


Abstract
This study developed an activity-guided laboratory-scale process for an extract of the aerial parts of Synotis solidaginea. Extraction conditions using 0–100% (v/v) ethanol–water solutions were screened using 2,2-diphenyl-1-picrylhydrazyl (DPPH) and 2,2′-azino-bis(3-ethylbenzothiazoline-6-sulfonic acid) (ABTS) assays and HaCaT keratinocyte responses, followed by fractionation with AB-8 macroporous resin. The 20–50% ethanol range provided a favorable balance between antioxidant activity and cytocompatibility; 50% ethanol extraction followed by 40% ethanol elution was selected. The final dried purified S. solidaginea extract (SSE) maintained HaCaT viability above 90% at 0.01–0.2 mg/mL under the tested conditions. Under the experimental conditions evaluated, a pooled sample comprising equal masses of ten final SSE batches was classified as non-irritating in the acute eye and repeated skin irritation tests, and negative results were reported in the Ames assay and the Chinese hamster lung (CHL) cell chromosome-aberration assay. These findings are limited to the tested material and endpoints and do not establish comprehensive safety. Rutin identification was supported by liquid chromatography–tandem mass spectrometry (LC-MS/MS), and its content was determined using a preliminary high-performance liquid chromatography (HPLC) method. Reported rutin contents in ten independently prepared laboratory-scale process batches derived from a single homogenized raw-material batch ranged from 2.34% to 2.54%, with a relative standard deviation (RSD) of 2.43%. Microbiological results met the adopted limits at the time of testing. These findings support laboratory-scale process development and preliminary chemical and quality characterization of S. solidaginea extract. Further studies should evaluate independent raw-material lots, complete analytical method validation, and assess storage stability and application-specific safety.
1. Introduction
Botanical extracts are multicomponent systems whose performance can vary with extraction and downstream processing [1,2]. Solvent-dependent antioxidant responses have been reported for several botanical materials [3,4,5]. Studies of other plant extracts likewise illustrate the importance of solvent composition when comparing chemical recovery and biological responses [6,7,8,9,10]. For a botanical extract intended as a functional ingredient, process development therefore benefits from linking preparation conditions to biological activity and measurable quality attributes rather than maximizing crude extraction yield alone.
Synotis solidaginea (Hand.-Mazz.) C. Jeffrey & Y. L. Chen is a perennial herb of the tribe Senecioneae (Asteraceae) distributed mainly in the Qinghai–Tibet region at altitudes of approximately 2900–3900 m [11]. The dried aerial parts are used in Tibetan medicine for wound-related and detoxification applications [12]. Previous analyses of S. solidaginea have described flavonoid and phenolic profiles, while separate work has identified eremophilane-type sesquiterpenes [13,14,15]. Skin-related biological studies of individual compounds, including isoquercitrin and hyperoside [16,17], rutin [18], and chlorogenic acid [19,20], provide a rationale for further investigation of botanical preparations; they do not establish which constituents determine the activity of SSE.
For laboratory-scale process development, three questions are important: which extraction conditions provide a favorable balance between activity and cytocompatibility; whether downstream purification can yield fractions with stronger biological responses; and how the resulting material can be characterized in terms of analytical attributes and selected safety endpoints. In China, the use of a new botanical cosmetic ingredient also requires defined safety and quality information [21,22]. This application context motivated the present study, which focused on developing and characterizing a reproducible preparation process.
Accordingly, this study used a stepwise screening and selection workflow to (i) screen ethanol–water extraction conditions using chemical antioxidant assays and HaCaT cell responses, (ii) select an AB-8 eluate using DPPH and ABTS responses, (iii) characterize the selected final extract in subsequent HaCaT experiments, and (iv) evaluate selected safety endpoints and characterize physicochemical, microbial, and rutin-associated analytical attributes. HaCaT experiments with the final extract provided subsequent biological characterization and were not used to select among the AB-8 fractions. The study focused on laboratory-scale process development and repeatability.
2. Materials and Methods
2.1. Plant Material, Biological Materials, and Reagents
Eight source samples of Synotis solidaginea (Hand.-Mazz.) C. Jeffrey & Y. L. Chen were collected in the Xizang Autonomous Region, China, between 25 July and 29 August 2024. Collection codes, dates, locations, decimal-degree coordinates, and altitudes are provided in Table 1. The plant material was collected and provided by Mima of the Xizang Food and Drug Inspection and Research Institute and authenticated by Prof. Zhou Yi. Phenological stage was not documented in the collection records. A voucher specimen, designated CX-ML, was deposited at the Xizang Food and Drug Inspection and Research Institute. The aerial parts were dried at 40 °C to constant mass, ground, passed through a 40-mesh sieve, and stored in a desiccator protected from light. Equal masses of material from the eight sources were pooled and thoroughly homogenized to obtain a single composite raw-material batch. Before processing, the homogenized material was divided equally into ten portions, each of which independently underwent the complete extraction, AB-8 purification, concentration, and drying procedure to produce ten laboratory-scale process batches. In this study, Synotis solidaginea extract (SSE) refers to the final dried purified extract obtained through this procedure. Each SSE batch was analyzed separately by HPLC, whereas equal masses of the ten final batches were pooled for safety evaluation.
Table 1.
Collection records of the eight S. solidaginea samples.
HaCaT cells (SCSP-5091) were obtained from the National Collection of Authenticated Cell Cultures, China. Cells were revived at passage 5 and used up to passage 10. According to the supplier’s quality-control information, the cells were negative for mycoplasma, bacterial, and fungal contamination and were authenticated by short tandem repeat (STR) profiling. Conventional-grade New Zealand rabbits were used for the acute eye irritation/corrosion test (n = 3, 2.7–2.9 kg, both sexes; females nulliparous and non-pregnant) and repeated skin irritation/corrosion test (n = 4, 2.6–2.9 kg, both sexes; females nulliparous and non-pregnant). Rabbits were supplied by Chengdu Dashuo Experimental Animal Co., Ltd., Chengdu, China and fed a standard diet (Jiangsu Xietong Pharmaceutical Bioengineering Co., Ltd., Nanjing, China; feed production license No. Su Feed (2024) 01008). Salmonella typhimurium strains TA97a, TA98, TA100, TA102, and TA1535 were purchased from Ningbo Mingzhou Biotechnology Co., Ltd., Ningbo, China; Chinese hamster lung (CHL) cells were obtained from Jinyuan Biotechnology Co., Ltd., Shanghai, China.
AB-8 macroporous adsorption resin was obtained from Shaanxi Lanshen Special Resin Co., Ltd., Xi’an, China (batch No. 20250112). Absolute ethanol was supplied by GENERAL-REAGENT/Greagent (Shanghai, China) and purified water by Wahaha (Hangzhou, China). For antioxidant assays, 2,2-diphenyl-1-picrylhydrazyl (DPPH) was purchased from Rhawn (Shanghai, China); 2,2′-azino-bis(3-ethylbenzothiazoline-6-sulfonic acid) (ABTS) and dimethyl sulfoxide (DMSO) from Solarbio (Beijing, China); and potassium persulfate from Xilong (Guangzhou, China). Ascorbic acid was obtained from Sinopharm Chemical Reagent Co., Ltd., Shanghai, China (AR ≥ 99.7%; product No. 10004016; lot No. 20200619). Rutin reference standard was obtained from Yuanye Bio (Shanghai, China) (HPLC ≥ 98%; product No. B20771; lot No. T27F10Z81699). Acetonitrile and methanol were supplied by Merck (Darmstadt, Germany), and glacial acetic acid by Fisher Scientific (Fair Lawn, NJ, USA; product No. A35-500; batch No. 244142). Fetal bovine serum, penicillin–streptomycin, trypsin, and Dulbecco’s modified Eagle medium (DMEM), all Gibco products, were obtained from Thermo Fisher Scientific (Suzhou) Instruments Co., Ltd. (Suzhou, China); phosphate-buffered saline (PBS) from Servicebio (Wuhan, China); and Cell Counting Kit-8 (CCK-8; C0038) and reactive oxygen species (ROS) assay kits from Beyotime (Shanghai, China). The ROS kit contained 2′,7′-dichlorodihydrofluorescein diacetate (DCFH-DA; S0034M; lot No. A235250409). Hydrogen peroxide (H2O2; 30%, AR ≥ 30%; lot No. 20220504) was obtained from Tianjin Damao Chemical Reagent Factory (Tianjin, China). The S9 fraction was supplied by Wuxi Xinrun Biotechnology Co., Ltd., Wuxi, China (batch No. 20231128). Ames positive controls were 2-aminofluorene (Sigma-Aldrich, St. Louis, MO, USA; S90850V), dexon (AccuStandard, New Haven, CT, USA; 4030165-01), sodium azide (Sigma-Aldrich, St. Louis, MO, USA; MKBR9480V), 1,8-dihydroxyanthraquinone (Macklin, Shanghai, China; C15222006), and 2-aminoanthracene (Alfa Aesar, Ward Hill, MA, USA; 10208889). CHL positive controls were mitomycin C (AbMole, Houston, TX, USA; purity 99.88%, M5791) and cyclophosphamide (Macklin, Shanghai, China; C12147600), with the identifiers reported as recorded in the original laboratory documentation.
2.2. Activity-Guided Preparation Process
2.2.1. Initial Ethanol–Water Solvent Screening
Dried S. solidaginea powder (1.00 g) was extracted with 0%, 10%, 20%, 30%, 40%, 50%, 60%, 70%, 80%, 90%, and 100% (v/v) ethanol–water solutions using three successive 30-min ultrasonic extraction cycles (250 W, 40 kHz) at room temperature. For each cycle, 10 mL of fresh solvent was added, corresponding to a solid-to-liquid ratio of 1:10 (g/mL) relative to the initial dry sample mass. After each cycle, the liquid phase was separated by filtration, and the three filtrates were combined and dried under vacuum at 50 °C. Three samples were extracted independently for each solvent condition, and each independent extract was assayed once in the DPPH and ABTS assays at each test concentration (n = 3). This preliminary screening was used to identify a range of ethanol concentrations for the subsequent process-selection experiment.
2.2.2. Laboratory-Scale Extraction and AB-8 Macroporous Resin Fractionation
Dried S. solidaginea powder (10.00 g) was extracted separately with 0%, 30%, and 50% (v/v) ethanol–water solutions. Each preparation underwent three successive 30-min ultrasonic extraction cycles (250 W, 40 kHz), with 100 mL of fresh solvent added for each cycle, corresponding to a solid-to-liquid ratio of 1:10 (g/mL) relative to the initial dry sample mass. After each extraction cycle, the extract was centrifuged at 6000 rpm for 10 min at 4 °C, and the supernatant was collected; the three supernatants were then combined. The 0%, 30%, and 50% ethanol groups were processed under identical extraction times, cycle numbers, solid-to-liquid ratios, and subsequent handling conditions, with ethanol concentration as the only variable. The final selected process used 50% ethanol under the same three-cycle extraction conditions. The combined extracts were passed through a 0.22 µm membrane filter and concentrated using an RE-52 series rotary evaporator (Shanghai Yarong Biochemical Instrument Factory, Shanghai, China) at 80 °C under a recorded vacuum of 0.05 MPa until a relative density of 1.2–1.3 was reached.
AB-8 macroporous adsorption resin (Lanshen, Xi’an, China; batch No. 20250112; approximately 320 g) was packed into a glass column with an internal diameter of 4 cm and a column-diameter-to-bed-height ratio of approximately 1:9, giving a bed volume (BV) of 452.16 cm3 (452.16 mL). AB-8 was selected as a literature-supported resin for laboratory-scale process development; alternative resins were not experimentally compared. The resin was washed sequentially with 2 BV of 95%, 70%, and 30% ethanol–water solutions and then with 5 BV of purified water until ethanol was no longer detected in the effluent. The sample-loading volume was 50 mL, and gravity flow was maintained at approximately 0.4–0.6 mL/s. During fraction screening, gradient elution was performed with 2 BV each of 0%, 20%, 40%, 60%, 80%, and 100% (v/v) ethanol–water; each fraction was collected, concentrated, and dried [23,24]. Three independent complete column fractionation experiments were performed for fraction screening, each including sample loading, gradient elution, fraction collection, and subsequent DPPH and ABTS testing. For the selected final process, the loaded column was washed with at least 3 BV of water and then eluted with 40% (v/v) ethanol. Approximately 1000 mL of eluate was collected. After concentration and drying, the product obtained from the 50% ethanol extract by this final purification procedure was designated SSE. Crude ethanol extracts and AB-8 eluate fractions used during screening are distinguished from final SSE. Working solutions for final-product assays were prepared from dried SSE. The final SSE yield after AB-8 macroporous resin purification was approximately 6% (w/w), calculated as the dry mass of final SSE divided by the initial dry plant-material mass × 100%. This study focused on activity-guided process development; yield was not used as the primary criterion for selecting extraction or elution conditions. Initial extraction-solvent screening considered antioxidant responses and HaCaT cytocompatibility, whereas AB-8 fraction selection was based on DPPH and ABTS responses. The selected final SSE was subsequently evaluated in HaCaT assays and chemically characterized. Equal masses of the ten final SSE process batches were pooled for safety evaluation. All extracts and fractions were stored at 4 °C in airtight containers protected from light until analysis.
2.3. Antioxidant and HaCaT Cell-Based Activity Screening
2.3.1. DPPH Radical-Scavenging Assay
DPPH radical-scavenging activity was assessed using a modified version of the published method [25], with the microplate format, reagent volumes, solvent system, and background correction described below. DPPH was dissolved in absolute ethanol. Dried screening extracts, AB-8 fractions, or the final SSE, as specified for each experiment, was dissolved in DMSO at 500 mg/mL and diluted with absolute ethanol to prepare sample solutions at 0.5, 1.0, and 2.0 mg/mL. Ascorbic acid was prepared in absolute ethanol and used as the positive control. In a 96-well plate, 20 µL of sample solution was mixed with 180 µL of 0.1 mM DPPH working solution and incubated for 30 min before absorbance was measured at 517 nm. Vehicle blanks containing the corresponding final DMSO concentrations were included; no appreciable DMSO interference was observed under the assay conditions. No visible turbidity or precipitation was observed. Sample-specific background absorbance was corrected using the corresponding sample blank. Scavenging activities were calculated from the raw absorbance values.
DPPH scavenging activity (%) = [1 − (Asample − Asample blank)/(Acontrol − Ablank)] × 100, where Asample is the absorbance of the sample solution mixed with DPPH working solution; Asample blank is the absorbance of the same sample solution with the DPPH working solution replaced by an equal volume of solvent; Acontrol is the absorbance of DPPH working solution mixed with the corresponding vehicle without sample; and Ablank is the absorbance of the corresponding solvent mixture without sample or DPPH.
2.3.2. ABTS Radical-Scavenging Assay
ABTS radical-scavenging activity was determined using a modified version of the published method [25], with ascorbic acid as the positive control. Sample solutions were prepared at 0.5, 1.0, and 2.0 mg/mL. The ABTS radical cation solution was generated by mixing 7.4 mM ABTS and 2.6 mM potassium persulfate solutions at a 1:1 (v/v) ratio and incubating the mixture in the dark at room temperature for 12 h. Immediately before use, the solution was diluted with absolute ethanol to an absorbance of 0.70 ± 0.02 at 734 nm. A 50 µL aliquot of sample solution was mixed with 150 µL of ABTS working solution and incubated in the dark for 30 min, after which absorbance was measured at 734 nm. Scavenging activity was calculated using the background-correction equation described in Section 2.3.1, with ABTS working solution replacing DPPH working solution in the corresponding definitions. Apparent values slightly above 100% were retained as calculated. Such values may occur when background correction yields a slightly negative sample signal near assay saturation and were therefore not interpreted as scavenging exceeding 100% or used to distinguish small differences among near-saturated responses. Other matrix effects cannot be excluded. Because only a limited number of concentrations were tested and several responses approached the assay ceiling, IC50 values were not calculated; instead, activities were compared at the tested concentrations.
2.3.3. HaCaT Cell Viability, Oxidative-Stress Protection, and Intracellular ROS
HaCaT cells were maintained in high-glucose DMEM supplemented with 10% fetal bovine serum and 1% penicillin–streptomycin at 37 °C in 5% CO2. SSE was dissolved in DMSO to prepare a 500 mg/mL stock solution and then diluted with complete culture medium to the required working concentrations. Working solutions were filtered through a 0.22 µm membrane before use. At 0.5 mg/mL SSE, the final DMSO concentration was 0.1% (v/v); a 0.1% DMSO vehicle control was included. The protective-effect experiments used 0.1, 0.2, and 0.5 mg/mL SSE, whereas the initial concentration screen covered a wider range. For morphological observations, cells in the logarithmic growth phase were seeded in 24-well plates at 4.68 × 10⁴ cells/well and treated with 0.2 mg/mL screening extract for 24 h; controls received extract-free medium. Morphology was observed using a Leica DM IL LED inverted microscope (Leica Microsystems CMS GmbH, Wetzlar, Germany). Three independent experiments were performed, with 3–5 randomly selected, non-overlapping fields imaged for each treatment in each experiment. Images representative of the overall observations across experiments are presented.
For viability assays, cells were seeded in 96-well plates at 8 × 10³ cells/well (100 µL/well), cultured overnight, and treated with the indicated extract or SSE concentrations. Three independent experiments were performed, with cells plated and treated separately for each experiment. Each treatment included six technical replicate wells per experiment. Measurements from the technical replicate wells were averaged within each experiment, and the three independent experiments served as the experimental units for statistical analysis. After the indicated treatment period, 10 µL CCK-8 reagent was added, followed by incubation at 37 °C for 2 h and absorbance measurement at 450 nm. Cell-free sample-background wells contained the corresponding concentration of SSE or screening extract and culture medium without CCK-8. Control-background wells contained the corresponding vehicle and medium without cells or CCK-8. These background wells were used to correct for intrinsic sample and vehicle absorbance.
The H2O2-induced injury model was established on the basis of preliminary experiments: exposure to 800 µM H2O2 for 2 h reduced HaCaT viability to approximately 69.8% of the untreated control, producing measurable injury while retaining sufficient cell viability to evaluate protective effects. Cells were pretreated for 24 h before H2O2 exposure; ascorbic acid (VC; 0.07 mg/mL) was the positive control. A dose-selection study for this ascorbic-acid concentration was not documented. The six treatment groups were (A) untreated control without SSE, ascorbic acid, or H2O2; (B) H2O2 model; (C) ascorbic-acid pretreatment followed by H2O2; and (D–F) pretreatment with 0.5, 0.2, and 0.1 mg/mL SSE, respectively, followed by H2O2. ROS was measured using the DCFH-DA kit (S0034M, lot A235250409; Beyotime, Shanghai, China). Cells were incubated with 10 µM DCFH-DA at 37 °C for 20 min and washed three times with PBS. Fluorescence was then measured in PBS in black 96-well plates using a SPARK multimode microplate reader (Tecan Austria GmbH, Grödig, Austria), with excitation and emission wavelengths of 488 and 525 nm, respectively. Sample controls without the probe were included to correct for background fluorescence. Parallel CCK-8 assays used transparent 96-well plates with matched seeding density, treatments, and timing. Background-corrected ROS fluorescence was divided by matched background-corrected CCK-8 absorbance; the untreated control ratio was defined as 100%. This procedure normalized fluorescence to a metabolic-activity signal rather than a direct cell count. Three independent ROS experiments were performed, each with three technical replicate wells per treatment. Signals from the technical replicates were averaged within each experiment before normalization, and the normalized results from the three independent experiments were used for analysis.
Cell viability (%) = [(Asample − Asample background)/(Acontrol − Acontrol background)] × 100. Asample and Acontrol are absorbance values from wells containing cells, sample or vehicle, respectively, and CCK-8; the corresponding background wells contain sample or vehicle and medium without cells or CCK-8.
R = (F − Fbackground)/(A − Abackground); relative ROS (%) = (Rtreatment/Runtreated control) × 100. F is ROS fluorescence and A is matched parallel CCK-8 absorbance, each corrected with its corresponding background. Normalized results are expressed on a scale relative to the untreated control: 1.0 corresponds to 100%.
2.4. Safety Evaluation of the Final Purified S. solidaginea Extract
All safety assays used a pooled sample prepared by combining equal masses of ten independently prepared final SSE process batches. Each batch was obtained by 50% ethanol extraction, AB-8 macroporous resin purification, collection of the 40% ethanol eluate, concentration, and drying, as described in Section 2.2.2. The safety results therefore apply to this pooled test material. Testing was conducted at the Shaanxi Institute for Food and Drug Control and covered acute eye irritation/corrosion, repeated skin irritation/corrosion, bacterial reverse mutation, and in vitro mammalian chromosome aberration.
2.4.1. Acute Eye Irritation/Corrosion Test
The three rabbits described in Section 2.1 were used for this assay. Within 24 h before the test, both eyes were examined with a handheld slit lamp, and only animals without ocular irritation, corneal defects, or conjunctival injury were included. SSE (100 mg) was placed into the conjunctival sac of one eye, and the upper and lower eyelids were gently held together for approximately 1 s to minimize loss of the test material. The contralateral eye served as the untreated control. No rinsing was performed during the first 24 h. The cornea, iris, and conjunctiva were examined at 1, 24, 48, and 72 h; additional observations on days 4 and 7 were planned if irritation persisted. Ocular findings were scored according to the Safety and Technical Standards for Cosmetics (2015 Edition) [22]. Animals were monitored during the observation period for ocular reactions and signs of severe distress.
2.4.2. Repeated Skin Irritation/Corrosion Test
The four rabbits described in Section 2.1 were used for this assay. Before the first application, the hair on both sides of the vertebral column was clipped to create approximately 3 × 3 cm test areas, with an application area of 2.5 × 2.5 cm on each side. SSE (0.5 g) was thoroughly moistened with purified water and applied without occlusive or semi-occlusive covering to one side, while purified water was applied to the contralateral side as the control. Treatment was performed once daily for 14 consecutive days. From the second day onward, residual material was removed with water before each subsequent application; hair was clipped as needed. Skin reactions were observed 1 h after application and scored for erythema and edema according to the Safety and Technical Standards for Cosmetics (2015 Edition) [22].
2.4.3. Bacterial Reverse Mutation Test
SSE was evaluated by the plate-incorporation bacterial reverse mutation assay using S. typhimurium TA97a, TA98, TA100, TA102, and TA1535, with and without S9 metabolic activation. The S9 fraction was supplied by Wuxi Xinrun Biotechnology Co., Ltd. (Wuxi, China) (batch No. 20231128). A preliminary test at 5 mg/plate showed no growth inhibition; therefore, the definitive assay used 5, 2.5, 1.25, and 0.625 mg/plate, with three plates per condition. Sterile water for injection was used to prepare SSE and dexon solutions; DMSO was used for the other positive-control solutions. The S9 mixture was prepared fresh and kept on ice. Each 10 mL contained 1 mL S9 fraction, 0.2 mL 0.4 mol/L MgCl2, 0.2 mL 1.65 mol/L KCl, 6 mL phosphate buffer (pH 7.4), 1 mL 0.05 mol/L glucose-6-phosphate, and 1.6 mL 0.025 mol/L NADP. Each plate received 0.1 mL bacterial suspension, 0.1 mL test or control solution, 0.5 mL S9 mixture or phosphate buffer, and 2 mL top agar. Positive-control solutions were 2-aminofluorene (0.1 mg/mL) for TA97a, TA98, and TA100 with S9; dexon (0.5 mg/mL) for TA97a, TA98, and TA102 without S9; sodium azide (0.015 mg/mL) for TA100 and TA1535 without S9; 1,8-dihydroxyanthraquinone (0.5 mg/mL) for TA102 with S9; and 2-aminoanthracene (0.05 mg/mL) for TA1535 with S9. Sterile water and DMSO were included as solvent controls. Plates were incubated at 37 °C for 48 h. A result was considered positive when the revertant count reached at least three times the solvent-control value for TA1535 or at least twice the solvent-control value for TA97a, TA98, TA100, or TA102, together with a dose–response relationship or a reproducible positive response at any dose. SSE and dexon were compared with the sterile-water control, and the DMSO-prepared positive controls with the DMSO control. The four-dose series used two-fold dilutions from the highest concentration tested in the preliminary assay, 5 mg/plate. This design followed the minimum of four doses specified in the earlier cosmetic method. The revised method specifies at least five doses [22,26].
2.4.4. In Vitro Mammalian Cell Chromosome Aberration Test
SSE was evaluated in Chinese hamster lung (CHL) cells at 5, 2, and 0.8 mg/mL. In preliminary testing, visually assessed cell coverage remained above 90% at 5 mg/mL and was 100% at 2 and 0.8 mg/mL with or without S9; no visible precipitation was observed. These observations supported the selection of 5 mg/mL as the highest test concentration. Visual coverage was not treated as a quantitative measurement of growth inhibition or relative cell proliferation. The CHL S9 mixture was prepared separately from the Ames mixture: 0.75 mL S9 fraction, 0.12 mL 0.4 mol/L MgCl2, 0.12 mL 1.65 mol/L KCl, 10.75 mg glucose-6-phosphate, and 18.40 mg NADP were made up to 6.0 mL with serum-free minimum essential medium (MEM); 0.2 mL was included in each 2.0 mL activated exposure system. In the definitive assay, cells were exposed for 6 h with and without S9 and for 24 h without S9. A negative control was included; mitomycin C (0.1 µg/mL) without S9 and cyclophosphamide with S9 served as positive controls. After exposure, cells were washed three times with Hanks’ solution and cultured for 20 h in fresh medium, followed by treatment with colchicine for 4 h (final concentration 1 µg/mL). Cells were harvested, treated with 0.075 mol/L KCl, fixed with methanol–acetic acid (3:1, v/v), and stained with Giemsa, and the cells from three parallel culture wells per condition were pooled for slide preparation. A total of 200 well-spread metaphase cells was examined per treatment group, rather than 200 cells per well. The three parallel wells formed one pooled sample per condition and were not independent experimental replicates. Chromosome-aberration rates were compared with the negative control using the chi-square test.
2.4.5. Animal Housing, Ethics, and Pain Management
Animals were housed individually at 20–24 °C and 40–70% relative humidity, with free access to water and a 12 h light/12 h dark cycle. Animal procedures were approved by the Ethics Committee of Shaanxi Institute for Food and Drug Control (Approval No. HZ2025H0094; 1 March 2025) and were conducted in accordance with the principles of replacement, reduction, and refinement (the 3Rs).
Animal welfare and local reactions were monitored throughout the experiments. No anesthetic or analgesic drugs were administered. Under the approved experimental protocol, no animal developed clinical signs that were judged to require pharmacological pain relief. For the ocular irritation test, the cornea, iris, and conjunctiva were examined at 1, 24, 48, and 72 h after administration. For the repeated dermal irritation test, erythema and edema were monitored daily for 14 consecutive days. The animals were also observed for signs of pain, distress, or deterioration in general condition. If clinically significant pain or distress had occurred, appropriate veterinary assessment and pain management would have been implemented in accordance with the approved animal welfare procedures.
2.5. Analytical Characterization and Quality Attributes
2.5.1. Physicochemical and Microbiological Testing
Appearance was evaluated under natural light. Loss on drying was determined according to General Chapter 0831 of the Chinese Pharmacopoeia 2025 Edition, Part IV [27]. The pH of a 10 wt% aqueous solution was measured using a METTLER TOLEDO SevenExcellence S400-K pH meter (METTLER TOLEDO, Greifensee, Switzerland). Residue on ignition was determined using an MF-4-10 furnace at 550 ± 25 °C for approximately 3–4 h to constant mass. Lead, arsenic, mercury, and cadmium were measured by inductively coupled plasma mass spectrometry (ICP-MS; NexION 2000G, PerkinElmer, Shelton, CT, USA). SSE was microwave-digested according to the Safety and Technical Standards for Cosmetics (2015 Edition) [22]; digests were cooled and diluted to the prescribed volume before analysis. Water solubility and microbial attributes were evaluated as described in the referenced procedures [22]. Residual methanol was determined by direct-injection gas chromatography with flame-ionization detection (GC-FID; Agilent 7890B, Agilent Technologies, Santa Clara, CA, USA), following the first method in Section 2.22 of the Safety and Technical Standards for Cosmetics (2015 Edition) [22]. Approximately 2.0 g of SSE was made up to 10 mL with methanol-free ethanol, sonicated for 15 min, centrifuged at 5000 rpm for 10 min, and filtered through a 0.45 µm membrane before analysis.
2.5.2. Preparation of Rutin Reference and Test Solutions
Approximately 10 mg of rutin reference standard was dissolved and diluted to 10 mL with 75% methanol to prepare a 1 mg/mL stock solution for HPLC analysis. An aliquot was diluted to 500 ng/mL and filtered through a 0.22 µm membrane for liquid chromatography–mass spectrometry (LC-MS) analysis. Working standards were prepared by serial dilution for HPLC calibration. The same 75% methanol solvent system was used for reference and test-solution preparation to maintain consistent solvent conditions across the analytical workflow. For extract analysis, approximately 100 mg of final dried SSE was dissolved in 75% methanol in a 10 mL amber volumetric flask, sonicated at 250 W and 40 kHz for 30 min, cooled, diluted to volume, mixed, and filtered through a 0.22 µm membrane. Raw plant material was prepared similarly using approximately 1.00 g of dried aerial-part powder in a 20 mL volumetric flask.
2.5.3. Qualitative LC-QTOF-MS Profiling
Qualitative profiling by liquid chromatography–quadrupole time-of-flight mass spectrometry (LC-QTOF-MS) was performed using a Nexera LC-30A system (Shimadzu, Kyoto, Japan) coupled to a TripleTOF 5600+ mass spectrometer (SCIEX, Concord, ON, Canada) with an electrospray ionization (ESI) source. Chromatographic separation was performed on a Waters ACQUITY UPLC CSH C18 column (2.1 mm × 100 mm, 1.7 µm; Waters, Milford, MA, USA) at 40 °C. The mobile phases were 0.1% acetic acid in water (A) and acetonitrile (B), delivered at 0.3 mL/min with the following gradient: 0–1 min 10% B; 1–5 min 10–30% B; 5–20 min 30–60% B; 20–30 min 60–80% B; 30–33 min 80% B; and return to 10% B at 33.1 min. The injection volume was 5 µL. ESI negative-ion full-scan data were acquired over m/z 50–1500 with low-/high-energy collision voltages of 10 V and 30–50 V, capillary voltage 5.5 kV, cone voltage 60 V, source temperature 100 °C, desolvation temperature 350 °C, cone-gas flow 50 L/h, and desolvation-gas flow 600 L/h. Different sample sets were used for qualitative LC-QTOF-MS profiling and quantitative HPLC analysis. LC-QTOF-MS provided qualitative chemical evidence; HPLC measured rutin in the ten final SSE process batches.
2.5.4. Targeted LC-MS/MS Confirmation of Rutin
Targeted liquid chromatography–tandem mass spectrometry (LC-MS/MS) analysis was performed using an Agilent 1260 Infinity LC system coupled to an Agilent 6460C Triple Quadrupole MS (Agilent Technologies, Santa Clara, CA, USA; recorded LC modules G1322A, G1312B, G7129A, G1316A, G7115A). Rutin was analyzed on a MicroPulite XP tC18 column (3.0 mm × 150 mm, 1.7 µm; WePure Biotech (Guangzhou) Co., Ltd., Guangzhou, China) at 35 °C with acetonitrile (A) and 0.1% acetic acid in water (B), at a flow rate of 0.3 mL/min, and a programmed gradient of 20–100% A (0–7 min), 100% A (7–9 min), 100–20% A (9–16 min), and 20% A (16–18 min). The injection volume was 10 µL. Data were acquired by multiple reaction monitoring (MRM) in negative-ion ESI mode. The nebulizer pressure was 50 psi, drying-gas flow was 10 L/min, drying-gas temperature was 350 °C, capillary voltage was 3500 V, fragmentor voltage was 205 V, and collision energy was 34 V. The monitored transition was m/z 609.1 → 299.9.
2.5.5. Preliminary HPLC Quantification of Rutin
High-performance liquid chromatography (HPLC) was used as a preliminary analytical method to quantify rutin as a representative chemical marker and compare its content among laboratory-scale SSE process batches. The procedure was not established as a fully validated method for routine quality control. Analysis was performed using a Thermo Scientific Dionex system with an HPG-3400SD pump, TCC-3000RS column compartment, and DAD-3000 diode-array detector (Dionex Softron GmbH, Germering, Germany). Rutin was monitored at 277 nm. Chromatographic separation was performed on a MicroPulite Gold RP18 Plus column (4.6 mm × 250 mm, 5 µm; WePure Biotech (Guangzhou) Co., Ltd., Guangzhou, China) at 35 °C. The mobile phases were acetonitrile (A) and 0.1% acetic acid in water (B), delivered at 0.5 mL/min with the following gradient: 20% A (0–10 min), 20–30% A (10–20 min), 30–40% A (20–30 min), 40–100% A (30–32 min), 100% A (32–40 min), 100–20% A (40–42 min), and 20% A (42–60 min). The injection volume was 10 µL. Injection precision and chromatographic system performance were evaluated using seven consecutive injections of the same Y10 test solution by calculating retention time, peak area, peak width, peak asymmetry, and theoretical plate number. The available records did not establish method repeatability based on independently prepared test solutions. Solution stability was assessed at 0, 4, 8, 12, 16, and 24 h. For the single-level spike-recovery assessment, six recovery solutions were prepared independently by combining 0.5 mL of Y10 test solution with 0.5 mL of rutin standard solution at 0.25 mg/mL. Recovery was calculated using the recalculated calibration equation and the mean concentration of the unspiked Y10 solution. Recovery (%) was calculated as (Cspiked × Vfinal − Cunspiked × Vsample)/(Cstandard × Vstandard) × 100, with Vfinal = 1.0 mL and Vsample = Vstandard = 0.5 mL. This single-level assessment did not constitute multi-level accuracy validation. The seven Y10 injections were technical replicates, not independently prepared samples. Calibration used rutin concentrations of 0.10, 0.20, 0.25, 0.30, and 0.40 mg/mL. Estimated limits of detection (LOD) and quantification (LOQ) were calculated as 3.3σ/S and 10σ/S, respectively, where S is the calibration slope and σ is the residual SD of the regression. These estimates were not independently confirmed with low-concentration samples. Selectivity was assessed by comparing blank, rutin-standard, and SSE chromatograms.
2.5.6. Microbial Testing
Microbial testing of SSE was performed according to Chapter V (Microbiological Test Methods) of the Safety and Technical Standards for Cosmetics (2015 Edition) [22]. Because SSE was a solid powder, 10 g of sample was dispersed in 90 mL of sterile physiological saline to prepare a 1:10 test suspension. For the aerobic bacterial count, serial dilutions were prepared from the 1:10 suspension; 1 mL of each selected dilution was plated in duplicate with lecithin-Tween 80 nutrient agar and incubated at 36 ± 1 °C for 48 ± 2 h. Molds and yeasts were enumerated from appropriate dilutions in duplicate on Rose Bengal agar at 28 ± 2 °C for 5 d. Thermotolerant coliform bacteria were tested by inoculating 10 mL of the 1:10 suspension into 10 mL of double-strength lactose bile broth containing neutralizers and incubating at 44.5 ± 0.5 °C; presumptive positive cultures were confirmed on eosin-methylene blue agar together with Gram staining and the indole test. Pseudomonas aeruginosa and Staphylococcus aureus were each enriched by adding 10 mL of the 1:10 test suspension to 90 mL of SCDLP broth at 36 ± 1 °C, followed by selective isolation and confirmatory tests as specified in the Standard. Confirmation of P. aeruginosa included Gram staining, oxidase and pyocyanin testing, with additional nitrate-reduction, gelatin-liquefaction, and 42 °C growth tests when required. Confirmation of S. aureus included Gram staining, mannitol fermentation, and the plasma coagulase test.
2.6. Statistical Analysis
Data are expressed as mean ± standard deviation (SD), unless specified otherwise. DPPH/ABTS screening used three independently prepared extracts per condition, each measured once per assay and concentration. The AB-8 gradient-fractionation assay used three independent complete column experiments. HaCaT viability assays comprised three independent experiments with six technical wells per treatment per experiment; ROS assays used three independent experiments with three technical wells. Measurements from technical replicate wells were averaged within each experiment before analysis; n = 3 denotes independent experiments. Morphological observations were obtained from three independent experiments, with 3–5 fields examined per treatment in each experiment. Single-factor comparisons used one-way analysis of variance (ANOVA) with Tukey’s multiple-comparison test. Cell-viability data across concentrations and treatment times are presented descriptively as mean ± SD from three independent experiments at the tested concentrations and treatment times, with and without H2O2 exposure. Different treatment-time groups were established independently and did not involve repeated measurements of the same wells. No inferential analysis of concentration × time interaction was performed; therefore, no conclusion regarding such an interaction is drawn. Lowercase letter annotations indicate the results of the reported single-factor multiple comparisons; groups sharing a letter were not significantly different at the 0.05 significance level. CHL chromosome-aberration counts were compared with the negative controls using chi-square tests, based on 200 metaphases per pooled treatment sample. The pooled wells were not treated as independent replicates. The ten SSE batches were independent complete preparations from one homogenized raw-material batch. The relative standard deviation (RSD) among these batches was calculated using the population SD (divisor n = 10). Repeated HPLC injections were used to assess injection precision. Significance was set at p < 0.05. Statistical analyses were performed using GraphPad Prism 9.0 (GraphPad Software, San Diego, CA, USA).
3. Results
3.1. Activity-Guided Process Selection
3.1.1. Ethanol–Water Solvent Screening
Extract appearance changed systematically with solvent composition: the 0–50% ethanol extracts were brownish yellow, whereas the 60–100% ethanol extracts became increasingly green (Figure 1). In the DPPH assay, the 20–50% ethanol extracts showed the strongest and most consistent responses across the tested sample concentrations, with apparent responses reaching or approaching 100% at some test concentrations (Figure 2A). Apparent ABTS scavenging activity was also high for most extraction conditions, whereas the 100% ethanol extract showed a lower response at 0.5 mg/mL (Figure 2B). Taken together with the cell-based results, the 20–50% ethanol range was selected for subsequent process development.
Figure 1.
Appearance of S. solidaginea extracts prepared during the initial ethanol–water solvent screening. From left to right, the ethanol concentrations were 0%, 10%, 20%, 30%, 40%, 50%, 60%, 70%, 80%, 90%, and 100% (v/v).
Figure 2.
DPPH (A) and ABTS (B) radical-scavenging activities of S. solidaginea extracts prepared with different ethanol–water solutions. Circles, squares, and triangles represent sample-solution concentrations of 2.0, 1.0, and 0.5 mg/mL, respectively. The horizontal axis indicates the ethanol concentration in the extraction solvent (% v/v). Data are presented as mean ± SD from three independently prepared extracts (n = 3), each measured once per assay at each test concentration; error bars indicate SD. Scavenging percentages were calculated using sample-specific background correction and matched reagent and solvent controls, with ascorbic acid as the positive control. Apparent values slightly above 100% were retained as calculated and interpreted as background-correction effects near assay saturation. Curves illustrate the responses at the tested concentrations; no pairwise statistical comparisons are presented.
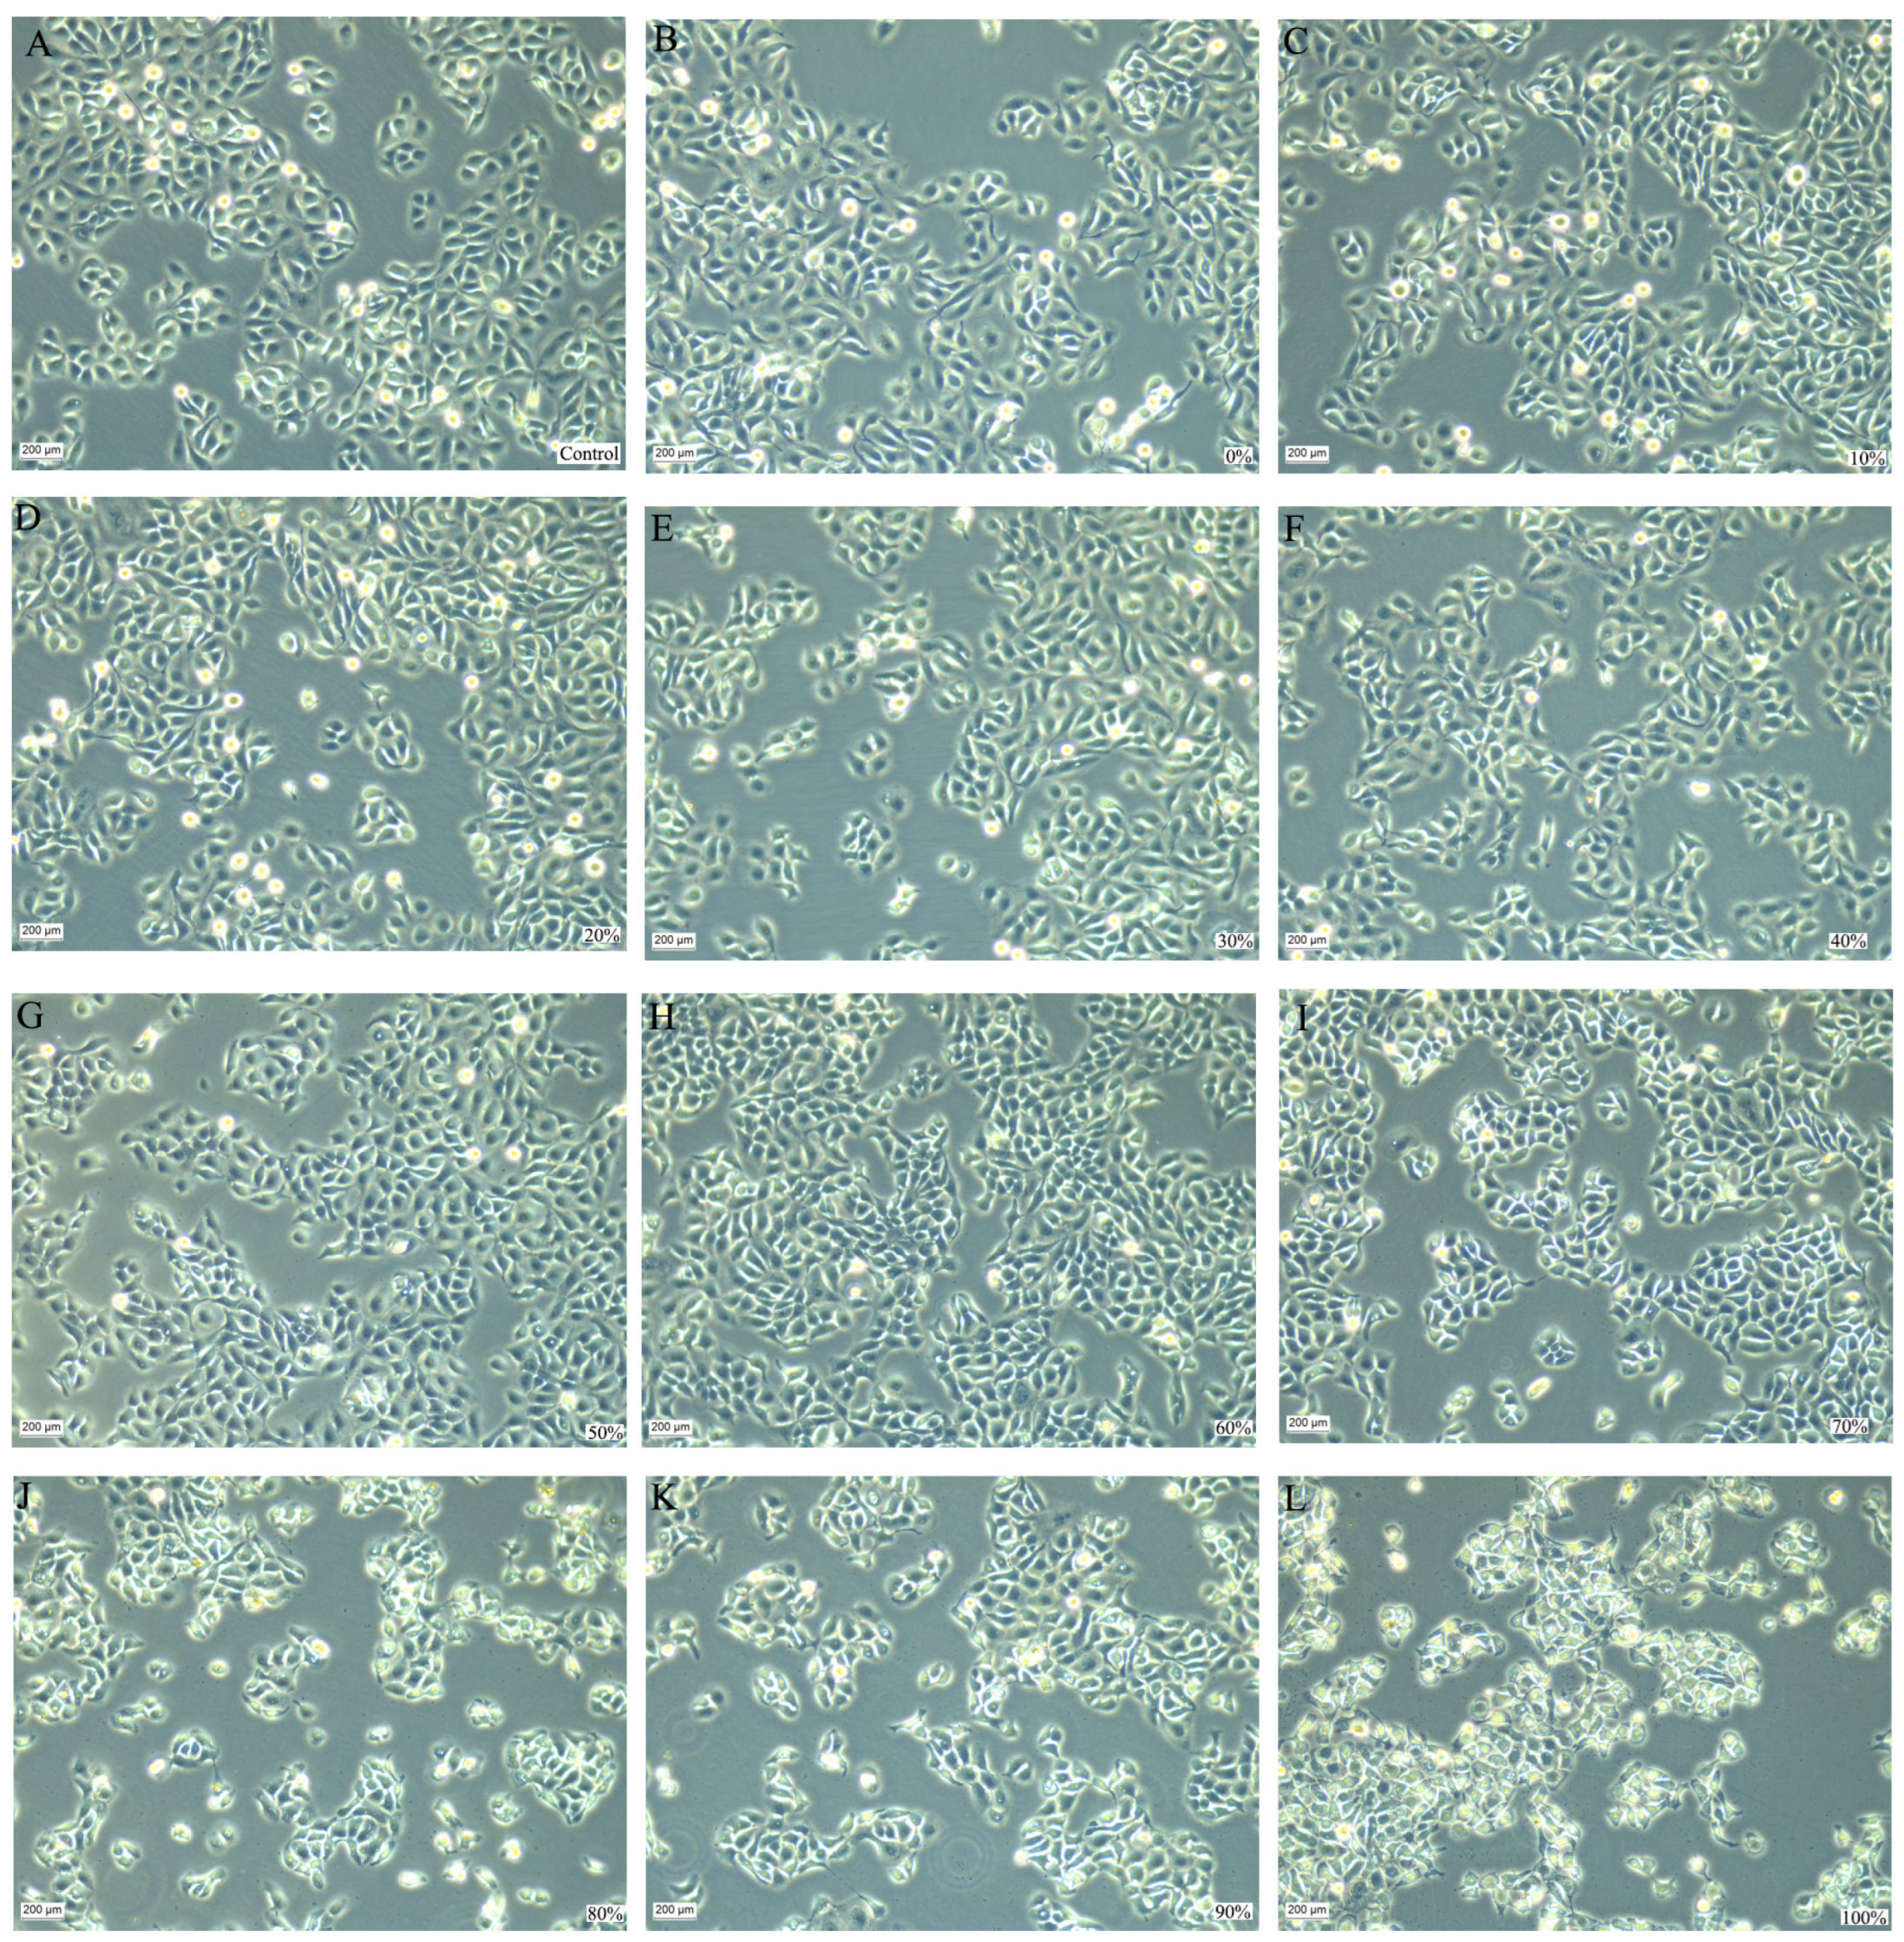
HaCaT responses also depended on extraction solvent. Extracts prepared with 0–50% ethanol maintained cell viability above 95% under normal culture conditions, whereas viability declined with extracts prepared using 60–70% ethanol and decreased markedly with those prepared using 80–100% ethanol (Figure 3A). Under H2O2-induced oxidative stress, extracts prepared using 0–50% ethanol improved cell viability relative to the H2O2 model; higher-ethanol extracts showed poorer cellular compatibility (Figure 3B). H2O2 increased intracellular ROS, while extracts prepared with approximately 20–60% ethanol reduced the ROS signal. The very low ROS signals observed with extracts prepared using more than 70% ethanol coincided with marked cytotoxicity and therefore were not interpreted as evidence of superior antioxidant activity (Figure 3C). Representative cell morphologies after 24 h of treatment with 0.2 mg/mL screening extracts are shown in Figure 4.
Figure 3.
HaCaT responses to S. solidaginea extracts prepared with different ethanol concentrations: (A) cell viability without H2O2 exposure; (B) cell viability following extract pretreatment and H2O2 exposure; and (C) intracellular ROS levels under oxidative stress. Data are presented as mean ± SD from three independent experiments (n = 3), with six technical replicate wells per treatment for viability assays and three for ROS assays in each experiment. Technical replicates were averaged within each experiment before statistical analysis; error bars indicate SD among independent experiments. Cell viability was corrected for sample background absorbance, and ROS fluorescence was normalized to matched parallel CCK-8 signals as described in Section 2.3.3. Control denotes untreated cells, and H2O2 denotes the oxidative-stress model group. Numeric treatment labels indicate the ethanol concentration used for extraction (% v/v). Within each panel, groups that do not share a lowercase letter differ significantly according to one-way ANOVA followed by Tukey’s multiple-comparison test (p < 0.05).
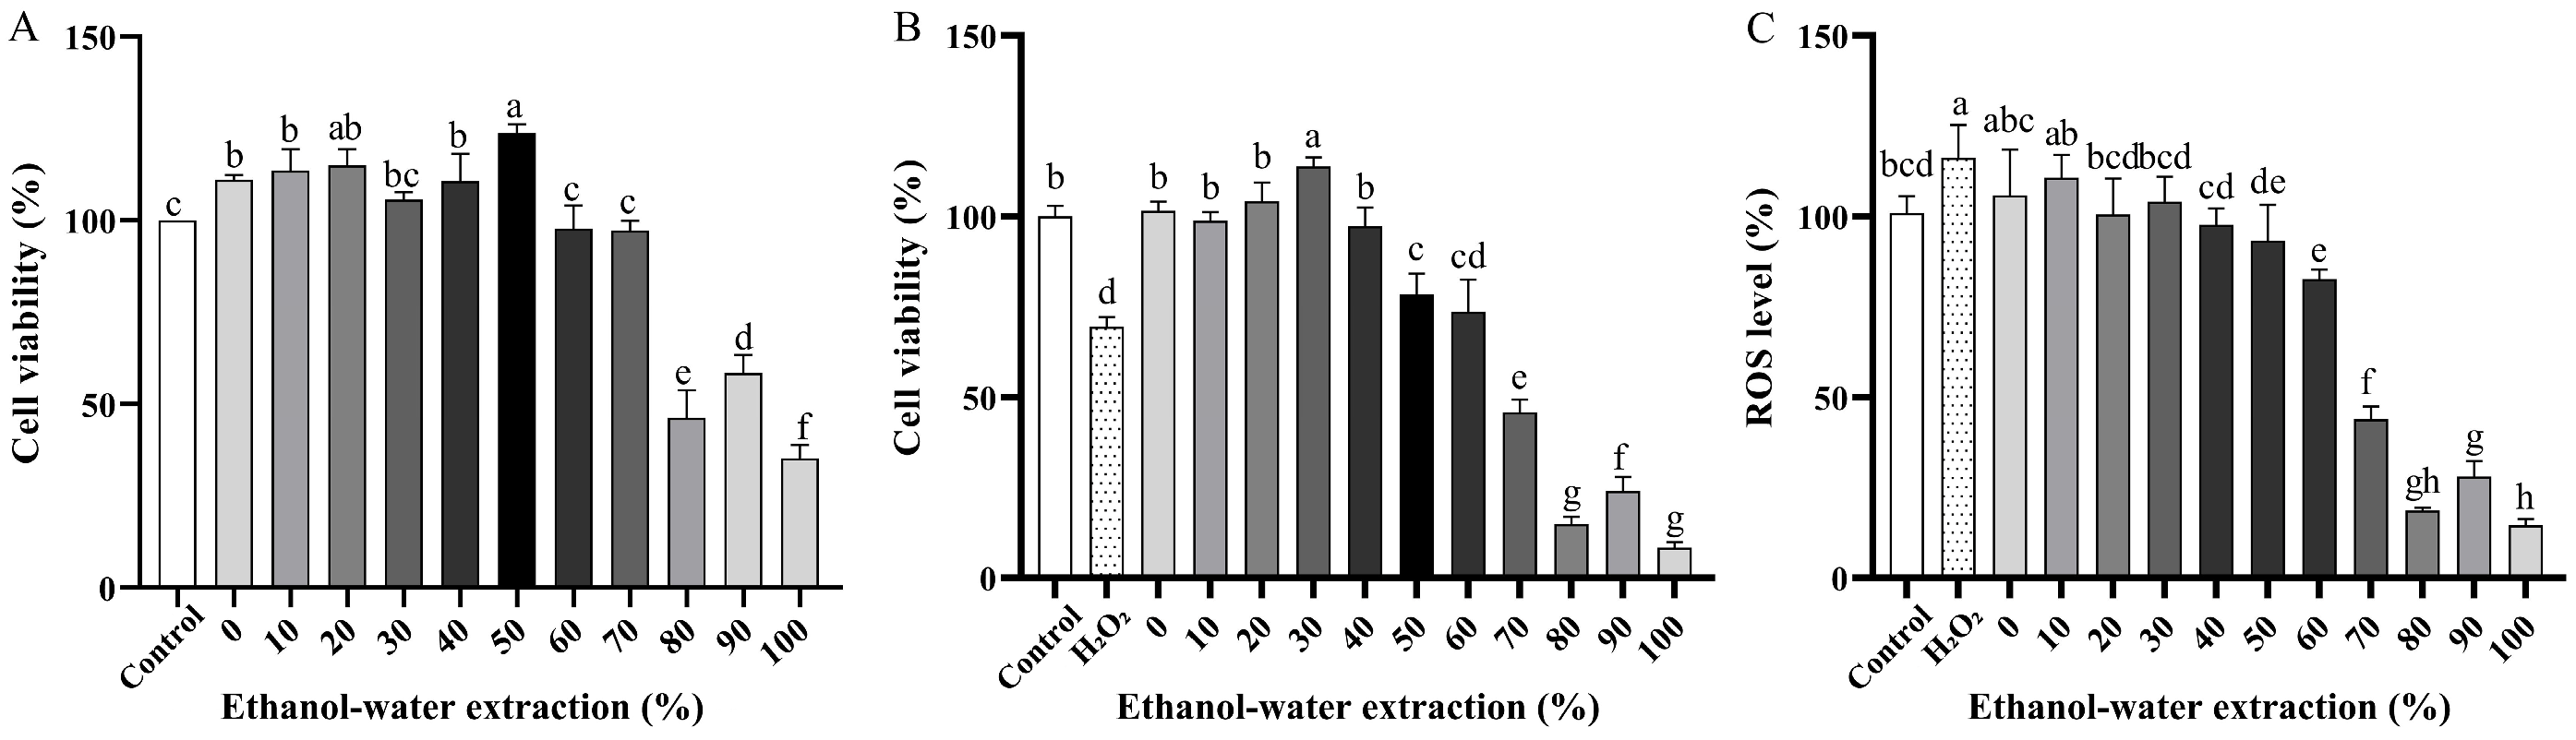
Figure 4.
Representative HaCaT cell morphology after 24 h of treatment with 0.2 mg/mL S. solidaginea extracts. (A) Untreated control; (B–L) extracts prepared with 0%, 10%, 20%, 30%, 40%, 50%, 60%, 70%, 80%, 90%, and 100% ethanol (v/v), respectively. Images are representative of three independent experiments, with 3–5 randomly selected, non-overlapping fields examined per treatment group in each experiment. Scale bar: 200 µm.
3.1.2. AB-8 Fractionation and Selection of the 40% Ethanol Eluate
For the 0%, 30%, and 50% ethanol extracts, DPPH and ABTS responses increased and then decreased as the ethanol concentration of the eluent increased. The 40% ethanol eluate from the 50% ethanol extract showed a favorable combined DPPH/ABTS response profile and was selected for further study (Figure 5). Selection was based on the combined responses under the tested conditions and did not establish a unique optimum. ABTS responses near assay saturation cannot resolve small differences between highly active fractions. The selected 40% ethanol eluate was concentrated and dried to obtain final SSE for cell-based characterization and quality evaluation. The final SSE yield after AB-8 purification, concentration, and drying was approximately 6% (w/w) relative to the initial dry plant-material mass.
Figure 5.
DPPH and ABTS radical-scavenging activities of AB-8 gradient-elution fractions from S. solidaginea extracts prepared with 0%, 30%, and 50% ethanol (v/v). Panels (A–C) show DPPH responses for the three extraction conditions, respectively, and panels (D–F) show the corresponding ABTS responses. Circles, squares, and triangles represent fraction-solution concentrations of 2.0, 1.0, and 0.5 mg/mL, respectively. The horizontal axis indicates ethanol concentration in the eluent (% v/v); “Clearance” on the vertical axes denotes radical-scavenging activity (%). Data are presented as mean ± SD from three independent complete AB-8 column fractionation experiments (n = 3), each comprising sample loading, gradient elution, fraction collection, and antioxidant testing. Error bars indicate SD among independent experiments. Background correction used sample-specific blanks, matched vehicle and reagent controls, and solvent blanks; ascorbic acid served as the positive control. Curves illustrate the observed response profiles; no pairwise statistical comparisons are presented.
3.1.3. Cytocompatibility and Oxidative-Stress Response of the Final SSE
Final SSE obtained by 50% ethanol extraction and AB-8 purification maintained HaCaT viability above 90% at 0.01–0.2 mg/mL in the absence of H2O2 (Figure 6A). The initial concentration screen also included 0.5–1.5 mg/mL SSE, which reduced viability. Figure 6B shows viability following treatment with different SSE concentrations in combination with H2O2; the varying concentrations refer to SSE, not H2O2. These initial concentration screens covered a wider range than the 0.1–0.5 mg/mL SSE treatment set used for the protective-effect experiments. Figure 6C shows viability at independently established treatment time points. These observations are limited to the tested conditions and do not establish a single optimal concentration applicable across different treatment conditions.
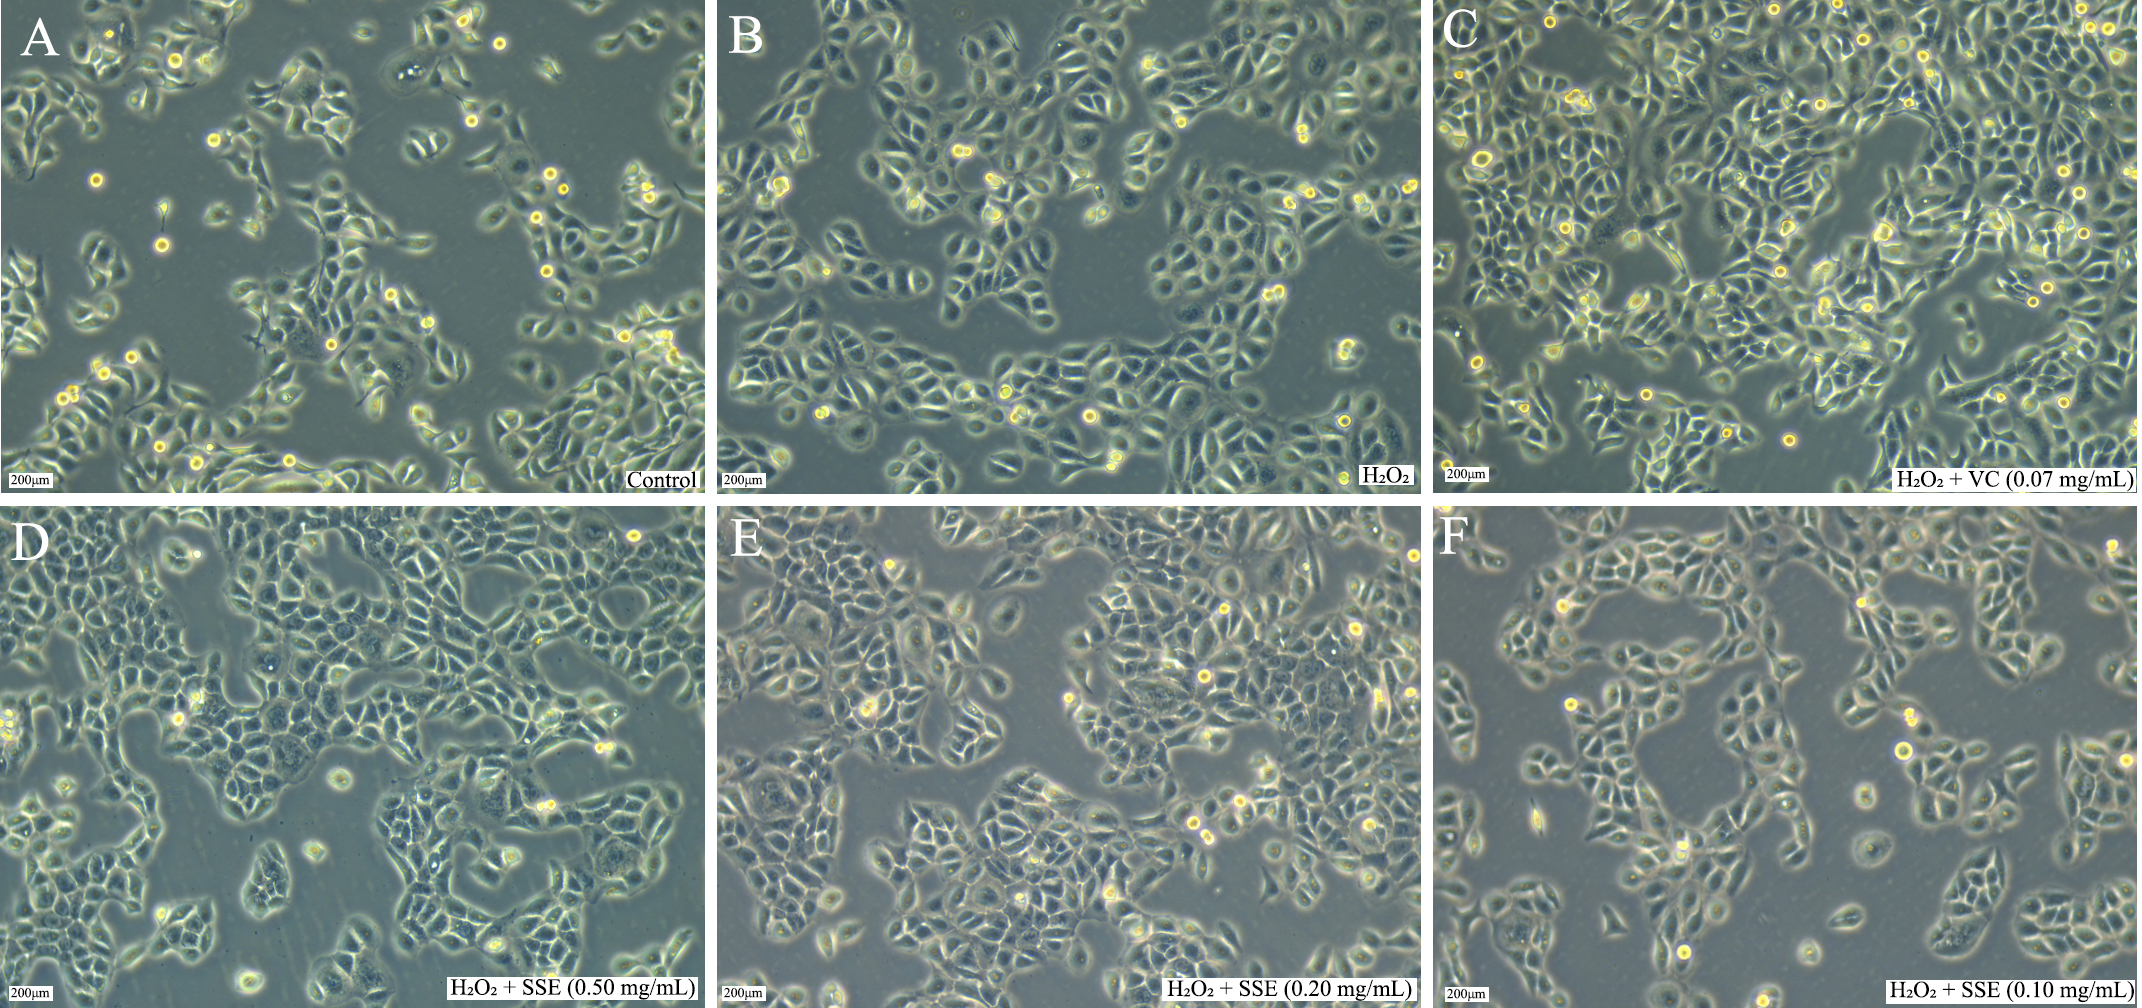
H2O2 increased the relative ROS signal to approximately 120%. Pretreatment with 0.1–0.5 mg/mL SSE reduced the ROS signal in a concentration-dependent manner (Figure 6D). Because 0.5 mg/mL also reduced viability under normal conditions, the lower ROS signal at this concentration should be interpreted together with its cytotoxicity rather than as an unqualified increase in antioxidant potency. Morphological observations were broadly consistent with the viability data at 0.1–0.5 mg/mL (Figure 7). Thus, the CCK-8 assay identified 0.01–0.2 mg/mL as the range that maintained viability above 90% under normal culture conditions.
Figure 6.
Effects of final dried purified SSE on HaCaT cell viability and intracellular ROS: (A) viability at different SSE concentrations without H2O2 exposure; (B) viability at different SSE concentrations under H2O2-induced stress; (C) viability at the tested SSE concentrations and treatment times, with and without H2O2 exposure; and (D) ROS fluorescence normalized to matched parallel CCK-8 signals. Data are presented as mean ± SD from three independent experiments (n = 3), each including six technical replicate wells per treatment for viability assays (A–C) and three for ROS assays (D). Technical replicates were averaged within each experiment, and independent experiments were the statistical units; error bars indicate SD. Control denotes untreated cells, H2O2 denotes the injury model, and H2O2 + VC denotes ascorbic-acid pretreatment followed by H2O2 exposure. In (C), SSE concentrations were 0.5, 0.2, and 0.1 mg/mL, and treatment-time groups were established independently. A 0.1% DMSO vehicle control was included for the 0.1–0.5 mg/mL protective-effect experiments. Background correction and ROS normalization are described in Section 2.3.3. In (D), values are expressed as fold changes relative to the untreated control, which was set to 1.0. Within each of panels (A), (B), and (D), groups that do not share a lowercase letter differ significantly according to one-way ANOVA followed by Tukey’s multiple-comparison test (p < 0.05). Panel (C) presents descriptive profiles; no statistical inference regarding a concentration × time interaction is made.
Figure 7.
Representative microscopic images of HaCaT cells under the indicated treatment conditions: (A) untreated control; (B) H2O2 model; (C) ascorbic-acid pretreatment followed by H2O2 exposure; and (D–F) pretreatment with 0.5, 0.2, and 0.1 mg/mL SSE, respectively, followed by H2O2 exposure. Images are representative of three independent experiments, with 3–5 randomly selected, non-overlapping fields examined per treatment group in each experiment. Scale bar: 200 µm.
3.2. Preliminary Safety Evaluation of SSE
3.2.1. Acute Eye Irritation/Corrosion
At 1 h after application of SSE, conjunctival congestion received a score of 1 in all three treated eyes, whereas scores for conjunctival edema, iris reactions, and corneal reactions were 0. At 24, 48, and 72 h, all ocular scores were 0 in the treated and control eyes. No marked pain, persistent distress, or other serious adverse effects were observed during the ocular test. The study was terminated at 72 h, and SSE was classified as non-irritating under the test criteria (Table A1).
3.2.2. Repeated Skin Irritation/Corrosion
No erythema or edema was observed at any SSE-treated skin site or control site during the 14-day study. The mean irritation score per animal over 14 days and the daily mean irritation score per animal were both 0.00. No marked pain, persistent distress, or other serious adverse effects were observed during the dermal test. SSE was therefore classified as non-irritating under the test criteria (Table A2).
3.2.3. Bacterial Reverse Mutation
In the preliminary assay, 5 mg/plate SSE produced no growth inhibition in any of the five tester strains with or without S9. Tester-strain identification results are presented in Table A3. In the definitive assay, the reported solvent- and positive-control colony counts are provided in Table A4. Historical control ranges and a complete set of assay acceptance criteria were unavailable for independent verification. At 5, 2.5, 1.25, and 0.625 mg/plate, SSE did not meet the predefined positivity thresholds in any strain with or without S9, and no dose–response relationship was observed. The bacterial reverse mutation assay was therefore negative under the conditions tested (Table A4).
3.2.4. In Vitro Mammalian Chromosome Aberration
In the preliminary CHL assay, no visible precipitation was observed at 0.8, 2, or 5 mg/mL with or without S9. Visually assessed cell coverage remained above 90% at 5 mg/mL and was approximately 100% at 0.8 and 2 mg/mL under both S9 conditions (Table A5). Cell coverage was a descriptive observation rather than a quantitative measure of growth inhibition. Cytogenetic scoring results and reported chromosome-aberration rates are presented in Table A6 and Table A7, respectively. After 6 h of exposure without S9, aberration rates were 1.0%, 1.0%, and 0.5% at 5, 2, and 0.8 mg/mL, respectively, compared with 1.5% in the negative control and 18.0% in the mitomycin C positive control. With S9, the corresponding rates were 1.5%, 1.0%, and 1.0%, compared with 1.5% in the negative control and 15.0% in the cyclophosphamide positive control. After 24 h of exposure without S9, aberration rates were 1.0%, 1.0%, and 1.5% at 5, 2, and 0.8 mg/mL, respectively. The study report classified the CHL chromosome-aberration assay as negative under the tested concentrations, exposure durations, and metabolic-activation conditions. These findings provide preliminary safety information under the experimental conditions evaluated, while a broader assessment of safety would require additional studies.
3.3. Preliminary Chemical and Quality Characterization
3.3.1. Physicochemical and Microbial Attributes
SSE was described as a yellow to yellowish-brown powder. The physicochemical characteristics, microbiological results, and rutin content are summarized in Table 2.
Table 2.
Physicochemical attributes, microbiological results, and rutin content of final SSE.
3.3.2. Rutin Identification by LC-QTOF-MS and LC-MS/MS
Untargeted LC-QTOF-MS screening detected rutin in four of the ten extracts analyzed. The deprotonated ion [M − H]− was observed at m/z 609.1456 (theoretical m/z 609.1461; mass error, −0.82 ppm), with fragment ions at m/z 301.0352 and 271.0244. In these four extracts, the rutin-associated ion ranked 21st–26th by peak intensity among the detected ions (Table 3). These results provided qualitative support for rutin identification, which was further examined by targeted LC-MS/MS, while HPLC was used for quantification. Because LC-QTOF-MS and HPLC analyses involved different sample sets, comparisons of rutin content among the ten final SSE process batches were based on HPLC measurements. The peak-intensity ranking reflects the MS response under the acquisition conditions and cannot be directly translated into relative content because response factors differ among compounds.
Table 3.
LC-QTOF-MS observations for rutin in S. solidaginea extract batches in which rutin was detected.
The LC-QTOF-MS fragment at m/z 301.0352 and the product ion monitored in the targeted LC-MS/MS transition (m/z 609.1 → 299.9) were obtained using different platforms and acquisition conditions. These product ions are reported separately and are not assigned as the same ion. Previous studies of quercetin glycosides distinguish an aglycone ion near m/z 301 from a radical aglycone ion near m/z 300 [28].
Targeted LC-MS/MS supported the assignment of rutin by comparison with the reference standard. The reference standard showed a target response at 4.710 min (Figure 8A; plotted transition, m/z 609.1 → 299.9), while the extract showed a corresponding peak at 4.713 min with the same transition (Figure 8B). The raw-material test solution showed the target response at 4.757 min, supporting the presence of rutin in the plant material before processing (Figure 8C).
Figure 8.
Representative LC-MS/MS profiles of (A) the rutin reference standard, (B) final dried purified SSE, and (C) a 75% methanol extract of the raw plant material. Each panel shows, from top to bottom, the total ion chromatogram, diode-array detector (DAD) chromatogram, chromatogram for the labelled MRM transition m/z 609.1 → 299.9, and mass spectrum.
3.3.3. Preliminary Rutin Quantification and Comparison Among Process Batches
The rutin calibration range was 0.10–0.40 mg/mL. At 0.10, 0.20, 0.25, 0.30, and 0.40 mg/mL, peak areas were 53.6218, 109.8625, 131.2092, 159.8843, and 210.6482, respectively. Ordinary least-squares regression gave y = 521.101x + 2.76995, R2 = 0.998960, where x is rutin concentration (mg/mL) and y is peak area. Using the regression residual SD (σ ≈ 2.1707), the estimated LOD and LOQ were approximately 0.01375 and 0.04166 mg/mL, respectively. These estimates were not independently confirmed using low-concentration samples. Seven consecutive injections of one Y10 solution gave a mean retention time of 23.424 min (RSD 0.29%) and a mean peak area of 132.909 (RSD 1.11%). Peak widths were 0.142–0.147 min, asymmetry factors were 1.00–1.03, and theoretical plate numbers were 139,913–150,707. These results describe short-term injection precision and chromatographic system performance; they do not establish repeatability across independently prepared samples or compliance with predefined system-suitability criteria. The reported 24 h solution-stability RSD was 0.46%. Recoveries for the six samples tested at a single spiking level were 104.91%, 108.57%, 108.01%, 105.15%, 111.48%, and 108.27% (mean, 107.73%; SD, 2.44 percentage points; RSD, 2.26%; n = 6). Although variability was low, the positive bias limits the evidence for analytical accuracy. The blank showed no evident interfering peak at the rutin retention time, and SSE showed a corresponding peak (Figure 9); agreement in retention time alone does not exclude co-eluting sample components. Rutin content was determined to compare chemical consistency among laboratory-scale SSE process batches prepared from one homogenized raw-material batch. The ten reported final SSE batch contents ranged from 2.3396% to 2.5432% (approximately 2.34–2.54%), with a mean of 2.45112% and a population SD of 0.05953 percentage points, summarized as 2.45 ± 0.06% and population RSD 2.43% (Table A8).
Figure 9.
Representative HPLC chromatograms of (A) the blank, (B) the rutin reference standard, and (C) the test solution prepared from final dried purified SSE, arranged from top to bottom. No evident interfering peak was observed in the blank at the retention time of rutin (approximately 23 min), while a corresponding peak was present in the SSE chromatogram. These comparisons provide preliminary evidence of selectivity, although potential co-elution of sample constituents cannot be excluded.
3.3.4. Microbial Results
The aerobic bacterial count was <10 CFU/g (Figure 10), and the combined mold and yeast count was also <10 CFU/g. Thermotolerant coliform bacteria, Pseudomonas aeruginosa, and Staphylococcus aureus were not detected. The tested samples met the microbiological limits applied in this study [22]. These results characterize microbiological quality at the time of analysis, while stability during storage would require further evaluation.
Figure 10.
Representative culture plates from aerobic bacterial enumeration of SSE. No colonies were observed on the plates, and the aerobic bacterial count was reported as <10 CFU/g under the assay conditions. Panels (A) and (B) are blank controls, and panels (C–F) are sample plates.
4. Discussion
The present findings support a stepwise, activity-guided approach to laboratory-scale SSE preparation, in which antioxidant responses were considered alongside cellular compatibility during extraction-solvent screening. The favorable responses observed for 20–50% ethanol extracts illustrate the value of considering both endpoints when selecting extraction conditions (Figure 2, Figure 3 and Figure 4). Subsequent AB-8 fractionation supported selection of the 40% ethanol eluate from the 50% ethanol extract based on its combined DPPH and ABTS responses (Figure 5). HaCaT testing then provided biological characterization of the selected final SSE (Figure 6 and Figure 7). Together, these results provide a practical basis for further process development, while broader evaluation would be needed to determine whether the selected conditions remain suitable across independent raw-material lots and larger preparation scales.
The solvent-dependent responses observed in this study may reflect differences in extract composition, consistent with previous reports of solvent-dependent chemical recovery and antioxidant responses in botanical extracts [3,4,5,6,7,8,9,10]. Such compositional differences offer a possible explanation for both the variation in antioxidant activity and the lower HaCaT viability observed with higher-ethanol extracts. Co-extracted constituents and other matrix effects may also contribute to the cellular responses [29,30,31,32,33]. These interpretations remain tentative, as the compounds responsible for the observed effects and their causal contributions were not established. Comparative chemical profiling combined with targeted bioactivity testing would help clarify these relationships.
AB-8 was selected for laboratory-scale process development based on previous applications of macroporous adsorption resins in the enrichment of flavonoid- and phenolic-rich botanical extracts [24,33,34,35,36,37,38,39]. These reports, including the review by Aljawarneh et al. [36] and studies of Chrysanthemum indicum [37], sweet potato leaves [38], and Sophora tonkinensis [39], provided a rationale for evaluating AB-8 for S. solidaginea. In the present study, activity-guided fractionation supported collection of the 40% ethanol eluate under the tested conditions (Figure 5). These findings support the practical applicability of AB-8 within the selected process, while its performance relative to alternative resins remains to be evaluated. Comparative studies of adsorption capacity, desorption efficiency, selectivity, breakthrough behavior, and regeneration would help guide further process development. Assessment of loading and washing requirements, solvent consumption, and resin reuse would also be needed to evaluate process recovery, cost, and environmental impact at larger scales.
The HaCaT results highlight the importance of considering cellular compatibility when interpreting the antioxidant responses of final SSE. In the absence of H2O2, cell viability exceeded 90% at 0.01–0.2 mg/mL SSE, whereas higher concentrations reduced the CCK-8 signal (Figure 6A). Responses to different SSE concentrations under H2O2-induced stress should therefore be interpreted alongside their effects on cell viability (Figure 6B). Normalization of ROS fluorescence to matched parallel CCK-8 measurements accounted for differences in the metabolic-activity signal among treatments, although it did not provide a direct measure of cell number or establish an antioxidant mechanism (Figure 6D). Interpretation of the higher-concentration screening results is also limited by incomplete information on sample preparation and vehicle conditions. Figure 6C presents descriptive viability profiles at the tested concentrations and treatment times; no concentration × time interaction is inferred. These cell-based experiments provided subsequent biological characterization of the selected final SSE, while direct cellular comparisons among the AB-8 fractions remain outside the scope of this study.
The safety evaluation provided preliminary information on selected irritation and genotoxicity endpoints for a pooled SSE sample prepared from equal masses of ten final process batches. Transient conjunctival congestion resolved by 24 h, and repeated dermal application for 14 days produced no erythema or edema, supporting the non-irritating classifications under the test criteria and exposure conditions. The Ames assay was negative at 0.625–5 mg/plate with and without S9. In the CHL assay, reported chromosome-aberration rates in SSE-treated groups ranged from 0.5% to 1.5%, and the study report classified the results as negative under the tested concentrations, exposure durations, and metabolic-activation conditions. Interpretation of this classification is limited by incomplete documentation of gap-scoring criteria, historical control ranges, and exposure-matched controls. Taken together, these findings provide a basis for further safety assessment of the prepared extract. A broader evaluation for cosmetic use would require additional evidence addressing endpoints such as skin sensitization, phototoxicity, longer-term dermal exposure, and formulation-specific effects.
The microbiological findings likewise describe the tested material at the time of analysis. Low recoverable microbial counts and the absence of the specified microorganisms provide preliminary information relevant to extract handling and further formulation studies (Table 2; Figure 10). Further testing during storage and across independent batches would help assess whether the observed microbiological quality is maintained over time and is consistent among batches.
Rutin was used as a representative chemical marker for SSE characterization and comparison among the ten final process batches, drawing on previous studies [13,15,18] and the present targeted LC-MS/MS and HPLC results. Its content ranged from 2.34% to 2.54%, with a population RSD of 2.43%, indicating relatively limited variation among laboratory-scale process batches prepared from the same homogenized raw material. These findings provide preliminary information on variation in rutin content during repeated processing of a common starting material. Broader evaluation across independently sourced raw materials and storage conditions would be needed to support its use in a release specification. LC-QTOF-MS provided complementary qualitative evidence from a different sample set, whereas quantitative comparisons among the ten final SSE batches relied on HPLC. Further investigation of the relationships between rutin content, broader chemical profiles, and biological responses would help assess its suitability for quality evaluation [15,40,41]. In the present study, rutin served as a chemical marker; its predominance in SSE and contribution to extract activity were not established.
The HPLC procedure was intended for preliminary quantification rather than routine quality control. Injection-precision and single-level recovery results provided partial analytical evidence, although the mean recovery of 107.73% suggested a positive bias. Method repeatability using independently prepared samples and robustness were not established, and the mathematically estimated LOD and LOQ were not confirmed with low-concentration samples. Chromatographic performance was described without predefined system-suitability acceptance criteria. Comprehensive validation, including further assessment of selectivity, sensitivity, recovery at multiple spiking levels, method repeatability, robustness, and system suitability, would strengthen confidence in the quantitative results and support future quality-control applications.
Overall, this study provides a basis for activity-guided laboratory-scale preparation and preliminary chemical and quality characterization of SSE. Further development could include comparative evaluation of resin purification performance, assessment of independently sourced raw-material batches, broader chemical characterization, and safety and formulation studies relevant to the intended application.
5. Conclusions
An activity-guided laboratory-scale process was developed for preparing SSE from the aerial parts of S. solidaginea. The selected procedure comprised three successive 30-min ultrasonic extractions with 50% ethanol at a solid-to-liquid ratio of 1:10 (g/mL) per cycle, using fresh solvent each time, followed by AB-8 purification, water washing, 40% ethanol elution, concentration, and drying. The resulting SSE exhibited radical-scavenging activity and concentration-dependent HaCaT responses under the tested conditions. Across ten independently prepared process batches derived from a single homogenized composite of eight equally represented source samples, rutin content ranged from 2.34% to 2.54% (mean ± population SD, 2.45 ± 0.06%; population RSD, 2.43%). These results describe variation in a representative chemical marker among the laboratory-scale process batches, with HPLC serving as a preliminary analytical method. Under the conditions evaluated, an equal-mass pool of the ten final batches was classified as non-irritating in the eye and skin irritation tests, and negative results were reported in the Ames and CHL chromosome-aberration assays. These findings provide preliminary safety information for the tested material and endpoints. Together, the results support further development of the laboratory-scale preparation process and preliminary quality characterization of SSE. Evaluation of independent raw-material lots, comprehensive analytical validation, storage-stability testing, and additional application-specific safety studies would be needed to support broader use.
Author Contributions
Conceptualization, J.Z. and Z.B.; methodology, J.Z., L.C. and Y.L.; validation, J.Z., C.L. and Y.L.; formal analysis, Z.Y., Z.N. and Q.Y.; investigation, J.Z., L.C., Z.B., Q.Y., Z.N., Y.L. and C.L.; resources, Z.Y. and H.Y.; data curation, L.C. and Z.B.; writing—original draft preparation, J.Z.; writing—review and editing, Z.B., L.C. and Z.Y.; visualization, C.L. and Y.L. All authors have read and agreed to the published version of the manuscript.
Funding
This research was funded by the Lhasa Municipal Science and Technology Bureau through the project ‘Development of National New Cosmetic Ingredients from Tibetan Medicinal Material Synotis solidaginea and Quality Control Technology for Large-Scale Production’ (grant number LSKJ202424).
Institutional Review Board Statement
The animal study protocol was reviewed and approved by the Ethics Committee of Shaanxi Institute for Food and Drug Control (Approval No. HZ2025H0094; approval date: 1 March 2025). Procedures were conducted in accordance with the Safety and Technical Standards for Cosmetics (2015 Edition) [22] and the principles of replacement, reduction, and refinement (the 3Rs).
Data Availability Statement
The results reported in this study are included in the article and Appendix A. The underlying raw data are available from the corresponding author upon reasonable request.
Acknowledgments
The authors thank Mima of the Xizang Food and Drug Inspection and Research Institute for collecting and providing the plant material and Zhou Yi for species identification. The authors also acknowledge the Shaanxi Institute for Food and Drug Control for conducting the safety-evaluation work. During the preparation of this manuscript, the authors used OpenAI ChatGPT (OpenAI, San Francisco, CA, USA) for English-language editing. The authors reviewed and edited the output and take full responsibility for the content of this publication.
Conflicts of Interest
The authors declare no conflicts of interest.
Abbreviations
| Abbreviation | Definition |
| DPPH | 2,2-Diphenyl-1-picrylhydrazyl |
| ABTS | 2,2′-Azino-bis(3-ethylbenzothiazoline-6-sulfonic acid) |
| DMSO | Dimethyl sulfoxide |
| PBS | Phosphate-buffered saline |
| CCK-8 | Cell Counting Kit-8 |
| ROS | Reactive oxygen species |
| LC-QTOF-MS | Liquid chromatography–quadrupole time-of-flight mass spectrometry |
| LC-MS | Liquid chromatography–mass spectrometry |
| HPLC | High-performance liquid chromatography |
| BV | Bed volume |
Appendix A
Table A1.
Acute eye irritation/corrosion results for SSE in New Zealand rabbits under non-rinsing conditions.
Table A2.
Repeated skin irritation/corrosion results for SSE in New Zealand rabbits.
Table A3.
Identification results for the tester strains.
Table A4.
Bacterial reverse mutation assay results for SSE in the definitive plate-incorporation assay.
Table A5.
Preliminary observations of CHL cell coverage and SSE precipitation.
Table A6.
Cytogenetic scoring results for the in vitro mammalian chromosome aberration assay of SSE. Bk, break; CEx, chromatid exchange; Mn, minute; DMn, double minute; CR, centric ring; AR, acentric ring; Oth, other.
Table A7.
Summary of the in vitro mammalian chromosome aberration assay of SSE.
Table A8.
Reported rutin contents in ten SSE process batches derived from a single homogenized raw-material batch. The mean was 2.45112%, the population SD was 0.05953 percentage points (divisor n = 10), and the population RSD was 2.42865%.
References
- Bandyopadhyay, A.; Selvan, S.A.; Patial, P.K.; Pal, T. Plant-based ingredients in cosmetic science: Current applications, limitations, and prospects. Int. J. Cosmet. Sci. 2026, 48, 258–284. [Google Scholar] [CrossRef] [Scilit] [PubMed]
- Elbouzidi, A.; Haddou, M.; Baraich, A.; Taibi, M.; El Hachlafi, N.; Pareek, A.; Mesnard, F.; Addi, M. Biochemical insights into specialized plant metabolites: Advancing cosmeceutical applications for skin benefits. J. Agric. Food Res. 2025, 19, 101651. [Google Scholar] [CrossRef] [Scilit]
- Jevtovic, V.; Alabbosh, K.F.S.; Al Shankiti, B.A.; Alaskar, T.A.M.; Alyami, R.A.; El-Sofany, W.I.; Jovanovic, V.S.; Nikolic, J.; Velickovic, V.; Alshammari, O.A.O.; et al. Designing antioxidant-enriched extracts from Erica carnea L.: Optimization, kinetics, and thermodynamic insights. Molecules 2026, 31, 245. [Google Scholar] [CrossRef] [Scilit] [PubMed]
- Lee, J.; Yi, J.; Lee, K.Y.; Jang, E.; Seo, Y.; Kim, K.S. Antioxidant activity of Aceriphyllum rossi leaf extracts using different solvents. J. Agric. Life Environ. Sci. 2024, 36, 375–386. [Google Scholar] [CrossRef]
- Kang, H.; Park, C.H.; Kwon, S.O.; Lee, S.G. Antioxidant and anti-inflammatory activities of Chrysanthemum indicum extracts at different ethanol ratios. Korean J. Food Sci. Technol. 2021, 53, 416–422. [Google Scholar]
- Huang, H.X.; Zhang, Y.K.; Zhang, D.D.; Feng, M.; An, M.X. Antioxidant activity of Paeonia lactiflora pollen extracts. J. Henan Agric. Sci. 2012, 41, 117–120. [Google Scholar] [CrossRef]
- Xiong, S.L.; Ma, N.; Liao, T.T.; Xue, C.Y. Antioxidant activity of flavone with different solvent extracts from Premna microphylla. Sci. Technol. Food Ind. 2017, 38, 19–24. [Google Scholar] [CrossRef]
- Mu, X.Y.; Wu, S.; Guo, Y.P.; Liu, H.; Xu, J.; Liu, X.Y. Effects of different solvents on active component content and antioxidant activity of Rosa roxburghii extract. Food Res. Dev. 2023, 44, 68–75. [Google Scholar]
- Nakamura, M.; Ra, J.H.; Kim, J.S. The comparative analysis of antioxidant and biological activity for Dendropanax morbifera leaves extracted by different ethanol concentrations. Yakugaku Zasshi 2016, 136, 1285–1296. [Google Scholar] [CrossRef] [Scilit] [PubMed]
- Peng, L.; Jin, X.; Li, Z.Q.; Lian, Y.J.; Zhang, D.; Xia, Z.B. Research on the antioxidant capacity of Parabarium micranthum extracted by different ethanol concentrations and its antioxidant mechanism on HaCaT cells. Chin. J. Biochem. Pharm. 2016, 36, 23–27. [Google Scholar]
- Flora of China Editorial Committee. Flora Reipublicae Popularis Sinicae; Science Press: Beijing, China, 1999; Volume 77, p. 211. [Google Scholar]
- Northwest Institute of Plateau Biology; Chinese Academy of Sciences. Tibetan Medicine Records (Revised Edition); Qinghai People‘s Publishing House: Xining, China, 2019; p. 758. [Google Scholar]
- Lei, X.; Cai, L.Y.; Chen, R.; Huang, S.W.; Zhang, J.; Wu, H.; Long, F.; Lyu, G.H. HPLC determination of flavonoids and phenolic acids in Synotis solidaginea. Chin. Tradit. Herb. Drugs 2021, 52, 2414–2420. [Google Scholar]
- Wei, X.Y.; Sun, H.B.; Xi, R.Y.; Wu, F.; Liu, Y.L.; Jin, Z.L.; Guo, D.L.; Xia, B.; Wang, F.; Zhou, Y. New eremophilane-type sesquiterpenes from Synotis solidaginea. Fitoterapia 2024, 175, 105970. [Google Scholar] [CrossRef] [Scilit] [PubMed]
- Wu, M.Y.; Xiong, Y.Z.; Zhu, L.; Zeweng, Y.; Li, R.Y.; Zhang, J.X.; Wan, L. A comprehensive method for quality evaluation of Tibetan medicine Synotis solidaginea by integrating UHPLC-Q-Orbitrap MS chemical profiling and UHPLC-DAD multi-components quantification. J. Pharm. Biomed. Anal. 2024, 241, 115983. [Google Scholar] [CrossRef] [Scilit] [PubMed]
- Li, Y.Y.; Ma, Y.E.; Yao, Y.K.; Ru, G.H.; Lan, C.; Li, L.Y.; Huang, T. Protective effect of isoquercitrin on UVB-induced injury in HaCaT cells and mice skin through anti-inflammatory, antioxidant, and regulation of MAPK and JAK2-STAT3 pathways. Photochem. Photobiol. 2024, 100, 1507–1518. [Google Scholar] [CrossRef] [Scilit] [PubMed]
- Yang, D.N.; Le, J.Y.; Xiao, S.Y.; Cui, Y.L.; Zhu, W.F.; Otsuki, K.; Li, W.; Xu, J.; Feng, F.; Zhang, J. Hyperoside promotes mitochondrial autophagy through the miR-361-5p/PI3K/Akt/mTOR signaling pathway, thereby improving UVB-induced photoaging. Antioxidants 2025, 14, 1401. [Google Scholar] [CrossRef] [Scilit] [PubMed]
- Wu, P.H.; Liu, Y.H.; Zhai, H.X.; Wu, X.H.; Liu, A.M. Rutin alleviates psoriasis-related inflammation in keratinocytes by regulating the JAK2/STAT3 signaling. Skin. Res. Technol. 2024, 30, e70011. [Google Scholar] [CrossRef] [Scilit] [PubMed]
- Girsang, E.; Ginting, C.N.; Lister, I.N.E.; Widowati, W.; Yati, A.; Kusuma, H.S.W.; Azis, R. Antiaging properties of chlorogenic acid through protein and gene biomarkers in human skin fibroblast cells as photoaging model. Res. Pharm. Sci. 2024, 19, 746–753. [Google Scholar] [CrossRef] [Scilit] [PubMed]
- Girsang, E.; Ginting, C.N.; Lister, I.N.E.; Gunawan, K.Y.; Widowati, W. Anti-inflammatory and antiaging properties of chlorogenic acid on UV-induced fibroblast cell. PeerJ 2021, 9, e11419. [Google Scholar] [CrossRef] [Scilit] [PubMed]
- The State Council of the People‘s Republic of China. Regulations on the Supervision and Administration of Cosmetics (Decree No. 727); The State Council of the People’s Republic of China: Beijing, China, 2020. [Google Scholar]
- China Food and Drug Administration. Safety and Technical Standards for Cosmetics (2015 Edition); China Food and Drug Administration: Beijing, China, 2015. Available online: https://www.nmpa.gov.cn/hzhp/hzhpfgwj/hzhpgzwj/20151223120001986.html (accessed on 20 June 2026).
- Lai, H.F.; Pan, L.W.; Lyu, G.M.; Huang, X.X. Purification technology of amentoflavone from Selaginella uncinata by macroporous resin. Jiangsu Agric. Sci. 2018, 46, 201–204. [Google Scholar] [CrossRef]
- Shu, Z.M.; Jiang, J.P.; Wang, J.P.; Li, Q.Q.; Wu, X.M. Purification of total flavonoids from peels of Citrus Changshan-huyou by macroporous resin. Chin. J. Mod. Appl. Pharm. 2017, 34, 649–653. [Google Scholar] [CrossRef]
- Li, H.M.; Geng, T.; Qin, Y.B.; Song, Z.R.; Qin, J.; Zhao, Q.C.; Li, Y. Physicochemical properties and antioxidant activity analysis of polysaccharides from sea cucumber cooking liquid. Fish. Res. 2025, 47, 451–459. [Google Scholar] [CrossRef]
- National Institutes for Food and Drug Control. Questions and Answers on Eight Revised Cosmetic Test Methods. 29 May 2026. Available online: https://www.nidc.org.cn/directory/web/nifdc/bshff/hzhpbzh/hzhpbzhtzgg/20260529141034117.html (accessed on 24 September 2026).
- Chinese Pharmacopoeia Commission. Pharmacopoeia of the People‘s Republic of China (2025 Edition): Vol. IV [S]; China Medical Science Press: Beijing, China, 2025. [Google Scholar]
- Akere, A.; Liu, Q.; Wu, S.; Hou, B.; Yang, M. High throughput mass spectrometry-based characterisation of Arabidopsis thaliana group H glycosyltransferases. RSC Adv. 2018, 8, 30080–30086. [Google Scholar] [CrossRef] [Scilit] [PubMed]
- Wu, L.T.; Chu, C.C.; Chung, J.G.; Chen, C.H.; Hsu, L.S.; Liu, J.K.; Chen, S.C. Effects of tannic acid and its related compounds on food mutagens or hydrogen peroxide-induced DNA strands breaks in human lymphocytes. Mutat. Res. Fundam. Mol. Mech. Mutagen. 2004, 556, 75–82. [Google Scholar] [CrossRef] [Scilit] [PubMed]
- Asiri, A.; Tasleem, M.; Al Said, M.; Asiri, A.; Al Qarni, A.A.; Bakillah, A. Optimizing cell density and unveiling cytotoxic profiles of DMSO and ethanol in six cancer cell lines: Experimental and in silico insights. Methods Protoc. 2025, 8, 93. [Google Scholar] [CrossRef] [Scilit] [PubMed]
- Altenburger, R.; Kissel, T. Biotransformation of estradiol in the human keratinocyte cell line HaCaT: Metabolism kinetics and the inhibitory effect of ethanol. Pharm. Res. 1998, 15, 1684–1689. [Google Scholar] [CrossRef] [Scilit] [PubMed]
- Fan, J.; Li, Y.Z.; Shen, F.; Wang, J.G.; Lv, Q.; Zhang, G.; Xia, G.M.; Chen, S.Y. The effect of the extracts from “Anti-UV Clone” on the growth of HaCaT and HepG2 cell lines. J. Yunnan Univ. Nat. Sci. Ed. 2010, 32, 705–709. (In Chinese) [Google Scholar]
- Lu, Y.; Luo, J.L.; Wang, X.; Zhu, J.Y. Study on purification of Kadsura coccinea leaf extract and its application as cosmetic raw materials. Chin. Wild Plant Resour. 2024, 43, 42–85. [Google Scholar]
- Zhan, M.R.; Wang, Y.B.; Kang, S.H.; Luo, X.P. Purification of polysaccharides from Codonopsis pilosula by macroporous adsorption resin and its whitening, moisture absorption and moisturizing properties. Chem. Ind. For. Prod. 2023, 43, 79–88. [Google Scholar]
- Zhang, X.; Wang, J.Y.; Tong, Y.; Li, Y.L.; Ma, Z.S.; Wang, L. Application and prospect of macroporous resin technology in extraction and purification of traditional Chinese medicine. Chin. J. Exp. Tradit. Med. Formulae 2012, 18, 286–290. [Google Scholar] [CrossRef]
- Aljawarneh, R.Y.A.; Che Zain, M.S.; Zakaria, F. Macroporous polymeric resin for the purification of flavonoids from medicinal plants: A review. J. Sep. Sci. 2024, 47, e2400372. [Google Scholar] [CrossRef] [Scilit] [PubMed]
- Yu, J.S.; Yu, J.P. Separation and purification of flavonoids from Chrysanthemum indicum with macroporous resin. Zhongguo Zhong Yao Za Zhi 2007, 32, 2123–2127. [Google Scholar] [PubMed]
- Xi, L.; Mu, T.; Sun, H. Preparative purification of polyphenols from sweet potato (Ipomoea batatas L.) leaves by AB-8 macroporous resins. Food Chem. 2015, 172, 166–174. [Google Scholar] [CrossRef] [Scilit] [PubMed]
- Hou, M.; Hu, W.; Xiu, Z.; Jiang, A.; Men, L.; Hao, K.; Sun, X.; Cao, D. Preparative purification of total flavonoids from Sophora tonkinensis Gagnep. by macroporous resin column chromatography and comparative analysis of flavonoid profiles by HPLC-PAD. Molecules 2019, 24, 3200. [Google Scholar] [CrossRef] [Scilit] [PubMed]
- Zhang, Q.Y.; Huang, F.; Liang, W.W.; Liao, J.T.; Wu, H.Q.; Luo, H.T. Determination of 67 indicative components from plant extracts in cosmetics by ultra high performance liquid chromatography-tandem mass spectrometry. J. Instrum. Anal. 2024, 43, 663–673. [Google Scholar] [CrossRef]
- T/NAIA 0320-2024; Ningxia Chemical Analysis and Testing Association. Determination of Rutin and Other Flavonoids in Cosmetics by High-Performance Liquid Chromatography. Ningxia Chemical Analysis and Testing Association: Yinchuan, China, 2024.
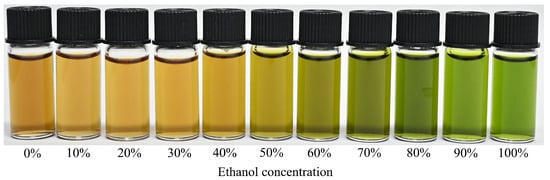
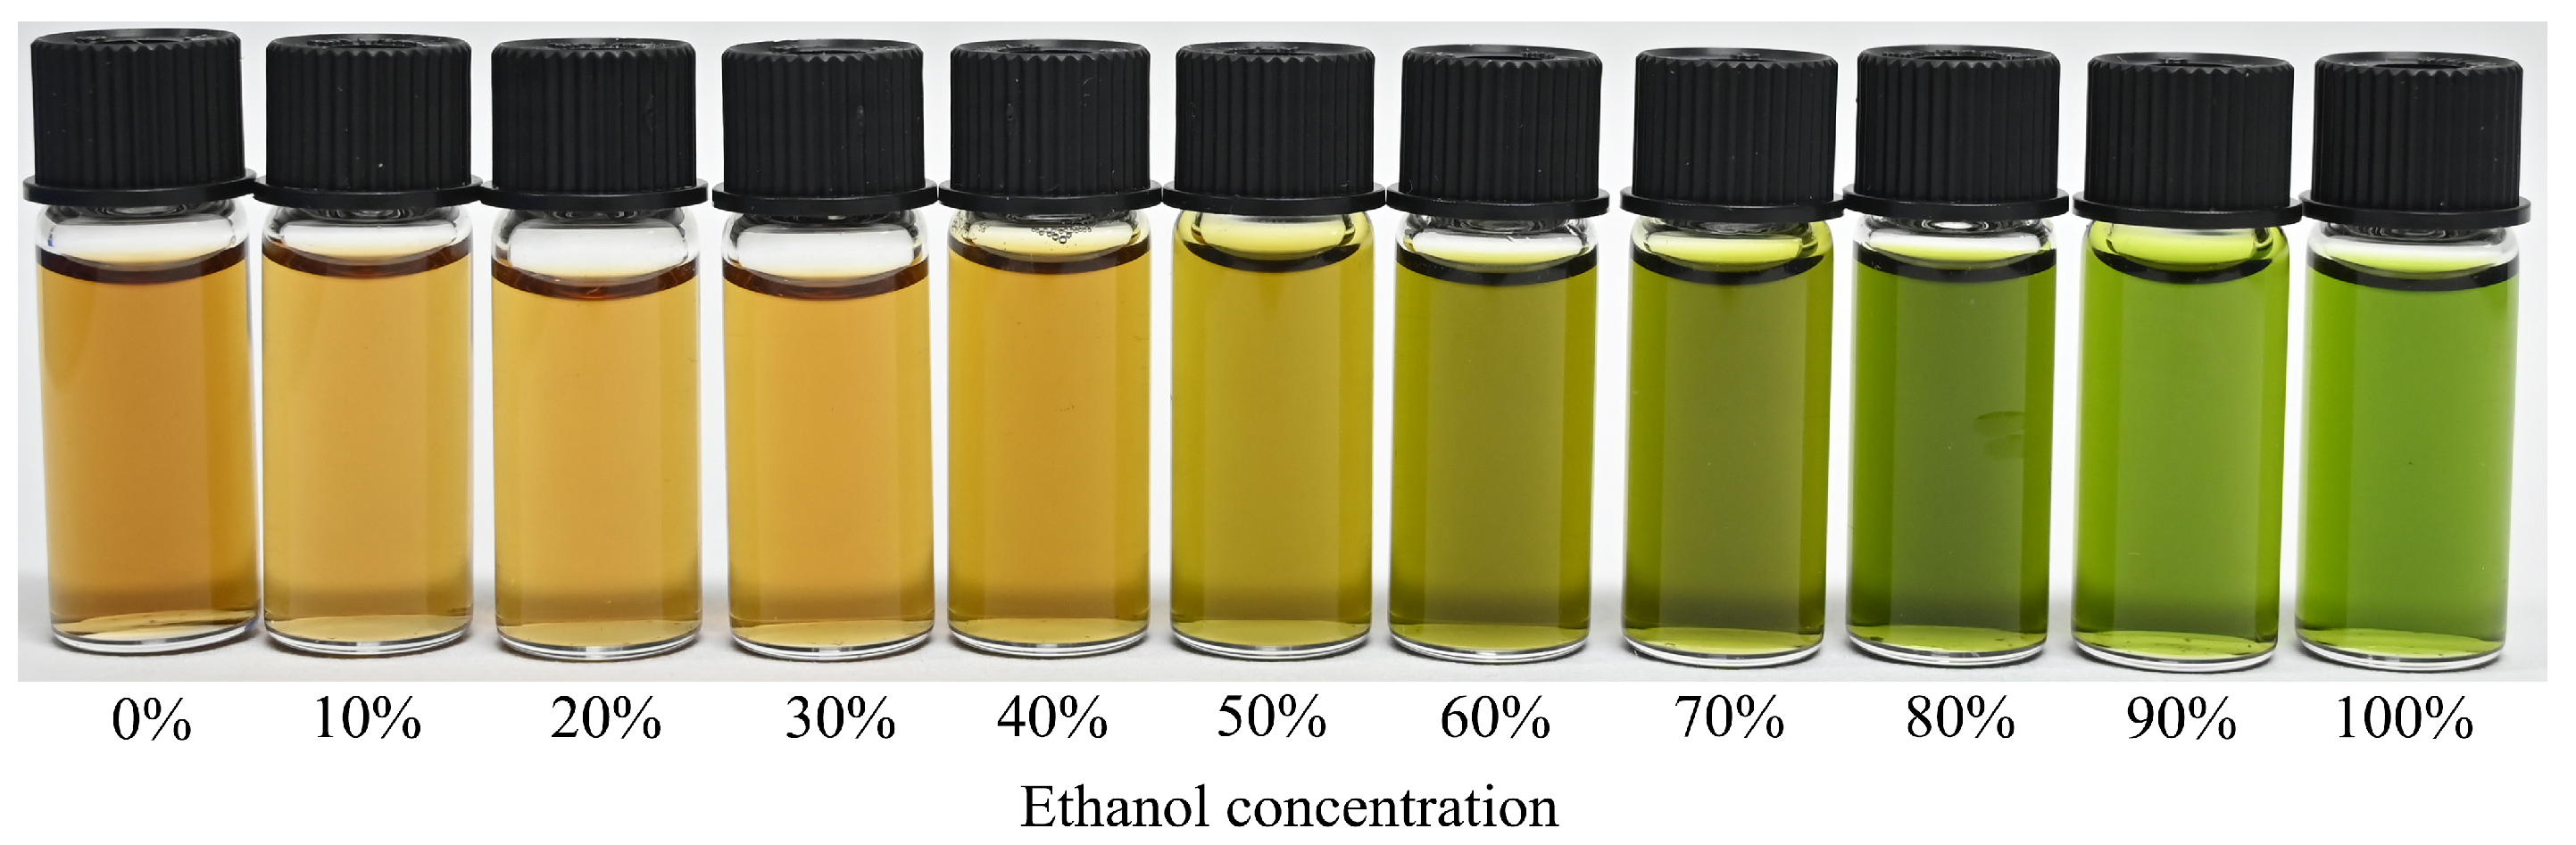
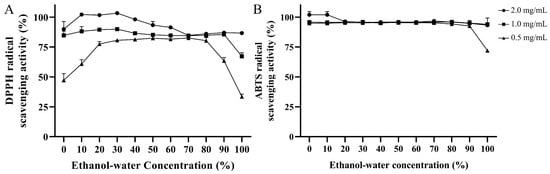
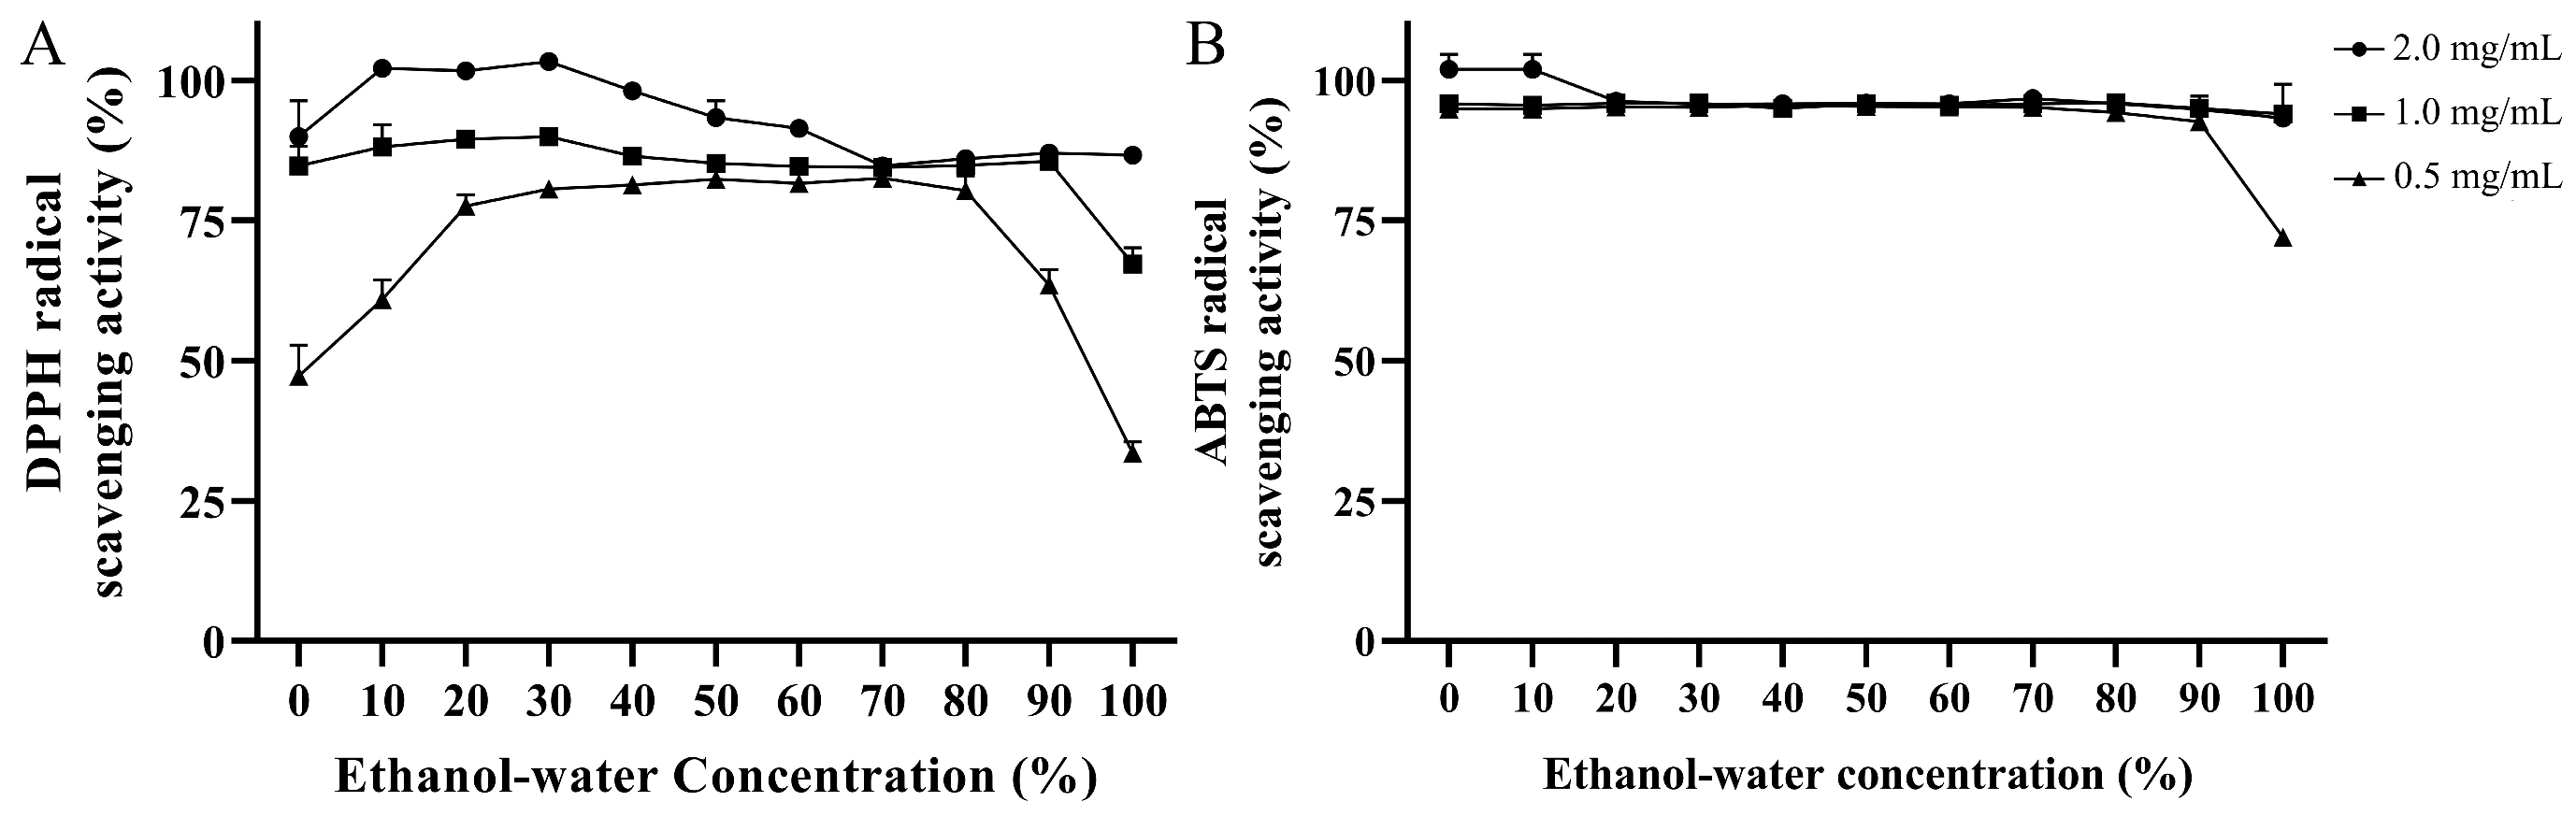
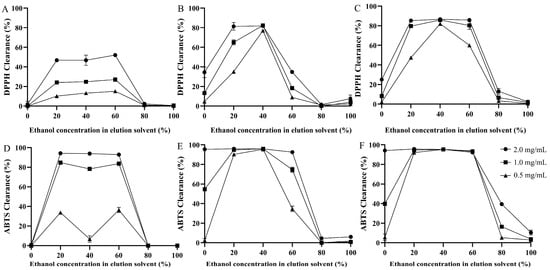
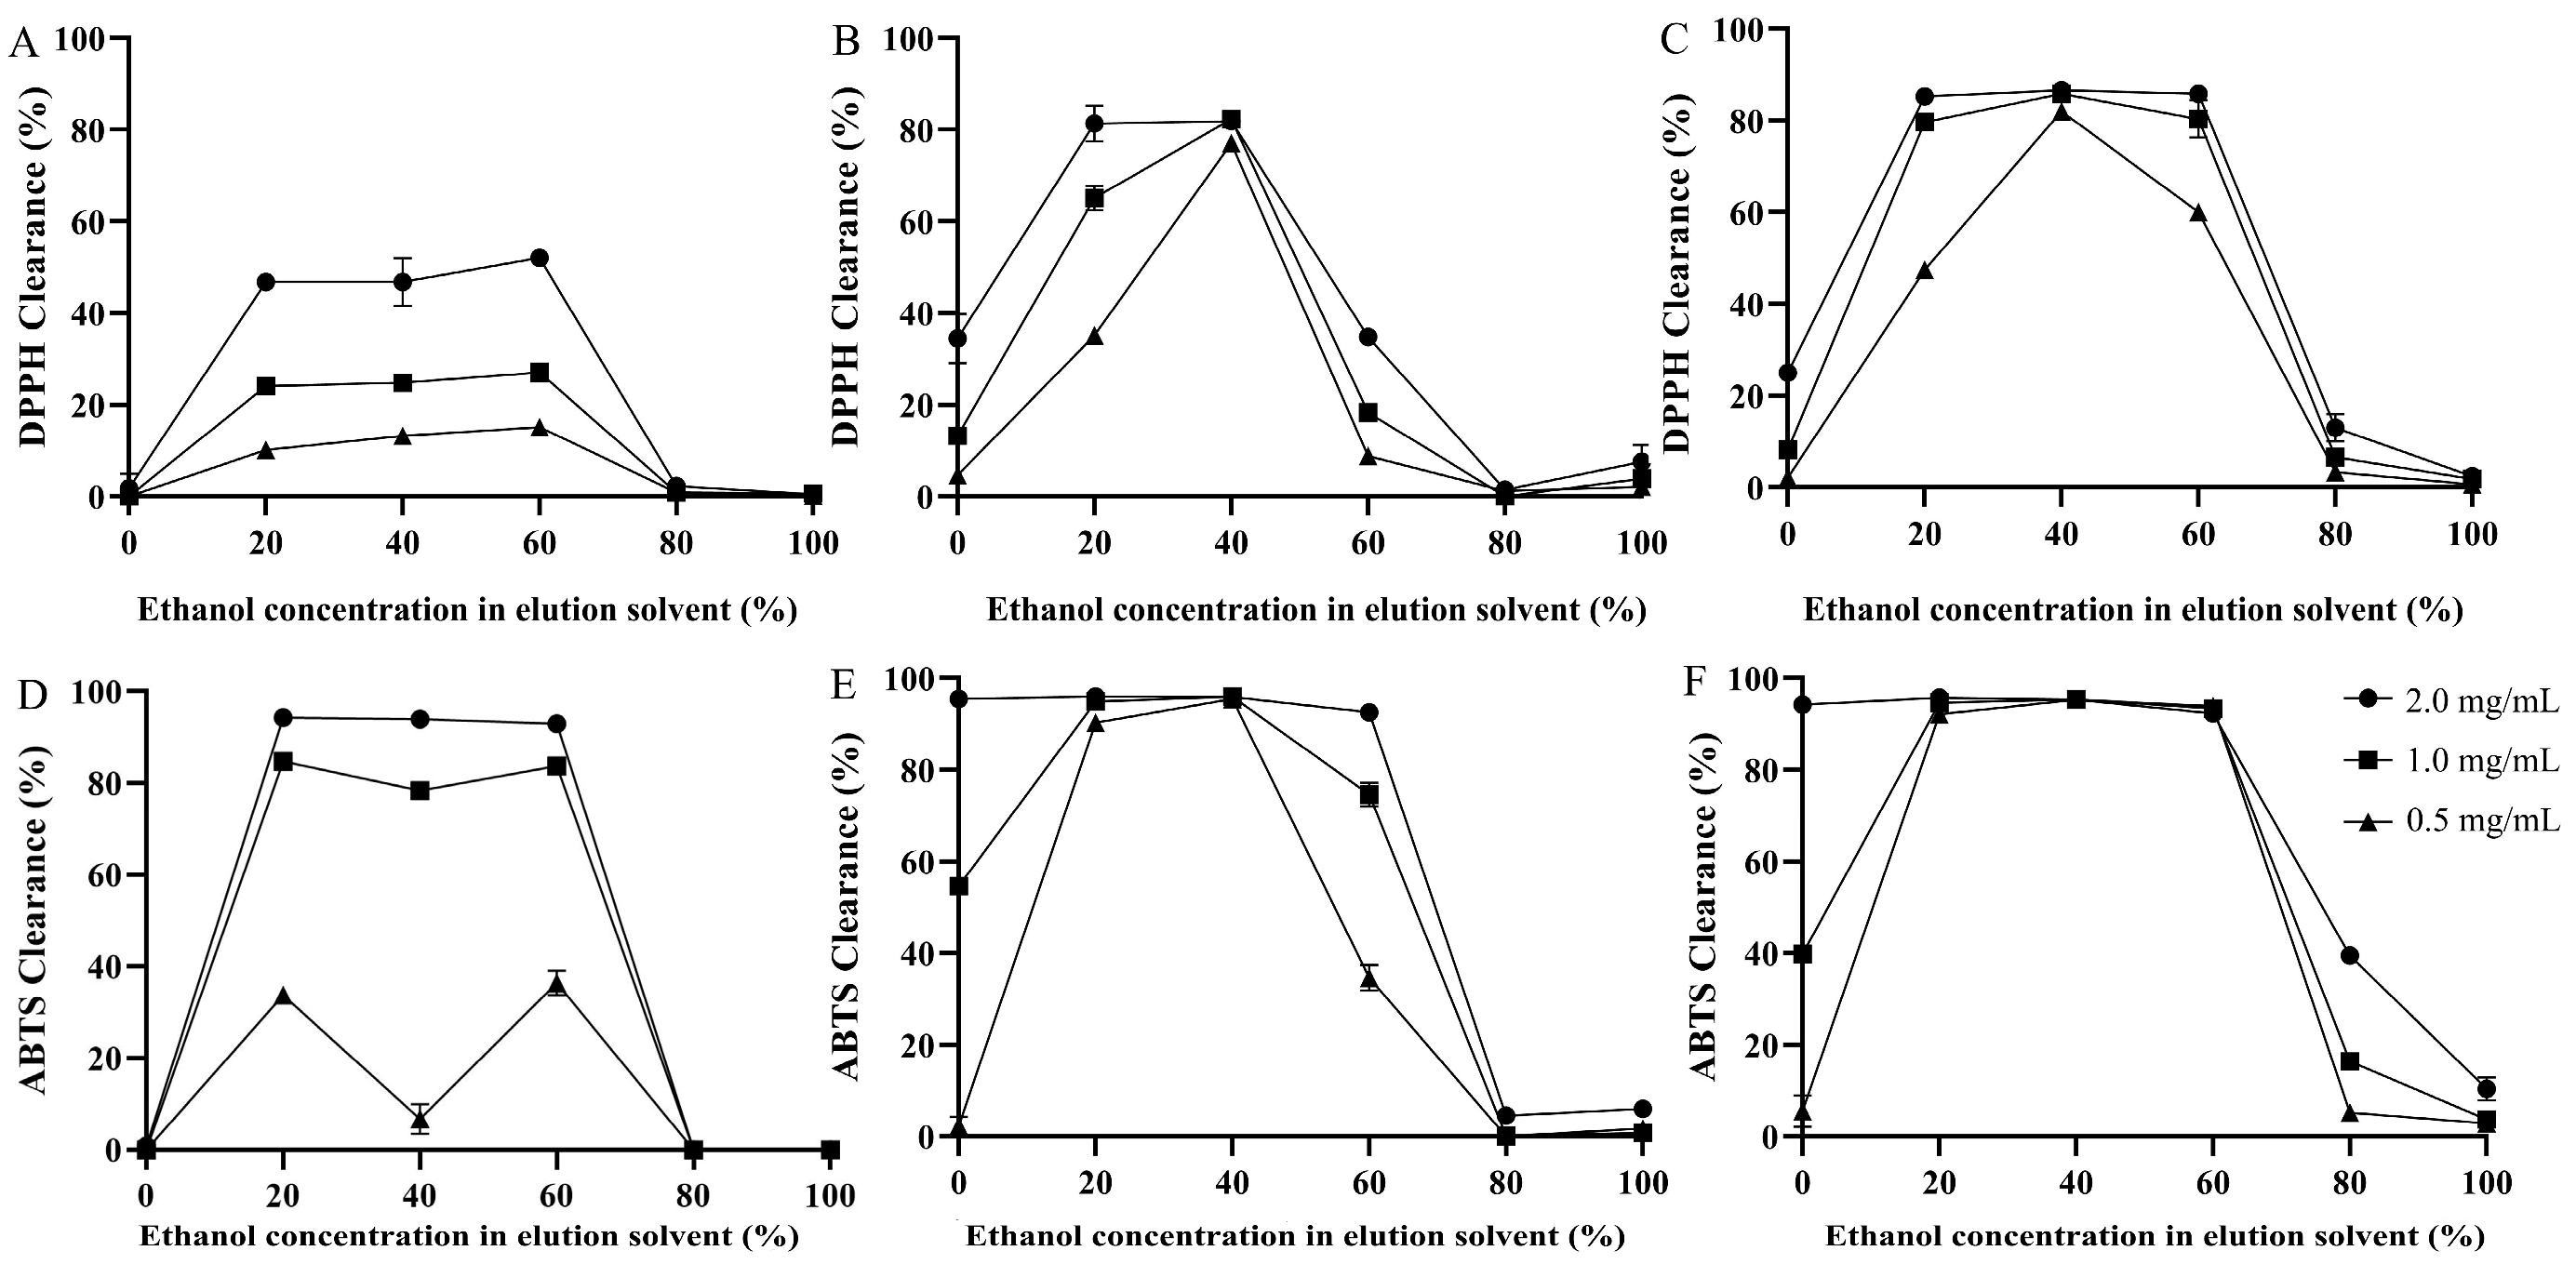
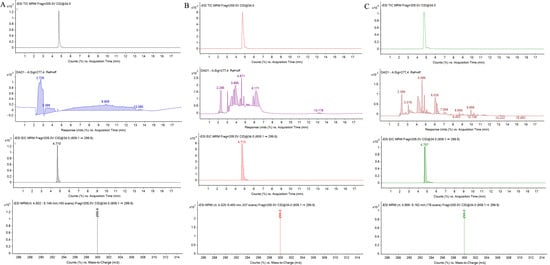
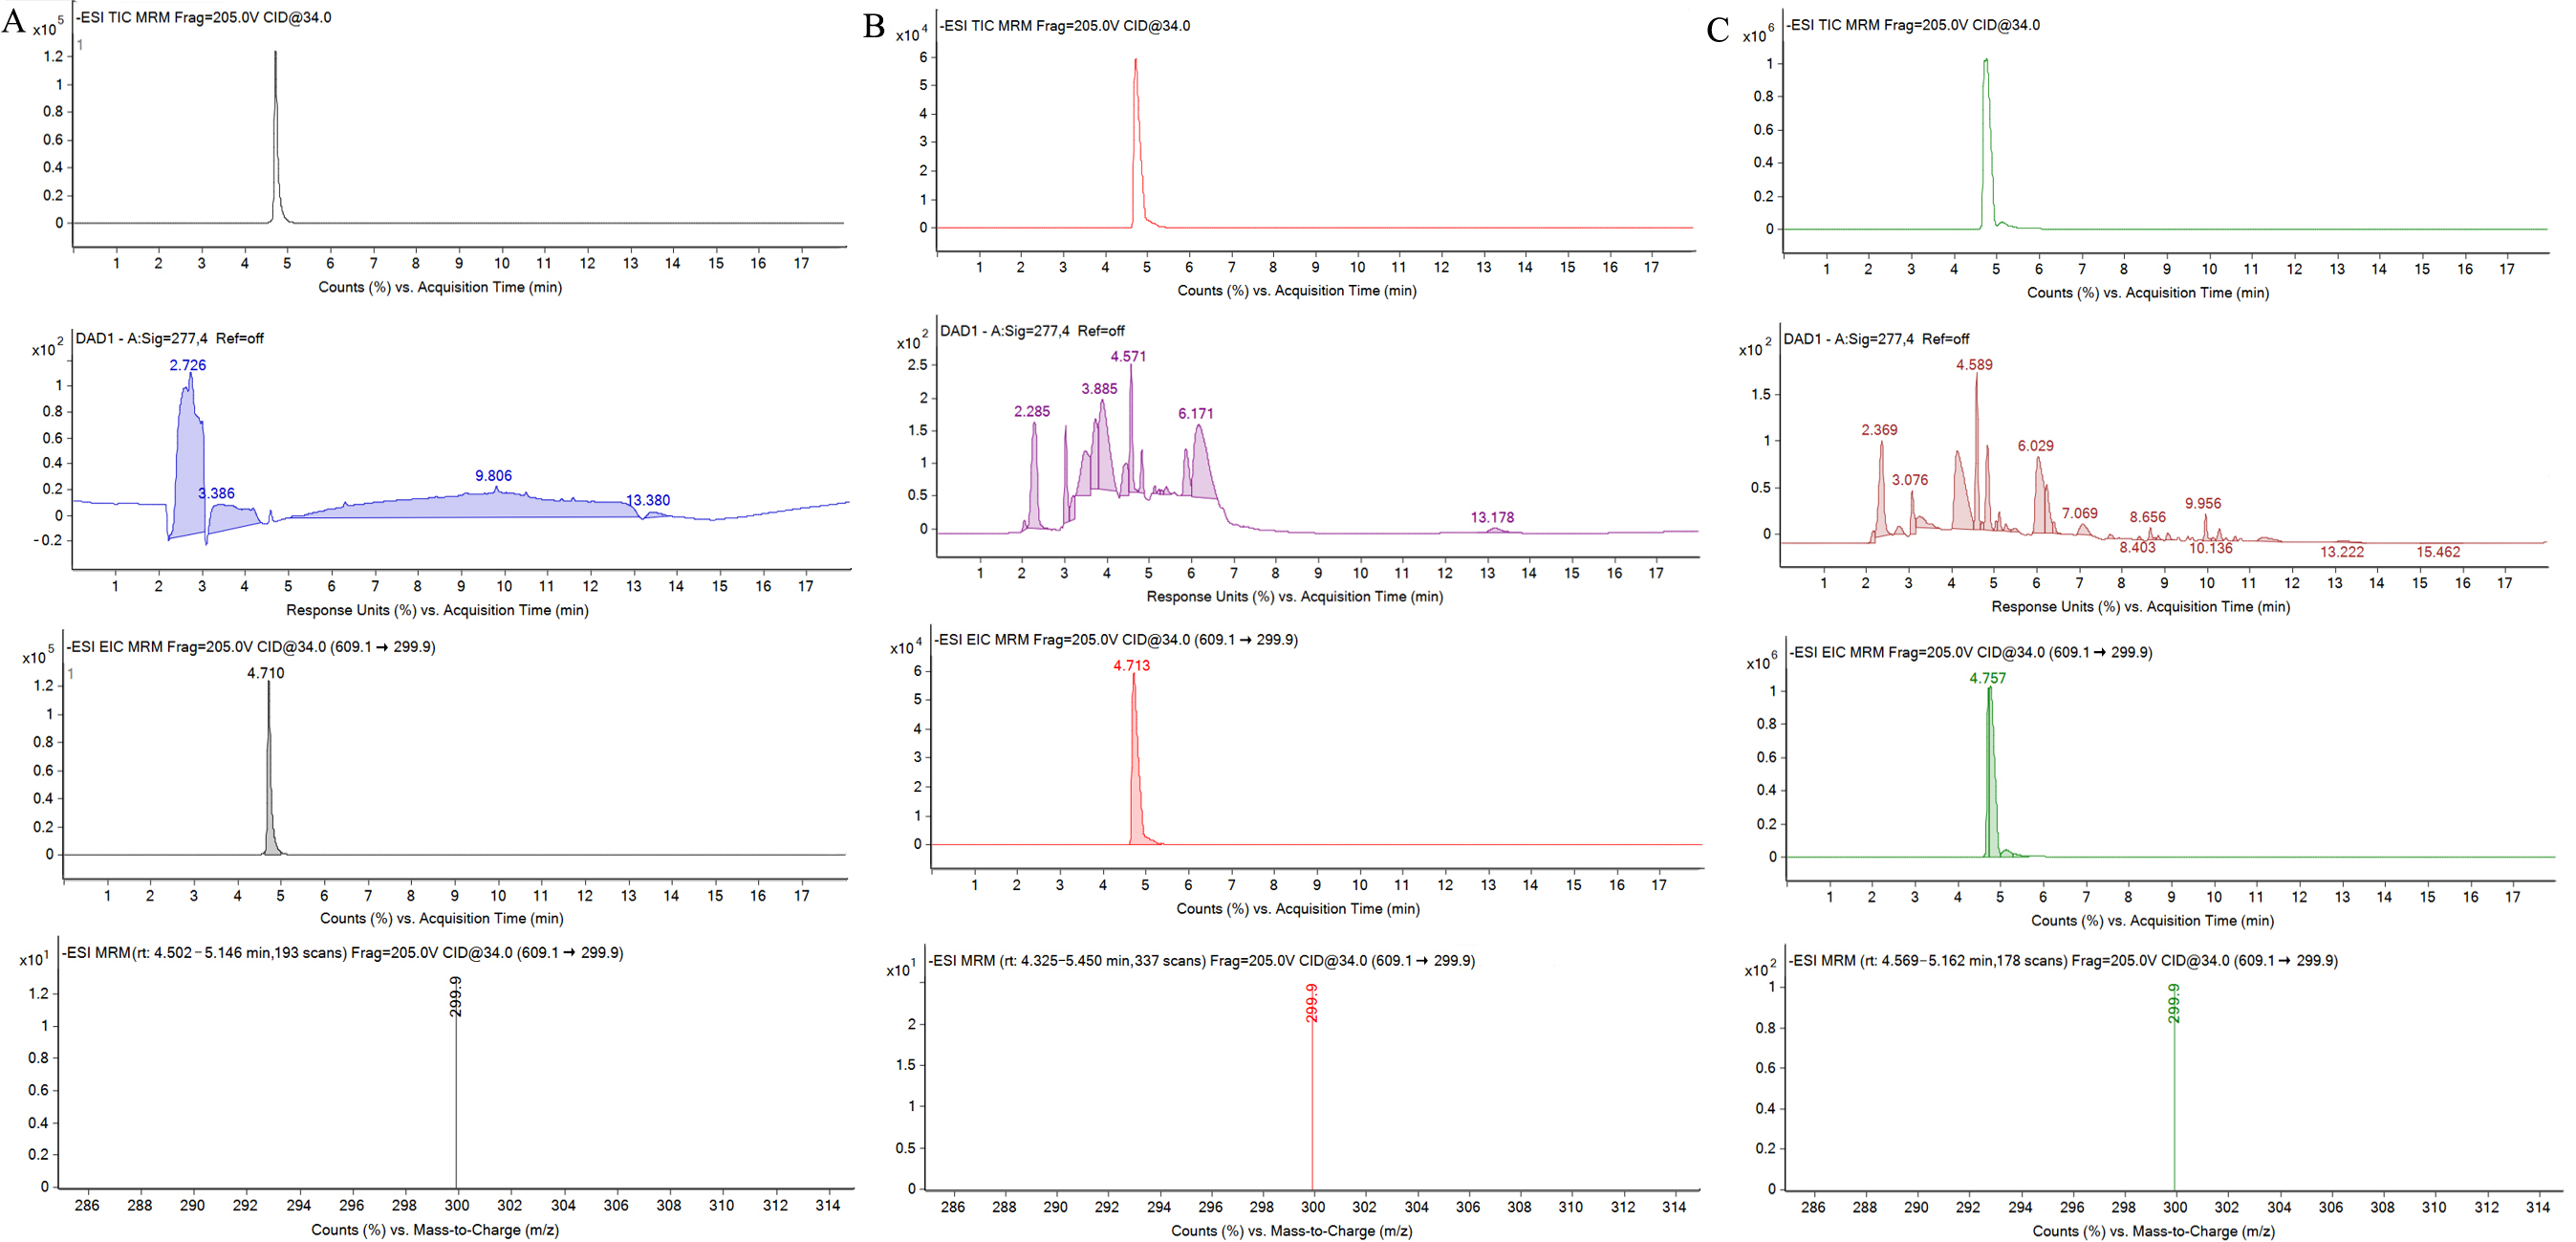
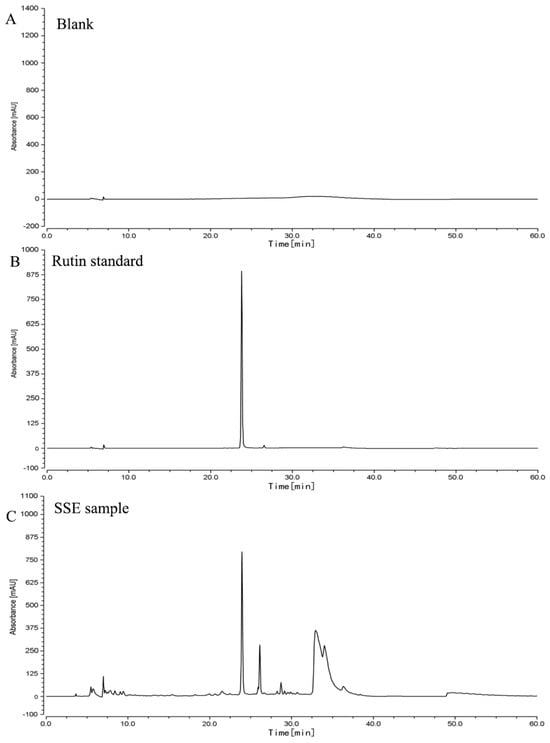
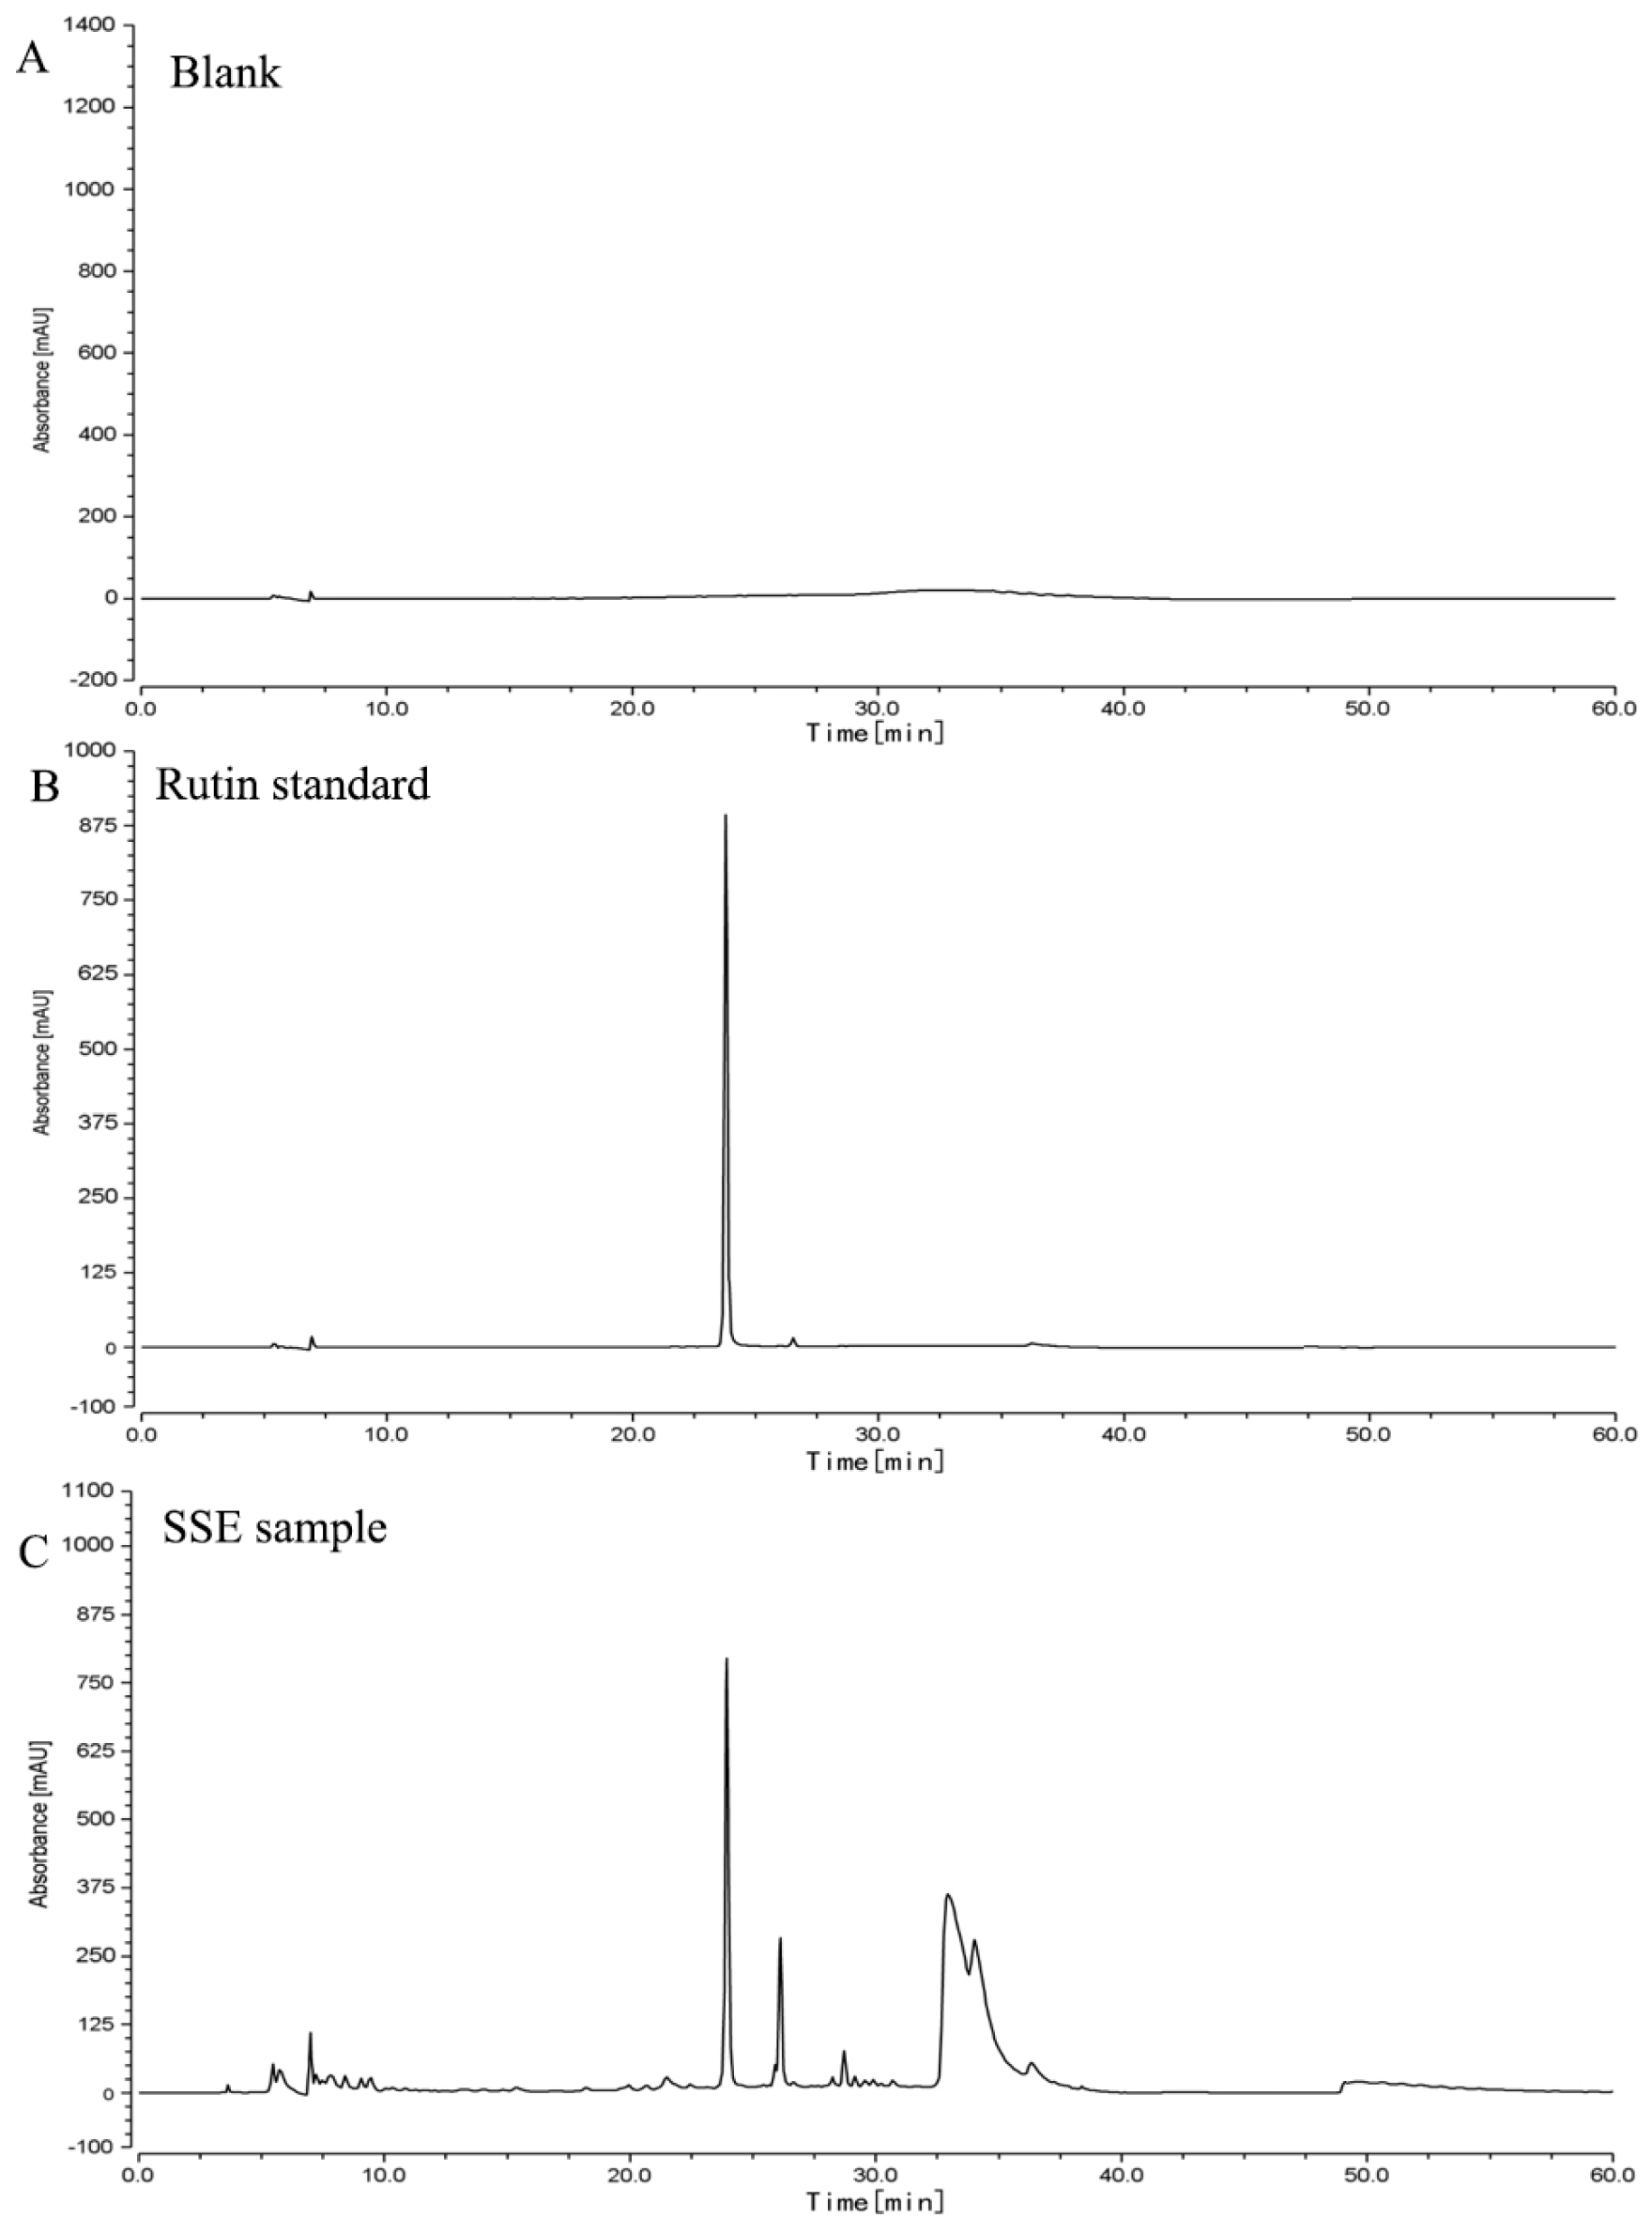
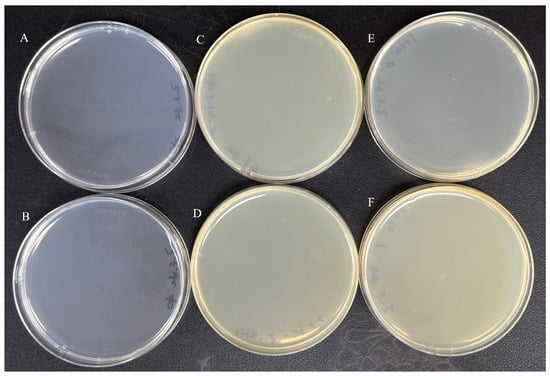
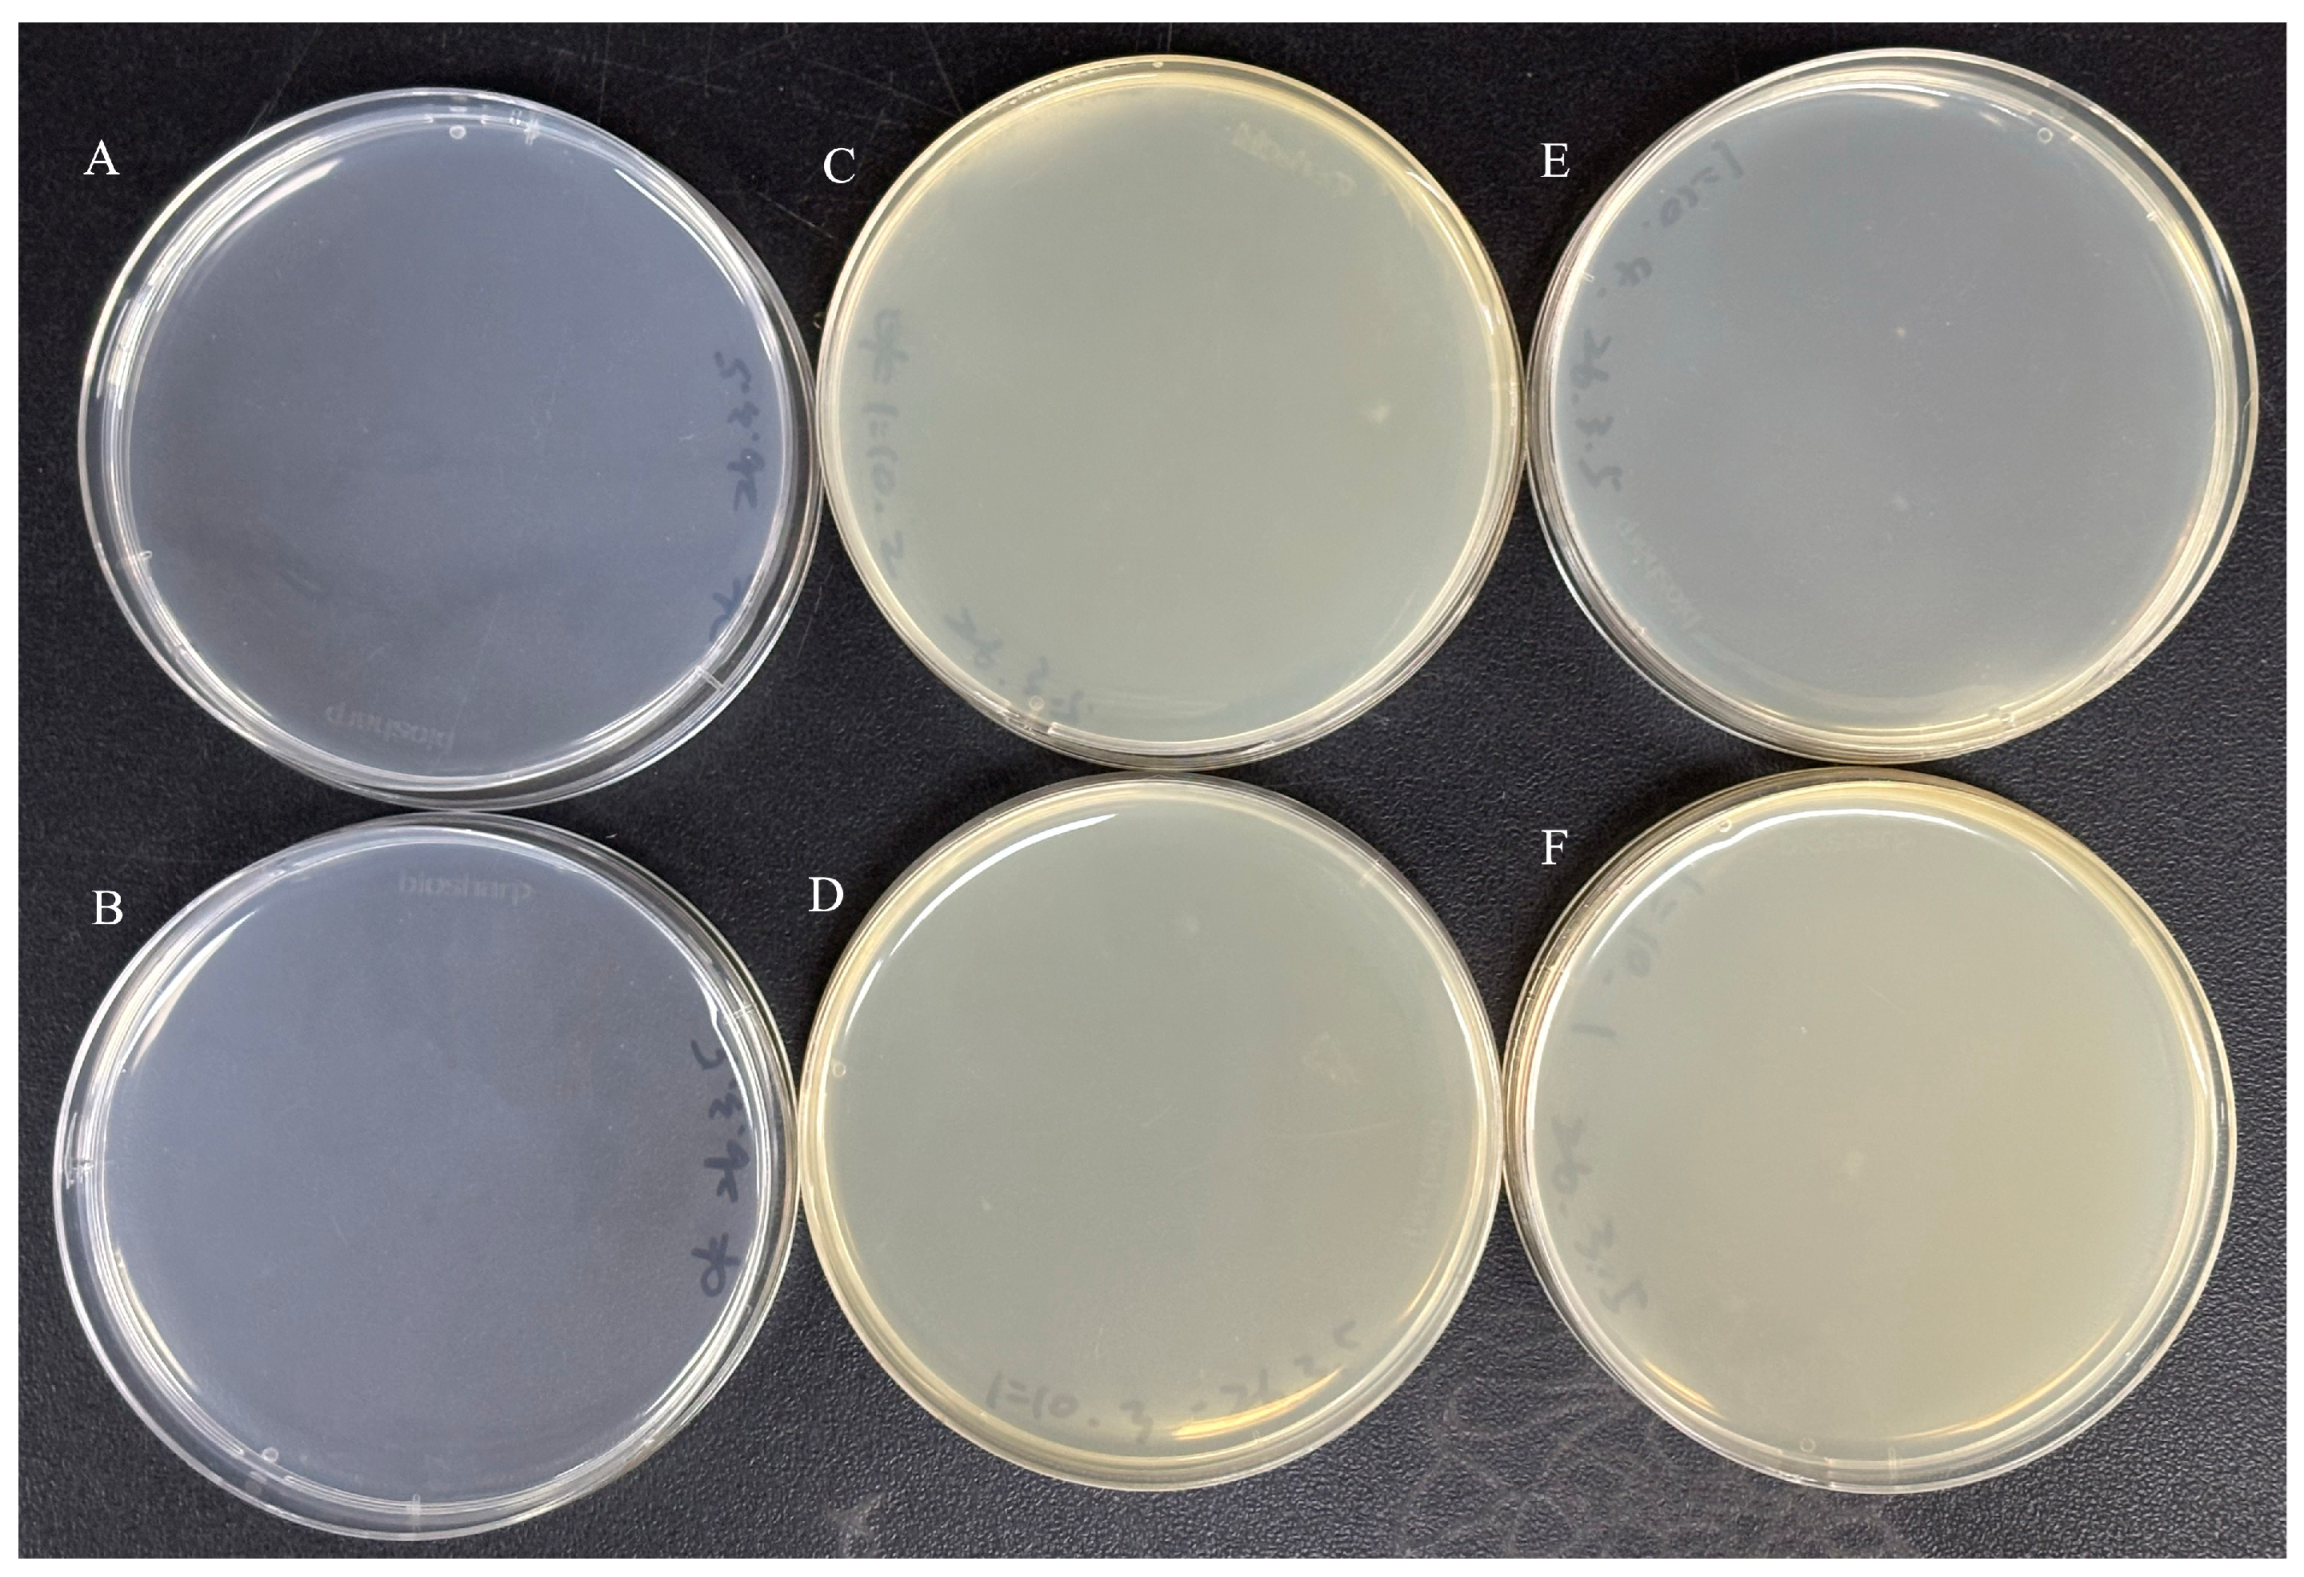

Disclaimer/Publisher’s Note: The statements, opinions and data contained in all publications are solely those of the individual author(s) and contributor(s) and not of MDPI and/or the editor(s). MDPI and/or the editor(s) disclaim responsibility for any injury to people or property resulting from any ideas, methods, instructions or products referred to in the content. |
© 2026 by the authors. Licensee MDPI, Basel, Switzerland. This article is an open access article distributed under the terms and conditions of the Creative Commons Attribution (CC BY) license.