


Abstract
With the continuous improvement of China’s electricity trading mechanism, encouraging renewable-energy sources to jointly participate in the energy-only spot market represents an inevitable trend for future development. Nevertheless, when renewable-energy power producers take part in the spot market, they are confronted with dual uncertainties originating from volatile renewable-energy output and fluctuating spot electricity prices, which degrade the stability of their revenue. To address these challenges, this paper designs a novel electricity spot market trading mechanism that accounts for stochastic scenarios of renewable energy. First, for the stochastic-scenario generation of renewable-energy output, both the interval and temporal characteristics of prediction errors are taken into consideration. Kernel density estimation and Markov chain modeling are adopted, followed by scenario reduction using an improved K-means algorithm to generate day-ahead stochastic scenarios of renewable-energy output for calculation. Subsequently, an operation optimization model for a multi-scenario coordinated complementary system consisting of wind, photovoltaic and thermal power is established. To enhance computational efficiency, a heuristic ant colony algorithm is employed for global-space search. Dynamic parameter adjustment of the pheromone volatilization factor is implemented to strengthen path searching capability and search probability to achieve accurate global-space search. Different from deterministic and robust scheduling frameworks, the proposed trading mechanism embeds high-precision stochastic scenarios into spot market optimization to balance renewable-energy revenue stability, system operation cost and rational market price signals. Finally, numerical case studies are carried out to verify and analyze the robustness and effectiveness of the proposed model. Numerical results demonstrate that compared with benchmark approaches, the proposed method reduces time-series RMSE by 11.29 MW, raises the scenario coverage rate by 8.73%, increases the comprehensive revenue of the renewable-energy base by 31.43%, and cuts the wind–solar curtailment rate by 6.95%.
1. Introduction
High-efficiency energy utilization and diversified market participants constitute the main characteristics of the new-type power system [1]. The large-scale grid integration of renewable energy poses new challenges to system flexibility. Relying on the corresponding novel electricity spot market, the new-type power system needs to provide a fair trading and competition environment for multi-energy market participants centered on renewable energy [2]. Reasonable market trading mechanisms should be formulated for the novel electricity spot market to guarantee market operational efficiency, realize the balanced distribution of multi-party benefits, and ultimately ensure the sustainable development and smooth transition of the power system [3].
Since the deployment and implementation of the new-round electric power system reform, China’s electricity market construction has advanced steadily and in an orderly manner. A pattern of diverse, competitive market participants has begun to take shape, and the role of the market in the optimal allocation of resources has been significantly strengthened [4]. With the implementation of the goal of building a new-type power system and the continuous optimization of the power-supply structure, new challenges have emerged in the operation of the electricity market [5]. Subject to the volatility of renewable-energy output, and given the fact that the accuracy of power-generation forecasting is related to the time interval between the forecasting instant and the actual dispatching moment, accurate forecasting cannot be achieved. The participation of renewable energy in the electricity market brings risks to power and energy balance, undermines market equilibrium, and is adverse to the safe and stable operation of the electricity market [6]. Compared with conventional energy generation, renewable-energy power generation is characterized by prominent uncontrollability and uncertainty. In addition, some wind power exhibits anti-peak-regulation characteristics, which requires the electricity market to be equipped with more flexible regulation measures [7]. Nevertheless, current market operation rules seldom systematically quantify the dual risks brought by forecast deviation and the anti-peak output of renewable energy in the spot market environment.
The pricing mechanism of the novel electricity spot market determines market clearing efficiency and operational stability. Existing relevant studies mainly focus on coping with the volatility of renewable energy. To address the operational challenges of power systems brought by high-penetration renewable energy and the benefit damage of market participants during generation schedule optimization, Ref. [8] develops a stochastic economic dispatch model incorporating flexible ramping product trading and generates wind power scenarios using the Copula function and quasi-Monte Carlo simulation. Australia and Germany have attempted to adopt a negative price mechanism adapted to energy fluctuation characteristics [9], which allows the market electricity price to drop to negative values under excess power supply so as to boost power consumption. Furthermore, focusing on fiscal incentive measures, some studies have designed a premium subsidy scheme for renewable energy based on the marginal pricing mechanism [10], where the government compensates renewable-energy producers participating in bidding for the gap between the feed-in tariff and the market reference price. Nevertheless, when the penetration level of renewable energy approaches 100%, market clearing prices will converge to zero if renewable-energy units bid at their marginal generation costs. Under such circumstances, price signals in conventional spot markets based on the classical marginal pricing theory lose their capability to guide resource allocation [11]. Moreover, renewable energy will suffer severe cost-recovery problems after the withdrawal of government fiscal subsidies. Accordingly, it is urgent to develop a pricing mechanism capable of revealing the true capacity cost of renewable energy to guarantee the sustainable operation of spot markets with a high penetration of renewable energy [12]. Most of these pricing-oriented investigations ignore the stochastic uncertainty of renewable-energy output when constructing market clearing models, which limits their practicability under high-penetration scenarios.
In addition, existing studies on the joint bidding of thermal power units and renewable-energy units mainly focus on thermal power unit-assisted bidding for renewable-energy units, as well as the impacts of high-penetration renewable-energy units on thermal power generation. In the context where thermal power units dominate the electricity market, Ref. [13] takes the large-scale integration of renewable-energy units into consideration and adopts the alternating direction method of multipliers (ADMM) to establish a trading model for the joint wind–photovoltaic–thermal–storage power-generation system in the spot market to obtain the optimal trading strategy. Ref. [14] constructs a time-of-use peak-regulation bidding game model for the joint participation of thermal power units and renewable-energy units in the spot market. Ref. [15] investigates the changes in bidding strategies of thermal power enterprises under scenarios with high renewable-energy penetration and carries out simulation analysis on the bidding behaviors of thermal power enterprises at different renewable-energy penetration levels. Refs. [16,17] conduct research on joint bidding among multiple renewable-energy units. Multi-objective optimization and multi-stage clearing models are the major approaches, aiming to mitigate uncertainties induced by power output fluctuations of renewable-energy units. Ref. [18] designs a spot market mechanism considering the influence of carbon trading and establishes a bi-level bidding clearing model based on coupled wind–photovoltaic–storage resources. Based on the renewable portfolio standard, Ref. [19] builds a bi-level decision-making model to analyze the joint bidding strategies of wind–photovoltaic–storage resources in the day-ahead energy-only market and frequency-regulation ancillary service market. Ref. [20] focuses on the joint bidding of wind power and hydropower units and proposes a bidding model for price-taker participants. Ref. [21] and Ref. [22] optimize the coordinated bidding strategies of hydro, wind and photovoltaic units by establishing an economic model with hydro–wind–photovoltaic capacity allocation and a joint optimization model using Nash bargaining theory, respectively. Furthermore, under the background of an electricity market system dominated by the joint spot market participation of wind–photovoltaic–storage aggregates, Ref. [23] develops a bi-level bidding and clearing model on the basis of Nash bargaining theory, attempting to increase the profit of each market participant and reduce their costs. However, few of the above joint bidding works adopt refined stochastic-scenario sets to characterize output uncertainties, which may result in overly conservative or risky market trading decisions.
Despite extensive research carried out by numerous scholars, several challenges still remain.
- (1)
- Most existing stochastic-scenario-generation methods for renewable-energy output only emphasize the temporal characteristics of forecasting errors while ignoring the interval distribution features of forecasting errors that vary with the magnitude of forecasted output. The simulated stochastic scenarios exhibit considerable deviations from the actual probabilistic properties of renewable-energy output and cannot accurately characterize the dual uncertainties when high-penetration renewable energy participates in the spot market.
- (2)
- Conventional meta-heuristic algorithms are widely adopted to solve optimization models for the coordinated participation of wind–photovoltaic–thermal power in the electricity spot market. With fixed update mechanisms, such algorithms tend to suffer from local optimum trapping and slow convergence.
To tackle these challenges, this paper proposes a novel electricity spot market trading mechanism considering stochastic scenarios of renewable energy. The main innovations of this work are summarized as follows:
- (1)
- A stochastic-scenario-generation method for renewable-energy output that takes both temporal and interval characteristics of forecasting errors into account is proposed. Integrating kernel density estimation, Markov chain and improved K-means scenario reduction, the method separately fits error distributions under different output levels based on forecast bins, reconstructs the real uncertainties of renewable energy, and generates an output-scenario set suitable for the day-ahead spot market.
- (2)
- A multi-scenario trading optimization model of the electricity spot market for coordinated wind–photovoltaic–thermal–storage operation is constructed. The objective is to maximize the comprehensive revenue of the renewable-energy base while complying with multiple constraints including power balance, tie-line power transmission, the start-up/shut-down and ramping limits of thermal units, power flow, and energy-storage operation. An improved ant colony algorithm with a dynamically adjusted pheromone volatilization factor is designed to mitigate the drawbacks of premature convergence and weak global search capability in traditional algorithms and improve the solution efficiency of the multi-scenario optimization model.
The organization of this paper is as follows: Section 2 presents the day-ahead stochastic-scenario-generation method based on renewable-energy forecasting errors. Section 3 establishes the electricity spot market trading mechanism considering renewable-energy participation, including the objective function and relevant constraint conditions. Section 4 elaborates the solution algorithm based on the improved ant colony algorithm. Section 5 carries out case studies to verify the performance of the proposed scenario-generation method and spot market trading mechanism. Finally, Section 6 concludes the whole paper.
2. Day-Ahead Stochastic-Scenario Generation Based on Renewable-Energy Forecasting Errors
When generating renewable-energy forecasting error sequences, the traditional Markov chain Monte Carlo (MCMC) method generally first conducts sampling based on the state-transition matrix to construct error sequences from state samples and then superimposes fluctuation components following a uniform distribution onto the generated simulated error sequences. Although this method takes the time-series characteristics of forecasting errors into account, it fails to effectively characterize the interval characteristics of forecasting errors. Moreover, the uniform distribution-based fluctuation compensation adopted cannot match the actual distribution of renewable-energy forecasting errors, which introduces certain deviations into the results. It should be clarified that current research cannot fully capture the dual temporal–interval uncertainties of renewable-energy prediction errors. Distinct from traditional MCMC and non-bin kernel density–Markov scenario-generation methods, the proposed multi-scenario method introduces forecast bins to fit error distributions under different output levels. Unlike robust optimization models that set excessive conservative reserves, this paper integrates the refined stochastic-scenario set into spot market optimization to achieve a trade-off among renewable-energy revenue, system operation economy and market-signal rationality.
This paper considers both the interval and temporal characteristics of errors. When generating simulated errors, sampling is first performed according to the state-transition matrix to determine the state of the forecasting error at the current time instant. Afterward, a forecasting error consistent with the corresponding state is randomly sampled from the forecasting error distribution corresponding to the forecasted output at this time instant, which is taken as the simulated forecasting error for this time instant. Sampling is implemented sequentially via the MCMC approach to obtain the simulated forecasting error sequence. Finally, the simulated forecasting error sequence is superimposed on the forecasted output sequence to yield the scenario set of renewable-energy power series.
Let the simulated forecasting error sequence for T time periods in a certain day be denoted as Ei = {E1, E2, ⋯, ET}. The specific procedures of the proposed method are described as follows.
- (1)
- According to the historical data of forecasted and actual renewable-energy output, assign the number of forecast bins, determine the forecasted output interval corresponding to each forecast bin, and construct the forecast bins. The detailed operations are as follows:
① Find the maximum value PMmax and minimum value PMmin of renewable-energy forecasted output.
② Divide the interval [PMmin, PMmax] into N non-overlapping sub-intervals.
③ Construct arrays consisting of forecasted output and corresponding forecasting errors within each sub-interval. After assembly, N forecast bins can be obtained.
- (2)
- Kernel density estimation is adopted to fit the probability distribution of forecasting errors inside each forecast bin one by one. The detailed steps are as follows:
① Suppose e1, e2, ⋯, en are random samples of forecasting errors within a given forecast bin. Let f(e) denote the probability density function of random variable E. Then, the kernel density estimation of f(e) can be expressed as:
where n is the sample size, h represents the bandwidth, denotes the kernel function, and ek is the k-th error sample.
In this paper, the Gaussian kernel is selected, which is written as:
In the above equation, u denotes the input variable of the kernel function.
② The commonly used Gaussian kernel function is selected as the probability density estimation model for forecasting errors in each forecast bin. The kernel density estimation of f(e) can be rewritten as:
③ Referring to the optimal bandwidth calculation method, the computational formula for the optimal bandwidth hbest is given by:
where σ is the standard deviation of sample variables.
hbest = 1.06σn−1/5
- (3)
- According to the forecasted output sequence of renewable energy, obtain the corresponding forecast bin at each time instant, and acquire the probability distribution of forecasting errors for each time instant.
- (4)
- Define the discrete states of forecasting errors and calculate the state-transition matrix P and cumulative state-transition matrix Pcum of forecasting errors based on historical renewable-energy forecasting error data.
- (5)
- Sample the probability distribution function of forecasting errors at time instant i to obtain the simulated forecasting error Ei at time instant i.
- (6)
- Identify state j corresponding to the simulated forecasting error Ei at time instant i. Sample the state j′ for the simulated forecasting error sequence at the next time instant according to the cumulative state-transition matrix Pcum of forecasting errors.
- (7)
- Sample the probability distribution of forecasting errors for the next time instant and judge whether the state corresponding to the sampled result is consistent with state j′ obtained in Step (6). If consistent, take this sampled result as the value of the simulated forecasting error sequence at the next time instant; otherwise, perform resampling. This step is skipped when i = 1.
- (8)
- Set i = i + 1. If i reaches the pre-specified number of time periods T, the generation of the simulated forecasting error sequence terminates; otherwise, go back to Step (5).
- (9)
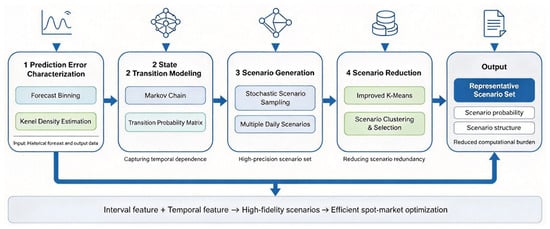
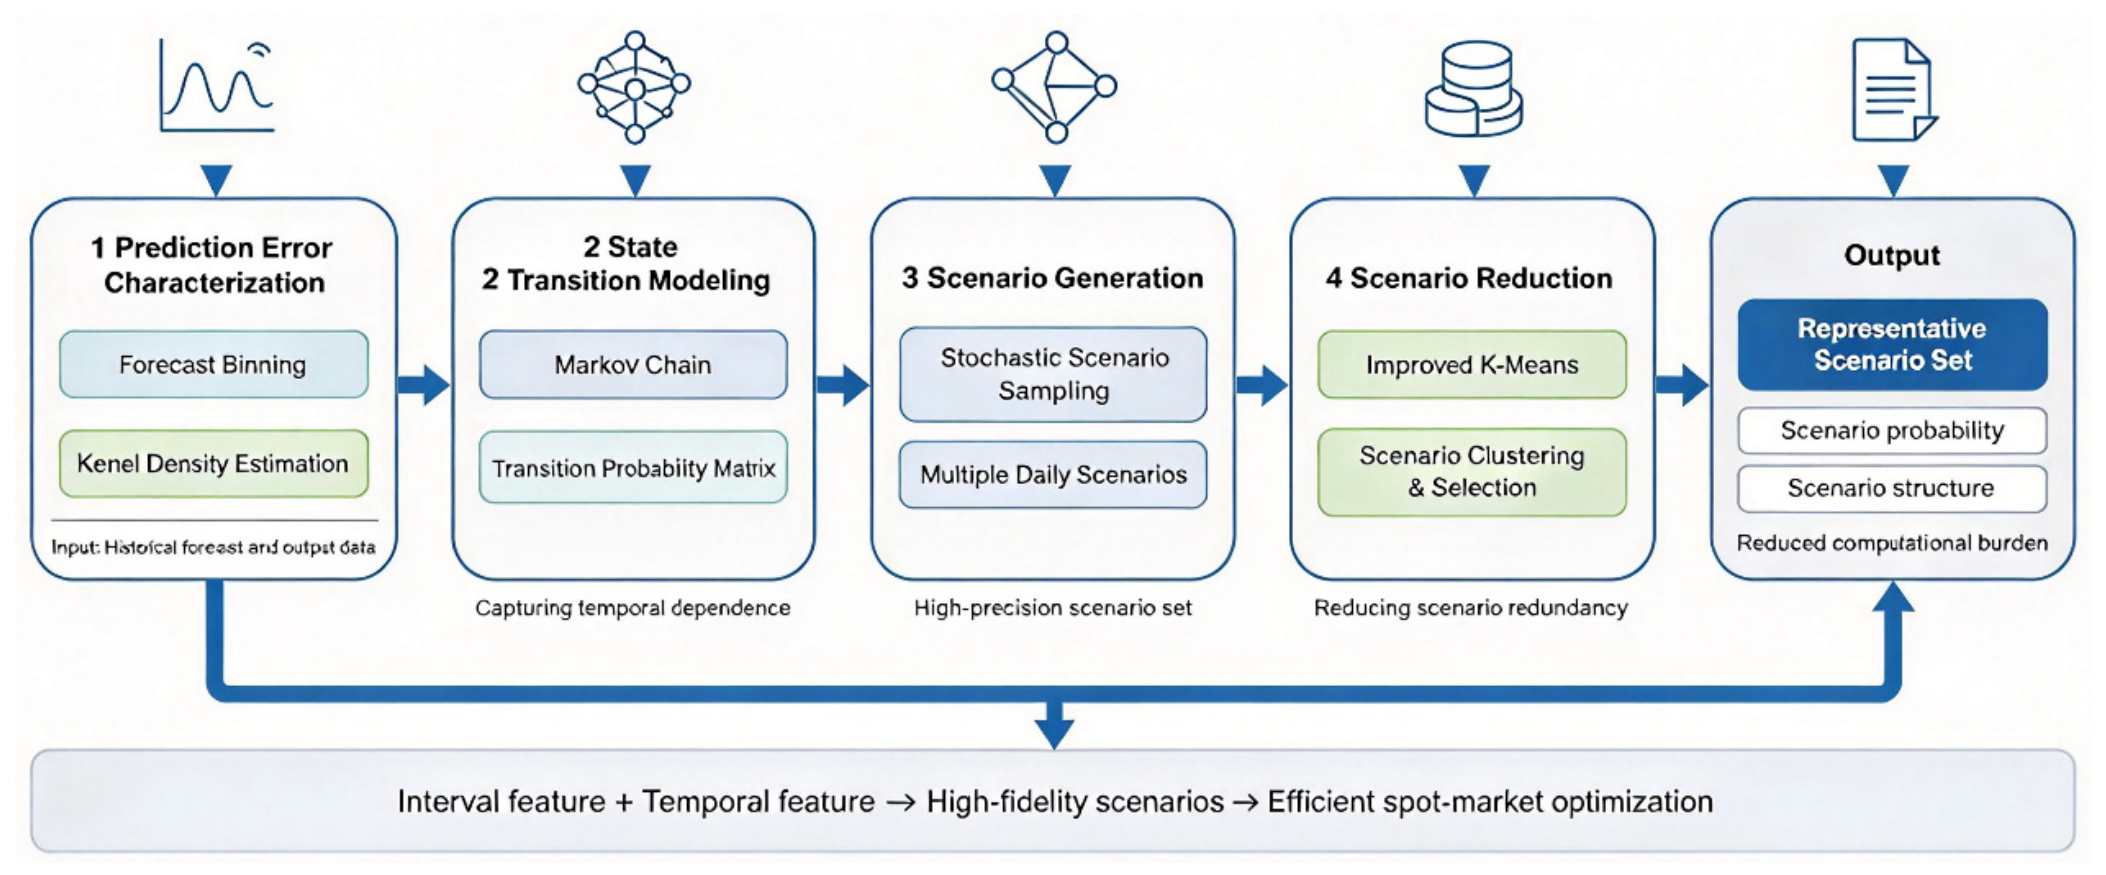
- Superimpose the simulated forecasting error sequence onto the forecasted output sequence to obtain the scenarios of renewable-energy power series. Massive day-ahead scenarios of renewable-energy power series can be generated via the above method, which can fully characterize the uncertainties of renewable energy. Different from the conventional K-means algorithm, which randomly initializes cluster centroids and easily falls into local optima, the improved K-means algorithm proposed in this paper introduces the maximum-distance criterion for centroid initialization to select initial cluster centers uniformly distributed across the sample space and incorporates the Wasserstein distance as the similarity metric instead of Euclidean distance to better measure the probabilistic discrepancy between stochastic scenarios; meanwhile, the algorithm adopts a scenario weight-updating strategy during clustering iteration, which retains the probability information of each original scenario and avoids distorting the overall probability characteristics of the generated scenario set so that the obtained representative scenarios can preserve the statistical features of the original high-dimensional stochastic scenarios while reducing the total number of scenarios and lowering computational burden for subsequent spot market optimization. To gain a better understanding, a detailed framework of the proposed multi-scenario-generation method is given in Figure 1.Figure 1. Framework of the Proposed Multi-Scenario-Generation Method.
3. Electricity Spot Market Trading Mechanism Considering Renewable-Energy Participation
3.1. Objective Function
Under multiple scenarios, the optimization objective of the renewable-energy base is to maximize its comprehensive revenue. The comprehensive revenue consists of spot market revenue, unit start-up/shut-down costs, operation costs and deviation penalty costs. The objective function is formulated as follows:
where Rspot denotes the trading revenue in the spot market; Csta, Cope and Cpen represent the start-up/shut-down cost, operation cost and penalty cost of the renewable-energy base, respectively; and are the start-up and shut-down cost coefficients of thermal power units, respectively; and are Boolean variables characterizing the operating status of thermal power units, where a value of 1 indicates that the thermal unit is in the on-line state and 0 represents other states; is the spot market electricity price; is the declared power output for sale of the renewable-energy base; ai, bi, and ci are fuel cost coefficients of thermal power units, which are generally obtained from historical unit data; λpen+ and λpen− are penalty factors for positive and negative power imbalance, respectively; and and denote the over-generation power and power shortage of the base, respectively, which can be obtained by (9). In the objective function (7), each scenario is associated with a distinct occurrence probability. The optimal scheduling decision of the multi-scenario model can be obtained by multiplying the scheduling outcome under each scenario by its corresponding occurrence probability. Ωs denotes the set of all stochastic scenarios, s ∈ Ωs represents a specific scenario, and πs is the occurrence probability of scenario, which satisfies Equation (10).
3.2. Constraints
- (1)
- Tie-line power constraint.
- (2)
- Wind power and photovoltaic output constraints.
- (3)
- Thermal power unit operation constraints.
The output and ramping rate of thermal power units shall be kept within their limit ranges:
where and are the upward and downward ramping rates of thermal power units, respectively, and Δt denotes the operation time scale.
Given that thermal power units cannot rapidly switch between start-up and shut-down states, they must comply with the minimum on-time constraint:
The minimum shut-down-time constraint for thermal power units is given by (15):
where and are the minimum on time and minimum shut-down time of the unit, respectively; denotes the initial on–off duration of the unit; m and Hi represent the mandatory on time and mandatory shut-down time at the initial instant for the unit, respectively; and is the initial operating state of the unit.
- (4)
- Power flow constraints.
- (5)
- Energy-storage-related operational constraints.
In the electricity spot market trading mechanism constructed herein, which accounts for stochastic renewable-energy scenarios, energy storage can smooth the stochastic fluctuations in wind and photovoltaic output subject to the operational constraints of charging/discharging power and SOC. It cooperates with thermal power units to realize coordinated and complementary system operation across multiple scenarios. On the one hand, energy storage stores surplus wind and photovoltaic power during periods of high renewable generation to curtail wind and photovoltaic curtailment and improve the overall accommodation capacity of the renewable-energy base. On the other hand, it can release stored electricity when renewable output is insufficient to mitigate imbalance penalties caused by power shortages. Meanwhile, it helps stabilize tie-line power fluctuations, reduce the peak-shaving pressure of thermal units and cut the costs incurred by frequent unit start-up and shut-down. Consequently, the comprehensive revenue of the renewable-base is increased, and revenue fluctuations across different stochastic scenarios are alleviated. While satisfying system power balance and power flow security constraints, the proposed model facilitates the formation of more reasonable spot market price signals and supports the safe and stable participation of high-penetration renewable-energy players in spot market transactions.
- (6)
- Power balance constraint.
4. Solution Method Based on Improved Ant Colony Algorithm
The economic dispatch problem of power grids is a complex combinatorial optimization problem. Owing to the large number of feasible solutions and the existence of integer variables for each feasible solution, the ant colony algorithm is adopted to tackle this problem. m ants are randomly placed on n decision variables, and the initial pheromone value on every edge between decision variables is set as τ(0) = const, where const represents a constant. Let bi = t denote the number of ants located at element i at time instant t, then ; tabuk is the taboo table used to record the feasible solutions traversed by ant k, whose initial entry is the first feasible solution. The set V is dynamically adjusted along with the evolution of tabuk; ants are forbidden to revisit the feasible domains corresponding to those feasible solutions that have been stored in tabuk. The ants finish one iteration once all n feasible solutions are recorded in tabuk. Upon completion of this iteration, tabuk is cleared, and the ants regain full freedom for subsequent selection. During path searching, ants compute the state-transition probability according to the pheromone quantity and heuristic information of each path. The state-transition rule adopted by the ant colony system is known as the random-proportional rule. At time instant t, the transition probability for ant k to select feasible solution j from feasible solution i is expressed as:
where allowedk = {0, 1, 2, …, n − 1\} − tabuk, a denotes the information heuristic factor, representing the relative importance of pheromone paths. β denotes the expectation heuristic factor, representing the relative importance of visibility. dij represents the feasible solution, and it is inversely proportional to the heuristic function ηij(t).
ηij(t) = 1/dij
After ants traverse n feasible solutions over t time instants to complete one tour, the pheromone concentration deposited on the paths gradually decays. Therefore, it is necessary to update the pheromone on each path, and the corresponding expression is given by:
where denotes the pheromone intensity deposited on path (i,j) by the k-th ant during the time interval (t, t + 1). ρ is the pheromone evaporation factor, and (1 − ρ) represents the residual pheromone factor. The magnitude of ρ directly affects the global search capability and convergence speed of the ant colony algorithm, while (1 − ρ) reflects the mutual-influence capability among individual ants.
The pheromone processing scheme adopted in the conventional ant colony algorithm suffers from drawbacks such as an excessively slow convergence speed and heavy computational burden. To better address this issue, an improvement is introduced for pheromone updating. The pheromone processing rule for the modified ant colony algorithm is expressed as:
where tnew denotes the current time, told denotes the time of the previous stage, τ(lk,tnew) represents the pheromone quantity on path lk at the current time, ρ(lk,tnew) denotes the pheromone evaporation coefficient of path lk at the current time, and ξ represents the pheromone deposited by a single ant within a unit time interval.
τ(lk,tnew) = (1 − ρ(lk,tnew)) + (tnew − told)ξ
After the ants complete the current iteration, the tour distances are calculated. Let Lbest be the shortest tour and Lworst be the longest tour. The update strategy for the shortest and longest tours is implemented according to Equations (23) and (24):
where φk represents the influence degree of the k-th ant-corresponding solution on the pheromone update of path (i,j) and Q is the pheromone intensity on the path. After the pheromone update is completed, the pheromone value of each edge is constrained within a certain range. This measure can reduce the pheromone discrepancy among all edges when excessive pheromones accumulate, thus expanding the search space for global solutions to a certain extent. The ant colony algorithm involves numerous parameters, and each parameter possesses its practical physical meaning. Reasonable parameter configuration can accelerate the system convergence speed, strengthen the global search capability, and effectively suppress the occurrence of premature stagnation. When a and β become excessively large or small, the adjustment formula is given as (25) and (26):
where k is the proportionality coefficient.
Regarding the specific parameter settings of the algorithm, they are shown in Table 1 below.
Table 1.
Parameter Settings of the Improved Ant Colony Algorithm.
In the optimization model, the 0–1 Boolean variables for the start-up and shut-down of thermal units, active power output of each unit, charging and discharging power of energy storage, and day-ahead declared output constitute all the decision variables of the model. In the improved ant colony algorithm, the complete traversal path of each ant is mapped to a full set of scheduling decision schemes. Different nodes on the path correspond respectively to the on/off status of thermal units, unit output power, charging/discharging power of energy storage, and day-ahead declared output of the renewable-energy base. Ants perform optimization within the discrete solution space, and the pheromone concentration of different paths reflects the quality of corresponding scheduling schemes. The termination criteria of the algorithm are set as follows: the iteration number reaches the predefined maximum number of iterations or the variation in the optimal objective function value over consecutive generations is less than the given threshold. Iteration terminates and the optimal solution is output once either condition is satisfied. For the equality and inequality constraints in the model, including power balance, tie-line power, unit ramping, minimum up/down time, power flow, and energy-storage operation constraints, the algorithm adopts a constraint handling mechanism combining feasibility judgment and penalty functions. After each ant generates a complete path (scheduling scheme), the algorithm first verifies whether this scheme satisfies all operational constraints. For individuals violating constraints, corresponding penalty terms are imposed on the comprehensive revenue in the objective function to reduce the pheromone deposition level of this path. This guides the ant colony to conduct global search toward the feasible solution space that satisfies all operational constraints, thereby eliminating infeasible solutions and ensuring that the obtained scheduling scheme complies with the practical operating boundaries of the power system.
5. Case Study
5.1. Introduction to Test System
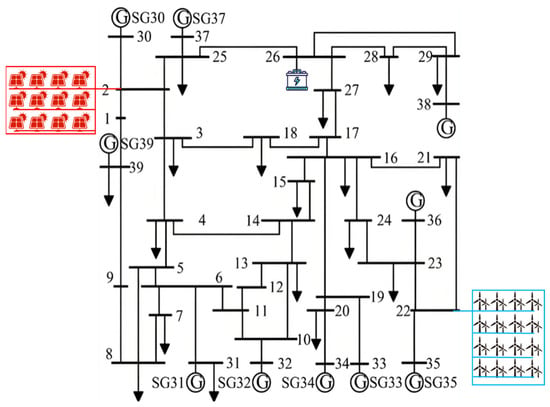
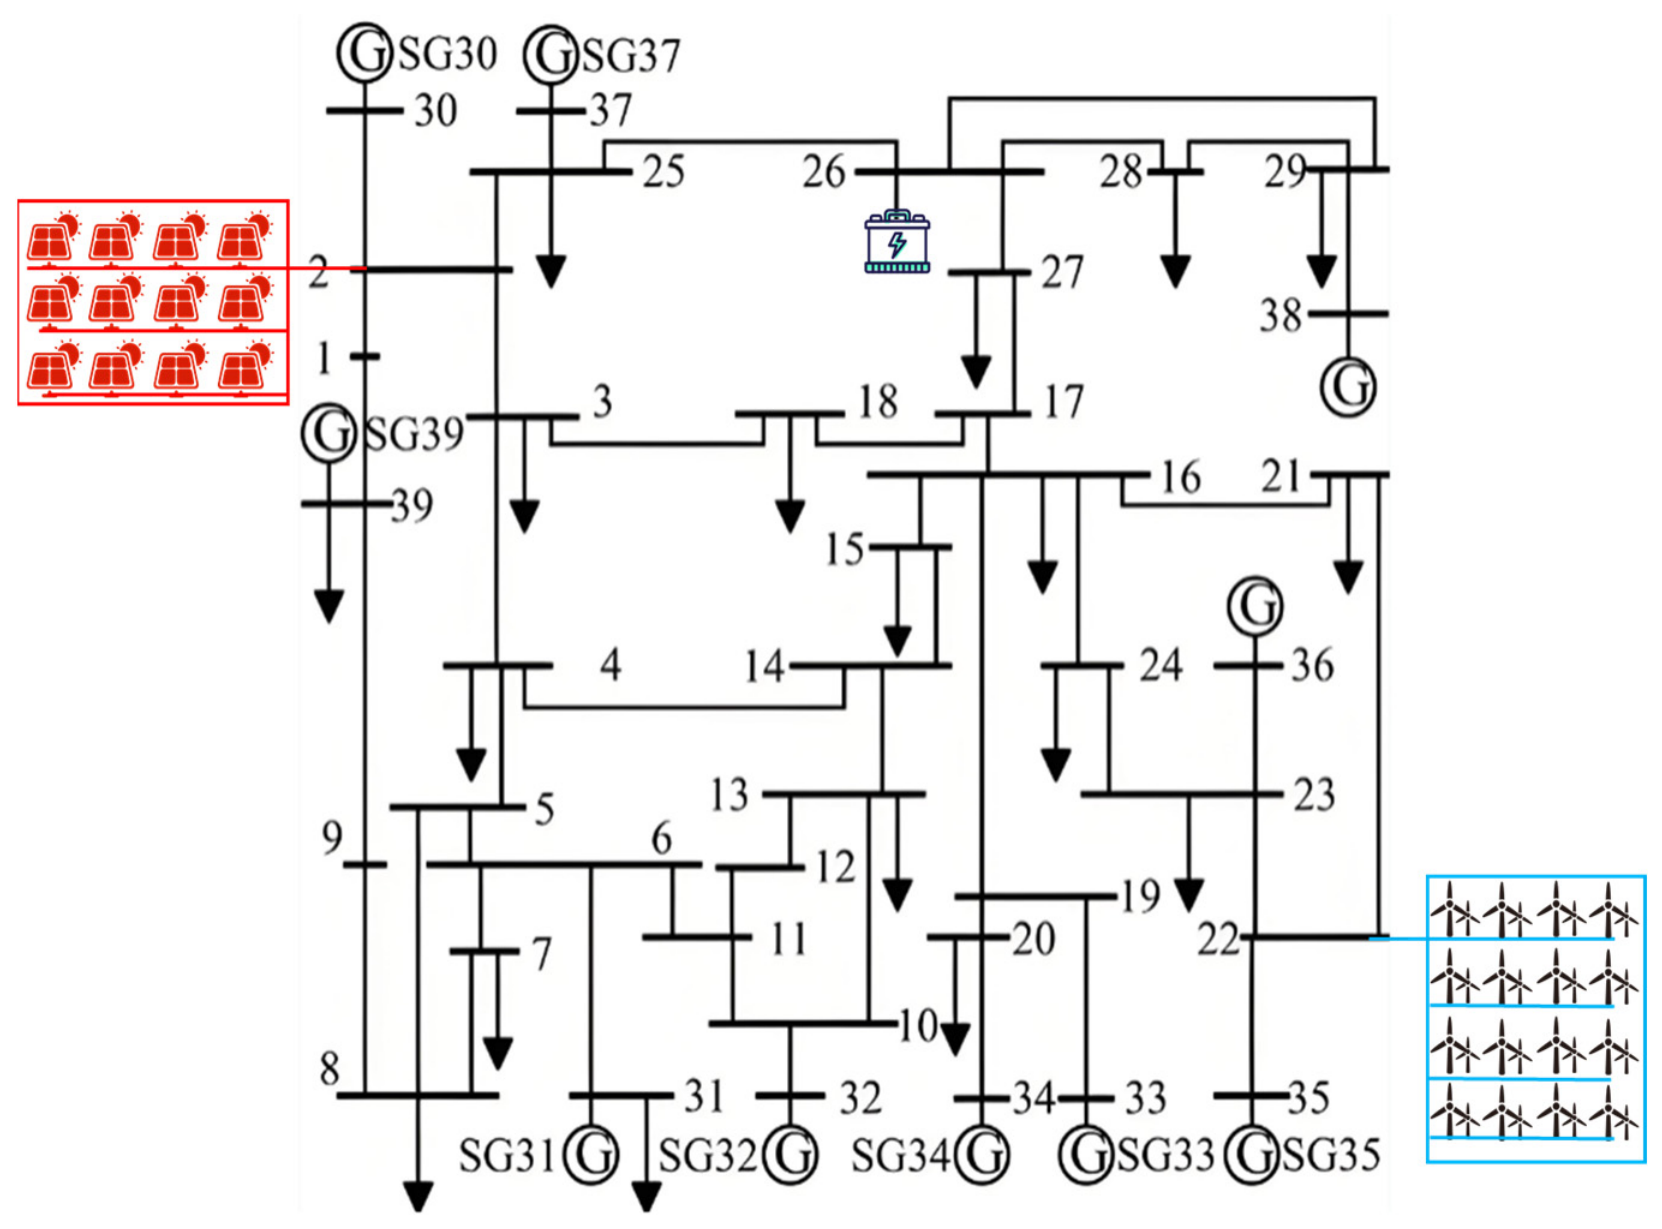
To verify the effectiveness and feasibility of the method proposed in this paper, a modified IEEE 39-bus test system is adopted for validation and analysis, and its topology is shown in Figure 2. The test system consists of 39 buses in total. A photovoltaic power station and a wind farm are connected to the system through Bus 2 and Bus 22, respectively, while energy-storage equipment is integrated into the system via Bus 26. To determine the optimal number of representative scenarios after clustering, this paper adopts a comprehensive judgment criterion combining the Wasserstein distance between the original full scenario set and the reduced scenario set as well as the relative error of the total probability distribution. The number of representative scenarios increases gradually from a small initial value, and the clustering iteration is repeated under each candidate scenario quantity, until the Wasserstein distance falls below 0.06 MW and the probability relative error drops below 3%, which guarantees that the statistical characteristics of the renewable-energy output uncertainties are sufficiently retained and avoids blindly increasing the number of scenarios to cause unnecessary computational burden in the subsequent electricity spot market optimization. These threshold values of 0.06 MW for Wasserstein distance and 3% for probability relative error are preset according to the accuracy requirement of day-ahead market clearing and the acceptable computational cost of the multi-scenario optimization model.
Figure 2.
Topology of the modified IEEE 39-bus test system.
5.2. Effectiveness Analysis of Scenario Generation
To analyze the effectiveness of the generated typical scenarios, several existing, widely used algorithms are selected as comparison models in this paper, including the conventional MCMC and kernel density–Markov without prediction bins. There are 1000 groups of original scenarios, and the default number of reduced typical scenarios is set to 10. The evaluation metrics comprise the aggregate probability error of the scenario set, output MAE, scenario coverage rate, average time-series error RMSE, and computation time. The detailed calculation results are presented in Table 2. To quantitatively evaluate the quality of the generated stochastic scenarios, two core evaluation metrics, namely, the total probability error and scenario coverage rate, are adopted in this paper. The specific definitions and calculation methods of the two metrics are given as follows. The total probability error is used to measure the deviation between the overall probability distribution of the reduced scenario set and that of the original massive scenario set after scenario reduction. Let Ω denote the original complete scenario set with a total number of scenarios Nall; Ns is the total number of representative scenarios. P(w) denotes the occurrence probability of scenario w in the original set, and P(ws) stands for the assigned probability corresponding to representative scenario ws after reduction. The total probability error characterizes the overall deviation degree of the probability distribution over all scenarios, and its calculation formula is expressed as:
Table 2.
Performance indicator comparison of different scenario-generation methods.
A smaller value of this metric indicates that the reduced scenario set retains more of the overall probabilistic information of the original scenarios.
The scenario coverage rate evaluates the capability of the reduced representative scenarios to cover the sample space of the original massive scenarios and reflects the proportion of real operating conditions that are encompassed by representative scenarios. All original time-series samples of renewable-energy output are divided according to power intervals. The ratio of the number of original output samples enveloped by representative scenarios to the total number of samples is counted, and the calculation expression is:
Here, Ncov denotes the number of original output samples falling within the output envelope of representative scenarios. A scenario coverage rate closer to 100% indicates that the representative scenarios can cover more practically possible operating conditions of renewable-energy output and provide a more comprehensive characterization of uncertainties.
Compared with the conventional MCMC method, the proposed method reduces the aggregate probability error by 10.56 percentage points, decreases the MAE by 23.23 MW, lowers the time-series RMSE by 29.17 MW, and improves the scenario coverage rate by 16.96 percentage points. Compared with the kernel density–Markov scheme without prediction bins, the aggregate probability error is reduced by 4.17 percentage points, the MAE is decreased by 8.78 MW, the time-series RMSE is decreased by 11.29 MW, and the coverage rate is increased by 8.73 percentage points. The conventional MCMC adopts a uniform distribution to simulate prediction errors. It fails to distinguish the differences in error distributions between high- and low-output intervals and exhibits the worst capability for characterizing uncertainties. Although the model without prediction bins improves the fitting of error distributions, it does not differentiate output intervals, which leads to biased error fitting under low-output and full-generation conditions of wind–solar resources. By introducing kernel density fitting with partitioned prediction bins while retaining the time-transition characteristics of the Markov chain, the proposed method achieves remarkable improvements in both probability and time-series fitting accuracy. The computation time increases by 1.25 s, which stems from the computational overhead of multi-prediction-bin kernel density estimation. The accuracy improvement comes at a minor computational cost, which is fully acceptable within the time limit for day-ahead market calculations.
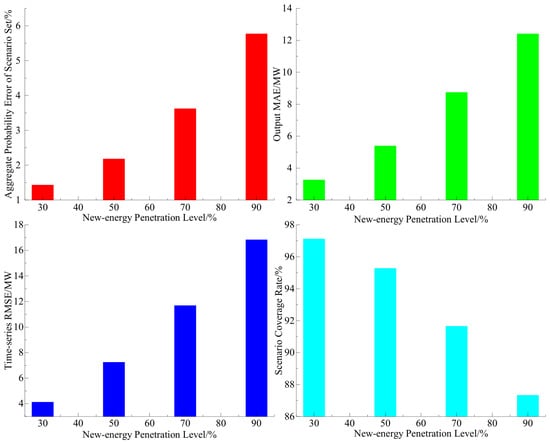
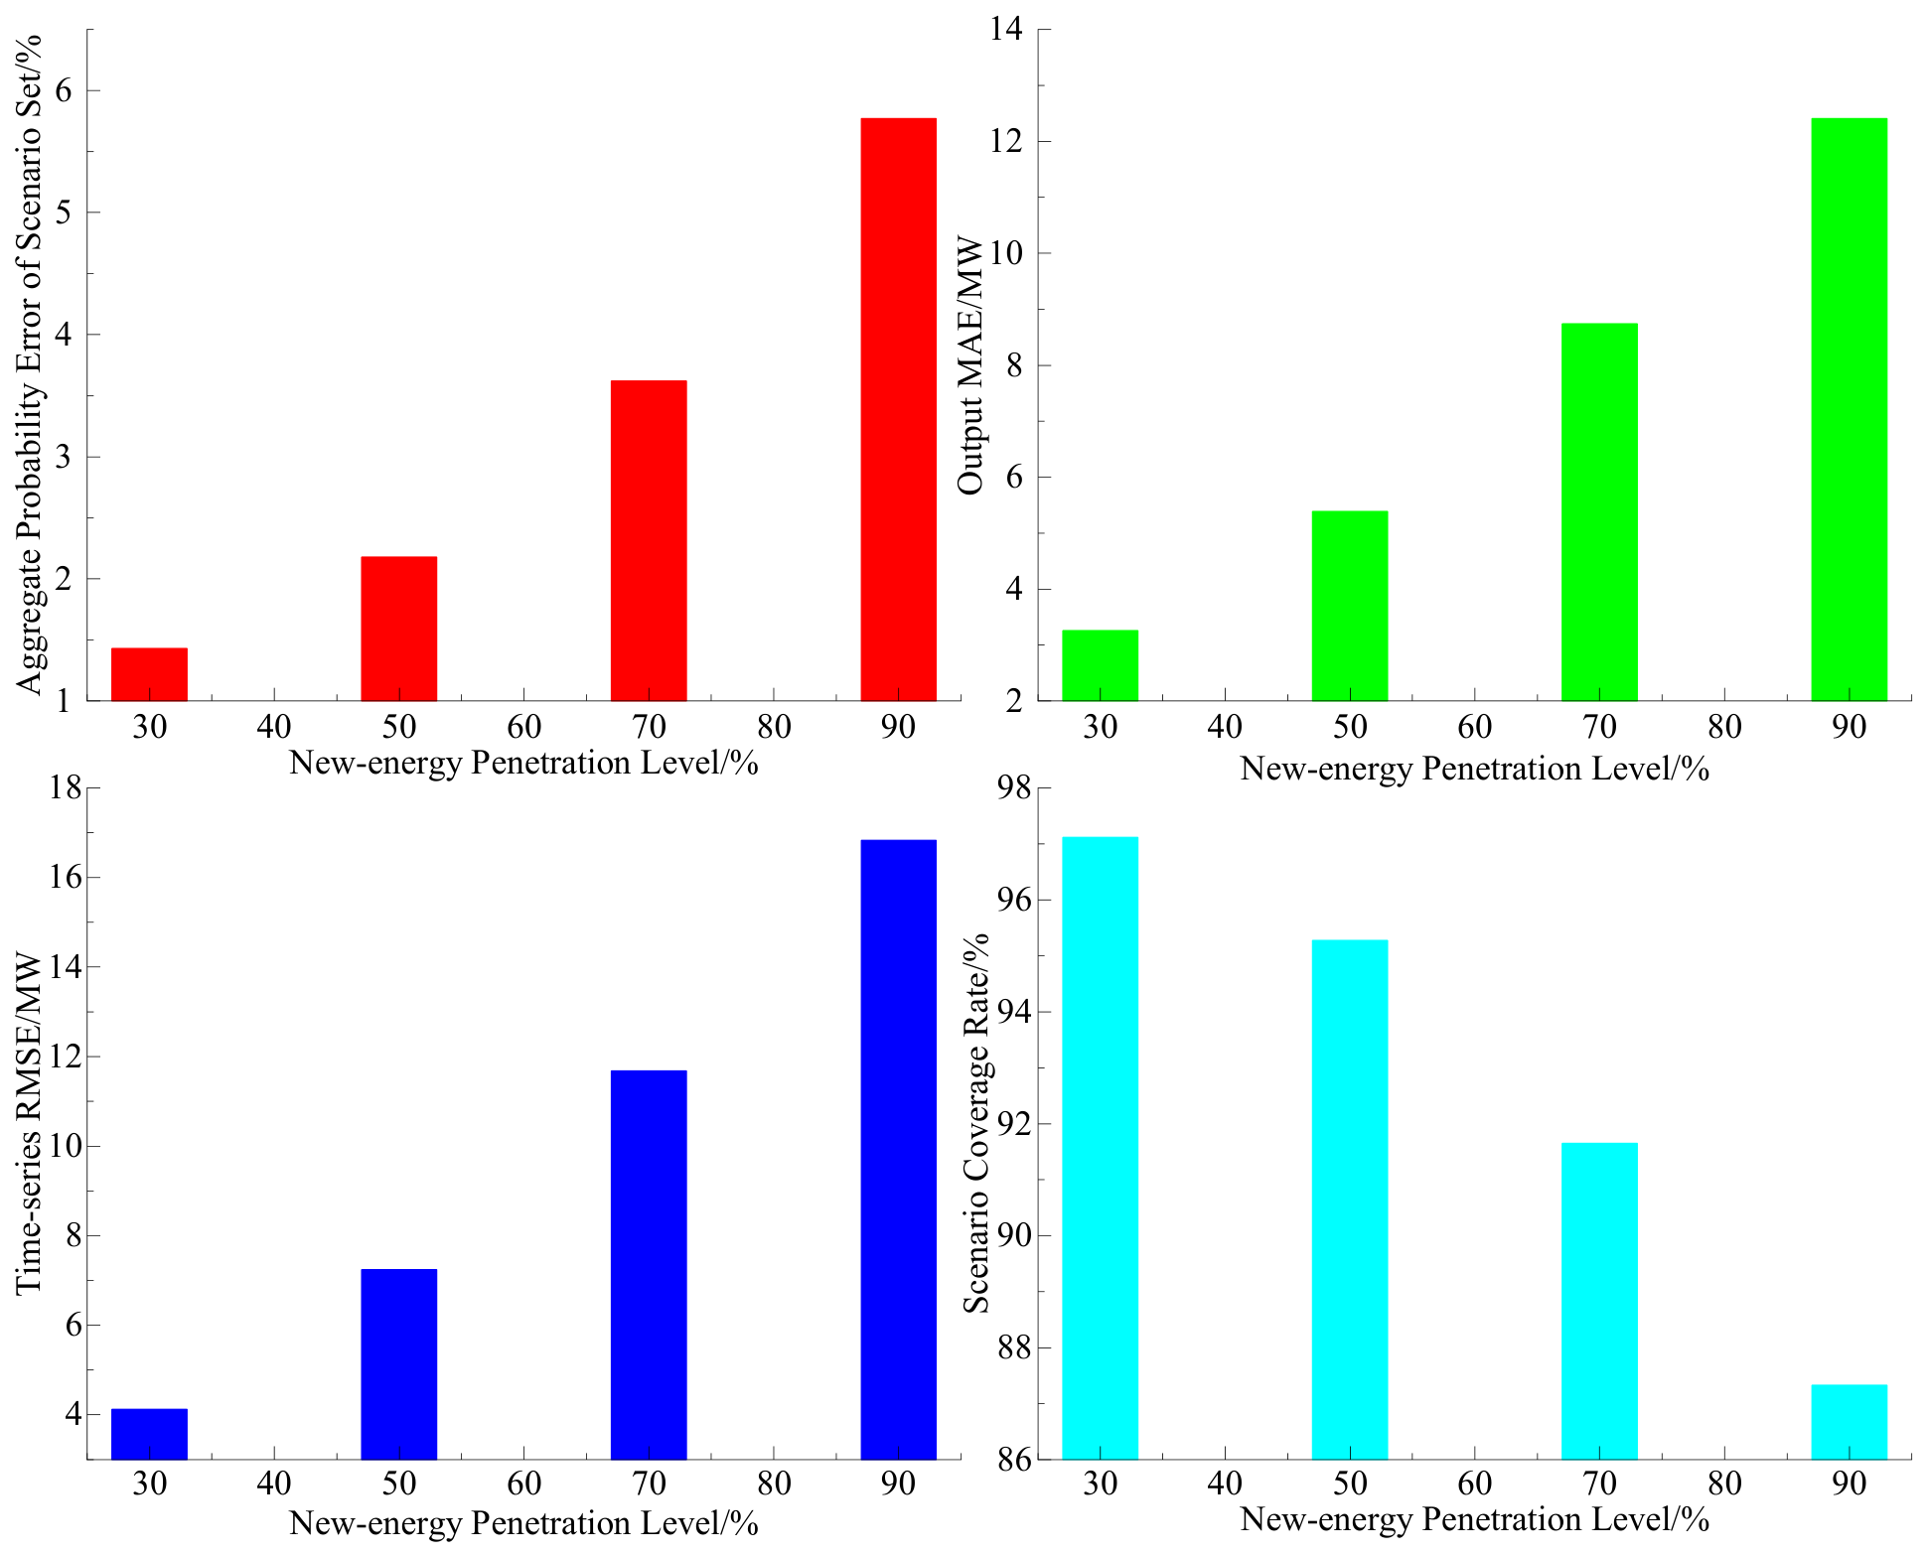
The inherent volatility and uncertainty of new-energy resources also affect the generated typical scenarios. Therefore, this paper analyzes the performance of typical-scenario generation under different renewable-energy penetration levels, as illustrated in Figure 3. The penetration range from 30% to 90% is selected for a sensitivity analysis of renewable-energy penetration, considering the practical development status and future evolution trend of the new-type power system in China; the lower bound of 30% corresponds to the current actual renewable-energy penetration level in many provincial spot market pilot regions, while the upper bound of 90% represents the near-term high-penetration development target of power systems under the goal of building the new-type power system, and this interval covers the transition process from moderate penetration to near-high-proportion renewable-energy supply, which can comprehensively reflect the variation characteristics of scenario-generation performance under different market operation conditions and verify the adaptability of the proposed method for both existing spot market practice and prospective high-renewable-penetration application scenarios.
Figure 3.
Comparison of scenario-generation performance under different renewable-energy penetration levels.
As the penetration level increases from 30% to 90%, the aggregate probability error rises by 4.34 percentage points, the MAE increases by 9.15 MW, the time-series RMSE grows by 12.71 MW, and the scenario coverage rate drops by 9.79 percentage points. A higher renewable-energy penetration rate corresponds to larger absolute fluctuation amplitudes of wind–solar power and a greater statistical dispersion of raw prediction errors, which degrades the scenario fitting performance. Nevertheless, even at a penetration level of 90%, the aggregate probability error is merely 5.77%, which is still substantially lower than the 12.74% obtained by conventional MCMC under 50% penetration. This demonstrates that the proposed method maintains reliable capability for uncertainty characterization under high-renewable-penetration conditions and can supply high-quality input scenario sets for multi-scenario spot market optimization.
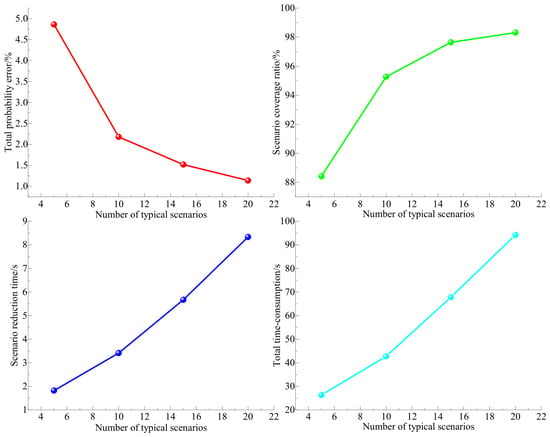
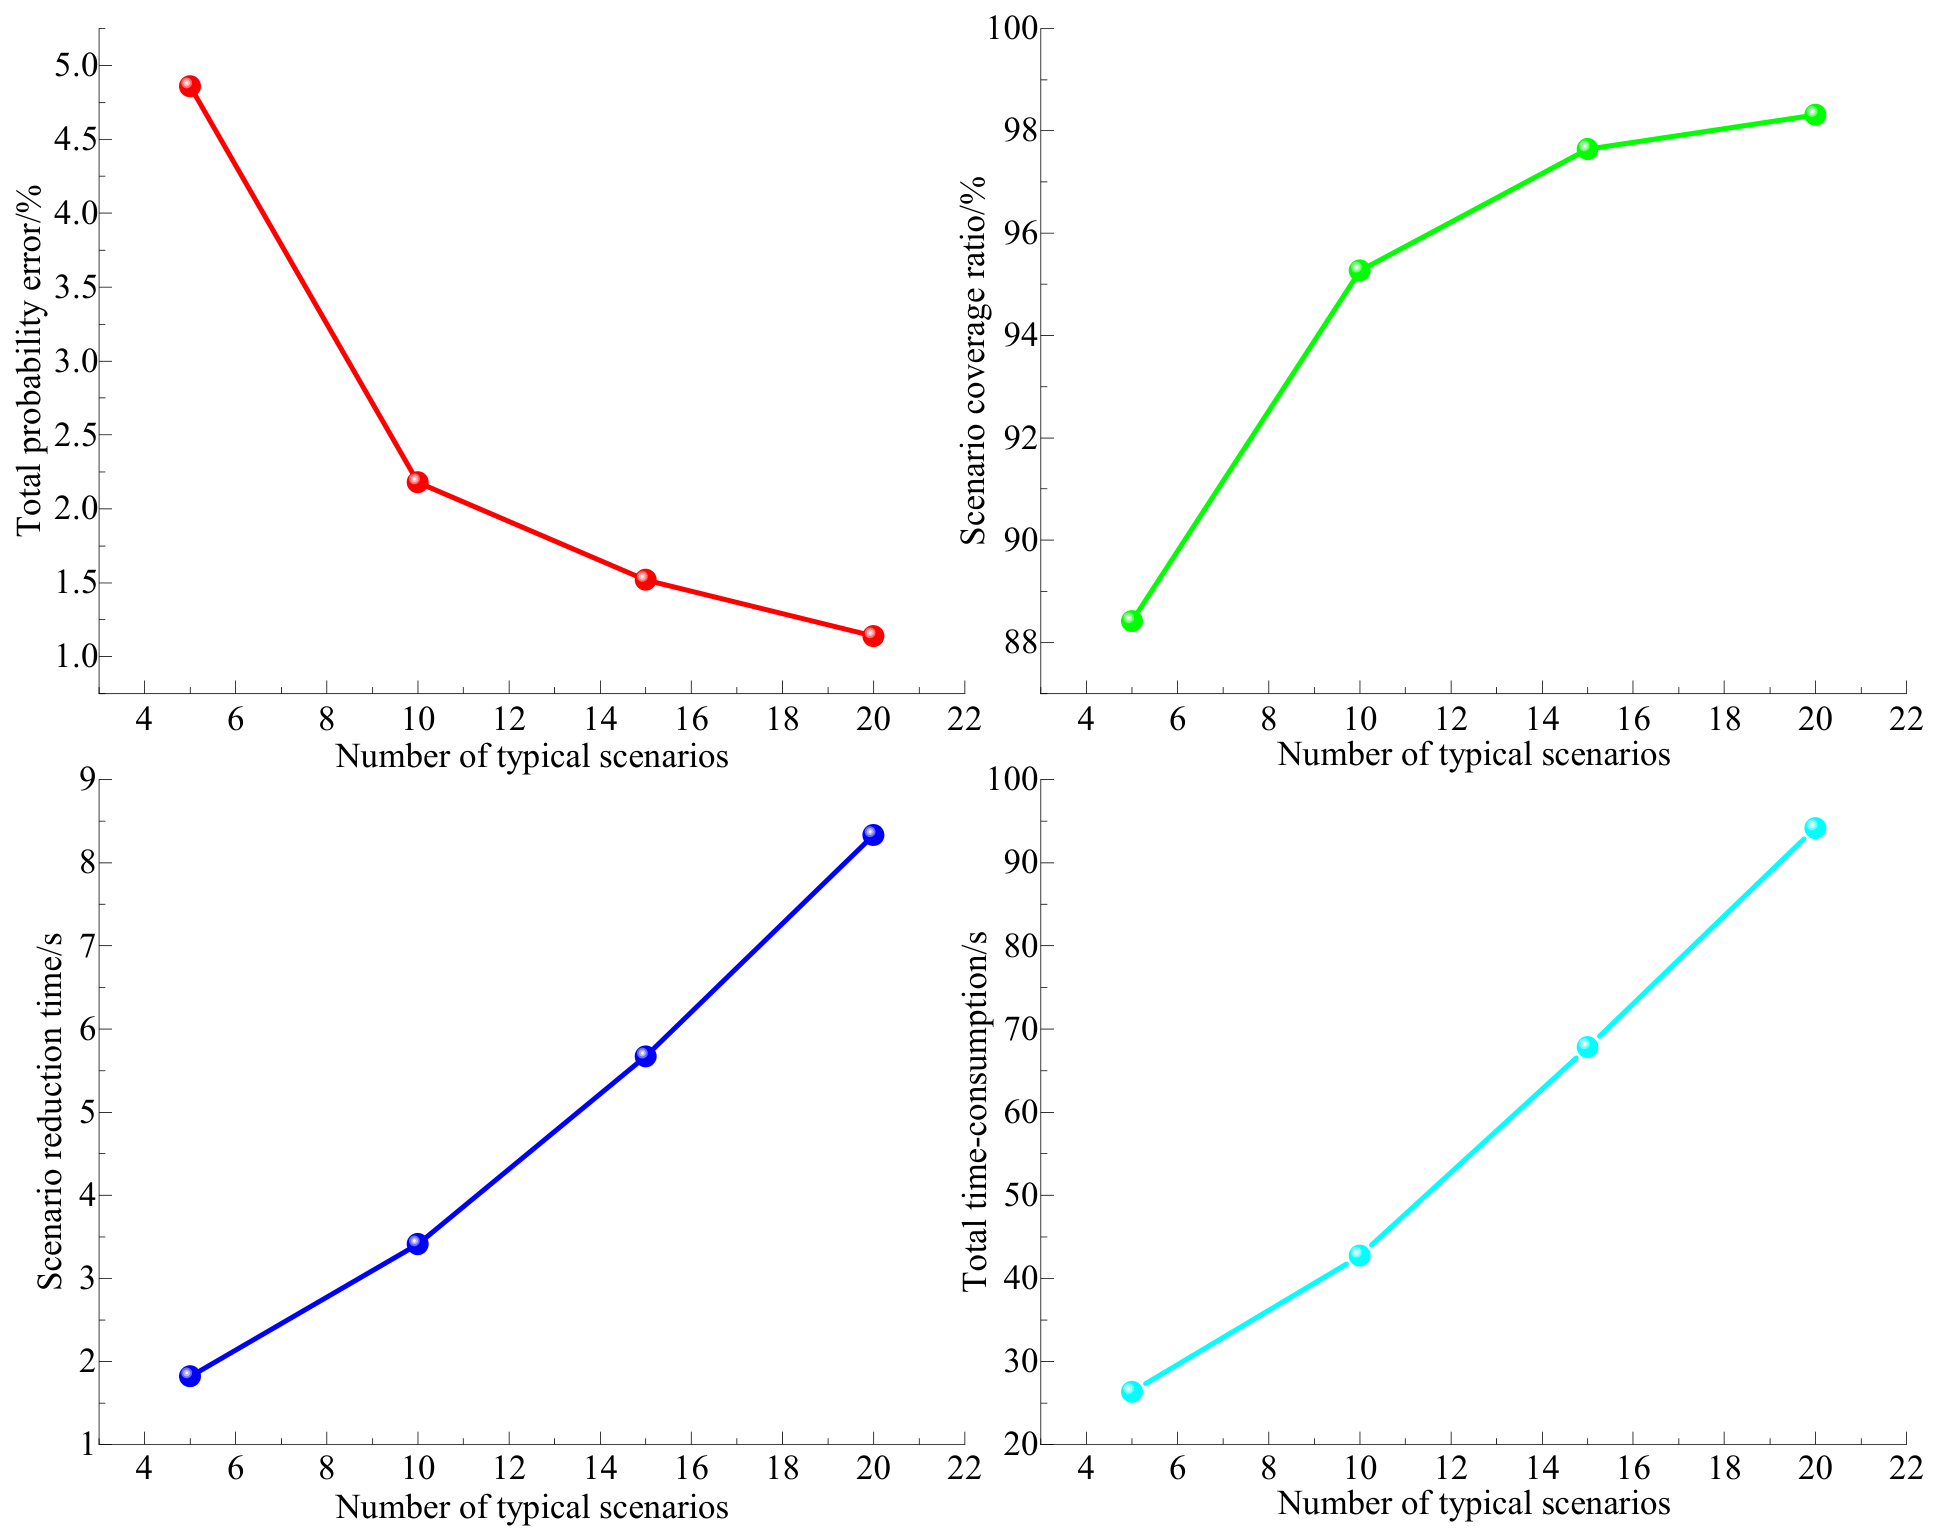
As shown in Figure 4, as the number of typical scenarios increases from 5 to 20, the total probability error decreases by 3.72 percentage points, the MAE drops by 6.77 MW, and the scenario coverage ratio rises by 9.89 percentage points. Nevertheless, the scenario reduction time increases by 6.51 s, and the total computation time for back-end multi-scenario optimization rises by 67.81 s. When the number of typical scenarios is set to 10, the scenario coverage ratio reaches 95.27%. Further increasing the scenario count to 15 and 20 yields marginal improvements in coverage of merely 2.37 and 3.04 percentage points, respectively, while the computational overhead nearly doubles. Balancing the accuracy of uncertainty characterization and the computational efficiency of the day-ahead market, this paper adopts 10 typical scenarios as the input for case studies to achieve a trade-off between uncertainty description accuracy and solving burden.
Figure 4.
Sensitivity analysis of scenario reduction quantity.
5.3. Effectiveness Analysis of Trading Mechanism
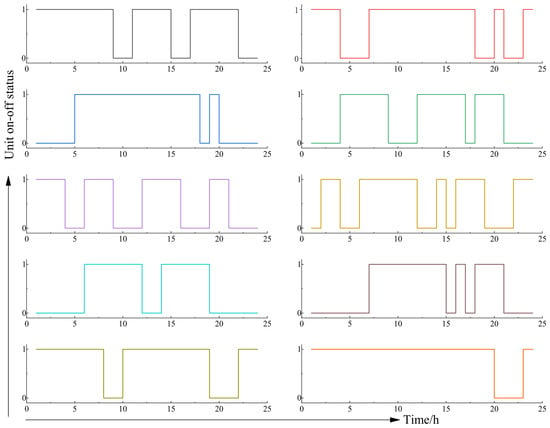
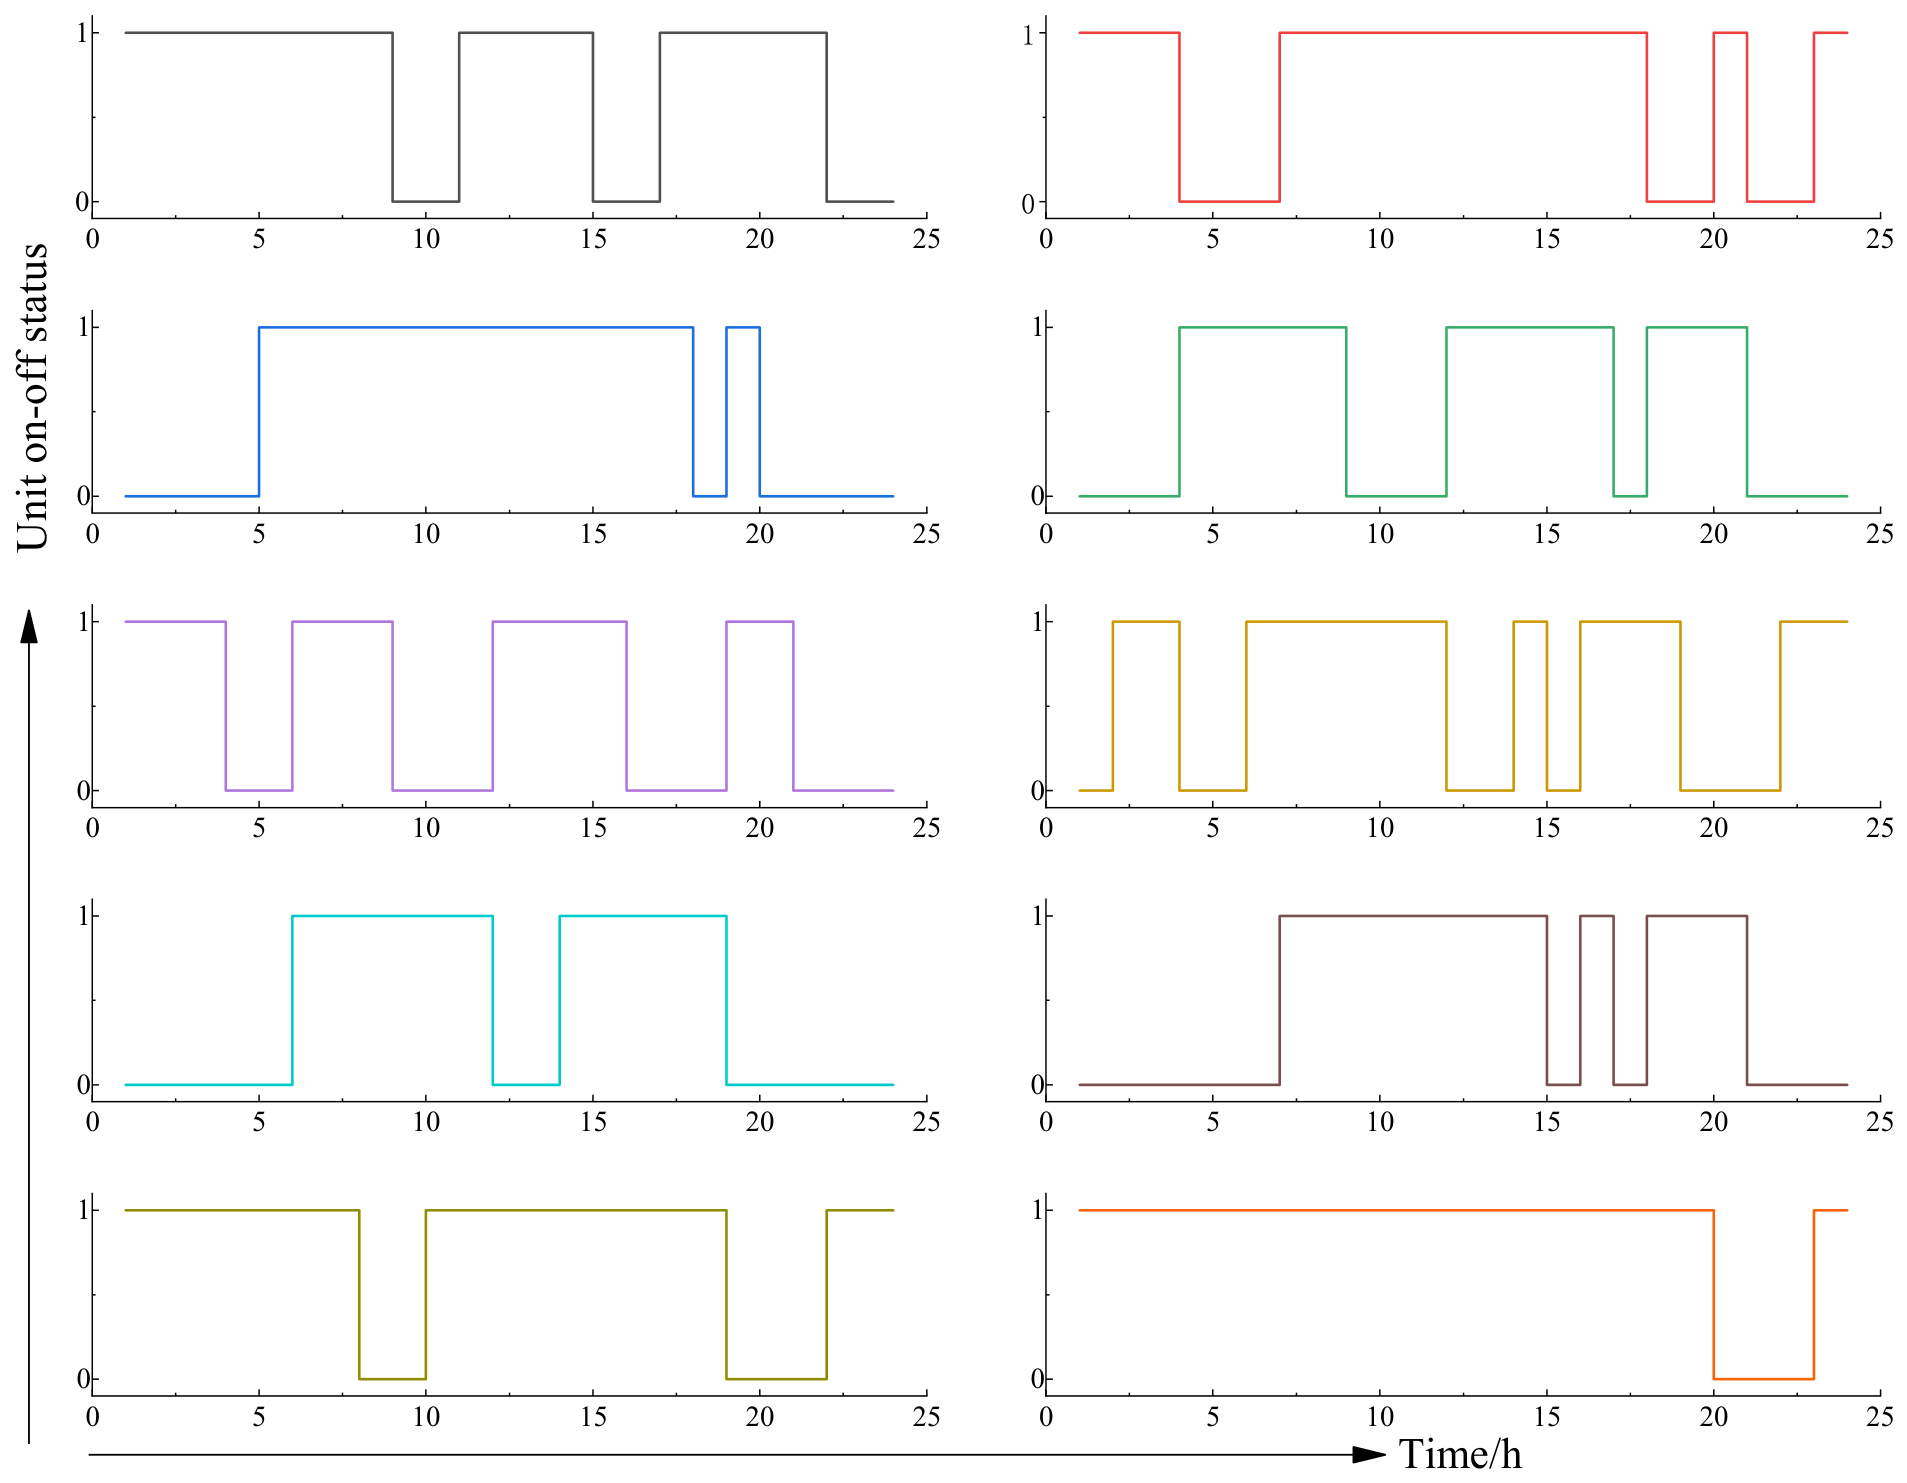
Under the scenario of new-energy fluctuations, the on–off status of each unit is shown in Figure 5. As shown in Figure 5, the load level is low during hours 1–4 at night, where the system load accounts for only 58.2% of the peak load. With abundant wind power generation, small-capacity units are shut down to avoid increased coal consumption and start–stop costs caused by unit operation under low-load conditions. From hours 5 to 7, units are started sequentially as the load gradually rises. The load peaks during hours 8–19, and the total available thermal power output increases by 486 MW to balance the load and smooth the fluctuations in wind and photovoltaic power. After hour 20, the load decreases and units are shut down one after another. Throughout the whole scheduling horizon, the start-up and shut-down actions of all units satisfy the minimum up- and down-time constraints, and no frequent unit cycling occurs. The total start–stop cost of thermal power units over the entire scheduling period is reduced by 18 720 $.
Figure 5.
The on–off status of each unit.
This paper further compares the decision-making performance of different scheduling models, as shown in Table 3. The comprehensive revenue in the table is obtained by calculating the optimal objective function value of the optimization model.
Table 3.
Comparison of quantitative indicators for different models.
Compared with the deterministic scheduling model, the proposed model increases the comprehensive revenue of renewable energy by 44.84 × 10³ $ (an increase of 31.43%), reduces the imbalance penalty cost by 33.94 × 10³ $, and cuts the wind–solar curtailment rate by 6.95 percentage points. Meanwhile, the total system operating cost only rises by 14.92 × 10³ $, and the average spot clearing price increases by 8.84 $/MWh. The deterministic model adopts only forecasted power output, without accounting for stochastic fluctuations. Deviations under real-world scenarios lead to heavy penalty costs and substantial curtailment of wind and solar power.
In comparison with the traditional multi-scenario robust scheduling model, the renewable-energy revenue of the proposed model is improved by 19.21 × 10³ $ (an increment of 11.41%), the total system operating cost decreases by 33.31 × 10³ $, the imbalance penalty cost is reduced by 11.31 × 10³ $, the wind–solar curtailment rate drops by 2.69 percentage points, and the average spot clearing price goes down by 17.83 $/MWh. To hedge against extreme uncertainties, the traditional robust model reserves large amounts of thermal spinning reserve, which increases operating costs and market clearing prices. Relying on a high-accuracy stochastic-scenario set, the proposed model avoids excessively conservative reserve capacity and achieves a favorable trade-off among renewable-energy revenue, system operating cost and the quality of market price signals.
In this paper, an improved ant colony algorithm is adopted to rapidly search for the optimal solution. To demonstrate the performance improvement brought by the algorithm modification, Table 4 presents the comparison results of convergence and optimality for different algorithms.
Table 4.
Comparison results of convergence and optimality for different algorithms.
Here, the solution success rate is defined as the proportion of runs that can find high-quality global feasible solutions among 20 independent repeated computations. Compared with the traditional ant colony algorithm, the proposed improved algorithm reduces the number of convergence iterations by 72, cuts the computation time by 35.89 s, increases the comprehensive revenue of renewable energy by 1.607 × 10⁴ $, and raises the solution success rate by 24 percentage points. The traditional ACO adopts a fixed pheromone evaporation coefficient. In the later iteration stage, pheromones concentrate on local paths, which easily leads to premature convergence. Particle swarm optimization achieves a relatively fast convergence speed, yet it tends to lose population diversity and still suffers from the local optimum problem. In this work, the pheromone evaporation factor is dynamically adjusted; differentiated pheromone updating is performed for the best and worst paths, and upper–lower bounds are imposed on pheromone values to expand the global search space. As a result, the number of iterations is reduced by 58.06%, the computation time is decreased by 45.64%, and the solution stability is significantly improved.
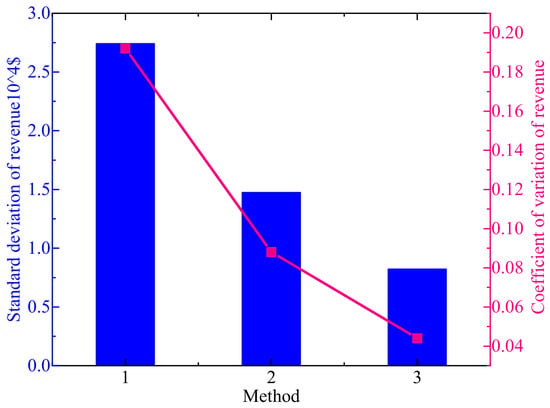
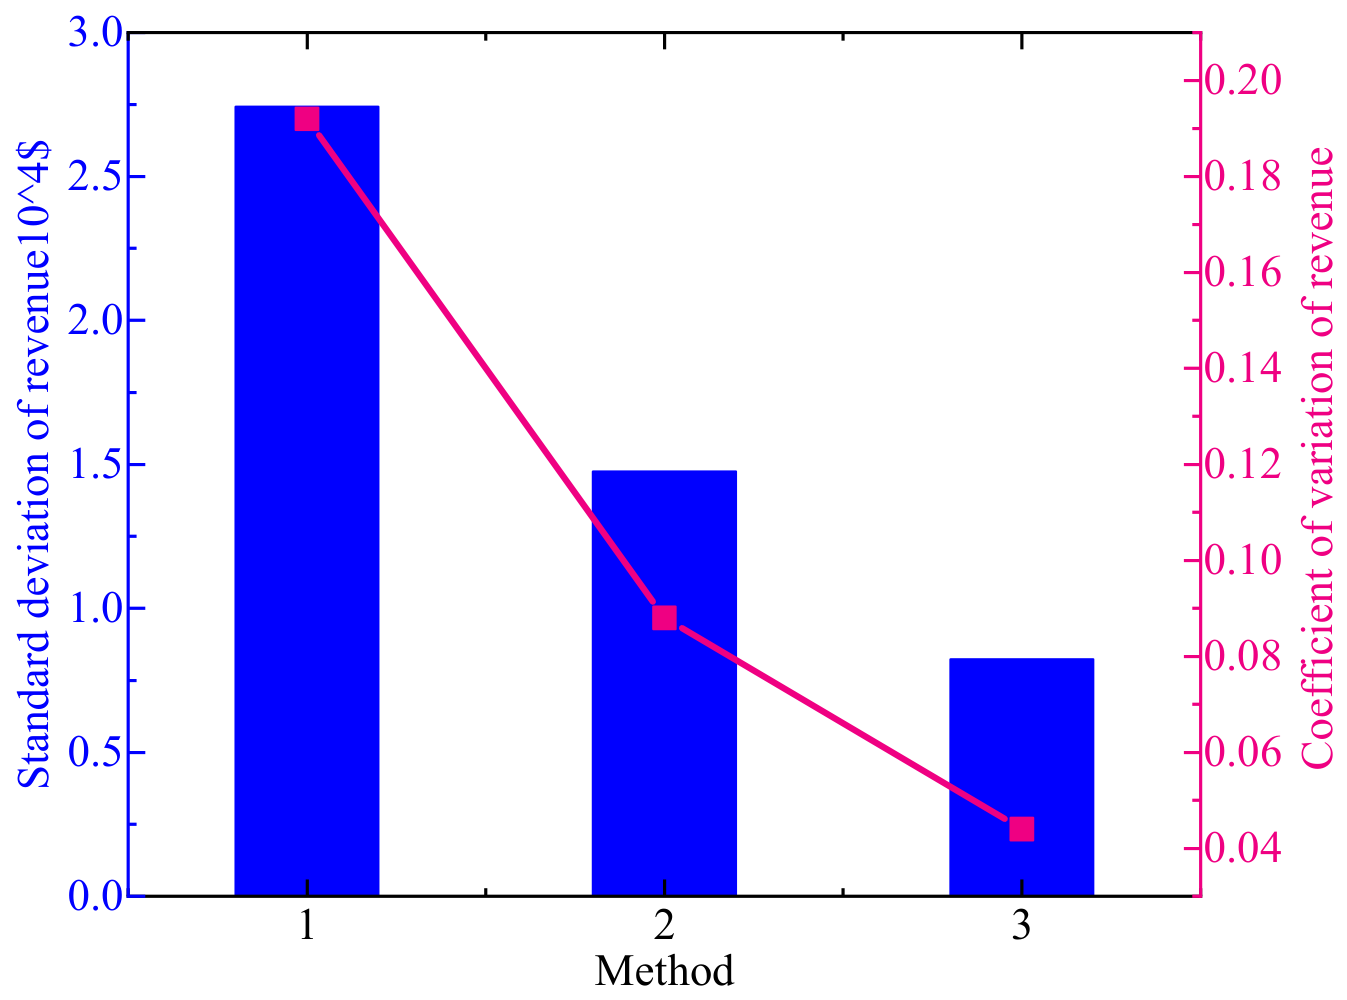
The core research motivation of this paper is to improve the revenue stability of high-penetration renewable energy participating in the electricity spot market. Two risk quantification indicators, namely, the standard deviation of revenue and the coefficient of variation of revenue, are supplemented herein. The standard deviation reflects the absolute fluctuation range of revenue, while the coefficient of variation (standard deviation/average comprehensive revenue) eliminates the impact of revenue magnitude and characterizes the relative revenue risk; a larger value indicates higher revenue volatility. We compare the deterministic scheduling model (Method 1), the multi-scenario robust scheduling model (Method 2), and the proposed method (Method 3). The detailed results are shown in Figure 6 below.
Figure 6.
Evaluation of risk quantification indicators for different methods.
The deterministic scheduling model makes decisions solely based on the forecasted renewable-energy output, without accounting for stochastic fluctuations in power generation. Substantial power imbalance penalties are incurred when the actual output deviates from the forecasted value, which leads to a significant divergence in revenue across stochastic scenarios. Accordingly, this model yields the highest standard deviation and coefficient of variation of revenue among the three methods and exhibits the poorest revenue stability. The traditional multi-scenario robust scheduling model reserves ample thermal spinning reserve to hedge against extreme uncertainty. It suppresses risk at the cost of partial market trading space. Although revenue fluctuations are markedly reduced compared with the deterministic model, the conservative reserve increases system operating costs and restricts further revenue growth. The proposed method performs optimization based on a high-precision stochastic-scenario set and fully characterizes the probabilistic statistical features of renewable-energy output. It avoids overallocating conservative reserves while simultaneously considering revenue performance under diverse stochastic scenarios during optimization. Consequently, the proposed method achieves not only the highest average comprehensive revenue but also a remarkably lower standard deviation and coefficient of variation of revenue than the other two comparative models. It effectively mitigates the revenue volatility of the renewable-energy base under market conditions and realizes the coordinated optimization of revenue magnitude and revenue stability, which aligns with the research motivation of this work to improve revenue stability for renewables participating in the electricity spot market.
To facilitate the comparison of performance among different combinations of modeling and solution methodologies, two comparative algorithms are configured herein. The details of each comparative algorithm are given as follows:
Comparative Method 1: Typical scenarios are generated by the Markov Monte Carlo method without distinguishing the characteristics of forecast error intervals. The problem is solved using the traditional K-means algorithm and ant colony algorithm.
Comparative Method 2: Kernel density estimation and Markov chain are adopted to construct scenario probabilities without forecast binning. The problem is solved by the traditional K-means algorithm and PSO algorithm.
The performance of different methodology combinations is shown in Table 5. The comparison metrics include time-series RMSE, scenario coverage rate, comprehensive revenue of renewable base, wind/PV curtailment rate, and convergence iterations.
Table 5.
Performance of Different Methodology Combinations.
It can be observed from the above table that compared with existing studies merely adopting kernel density estimation, Markov modeling, conventional scenario reduction and ordinary meta-heuristic algorithms, this paper makes two core original contributions to the methodology. First, in the scenario-generation stage, most existing kernel density–Markov methods only capture the temporal autocorrelation of forecast errors and ignore the interval characteristics that the statistical distribution of forecast errors varies with the magnitude of renewable-energy forecast output. This paper introduces forecast binning to perform separate kernel density fitting for forecast errors under different power intervals. Meanwhile, the K-means scenario reduction algorithm is improved. The Wasserstein distance is used instead of the Euclidean distance to measure the probabilistic discrepancy between scenarios, combined with the maximum-distance criterion for centroid initialization and a scenario weight-updating strategy. This preserves the probabilistic statistical features of the original scenario set to the greatest extent. Consequently, the time-series RMSE is reduced by 11.29 MW compared with the unbinned kernel density–Markov method, and the scenario coverage rate increases by 8.73%. Second, from the perspective of meta-heuristic solutions, traditional ant colony algorithms adopt fixed pheromone evaporation coefficients. Pheromones tend to accumulate excessively in the later iteration stage, which makes the algorithm prone to local optima. This work designs a dynamic adjustment strategy for the pheromone evaporation factor, implements differentiated pheromone updates for the best and worst paths, and sets upper and lower bounds on pheromones to suppress premature convergence. The number of convergence iterations drops from 96–124 to 52. Benefiting from the high-precision stochastic-scenario set, the multi-scenario optimization can characterize the uncertainty of renewable-energy output more accurately and avoid over-reserving conservative spinning reserves in robust models. Ultimately, the comprehensive revenue of the renewable-energy base is further improved, and the wind–PV curtailment rate is reduced. The coordinated improvement of uncertainty characterization accuracy and solution performance is achieved with a slight increase in computational cost.
6. Conclusions
To address the poor revenue stability and high market-participation risk of renewable-energy bases caused by the uncertainty of renewable-energy output, this paper constructs an optimization model for electricity spot market trading considering stochastic renewable-energy scenarios in line with the reform trend of China’s electricity spot market. A high-precision scenario-generation method and an improved ant colony optimization algorithm are correspondingly developed. Comparative simulations among multiple models and algorithms are carried out to verify the effectiveness and superiority of the proposed strategy. The main conclusions are drawn as follows.
First, the proposed stochastic scenario-generation method for renewable energy fully takes into account both the interval and temporal characteristics of renewable-energy power prediction errors. Kernel density estimation, Markov chain modeling and an improved K-means scenario reduction algorithm are adopted. Second, compared with the traditional deterministic scheduling model and conservative robust scheduling model, the proposed multi-scenario complementary spot trading model for wind–photovoltaic–thermal power can significantly increase the comprehensive revenue of renewable-energy bases and effectively reduce the system imbalance penalty cost as well as the wind–solar curtailment rate. Meanwhile, the model avoids reserving excessive thermal spinning reserve. With a slight increase in the basic system operating cost, the spot market clearing price is optimized. The proposed approach balances renewable-energy accommodation benefits, system operation economy and the rationality of market price signals and adapts to the operation requirements of high-penetration renewable energy participating in the spot market. Third, the improved ant colony algorithm dynamically adjusts the pheromone evaporation factor, implements differentiated pheromone updates for the best and worst paths, and imposes bounds on pheromone values. It effectively overcomes the drawbacks of premature convergence in the traditional ant colony algorithm and the tendency to fall into local optima for particle swarm optimization.
It should be noted that this paper only considers the multi-scenario coordinated operation of wind power, photovoltaic, thermal power and energy storage and does not take into account the impacts of demand-side flexible loads and strategic bidding behaviors of market participants on the trading outcomes of the spot market. Meanwhile, the simulation verification is only carried out on a modified IEEE-39 standard test system, and engineering validation using real provincial electricity market operating data has not been performed. In future work, flexible load resources will be introduced to construct a multi-agent joint trading optimization model. The engineering applicability of the model will be further verified using real power grid and market operation data. In addition, the trading mechanism for renewable energy participating in the spot market under the coupling of carbon trading and the ancillary service market will be explored.
Author Contributions
Conceptualization, W.C., W.X., W.K., Y.G. and X.X.; methodology, W.C., W.X., W.K., Y.G. and X.X.; validation, W.C., W.X., W.K., Y.G. and X.X.; software, W.C., W.X., W.K., Y.G. and X.X.; writing—original draft preparation, W.C., W.X., W.K., Y.G. and X.X. All authors have read and agreed to the published version of the manuscript.
Funding
This work was supported by the Research Project on Key Mechanisms for the Full Participation of Renewable Energy in Energy-Only Market Transactions (No. 076100KM26050010).
Data Availability Statement
The original contributions presented in this study are included in the article. Further inquiries can be directed to the corresponding author.
Conflicts of Interest
Authors Wenchao Chen, Wanying Xu, Wenhui Kang, and Yining Gao were employed by the company Hainan Power Exchange Center Co., Ltd. Author Xiaofeng Xu was employed by the company Beijing Kedong Electrical Power Control System Co., Ltd. The remaining authors declare that the research was conducted in the absence of any commercial or financial relationships that could be construed as a potential conflict of interest.
Nomenclature Table
| Variables | Meaning |
| f(e) | The probability density function of random variable E |
| n | The sample size |
| h | The bandwidth |
| K((e − ek)/h) | The kernel function |
| ek | The k-th error sample |
| u | The input variable of the kernel function |
| σ | The standard deviation of sample variables |
| P | The state-transition matrix |
| Pcum | The cumulative state-transition matrix |
| pab | The transition probability of forecasting errors from state a to state b |
| M | The number of states |
| Rspot | The trading revenue in the spot market |
| Csta, Cope and Cpen | The start-up/shut-down cost, operation cost and penalty cost of the renewable-energy base |
| and | The start-up and shut-down cost coefficients of thermal power units |
| and | Boolean variables characterizing the operating status of thermal power units |
| The spot market electricity price | |
| The declared power output for sale of the renewable-energy base | |
| ai, bi, ci | Fuel cost coefficients of thermal power units |
| λpen+ and λpen− | Penalty factors for positive and negative power imbalance |
| and | The over-generation power and power shortage |
| Ωs | The set of all stochastic scenarios |
| s ∈ Ωs | A specific scenario |
| πs | The occurrence probability of scenario |
| The upper capacity limit of the transmission tie line | |
| and | The rated capacities of wind power and photovoltaic power |
| and | The upward and downward ramping rates of thermal power units |
| Δt | The operation time scale |
| and | The minimum on time and minimum shut-down time of the unit |
| The initial on–off duration of the unit | |
| m and Hi | The mandatory on time and mandatory shut-down time at the initial instant for the unit |
| The initial operating state of the unit | |
| Pi and Qi | The active and reactive power injection at bus i |
| Ui and Uj | The voltage magnitudes of bus i and bus j |
| δi and δj | The voltage phase angles of bus i and bus j |
| δi − δj | The phase-angle difference between these two buses |
| Gij | The conductance |
| Bij | The susceptance |
| a | The information heuristic factor |
| β | The expectation heuristic factor |
| dij | The feasible solution |
| The pheromone intensity deposited on path (i, j) by the k-th ant during the time interval (t, t + 1) | |
| ρ | The pheromone evaporation factor |
| (1 − ρ) | The residual pheromone factor |
| tnew | The current time |
| told | The time of the previous stage |
| τ(lk,tnew) | The pheromone quantity on path lk at the current time |
| ρ(lk,tnew) | The pheromone evaporation coefficient of path lk at the current time |
| ξ | The pheromone deposited by a single ant within a unit time interval |
| φk | The influence degree of the k-th ant-corresponding solution on the pheromone update of path (i, j) |
| Q | The pheromone intensity on the path |
| k | The proportionality coefficient |
References
- Wu, J.; Zhu, H.; Wang, Y.; Zhou, M.; Chen, C.; Wu, Z. Bi-Level Electricity Market Clearing Model Considering Cross-Regional Green Energy Transactions. In Proceedings of the 2024 6th International Conference on Power and Energy Technology (ICPET), Beijing, China, 12–15 July 2024; pp. 938–943. [Google Scholar] [CrossRef] [Scilit]
- Chen, Y.; Qin, W.; Qi, J.; Zhang, W.; Liu, B. Research on Medium-and Long-Term Operation Strategy in the Province Considering the Uncertainty of Renewable Energy. In Proceedings of the 2023 IEEE 7th Conference on Energy Internet and Energy System Integration (EI2), Hangzhou, China, 15–18 December 2023; pp. 3223–3228. [Google Scholar] [CrossRef] [Scilit]
- Li, B.; Fan, P.; Li, R.; Lin, K. Data-driven Pricing Strategy of New Energy Stations in The Spot Market Environment. In Proceedings of the 2024 4th International Conference on Smart Grid and Energy Internet (SGEI), Shenyang, China, 13–15 December 2024; pp. 738–742. [Google Scholar] [CrossRef] [Scilit]
- Kumar, P.; Kumar, Y.; Ahirwar, K.K.; Yadav, A.K.; Kumar, K.; Suman, S.K.; Shrivastava, T. Dual-Sided Involvement of Energy Optimization and Strategic Bidding in Wind-PV System to Maximize Benefits for Customers and Power Providers. IEEE Access 2024, 12, 15884–15901. [Google Scholar] [CrossRef] [Scilit]
- Shang, J.; Wang, K.; Lai, X.; Yang, J.; Jiang, X.; Gao, J.; Singh, S.N. Spot Electricity Market Design Considering Carbon Emissions for a Power System With a High Penetration of Renewable Energy Generation. IEEE Trans. Netw. Sci. Eng. 2024, 11, 5477–5486. [Google Scholar] [CrossRef] [Scilit]
- Chandra, R.; Saha, J.; Manohar, S.S.; Panda, S.K.; Spanos, C.J. Analysis and Testbed Demonstration of Electricity Product Differentiation in a Bilateral Negotiation Based Peer-to-Peer Transactive Energy Market. IEEE Trans. Ind. Appl. 2026, 62, 5055–5068. [Google Scholar] [CrossRef] [Scilit]
- Zhang, Y.; Wen, H.; Bian, Y.; Shi, Y. Improving Sequential Market Coordination via Value-Oriented Renewable Energy Forecasting. IEEE Trans. Energy Mark. Policy Regul. 2025, 3, 408–423. [Google Scholar] [CrossRef] [Scilit]
- Chen, H.; Huang, J.; Lin, Z.; Huang, F.; Li, M. Stochastic Economic Dispatch Based Optimal Market Clearing Strategy Considering Flexible Ramping Products Under Wind Power Uncertainties. CSEE J. Power Energy Syst. 2024, 10, 1525–1535. [Google Scholar] [CrossRef] [Scilit]
- Xie, R.; Chen, Y. Real-Time Bidding Strategy of Energy Storage in an Energy Market With Carbon Emission Allocation Based on Aumann-Shapley Prices. IEEE Trans. Energy Mark. Policy Regul. 2024, 2, 350–367. [Google Scholar] [CrossRef] [Scilit]
- Zahraoui, Y.; Korõtko, T.; Rosin, A.; Zidane, T.E.K.; Mekhilef, S. A Real-Time Simulation for P2P Energy Trading Using a Distributed Algorithm. IEEE Access 2024, 12, 44135–44146. [Google Scholar] [CrossRef] [Scilit]
- Wang, S.; Chen, H.; Gong, C.; Song, C.; Wang, J.; Wang, T.; Shang, Y.; Zhang, C.; Wang, Z.; Yang, N. A Bi-Level Game-Based Optimal Scheduling Strategy for Shared Energy Storage and Integrated Energy MG Clusters. IEEE Trans. Ind. Appl. 2026, 62, 1886–1899. [Google Scholar] [CrossRef] [Scilit]
- Awadalla, M.; Bouffard, F. Tight and Compact Data-Driven Linear Relaxations for Constraint Screening in Unit Commitment. IEEE Trans. Energy Mark. Policy Regul. 2024, 2, 63–78. [Google Scholar] [CrossRef] [Scilit]
- Bienstock, D.; Dvorkin, Y.; Guo, C.; Mieth, R.; Wang, J. Risk-Aware Security-Constrained Unit Commitment: Taming the Curse of Real-Time Volatility and Consumer Exposure. IEEE Trans. Energy Mark. Policy Regul. 2024, 2, 536–551. [Google Scholar] [CrossRef] [Scilit]
- Talari, S.; Birk, S.; Ketter, W.; Schneiders, T. Sequential Clearing of Network-Aware Local Energy and Flexibility Markets in Community-Based Grids. IEEE Trans. Smart Grid 2024, 15, 405–417. [Google Scholar] [CrossRef] [Scilit]
- Mansouri, S.A.; Nematbakhsh, E.; Ramos, A.; Tostado-Véliz, M.; Aguado, J.A.; Aghaei, J. A Robust ADMM-Enabled Optimization Framework for Decentralized Coordination of Microgrids. IEEE Trans. Ind. Inform. 2025, 21, 1479–1488. [Google Scholar] [CrossRef] [Scilit]
- Xiong, Z.; Wang, L.; Jiang, C.; Zhou, S.; Li, Y. Bi-Level Low-Carbon Optimal Operation Model of Multi-Energy Aggregator in Energy and Flexibility Market. IEEE Trans. Ind. Appl. 2025, 61, 4755–4767. [Google Scholar] [CrossRef] [Scilit]
- Zheng, J.; Liang, Z.-T.; Li, Y.; Li, Z.; Wu, Q.-H. Multi-Agent Reinforcement Learning With Privacy Preservation for Continuous Double Auction-Based P2P Energy Trading. IEEE Trans. Ind. Inform. 2024, 20, 6582–6590. [Google Scholar] [CrossRef] [Scilit]
- Zhou, Y.; Ma, Z.; Wang, T.; Zhang, J.; Shi, X.; Zou, S. Joint Energy and Carbon Trading for Multi-Microgrid System Based on Multi-Agent Deep Reinforcement Learning. IEEE Trans. Power Syst. 2024, 39, 7376–7388. [Google Scholar] [CrossRef] [Scilit]
- Liu, Z.; Huang, B.; Li, Y.; Sun, Q.; Pedersen, T.B.; Gao, D.W. Pricing Game and Blockchain for Electricity Data Trading in Low-Carbon Smart Energy Systems. IEEE Trans. Ind. Inform. 2024, 20, 6446–6456. [Google Scholar] [CrossRef] [Scilit]
- Xia, Y.; Wang, K.; Ji, H.; Wang, Q.; Shi, L.; Wu, F. Dynamic Network Usage Fee for Joint Kilowatt and Negawatt Peer-to-Peer Energy Market Based on Knowledge Distillation. IEEE Trans. Smart Grid 2026, 17, 2250–2264. [Google Scholar] [CrossRef] [Scilit]
- Tapia, T.; Liang, Z.; Konstantinou, C.; Dvorkin, Y. Electricity Market-Clearing With Extreme Events. IEEE Trans. Energy Mark. Policy Regul. 2025, 3, 194–208. [Google Scholar] [CrossRef] [Scilit]
- Saini, V.K.; Elshamy, A.R.; Al-Sumaiti, A.S.; Kumar, R. Community-Oriented Energy Trading Strategy in Multiagent Cloud Energy Storage Framework. IEEE Trans. Ind. Inform. 2025, 21, 8407–8418. [Google Scholar] [CrossRef] [Scilit]
- Liu, Y.; Huang, B.; Lin, Y.; Chen, Y.; Wu, L. Optimal SOC Headroom of Pump Storage Hydropower for Maximizing Joint Revenue from Day-Ahead and Real-Time Markets under Regional Transmission Organization Dispatch. J. Mod. Power Syst. Clean Energy 2024, 12, 238–250. [Google Scholar] [CrossRef] [Scilit]

Disclaimer/Publisher’s Note: The statements, opinions and data contained in all publications are solely those of the individual author(s) and contributor(s) and not of MDPI and/or the editor(s). MDPI and/or the editor(s) disclaim responsibility for any injury to people or property resulting from any ideas, methods, instructions or products referred to in the content. |
© 2026 by the authors. Licensee MDPI, Basel, Switzerland. This article is an open access article distributed under the terms and conditions of the Creative Commons Attribution (CC BY) license.