


Abstract
Hydraulic fractures in bedding-rich shale commonly interact with natural fractures and bedding interfaces, promoting fracture diversion, height containment, and asymmetric growth between nearby initiation points. This study investigates these processes using a coupled flow-solid cohesive-zone model with 30 single-factor cases covering in situ stress differences, elastic modulus, Poisson’s ratio, matrix fracture toughness, fluid viscosity, and injection rate, together with an auxiliary two-injection-point angle model. The effective-stress framework is used to interpret weak-plane activation, while fracture initiation and mixed-mode degradation are represented by a cohesive traction-separation formulation. Increasing the in situ stress difference from 1 to 5 MPa increases fracture height from approximately 3.0 to 7.2 m while reducing width from about 4.7 to 3.5 mm. Elastic modulus, Poisson’s ratio, and matrix fracture toughness primarily influence aperture within the investigated ranges, whereas higher fluid viscosity and injection rate are associated with greater vertical extension. Cross-method comparison with RFPA2D-Flow, FDEM, phase-field, block-DEM, and CDEM studies shows consistent trends in weak-plane interaction and fracture diversion. Field-scale microseismic observations from the Guyeyouping-1 horizontal well indicate predominantly vertical fractures with interpreted full lengths of approximately 222–470 m, an average length of about 365 m, and an average left–right wing-length difference of approximately 50 m; a corresponding six-cluster simulation exhibits the same asymmetric growth tendency. Overall, the results identify stress state, weak-plane geometry, and hydraulic conditions as key controls on non-uniform fracture propagation in layered shale and provide a mechanistic basis for site-specific fracturing design within the investigated parameter ranges.
1. Introduction
Densely clustered hydraulic fracturing in horizontal wells improves stimulated reservoir volume by increasing the number of perforation clusters and shortening cluster spacing. In bedding-rich shale, however, a hydraulic fracture may interact with natural fractures or bedding interfaces before continuing through the matrix. Interface opening, shear damage, and fluid diversion can then promote bedding-parallel or radial propagation, restrict vertical extension, and amplify differences among nearby initiation points [1,2,3,4,5].
A useful mechanical interpretation begins with effective normal stress. When fracturing fluid enters a weak interface, the local fluid pressure rises, and the effective normal restraint decreases. Under fracture-tip shear disturbance, this reduction can increase the tendency for interface activation, including local damage and opening. The present analysis therefore uses interface opening and fracture-path morphology as the primary indicators of weak-plane activation, while permanent tangential slip and detailed contact-traction evolution are treated as complementary mechanisms rather than primary output variables.
Previous studies have clarified fracture-crossing criteria at frictional interfaces, fracture interaction in naturally fractured formations, and height containment in layered reservoirs [2,3,4,5,6,7,8,9,10,11]. Multi-fracture simulations further show that nearby hydraulic fractures may develop non-uniformly because of stress and flow competition [12,13]. Numerical developments such as the implicit level set method have advanced hydraulic-fracture propagation modeling [14], while laboratory experiments on naturally fractured rock have provided complementary evidence regarding fracture interaction and propagation behavior [15]. The present study therefore develops a mechanistic framework linking weak-plane activation, bedding-parallel fluid diversion, reduced cross-layer driving pressure, height containment, and asymmetric fracture development. The auxiliary two-injection-point model is used to examine local interaction between nearby initiation points rather than to represent a complete wellbore-coupled multi-cluster system.
The interpretation is grounded in classical hydraulic-fracture width and height-growth solutions [16,17], layered-formation containment analyses [18,19], and more recent numerical models of hydraulic fracture propagation [20,21,22,23,24,25,26,27,28,29,30]. To assess the generality of the observed trends, the present results are compared with independent RFPA2D-Flow, FDEM, phase-field, block-DEM, and CDEM simulations [31,32,33,34,35,36,37,38], together with a field-scale microseismic case from the same research program. These comparisons are used to evaluate consistency in interaction regimes and directional parameter trends across different numerical and field scales. Recent studies also show that fluid rheology and network geometry can strongly alter hydraulic resistance and pressure redistribution in branching or converging-diverging flow networks [39,40]. These studies provide a useful fluid-mechanical analogy for pressure partition after fluid diversion into activated weak-plane pathways.
2. Materials and Methods
2.1. Effective-Stress-Based Interpretation of Weak-Plane Activation
Let σn denote the compressive normal stress acting on a weak plane and pf the fluid pressure within that plane, both expressed using the same pressure reference. With compression taken as positive, the effective normal stress is written as
σ′n = σn − pf
For a closed interface under effective compression (σ′n ≥ 0), the idealized shear resistance is described by a cohesion-friction form:
where cw is the weak-plane cohesion and μw is the weak-plane friction coefficient. For positive shear resistance τc, a slip-tendency index can therefore be defined as
where |τ| is the shear-traction magnitude. Equation (2) is restricted to a closed, compression-bearing interface and is not extrapolated to tensile opening. Equations (1)–(3) serve as an interpretive framework for weak-plane activation, whereas fracture initiation and evolution are governed by the cohesive-zone formulation described below. Accordingly, interface opening and fracture-path deflection are used as the principal numerical indicators in the present analysis.
τc = cw + μwσ′n
Ts = |τ|/τc ≥ 1
2.2. Coupled Flow-Solid Cohesive-Zone Model
The rock matrix is treated as a poroelastic continuum governed by pore-fluid mass conservation and Darcy flow. C3D8P pore-pressure elements are used for the matrix, whereas the prescribed hydraulic-fracture and bedding paths are represented by COH3D8P cohesive pore-pressure elements that permit tangential fluid flow and fluid exchange with the surrounding matrix. Fracture initiation is governed by a quadratic nominal-stress criterion, and subsequent mixed-mode degradation is described by the Benzeggagh–Kenane (BK) energy relation. The constitutive relations adopted in the analysis are summarized below.
(⟨tn⟩/tn0)2 + (ts/ts0)2 + (tt/tt0)2 = 1
In Equation (4), tn is the nominal traction normal to the cohesive interface, whereas ts and tt are the nominal tractions in the two tangential directions. tn0, ts0, and tt0 are the corresponding undamaged cohesive strengths. The Macaulay bracket ⟨x⟩ = max(x, 0) is applied only to the normal term, so compressive normal traction does not contribute to damage initiation; the two shear contributions enter through their squared terms.
Once the initiation condition in Equation (4) is satisfied, the cohesive response is progressively degraded through a scalar damage variable D (0 ≤ D ≤ 1), where D = 0 denotes the undamaged state and D = 1 denotes complete cohesive degradation. For the two shear components, the degraded tractions are written as ts = (1 − D) and tt = (1 − D), where the overbar denotes the corresponding undamaged traction. Under mixed-mode loading, the damage evolution is governed by the BK relation:
In Equation (5), Gn is the normal-mode energy-release contribution; Gs is the first shear-mode contribution; Gt is the second shear-mode contribution; Gnc and Gsc are the critical fracture energies defining the normal- and shear-mode limits used in the BK interpolation, respectively; and η is the dimensionless mode-mixity exponent. The total energy-release measure is G_T = Gn + Gs + Gt, and Equation (5) gives the corresponding mixed-mode critical energy Gc. Fracture propagation is permitted when G_T reaches Gc. The BK relation governs cohesive damage evolution; at D = 1, the cohesive shear traction is fully degraded. Any subsequent compressive contact response is conceptually distinct from cohesive fracture-energy dissipation, and Gc is therefore interpreted as the energy associated with cohesive damage evolution.
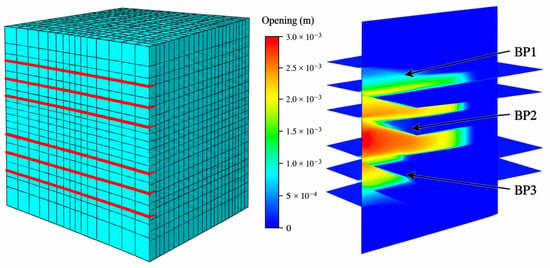
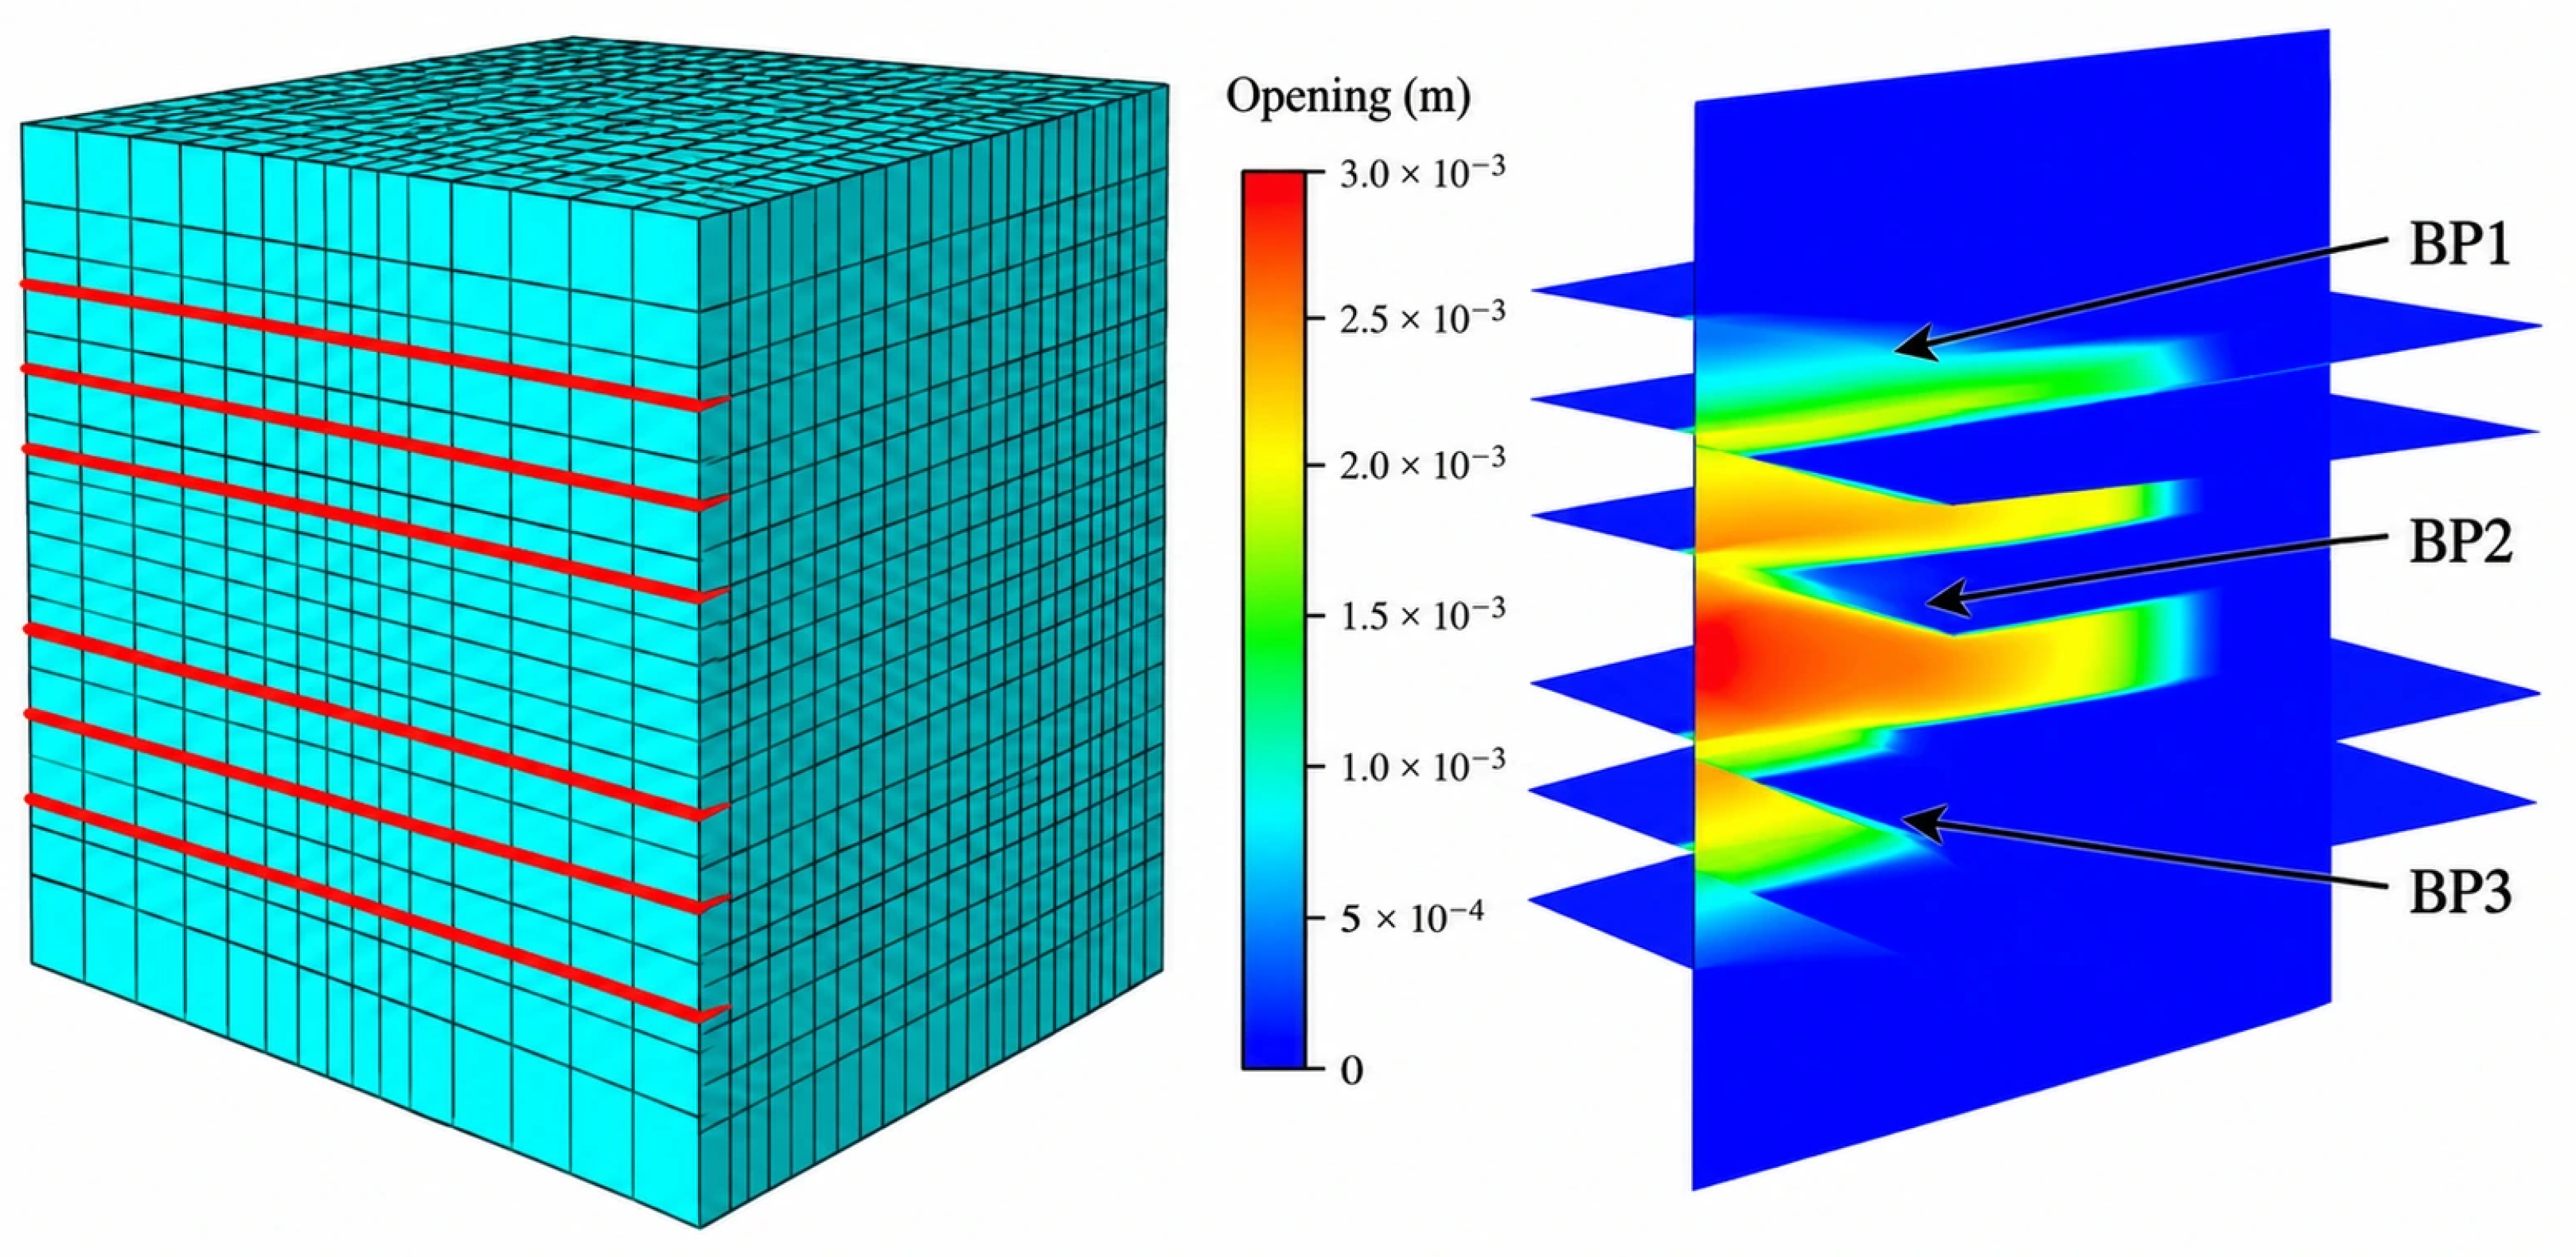
The primary model uses a 30 m × 30 m × 30 m domain with 3 m bedding spacing and injection between adjacent interfaces. The geometry includes one-, two-, and three-bedding-fracture configurations. Each bedding-fracture layer is represented as a finite interface band bounded by two visible horizontal faces; consequently, the three-layer configuration appears as six horizontal faces in the visualization. The primary case therefore contains three weakly cemented bedding-fracture layers rather than six independent bedding layers. The primary-model geometry and bedding-fracture configuration are shown in Figure 1. The nominal global mesh size is 1 m, with 13,080 elements in the primary model. The baseline parameters are summarized in Table 1.
Figure 1.
Primary-model visualization. Three weakly cemented bedding-fracture layers are arranged at 3 m spacing. Each layer is represented by two bounding faces, producing six visible horizontal surfaces in the rendered geometry. BP1–BP3 denote the three bedding-fracture layers.
Table 1.
Baseline parameters and numerical configuration of the primary model.
Table 1 lists only values attributable to the primary three-dimensional case series. The value e = 0.20 is a void ratio, corresponding to porosity n = e/(1 + e) ≈ 0.167, and 9800 N·m−3 is the fluid specific weight rather than density. Parameters from the separate XFEM hydration-fracture models discussed in Section 2.6 are not transferred to the primary CZM.
2.3. Numerical Case Matrix
A total of 30 single-factor cases were conducted using the primary model. The cases form a one-at-a-time sensitivity design rather than a factorial parameter study. The prescribed stress variable is expressed as Δσ = σv − σh, where σh is the minimum horizontal stress. Except for the viscosity group, for which Δσ = 1 MPa, the non-stress parameter groups use Δσ = 2 MPa and hold the remaining reported inputs at their corresponding baseline values. Consequently, the analysis focuses on within-sweep trends, while coupled interactions and normalized effect rankings across different sweeps are reserved for future factorial studies. The complete case matrix is summarized in Table 2.
Table 2.
Single-factor numerical simulation cases used for sensitivity analysis.
2.4. Auxiliary Model for Interaction Between Two Injection Points
A geometrically independent two-injection-point auxiliary model was used to examine the effect of natural-fracture angle (15°, 30°, 45°, 60°, 75°, and 90°). The model uses a 50 m × 50 m plane-strain domain with two initiation points separated by 5 m; the matrix is discretized with CPE4P elements, fracture/interface paths use COH2D4P elements, and the pre-fracture region is locally refined to approximately 0.1–1 m. The angle sweep uses Δσ = 2 MPa, E = 19 GPa, ν = 0.25, and fluid viscosity = 1 mPa·s. The left initiation point is denoted as Injection Point 1 and the right initiation point as Injection Point 2. This auxiliary configuration isolates local interaction and asymmetry between nearby initiation points.
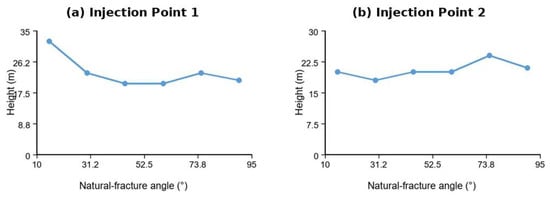
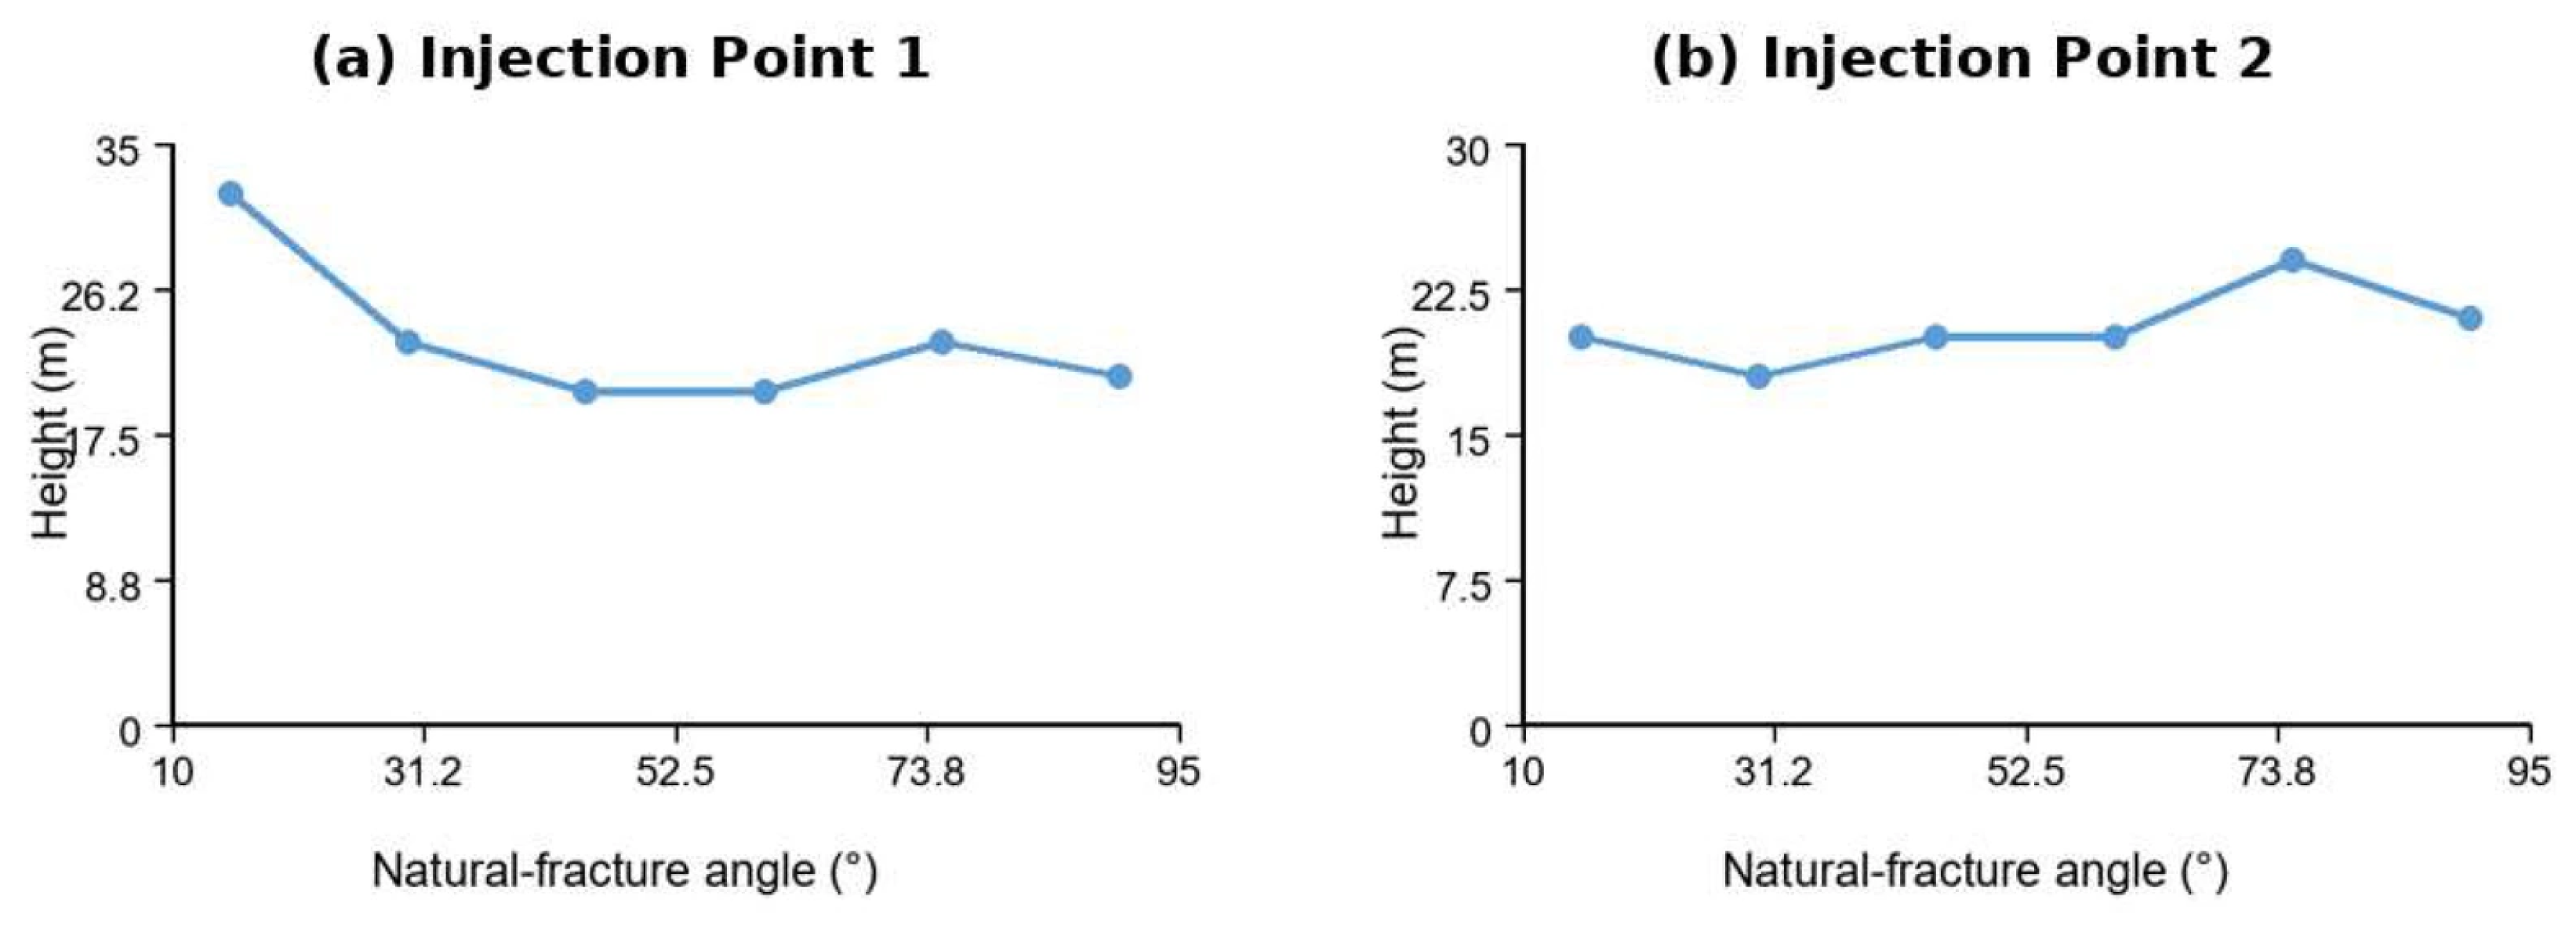
In the 15° case, the fracture heights are approximately 32 m at Injection Point 1 and 20 m at Injection Point 2. These values correspond to the independent 50 m × 50 m auxiliary model rather than the 30 m primary three-dimensional model. The angle series is therefore used to compare relative interaction behavior within the auxiliary configuration, while boundary and pumping-normalization effects are considered as part of the broader model-scope discussion in Section 4.4.
2.5. Numerical Resolution and Sensitivity Scope
The primary three-dimensional model uses a nominal global element size of 1 m and contains 13,080 elements. The independent two-dimensional angle model uses local mesh sizes of approximately 0.1–1 m and is treated as a distinct formulation rather than as a refinement level of the primary geometry. The numerical assessment therefore emphasizes within-series sensitivity trends. Systematic verification of mesh, time-step, and domain-size effects is identified as an important extension for future work.
Cross-method comparisons and the supporting XFEM analyses provide complementary context for model behavior, numerical practice, and process interpretation across scales. Same-model convergence remains a separate numerical-verification task considered in the future-work framework.
2.6. Supporting XFEM Model-Development Records and Output Definitions
Separate two-dimensional XFEM model-development records from the same research program provide additional procedural context. At core scale, a 2.5 × 5 cm plane-strain model used CPE4P elements with a 0.0005 m mesh (approximately 250,000 elements); a 50 m × 50 m well-group model used CPE4P elements with a 0.5 m mesh (approximately 10,000 elements). These supporting models employed Geostatic and Soil steps, with analysis duration, incremental stepping, and maximum pore-pressure change controlled in the Soil step, and General Solution Controls adjusted to improve numerical convergence. In the supporting XFEM models, in-plane displacement constraints (Ux = Uy = 0) and a constant external pore-pressure boundary were prescribed, while in situ stresses, initial pore pressure, void ratio, and saturation were introduced as predefined fields. Injection was controlled through an amplitude definition and *cflow, and PFOPENXFEM/PORPRES outputs were used to obtain crack opening and pore-pressure histories.
The supporting XFEM models were adjusted against physical-model observations under controlled pore-pressure and confining-pressure conditions, providing experiment-informed procedural context for model development. Their geometry and parameterization differ from the primary 3D C3D8P/COH3D8P formulation, so the XFEM parameter set is treated independently from the primary CZM baseline; for example, E = 16.64 GPa and ν = 0.1784 characterize the supporting XFEM cases, whereas the primary case uses 19 GPa and 0.19. For dimensional clarity, k denotes intrinsic permeability (m2), Kh hydraulic conductivity (m/s), and μ dynamic viscosity (Pa·s), and a pressure-driven interface exchange coefficient Cl has units of m/(Pa·s) when written as vn = ClΔp. Table 1 reports primary-model quantities with unambiguous definitions and units. The fracture height and width curves are used as comparative case-series metrics for trend analysis.
3. Results and Discussion
3.1. Effect of In Situ Stress Difference
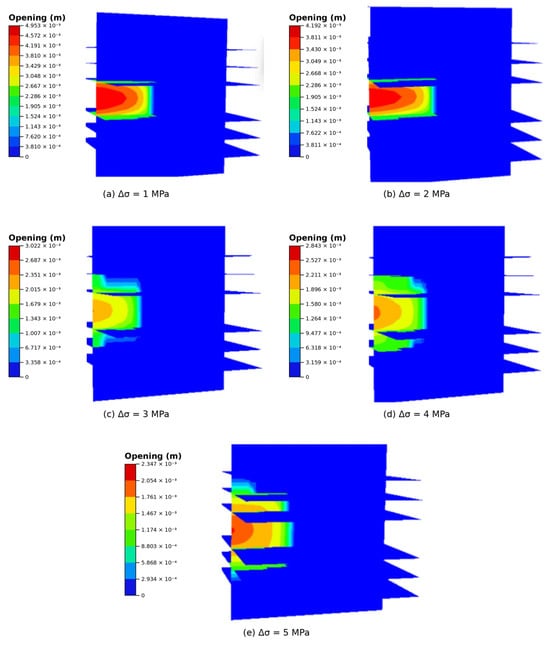
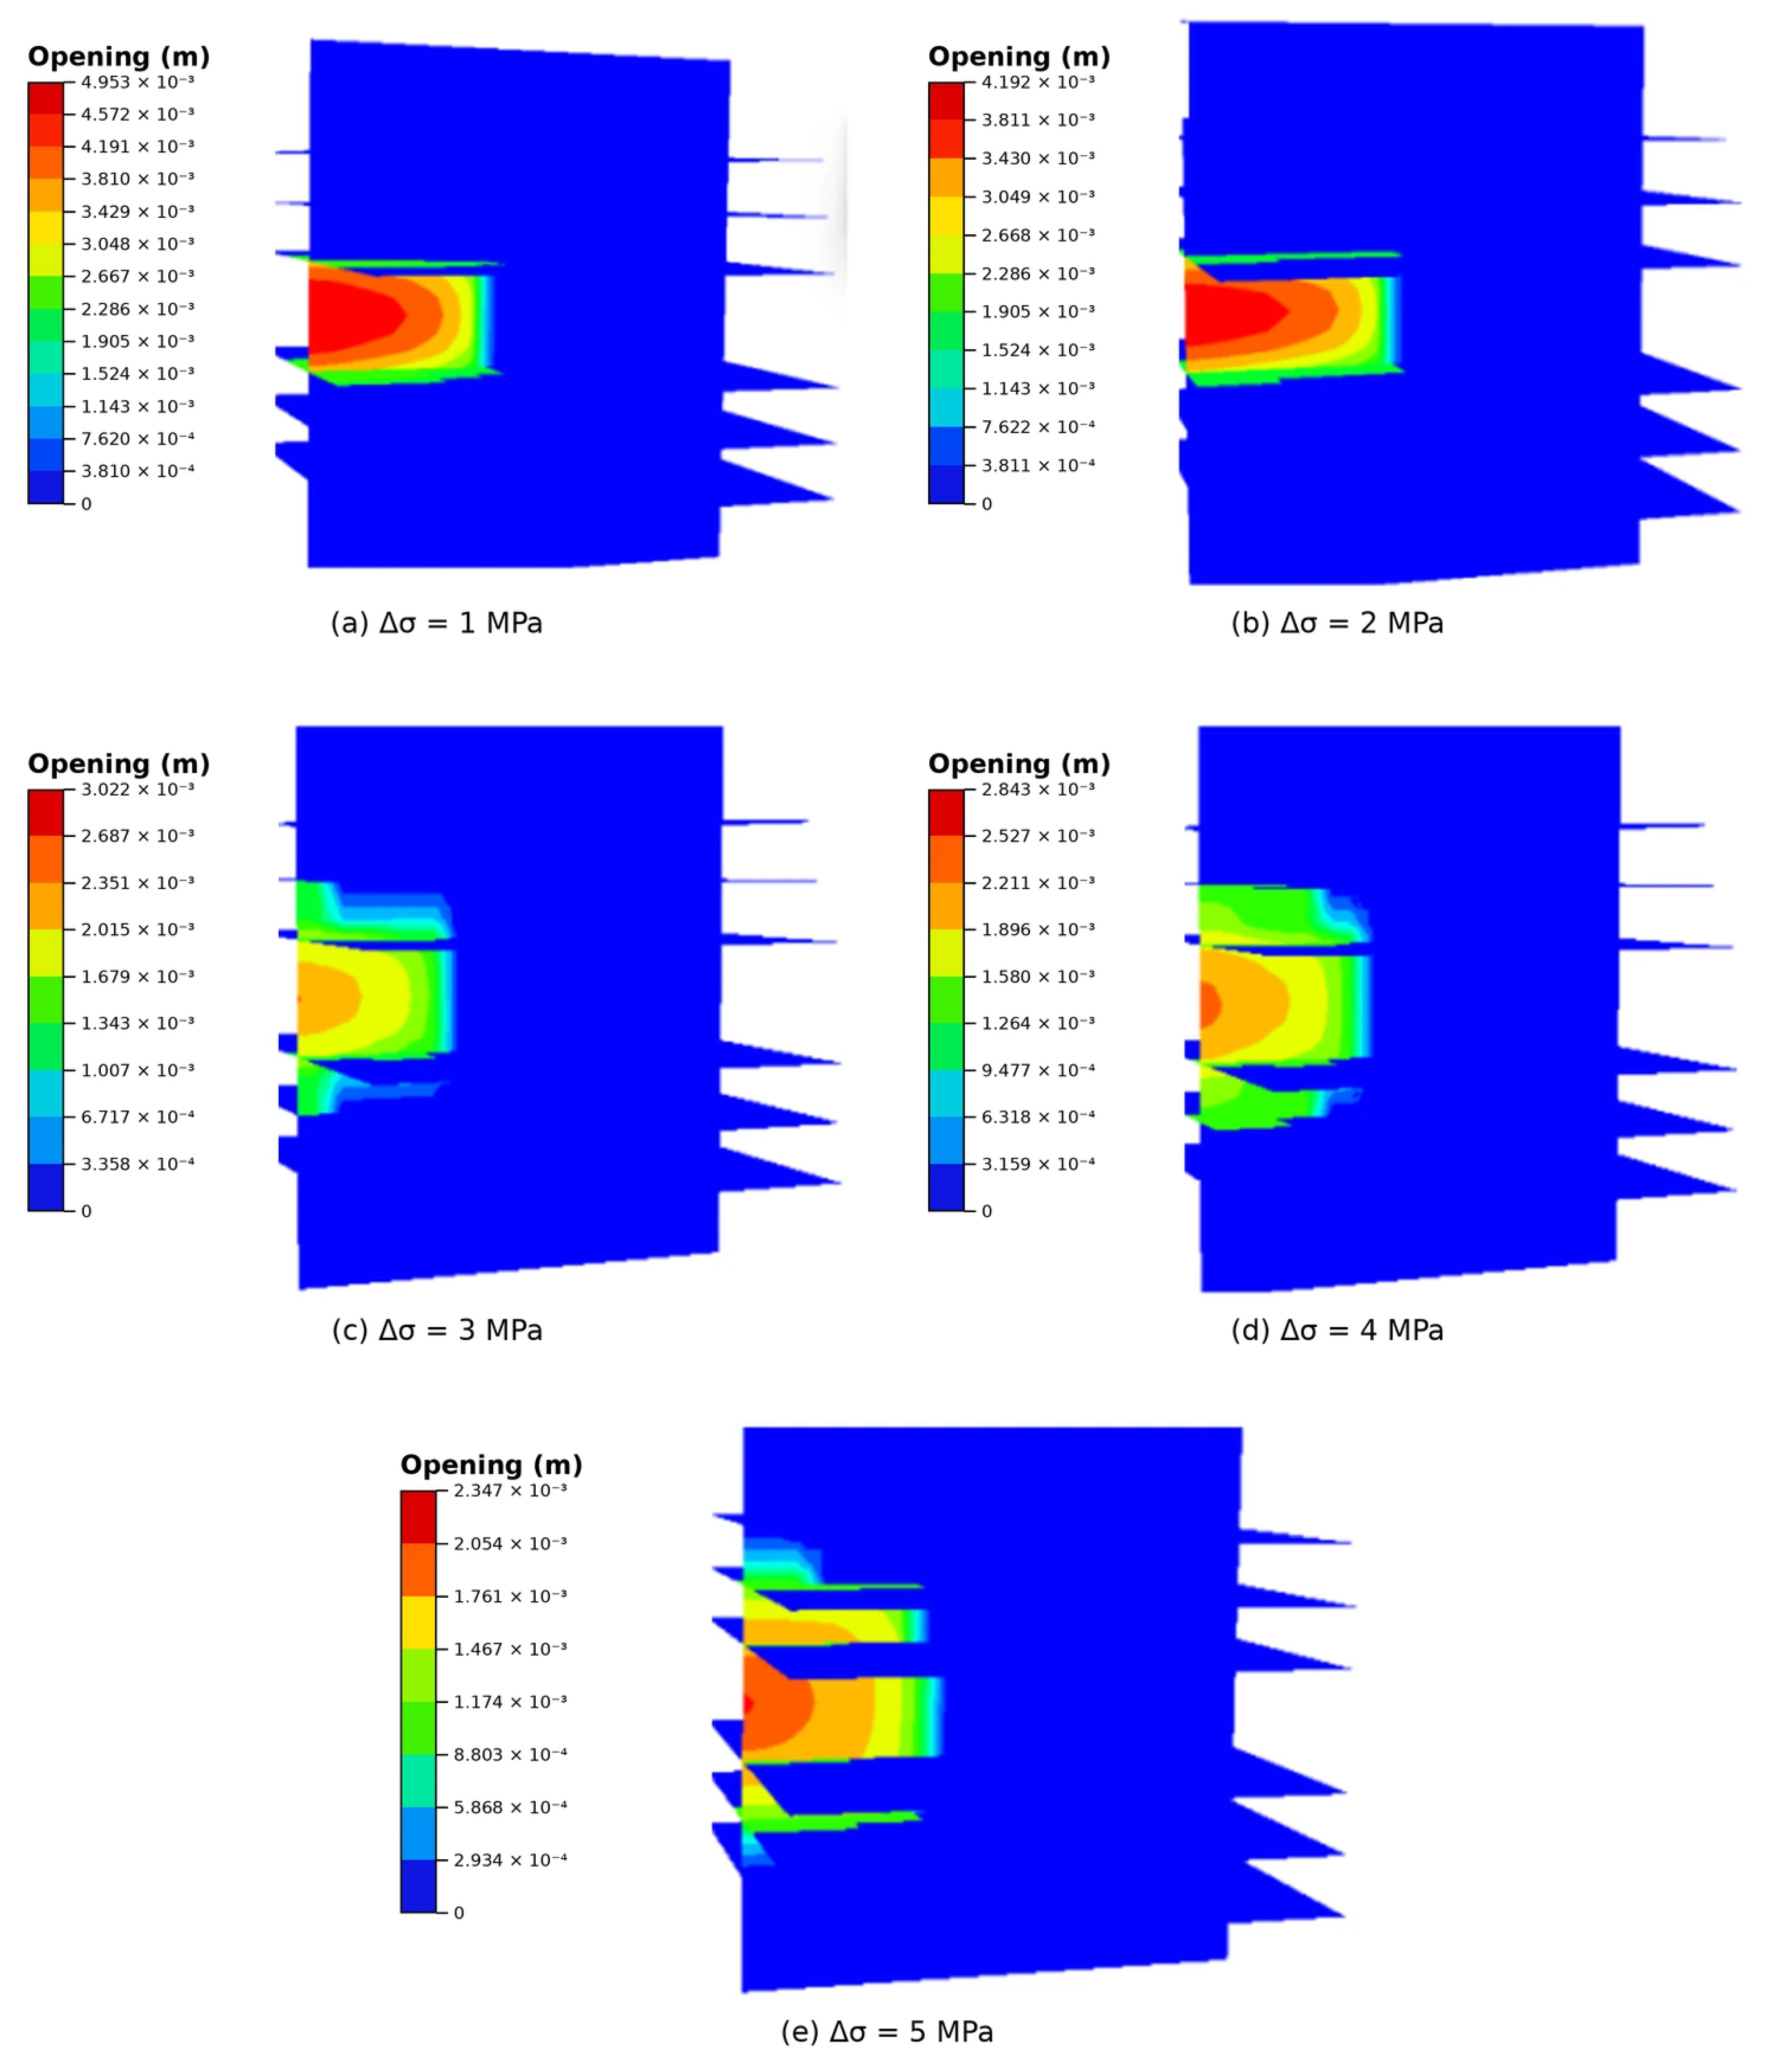
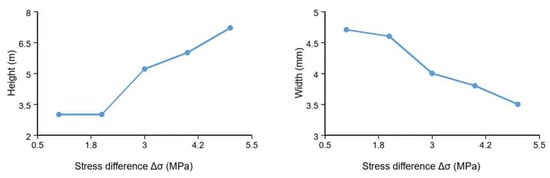
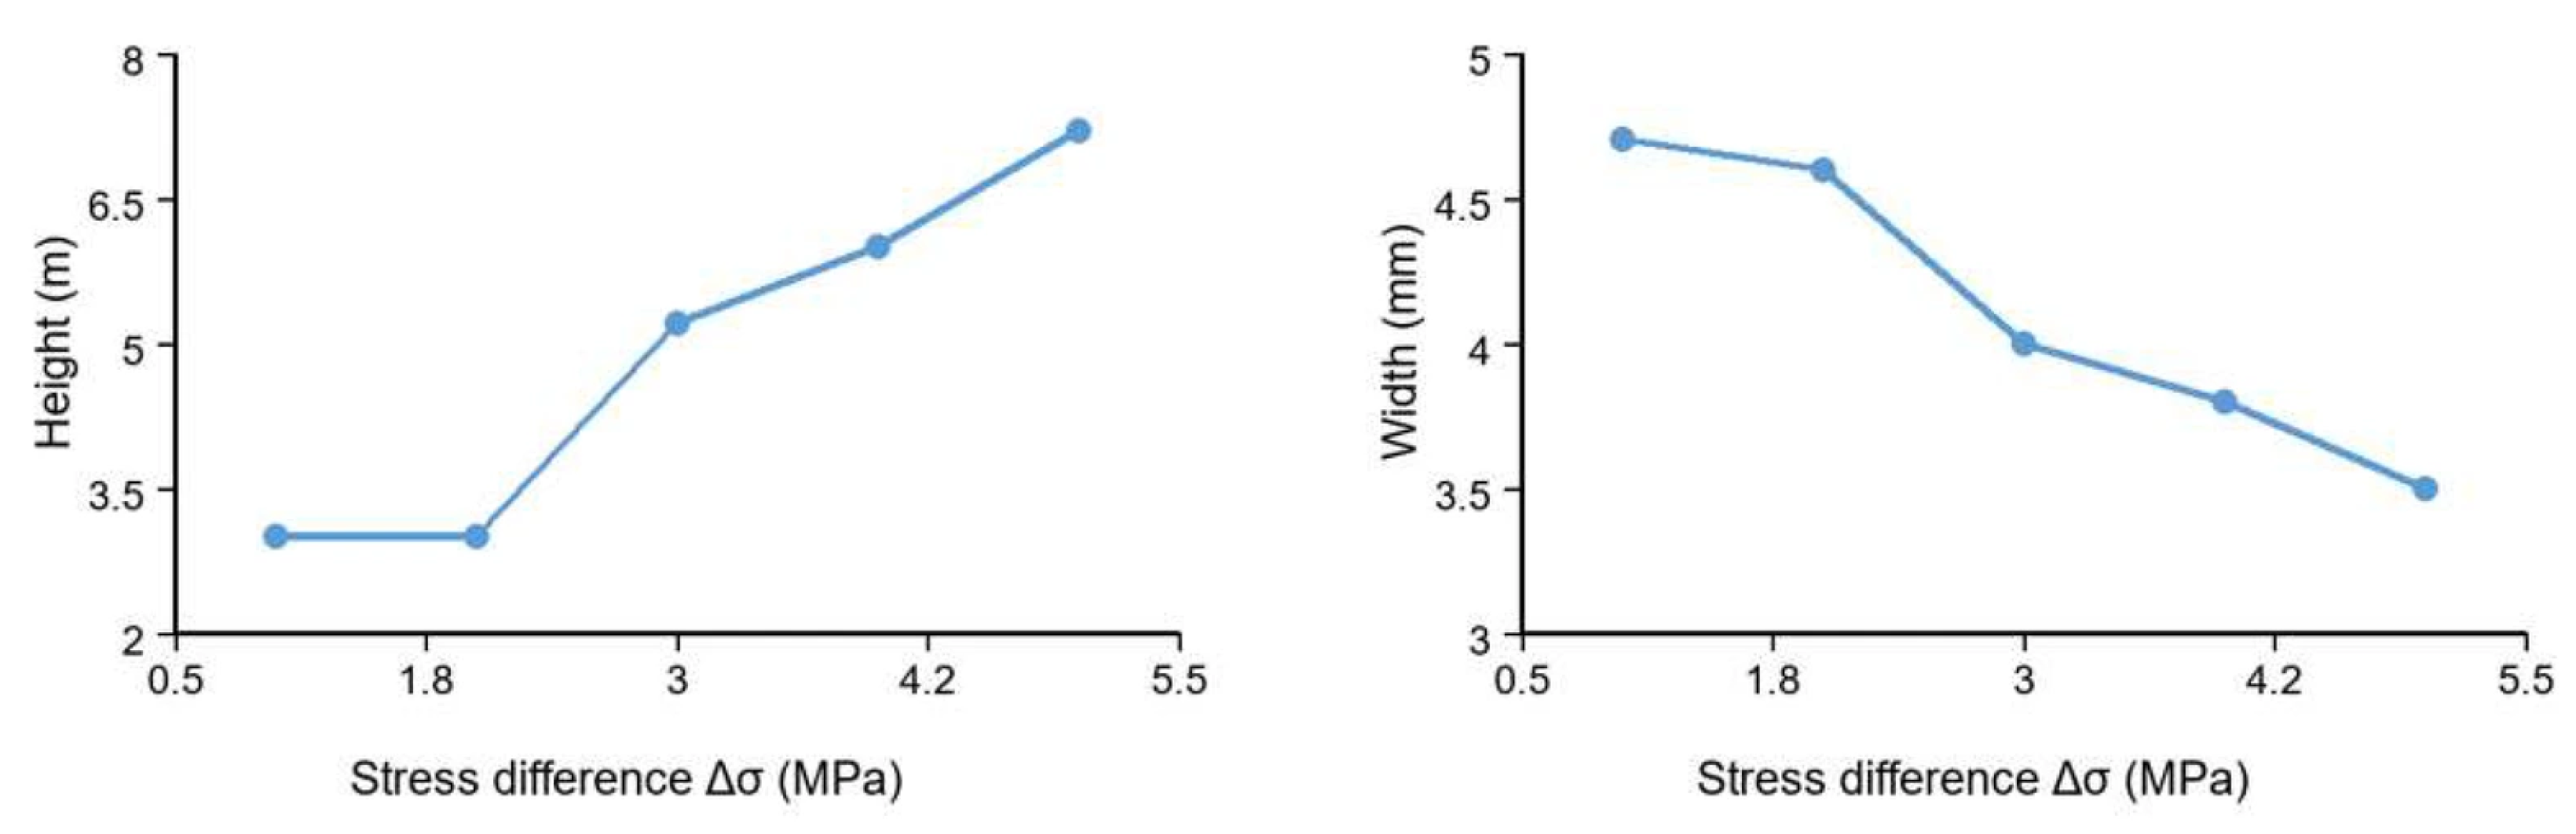
The simulation results at Δσ = 1–5 MPa show a transition from interface capture toward greater vertical extension. The corresponding opening patterns are shown in Figure 2, and the height/width trends are summarized in Figure 3. Fracture height is approximately 3.0 m at both 1 and 2 MPa; it then increases and reaches approximately 7.2 m at 5 MPa, where the morphology shows propagation across successive bedding levels. Fracture width decreases from approximately 4.7 to 3.5 mm over the full range.
Figure 2.
Fracture propagation opening contours under different in situ stress differences. Opening is displayed in meters; each panel retains its own color scale.
Figure 3.
Effects of in situ stress difference on fracture height and width. Approximate case-series values used for comparative trend analysis.
The opening patterns are consistent with bedding-parallel diversion at low Δσ. Fluid entry and a reduction in effective normal restraint provide a plausible explanation for capture, while a larger stress contrast favors continued vertical extension. Because Figure 2 presents opening contours, pressure redistribution is discussed as a mechanistic interpretation of the coupled response rather than as an independently plotted state variable.
3.2. Effect of Elastic Modulus
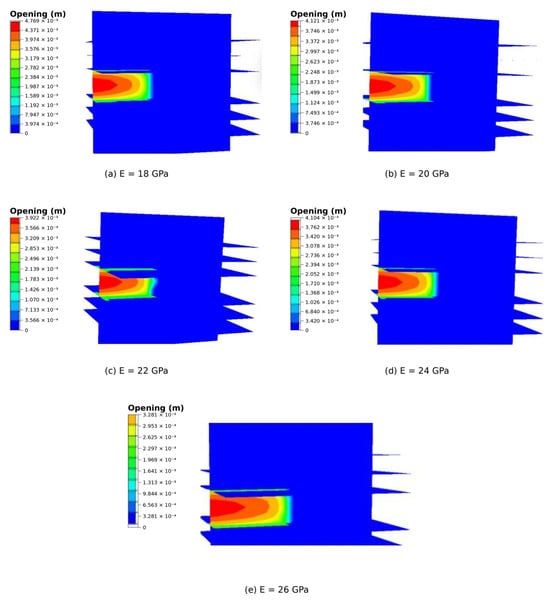
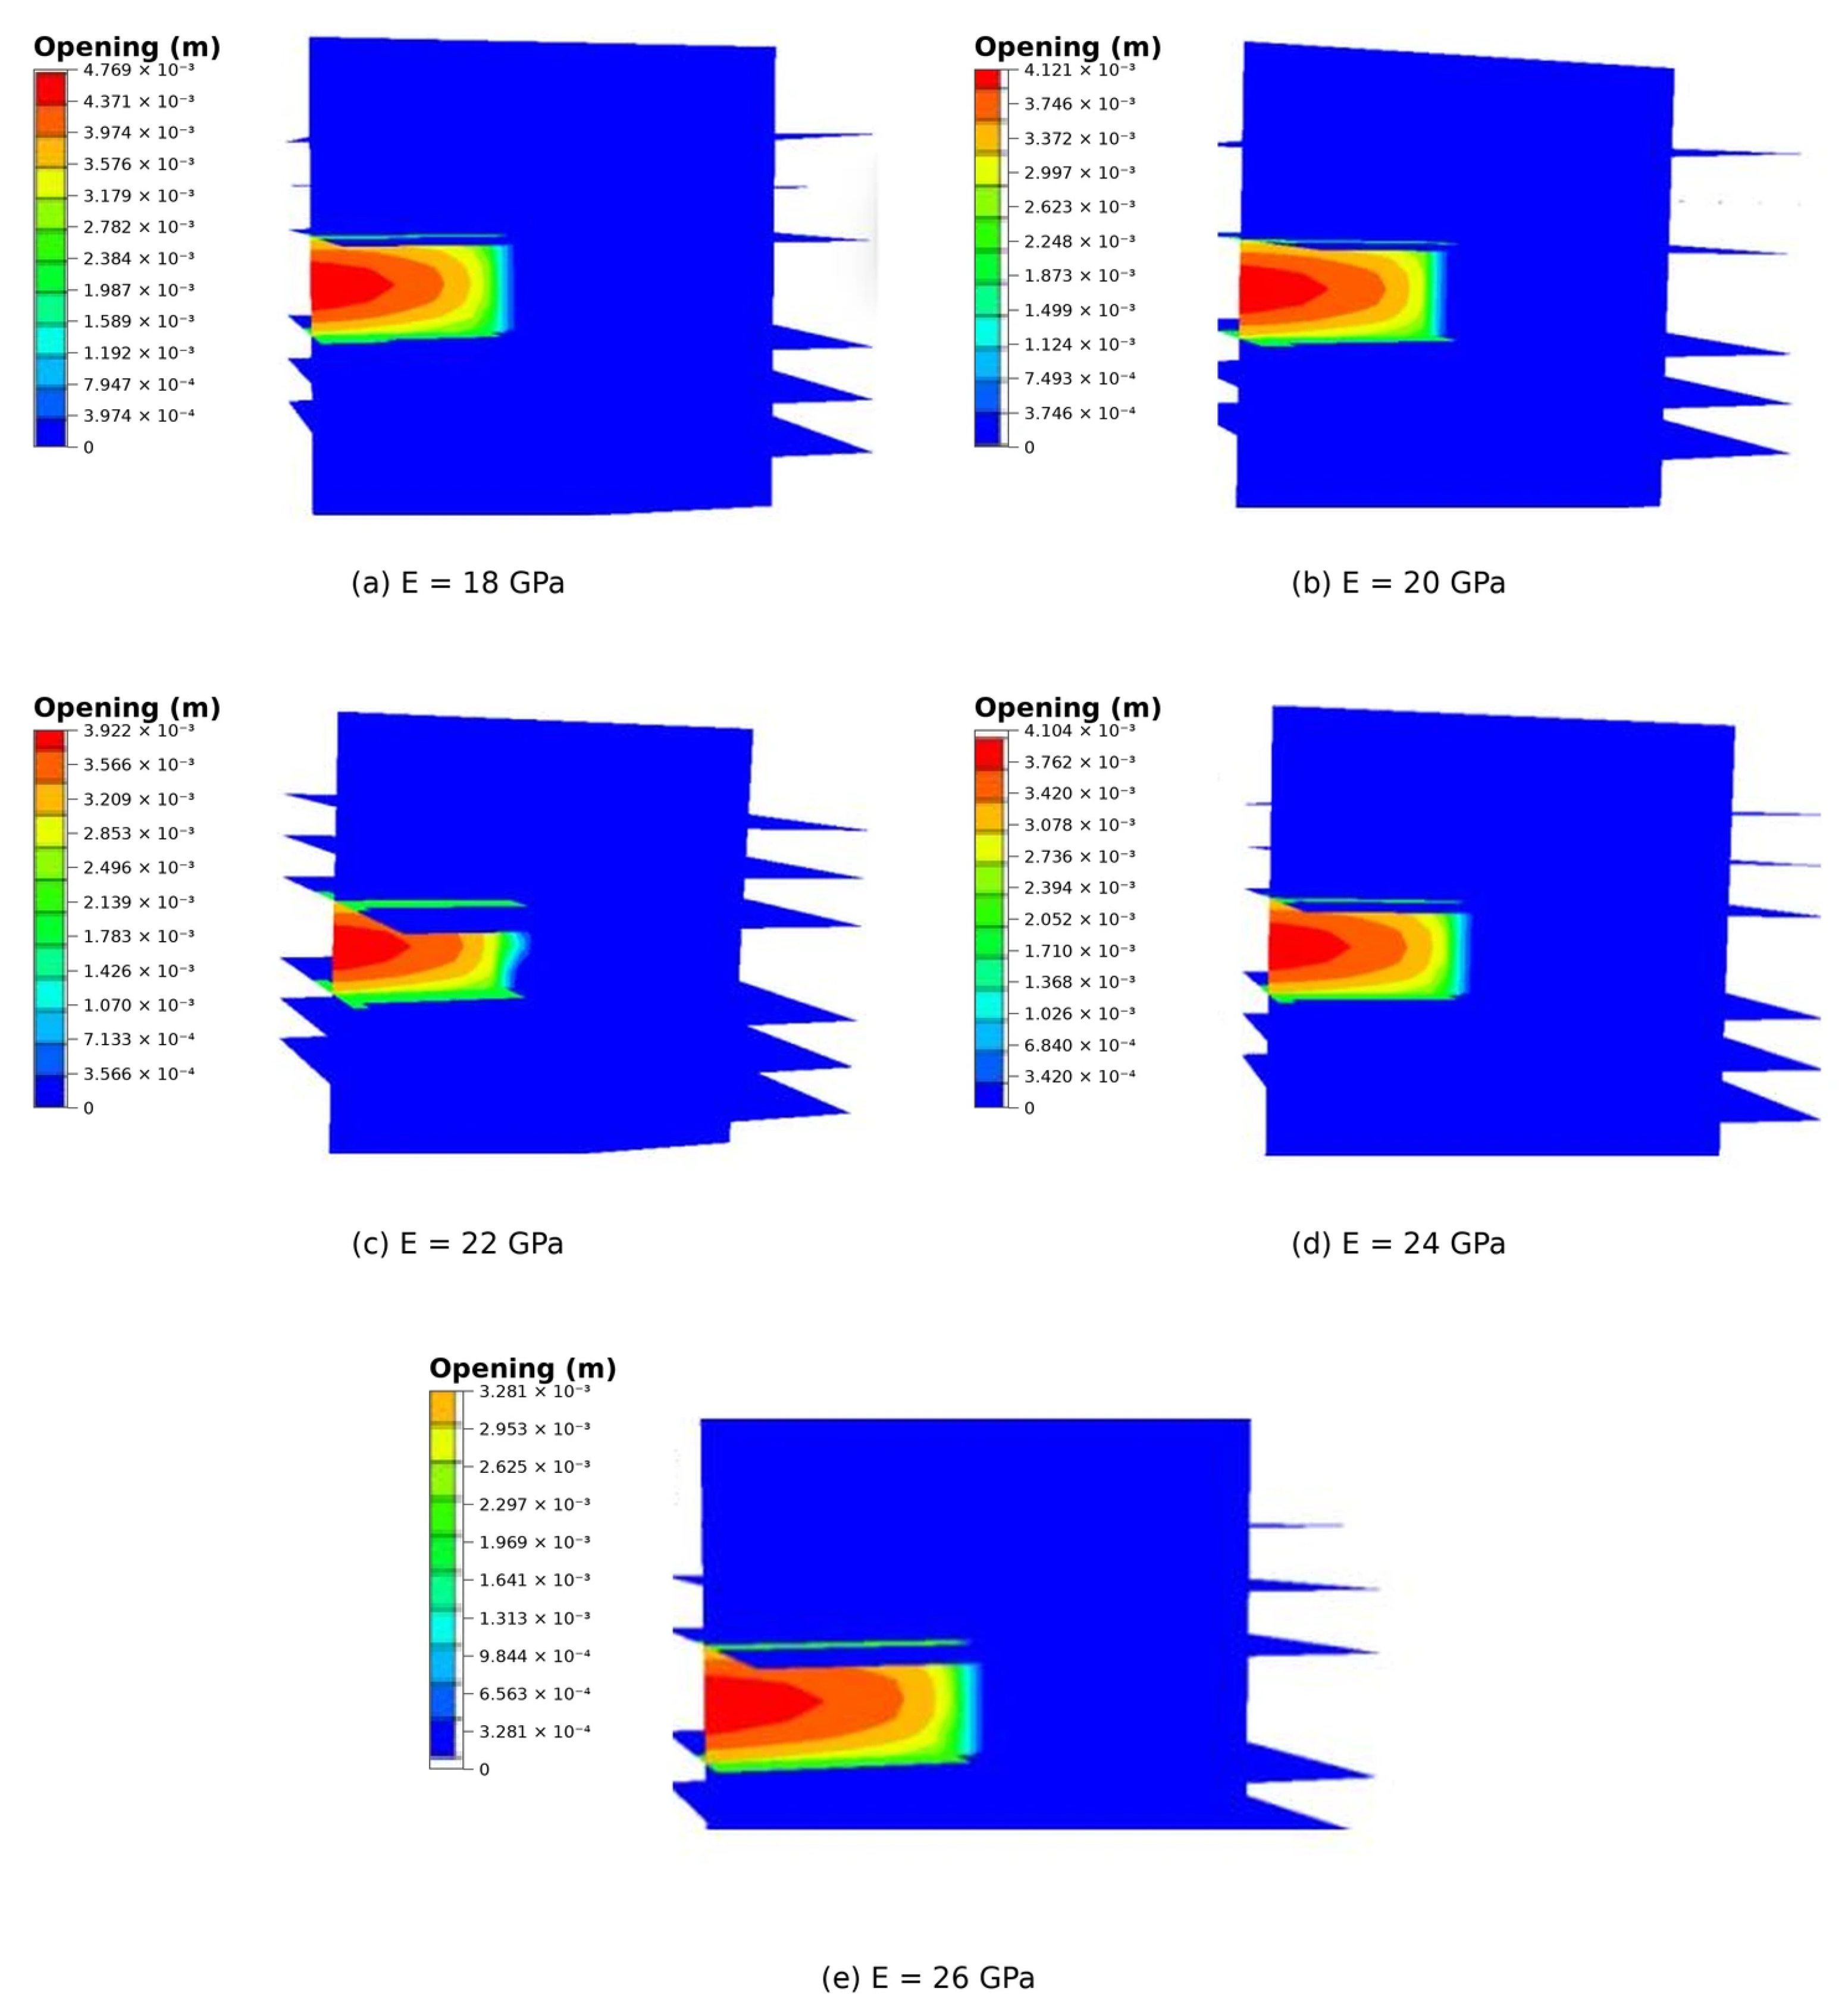
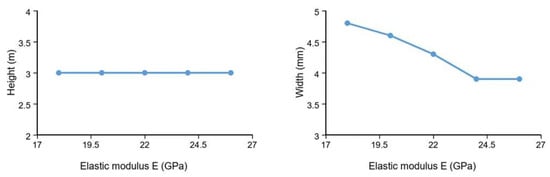
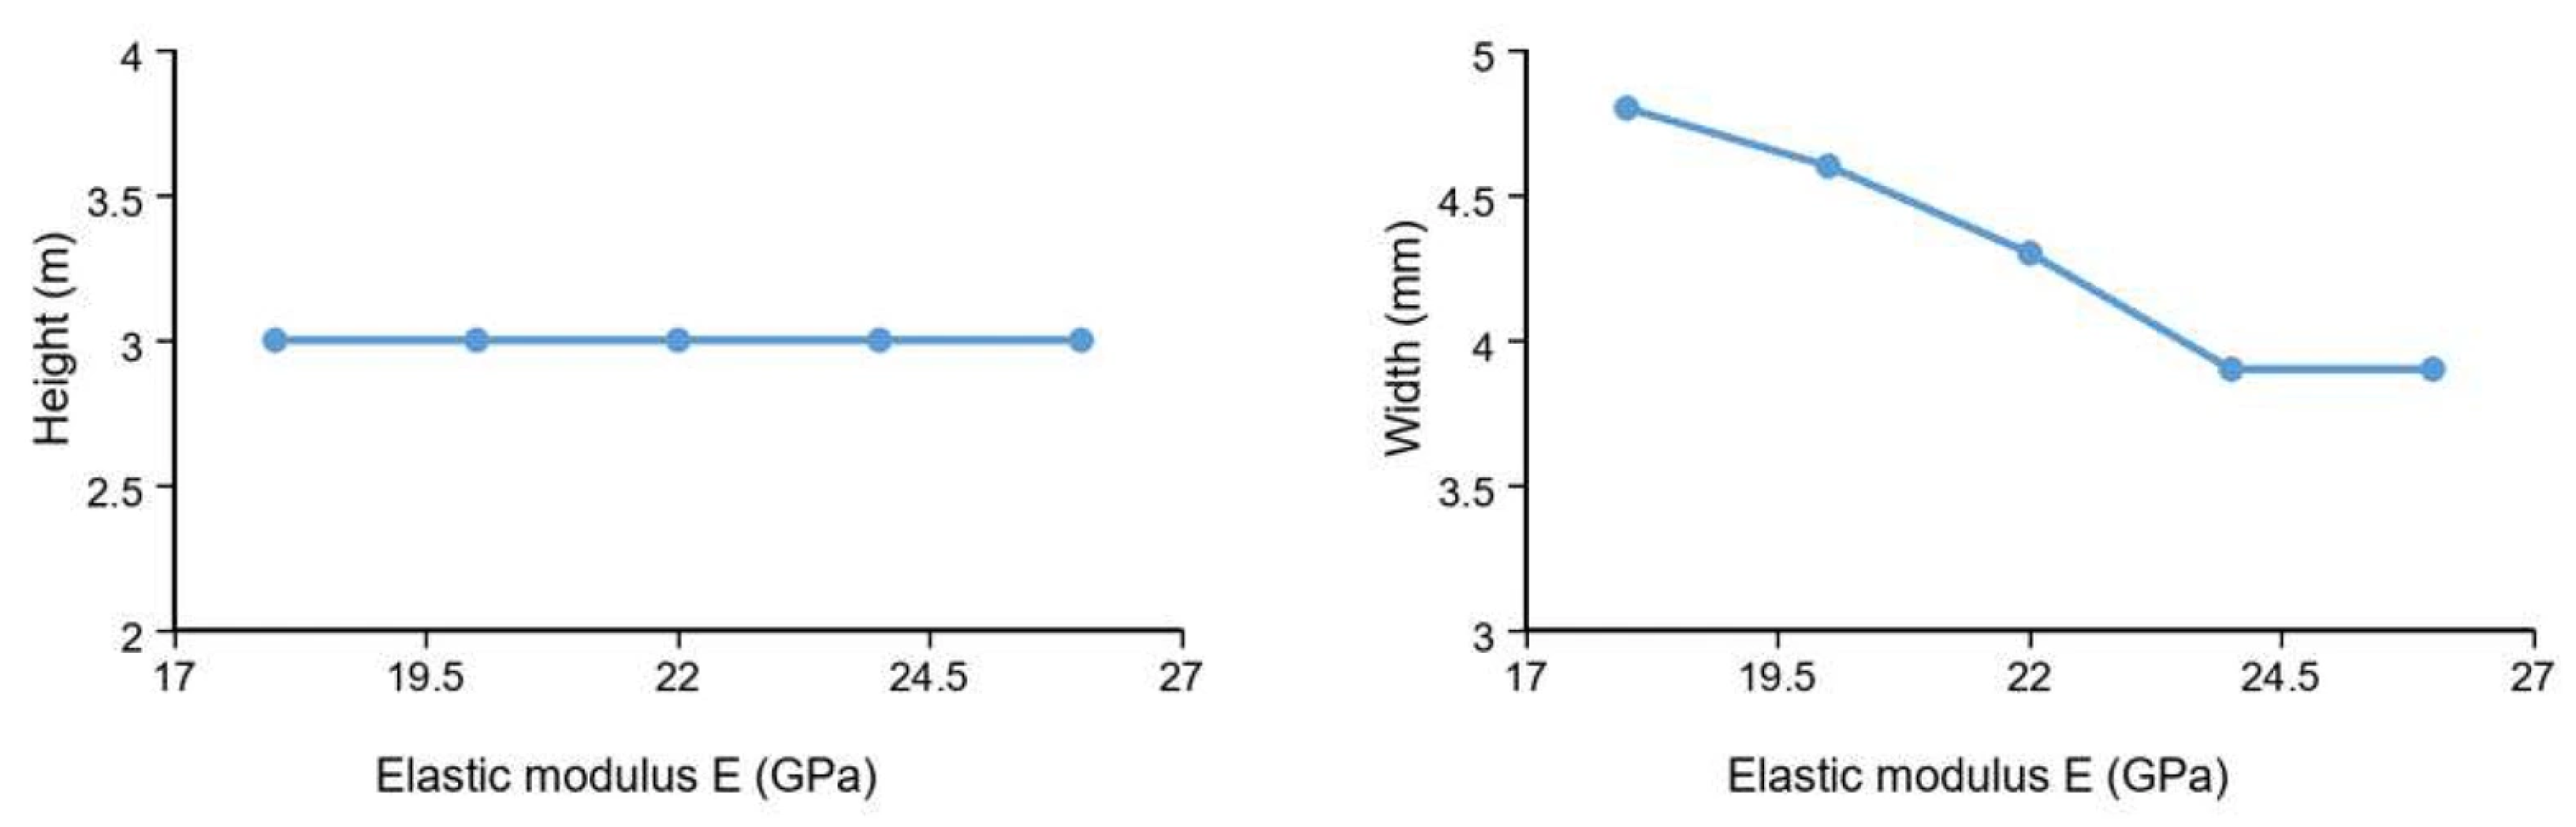
Elastic moduli of 18, 20, 22, 24, and 26 GPa were considered. Fracture height remained approximately 3.0 m for all cases, indicating that the fracture was captured by the first bedding plane. Fracture width decreased gradually from about 4.8 to 3.9 mm (Figure 4 and Figure 5). Therefore, elastic modulus mainly regulates fracture opening rather than determining whether the fracture can penetrate the bedding plane. Figure 4 presents the fracture-propagation patterns for the five elastic-modulus cases, and Figure 5 summarizes the corresponding fracture-height and fracture-width responses.
Figure 4.
Fracture propagation opening contours under different elastic moduli. Opening is displayed in meters; each panel retains its own color scale.
Figure 5.
Effects of elastic modulus on fracture height and width. Approximate case-series values used for comparative trend analysis.
A lower elastic modulus allows greater matrix deformation and aperture after weak-plane activation, which can help sustain an interface-parallel flow path. A higher modulus suppresses aperture but, within the present parameter range, does not change the relative weakness of the preset bedding interface. The propagation mode therefore remains interface-dominated in these cases.
3.3. Effect of Poisson’s Ratio
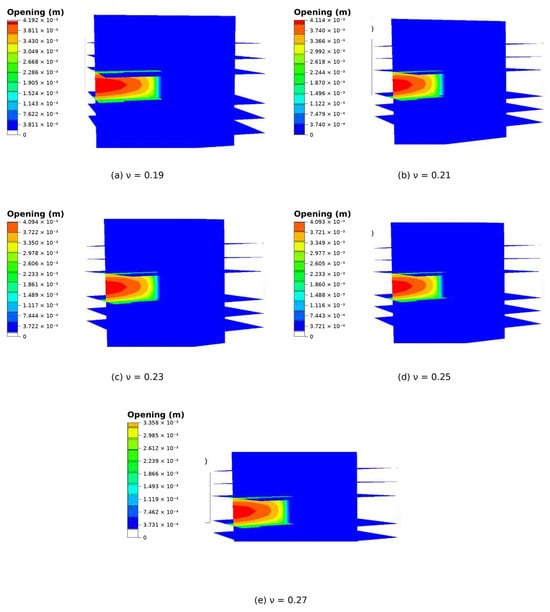
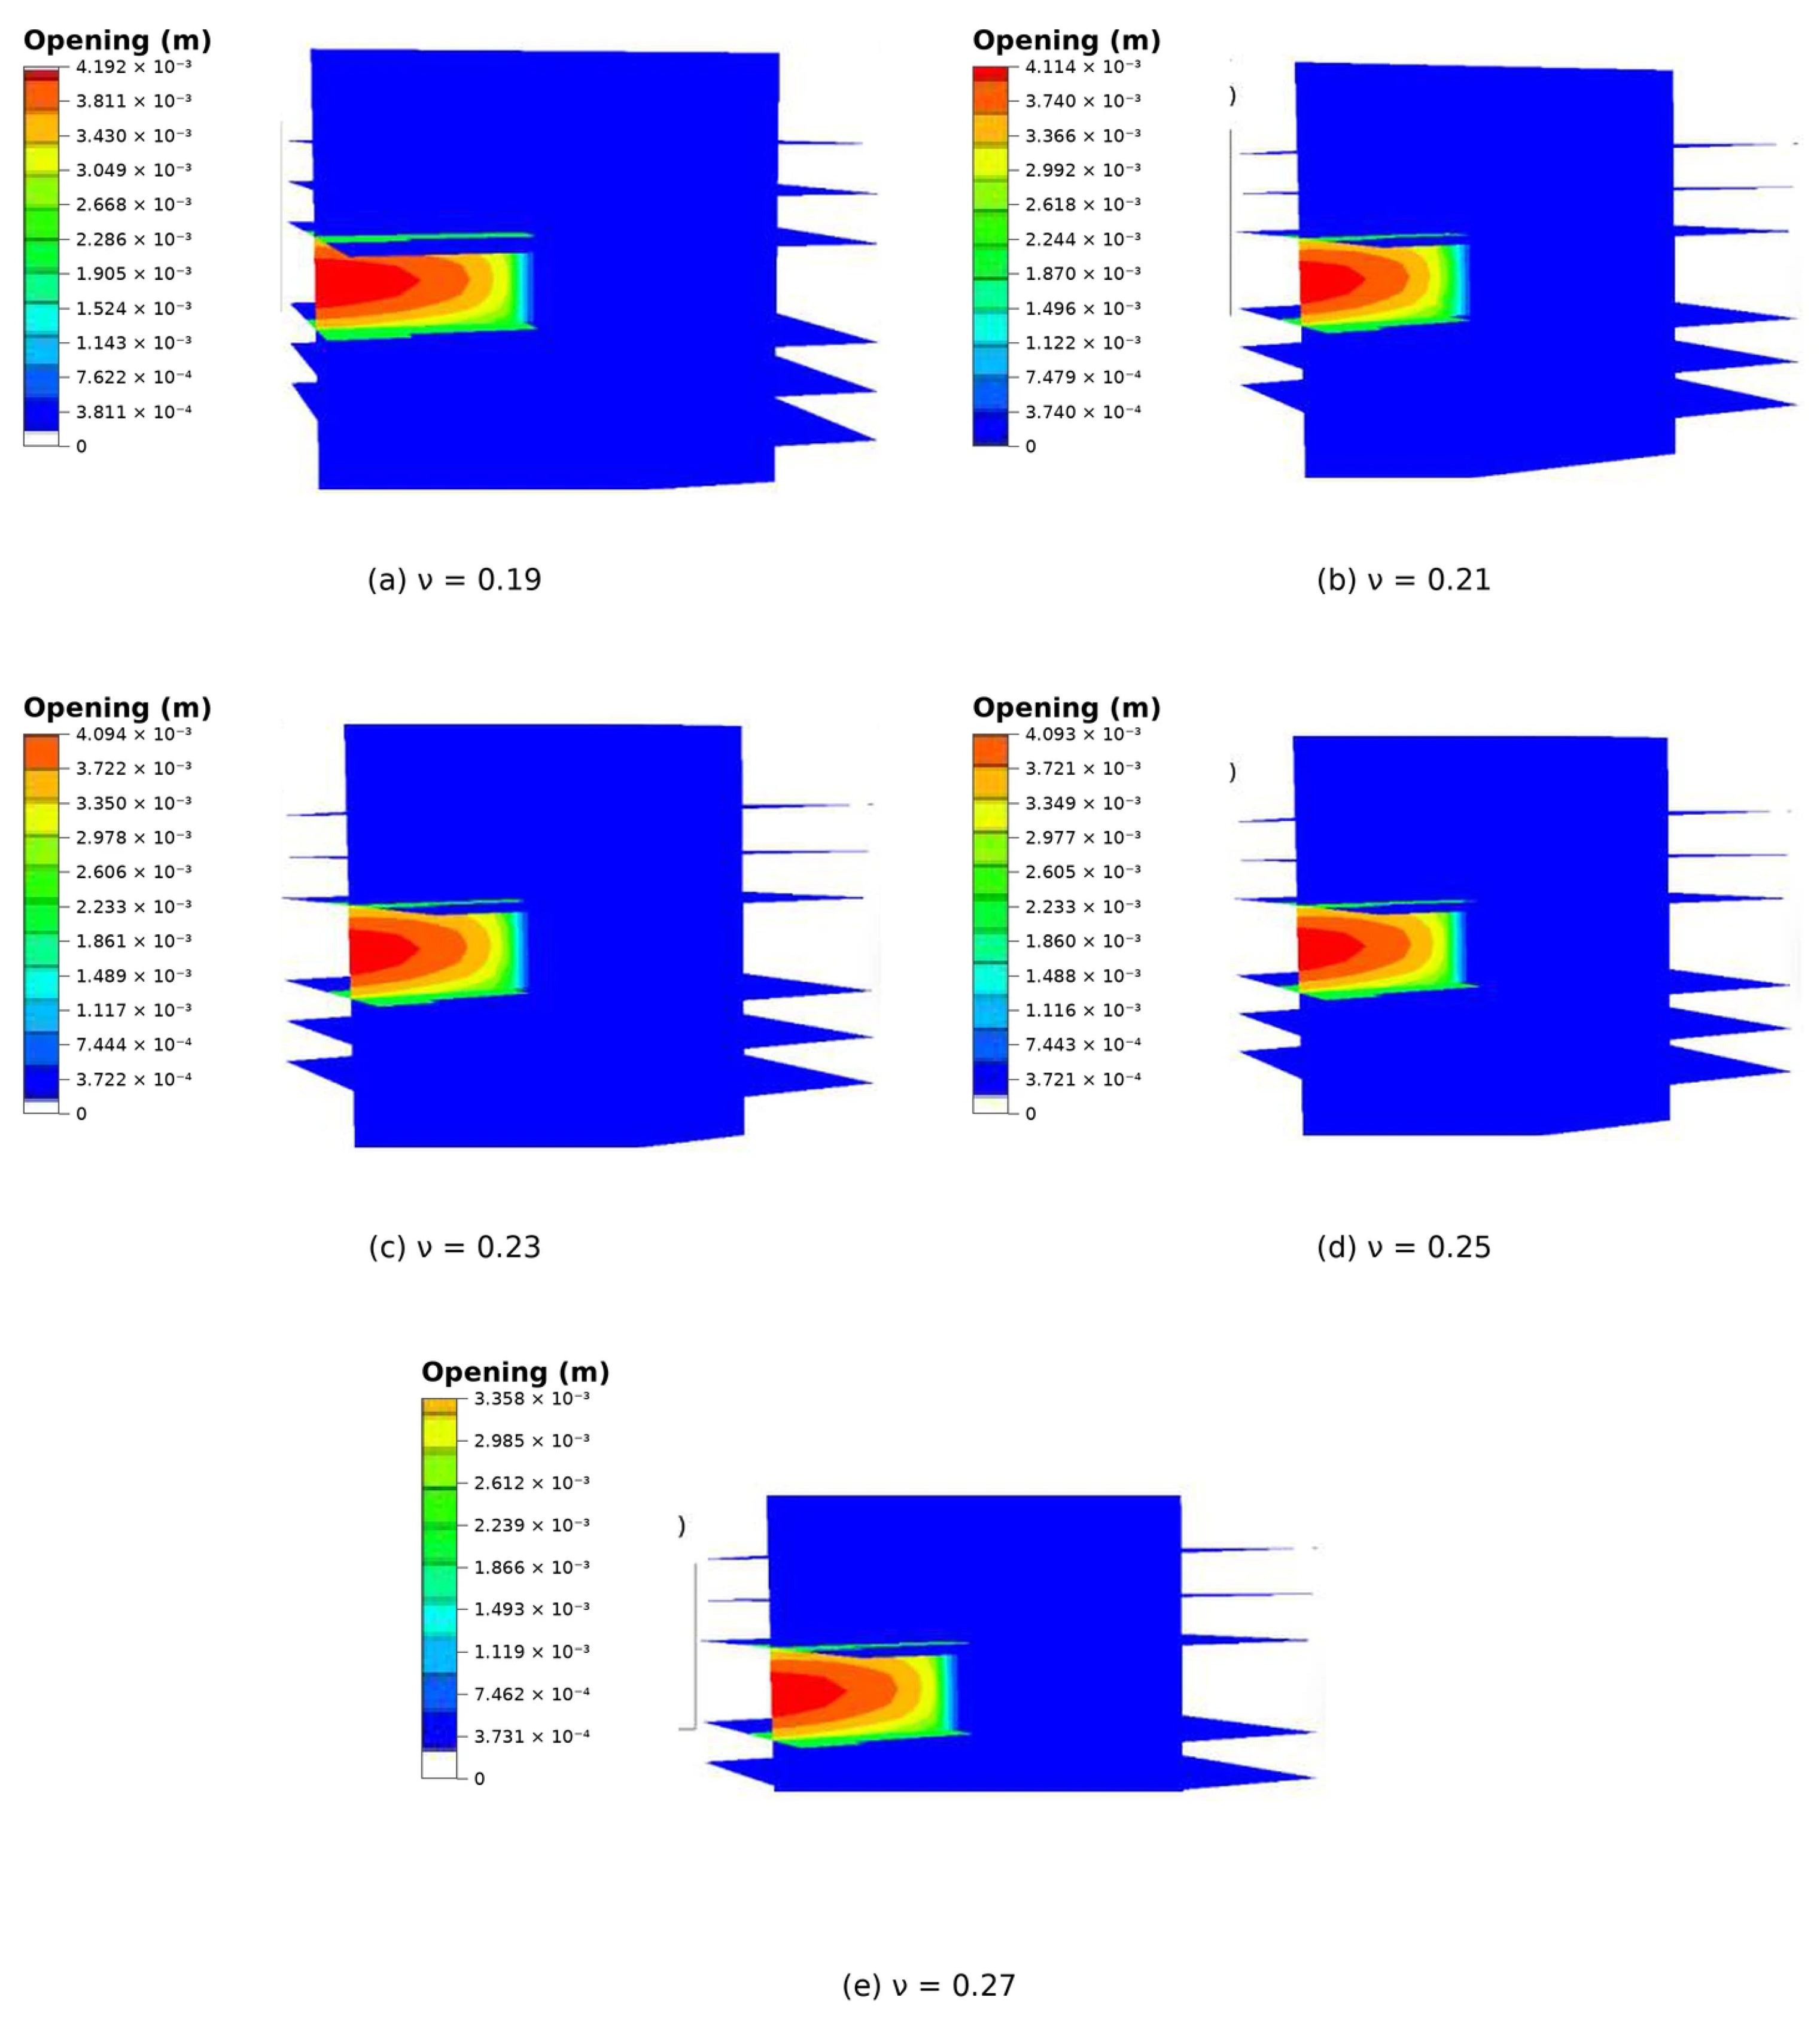
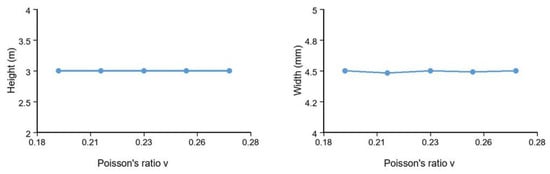
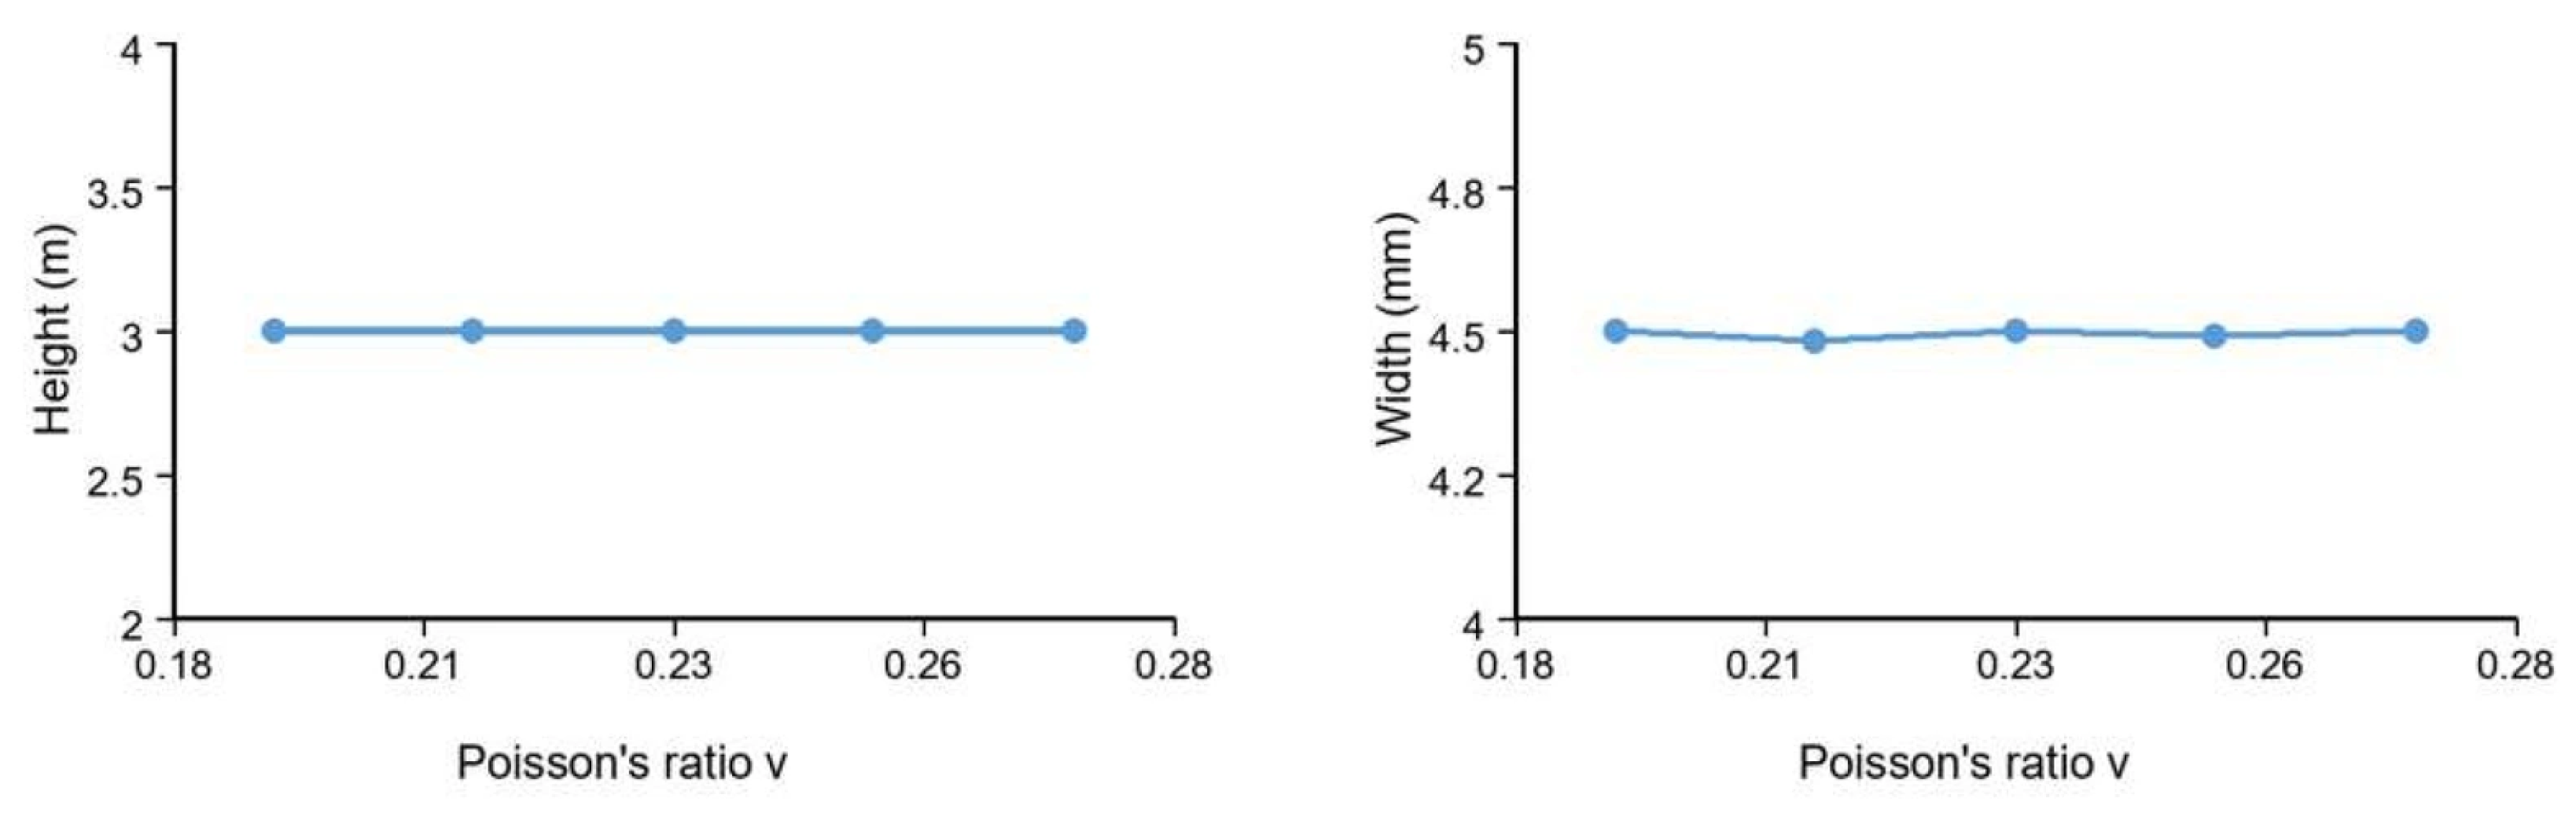
For Poisson’s ratios of 0.19, 0.21, 0.23, 0.25, and 0.27, fracture height remains close to 3.0 m and fracture width remains near 4.5 mm (Figure 6 and Figure 7). The opening patterns show capture at the first encountered bedding interface. The small width variations are minor relative to the overall response and are therefore not interpreted as a systematic Poisson-ratio effect within the investigated range.
Figure 6.
Fracture propagation opening contours under different Poisson’s ratios. Opening is displayed in meters; each panel retains its own color scale.
Figure 7.
Effects of Poisson’s ratio on fracture height and width. Approximate case-series values used for comparative trend analysis.
Poisson’s ratio affects lateral deformation compatibility, but the simulated interaction regime remains unchanged over the sampled range. The result therefore indicates limited sensitivity to Poisson’s ratio under the present model conditions.
3.4. Effect of Fracture Toughness
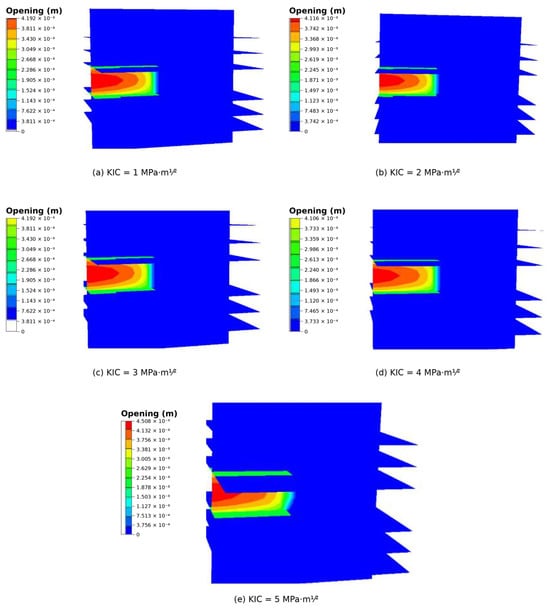
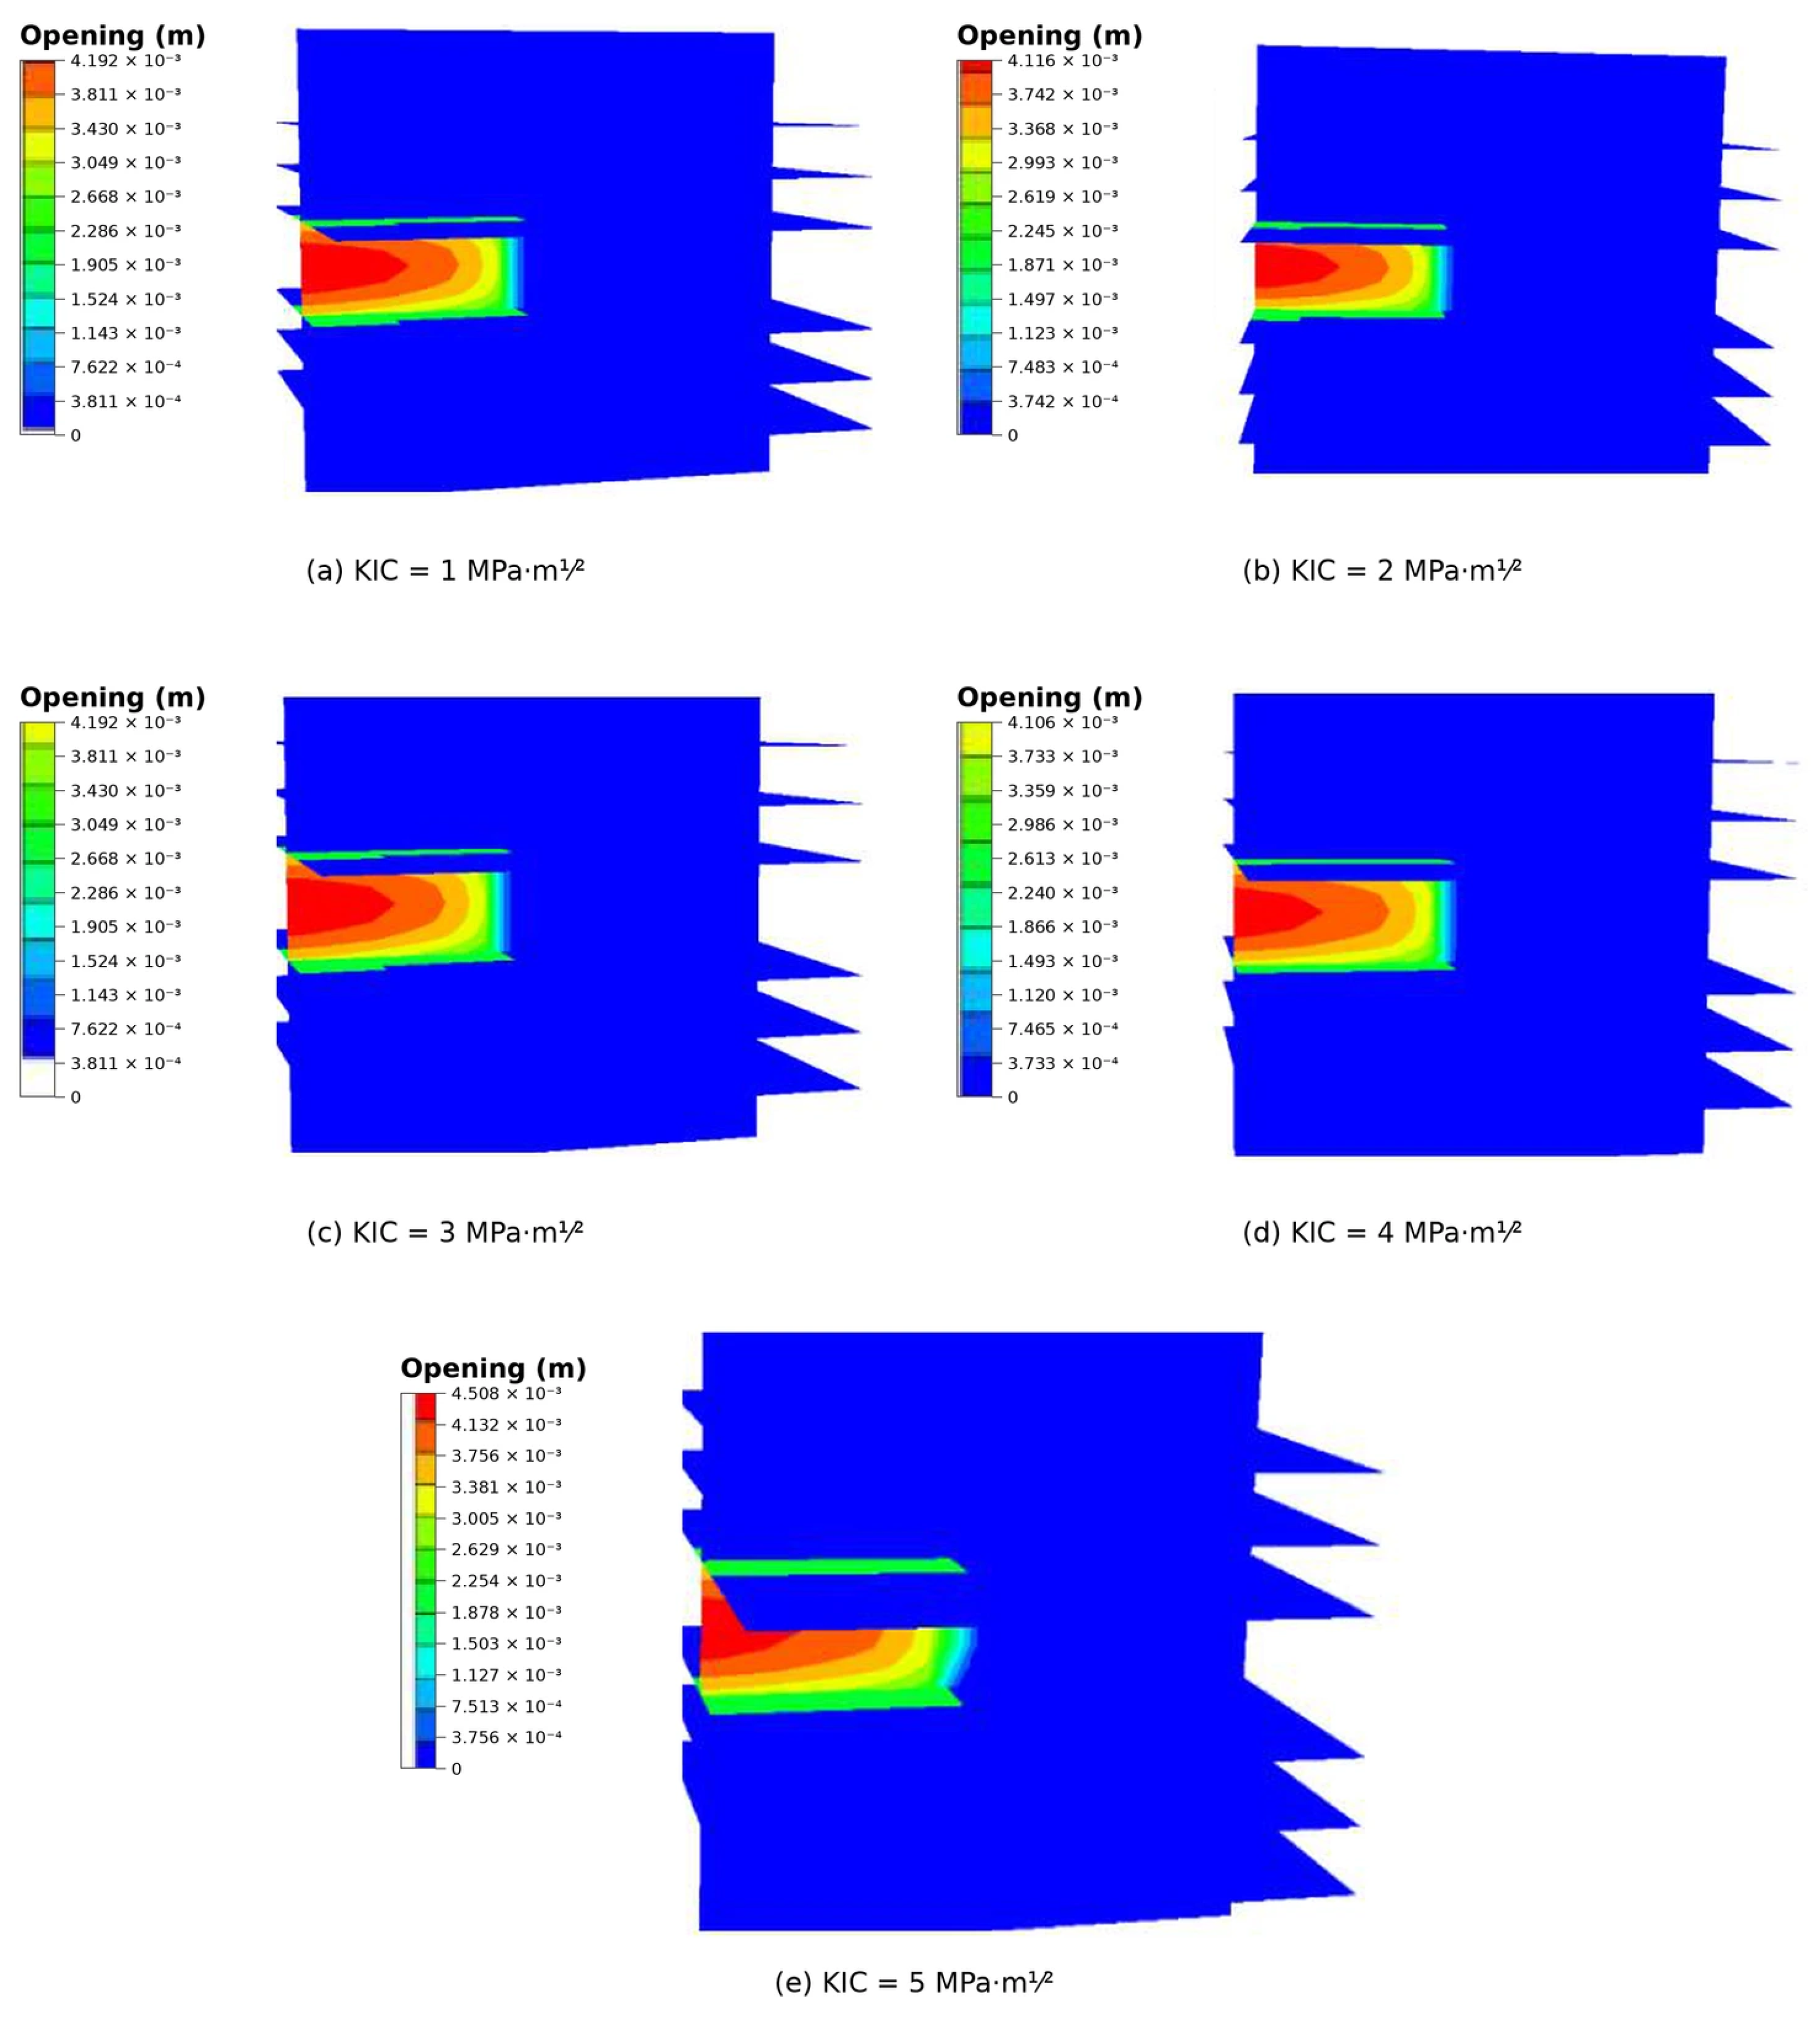
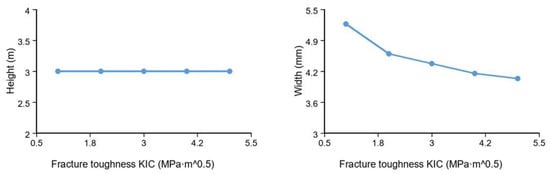
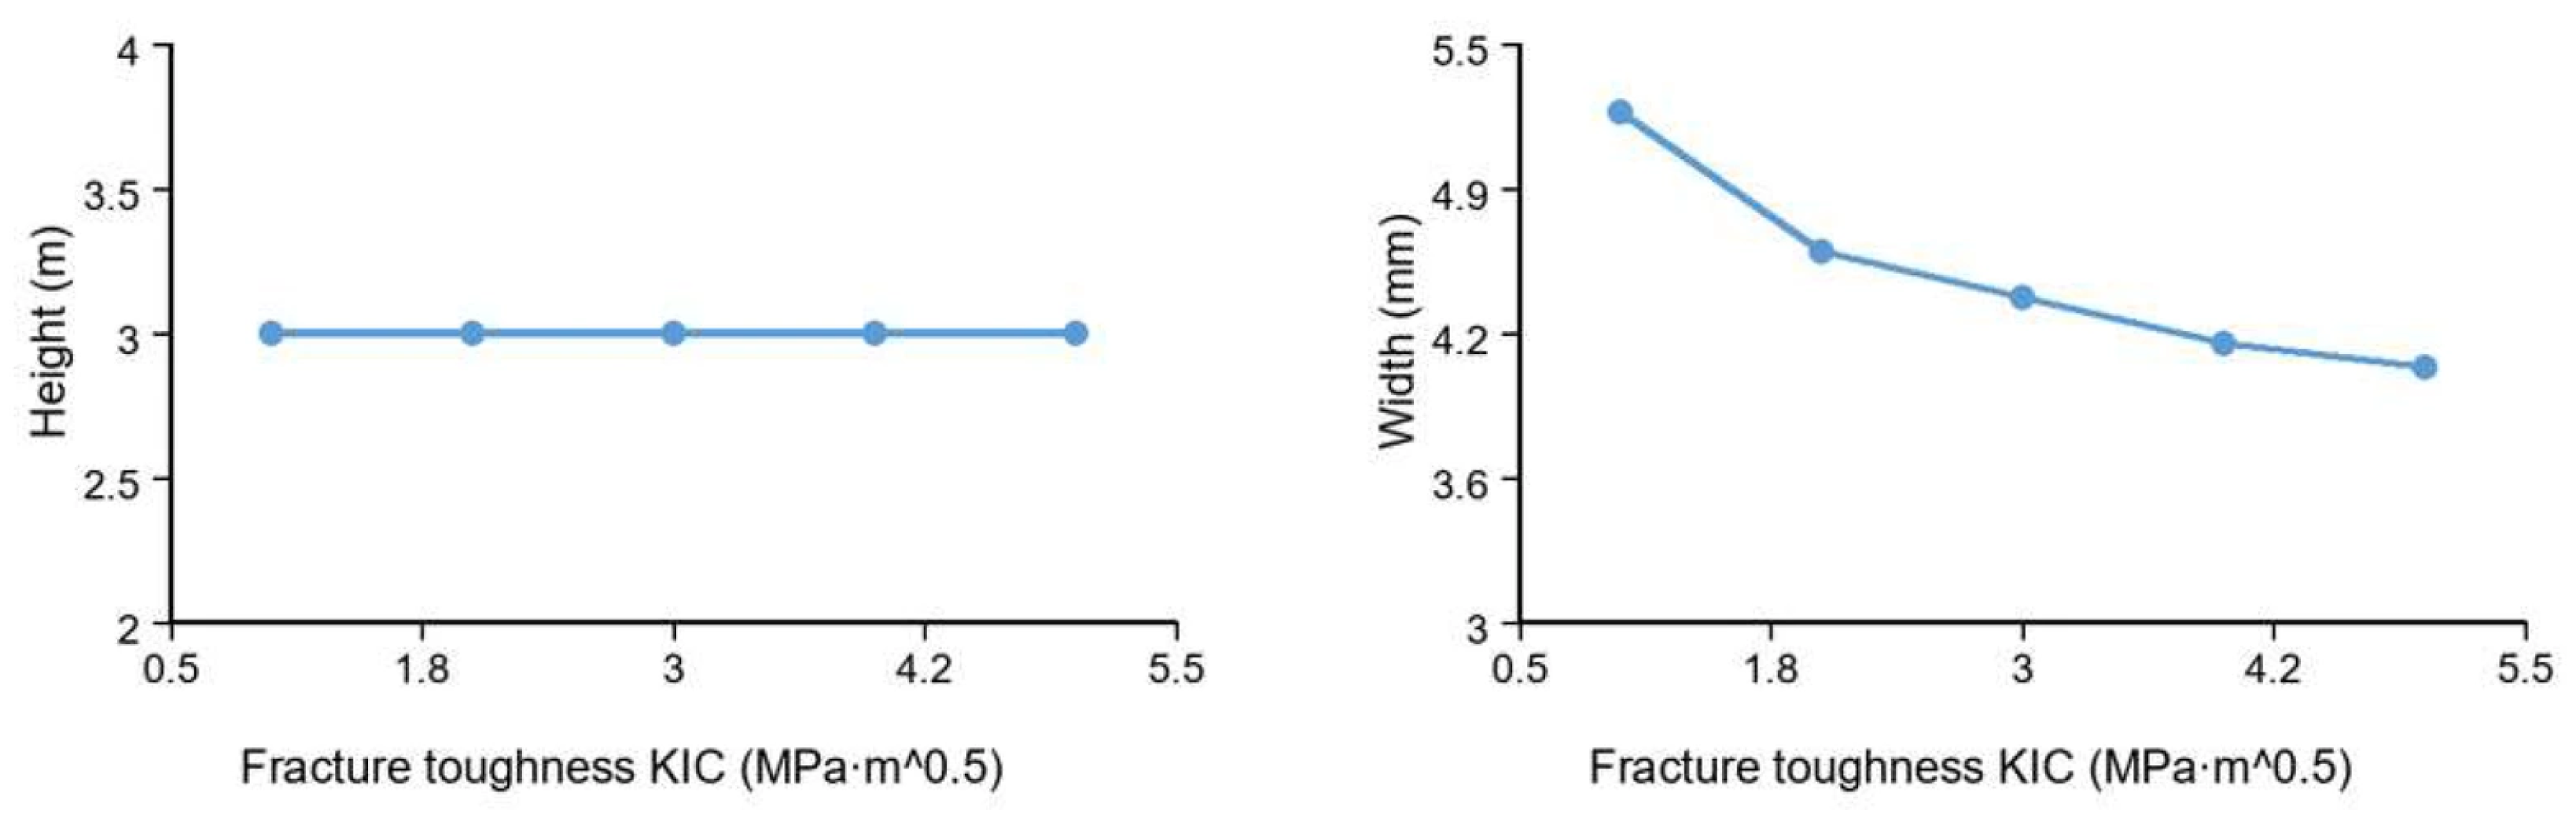
Matrix fracture toughness values of 1, 2, 3, 4, and 5 MPa·m1⁄2 were simulated. Fracture height remained about 3.0 m for all cases, indicating persistent capture by the bedding plane. Fracture width decreased from about 5.2 to 4.1 mm as toughness increased (Figure 8 and Figure 9). Higher matrix fracture toughness raises the energy required for new fracture propagation in the matrix but does not change the basic bedding-parallel growth mode. Figure 8 shows the fracture-propagation patterns at the different toughness levels, whereas Figure 9 summarizes the corresponding fracture-height and fracture-width trends.
Figure 8.
Fracture propagation opening contours under different fracture toughness values. Opening is displayed in meters; each panel retains its own color scale.
Figure 9.
Effects of fracture toughness on fracture height and width. Approximate case-series values used for comparative trend analysis.
Within the current comparative literature, matrix-toughness sweeps under otherwise similar weak-plane conditions remain limited. The present result is therefore discussed as a model-specific sensitivity trend rather than a general crossing criterion.
3.5. Effect of Fracturing-Fluid Viscosity
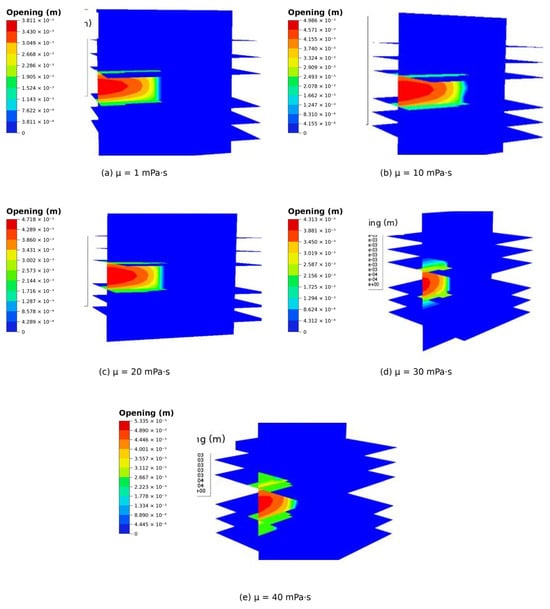
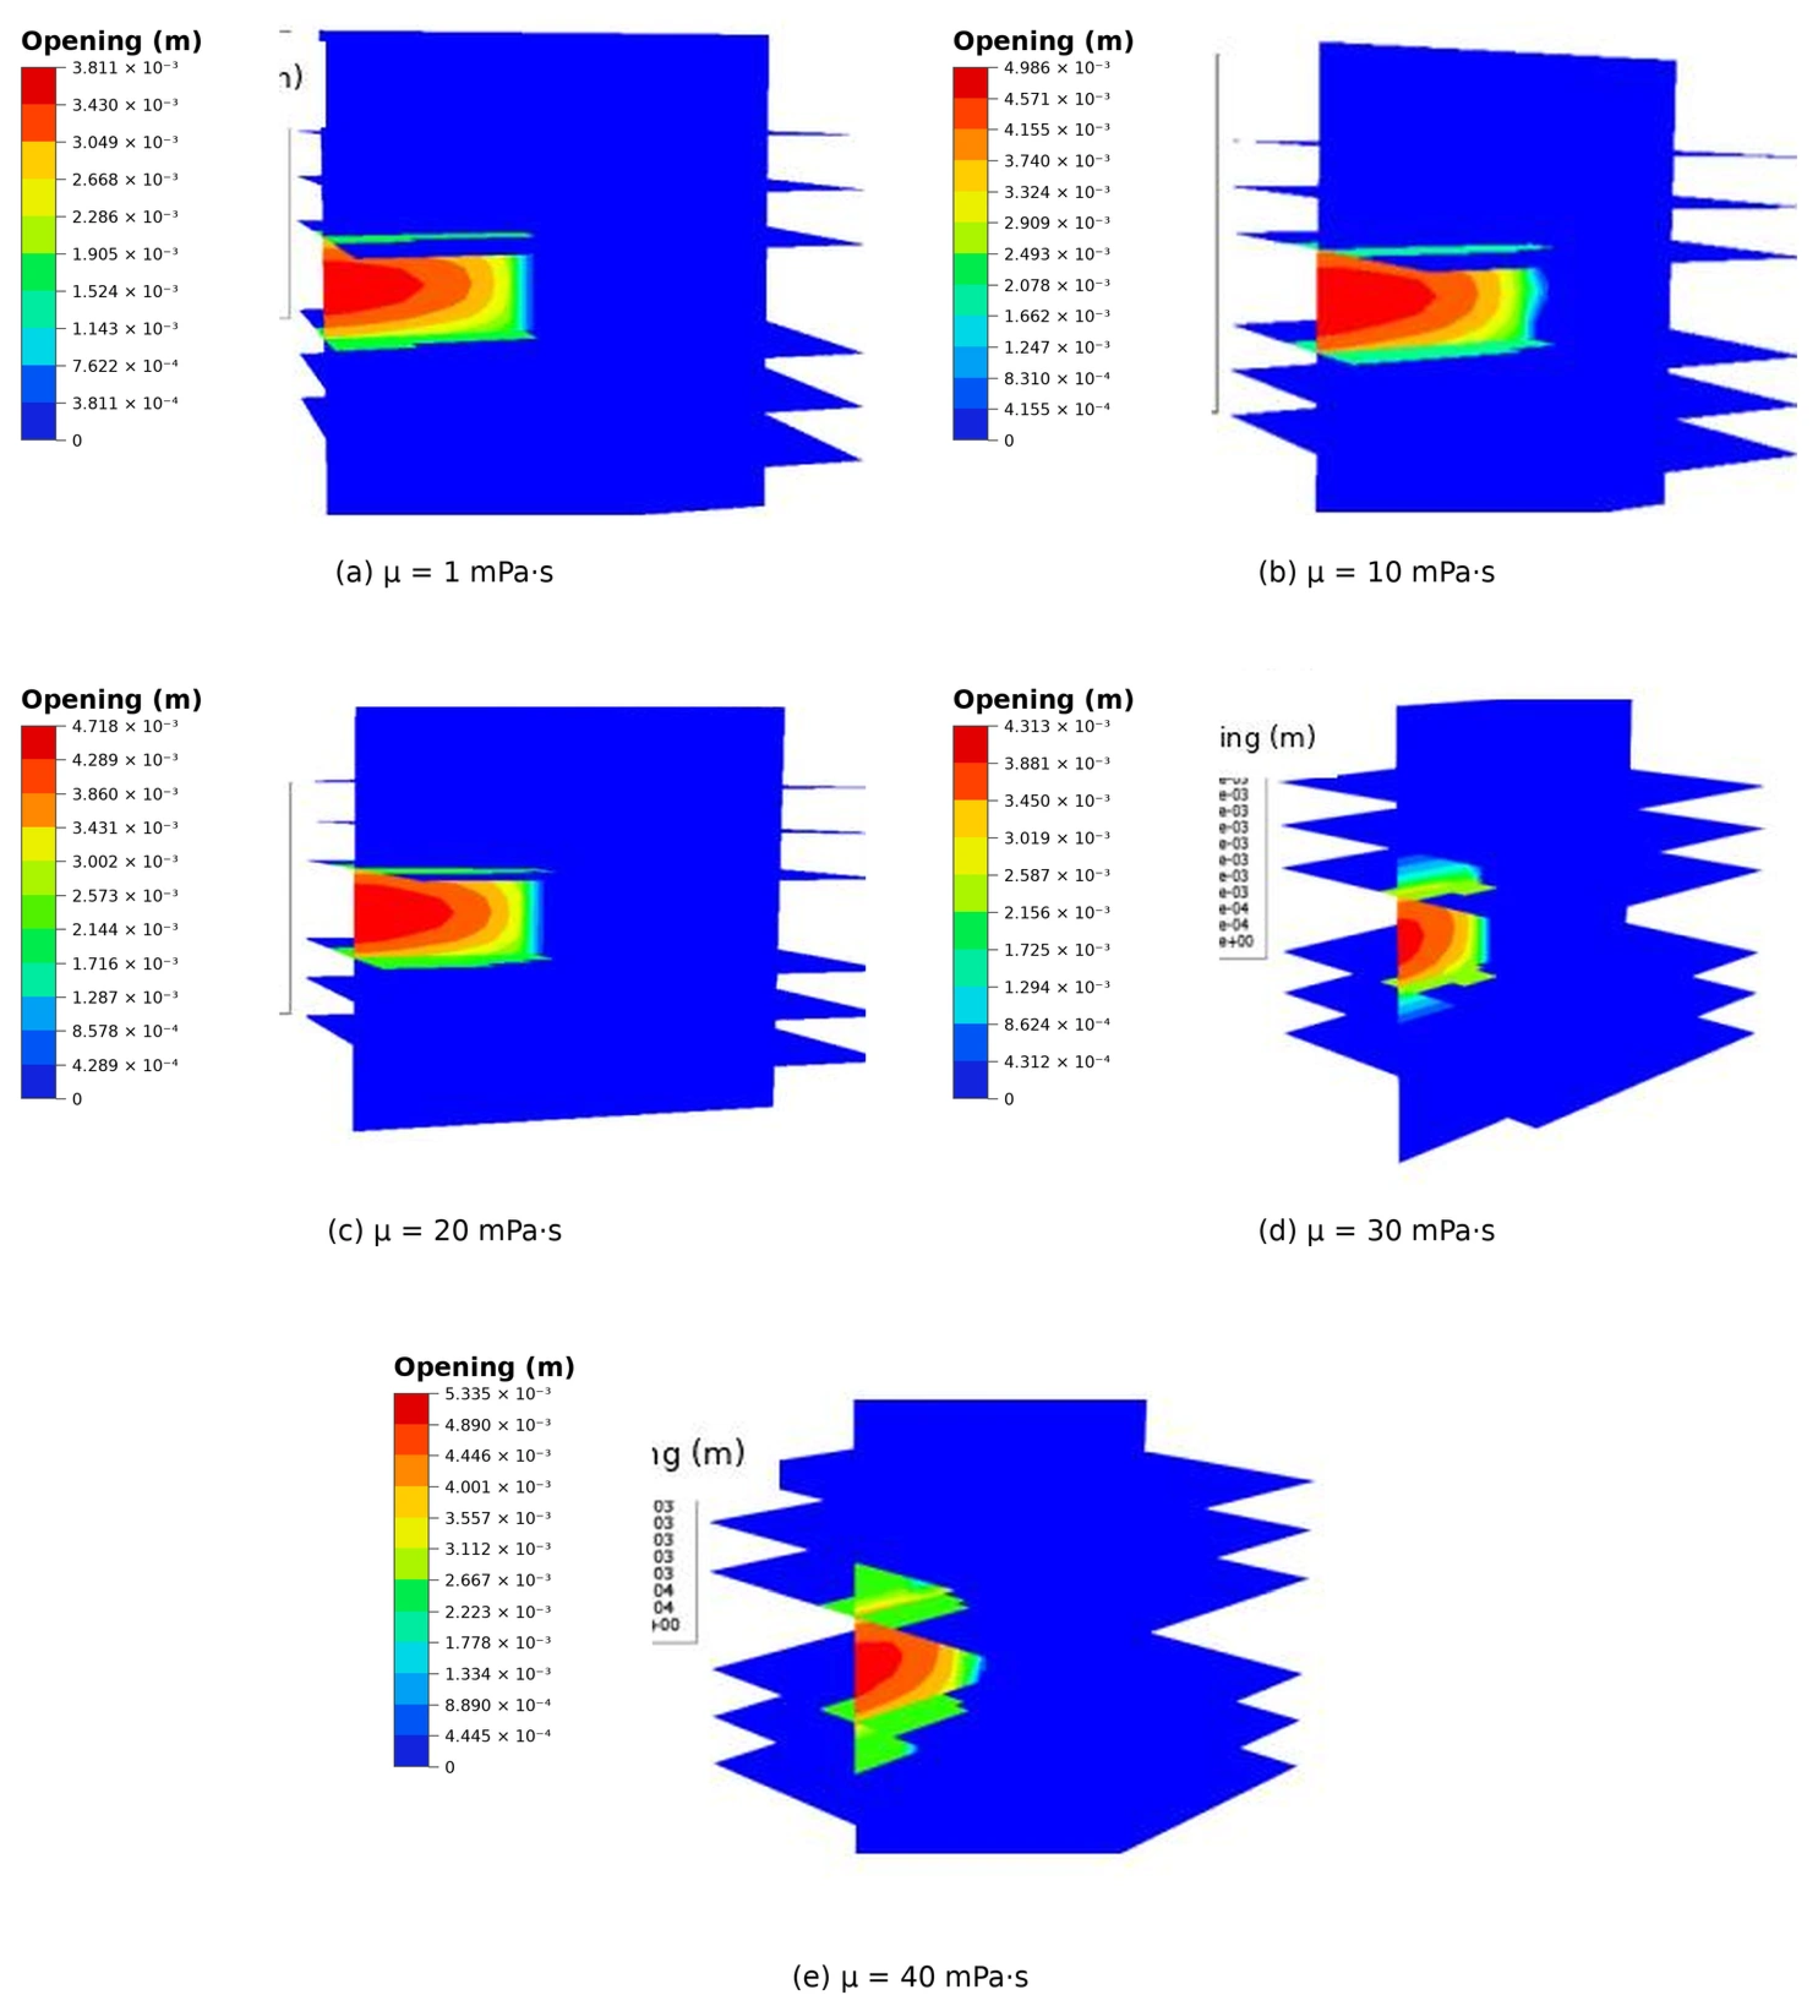
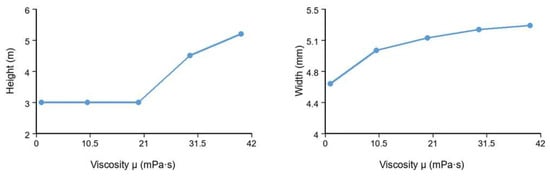
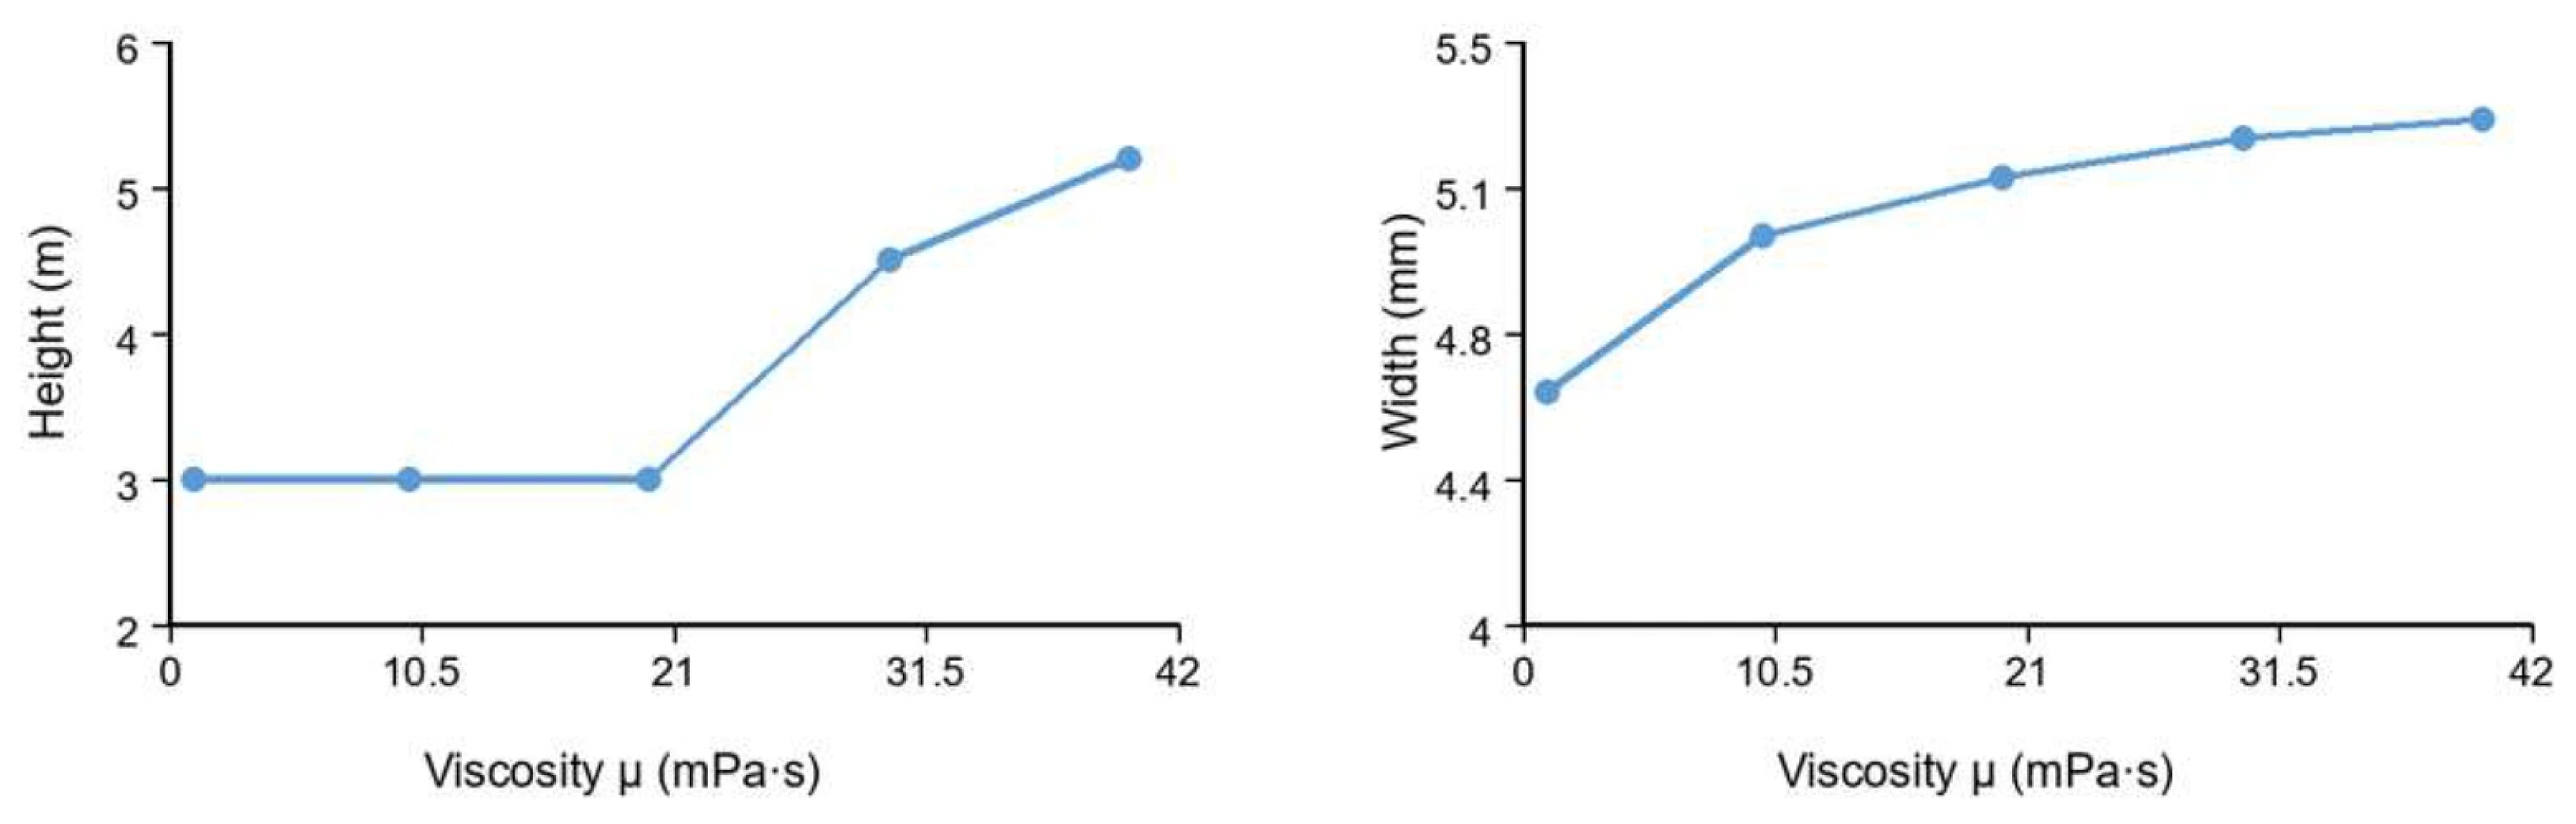
Fluid viscosities of 1, 10, 20, 30, and 40 mPa·s were examined under a stress difference of 1 MPa. At 1–20 mPa·s, fracture height was about 3.0 m, and the hydraulic fracture was captured by the bedding plane. When viscosity reached 30 mPa·s, the fracture began to penetrate across the weak plane and fracture height increased to about 4.5 m. At 40 mPa·s, height further increased to about 5.2 m. Fracture width increased from about 4.6 to 5.3 mm. The fracture-propagation patterns are shown in Figure 10, and the corresponding changes in fracture height and width are summarized in Figure 11.
Figure 10.
Fracture propagation opening contours under different fracturing-fluid viscosities. Opening is displayed in meters; each panel retains its own color scale.
Figure 11.
Effects of fracturing-fluid viscosity on fracture height and width. Approximate case-series values used for comparative trend analysis.
Higher viscosity is associated with greater fracture height and aperture in this series. A change in the competition between bedding-parallel diversion and continued propagation provides a plausible explanation for the observed transition. The first sampled case showing partial crossing occurs at 30 mPa·s after a non-crossing case at 20 mPa·s; accordingly, 30 mPa·s is treated as a sampled transition condition within the present model rather than as a universal threshold.
3.6. Effect of Injection Rate
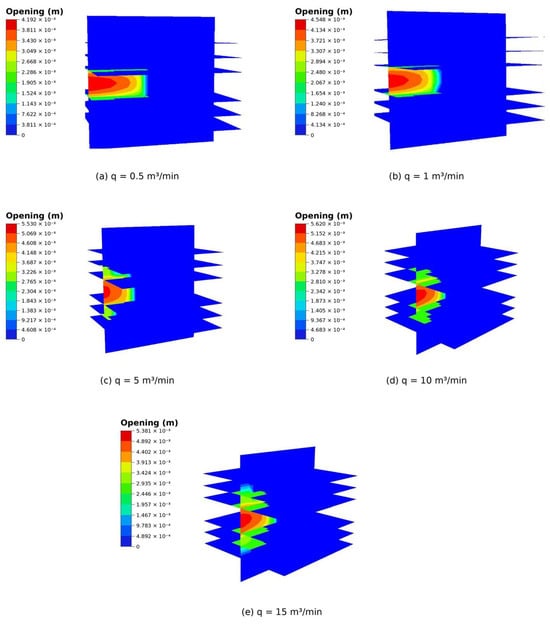
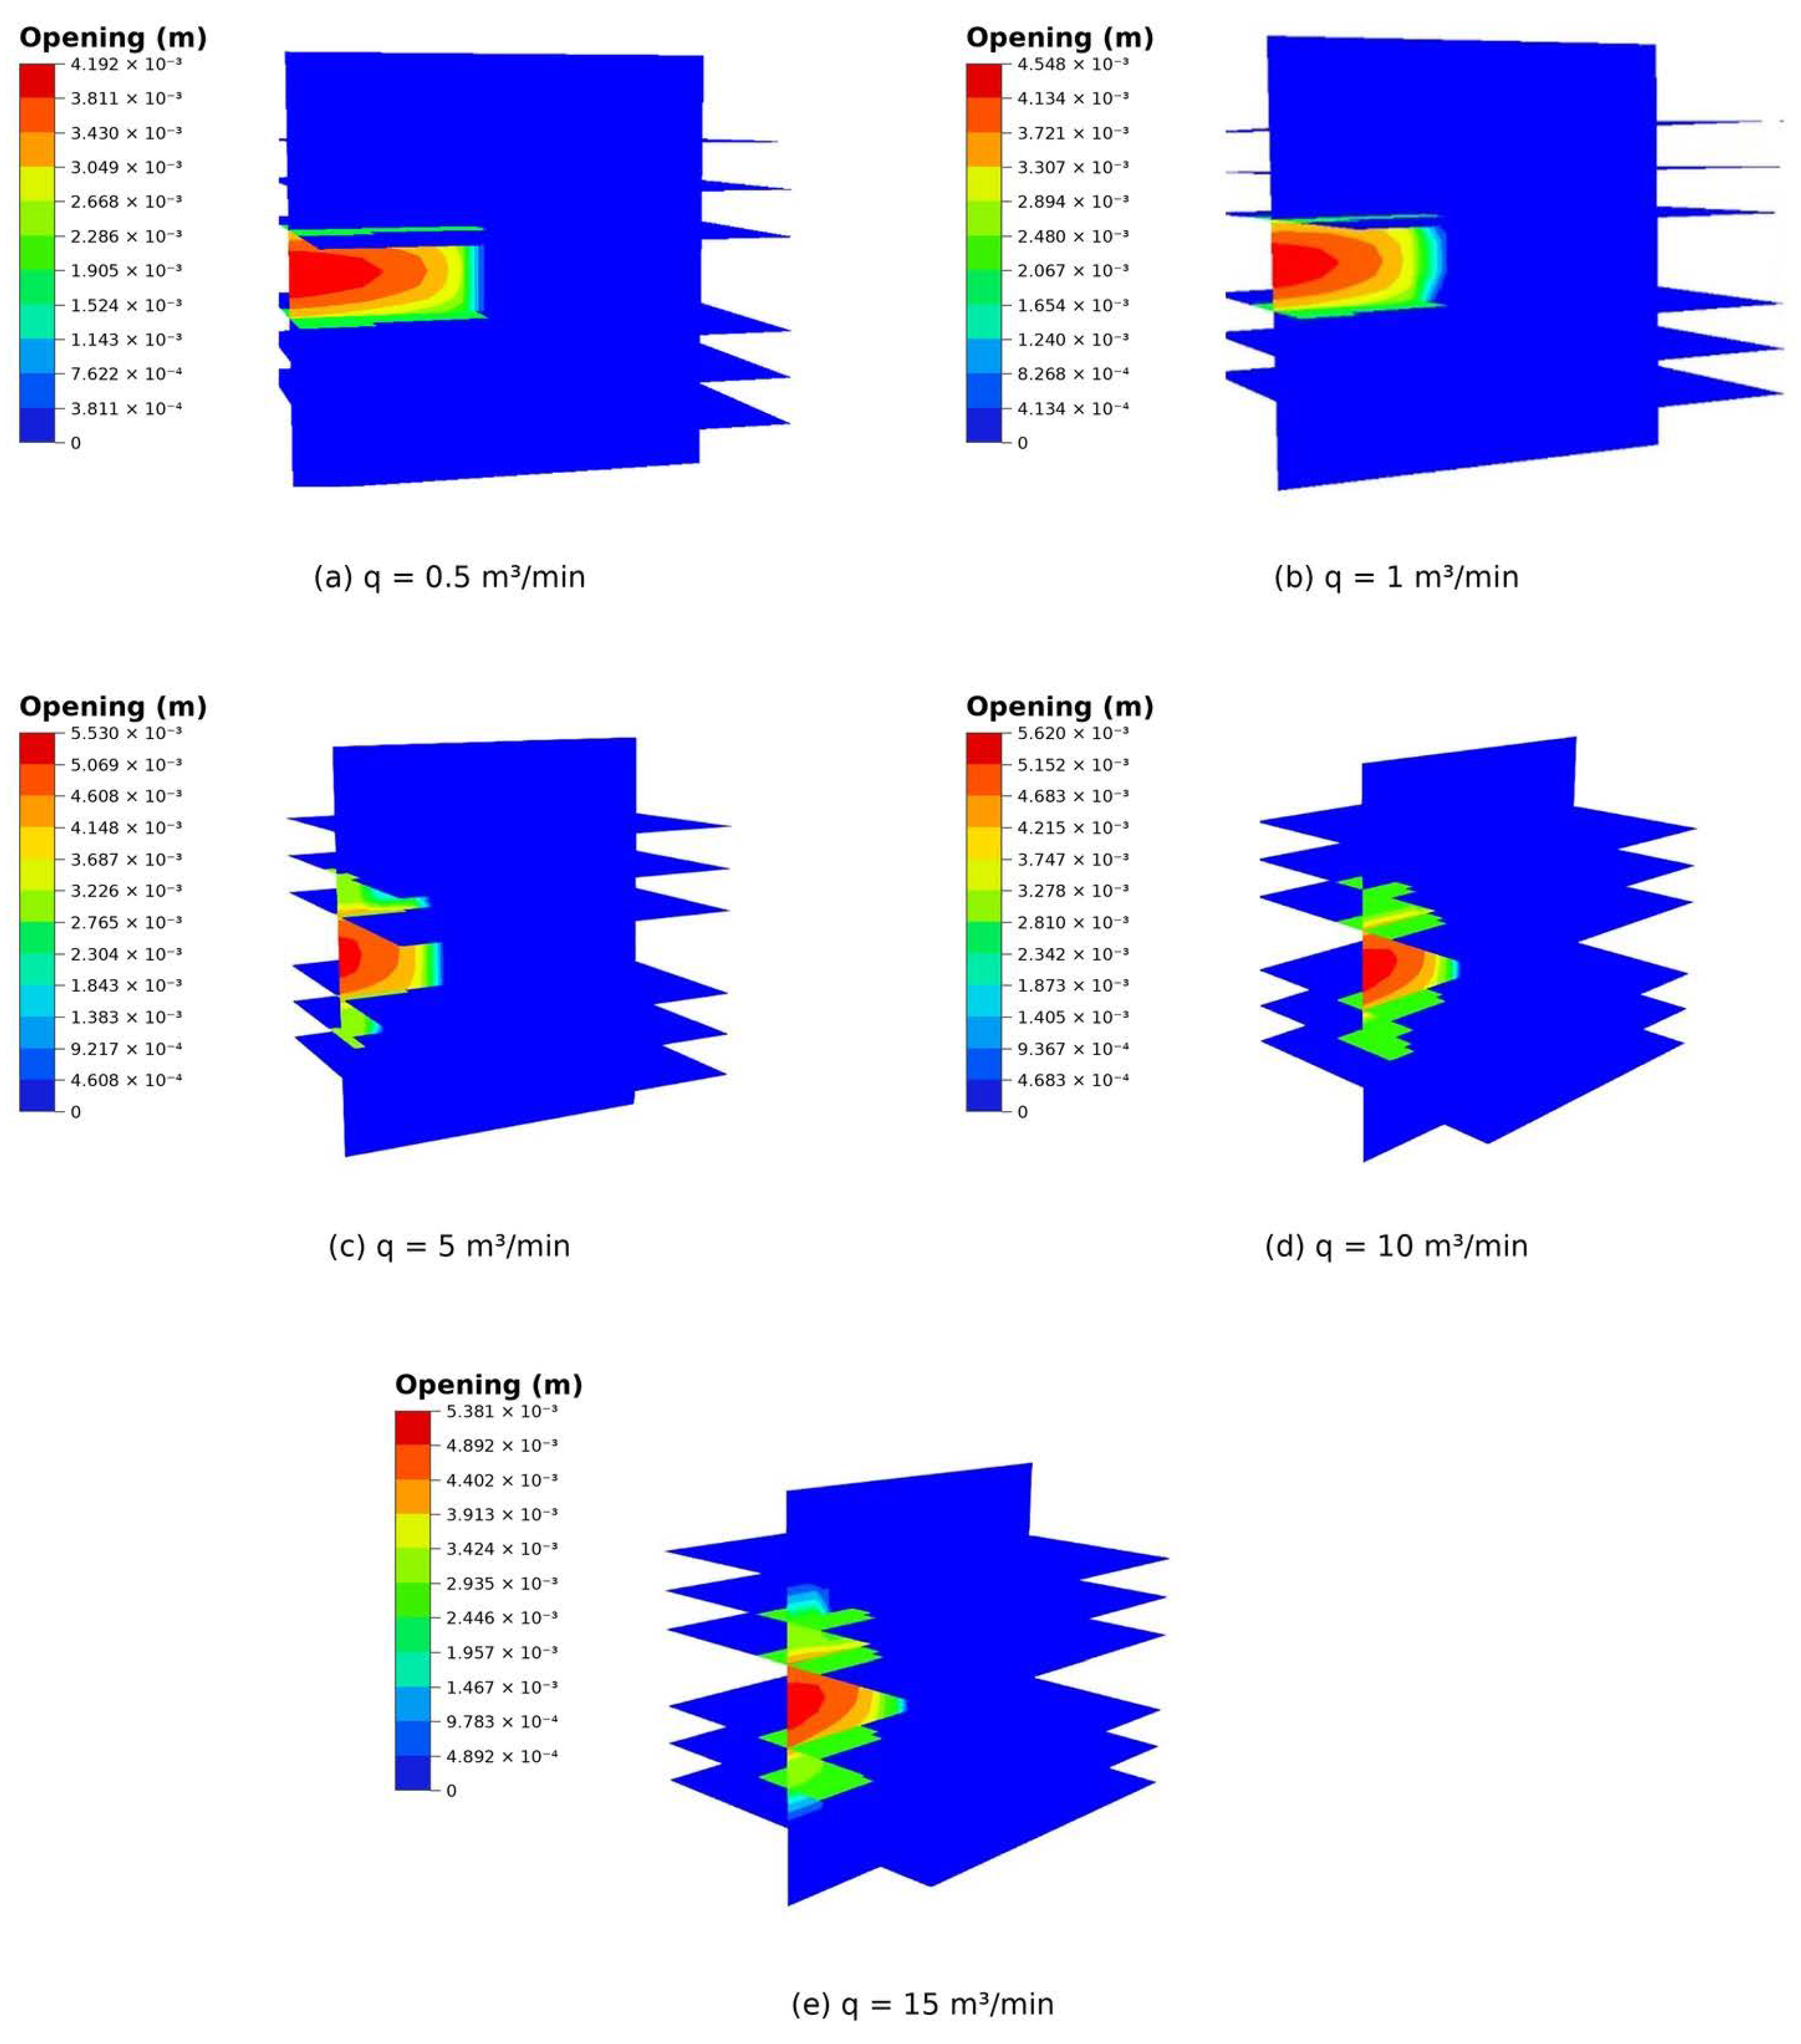
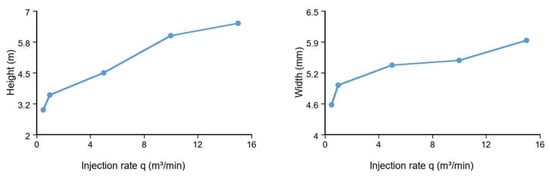
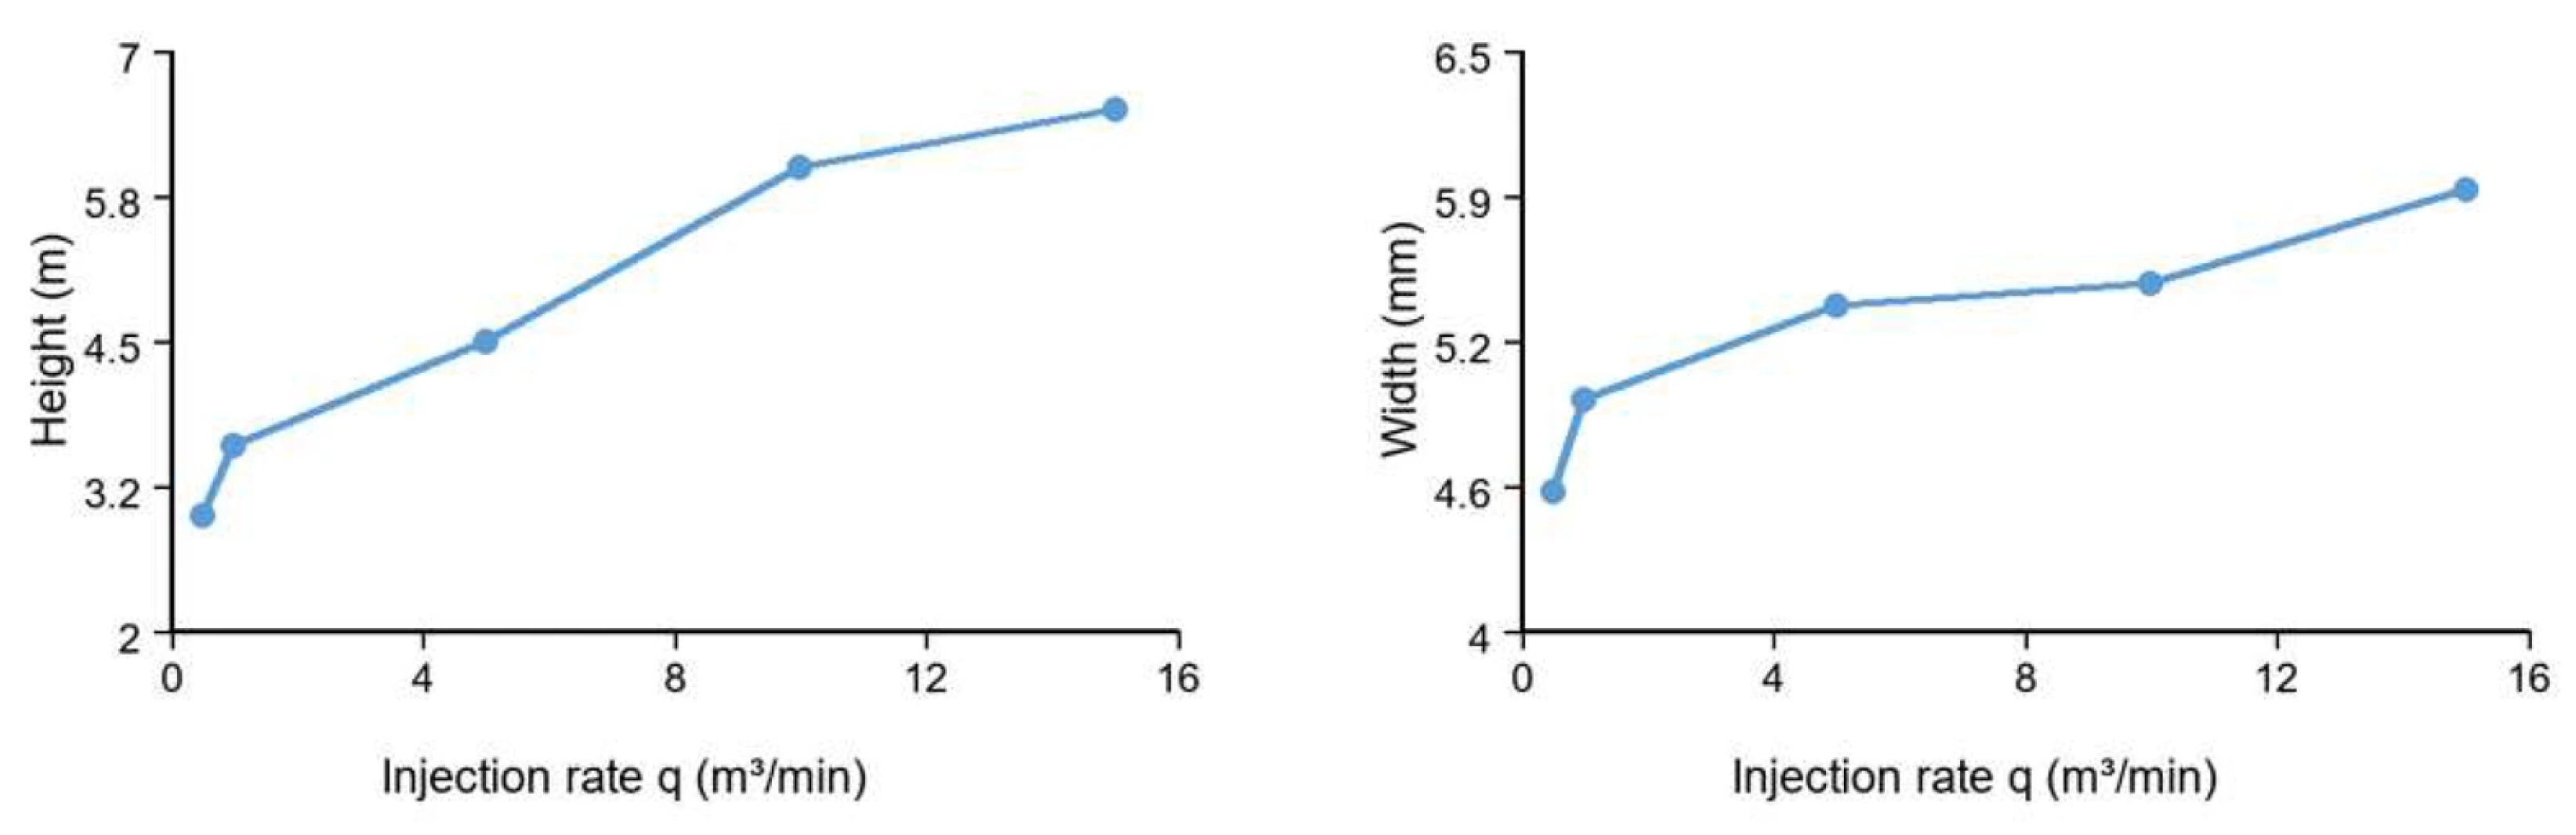
For injection rates of 0.5, 1, 5, 10, and 15 m3/min, the opening contours show progressively greater vertical extension with increasing rate (Figure 12). The corresponding fracture heights are approximately 3.0, 3.6, 4.5, 6.0, and 6.5 m, respectively, while the reported fracture width increases from approximately 4.6 to 5.9 mm (Figure 13). The rate series is interpreted as a sensitivity trend across the prescribed cases; separating pure rate effects from cumulative injected-volume effects would require fixed-time or fixed-volume normalization.
Figure 12.
Fracture propagation opening contours under different injection rates. Opening is displayed in meters; each panel retains its own color scale.
Figure 13.
Effects of injection rate on fracture height and width. Approximate case-series values used for comparative trend analysis.
A higher injection rate can sustain pressure during interface diversion and increase fracture opening, providing one mechanistic explanation for the observed geometry. The rate response is therefore interpreted as a coupled hydraulic effect that depends on interface properties, leakoff behavior, and pumping protocol.
3.7. Numerical-Resolution Considerations
The numerical-resolution assessment focuses on relative trends across the prescribed case series. Systematic convergence verification would further quantify the sensitivity of absolute fracture dimensions and transition points to mesh size, time integration, and domain treatment. The supporting XFEM models in Section 2.6 provide complementary information on spatial resolution and solver-control strategies.
3.8. Cross-Method Numerical Comparison with Independent Simulations
To assess whether the governing trends obtained from the present cohesive-zone formulation are specific to one numerical framework, the results were compared qualitatively with independent RFPA2D-Flow, FDEM, phase-field, block-DEM, and CDEM studies [31,32,33,34,35,36,37,38]. The comparison is intended to evaluate consistency in weak-plane interaction regimes and the direction of parameter effects across methods with different geometries, scales, and constitutive representations. The main cross-method comparisons are summarized in Table 3.
Table 3.
Cross-method comparison of weak-plane-interaction mechanisms and directional parameter trends.
3.8.1. Comparison of Weak-Plane-Interaction Mechanisms
Opening and fracture-path deflection are the primary indicators of weak-plane activation in this study. Independent FDEM and phase-field studies that explicitly represent interface slippage report related arrest or diversion behavior [33,34]. Together, these results support a consistent mechanism-level interpretation of interface-controlled fracture diversion across different numerical formulations.
3.8.2. Comparison of Weak-Plane Angle and Differential-Stress Effects
The auxiliary angle series can be compared with the RFPA interaction maps of Men and co-workers [31,32]. At Δσ = 2 MPa, the present simulations show strong capture/diversion at 15–30°, mixed behavior at 45–60°, and crossing-dominated responses at 75–90°. The RFPA studies show the same overall direction of transition as angle and differential stress increase, but the exact regime boundaries differ. Because the present auxiliary model contains two interacting initiation points and different interface properties and geometry, the comparison is restricted to the direction of the regime transition. Likewise, the present increase in fracture height from about 3.0 to 7.2 m as Δσ increases from 1 to 5 MPa is qualitatively consistent with studies in which higher differential stress increases crossing tendency [31,32,34].
3.8.3. Comparison of Mechanical and Operational Parameter Trends
The remaining trends show varying levels of agreement with published calculations, although direct like-for-like comparisons are limited by differences in parameter definitions and model configurations. In particular, the RFPA study varies bedding stiffness [35], whereas the present sweep changes matrix elastic modulus. Published block-DEM and CDEM studies report cases in which higher viscosity or injection rate promotes penetration [37,38], while phase-field results show that interface permeability and cementation can alter the rate response [34]. These comparisons support trend-level interpretation while emphasizing the dependence of transition behavior on the underlying model configuration.
3.8.4. Field-Scale Qualitative Comparison with Microseismic Observations
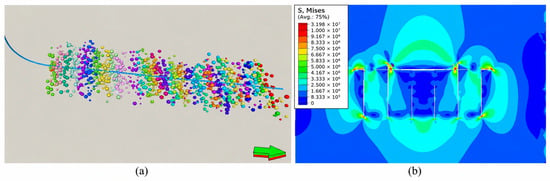
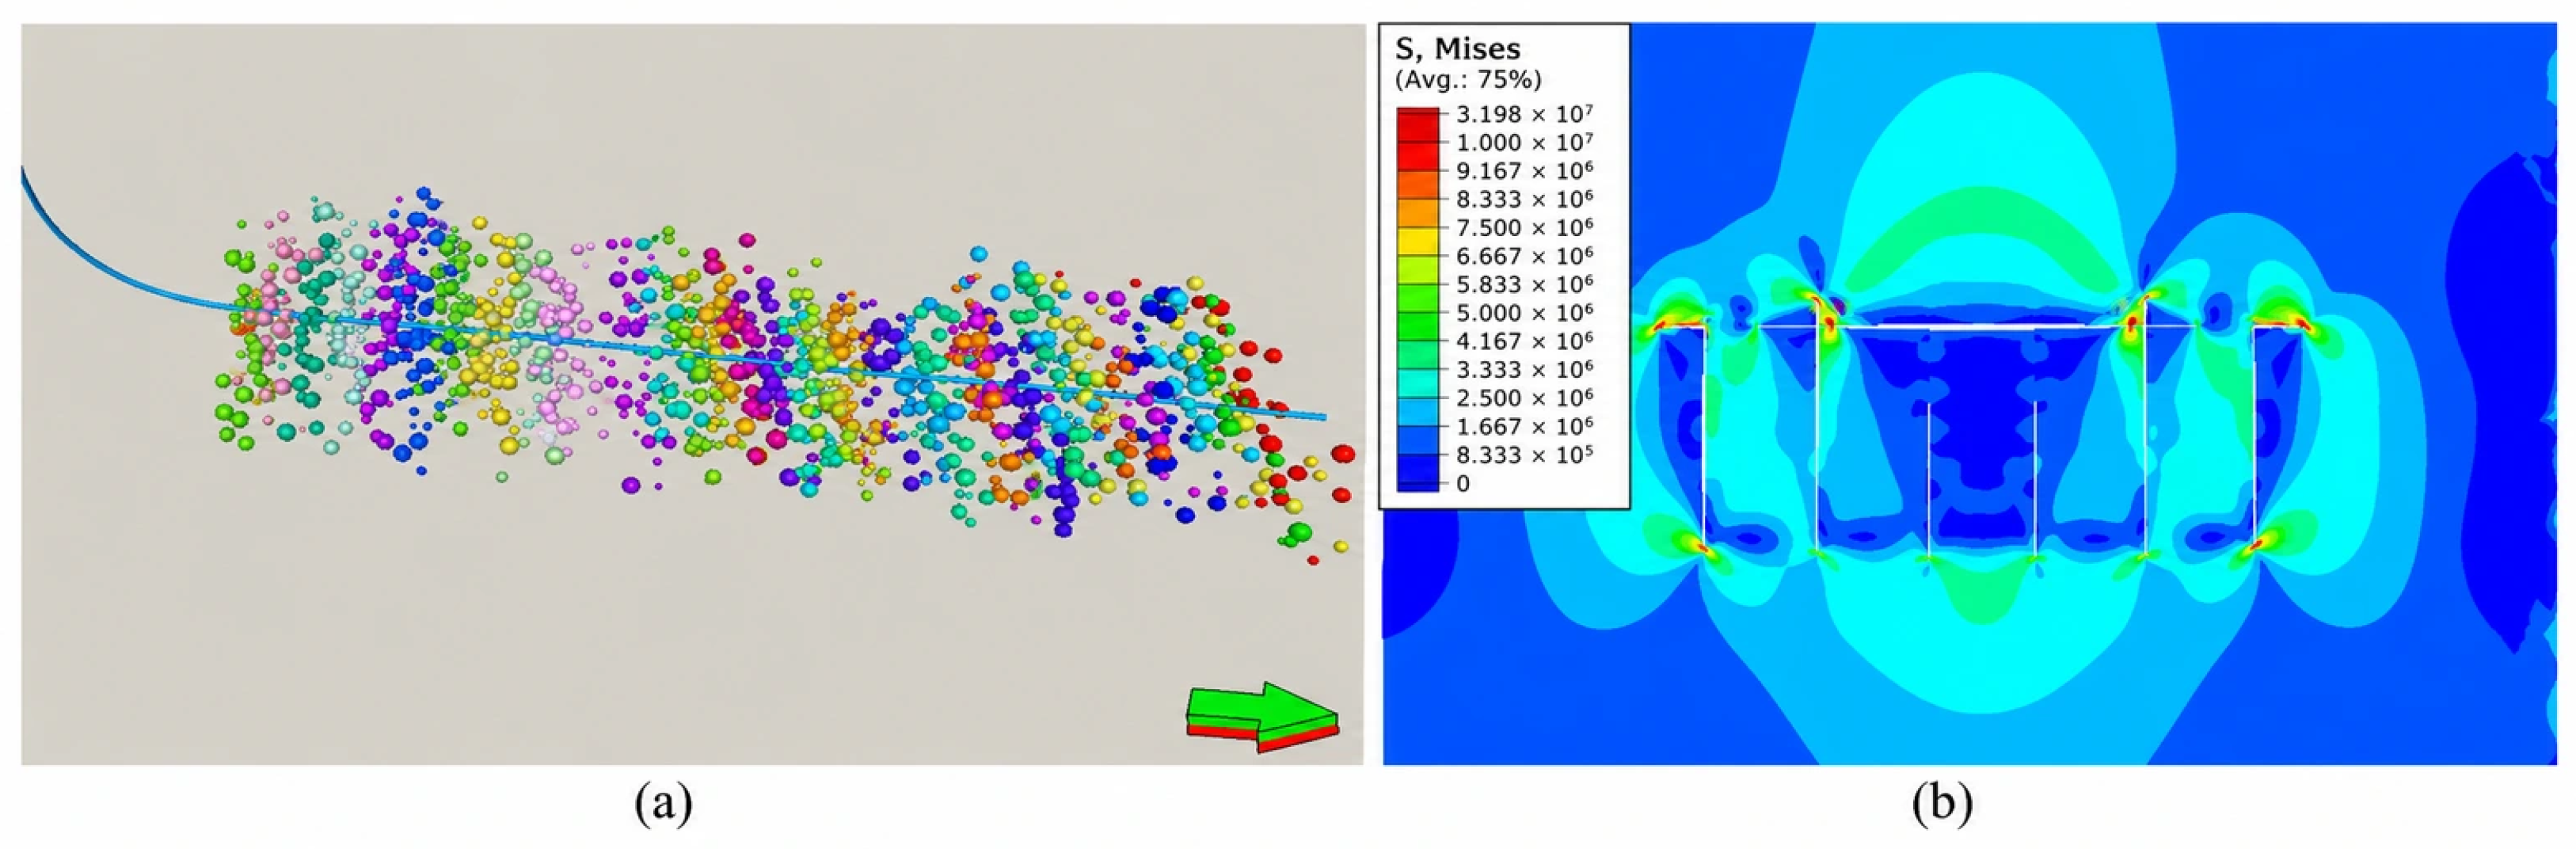
To further examine whether the non-uniform fracture-growth behavior identified in the numerical analyses is consistent with field-scale observations, a qualitative comparison was conducted using microseismic monitoring data from the Guyeyouping-1 horizontal well in the Gulong shale-oil reservoir. The horizontal section is approximately 1562 m long and was hydraulically fractured in 35 stages comprising 138 clusters, with an average cluster spacing of approximately 10 m. The treatment used a total fluid volume of approximately 82,673 m3 and approximately 3063 m3 of proppant.
Microseismic interpretation indicates that the stimulated fractures are predominantly vertical and exhibit pronounced spatial asymmetry. The interpreted full fracture lengths range from approximately 222 to 470 m, with an average value of approximately 365 m. In addition, the average difference between the two fracture-wing lengths is approximately 50 m, indicating that fracture development at the field scale is not strictly symmetric.
A six-cluster numerical model constructed for the corresponding well interval also exhibits non-uniform fracture development. The outer fractures show relatively greater extension and wider affected regions, whereas the growth of the interior fractures is comparatively restricted. As shown in Figure 14, this qualitative pattern is consistent with the asymmetric fracture distribution inferred from the microseismic observations and supports the interpretation that stress interaction among neighboring fractures can lead to heterogeneous fracture growth within a multi-fracture system.
Figure 14.
Field-scale qualitative comparison for the Guyeyouping-1 horizontal well: (a) microseismic event distribution interpreted from the hydraulic-fracturing treatment and (b) simulated S, Mises stress-field response associated with the six-cluster fracture system. The microseismic interpretation indicates asymmetric fracture development, with interpreted full fracture lengths of approximately 222–470 m and an average left–right wing-length difference of approximately 50 m. The numerical model likewise exhibits non-uniform development, with greater extension of the outer fractures and restricted growth of the interior fractures. Together, the two datasets highlight consistent spatial asymmetry in multi-fracture growth.
Because the field case differs from the primary model in geometric scale, completion configuration, boundary conditions, and diagnostic variables, the comparison is used to assess qualitative consistency in asymmetric fracture development. Figure 14b presents the simulated S, Mises stress-field response, whereas Figure 14a shows the microseismic event distribution; agreement is therefore evaluated at the level of spatial asymmetry and non-uniform fracture growth across the multi-fracture system.
3.9. Mechanistic Synthesis and Scope of the Weak-Plane-Activation Interpretation
A plausible interpretation of the simulation patterns is that an approaching hydraulic fracture accesses a weak interface, followed by opening and bedding-parallel propagation. Effective stress and cohesive degradation provide the mechanical basis for this diversion, while redistribution of pressure, flow, and energy influences vertical growth and the response of neighboring initiation points. The analysis therefore links opening and path evolution with the broader coupled hydromechanical mechanisms that govern weak-plane interaction.
Within the single-factor cases, larger Δσ, viscosity, and injection rate are associated with greater fracture height, whereas the elastic-property and matrix-toughness sweeps retain an interface-dominated propagation pattern. These observations are specific to the investigated parameter ranges. Supporting XFEM analyses further show that the viscosity-related stress response varies with pore-pressure and confining-pressure conditions, reinforcing the interaction-dependent nature of one-at-a-time sensitivity trends.
4. Engineering Implications, Applicability, and Limitations
4.1. Optimize Weak-Plane Geometry and Target Interval
The simulations indicate that low-angle weak planes are more susceptible to early capture/diversion under the modeled conditions. Geological and image-log characterization can therefore be used to identify intervals where such interfaces are strongly developed. These results support a site-specific completion strategy because crossing depends jointly on stress state, interface strength, permeability, and pumping conditions. Perforation interval, azimuth, and cluster position should therefore be evaluated together with local geomechanical calibration.
In the 50 m × 50 m auxiliary model, the 15° case gives approximate fracture heights of 32 m at the left-side initiation point (Injection Point 1) and 20 m at the right-side initiation point (Injection Point 2). At larger interaction angles, the two responses generally become more comparable, although the detailed trend remains asymmetric. These results identify a local asymmetry mechanism associated with low-angle weak-plane capture. The auxiliary model isolates local fracture interaction rather than wellbore/perforation hydraulics, and the angle-dependent responses are therefore used to interpret local interaction trends. The results are summarized in Figure 15.
Figure 15.
Fracture height as a function of natural-fracture angle in the independent 50 m × 50 m CPE4P/COH2D4P auxiliary model: (a) Injection Point 1 (left-side initiation point) and (b) Injection Point 2 (right-side initiation point). At 15°, the reported heights are approximately 32 and 20 m, respectively. The series is interpreted as a relative angle-sensitivity analysis within the auxiliary model.
4.2. Maintain Cross-Layer Driving Pressure Without Blindly Increasing Parameters
Differential stress is primarily a geological constraint, whereas viscosity and injection rate are operational variables. The first sampled crossing case in the viscosity series occurs at 30 mPa·s after a non-crossing case at 20 mPa·s; this value is therefore treated as a sampled transition condition rather than a field-design threshold. Quantitative design application would benefit from comparisons at fixed pumping time or injected volume, together with measured stress/interface properties and treatment-pressure or fracture-diagnostic data. The present results provide a mechanistic basis for such site-specific calibration.
4.3. Implications for Fluid Distribution Among Nearby Initiation Points
Preferential activation of one weak plane may create a lower-resistance pathway and alter fluid partition among nearby fractures. Limited-entry perforation is therefore a plausible mitigation concept because added perforation pressure drop can reduce sensitivity to downstream resistance differences. Because the present formulation isolates fracture interaction rather than detailed wellbore/perforation hydraulics, quantitative limited-entry design should be evaluated with a dedicated wellbore-perforation-fracture model or field diagnostics.
4.4. Model Limitations
Several aspects define the scope of the present study. The primary model uses prescribed potential fracture paths and a one-factor-at-a-time parameter design. Future work should incorporate explicit post-degradation frictional contact, coupled parameter combinations, and systematic mesh-, time-step-, and domain-sensitivity analyses. Quantitative transfer to field design will also benefit from standardized fracture-dimension extraction, complete calibration of interface hydraulic and mechanical properties, and matched treatment-pressure or microseismic datasets. The supporting XFEM analyses and field microseismic comparison provide complementary process-level evidence across scales and form a basis for these future extensions.
5. Conclusions
- (1)
- The opening contours and fracture paths support a weak-plane-activation/diversion mechanism for radial growth and height containment. Effective-stress reduction and cohesive degradation provide the principal mechanical basis for interface capture and fracture-path deflection.
- (2)
- Within the present geometry and parameter ranges, differential stress strongly affects cross-layer propagation. Increasing Δσ from 1 to 5 MPa changes the response from first-interface capture toward crossing of multiple interfaces, with fracture height increasing from about 3.0 to 7.2 m and width decreasing from about 4.7 to 3.5 mm.
- (3)
- Elastic modulus, Poisson’s ratio, and matrix fracture toughness mainly change the aperture in the tested single-factor cases and do not change the interface-dominated propagation mode. This conclusion is limited to the current ranges and interface properties.
- (4)
- Higher viscosity and injection rate are associated with greater vertical extension in the simulated case series. Partial crossing first appears at the sampled viscosity level of 30 mPa·s, while the rate series reaches approximately 6.5 m at 15 m3/min. These results identify model-specific transition behavior and provide a basis for site-specific hydraulic calibration.
- (5)
- Cross-method comparison and the Guyeyouping-1 microseismic case show consistent asymmetric and non-uniform fracture-growth patterns across numerical and field scales. The results support the use of weak-plane geometry, stress state, and hydraulic conditions as key controls in site-specific interpretation. Future work should focus on systematic numerical convergence, explicit post-degradation contact, coupled-parameter analyses, and matched laboratory or field calibration before quantitative completion-design application.
Author Contributions
Conceptualization, P.T.; methodology, P.T. and T.L.; software, P.T.; validation, W.L.; formal analysis, P.T.; data curation, W.L.; visualization, W.L.; writing—original draft preparation, P.T. and T.L.; writing—review and editing, W.L., Y.L. and T.L.; supervision, Y.L.; project administration, Y.L., P.T., W.L. and Y.L. contributed equally to this work. All authors have read and agreed to the published version of the manuscript.
Funding
This research received no external funding.
Institutional Review Board Statement
Not applicable. This study involved numerical simulations and did not involve humans or animals.
Informed Consent Statement
Not applicable.
Data Availability Statement
The numerical results and summarized field microseismic metrics supporting the findings of this study are reported in the article. Additional supporting data are available from the corresponding author upon reasonable request, subject to applicable data-use restrictions.
Conflicts of Interest
The authors declare no conflicts of interest.
References
- Warpinski, N.R.; Teufel, L.W. Influence of geologic discontinuities on hydraulic fracture propagation. J. Pet. Technol. 1987, 39, 209–220. [Google Scholar] [CrossRef] [Scilit]
- Renshaw, C.E.; Pollard, D.D. An experimentally verified criterion for propagation across unbounded frictional interfaces in brittle, linear elastic materials. Int. J. Rock Mech. Min. Sci. Geomech. Abstr. 1995, 32, 237–249. [Google Scholar] [CrossRef] [Scilit]
- Gu, H.; Weng, X.; Lund, J.B.; Mack, M.G.; Ganguly, U.; Suarez-Rivera, R. Hydraulic fracture crossing natural fracture at nonorthogonal angles: A criterion and its validation. SPE Prod. Oper. 2012, 27, 20–26. [Google Scholar] [CrossRef] [Scilit]
- Dahi-Taleghani, A.; Olson, J.E. Numerical modeling of multistranded-hydraulic-fracture propagation: Accounting for the interaction between induced and natural fractures. SPE J. 2011, 16, 575–581. [Google Scholar] [CrossRef] [Scilit]
- Kresse, O.; Weng, X.; Gu, H.; Wu, R. Numerical modeling of hydraulic fractures interaction in complex naturally fractured formations. Rock Mech. Rock Eng. 2013, 46, 555–568. [Google Scholar] [CrossRef] [Scilit]
- Chen, Z.; Bunger, A.P.; Zhang, X.; Jeffrey, R.G. Cohesive zone finite element-based modeling of hydraulic fractures. Acta Mech. Solida Sin. 2009, 22, 443–452. [Google Scholar] [CrossRef] [Scilit]
- Chen, Z. Finite element modelling of viscosity-dominated hydraulic fractures. J. Pet. Sci. Eng. 2012, 88–89, 136–144. [Google Scholar] [CrossRef] [Scilit]
- Gao, Q.; Ghassemi, A. Three dimensional finite element simulations of hydraulic fracture height growth in layered formations using a coupled hydro-mechanical model. Int. J. Rock Mech. Min. Sci. 2020, 125, 104137. [Google Scholar] [CrossRef] [Scilit]
- Gu, H.; Siebrits, E. Effect of formation modulus contrast on hydraulic fracture height containment. SPE Prod. Oper. 2008, 23, 170–176. [Google Scholar] [CrossRef] [Scilit]
- Gong, F.; Xia, B.; Liu, W.; Peng, Y.; Gao, Y. Propagation of hydraulic fracture under the joint impact of bedding planes and natural fractures in shale reservoirs. Energy Sci. Eng. 2019, 7, 2690–2702. [Google Scholar] [CrossRef] [Scilit]
- Hooker, J.N.; Ruhl, M.; Dickson, A.J.; Hansen, L.N.; Idiz, E.; Hesselbo, S.P. Shale anisotropy and natural hydraulic fracture propagation: An example from the Jurassic (Toarcian) Posidonienschiefer, Germany. J. Geophys. Res. Solid Earth 2020, 125, e2019JB018442. [Google Scholar] [CrossRef] [Scilit]
- Wu, K.; Olson, J.E. Mechanisms of simultaneous hydraulic-fracture propagation from multiple perforation clusters in horizontal wells. SPE J. 2016, 21, 1000–1008. [Google Scholar] [CrossRef] [Scilit]
- Peirce, A.P.; Bunger, A.P. Interference fracturing: Nonuniform distributions of perforation clusters that promote simultaneous growth of multiple hydraulic fractures. SPE J. 2015, 20, 384–395. [Google Scholar] [CrossRef] [Scilit]
- Peirce, A.P.; Detournay, E. An implicit level set method for modeling hydraulically driven fractures. Comput. Methods Appl. Mech. Eng. 2008, 197, 2858–2885. [Google Scholar] [CrossRef] [Scilit]
- Zhou, J.; Jin, Y.; Chen, M. Experimental investigation of hydraulic fracturing in random naturally fractured blocks. Int. J. Rock Mech. Min. Sci. 2010, 47, 1193–1199. [Google Scholar] [CrossRef] [Scilit]
- Perkins, T.K.; Kern, L.R. Widths of hydraulic fractures. J. Pet. Technol. 1961, 13, 937–949. [Google Scholar] [CrossRef] [Scilit]
- Nordgren, R.P. Propagation of a vertical hydraulic fracture. Soc. Pet. Eng. J. 1972, 12, 306–314. [Google Scholar] [CrossRef] [Scilit]
- Daneshy, A.A. Hydraulic fracture propagation in layered formations. Soc. Pet. Eng. J. 1978, 18, 33–41. [Google Scholar] [CrossRef] [Scilit]
- Simonson, E.R.; Abou-Sayed, A.S.; Clifton, R.J. Containment of massive hydraulic fractures. Soc. Pet. Eng. J. 1978, 18, 27–32. [Google Scholar] [CrossRef] [Scilit]
- Detournay, E. Mechanics of hydraulic fractures. Annu. Rev. Fluid Mech. 2016, 48, 311–339. [Google Scholar] [CrossRef] [Scilit]
- Adachi, J.; Siebrits, E.; Peirce, A.; Desroches, J. Computer simulation of hydraulic fractures. Int. J. Rock Mech. Min. Sci. 2007, 44, 739–757. [Google Scholar] [CrossRef] [Scilit]
- Adachi, J.I.; Detournay, E.; Peirce, A.P. Analysis of the classical pseudo-3D model for hydraulic fracture with equilibrium height growth across stress barriers. Int. J. Rock Mech. Min. Sci. 2010, 47, 625–639. [Google Scholar] [CrossRef] [Scilit]
- Guo, J.; Luo, B.; Lu, C.; Lai, J.; Ren, J. Numerical investigation of hydraulic fracture propagation in a layered reservoir using the cohesive zone method. Eng. Fract. Mech. 2017, 186, 195–207. [Google Scholar] [CrossRef] [Scilit]
- Lin, C.; He, J.; Li, X.; Wan, X.; Zheng, B. An experimental investigation into the effects of the anisotropy of shale on hydraulic fracture propagation. Rock Mech. Rock Eng. 2017, 50, 543–554. [Google Scholar] [CrossRef] [Scilit]
- Fu, W.; Ames, B.C.; Bunger, A.P.; Savitski, A.A. Impact of partially cemented and non-persistent natural fractures on hydraulic fracture propagation. Rock Mech. Rock Eng. 2016, 49, 4519–4526. [Google Scholar] [CrossRef] [Scilit]
- Fu, W.; Savitski, A.A.; Damjanac, B.; Bunger, A.P. Three-dimensional lattice simulation of hydraulic fracture interaction with natural fractures. Comput. Geotech. 2019, 107, 214–234. [Google Scholar] [CrossRef] [Scilit]
- Zhao, K.; Stead, D.; Kang, H.; Damjanac, B.; Donati, D.; Gao, F. Investigating the interaction of hydraulic fracture with pre-existing joints based on lattice spring modeling. Comput. Geotech. 2020, 122, 103534. [Google Scholar] [CrossRef] [Scilit]
- Liu, X.; Rasouli, V.; Guo, T.; Qu, Z.; Sun, Y.; Damjanac, B. Numerical simulation of stress shadow in multiple cluster hydraulic fracturing in horizontal wells based on lattice modelling. Eng. Fract. Mech. 2020, 238, 107278. [Google Scholar] [CrossRef] [Scilit]
- Zhang, Y.; Liu, Z.; Han, B.; Zhu, S.; Zhang, X. Numerical study of hydraulic fracture propagation in inherently laminated rocks accounting for bedding plane properties. J. Pet. Sci. Eng. 2022, 210, 109798. [Google Scholar] [CrossRef] [Scilit]
- Yang, L.; Chen, B. Extended finite element-based cohesive zone method for modeling simultaneous hydraulic fracture height growth in layered reservoirs. J. Rock Mech. Geotech. Eng. 2024, 16, 2960–2981. [Google Scholar] [CrossRef] [Scilit]
- Men, X.; Han, Z. Prediction criterion and numerical validation for the interaction between hydraulic fractures and bedding planes. PLoS ONE 2023, 18, e0294993. [Google Scholar] [CrossRef] [Scilit] [PubMed]
- Men, X.; Zhang, Y.; Zuo, D. Prediction criterion of the interaction between hydraulic fractures and bedding planes via theoretical and simulation approaches. Sci. Rep. 2025, 15, 6086. [Google Scholar] [CrossRef] [Scilit] [PubMed]
- Wu, S.; Gao, K.; Feng, Y.; Huang, X. Influence of slip and permeability of bedding interface on hydraulic fracturing: A numerical study using combined finite-discrete element method. Comput. Geotech. 2022, 148, 104801. [Google Scholar] [CrossRef] [Scilit]
- Sarmadi, N.; Mousavi Nezhad, M.; Fisher, Q.J. 2D phase-field modelling of hydraulic fracturing affected by cemented natural fractures embedded in saturated poroelastic rocks. Rock Mech. Rock Eng. 2024, 57, 2539–2566. [Google Scholar] [CrossRef] [Scilit]
- Wang, Y.; Liu, X.; Liang, L.; Xiong, J. The influence of bedding planes and permeability coefficient on fracture propagation of horizontal wells in stratification shale reservoirs. Geofluids 2020, 2020, 1642142. [Google Scholar] [CrossRef] [Scilit]
- Li, S.; Zhao, H.; Wang, J.; Xie, X.; Qin, L.; Zou, L.; Liu, Y. A dynamic propagation numerical model of hydraulic fracture interactions with pre-existing complex natural fractures. Processes 2024, 12, 899. [Google Scholar] [CrossRef] [Scilit]
- Zheng, Y.; He, R.; Huang, L.; Bai, Y.; Wang, C.; Chen, W.; Wang, W. Exploring the effect of engineering parameters on the penetration of hydraulic fractures through bedding planes in different propagation regimes. Comput. Geotech. 2022, 146, 104736. [Google Scholar] [CrossRef] [Scilit]
- Zheng, H.; Wang, H.; Li, F.; Li, N. Numerical simulation of the interaction between hydraulic fracture and the bedding plane in shale formation. Processes 2025, 13, 6. [Google Scholar] [CrossRef] [Scilit]
- Garg, A.; Mishra, H.; Pattanayek, S.K. Scaling laws for optimized power-law fluid flow in self-similar tree-like branching networks. J. Appl. Phys. 2024, 135, 204702. [Google Scholar] [CrossRef] [Scilit]
- Garg, A. Scaling laws for optimal power-law fluid flow within converging-diverging dendritic networks of tubes and rectangular channels. Phys. Fluids 2024, 36, 073116. [Google Scholar] [CrossRef] [Scilit]

Disclaimer/Publisher’s Note: The statements, opinions and data contained in all publications are solely those of the individual author(s) and contributor(s) and not of MDPI and/or the editor(s). MDPI and/or the editor(s) disclaim responsibility for any injury to people or property resulting from any ideas, methods, instructions or products referred to in the content. |
© 2026 by the authors. Licensee MDPI, Basel, Switzerland. This article is an open access article distributed under the terms and conditions of the Creative Commons Attribution (CC BY) license.