


Abstract
China’s carbon-peaking and carbon-neutrality targets are accelerating the integration of distributed photovoltaic (PV) systems, energy storage, and electric vehicle (EV) charging infrastructure, requiring distribution-network planning that reflects local resource, demand, and reliability characteristics. This paper proposes a multi-scenario coordinated planning framework that maps the characteristics of six representative supply-area types into area-specific planning parameters, capacity limits, and reliability requirements. Each supply-area type is evaluated as a separate planning case with three probability-weighted PV weather scenarios, shared investment decisions, and fixed base-load and EV charging profiles across weather scenarios. The model jointly determines the deployment and sizing of PV systems, stationary and mobile energy storage, and EV charging infrastructure. It minimizes the equivalent daily life-cycle cost augmented by reliability and operational-performance terms, capturing area-specific economic-reliability trade-offs. A dynamic arithmetic optimization algorithm (DAOA) incorporating an iteration-dependent step-size mechanism is developed to solve the resulting model. Case studies on the IEEE 33-bus system, additional representative distribution networks, and a real feeder topology yield differentiated resource configurations consistent with supply-area characteristics. On the IEEE 33-bus system, planned PV capacity ranges from 64.71 kW in the high-reliability area to 419.43 kW in the urban-village area, while stationary battery energy storage capacity ranges from 750 to 2000 kWh across the six area types. In repeated-run comparisons, DAOA achieves the lowest mean final fitness among five algorithms under identical test settings. These results illustrate how supply-area parameterization translates heterogeneous planning requirements into differentiated resource deployment decisions.
1. Introduction
Driven by global decarbonization commitments and the transition toward power systems with high penetrations of renewable energy, distributed photovoltaic (PV) systems, electrochemical energy storage systems, and electric vehicle (EV) charging infrastructure are increasingly integrated into medium- and low-voltage distribution networks [1]. This trend accelerates the transition from conventional passive distribution networks to active distribution networks [2]. However, the intermittency and stochastic variability of distributed PV generation can alter power-flow patterns and voltage profiles [3], leading to voltage violations [4] and reverse power flow [5] and increasing transformer overloading risk under high PV penetration [6]. In addition, the temporal variability of EV charging demand may widen the peak-to-valley load difference and complicate distribution-system operation [7].
To address these challenges, the coordinated planning of distributed PV systems, electrochemical energy storage systems, and EV charging infrastructure is a key problem in active distribution network planning [8,9]. Considerable research has been conducted on the coordinated planning of these resources. Reference [10] considered joint planning of operating economy under normal conditions and resilience under fault conditions. References [11,12] developed robust or coupled planning models for storage-integrated EV charging under uncertainty. Reference [13] formulated a coordinated planning model for high PV penetration to optimize resource investments and system economics. Although these studies have established effective coordinated and uncertainty-aware planning frameworks, supply-area-dependent resource conditions and reliability requirements are generally not translated into explicit planning parameters and constraints.
Scenario-based methods are widely adopted, and representative-day selection and data-driven clustering are commonly used to characterize renewable generation and demand variability [14,15]. Information-entropy extraction [16] and K-means clustering [17] have been used to reduce problem size, while scenario decomposition for multiple flexibility services and multi-scenario planning for shared energy storage are reported in [18,19]. Nevertheless, these approaches primarily focus on uncertainty representation, scenario reduction, or resource-specific planning, while the systematic linkage between practical supply-area characteristics and coordinated infrastructure-planning parameters remains insufficiently addressed. Table 1 summarizes representative distribution-network planning approaches and highlights that supply-area-dependent resource conditions and reliability requirements are rarely translated into explicit planning parameters under coordinated PV–ESS–EV planning.
Table 1.
Comparison of representative distribution-network planning approaches.
Conventional planning studies often represent PV and load uncertainty using either a single representative day or a limited set of operating scenarios derived from historical data [20,21]. Such scenario representations do not directly align with the supply-area classifications used in practical distribution-network planning [22]. Supply-area types differ substantially in rooftop resource availability, load-profile characteristics, EV charging behavior, and supply-reliability targets [23]. Accordingly, the remaining methodological gap is not the absence of coordinated or scenario-based planning itself, but the lack of a unified parameterization mechanism that systematically translates practical supply-area characteristics into resource-capacity bounds, operational parameters, reliability requirements, and planning constraints for coordinated PV–ESS–EV infrastructure planning. To address these limitations, this paper develops a coordinated planning method for distributed PV systems, energy storage systems, and EV charging infrastructure that explicitly accounts for the resource, load, and reliability characteristics of different supply-area types. Specifically, six parameterized planning scenarios are defined according to the supply-area classification principles, and PV generation profiles together with EV charging demand and reliability requirements are coupled in scenario formation for optimization. This parameterization establishes an explicit link between supply-area classification, area-specific planning requirements, and coordinated resource-allocation decisions. On this basis, the main contributions are summarized as follows:
- A parameterized multi-scenario planning framework is developed to capture differentiated requirements across supply areas in the coordinated planning of PV systems, energy storage systems, and EV charging infrastructure. The framework systematically maps area-specific rooftop PV potential, load and charging characteristics, and reliability requirements into optimization-ready planning parameters and constraints, enabling area-dependent planning decisions under heterogeneous operating conditions.
- An area-aware coordinated planning model is formulated to jointly determine the deployment of PV systems, stationary and mobile energy storage systems, and EV charging infrastructure. The proposed model minimizes the equivalent daily total cost over the planning horizon while incorporating supply-area-dependent reliability and operational-performance penalty terms, thereby representing an economic–reliability trade-off within a unified optimization framework. The joint formulation captures cross-resource coupling, where the investment and operation of one resource affect the optimal configuration of the others under the same multi-scenario evaluation framework.
- A dynamic arithmetic optimization algorithm (DAOA) is developed to solve the coordinated planning model. An iteration-dependent control mechanism is introduced to adaptively regulate the search step size, improving convergence behavior and mitigating premature stagnation. Case studies demonstrate that DAOA achieves the best average final fitness among the compared algorithms under the adopted test settings.
2. Materials and Methods
In the coordinated planning of distributed PV systems, energy storage systems, and EV charging infrastructure in distribution networks, the upper bound on the installable distributed PV capacity at each bus is a key model input. If a uniform installation ratio is adopted or differences in rooftop availability are neglected, the estimated PV deployment potential may not reflect the capacity that can be installed in practice. Therefore, the gross rooftop area is first converted into the area available for PV installation, which is then used to determine the upper bound on the installable PV capacity at each bus. Subsequently, six representative supply-area types are defined by accounting for differences in resource availability and interconnection characteristics across supply areas. These types provide a consistent parameterization framework for comparing area-specific planning decisions in the subsequent case studies.
2.1. Refined Assessment of Installable Rooftop PV Capacity
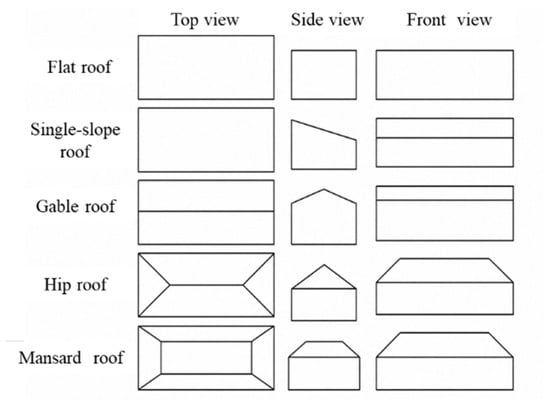
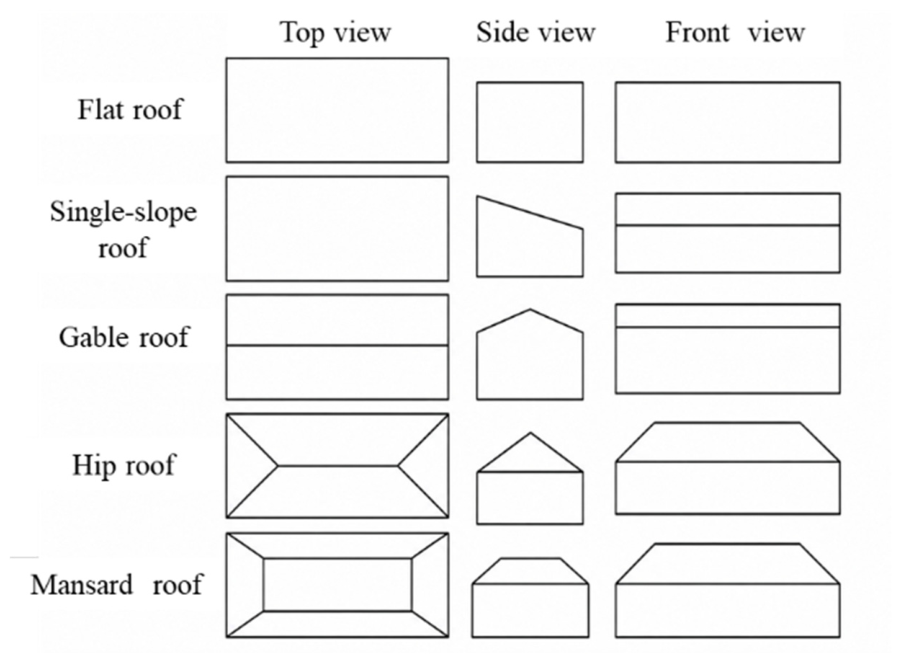
Before formulating the planning model, the upper bound on the installable rooftop PV capacity at each bus must be estimated. Although rooftops provide potential space for PV deployment, the area available in practice is affected by rooftop equipment occupancy, spacing requirements for PV arrays, and roof slope, as illustrated in Figure 1.
Figure 1.
Roof types of buildings.
For buildings with flat roofs, such as industrial facilities, the usable rooftop area is calculated as
where St is the gross rooftop area; Sr is the usable rooftop area; β1 is the rooftop-equipment occupancy factor; β2 is the PV-system layout factor; and β3 is the effective-area factor for the PV array.
Sr = St β1 β2 β3
For buildings with pitched roofs, such as low-rise residential buildings, a roof-slope correction factor is further introduced:
Sr = St × β1 × cos(20°)
A representative roof slope of 20° is adopted because the pitched-roof slopes considered in the underlying project study are approximately 10–35°, with most values below 25°.
Based on the usable rooftop area, the upper bound on the installable PV capacity at bus i is determined as
where η = 0.1 kW/m2 is the PV capacity density and Wi ∈ (0,1) is the customer PV-adoption factor at bus i. The latter represents customers’ willingness to invest in rooftop PV systems and is parameterized using the Bass diffusion model [24] to characterize differences in PV adoption maturity across supply-area types. In the numerical studies, η is set to 0.1 kW/m2, and the midpoint of each supply-area-specific range is adopted as the fixed value of Wi.
2.2. Definition and Parameterization of Representative Supply-Area Types
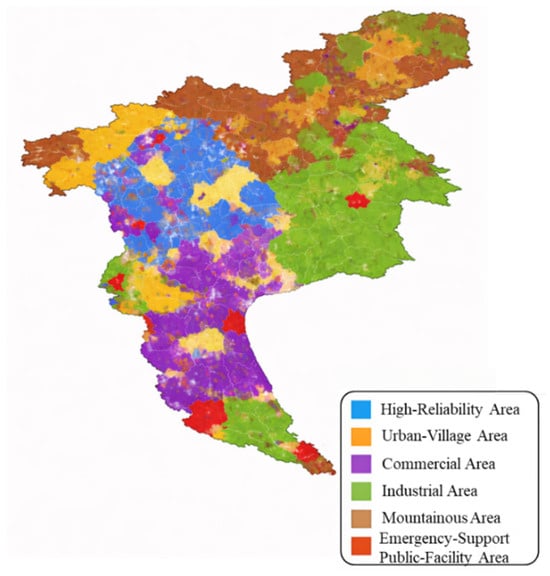
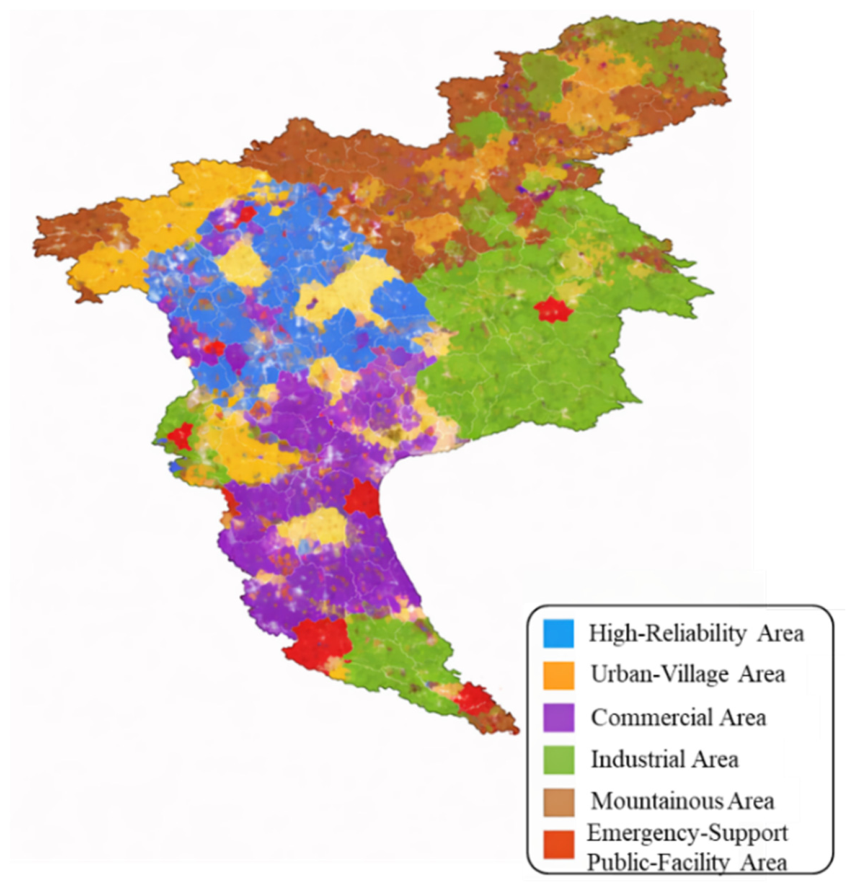
Distribution networks exhibit substantial spatial heterogeneity in building morphology, rooftop PV deployment potential, customer willingness to adopt PV systems, and reliability requirements. A uniform parameter set does not explicitly represent these area-specific differences in local resources, load characteristics, and planning requirements. Therefore, based on the supply-area classification principles in GB 50613-2010 [25], the Code for Planning and Design of Urban Distribution Network, and the observed operating characteristics of representative supply areas in Guangzhou based on field surveys and operational statistics collected in 2025, we define six representative supply-area types: high-reliability areas, urban-village areas, commercial areas, industrial areas, mountainous areas, and emergency-support public-facility areas, as illustrated in Figure 2. The last type comprises areas containing public facilities, such as emergency shelters, stadiums, and convention and exhibition centers, that serve routine public functions under normal conditions and provide emergency response and power-support functions during contingencies.
Figure 2.
Six representative supply-area types considered in the planning framework based on GB 50613 and representative operating characteristics in Guangzhou.
To incorporate these supply-area characteristics into the subsequent optimization model, Table 2 summarizes the differences among the six types in terms of rooftop PV deployment potential, customer investment capacity and adoption willingness, load characteristics, and EV charging demand. These characteristics are then mapped into supply-area-specific planning parameters and constraints. Based on this parameterization, the next section formulates a coordinated planning model for PV systems, energy storage systems, and EV charging infrastructure. The model minimizes the equivalent daily total cost over the planning horizon while capturing the tradeoff between economic performance and differentiated reliability requirements, thereby producing planning decisions and deployment strategies tailored to each supply-area type.
Table 2.
Key planning characteristics of the six representative supply-area types.
3. Multi-Scenario Coordinated Planning Model Considering Economic Performance and Reliability
3.1. Equivalent Daily Life-Cycle Cost Objective
The multi-scenario framework considered in this study has two levels. The six representative supply-area types, denoted by S = {1,…,6}, are treated as separate planning cases with different resource, demand, reliability, and cost parameters, rather than as six zones simultaneously existing within one distribution network. For each supply-area case S, PV-generation uncertainty is represented by the weather-scenario set K with occurrence probabilities pk. Throughout Section 3, k ∈ K denotes the weather-scenario index, t ∈ T denotes the time-interval index, and . To avoid ambiguity, k is used exclusively for weather scenarios, while other equipment indices are denoted separately. The investment and sizing decisions for PV, stationary BESS, MESS, and EV charging infrastructure are determined once for each supply-area case and are common to all three weather scenarios; therefore, these planning decisions are independent of the specific weather realization. In the present formulation, the probabilistic scenario treatment is applied only to PV generation, whereas the base-load and EV-charging profiles are represented by deterministic, supply-area-specific profiles and remain unchanged across weather scenarios. Accordingly, PV output varies with k, and the electricity-purchase cost is evaluated as a probability-weighted sum across the weather scenarios using pk, as formulated in Equation (11), and is then included in the equivalent daily total-cost objective through Cgrid(s) in Equation (4). Thus, each of the six supply-area planning cases is evaluated under three weather realizations while retaining one common set of planning decisions across the three weather scenarios.
For clarity, the term coordinated planning in this paper describes the structure of the planning model rather than a separate operating scenario. Specifically, PV capacity, stationary BESS configuration, MESS configuration, and EV charging-infrastructure capacity are treated as coupled planning variables and are jointly optimized under a common objective function, power-balance model, network-performance evaluation, and reliability assessment. Consequently, changes in one resource category may affect the economically and operationally preferred configuration of the others.
By contrast, uncoordinated planning refers conceptually to a planning architecture in which the different resource categories are determined independently or sequentially without simultaneous cross-resource optimization or backward adjustment. The numerical case studies in this paper focus on the proposed coordinated formulation. Therefore, the reported results are used to demonstrate the behavior and area-specific adaptability of the coordinated framework, rather than to establish a quantitative superiority over an explicit uncoordinated-planning benchmark.
Accordingly, the planning model is formulated to minimize the equivalent daily total cost over the planning horizon:
minC = Cinv + Com + Cgrid + Closs + Cpen
3.1.1. Investment Cost
The total investment comprises distributed PV systems, stationary battery energy storage systems (BESS), mobile energy storage systems (MESS), and EV charging infrastructure. The capital recovery factor (CRF) is used to convert the upfront investment into an equivalent daily cost:
where r = 0.08 is the social discount rate, and L = 20 is the planning horizon in years.
Cinv = CRF(CPV + CBESS + CMESS + CEV)/365
- (1)
- PV Investment Cost
For buses located farther downstream along a feeder, longer equipment-transport distances and less favorable site conditions may result in higher overall installation costs. To account for this spatial variation, a feeder-location adjustment factor δi is determined according to the topological feeder depth di, defined as the number of upstream branches between the feeder head and bus i. In the numerical implementation, δi is set to 1.00, 1.15, 1.25, and 1.35 for di ≤ 2, 2 < di ≤ 8, 8 < di ≤ 15, and di > 15, respectively, to modify the unit PV investment cost at each bus:
where PPV,i is the installed PV capacity at bus i, and cpv,s is the total installed cost per unit of PV capacity for the supply-area scenario s.
Topological feeder depth is used as a proxy for relative installation accessibility, not as a physical transportation distance, because detailed GIS-based transportation and road-accessibility data are not available for all test networks.
- (2)
- Energy-Storage Investment Cost
Energy-storage equipment is modeled through discrete installation from a standardized candidate catalog. For each bus and supply-area scenario, the optimization determines which candidate unit is installed by binary selection variables. Once a candidate unit is selected, its rated power and rated energy from the catalog are used to compute the installed storage ratings, and the resulting ratings are then enforced in the SOC constraints and power limits. The investment cost is calculated by summing the installed candidate-unit costs weighted by the corresponding selection variables.
where cspec (Pm,Em) is the actual cost of the selected candidate unit m, and Pm,Em are its rated power and energy capacity, respectively.
- (3)
- EV Charging Infrastructure Investment Cost
The total installed cost of EV charging infrastructure is represented using a scenario-dependent unit cost. In the optimization, the decision variable for EV charging infrastructure is the installed rated charging power at each bus under each supply-area scenario. For each time interval, the EV charging demand used in the power-balance constraint is generated from the installed rated charging power using the supply-area-dependent participation rate and the specified time-profile factor. It is calculated as
where PEV,j is the rated power of the j th charging facility under the supply-area scenario s, and cEV,s is the corresponding total installed cost per unit of charging capacity.
3.1.2. Operation and Maintenance Cost
The annual operation and maintenance (O&M) cost of each type of equipment is assumed to vary approximately linearly with its installed capacity and is converted into an equivalent daily cost as follows:
where the unit O&M cost of each equipment type is specified for each supply-area type to reflect regional differences in maintenance requirements, labor costs, and site accessibility.
3.1.3. Electricity Purchase Cost
To account for weather-induced uncertainty in PV generation, the electricity purchase cost is formulated as
where pk is the occurrence probability of weather scenario k, πt is the electricity purchase price during time interval t, and is the net power purchased from the upstream grid for supply-area type s under weather scenario k during time interval t:
The base demand and EV charging demand vary across supply-area types but remain unchanged across weather scenarios for a fixed supply-area case s. By contrast, the available PV generation and the resulting scenario-dependent operating variables vary with weather scenario k. In calculating the electricity purchase cost, the net power exchanged with the upstream grid is jointly determined by the charging and discharging of the energy storage systems and the managed and unmanaged charging of EVs. Energy storage is scheduled according to the principle of energy arbitrage under time-of-use tariffs: discharging is prioritized during peak-price periods, whereas charging is prioritized during off-peak-price periods. The charging and discharging power are further constrained by the state of charge (SOC) and the applicable power and energy-capacity limits.
A hybrid managed–unmanaged EV charging model is adopted. Specifically, the supply-area-dependent proportion of the EV charging demand participates in managed charging, whereas the remaining demand follows the unmanaged charging load-factor profile. The managed/unmanaged distinction used here describes EV charging behavior at the operational level and should not be confused with the coordinated/uncoordinated infrastructure-planning concepts defined above. The resulting charging demand is then used to determine the net grid-purchase power in each time interval:
where rresp,s denotes the participation rate in managed EV charging for supply-area type s, characterizing regional differences in charging-infrastructure management and customer participation. κs(t) denotes the supply-area-dependent temporal profile factor.
3.1.4. Network Loss Cost
The active power losses in the distribution network are obtained using the backward/forward sweep power-flow method and converted into an equivalent daily cost using the average daily electricity price:
The active power loss is obtained from the power-flow calculation for supply-area case s, weather scenario k, and time interval t, and the corresponding network-loss cost is aggregated across weather scenarios using pk.
3.1.5. Reliability, Constraint-Violation, and Peak-Demand Management Terms
To quantify violations of the reliability and operational requirements, constraint-violation penalty terms are incorporated into the objective function when the corresponding violation metrics exceed their admissible limits. These violation penalties are defined using positive deviations, i.e., zero penalty is incurred when the requirement is satisfied, and the penalty increases monotonically with the violation magnitude. In addition, a peak-period grid-purchase management term is included to discourage grid purchases during designated peak-demand intervals. Unlike the constraint-violation penalties, this term is not activated by exceedance of a prescribed threshold. The corresponding penalty and management terms are weighted and incorporated into the equivalent daily life-cycle cost objective, ensuring an economically interpretable investment–reliability trade-off.
Cpen = wv Cv + wtrans Ctrans + CEENS + wN−1 CN−1 + wpeak Cpeak + wbudgetCbudget
The relative importance of the reliability, operational, and peak-demand management terms is reflected by the corresponding weighting coefficients assigned to the associated evaluation metrics.
- (1)
- Voltage-Violation Penalty
- (2)
- Transformer-Overloading Penalty
- (3)
- Expected Energy Not Supplied Penalty
To represent differentiated supply-reliability requirements across supply-area cases, annual EENS is evaluated by aggregating the post-contingency load shortfall weighted by the corresponding component failure rate and repair duration over the representative operating periods. The normalized EENS ratio under supply-area case s is then defined as
where EENSs is the annual expected energy not supplied in kWh/year and is the corresponding annual electricity demand.
The deviation from the supply-area-specific reliability target is then defined as
Accordingly, the EENS penalty is formulated as
where is the normalized EENS target specified according to the supply-reliability classification of each of the six representative supply-area types, and wEENS(s) is the corresponding weighting coefficient assigned according to the supply-area type.
CEENS(s) = wEENS(s)ΔrEENS,s
- (4)
- N-1 Contingency Penalty [26]
Here, ε(s) denotes the maximum allowable load-shortage ratio corresponding to the prescribed N-1 islanded-load coverage target.
This term evaluates the islanded-load coverage capability under a single-line outage in a supply-area scenario s. For each supply-area scenario, a single-line outage is represented by removing one distribution line from the in-service line set of the considered distribution network. After the outage, the islanded network is identified by connectivity analysis, and the islanded operation duration is set to the required islanded-operation duration parameter of the corresponding supply-area type. During the islanded interval, the served load is determined by the islanded network operation together with coordinated dispatch of stationary BESS and MESS under the same SOC feasibility conditions as in normal operation.
The islanded-load coverage ratio is computed as the ratio between the priority-level aggregated served load energy and the priority-level aggregated demanded load energy over the islanded operation duration. The N-1 penalty is activated when the computed coverage ratio is below the N-1 islanded-load coverage target for the corresponding supply-area type, and its magnitude is scaled by the associated weighting coefficient. Otherwise, the N-1 penalty term is set to zero.
- (5)
- Peak-Period Grid-Purchase Management Term
- (6)
- Investment-Budget Violation Penalty
Cbudget(s) = max(0,Cinv(s) − Cmax(s))
3.2. Multi-Scenario Operational and Reliability Constraints
- (1)
- Nodal Power-Balance Constraint
The operation horizon is discretized into a set of time intervals indexed by t. The operational relationships in this subsection are evaluated for each supply-area case s, each weather scenario k, and each time interval t, while the voltage-deviation and transformer-overloading requirements in Equations (18) and (19) are treated as soft penalties rather than hard constraints. The PV installed capacity is treated as a continuous decision variable limited by the bus-specific upper bound. The EV charging demand in each time interval is derived from the installed rated charging power using the participation rate and time-profile factor. The stationary and mobile storage ratings used in the SOC and power constraints are obtained from the discrete candidate-catalog selection determined. For each supply-area scenario s, weather scenario k, and discrete time interval t, the nodal power-balance constraint ensures that the total power injection equals the corresponding demand:
where Pd,i,s,t and denote the base demand and EV charging demand, respectively, at bus i during time interval t for supply-area case s; these two demand terms remain unchanged across the weather scenarios. Moreover, , , , and denote the PV output, stationary BESS power, MESS power, and power supplied by the upstream grid, respectively, at bus i during time interval t for supply-area case s under weather scenario k.
Under normal grid-connected operation, the grid-purchase term is defined as a non-negative residual demand in Equation (12), so the total load, including the EV charging demand, is satisfied by local PV and storage output or by upstream grid supply. Under N-1 islanded intervals, the EV charging load is included in the served-load assessment and reflected in the priority-level islanded-load coverage metric in Equation (23). This ensures that required EV charging service is evaluated under contingency conditions through the coordinated dispatch of BESS and MESS within the same SOC feasibility bounds as normal operation.
- (2)
- PV Capacity Constraint
For each bus and supply-area scenario, the PV installed capacity is a continuous decision variable. Its value is limited by the bus-specific upper bound determined by the usable rooftop area and the customer PV-adoption factor:
- (3)
- Energy-Storage State-of-Charge Constraints
The SOC of stationary BESSs and MESSs is computed using the rated energy values associated with the discrete candidate-catalog selections. Let m denote the storage unit index. For each supply-area case s, weather scenario k, storage unit m, and time interval t, SOC is constrained within the corresponding lower and upper limits, ensuring feasible charging and discharging operation:
where denotes the stored energy, rather than a dimensionless SOC ratio, of storage unit m in supply-area case s under weather scenario k at time interval t, and denote its charging and discharging power, respectively. ηc and ηd denote the charging and discharging efficiencies, respectively. The SOC limits and initial condition are defined relative to the selected rated energy capacity Em; in the numerical implementation, they are set to 0.10Em, 0.90Em, and 0.50Em, respectively.
For numerical implementation, the rated power and energy of stationary BESS and MESS are determined by the selected candidate units. The initial stored energy is set to 50% of the selected rated energy capacity, and the admissible stored-energy range is 10–90% of the rated capacity. Charging, discharging, and idle operation are mutually exclusive at each time interval, and the actual charging/discharging power is limited by both the selected rated power and the available stored-energy margin. EV-charging planning variables are bounded by the supply-area-specific maximum charging capacity. Grid-purchase power is calculated as the non-negative residual demand supplied by the upstream grid. Voltage deviation and transformer overloading are treated through the soft-penalty terms in Equations (18) and (19), while branch loading is evaluated in the power-flow calculation. To mitigate end-effect in representative-day evaluation and to ensure that the obtained daily operation corresponds to a steady cycling regime, a terminal stored-energy regulation constraint is imposed for both stationary BESS and MESS. Specifically, the stored energy at the end of the representative-day horizon is required to return to the initial energy level (with a tolerance):
where δterm is the allowable terminal deviation ratio. In the numerical implementation, δterm is set to 0.05. Therefore, the representative-day horizon does not enforce inter-day SOC continuity, while storage feasibility within the horizon is guaranteed by the SOC bounds and operational limits at every time interval.
In the present formulation, MESS is not dynamically relocated during the representative-day operating horizon. Its eligible connection site is selected at the planning stage and remains unchanged during subsequent hourly operation. Therefore, relocation, travel time, transportation cost, connection/disconnection transitions, and intertemporal routing are not decision variables or constraints. The term mobile refers to dedicated transportable battery energy-storage equipment that can be pre-positioned before operation or emergency support, whereas stationary BESS is permanently installed. MESS is also distinct from Vehicle-to-Grid (V2G): EVs are modeled only as charging demand in this study, and bidirectional discharge from EV batteries to the grid is outside the scope of the present model.
The stationary BESS candidates include LFP, NCM622, and Na-ion battery systems with different rated power, energy capacity, and installed cost. Stationary BESS provides local energy shifting, PV accommodation, peak-period support, and reliability support. MESS represents dedicated transportable battery storage for pre-deployment and emergency support. PV, storage, and EV charging infrastructure connect through the distribution-network buses rather than forming a serial PV–ESS–EV chain. They operate in a grid-connected distribution network under normal conditions, while islanded-load support is evaluated under N-1 contingencies.
4. DAOA-Based Solution Method for Coordinated Distribution-Network Planning
The arithmetic optimization algorithm (AOA) [27] is a metaheuristic optimization algorithm. It employs multiplication and division operators for global exploration and addition and subtraction operators for local exploitation. AOA has demonstrated favorable convergence performance on benchmark functions and engineering optimization problems.
For the coordinated planning problem involving PV systems, energy storage systems, and EV charging infrastructure formulated in this paper, the step-size control mechanism of the conventional AOA has two limitations. First, the step size in the exploitation phase is governed by a predefined math optimizer probability (MOP) function and decreases linearly according to a prescribed schedule toward the end of the iterative process. This mechanism reduces the perturbation capability during later iterations and may increase the risk of convergence to a local optimum. Second, a single step-size control mechanism may not adequately accommodate changes in the search phase and problem scale.
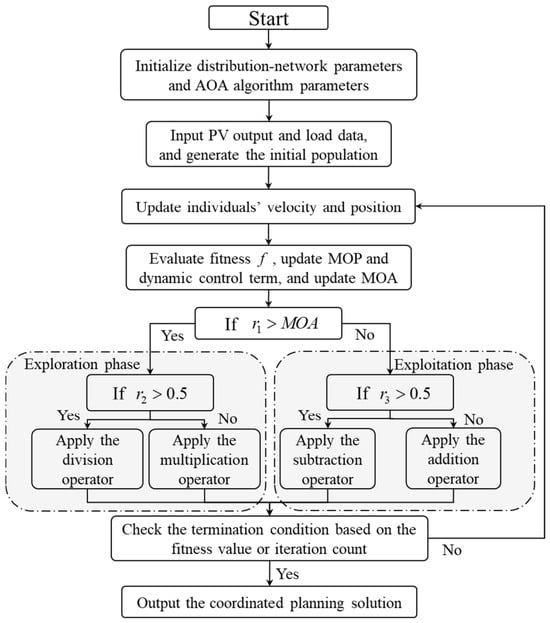
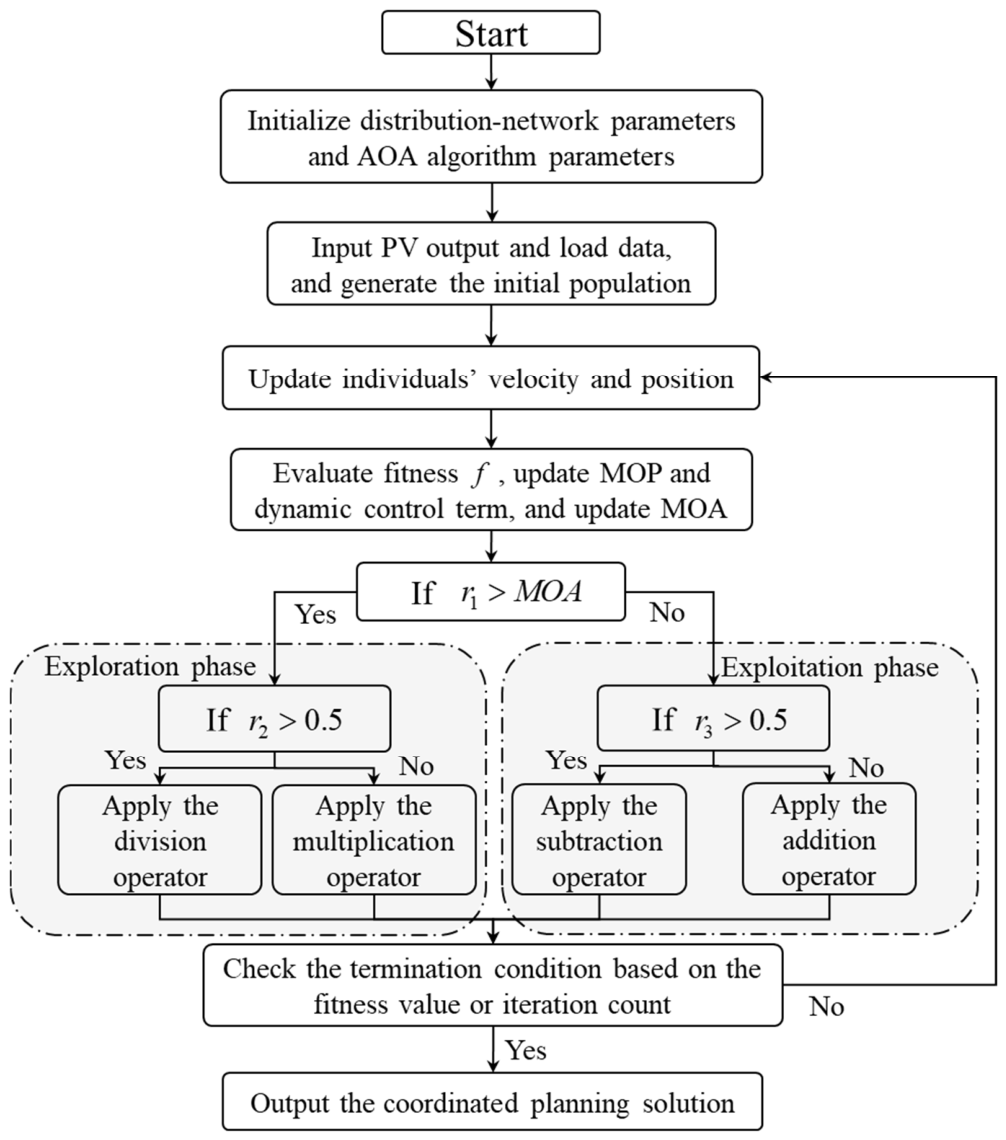
To address these limitations, an improved dynamic arithmetic optimization algorithm (DAOA) is developed. The solution procedure for the coordinated planning model using DAOA is illustrated in Figure 3. Specifically, an iteration-dependent dynamic control term f is introduced to reconstruct the search step size as
where t is the current iteration index and Tmax is the maximum number of iterations. DAOA retains the two-phase search framework of the conventional AOA while incorporating the dynamic term into the exploitation phase. The position-update rules are given as follows.
Figure 3.
Solution procedure for the coordinated planning model using DAOA.
Exploration phase (r1 > MOA):
Exploitation phase (r1 ≤ MOA):
The dynamic step size is defined as
where scale denotes the actual search step size and ε = 10−6 is a numerical stabilization term introduced to prevent excessively small step sizes from causing search degeneration.
5. Case Studies
This section evaluates the proposed coordinated planning framework for distributed PV systems, energy storage systems, and EV charging infrastructure, together with the DAOA. First, comparative studies are conducted on the IEEE 33-bus distribution system to examine how representative operating conditions and the modeling of supply-area heterogeneity affect the planning results. The framework is then applied to several benchmark distribution systems and a real distribution network to further assess the practical applicability of the required parameterization and modeling procedures.
5.1. Case-Study Design and Input Data
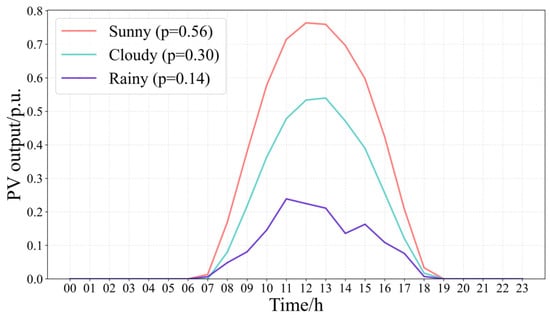
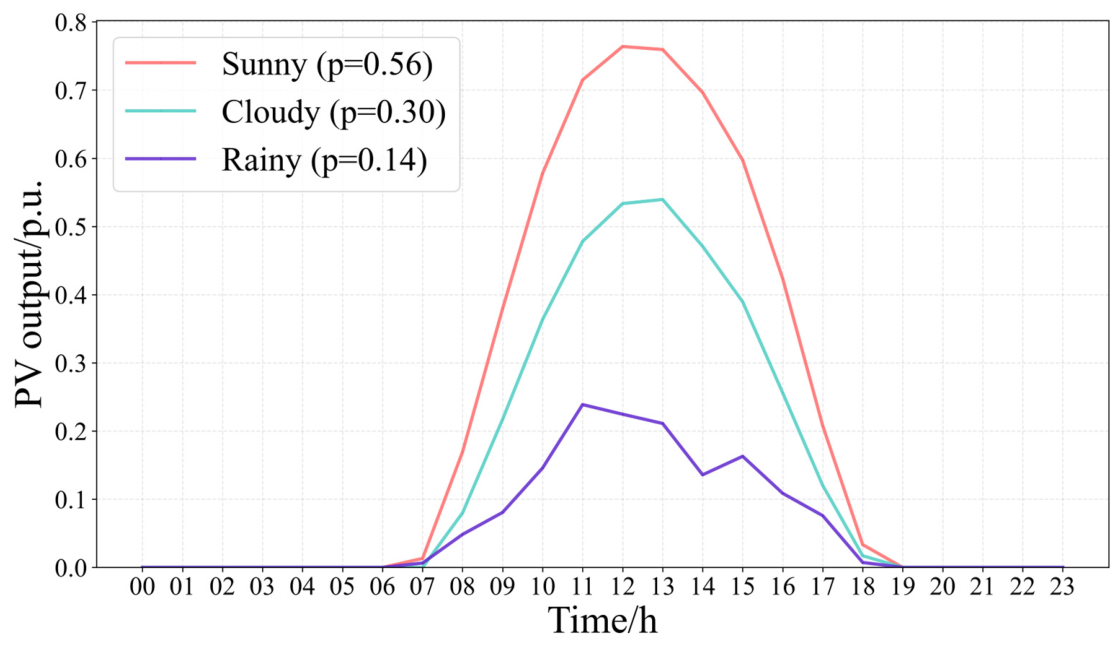
To characterize the variability of PV generation, annual PV power data from a representative PV demonstration site in Guangdong Province, covering the full year of 2022 at an hourly resolution, are clustered into three representative weather scenarios, namely sunny, cloudy, and rainy, using the K-means++ algorithm [28]. Before clustering, the annual data are cleaned and normalized, and each day is represented by a 24-point PV-output profile. For the present planning model, the number of clusters is set to K = 3. K-means++ initialization is used to improve the selection of the initial cluster centers, and the measured daily profile with the minimum Euclidean distance to each cluster centroid is selected as the representative profile. The occurrence probability of each scenario is determined by its proportion of days in the annual dataset. The resulting probabilities of the sunny, cloudy, and rainy scenarios are 0.56, 0.30, and 0.14, respectively. The resulting representative PV generation profiles and their probabilities are shown in Figure 4. Electricity purchase costs are then calculated as the probability-weighted sum across the three scenarios to account for PV generation uncertainty in the planning results.
Figure 4.
Representative PV generation profiles under the three weather scenarios.
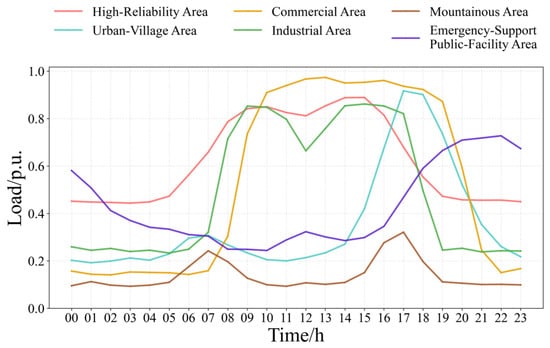
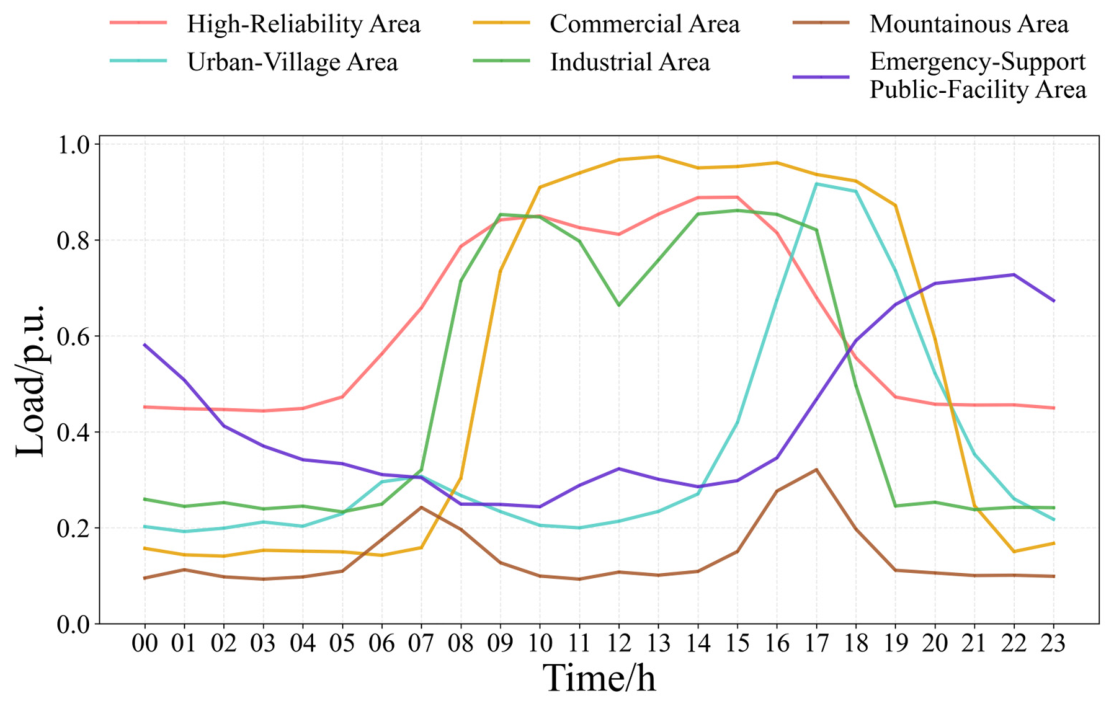
To represent differences in load levels and electricity-use patterns across supply areas, six representative supply-area types are defined according to building characteristics and electricity-consumption patterns. The corresponding daily load profiles are used as inputs to the operational simulations, as shown in Figure 5.
Figure 5.
Daily load profiles of the six-representative supply-area types.
To evaluate whether the proposed framework produces area-specific planning decisions, each supply-area type is assigned a consistent set of resource, demand, reliability, and cost parameters. Table 3 lists the type-specific inputs derived from field surveys and operational statistics for representative supply areas in Guangzhou in 2025, together with applicable national and industry classification standards. These inputs include rooftop-utilization factors, customer PV-adoption factors, annual equivalent full-load hours of PV generation, managed EV-charging participation rates, voltage-deviation limits, and supply-reliability targets. Table 4 reports the corresponding weighting coefficients used for the reliability and constraint-violation penalties and the peak-period grid-purchase management term. Specifically, the coefficients in Table 5 scale the corresponding penalty/management terms in Equation (17): wv and wtrans weight the voltage-violation penalty (Equation (18)) and transformer-overloading penalty (Equation (19)), respectively; weens scales the EENS penalty (Equation (22), based on the normalized EENS deviation defined in Equations (20) and (21)); wN−1 scales the N-1 islanded-load coverage penalty (Equation (23)); wpeak weights the peak-period grid-purchase management term (Equation (24)); and wbudget accounts for the investment-budget violation penalty (Equation (25)). The coefficients are selected based on the same data sources and engineering experience and are treated as engineering weights reflecting differentiated planning priorities across supply-area types. These values are engineering planning ranges compiled from representative field-survey and operational information. Because the coefficients are calibrated deterministically from engineering/operational inputs rather than estimated from a statistical sampling process, the notion of a single statistical sample size is not applicable.
Table 3.
Supply-Area–Specific Parameters for the Six Representative Supply-Area Types.
Table 4.
Weighting Coefficients for the Six Representative Supply-Area Types.
Table 5.
Technical and Cost Data for Candidate Energy-Storage Units.
The supply-reliability classification and N-1 planning principles follow GB 50613-2010. The normalized EENS, islanded-load-coverage, and islanded-operation-duration targets are parameterized by combining these classification principles with local operational statistics and engineering requirements. Among the reliability-related parameters in Table 3, the load-priority level, normalized EENS target, voltage-deviation limit, N-1 islanded-load coverage ratio, and required islanded-operation duration are used directly in the operational and reliability evaluation. SAIDI and average interruption duration characterize the corresponding supply-reliability class and are not imposed as separate optimization constraints.
The planning model performs discrete selection from a catalog of stationary and mobile energy-storage units. Table 5 summarizes the rated power, rated energy capacity, technology type, and installed cost of the candidate units. The remaining parameters common to all cases are given in Table 6, while the time-of-use electricity tariff used to calculate grid-purchase and storage-arbitrage costs is listed in Table 7. Parameters reported as ranges in Table 3 and Table 4 are represented by the midpoint values shown in parentheses before optimization and are held fixed during each case study.
Table 6.
Basic parameter settings.
Table 7.
Time-of-use electricity prices.
Unless otherwise stated, the optimization objective is evaluated on an equivalent daily basis, whereas the monetary results explicitly reported as annual costs in the subsequent figures and tables are annualized for presentation and comparison.
All numerical simulations were implemented in Python 3.14 on a 64-bit Windows operating system and executed on a computer equipped with an AMD Ryzen 5 7640HS processor at 4.30 GHz, 16 GB RAM, integrated AMD Radeon 760M Graphics, and 477 GB storage. GPU acceleration was not used in the numerical simulations.
5.2. Planning Analysis on the IEEE 33-Bus System
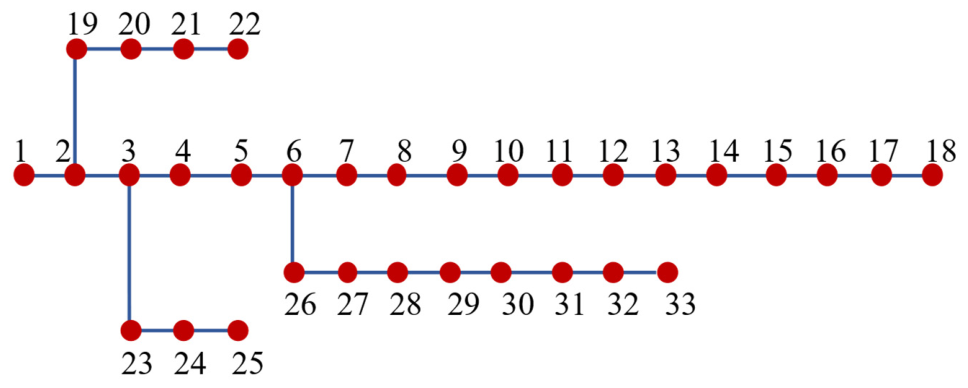
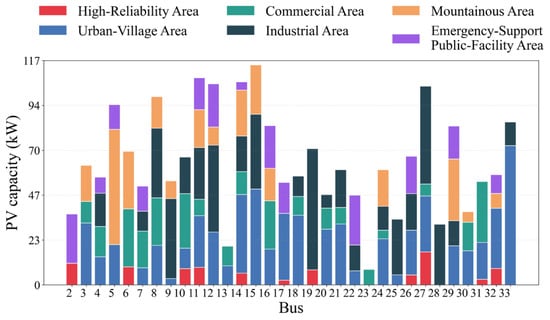
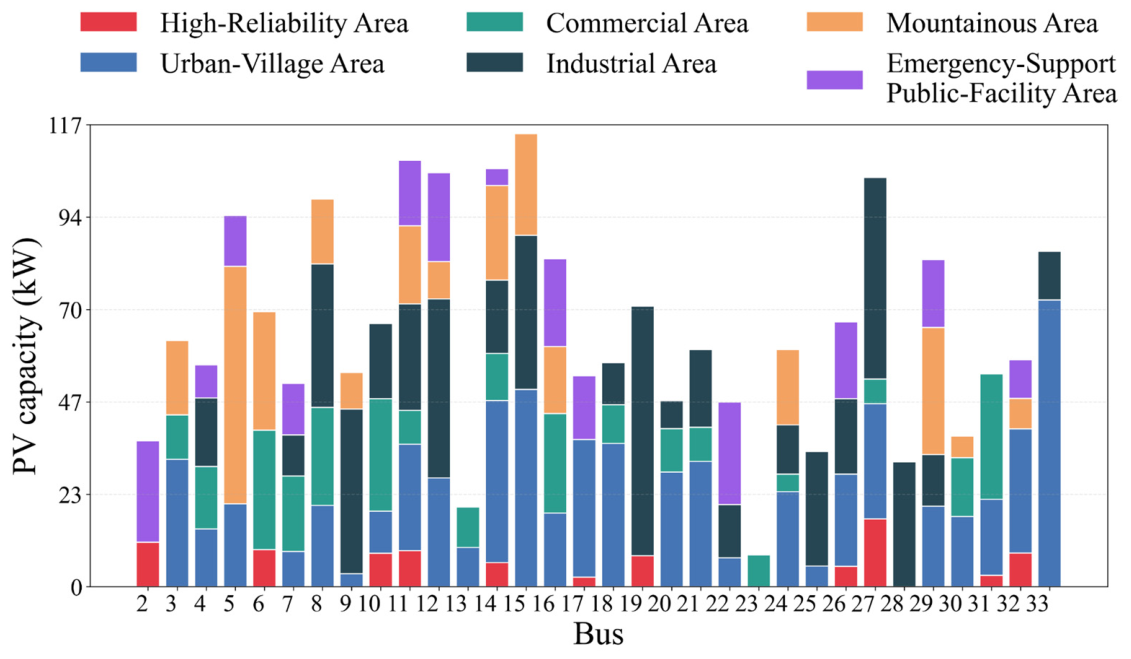
To examine how the proposed supply-area-specific parameterization affects the coordinated planning decisions, the IEEE 33-bus distribution test system in Figure 6 is used as a common network topology [29]. First, the rooftop PV assessment in Section 2.1 is applied to each of the six representative supply-area types using the corresponding type-specific inputs (Table 2). This procedure yields the bus-level upper bounds on the installable PV capacity shown in Figure 7. These bounds serve as planning constraints rather than optimized outcomes; their spatial variation across buses and supply-area types reflects differences in rooftop availability, array-layout conditions, and customer PV-adoption propensity.
Figure 6.
Topology of the IEEE 33-bus distribution system.
Figure 7.
Bus-specific upper bounds on installable PV capacity for the six supply-area types.
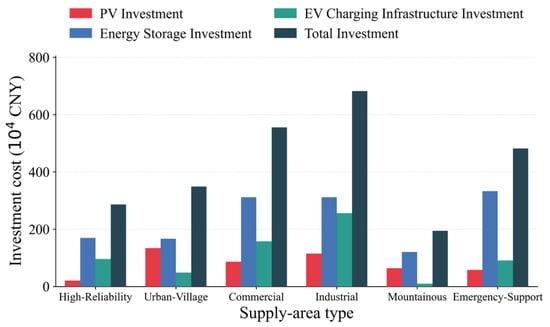
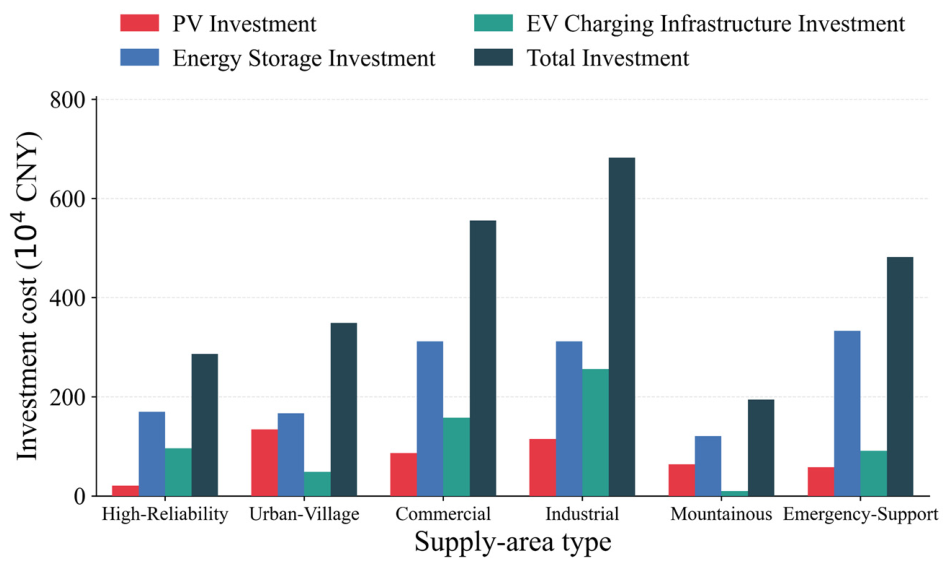
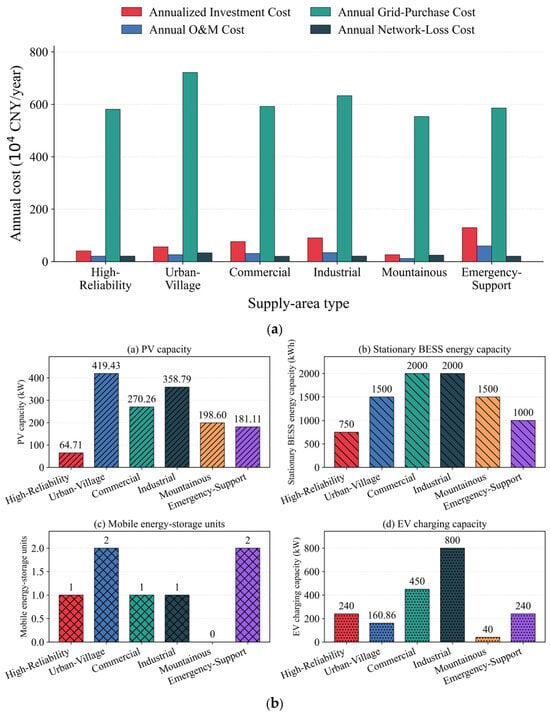
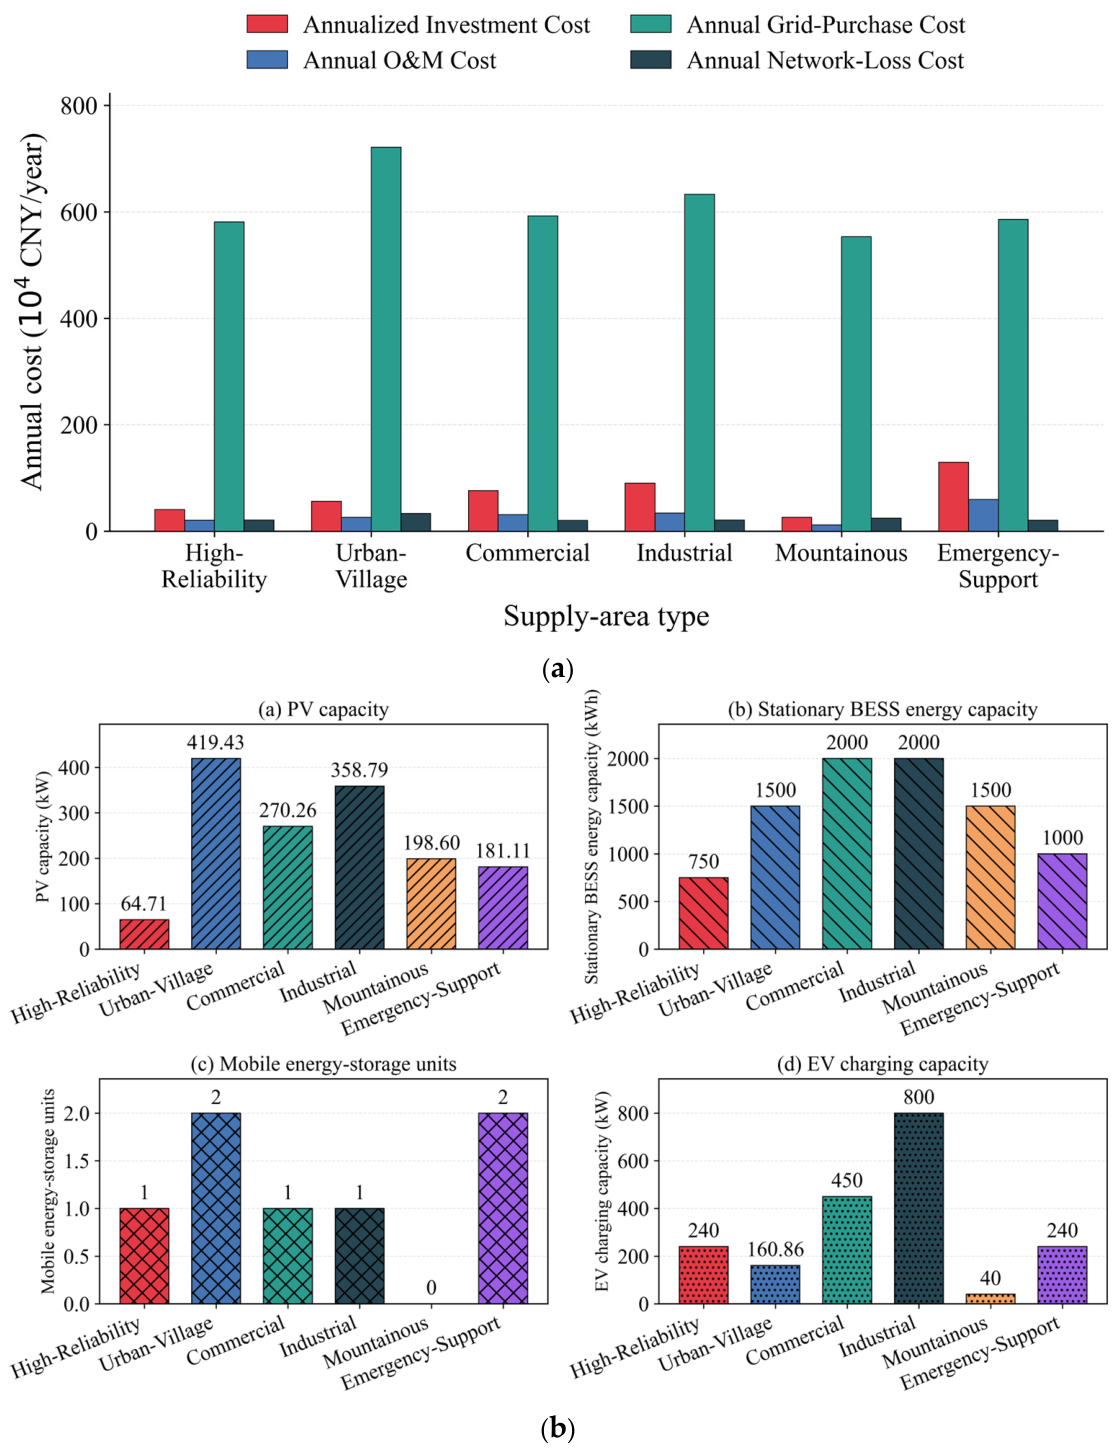
On this basis, the supply-area-specific inputs are incorporated into the coordinated planning model in Section 3 and solved by DAOA. The aggregate investment and annual cost components across the six supply-area types are summarized jointly in Figure 8 and Figure 9. Figure 8 reports the investment breakdown, while Figure 9 presents the corresponding equivalent annual cost components together with the resulting overall resource deployment. The results indicate that the planning outcomes are jointly shaped by rooftop PV potential, load and EV charging demand characteristics, supply-reliability requirements, and the associated weighting coefficients in Table 4. In particular, high-reliability areas exhibit relatively limited PV deployment, mainly due to tighter planning requirements under constrained rooftop availability, which makes the objective more sensitive to reliability- and constraint-related penalties. Consequently, a larger share of the investment is allocated to energy storage to support the prescribed reliability and emergency-support objectives, whereas EV charging infrastructure is sized to meet the area-specific charging demand within the allowable system limits. By contrast, urban-village and industrial areas accommodate higher PV capacities owing to more favorable rooftop conditions and stronger customer adoption conditions, which improves the economic attractiveness of PV integration. For mountainous areas, longer electrical distances and end-of-feeder voltage constraints lead to more conservative deployment decisions, as additional distributed resources incur higher reliability-related and operational-constraint penalties. Finally, for emergency-support public-facility areas, storage allocation tends to be higher to enable rapid emergency power support, which also increases the associated annual O&M-related cost contribution.
Figure 8.
Breakdown of investment costs across the six supply-area types.
Figure 9.
(a) Comparison of average annual costs across the six supply-area types. (b) Comparison of coordinated PV–ESS–EV configurations across the six supply-area types.
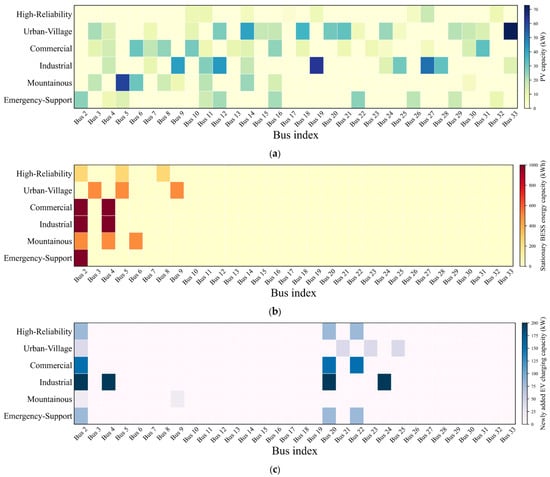
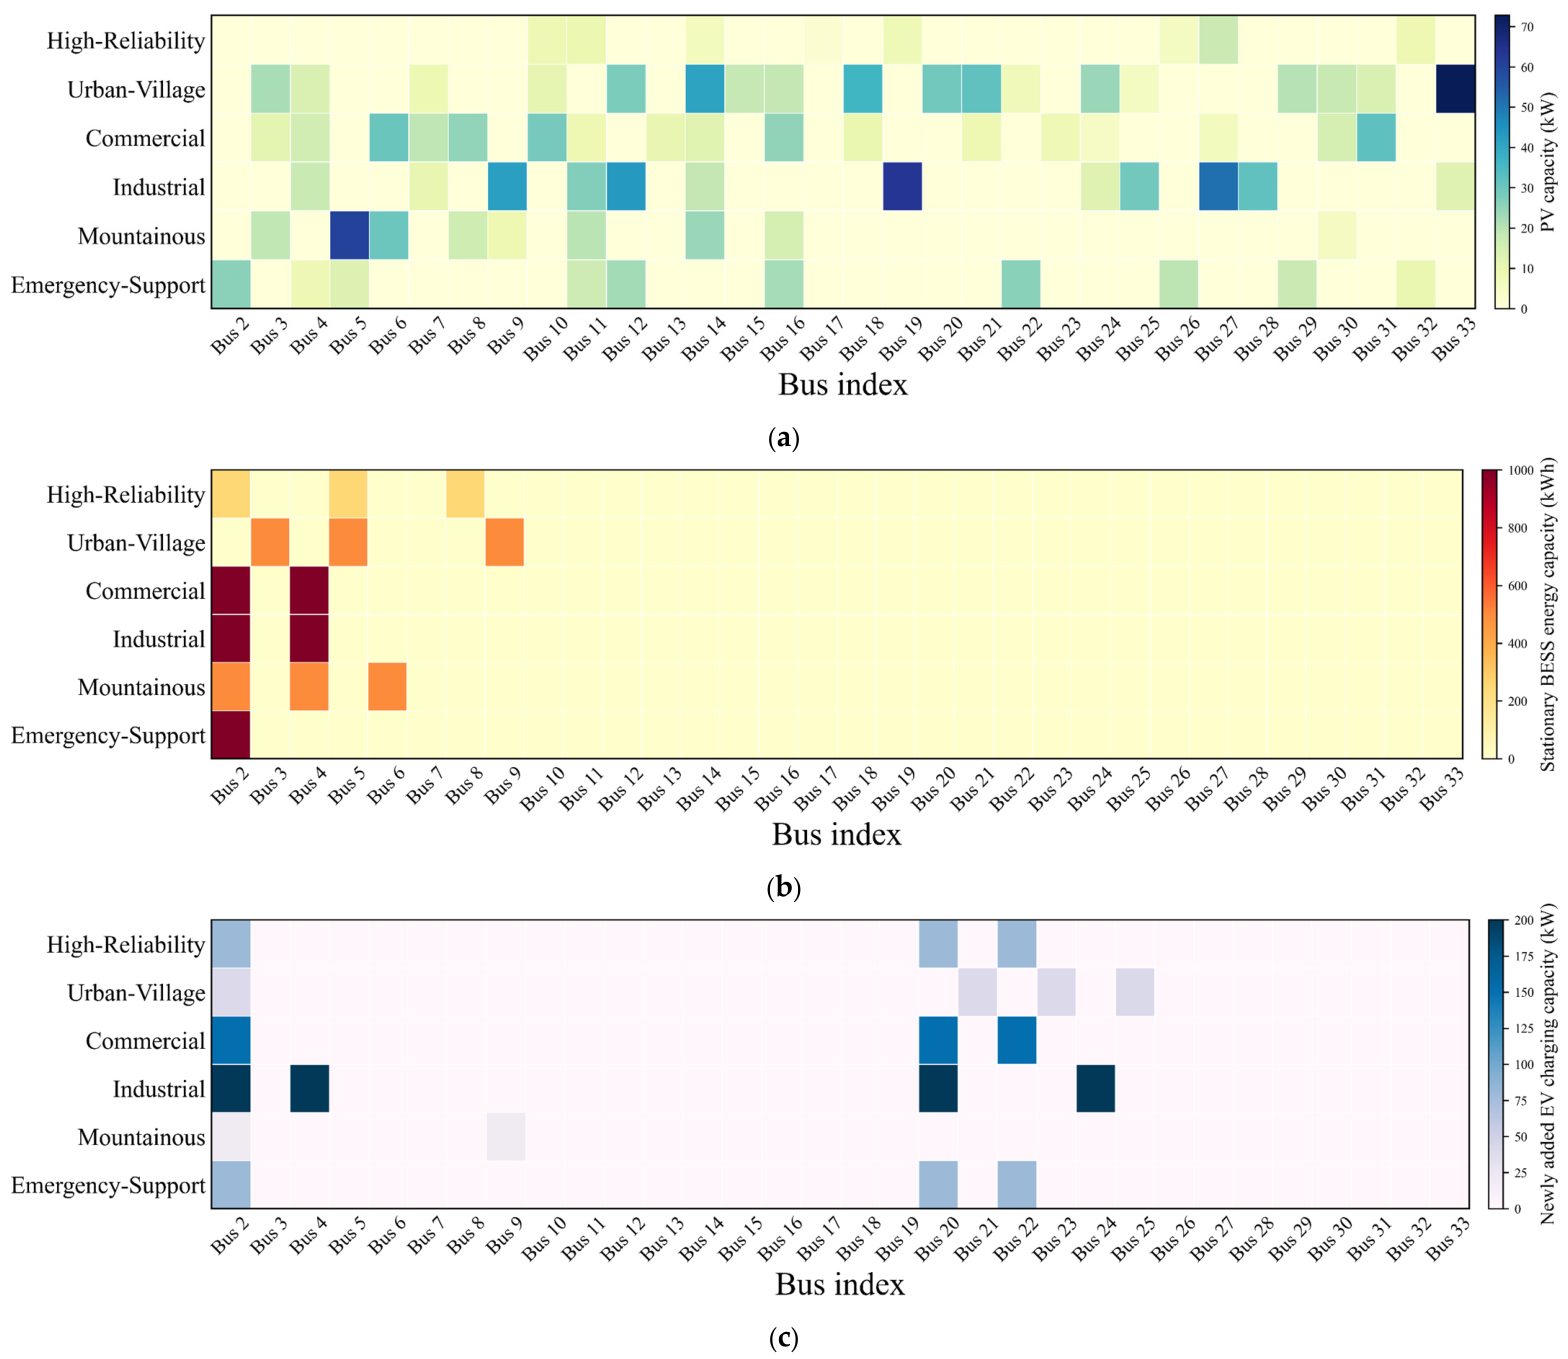
Beyond aggregate costs and total deployments, Figure 10 provides the bus-level allocation patterns of the planned resources under the six supply-area types. Specifically, Figure 10a–c show, respectively, the installed PV capacity, the stationary BESS energy capacity, and the additional EV charging capacity allocated to each bus. These spatial allocations further corroborate that the proposed parameterization translates supply-area heterogeneity into both system-level and location-level planning decisions. PV deployments concentrate at buses with larger rooftop-based capacity limits, while stationary BESS installations are placed where they can better mitigate local voltage and loading constraints and improve reliability performance under the corresponding supply-area requirements. EV charging capacity additions follow the assumed charging-demand levels and are subject to the allowable site and network constraints embedded in the optimization. Taken together, Figure 7, Figure 8, Figure 9 and Figure 10 demonstrate that the proposed multi-scenario, supply-area-aware modeling framework produces planning decisions that are consistent with the differentiated resource, demand, and reliability characteristics of different supply-area types. It should be noted that these comparisons are conducted among different supply-area parameterizations within the proposed coordinated framework. They therefore demonstrate the differentiated behavior of the proposed formulation, rather than a quantified performance advantage over an uncoordinated-planning benchmark.
Figure 10.
(a) Node-wise PV installation results under the six supply-area types. (b) Node-wise stationary BESS energy configuration under the six supply-area types. (c) Node-wise newly added EV charging loads under the six supply-area types.
5.3. Case Studies on Different Representative Distribution Systems
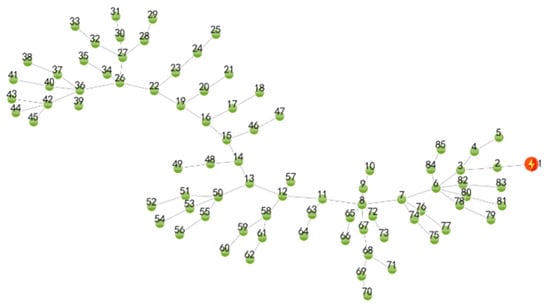
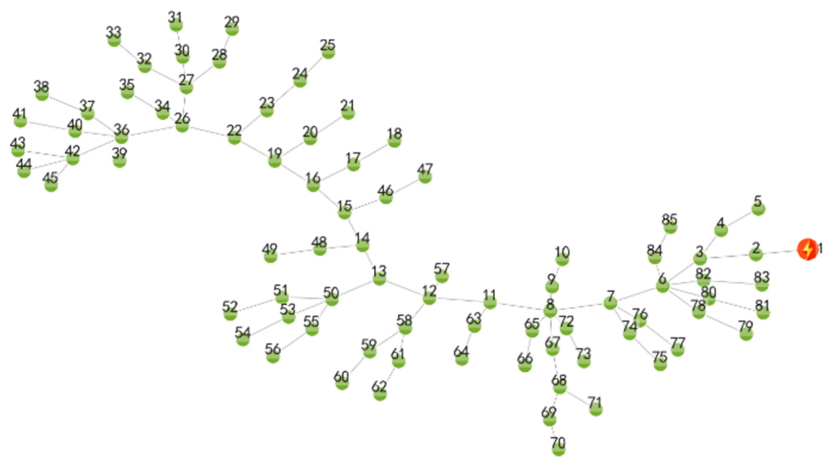
To verify the applicability and effectiveness of the proposed coordinated planning method for PV, energy storage, and EV charging across different practical distribution-network scenarios, additional case studies on representative distribution systems are conducted. In practice, the planning framework is typically applied after the operating scenario is determined and then adapted to enable coordinated planning of distributed resources. Accordingly, a real 10-kV feeder topology originating from a local distribution substation is adopted as the representative case in Figure 11. In addition, three representative distribution-system cases from [30] are included for comparison, covering rural, urban, and industrial park environments.
Figure 11.
Physical topology of a real 10-kV feeder originating from a local distribution substation.
For the case-study settings, besides the feeder structure and the network size, all other model parameters, weighting-coefficient configurations, and the solution approach are kept consistent with those used for the 33-bus system to ensure fair comparisons across different cases. The four planning cases are defined as follows:
Case 1: the real 10-kV feeder topology originating from a local distribution substation, with an 85-bus distribution network, configured as a high-reliability area;
Case 2: a representative 10-kV rural feeder case with a 51-bus network, configured as an urban-village area;
Case 3: a representative 10-kV urban feeder case with a 45-bus network, configured as a commercial area;
Case 4: a representative 10-kV industrial-park feeder case with a 37-bus network, configured as an industrial area.
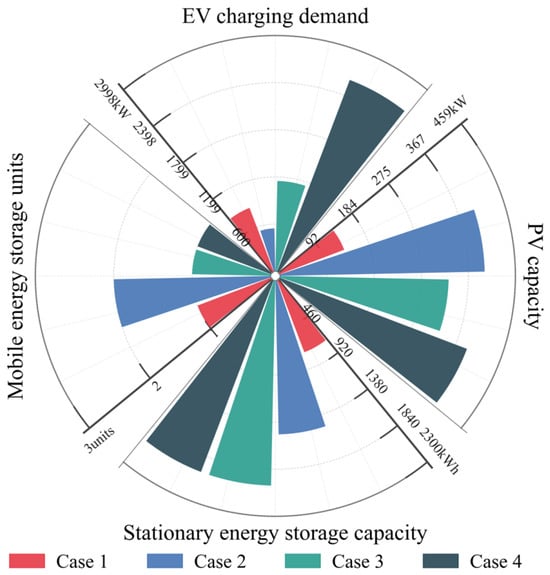
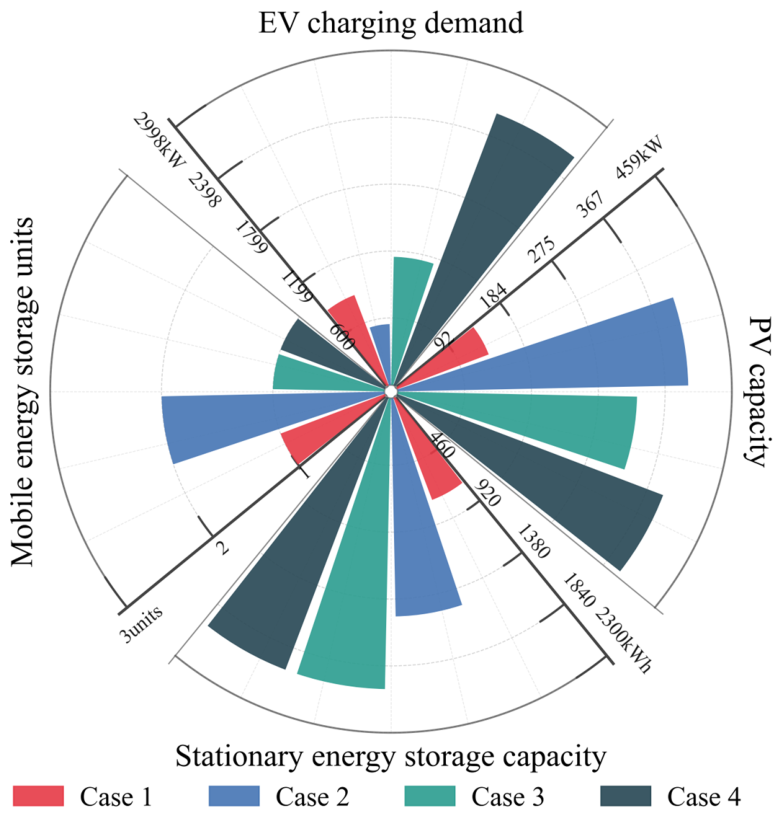
The comparison results of the coordinated planning decisions are reported in Table 8 and Figure 12. Table 8 summarizes the equivalent annual total cost under each case and the corresponding cost breakdown, while Figure 12 reports the resulting planned deployment levels of PV systems, energy storage systems, and EV charging infrastructure. Under the same solution framework and algorithm, the optimized plans still exhibit noticeable differences across the four cases. These differences are consistent with the combined effects of network size, topology, and load distribution, which alter the power-flow conditions and the corresponding operational and reliability evaluations. Accordingly, different investment allocations among PV deployment, energy storage, and EV charging infrastructure are obtained across the four network cases.
Table 8.
Comparison of average annual costs for the four distribution-network cases.
Figure 12.
Comparison of the planned capacities of PV systems, energy storage systems, and EV charging infrastructure across the four distribution-system cases.
Compared with the planning outcomes obtained on the IEEE 33-bus system, the relative deviations among Case 1–Case 4 become even more significant. This observation indicates that, under different distribution-network characteristics, the relative importance of PV accommodation, storage deployment, and EV charging infrastructure sizing should be adapted rather than kept fixed. These results show that planning outcomes vary noticeably with network structure and operating conditions, indicating the importance of accounting for network- and area-specific characteristics in distribution-network planning. Within the scope of the present case studies, the proposed multi-scenario, supply-area-aware framework provides a consistent means of representing these differences.
To provide a consolidated verification of reliability and operational performance for the four practical distribution-network cases, Table 9 reports the post-optimization indicators and compares the reliability-related metrics (EENS, N-1 load coverage, and voltage deviation) against the corresponding prescribed targets/allowable limits parameterized for each supply-area classification (Table 3). Meanwhile, Table 9 reports the operational loss metrics and the peak-demand indicator using the definitions provided in the table notes, whereas Table 8 presents the monetized network-loss cost derived from Equation (16). The results indicate that the optimized planning solutions satisfy the reliability requirements and keep voltage deviations within allowable bounds across all cases. Overall, these findings validate the effectiveness of the proposed differentiated parameterization and coordinated multi-scenario planning framework.
Table 9.
Performance verification against prescribed targets across four distribution-network cases.
5.4. Verification of Algorithm Performance
To verify the effectiveness of the proposed DAOA, it is compared with the conventional AOA and Particle Swarm Optimization (PSO) [31]. For the repeated-run evaluation on the IEEE 33-bus system, the Whale Optimization Algorithm (WOA) [32] and the Sparrow Search algorithm (SSA) [33] are additionally included to broaden the benchmark comparison. The comparison is conducted using the objective function described in Section 3, where the equivalent daily total life-cycle cost and the multiple reliability-related penalty terms are combined to form the fitness value.
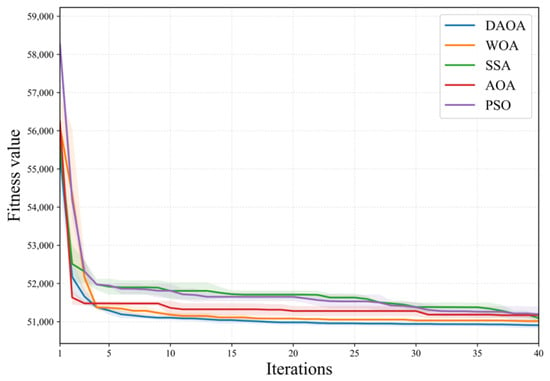
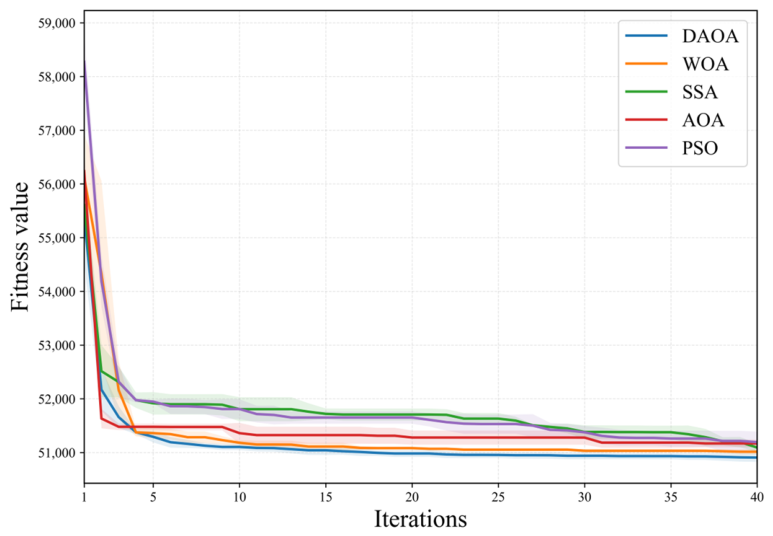
All five algorithms use the same decision-variable bounds, fitness function, population size of 30, and maximum iteration limit of 40. Thirty independent runs with different random seeds are performed for each algorithm. Figure 13 presents the mean convergence trajectories obtained from the 30 independent runs, with the shaded bands indicating ±1 standard deviation. The mean final fitness values and their standard deviations at the final iteration are summarized in Table 10. Under the adopted test settings, DAOA achieves the lowest mean final fitness among the five compared algorithms in the repeated-run experiments.
Figure 13.
Mean convergence trajectories of the five optimization algorithms over thirty independent runs; shaded bands indicate ±1 standard deviation.
Table 10.
Detailed statistical comparison of algorithm performance (30 independent runs).
To strengthen the algorithm comparison, Wilcoxon rank-sum tests (two-sided, alpha = 0.05) are performed on the 30-run final-fitness samples. The corresponding p-values are reported in Table 10. The results indicate that DAOA obtains statistically significant improvements over WOA, SSA, AOA, and PSO at the 0.05 significance level.
Table 11 reports the computational results on several distribution-network cases. As the problem size and constraint severity vary across cases, the compared metaheuristic methods may exhibit different convergence and computational characteristics. The values in Table 11 are representative case-level results used to compare the computational behavior across different distribution-network cases, whereas the repeated-run statistical comparison is reported separately in Figure 13 and the preceding analysis. In this setting, DAOA’s iteration-dependent dynamic step-size control helps maintain effective search behavior throughout the optimization process. Consequently, for all considered cases in Table 11, the final total cost obtained by DAOA is lower than those obtained by both AOA and PSO.
Table 11.
Comparison of solution algorithms’ performance.
6. Conclusions
This paper studies the adaptation challenge of coordinated planning for distributed PV systems, energy storage systems, and EV charging infrastructure under heterogeneous resource endowments and supply-reliability requirements across supply areas. A multi-scenario coordinated planning method is proposed by explicitly accounting for regional heterogeneity. Specifically, six representative supply-area types are constructed to parameterize the differences in PV resource availability, load characteristics, and reliability objectives. Multi-scenario modeling is then used to couple scenario generation with area-specific constraints. The proposed framework is validated through case studies, and the main findings are summarized as follows.
- (1)
- The proposed scenario-parameterized modeling framework provides an effective way to represent core differences among supply areas. Results based on the six representative supply-area types indicate that the framework yields area-dependent decisions. For high-reliability areas, energy-storage resources are prioritized to support continuity of supply and emergency power support. For urban-village and industrial areas, PV deployment and utilization are emphasized to improve PV energy accommodation. Quantitatively, the planned PV capacity ranges from 64.71 kW in the high-reliability area to 419.43 kW in the urban-village area, while the stationary BESS energy capacity ranges from 750 to 2000 kWh across the six supply-area types. These results show that the coordinated planning model can represent area-specific economic and reliability trade-offs and generate planning decisions reflecting the differentiated characteristics of the considered supply-area types.
- (2)
- The proposed improved dynamic arithmetic optimization algorithm shows favorable solution performance for the coordinated planning model under the adopted test settings. The repeated-run comparison indicates that DAOA achieves the lowest mean final fitness among the five compared algorithms while maintaining stable convergence behavior. The corresponding mean final fitness is 50,906.23 ± 79.50. These results support the effectiveness of the dynamic step-size mechanism for the planning cases considered in this study, without implying general superiority across optimization problems.
- (3)
- Test results on the IEEE 33-bus system, several representative distribution-network cases, and a real distribution-network topology show differentiated planning outcomes under the adopted network characteristics, operating conditions, and engineering parameter settings. The results illustrate the application of the proposed parameterization and coordinated formulation to the cases considered; they do not establish a quantified advantage over a uniform-planning or uncoordinated-planning baseline.
The present formulation applies probabilistic scenario modeling to weather-dependent PV generation, while base-load and EV-charging profiles are represented deterministically for each supply-area case. Future work will extend the uncertainty treatment to explicitly capture variations in base load and EV charging demand using chance-constrained or distributionally robust optimization. In addition, systematic sensitivity analyses and calibration of the area-dependent weighting coefficients will be investigated. The joint optimization framework will be further extended to incorporate multi-party interactions, including PV and energy storage participation in electricity markets together with EV-charging decision-making.
Supplementary Materials
The following supporting information can be downloaded at: https://www.mdpi.com/article/10.3390/pr14213528/s1, Supplementary Data for Multi-Scenario Coordinated Planning Study: Supporting numerical data for the revised manuscript, including PV profiles in Figure 4, load profiles in Figure 5, exact planning parameter settings, and implementation settings recoverable from the supplied code; Numerical Data Underlying Figure 4: Representative PV Profiles; Numerical Data Underlying Figure 5: Six Supply-Area Load Profiles; Benchmark Numerical Parameter Settings; Penalty Coefficients from Manuscript Table 3; Implementation Settings Recoverable from Supplied Code.
Author Contributions
Conceptualization, L.L.; methodology, Q.Z.; validation, W.P.; formal analysis, Z.H.; investigation, M.L.; resources, J.L. and J.D.; writing, J.D. All authors have read and agreed to the published version of the manuscript.
Funding
This research was funded by [the Science & Technology Program of Guangdong Power Grid Co., Ltd.] grant number [030100KC24070043].
Data Availability Statement
The numerical data underlying the representative PV and load profiles and the parameter settings used for the benchmark case studies are provided in the Supplementary Materials. The detailed topology and operational data of the real 10-kV distribution feeder are not publicly available due to utility confidentiality and data-access restrictions.
Conflicts of Interest
Authors Linhuan Luo, Qilin Zhou, Wei Pan, Zhian He and Minghao Liu were employed by Guangzhou Power Supply Bureau of Guangdong Power Grid Co., Ltd. The remaining authors declare that the research was conducted in the absence of any commercial or financial relationships that could be construed as a potential conflicts of interest.
References
- Huang, R.; Wang, P.; Zhang, S.; Ren, Z.; Pu, L. Power system transition pathways in mega-cities under the “dual carbon” targets: A multi-temporal case study of Beijing in China. Renew. Energy 2026, 260, 125221. [Google Scholar] [CrossRef] [Scilit]
- Bernal-Agustín, J.L.; Lujano-Rojas, J.M.; Artal-Sevil, J.S.; Dufo-López, R. Techno-economic planning of battery energy storage for renewable hosting capacity in active distribution networks. Appl. Energy 2026, 424, 128497. [Google Scholar] [CrossRef] [Scilit]
- Faustine, A.; Nunes, N.J.; Pereira, L. Efficiency through simplicity: Mlp-based approach for net-load forecasting with uncertainty estimates in low-voltage distribution networks. IEEE Trans. Power Syst. 2025, 40, 46–56. [Google Scholar] [CrossRef] [Scilit]
- Munikoti, S.; Natarajan, B.; Jhala, K.; Lai, K. Probabilistic voltage sensitivity analysis to quantify impact of high pv penetration on unbalanced distribution system. IEEE Trans. Power Syst. 2021, 36, 3080–3092. [Google Scholar] [CrossRef] [Scilit]
- Liu, Z.; Wang, Z.; Chen, Y.; Ren, Q.; Zhao, J.; Qiu, S.; Zhao, Y.; Zhang, H. A hierarchical distributed and local voltage control strategy for photovoltaic clusters in distribution networks. Processes 2025, 13, 1633. [Google Scholar] [CrossRef] [Scilit]
- Khalid, M. Discussion on “short-term reactive power planning to minimize cost of energy losses considering PV systems”. IEEE Trans. Smart Grid 2020, 11, 1812. [Google Scholar] [CrossRef]
- Yu, Z.; Yang, C.; Wang, Q. The impact of large-scale EV charging on the real-time operation of distribution systems: A comprehensive review. Renew. Sustain Energy Rev. 2027, 243, 117375. [Google Scholar] [CrossRef] [Scilit]
- Yong, P.; Yang, Z. Power resource planning for cellular base stations in distribution networks toward renewable transitions. IEEE Trans. Ind. Informat 2026, 22, 8596–8607. [Google Scholar]
- Liu, X.; Zhao, P.; Qu, H.; Liu, N.; Zhao, K.; Xiao, C. Optimal placement and sizing of distributed PV-storage in distribution networks using cluster-based partitioning. Processes 2025, 13, 1765. [Google Scholar] [CrossRef] [Scilit]
- Wang, C.; Liu, C.; Chen, J.; Zhang, G. Cooperative planning of renewable energy generation and multi-timescale flexible resources in active distribution networks. Appl. Energy 2024, 356, 122429. [Google Scholar] [CrossRef] [Scilit]
- Chakraborty, R.; Das, P.; Das, D.; Gope, S.; Das, P. Stochastic planning framework for EV charging stations with distributed energy resources in unbalanced distribution networks considering ecological sustainability. Appl. Energy 2026, 423, 128404. [Google Scholar] [CrossRef] [Scilit]
- Yao, H.; Xiang, Y.; Gu, C.; Liu, J. Optimal planning of distribution systems and charging stations considering PV-grid-EV transactions. IEEE Trans. Smart Grid 2025, 16, 691–703. [Google Scholar] [CrossRef] [Scilit]
- Li, J.; Li, F.; Sun, K.; Sun, B. Bi-level coordinated expansion planning of high-PV-penetration active distribution networks incorporating multiple flexible resources considering WGAN-GP-based uncertainty generation. Energy 2025, 330, 136685. [Google Scholar] [CrossRef] [Scilit]
- Xiao, J.; Zhang, Z.; Terzi, S.; Tao, F.; Anwer, N.; Eynard, B. Multi-scenario digital twin-driven human-robot collaboration multi-task disassembly process planning based on dynamic time petri-net and heterogeneous multi-agent double deep q-learning network. J. Manuf. Syst. 2025, 83, 284–305. [Google Scholar] [CrossRef] [Scilit]
- Wang, G.; Qian, Z.; Feng, X.; Ren, H.; Zhou, W.; Wang, J.; Ji, H.; Li, P. Data-driven operation of flexible distribution networks with charging loads. Processes 2023, 11, 1592. [Google Scholar] [CrossRef] [Scilit]
- Shi, Z.; Yang, Y.; Xu, Q.; Cheng, A.; Wu, C.; Pang, S. An information gap decision theory-based bi-level robust model for low-carbon transition planning of distribution network considering multi-source uncertainties. Renew. Energy 2026, 273, 126091. [Google Scholar] [CrossRef] [Scilit]
- Wang, X.; Kang, Q.; Guo, L.; Zhang, F.; Liang, Z.; Gao, J.; Wang, X.; Liu, W. Economic evaluation for 5g planning of a distribution network considering network coupling and important node identification. Prot. Control Mod. Power Syst. 2024, 9, 126–141. [Google Scholar] [CrossRef] [Scilit]
- Puzhuang, L.; Kamari, N.A.B.M.; Zaman, M.H.M.; Zulkifley, M.A. Regional-adaptive multi-objective planning and operation for cooperative energy sharing of hybrid energy storage systems under zonal heterogeneity. Energy Convers. Manag. 2026, 366, 121819. [Google Scholar] [CrossRef] [Scilit]
- Cao, K.; Liu, Y.; Wang, C. Deep learning-assisted distributionally robust optimization of shared energy storage for distribution network resilience enhancement. Eng. Appl. Artif. Intell. 2026, 167, 113834. [Google Scholar] [CrossRef] [Scilit]
- Wang, S.; Dong, Y.; Wu, L.; Yan, B. Interval overvoltage risk based pv hosting capacity evaluation considering pv and load uncertainties. IEEE Trans. Smart Grid 2020, 11, 2709–2721. [Google Scholar] [CrossRef] [Scilit]
- Gu, Y.; Ullah, Z.; Wang, P.; Alferidi, A.; Alsolami, M.; Lami, B.; Hasanien, H.M. Decision-dependent spatiotemporal co-optimization of PV–battery–hydrogen urban EV charging networks under mobility and renewable uncertainty. Appl. Energy 2026, 422, 128336. [Google Scholar] [CrossRef] [Scilit]
- Wen, Z.; Zhang, X.; Wang, H.; Wang, G.; Wu, T.; Qiu, J. Low-carbon planning for integrated power-gas-hydrogen system with wasserstein-distance based scenario generation method. Energy 2025, 316, 134388. [Google Scholar] [CrossRef] [Scilit]
- Sheng, Y.; Shen, L.; Wang, W.; Sun, Y. Optimal planning of urban-scale rooftop PV systems for maximizing renewable energy integration by reducing grid congestion-induced curtailments: A case study. Renew. Energy 2026, 264, 125559. [Google Scholar] [CrossRef] [Scilit]
- Bass, F.M. A new product growth for model consumer durables. Manag. Sci. 1969, 15, 215–227. [Google Scholar] [CrossRef] [Scilit]
- GB 50613-2010; Code for Planning and Design of Urban Distribution Network. Standards Press of China: Beijing, China, 2010.
- Xiao, J.; Zu, G.; Zhou, H.; Zhang, X. Total quadrant security region for active distribution network with high penetration of distributed generation. J. Mod. Power Syst. Clean Energy 2021, 9, 128–137. [Google Scholar] [CrossRef] [Scilit]
- Abualigah, L.; Diabat, A.; Mirjalili, S.; Elaziz, M.A.; Gandomi, A.H. The arithmetic optimization algorithm. CMAME 2021, 376, 113609. [Google Scholar] [CrossRef] [Scilit]
- Arthur, D.; Vassilvitskii, S. K-means++: The advantages of careful seeding. In Proceedings of the Eighteenth Annual ACM-SIAM Symposium on Discrete Algorithms (SODA 2007), New Orleans, LA, USA, 7–9 January 2007; pp. 1027–1035. [Google Scholar]
- Qiu, Z.; Mo, Y. Location planning of flexible direct-current interconnection control device for distribution network based on optimal power flow. Expert Syst. Appl. 2025, 294, 128771. [Google Scholar] [CrossRef] [Scilit]
- Sun, C.; Li, J.; Luo, F.; Yuan, K.; Song, Y.; Zhang, T.-Y. Typical case design of distribution system considering dg integration. Electr. Power Constr. 2020, 41, 47–62. [Google Scholar]
- Kennedy, J.; Eberhart, R. Particle swarm optimization. Proc. ICNN’95-Int. Conf. Neural Netw. 1995, 4, 1942–1948. [Google Scholar]
- Mirjalili, S.; Lewis, A. The whale optimization algorithm. Adv. Eng. Softw. 2016, 95, 51–67. [Google Scholar] [CrossRef] [Scilit]
- Xue, J.; Shen, B. A novel swarm intelligence optimization approach: Sparrow search algorithm. Syst. Sci. Control Eng. 2020, 8, 22–34. [Google Scholar] [CrossRef] [Scilit]

Disclaimer/Publisher’s Note: The statements, opinions and data contained in all publications are solely those of the individual author(s) and contributor(s) and not of MDPI and/or the editor(s). MDPI and/or the editor(s) disclaim responsibility for any injury to people or property resulting from any ideas, methods, instructions or products referred to in the content. |
© 2026 by the authors. Licensee MDPI, Basel, Switzerland. This article is an open access article distributed under the terms and conditions of the Creative Commons Attribution (CC BY) license.