


Abstract
Microwave-assisted steam gasification offers a potential electrified pathway for hydrogen production, but the influence of reactor hydrodynamics on microwave-assisted gasification performance remains insufficiently understood. This study experimentally compares hydrogen production by steam gasification of activated carbon in microwave-assisted packed- and fluidized-bed reactors, with particular emphasis on the effects of bed configuration, reaction temperature, and steam flow rate on hydrogen production and thermodynamic performance. Activated carbon serves as the carbonaceous reactant and microwave susceptor. The two reactor configurations exhibited distinctly different behavior. In the packed-bed reactor, the maximum hydrogen yield of approximately 50% was obtained at 700 °C and a water flow rate of 0.0082 mL/min, with corresponding maximum energy and exergy efficiencies of 13.37% and 6.2%, respectively. The maximum hydrogen production rate of 0.00733 mg/s occurred at a water flow rate of 0.0164 mL/min and the highest carbon conversion was found to be 29.2% in the packed-bed reactor. In comparison, the fluidized-bed reactor achieved a lower maximum hydrogen yield of 31.6% at 700 °C and 0.0082 mL/min, while its maximum hydrogen production rate reached 0.0059 mg/s under the same conditions. Maximum energy and exergy efficiencies of 5.3% and 2.60%, respectively, were obtained in the fluidized bed at 750 °C and 0.0164 mL/min and the highest carbon conversion was found to be 33.8% for fluidized bed. Despite the enhanced gas–solid contacting and thermal uniformity generally associated with fluidization, the packed bed exhibited substantially higher hydrogen yield and thermodynamic efficiencies. The observed differences suggest that the conventional transport advantages of fluidization may be offset in microwave-assisted reacting systems by changes in microwave–particle interaction, steam residence time, and heat losses. The results demonstrate that reactor hydrodynamics and microwave energy deposition should be considered together when designing microwave-assisted gasification systems for hydrogen production.
1. Introduction
Rising greenhouse gas (GHG) emissions are driving global temperature rise well beyond the 1.5 °C limit [1,2]. Hydrogen has emerged as a promising clean energy carrier because of its high energy density and compatibility with renewable energy systems [3,4,5,6]. It is widely used in petroleum refining, biofuel production, metal processing, chemical synthesis and energy applications [1,7,8,9,10], yet its production remains energy-intensive [9,10,11]. Global hydrogen demand reached almost 100 million tons in 2024, but low-emission hydrogen accounted for less than 1% of that supply [12]. Most hydrogen is still produced from fossil fuels, mainly by steam methane reforming (SMR), which emits approximately 9–10 kg of CO2 per kg of H2; even with carbon capture and storage, the CO2 reduction rarely exceeds 90% [9,10,12]. Water electrolysis is the most mature low-carbon route, but its large-scale adoption is limited by high electricity demand and cost [9,12]. In a fixed (packed) bed, the particles stay stationary and the gas flows through the voids between them. In a fluidized bed, the gas velocity exceeds the minimum fluidization velocity, so the particles are suspended and move like a fluid; this improves gas–solid mixing and heat transfer, but it also causes particle attrition and makes heat distribution harder to control [13,14]. Because bed hydrodynamics set the gas–particle contact time and the heat supply to the particles, the reactor configuration is expected to affect gasification performance.
Beyond steam methane reforming, gasification of carbonaceous solids—coal, petroleum coke, biomass, and industrial carbon residues—with steam, air, or oxygen is another established thermochemical route to hydrogen-rich syngas. Industrial gasification is carried out in fixed-bed, fluidized-bed, or entrained-flow reactors, which differ sharply in operating temperature and feedstock particle size and consequently in achievable carbon conversion and syngas composition: fixed-bed gasifiers typically operate at 1000–1100 °C with particle sizes around 5 cm, fluidized-bed gasifiers at a lower 800–1000 °C with particle sizes near 0.6 mm, and entrained-flow gasifiers at 1200–1700 °C with fine particles of approximately 0.015 cm [15]. In a fixed (packed) bed, the particles stay stationary and the gas flows through the voids between them. In a fluidized bed, the gas velocity exceeds the minimum fluidization velocity, so the particles are suspended and move like a fluid; this improves gas–solid mixing and heat transfer, but it also causes particle attrition and makes heat distribution harder to control [13,14]. Because bed hydrodynamics set the gas–particle contact time and the heat supply to the particles, the reactor configuration is expected to affect gasification performance.
The steam–carbon (water–gas) reaction proceeds through steam chemisorption on a free carbon active site to form a surface oxide complex with release of H2, followed by decomposition of that complex to release CO and regenerate the active site, as shown in Equation (1) [16]. The overall rate is therefore governed jointly by this two-step surface mechanism and by pore/gas-film mass transfer, both of which are strongly dependent on temperature and steam partial pressure, with a reported reaction order of 0.43–0.55 with respect to steam partial pressure [16]. Because reactor hydrodynamics govern the local gas–particle contact time and heat supply that set these rate-limiting steps, the choice between fixed-bed and fluidized-bed configurations is expected to directly affect gasification performance, a relationship established under conventional heating but largely untested under microwave irradiation.
Microwave heating has shown strong potential for hydrogen production [17,18,19,20]. It operates in the 0.3–300 GHz range, commonly at 915 MHz or 2.45 GHz, and converts electromagnetic energy directly into heat inside the absorbing material [21,22], which gives rapid, volumetric and controllable heating [23]; similar energy-efficiency advantages over conventional heating have been shown in regeneration and separation processes [24]. Microwave heating depends on the dielectric, magnetic and electrical properties of the material [9]. Activated carbon (AC) is a strong microwave absorber because of its high dielectric loss tangent, so it can act as both the reactant and the microwave susceptor [25]. Microwave heating has been applied to hydrogen production by water splitting [26], plasma dissociation of water vapor [27,28], biomass pyrolysis [1] and methane decomposition over AC [29,30], generally improving reaction rates and hydrogen yields compared with conventional heating [9]. Horikoshi et al. [10] produced hydrogen from wastewater and seawater over microwave-heated AC in a packed bed, and Dadsetan et al. [30] used AC as a microwave receptor in a fluidized-bed reactor. However, each of these studies used a single-bed configuration, and packed-bed and fluidized-bed operation have not been compared directly for microwave-assisted steam gasification.
As mentioned earlier, sustainable hydrogen production via water splitting using catalysts and innovative heating technologies has gained increasing attention, with catalysts such as activated carbon (AC), zeolites, and Ce/Zr-based materials facilitating water gasification upon heating. Among heating methods, microwave heating has demonstrated strong potential due to its efficiency and unique interaction with catalytic materials [17,18,19,20]. Microwave heating operates within 0.3–300 GHz frequency range, commonly at 915 MHz and 2.45 GHz for industrial and scientific applications where electromagnetic energy is converted directly into thermal energy [21,22]. It creates local heating, which enhances reaction rates, improves energy efficiency, and enables precise temperature control. These energy-efficiency and rapid-heating advantages of microwave-based processes over conventional thermal methods have also been demonstrated in other regeneration and separation applications [24]. Microwave interactions depend on the dielectric, magnetic, and electrical properties of materials. For example, polar molecules such as water generate heat through rotational motion and molecular friction under alternating electric fields, while dielectric solids experience electron excitation and lattice vibrations, and electrically conductive materials such as metals generate heat primarily through induced eddy currents rather than dielectric polarization [9]. Among solid materials, activated carbon is an effective microwave absorber and is widely used as a catalyst or support material in hydrogen production due to its high dielectric loss tangent [25]. Microwave-induced volumetric heating [23] accelerates steam–carbon reactions and improves temperature uniformity, while continuous particle circulation in the fluidized bed helps reduce the temperature of hot spots created by microwave irradiation [31].
A limited number of studies have investigated the use of microwave heating for hydrogen production. For example, Serra et al. [26] demonstrated a contactless, cyclable, microwave-induced water-splitting method for hydrogen production at low temperatures (<250 °C) using solid-state ionic materials, thereby reducing system complexity by eliminating electrodes, electrolytic cells, and high operating temperatures, and enabling the production of fuels such as methane. Zhao et al. [9] reviewed microwave-enhanced hydrogen production from plastic waste, biomass, low-carbon alcohols, and methane, highlighting its efficiency, effectiveness, and cost advantages over conventional heating. Chehade et al. [27] also proposed a microwave-based plasma process for water vapor dissociation, achieving hydrogen concentrations of 2500–8000 ppm with energy and exergy efficiencies up to 53.7% and 44%, respectively. Younas et al. [28] reviewed conventional and emerging hydrogen production pathways, emphasizing plasma-based and microwave-assisted plasmolysis as promising alternatives to steam methane reforming due to their lower environmental impact and competitive hydrogen yields of up to 20 g kWh−1. Moreover, Sridevi et al. [1] reviewed microwave-assisted pyrolysis of lignocellulosic biomass and showed that microwave heating improves reaction kinetics and hydrogen-rich syngas production compared to conventional pyrolysis. Gao et al. [27] introduced a microwave-assisted thermochemical water-splitting cycle using a high-entropy oxide catalyst, in which microwave irradiation accelerated oxygen-vacancy formation, shortened reaction times to minutes, and achieved hydrogen yields of up to 122 mL/g/cycle with lower energy consumption.
In studies of microwave heating of various water sources in a packed-bed reactor, Horikoshi et al. [10] demonstrated hydrogen production from contaminated water and seawater using microwave-heated activated carbon, thereby achieving significant energy savings. Dominguez et al. [29] showed that microwave heating enhanced methane conversion and hydrogen production compared with AC, owing to volumetric heating and the formation of localized microplasmas. However, catalyst deactivation occurred due to carbon deposition that blocked active sites. Similarly, Suttisawat et al. [32] reported improved conversion, faster reaction rates, and reduced catalyst deactivation during microwave-assisted tetralin dehydrogenation using Pt-supported AC. Shi et al. [33] investigated microwave-assisted pyrolysis and reforming with activated carbon and observed enhanced H2 selectivity, increased gas yield, and reduced bio-oil formation due to intensified cracking and reforming reactions. Dadsetan et al. [30] developed a CO2-free, microwave-driven methane pyrolysis process in a fluidized-bed reactor where AC and recycled pyrolytic carbon served as microwave receptors and catalysts, achieving over 90% hydrogen selectivity and demonstrating strong potential for scalable hydrogen production.
In this study, activated carbon is used in fluidized-bed and packed-bed reactors where solid particles exhibit fluid-like behavior under upward gas flow, thereby enhancing heat and mass transfer. Although fluidized beds offer advantages such as excellent mixing and scalability, they also face challenges such as particle erosion and control of heat distribution [13,14]. Beyond these hydrodynamic trade-offs, the two configurations are expected to interact with microwave irradiation in fundamentally different ways. In a packed bed, the fixed spatial arrangement of AC particles presents a relatively constant dielectric load to the electromagnetic field, allowing the microwave generator and tuner to settle into a stable absorption state with minimal reflected power. In a fluidized bed, by contrast, continuous particle circulation changes the local packing density and orientation of AC within the cavity from moment to moment, which should produce a time-varying dielectric environment, fluctuate reflected power, and localize hot and cold spots rather than producing a uniform volumetric heating as expected in the packed configuration. These differences in microwave–particle coupling stability may be a major factor that identical steam–carbon reaction conditions which could produce different outcomes in the two bed types which is one of the motivations to perform this study. A recent computational work performed by Salakhi et al. supports this claim. The authors’ coupled CFD-DEM/electromagnetic modeling of microwave-heated fluidized beds can influence microwave power absorption and distribution, affecting the temperature of microwave-induced hot and cold spots as particles circulate through the electromagnetic field [31]. Direct experimental comparisons of packed- and fluidized-bed operation under microwave irradiation, including our own prior work on microwave-assisted gas–solid processes, have likewise found that fluidization redistributes heat more uniformly throughout the bed the localized heat accumulation observed under packed-bed conditions [34].
Hydrogen production through steam gasification of activated carbon typically follows the gasification reaction:
C + H2O → H2 + CO
This reaction occurs when water vapor comes into contact with hot AC particles. Efficient heat transfer is essential for achieving high gasification conversion, especially in fluidized beds where heat transfer occurs through wall–fluid, wall–particle, particle–particle, and fluid–particle interactions, with particle–particle and fluid–particle mechanisms being the most critical in dense beds. Microwave heating is particularly suitable for such reactors because it provides controlled volumetric heating [35]. Although challenges such as non-uniform energy distribution and the formation of hot and cold spots may occur in materials with low dielectric constants, microwave heating remains attractive for sustainable hydrogen production because of its high power density, compact system design, and ease of temperature control [36].
Despite growing interest in microwave-assisted gasification, how reactor hydrodynamics governs microwave–material coupling and, in turn, steam–carbon reaction behavior remains insufficiently understood. Packed and fluidized beds present fundamentally different electromagnetic environments: a fixed particle arrangement offers a stable dielectric medium for microwave penetration, whereas continuous particle motion in a fluidized bed should generate fluctuating dielectric properties, transient hot and cold spots, and time-varying microwave absorption. The differences in bed configuration in microwave–reactor coupling that translate into measurable differences in reaction performance have not been directly tested under identical operating conditions. This study investigates the effects of microwave-induced thermal and electromagnetic interactions in both reactor configurations on hydrogen yield, hydrogen production rate, carbon conversion, and energy–exergy efficiencies during steam–carbon gasification, used here as a probe reaction for microwave–reactor coupling. To the best of the authors’ knowledge, limited systematic experimental work has directly compared microwave-assisted packed- and fluidized-bed reactors for steam–carbon gasification under comparable operating conditions while simultaneously evaluating hydrogen production and thermodynamic performance. The present study addresses this gap by examining how reactor hydrodynamics influence the performance of microwave-assisted steam gasification.
2. Experimental and Materials
2.1. Experimental Setup
The experimental system used in this study was designed to deliver fully vaporized steam and preheated nitrogen into a microwave-heated carbon bed while enabling continuous control of temperature, microwave power, flow rate, and product composition. A schematic diagram of the experimental setup used in this study is shown in Figure 1. A gas mixture of water vapor and nitrogen was sent to the reactor through heated stainless-steel tubing. Deionized water was delivered using a syringe pump (KDS, Legato 100, Holliston, MA, USA) and was converted into steam by heating tape wrapped around insulated tubing. The temperature is measured with a K-type thermocouple (Omega, KMQXL-062E-3, Holliston, MA, USA) to ensure it remains above 100 °C, thereby converting all the water into steam. Nitrogen (N2) gas was preheated on a separate heating line before being mixed with steam. Thermocouples installed in the steam, nitrogen, and mixed-gas lines monitored temperatures, which were maintained at 130 °C, 130 °C, and 140 °C, respectively, using PID controllers. N2 flow rate was controlled using a mass flow controller (MFC) (GE50A-MKS instruments, Andover, MA, USA) within a range of 0–200 mL/min. The gas stream entered a custom-made quartz reactor (8 mm internal diameter, 10 mm external diameter, 48 mm length as shown in Figure S1d, manufactured by the glassblowing facility at the University of Alabama) positioned at the center of the microwave cavity where AC was packed between frits and quartz wool. Insulation (ALTRAFORM KVS 174–400, provided by Sairem Corp., Holliston, MA, USA) surrounding the reactor was used to minimize heat loss and protect the microwave cavity. The temperature of irradiated AC was measured using a pyrometer (Optris CT LT 22, ±1 °C, with a wavelength range between 0.8 and 2.6 µm with 99% transmittance, Holliston, MA, USA) focused on the center of the carbon bed. The microwave cavity (Figure S1c) was connected to a microwave generator (GMS-450, Sairem Inc., Holliston, MA, USA Figure S1b) capable of delivering 0–450 W, while a temperature controller (T-Box, Sairem Inc., Holliston, MA, USA) adjusted microwave power to maintain constant reactor temperature. Microwave leakage was continuously monitored during operation with a microwave leakage detector. After the reactor, the reaction products passed through a filter and cooling system (Buhler, TC-MINI, Holliston, MA, USA) for moisture removal before entering a mass flow meter (Omega, FMA-1620A-I2, Holliston, MA, USA) and a gas analyzer (ETG MCA 100 syn, Holliston, MA, USA) for flow rate and composition measurements. The reflected and forward microwave power, gas flow rate, and reactor data were continuously recorded at one-second intervals using GeneLink software and e-Gauge instrument. The active carbon used in this study was coconut shell-based with a particle size of 284 µm and was purchased from HAY CARB. The nitrogen gas with 99.999% UN1066 purity was supplied by AirGas.
Figure 1.
Experimental setup.
Both configurations used the same quartz reactor (8 mm i.d.) and the same charge of 0.742 g coconut shell activated carbon (mean particle size 284 µm). The static bed height was 34 mm (H/D = 4.3), which filled about 80% of the 43 mm bed section and left 9 mm of freeboard for bed expansion. A quartz frit (70–100 µm pores) at the middle of the reactor supported the bed and distributed the gas and a second frit was placed at the reactor outlet. As in other porous reactor internals, the pore structure of the frit governs the gas velocity distribution and adds a flow-dependent pressure drop [37]. The two configurations differed only in N2 flow rate: 30 mL/min for the packed bed and 110 mL/min for the fluidized bed (Table 1). Because both configurations received the same steam flow, the higher N2 flow in the fluidized bed lowered the steam mole fraction by a factor of 2.1–3.1 and increased the superficial gas velocity by a factor of 2.1–3.0.
Table 1.
Bed geometry and operating conditions of the packed- and fluidized-bed configurations.
2.2. Experimental Procedure and Conditions
In this study, experiments were conducted under controlled conditions using both packed- and fluidized-bed reactor configurations. The investigated variables included water flow rate and reaction temperature. Prior to these experiments, preliminary screening tests were performed to identify stable operating conditions for water injection rate, activated carbon loading, and temperature under microwave heating, ensuring reactor stability, reliable fluidization, and consistent gas analysis. Based on these initial tests, the final operating conditions were selected for systematic evaluation. For all experiments, 0.742 g of AC was loaded into the reactor to fill 80% of the reactor height. Each experimental condition was repeated twice to evaluate experimental repeatability. The measurements were consistent within the calculated uncertainty bounds, and a representative case is provided in Table S1. The ± values reported in this study are measurement uncertainties at a 90% confidence level, obtained by error propagation from the accuracies of the gas analyzer, mass flow controller, mass flow meter, syringe pump, and pyrometer (Table S4; procedure in Table S7), and not standard deviations of the replicates.
After loading the AC into the reactor, it was positioned inside the microwave cavity and insulated to minimize heat loss. Nitrogen gas was introduced at a constant flow rate of 30 mL/min to remove any volatiles in the reactor and tubing as well as to check for any potential gas leakage in the system. Microwave power was then applied at a low level (30 W) to evaluate reflected power, and the tuner position was adjusted manually to minimize reflected power and improve microwave absorption. After stabilization, the reactor was allowed to cool down to ambient temperature since the AC partially absorbed microwave energy during the initial test.
Heating tapes were wrapped around the water and nitrogen feed lines and insulated to minimize heat loss. In the water line, the heating tape vaporized liquid water into steam, while in the nitrogen line it preheated the carrier gas to prevent steam condensation, ensuring stable delivery of fully vaporized steam and preheated nitrogen into the reactor. Temperature was controlled using a feedback-regulated controller. After reaching the target reaction temperature and confirming the absence of microwave leakage by a microwave leakage detector, the water pump was set to deliver the required flow rate for each experiment. Initial microwave forward power was set at 150 W for the packed-bed reactor and 180 W for the fluidized-bed reactor. These values were only used as initial settings to achieve reaction temperatures between 600 and 750 °C, so both configurations were compared at identical temperatures, and the measured absorbed energy was used in the efficiency calculations. Synchronization between the microwave generator and pyrometer was achieved by the T-box, which automatically adjusted microwave power to maintain the target temperature. Experiments were terminated once hydrogen concentration began to decrease, indicating AC deactivation under the operating conditions.
All experimental conditions used in this study are summarized in Table 2. Experiments were labeled using the format [bed type]–[temperature]–[flow rate], where ‘P’ and ‘F’ represented and fluidized beds, respectively, in the bed type. The number indicates the reaction temperature, and R1-R4 correspond to water flow rates of 0.0082, 0.01093, 0.0164, and 0.0328 mL/min, respectively.
Table 2.
Operating parameters of conducted experiments.
3. Analysis and Assessment
Thermodynamics provides the foundation for understanding energy behavior and transformations within a system. In this study, energy and exergy analyses were performed to evaluate the system performance, where energy analysis quantifies energy transformations and exergy analysis determines the portion of energy convertible into useful work. In order to investigate the effects of different experimental conditions, thermodynamic analysis based on energy and exergy efficiencies was conducted using mass, energy, entropy, and exergy balance equations for both the overall system and individual components. The general forms of the mass, energy, entropy, and exergy balance equations are expressed as follows:
The energy and exergy efficiencies are evaluated based on carbon gasification performance as follows [38,39]:
where , , and are the energy rates provided by the microwave, syringe pump, and the converted carbon, respectively. LHV represents the lower heating value of each gas, which is shown in Table S2 along with the chemical exergies. In addition, the following assumptions were made to solve Equations (2)–(7): (i) changes in kinetic and potential energy, along with their corresponding exergy contributions, were considered negligible; (ii) the work from syringe pump was calculated to be negligible compared to the microwave input power and was therefore excluded from the analysis.
The absorbed microwave power was calculated using the following equation:
where Pforward refers to the microwave energy supplied by the generator, Preflected is measured using a resistance element and dissipated by an isolator, and Pabsorbed is the power absorbed by the material, resulting in temperature increase. The total absorbed microwave power, , is the accumulated energy consumption from the microwave used to heat up the sample and to maintain the reaction.
Pabsorbed = Pforward − Preflected
The system boundary was drawn at the inlet of the microwave cavity, and was considered the only energy input, as the main energy consumption of the process occurs in the cavity and the aim of this analysis is to evaluate the conversion of absorbed microwave energy into chemical energy of the product gas. Steam generation and N2 preheating upstream of the cavity were performed with laboratory heating tapes that were not optimized for energy consumption and had significant heat losses at this scale; therefore, they were not included in the efficiency calculations.
Fluidized beds offer advantages such as superior heat and mass transfer, excellent gas–solid contact, improved temperature control, and easier solids replacement. Activated carbon exhibits physical and structural properties that make it highly suitable for fluidized-bed operation under microwave irradiation. Its low particle density (400–600 kg/m3), high porosity, and moderate particle size (284 μm) place it within Geldart Group A, characterized by stable fluidization, early bed expansion, and predictable hydrodynamic behavior at moderate gas velocities [40,41].
The minimum fluidization velocity (Umf) was calculated using standard gas–solid fluidization correlations. First, the Archimedes number (Ar) is calculated as [42]:
where g is gravitational acceleration, dp is particle diameter, ρs is particle density, ρg is gas density, and μ is gas viscosity. The minimum fluidization Reynolds number is then obtained using the Wen–Yu correlation [42].
Once the Reynolds number is known, the minimum fluidization velocity can be calculated as follows:
The average particle size of the activated carbon in this study was 284 μm, with a particle density of 450 kg/m3 and fluid viscosity of 4.081 × 10⁻⁵ kg/s/m. The minimum fluidization flow rate calculated from Equations (10)–(12) was 58 mL/min N2. Experimentally, the entire bed was fluidized at 110 mL/min (about 1.9 times the calculated value), consistent with wall effects in narrow columns [43]. In the packed bed, quartz wool placed on top of the bed prevented particle motion. More information can be found regarding fluidization calculations in our previous work [44].
The energy consumption to create fluidization is heavily dependent on the flow rate and pressure drop, a key factor in the fluidized-bed reactors which is also calculated theoretically using the following equation:
where η represents the compressor efficiency, which typically ranges from 0.55 to 0.9 depending on compressor type and was assumed to be 0.65 in this study. Q is the volumetric flow rate of nitrogen feed gas.
As shown in Figure S1d, two frits with porosity between 70 and 100 μm were positioned at the middle and outlet of the reactor. The middle frit supported the AC and improved nitrogen flow distribution from the bottom; however, the use of two frits caused a significant pressure drop within the fluidized-bed reactor. Therefore, the theoretical pressure drop across the reactor was calculated using Equation (14).
where g, ρp, ρf, ε and h represent the gravitational force, particle density, fluid density, voidage, and bed height during fluidization, respectively. All the parameters are listed in Table S3.
∆P = g(ρp − ρf)(1 − ε)h
To quantitatively evaluate steam–carbon gasification under microwave irradiation, carbon conversion was determined for all operating conditions in both packed-bed and fluidized-bed reactors. Carbon conversion represents the fraction of the initial AC converted into carbon-containing gaseous products and serves as a key indicator of reaction progress and solid-phase participation in the gasification process. In this study, carbon conversion was calculated using the total moles of CO, CO2, and CH4 measured in the outlet stream according to the following standard expression for heterogeneous gasification systems:
where nco, , and represent the total moles of carbon present in the gaseous products, and denotes the initial moles of carbon in the AC loaded into the reactor. The energy content of the converted carbon () is calculated as the product of carbon conversion (XC) and the lower heating value of carbon LHVC.
Hydrogen yield represents the actual molar amount of hydrogen obtained in the gaseous products, as measured by the gas analyzer, relative to the theoretical maximum moles of hydrogen that could be produced from the supplied steam. It serves as an indicator of how efficiently the input steam is converted into hydrogen under the specified operating conditions, and is calculated as shown in Equation (17):
Uncertainty and error propagation analyses were carried out for all experiments in both reactor configurations, across the different temperatures and water flow rates. The instrument uncertainties (Table S4) were propagated through the equations for hydrogen yield, carbon conversion, hydrogen production rate, total hydrogen produced, and energy and exergy efficiencies, using the propagation equations given in Table S7. All uncertainties were calculated at a 90% confidence level. The uncertainty of the hydrogen yield is reported in Table 3 and Table 4, and the uncertainties of all other parameters are given in Table S8. Uncertainties were higher in the fluidized bed because the higher N2 flow diluted the product gas, so the measured H2 and CO concentrations were lower relative to the accuracy of the gas analyzer. The complete calculation procedure, including instrument accuracies, propagation equations, and representative examples, is provided in the Supplementary Information (Table S7). In fluidized-bed experiments, uncertainty was inherently higher due to the fact that the low water flow rates and dynamic motion of AC particles caused fluctuations in gas–solid contact, reactor hydrodynamics, and instantaneous reaction conditions, resulting in greater measurement variability compared to packed-bed reactor which demonstrated more stable measurements. The uncertainties for each sensor used in this study are listed in Table S4.
Table 3.
Effect of temperature on hydrogen yield and carbon conversion in packed and fluidized beds.
Table 4.
Effect of water flow rate on hydrogen yield and carbon conversion in packed and fluidized beds.
4. Results and Discussions
4.1. Reaction Mechanism
Before evaluating the effect of parameters (temperature and flow rate), the reaction mechanism was investigated to understand the chemistry behind the reactions. As explained in detail earlier, the reactor was loaded with 0.742 g of AC secured by frits at the bottom of the reactor, and deionized water was continuously introduced at different flow rates under constant temperature conditions. The reactor was positioned so that the AC aligned with the microwave electric field inside the cavity. Only 80% of the reactor volume was initially filled with AC to accommodate bed expansion under fluidized-bed conditions. During the experiments, outlet gas compositions (CH4, CO2, CO, and H2) were continuously monitored and recorded every second using a gas analyzer.
The gas evolution behavior confirms that activated carbon was progressively consumed during microwave-assisted steam gasification and served as both the microwave susceptor and the reacting carbon source. Although water was continuously supplied at a fixed flow rate, hydrogen and carbon monoxide concentrations decreased after approximately 45 min of microwave irradiation, mainly due to the reduction in AC amount as the reaction progressed, as shown in Figure 2. Similar behavior was reported by Horikoshi et al. [10] during microwave-assisted hydrogen production from wastewater, where the following reactions were proposed to occur in the process:
C + H2O → H2 + CO
CO + H2O ⇆H2 + CO2
C + 2H2O → 2H2 + CO2
Figure 2.
AC reduction.
The product gases after the reactions confirm that the process occurring inside the quartz reactor is governed by microwave-assisted steam gasification of AC. During each experiment, the concentration profiles of H2, CO, CO2, and CH4 reflected the progressive consumption of AC (Figure 3b). The rapid increase in H2 and CO following steam injection, together with the corresponding temperature increase as shown in Figure 3a. Here, the mass of activated carbon decreases after each run, which demonstrates that AC acts not only as a microwave susceptor but also as the primary reactant in the heterogeneous gasification reactions. Table 2 represents all operating conditions.
Figure 3.
(a) Temperature profile; (b) gas composition during microwave-assisted steam–carbon gasification at 700 °C.
The gasification mechanism follows the conventional steam–carbon pathway, in which steam adsorbs on reactive carbon sites and forms surface oxygen complexes that subsequently decompose into CO and H2 [45]. However, microwave heating modifies the reaction kinetics by coupling directly with AC because of its high dielectric loss factor, producing rapid volumetric heating and localized hot spots on the carbon surface. These conditions accelerate the endothermic steam–carbon reaction and explain the high H2 and CO production rates observed during the first 30–45 min, when the amount of reactive carbon and the number of active surface sites are the greatest.
C(s) + H2O(g) → CO(g) + H2(g)
The reaction shown in Equation (21) is strongly endothermic and requires substantial energy input to proceed. The microwave here supplies thermal energy volumetrically and directly within the solid phase rather than through gas-phase heating, preferentially promoting the reaction at the carbon surface where microwave energy is most effectively absorbed [46]. The predominance of CO over CO2 as shown in Figure 3b is governed by both thermodynamic and kinetic effects. Above 600 °C, steam gasification strongly favors CO formation, whereas significant CO2 production would require extensive water–gas shift conversion (CO + H2O → CO2 + H2), which is limited by the absence of an effective catalyst, the short gas residence time, and non-uniform gas-phase temperatures under microwave heating. In addition, any CO2 formed is readily consumed through the endothermic Boudouard reaction (C + CO2 → 2CO), which is favored at elevated temperatures, and further enhanced by the higher local carbon surface temperatures generated by microwave irradiation [47]. Consequently, CO2 concentrations remained consistently low under all operating conditions, while CO remained the dominant carbon-containing product, suggesting that the carbon bed functions both as the primary reactant and as an effective sink for CO2 before it exits the reactor [48].
Temperature profiles for both packed- and fluidized-bed reactors under different temperature conditions are shown in Figure 4. As can be seen from the graphs, activated carbon coupled efficiently with the microwave field and reached the target reaction temperatures rapidly and reproducibly. Both reactors exhibited a rapid heating stage (0–150 s), demonstrating the fast heating capability of microwave irradiation, followed by a stable temperature plateau as set by a T-box controller in the microwave unit. However, the packed bed in Figure 4a reached the target temperature faster than the fluidized bed, whereas the fluidized bed in Figure 4b exhibited larger temperature fluctuations during steady operation, particularly at 750 °C. The slower heating response and increased temperature variability are attributed to the higher nitrogen flow rate required for fluidization (110 mL/min versus 30 mL/min in the packed bed). Although the inlet nitrogen and steam were preheated to 130–140 °C, their substantially lower temperature relative to the reactor bed increased convective heat removal. In addition, the dynamic mixing behavior of bubbles and the continuous injection of cold gas have been reported to produce fluctuating temperature profiles in microwave-heated fluidized beds [49]. These effects likely contributed to the less stable temperature profile observed in the present study. In contrast, lower gas flow rate in the packed bed minimized convective heat losses, providing a more stable thermal environment and a faster approach to the target temperature.
Figure 4.
Temperature profiles of (a) packed-bed and (b) fluidized-bed reactors during microwave-assisted steam–carbon gasification at target temperatures of 600, 650, 700, and 750 °C.
Steam injection was initiated only after the reactor reached the target temperature to ensure identical thermal conditions at the beginning of each experiment. Hydrogen and CO rapidly became the dominant gaseous products, confirming syngas formation during microwave-assisted steam gasification of activated carbon. The hydrogen-rich product stream may subsequently be upgraded using established purification technologies such as pressure-swing adsorption (PSA) or membrane separation [50,51,52].
In microwave heating systems, one of the most important parameters is the energy consumption to heat up the material. The microwave unit in our experimental setup is able to measure the forward and reflected power, which allows one to understand the heating efficiency of the microwave. Figure 5 compares forward, reflected and absorbed microwave powers for packed and fluidized beds under different temperature and flow rate conditions. As can be seen from Figure 5a, the forward microwave power required to reach and maintain the target temperature increased with temperature in both reactor configurations. However, this increase was relatively modest in the packed bed and more pronounced in the fluidized bed. This difference can be attributed to their distinct microwave–particle coupling behavior. In the packed bed, the spatially fixed AC particles provide relatively stable dielectric conditions and consistent microwave coupling, as indicated by the low reflected power. In contrast, the higher N2 flow required for fluidization induces continuous particle motion and changes in the spatial distribution of the microwave-absorbing AC within the electromagnetic field. These dynamic conditions can affect microwave coupling and increase reflected power, resulting in higher microwave energy consumption in the fluidized bed. In Figure 5b, the packed-bed reactor, increasing the water flow rate generally resulted in an increase in the forward microwave power required to maintain the reactor at the target temperature. This behavior can be attributed to the greater amount of steam entering the reactor, which increases the thermal load and consequently requires additional microwave power to maintain a constant operating temperature. The reflected power also generally increased with increasing water flow rate. In contrast, no clear trend in forward or reflected power with water flow rate was observed in the fluidized-bed reactor, likely due to the dynamic nature of the bed and the associated variations in microwave–particle coupling. Nevertheless, the fluidized-bed reactor consistently required higher forward microwave power than the packed-bed reactor across all investigated conditions.
Figure 5.
Forward, absorbed, and reflected microwave energy for packed-bed and fluidized-bed reactors as functions of (a) steam flow rate (at 700 °C) and (b) reactor temperature (at 0.0164 mL/min).
4.2. Effect of Temperature in Packed Bed and Fluidized Bed
In chemistry, temperature is a key parameter in the initiation and maintenance of chemical reactions. In order to investigate the effect of temperature on hydrogen production in packed-bed and fluidized-bed reactors, several experiments were conducted at reaction temperatures of 600, 650, 700, and 750 °C, as listed in Table 2 and based on the methodology presented in the literature [10]. Similar to the initial experiment discussed in the previous section, the quartz reactor was loaded with 0.742 g of AC held by two glass frits and the water flow rate was fixed at 0.0164 mL/min using a syringe pump. Nitrogen flow rates of 30 mL/min and 110 mL/min were used for packed-bed and fluidized-bed conditions, respectively. The reactor operated under an E-mode microwave configuration to provide uniform energy delivery and controlled thermal conditions. Prior to each experiment, the reflected power was minimized by adjusting the stub manually.
Figure 6a and Table 3 present the evolution of hydrogen yield at different reaction temperatures under packed-bed conditions. Starting with the packed-bed reactor, at 600 °C, the hydrogen yield increased only slightly before reaching a plateau of approximately 4%, indicating that the thermal energy was insufficient to effectively drive the endothermic steam–carbon gasification reaction. Increasing the temperature to 650 °C significantly enhanced hydrogen production, with the yield increasing rapidly during the first 10 min and then more gradually to a final value of 33.4%. The highest hydrogen yield (41.8%) was obtained at 700 °C, where the yield increased steadily throughout the experiment, indicating that microwave absorption and steam–carbon reaction kinetics were most favorably balanced. When the temperature increased to 750 °C, the hydrogen yield increased rapidly during the initial stage, reached a maximum of approximately 25% after 50–55 min reaction time, and then declined slightly to a final value of 22.3%, suggesting progressive consumption of activated carbon and a reduction in the availability of reactive surface sites.
Figure 6.
Effect of temperature on hydrogen yield in (a) packed bed and (b) fluidized bed.
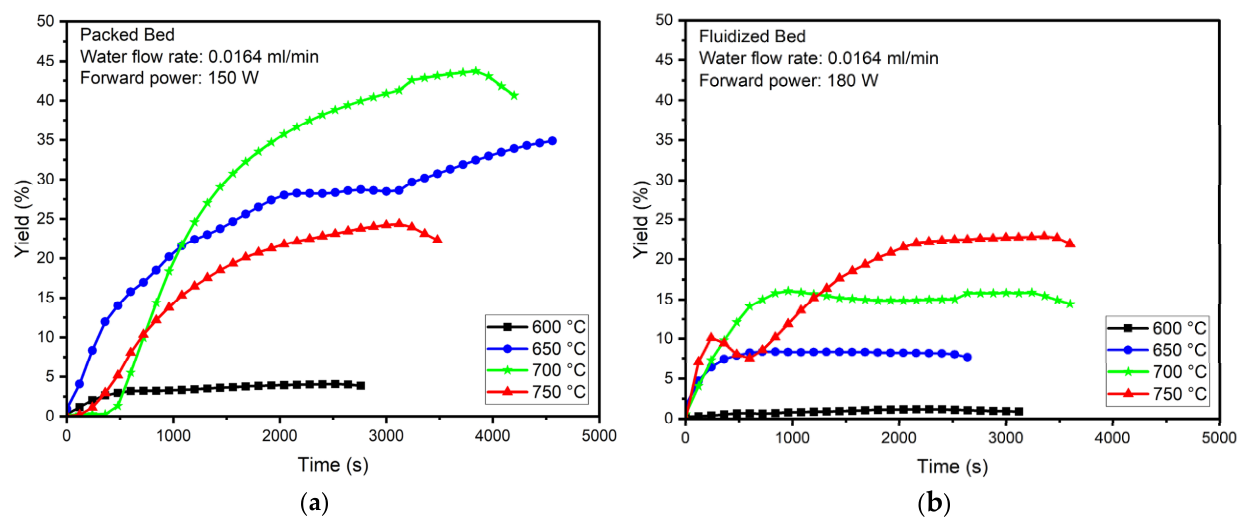
The hydrogen yield results for the fluidized-bed reactor are shown in Table 3 and Figure 6b. It is obvious from the figures that increasing temperature progressively improved hydrogen yield, but the maximum yield shifted to 750 °C due to the fact that a stronger thermal driving force was required to offset nitrogen dilution and a shorter residence time. At 600 °C, the hydrogen yield remained below 1% throughout the experiment, showing a similar trend to the packed bed. Increasing the temperature to 650 °C resulted in a rapid initial increase followed by stabilization at a final yield of 7.8%. At 700 °C, the hydrogen yield reached a maximum of approximately 17% within 15–20 min before gradually declining to a stable value of 14.8%. The highest hydrogen yield in the fluidized-bed reactor was achieved at 750 °C, where the yield increased rapidly and reached an early plateau at 21.9%.
At all the temperatures investigated, the packed-bed reactor produced higher hydrogen yields than the fluidized-bed reactor. This behavior is attributed primarily to the higher nitrogen flow rate required to maintain fluidization (110 mL/min compared with 30 mL/min in the packed-bed reactor), which decreases the steam partial pressure and shortens the gas residence time within the reactor, a nitrogen-dilution effect that has been widely reported in fluidized-bed gasification systems [53]. However, the difference between the two reactor configurations became much smaller at 750 °C (22.3% for the packed bed and 21.9% for the fluidized bed), indicating that the higher reaction rate at elevated temperature partially compensates for the adverse effects of steam dilution and reduced residence time.
The dynamic product profiles reveal that reactor hydrodynamics strongly affected microwave–particle coupling, producing stable gas evolution in the packed bed but fluctuating behavior in the fluidized bed. While the hydrogen yield values reported earlier represent the overall extent of conversion achieved under each condition, and Figure 7 shows how H2 and CO production evolved dynamically over time at each reactor’s thermal optimum (the highest hydrogen yields at the corresponding temperature), revealing a key behavioral difference between the two configurations. While the packed bed produced a smooth, stable profile, the fluidized bed showed an irregular, non-monotonic pattern consistent with time-varying microwave–particle coupling under continuous particle motion [31,34]. As discussed in Section 4.1, CO constituted the main product of carbon-containing species under all conditions; CO2 and CH4 were included in Equation (15), but their contributions to the reported conversion values are negligible.
Figure 7.
Maximum carbon conversion in a constant water flow rate of 0.0164 mL/min: (a) packed bed and (b) fluidized bed.
Carbon conversion in the activated carbon is listed in Table 3, and the packed-bed reactor in Figure 7a showed a strong temperature dependence on the conversion, consistent with the endothermic steam–carbon gasification mechanism. At 600 °C, conversion was minimal (2.90%) due to insufficient thermal activation of the heterogeneous reaction. Increasing temperature to 650 °C raised conversion to 15.6%, reflecting more favorable gasification kinetics under microwave heating. The highest conversion was achieved at 700 °C (27.5%), where thermal activation and microwave absorption were optimally balanced, leading to maximum utilization of the carbon bed. The decline at 750 °C may be associated with structural changes in the AC and reduced microwave coupling at elevated temperatures, which could progressively reduce the number of accessible reactive surface sites; direct characterization of the spent carbon would be needed to confirm this mechanism [31].
Carbon conversion in the fluidized-bed reactor in Figure 7b showed an increase monotonically with temperature, consistent with the strong thermal dependence of steam–carbon gasification [54]. Conversion was low at 600 °C (2.6%) due to having insufficient thermal energy to drive the heterogeneous reaction. Elevating temperature to 650 °C and 700 °C raised conversion to 8.0% and 15.8%, respectively, as progressively faster reaction kinetics offset the residence-time and nitrogen-dilution penalties inherent to fluidized-bed operation [53]. The highest conversion was achieved at 750 °C (33.8%), where reaction rates were sufficient to maximize carbon consumption despite the shorter gas–solid contact time. Unlike the packed-bed reactor, the fluidized bed showed no performance decline at 750 °C, indicating that it remained in a reaction-rate-limited regime throughout the investigated temperature range. CO concentration profiles under different conditions are provided in Figures S1–S4.
4.3. Effect of Flow Rate of Water in Packed Bed and Fluidized Bed
The effect of water flow rate on hydrogen yield was investigated at 700 °C for the packed- and fluidized-bed reactors. Four water flow rates spanning reactant-limited and residence-time-limited conditions were evaluated, and the results are presented in Figure 8 and Table 4.
Figure 8.
(a) Effect of water flow rate on hydrogen yield in packed bed and (b) fluidized bed.
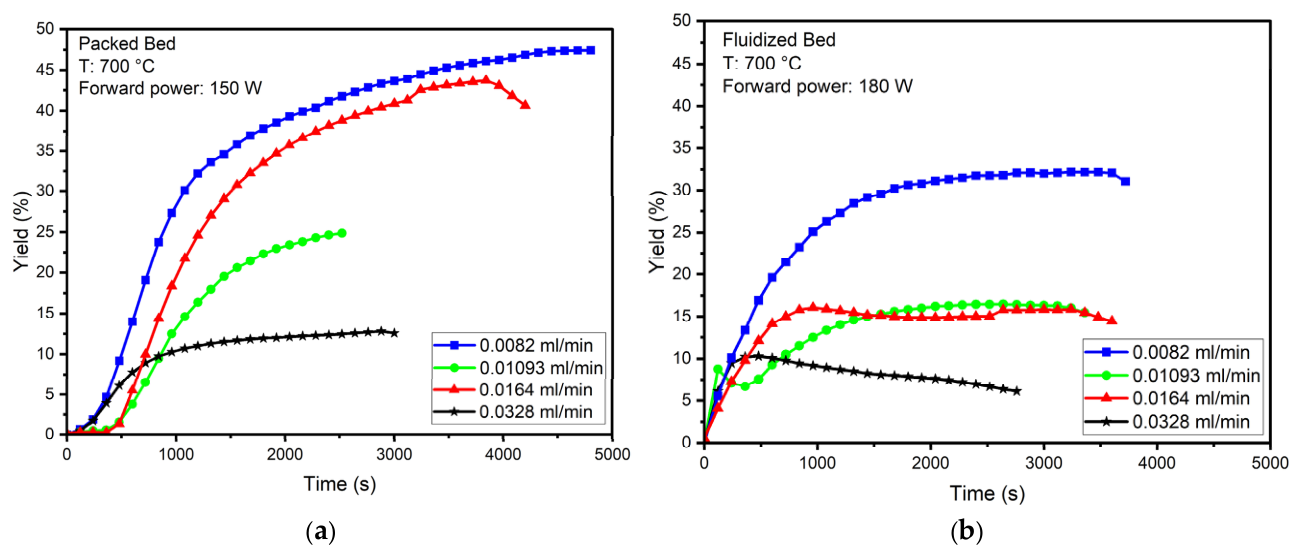
For the packed-bed reactor (Figure 8a), hydrogen yield exhibited a clear non-monotonic dependence on water flow rate, indicating the existence of an optimum steam supply beyond which additional reactant reduced rather than enhanced hydrogen production, a behavior commonly reported for steam gasification systems [10]. At the lowest flow rate of 0.0082 mL/min, the prolonged steam residence time promoted sustained gas–solid contact throughout the 70 min experiment, resulting in the highest hydrogen yield of 50.4%. Increasing the flow rate to 0.01093 mL/min reduced the yield to 25.0%, suggesting that the shorter residence time limited complete steam utilization despite the greater reactant availability. At 0.0164 mL/min, the yield recovered to 41.8%, indicating a more favorable balance between steam supply and residence time, where both mass transfer and reaction kinetics remained effective. A further increase to 0.0328 mL/min caused the yield to decrease sharply to 12.8%, likely because the higher steam velocity reduced gas–solid contact time and promoted less uniform microwave heating, thereby lowering the overall gasification efficiency [31].
A similar non-monotonic trend was observed in the fluidized-bed reactor (Figure 8b), although hydrogen yields remained consistently lower than those obtained in the packed-bed configuration. The maximum hydrogen yield (31.6%) was achieved at the lowest flow rate (0.0082 mL/min), where the longer residence time and improved steam–carbon interaction partially compensated for the dilution associated with the nitrogen fluidization gas [53]. Increasing the flow rate to 0.01093 mL/min decreased the yield to 16.0%, likely reflecting less effective particle exposure to microwave heating under dynamic bed conditions [31,34]. At 0.0164 mL/min, the hydrogen yield stabilized at 14.8%, remaining substantially below the corresponding packed-bed value (41.8%), which can be attributed to the combined effects of reduced residence time, greater nitrogen dilution, and intermittent microwave–particle coupling inherent to fluidized-bed operation. At the highest flow rate (0.0328 mL/min), the yield further declined to 6.2%, consistent with severe steam bypassing and insufficient gas–solid contact.
Carbon conversion in the packed-bed reactor also displayed a non-monotonic dependence on water flow rate (Figure 9a). The highest conversions were obtained at 0.0082 mL/min (29.2%) and 0.0164 mL/min (27.6%), whereas a pronounced local minimum occurred at 0.01093 mL/min (13.5%). This intermediate decrease may be associated with preferential steam channeling through the packed bed, which reduced the effective gas–solid contact despite an adequate steam supply. At the highest flow rate (0.0328 mL/min), carbon conversion decreased to 19.4%, indicating that the increased gas velocity shortened the reaction time available for heterogeneous steam–carbon gasification before the reactants exited the reactor.
Figure 9.
(a) Maximum carbon conversion in packed bed obtained at 0.0164 mL/min and (b) fluidized bed obtained at 0.01093 mL/min.
In contrast, the fluidized-bed reactor (Figure 9b) achieved its highest carbon conversion at 0.01093 mL/min (24.2%), suggesting that this flow rate provided the most favorable balance between steam availability and gas–solid mixing. At the lowest flow rate (0.0082 mL/min), carbon conversion reached 19.6%, indicating that although residence time was the longest, the limited steam supply constrained overall carbon utilization. Increasing the flow rate beyond the optimum reduced conversion to 15.8% at 0.0164 mL/min and 10.2% at 0.0328 mL/min, consistent with progressively shorter gas–solid contact times and increased steam bypassing at higher superficial gas velocities [53].
Overall, the packed-bed reactor consistently produced higher hydrogen yields across all water flow rates, whereas the fluidized-bed reactor achieved greater carbon conversion at its optimum operating conditions (24.2% versus 13.5% for the packed bed at 0.01093 mL/min). This distinction reflects the fundamentally different operating characteristics of the two reactor configurations. The packed bed benefits from stable microwave coupling and prolonged gas–solid residence time, maximizing hydrogen production through efficient steam conversion. In contrast, the fluidized bed promotes enhanced particle mixing and carbon utilization at moderate flow rates, although these advantages are partially offset by nitrogen dilution and fluctuations in microwave–particle interactions. These findings demonstrate that the two reactor configurations offer complementary performance characteristics, with the preferred design ultimately depending on whether the primary objective is to maximize hydrogen yield or carbon conversion. It should be noted that the higher relative propagated uncertainties observed for several fluidized-bed performance metrics can be partly attributed to the higher carrier-gas flow rate, which resulted in lower product-gas concentrations and potentially increased the relative contribution of gas-analyzer measurement uncertainty. The uncertainty analysis in this study was primarily based on the measurement uncertainties associated with the gas analyzer, mass flow controllers, and other relevant instrumentations.
The hydrogen yield obtained in this study was compared with that from another study [10], which used microwave-heated activated carbon with water in a fixed bed at 600–700 °C. With ion-exchanged water, they reported a yield of about 75% in a 16 mm reactor containing 4.5 g of activated carbon, and 86% in a 40 mm reactor, compared with 50.4% in the present packed bed (8 mm, 0.742 g) and 31.6% in the fluidized bed. Several factors explain this difference in the yields. First, the water–gas shift reaction proceeded nearly to completion in their reactor, as no CO was detected, whereas in the present study CO was the dominant carbon-containing product and syngas was produced; since the water–gas shift converts additional steam into hydrogen, a more complete shift would increase the hydrogen yield. Second, reactors used in this study were smaller and contained 6–15 times less activated carbon, affecting the ultimate yield. Third, N2 is used as the carrier gas in this study. This shortened the residence time, particularly in the fluidized bed. Finally, the main source of hydrogen was deionized waterl no organic compounds or salts, which usually act as an additional source for hydrogen, were used in the present study.
4.4. Efficiency
The energy and exergy efficiency of the systems, under different conditions listed in Table 2, are calculated using Equations (6) and (7) based on the lower heating values (LHV) and chemical exergy values of the product gases listed in Table S2. The energy efficiency depends on three main energy components: (a) thermal energy for microwave; (b) flow work to create fluidization; (c) pump work for water flow. It should be noted that the energy rates used to create fluidization and water flow are significantly lower compared to the thermal energy used for microwaves. The energy required for fluidization was confirmed to account for less than 1% of the total microwave power consumption, as shown in Table S6. Therefore, these two energy rates were assumed to be negligible, and the overall thermodynamic performance for both reactor configurations was compared primarily on the basis of microwave energy utilization.
Figure 10 presents the effects of temperature and water flow rate on the energy and exergy efficiencies of both reactor configurations. For the packed-bed reactor (Figure 10a), increasing temperature improved both energy and exergy efficiencies by accelerating steam–carbon gasification and increasing useful chemical-energy recovery. At 600 °C, both efficiencies were low, reflecting insufficient thermal activation and slow gasification kinetics. As the temperature increased to 750 °C, maximum energy and exergy efficiency reached 12.52% and 6.63% at 700 °C, indicating the improved conversion of microwave energy into useful chemical products. This improvement is attributed to faster steam–carbon reaction kinetics, greater activated carbon (AC) utilization, and more efficient conversion of absorbed microwave energy into the chemical energy of the product gases at elevated temperatures.
Figure 10.
Effects of temperature and flow rate on energy and exergy efficiency in packed bed (a,b) and fluidized bed (c,d).
The effect of water flow rate on packed-bed efficiency (Figure 10b) followed a non-monotonic pattern consistent with the hydrogen yield trends discussed in Section 4.3. Maximum energy (13.37%) and exergy (6.2%) efficiencies were obtained at the lowest flow rate (0.0082 mL/min), where the longest steam residence time maximized the fraction of absorbed microwave energy converted into gasification products. At 0.01093 mL/min, both efficiencies declined due to shortened steam contact time and incomplete steam utilization. A partial recovery occurred at 0.0164 mL/min (energy 12.5%, exergy 6.1%), reflecting the more favorable balance between steam supply and residence time at this condition. At 0.0328 mL/min, energy efficiency dropped to 7.3% and exergy efficiency to 3.85%, as excessive steam loading increased the microwave energy required for steam heating relative to the energy content of the gasification products, a penalty that became dominant at high flow rates regardless of reaction kinetics.
Figure 10c demonstrates the effect of temperature on the energy efficiency of the fluidized-bed reactor. As stated earlier, temperature was found to be the most dominant variable controlling efficiency, with the maximum efficiency occurring at 750 °C. As can be seen from the figure, both efficiencies increased monotonically with temperature, reaching maximum values of 5.3% (energy) and 2.60% (exergy) at 750 °C, driven by enhanced reaction kinetics at elevated temperature. These values are substantially lower than the packed-bed maxima across all tested temperatures, reflecting the energy losses associated with dielectric instability, higher reflected microwave power, and the nitrogen carrier gas requirement in the fluidized-bed configuration [39]. The effect of water flow rate on the energy efficiency of the fluidized-bed configuration (fluidized-bed efficiency) is shown in Figure 10d, where the efficiencies are relatively insensitive to water flow rate because of dielectric instability rather than steam supply. This was the primary factor limiting thermodynamic performance. The flow rate sensitivity of fluidized bed efficiency was markedly lower than that of the packed bed, i.e., both efficiencies remained low and closely grouped across all flow rates, indicating that thermodynamic performance in the fluidized bed is governed primarily by the inherent coupling instability of the system rather than by steam supply conditions.
The consistently lower efficiencies of the fluidized bed relative to the packed bed across both temperature and flow rate series can be attributed to fluctuations in dielectric properties and microwave coupling. Under fluidized-bed conditions, a consistently higher fraction of microwave power was reflected rather than absorbed [31], reducing the energy available to drive gasification. Therefore, improving microwave coupling stability through strategies such as bed geometry optimization, susceptor addition, or frequency tuning may help narrow the efficiency gap between the two reactor configurations.
4.5. Hydrogen Production Rate
Hydrogen production rate was analyzed to distinguish conditions that maximize instantaneous hydrogen generation from those that maximize hydrogen yield. Figure 11 presents the hydrogen production rate and total hydrogen output as functions of temperature (panels a and c) and water flow rate (panels b and d) for both reactor configurations. Figure 12 directly compares the hydrogen production rates of the packed-bed and fluidized-bed reactors under all operating conditions.
Figure 11.
Effects of temperature (a,c) and flow rate (b,d) on hydrogen production rate and total produced hydrogen in packed and fluidized bed.
Figure 12.
Effect of (a) flow rate and (b) temperature on hydrogen production rate for packed- and fluidized-bed reactors.
For the packed-bed reactor, the highest hydrogen production rate and total hydrogen production were obtained at 700 °C 0.0072 mg/s and 0.0295 g, respectively (Figure 11a), corresponding to the optimum temperature identified in Section 4.2. The increase in production rate from 600 to 700 °C indicates progressively faster steam–carbon gasification kinetics under microwave irradiation, in agreement with previous studies on microwave-heated activated carbon in fixed-bed reactors [10]. At 750 °C, the production rate declined, likely because structural degradation of activated carbon and reduced microwave coupling limited the availability of reactive surface sites despite the higher thermal driving force [31].
The influence of water flow rate on the hydrogen production rate is shown in Figure 11b, where water flow rate created a trade-off between steam conversion efficiency and total hydrogen output under packed-bed conditions. The highest hydrogen yield (50.4%) was achieved at 0.0082 mL/min, where the longer steam residence time maximized steam conversion efficiency. In contrast, the greatest total hydrogen production (0.0295 g) occurred at 0.0164 mL/min, where the combination of adequate residence time and higher steam throughput compensated for the lower hydrogen yield (41.8%). This difference between the flow rates that maximize hydrogen yield and total hydrogen production highlights an important operating trade-off in microwave-assisted steam–carbon gasification which should be considered when selecting operating conditions for specific process objectives.
Hydrogen production rate and total hydrogen in the fluidized-bed reactor increased steadily with temperature, reaching their maximum at 750 °C 0.0059 mg/s and 0.0219 g, respectively (Figure 11c), consistent with the enhanced reaction kinetics discussed in Section 4.2. In contrast, hydrogen yield decreased monotonically with increasing water flow rate (Figure 11d), falling from 31.6% at 0.0082 mL/min to 6.2% at 0.0328 mL/min. Similarly, the highest hydrogen production rate and total hydrogen production were achieved at 0.0082 mL/min, reaching 0.0042 mg/s and 0.0157 g, respectively, corresponding to the condition with the maximum hydrogen yield (31.6%). As the water flow rate increased, both values generally decreased, although a slight increase was observed at 0.0328 mL/min.
Across all operating conditions, the packed-bed reactor delivered superior hydrogen production rates (0.00733 mg/s) and total hydrogen (0.0295 g) output because its stable dielectric environment promoted more effective microwave coupling. As shown in Figure 12, both hydrogen production rate and total hydrogen output were consistently lower in the fluidized-bed reactor than in the packed-bed reactor under all operating conditions. This difference can be attributed to the combined effects of higher reflected microwave power reducing the fraction of energy available for gasification [31], shorter gas–solid residence time limiting steam–carbon contact, and nitrogen carrier gas dilution lowering the steam partial pressure [53]. These results indicate that although the fluidized-bed reactor offers advantages in gas–solid mixing and potential scalability, the packed-bed configuration provides superior thermodynamic performance for microwave-assisted steam–carbon gasification under the operating conditions investigated in this study.
5. Conclusions
In this study, an experimental study was performed to investigate the effect of several parameters on microwave assisted steam–carbon gasification under packed- and fluidized-bed configurations. Temperature and water flow rate varied to evaluate reaction mechanism, hydrogen yield and thermodynamic efficiencies. The packed-bed reactor showed superior hydrogen yield and thermodynamic performance, achieving the highest hydrogen yield (~50%), energy efficiency (13.37%), and exergy efficiency (6.2%) at 700 °C and 0.0082 mL/min. The highest hydrogen production rate and total hydrogen among all experiments were observed in the packed bed, reaching 0.00733 mg/s and 0.0295 g, respectively at 700 °C, while carbon conversion reached its maximum value of 29.2% at 700 °C, indicating optimal microwave absorption and reaction kinetics. The fluidized-bed reactor reached its highest hydrogen yield (31.6%) at 700 °C and 0.0082 mL/min, while carbon conversion increased monotonically with temperature and peaked at 33.8% at 750 °C. Energy and exergy efficiencies showed limited sensitivity to water flow rate, with maximum values of 5.30% and 2.6%, respectively.
Despite improved gas–solid contact and mixing, the fluidized bed consistently produced lower hydrogen yields and efficiencies than the packed bed due to shorter residence time, dielectric fluctuations, nonuniform microwave absorption, higher reflected power, and possible steam bypassing. In contrast, the stable dielectric environment of the packed bed enabled more effective microwave absorption, longer gas–solid contact time, and better thermal retention. Overall, the packed bed was superior for maximizing hydrogen yield and thermodynamic efficiency, whereas the fluidized bed favored higher carbon conversion.
Supplementary Materials
The following supporting information can be downloaded at: https://www.mdpi.com/article/10.3390/pr14213447/s1, Figure S1: (a)Experimental setup, (b) microwave generator and controller, (c) microwave cavity, and (d) quartz reactor; Figure S2. CO concentration in packed bed at constant temperature T = 700 °C and different water flowrate; Figure S3. CO concentration in fluidized bed at constant water flowrate = 0.0164 mL/min and different temperature; Figure S4. CO concentration in packed bed at constant water flowrate = 0.0164 mL/min and different temperature; Figure S5. CO concentration in packed bed at constant temperature T = 700 °C and different water flowrate; Table S1. Repeatability of experiments; Table S2. Thermochemical properties and lower heating values of key gaseous species (STP); Table S3. Fluidized bed parameters; Table S4. Sensors’ uncertainties; Table S5. Exergy balance for all experiments (dead state: T0 = 298.15 K, P0 = 101.325 kPa); Table S6. Electrical energy consumption and microwave energy; Table S7. Indirect measurements uncertainty; Table S8. Performance parameters and their measurement uncertainties (90% confidence level) for all experiments.
Author Contributions
Conceptualization, E.G., M.E. and S.A.; methodology, E.G., M.E. and S.A.; validation, E.G., M.E. and S.A.; formal analysis, E.G.; investigation, E.G., M.E. and S.A.; resources, S.A.; data curation, E.G.; writing—original draft preparation, E.G.; writing—review and editing, E.G., M.E. and S.A.; visualization, E.G.; supervision, M.E. and S.A.; project administration, S.A.; funding acquisition, S.A. All authors have read and agreed to the published version of the manuscript.
Funding
This research received no external funding.
Data Availability Statement
The data are available upon request.
Acknowledgments
The authors acknowledge Alabama Transportation Institute (ATI) at the University of Alabama for providing funding to facilitate the work done in this study. Special thanks to Rick Smith at the glassblowing facility at University of Alabama for construction of the quartz glass reactors used in this work.
Conflicts of Interest
The authors declare no conflicts of interest.
Abbreviations
The following abbreviations are used in this manuscript:
| AC | Activated carbon | |
| ATI | Alabama Transportation Institute | |
| CFD | Computational fluid dynamics | |
| DEM | Discrete element method | |
| GHG | Greenhouse gas | |
| LHV | Lower heating value | |
| MFC | Mass flow controller | |
| PID | Proportional–integral–derivative | |
| PSA | Pressure-swing adsorption | |
| SMR | Steam methane reforming | |
| Nomenclature | ||
| Ar | Archimedes number | – |
| dp | Particle diameter | m |
| ECf | Energy consumption of gas flow | MJ |
| Ef | Energy for gas flow through the bed | MJ |
| ex | Specific exergy | kJ/mol |
| Exergy destruction rate | W | |
| Exergy rate associated with heat transfer | W | |
| g | Gravitational acceleration | m/s2 |
| h | Specific enthalpy | kJ/kg |
| LHV | Lower heating value | kJ/mol |
| ṁ | Mass flow rate | kg/s |
| n | Number of moles | mol |
| nC0 | Initial moles of carbon | mol |
| Pabsorbed | Absorbed microwave power | W |
| Pforward | Forward microwave power | W |
| Preflected | Reflected microwave power | W |
| Q(t) | Gas volumetric flow rate | m3/s |
| Heat transfer rate | W | |
| Remf | Reynolds number at minimum fluidization | – |
| s | Specific entropy | kJ/(kg·K) |
| Entropy generation rate | W/K | |
| Ts | Boundary temperature | K |
| Umf | Minimum fluidization velocity | m/s |
| v | Velocity | m/s |
| Work (power) rate | W | |
| Absorbed microwave energy | kJ | |
| Energy of converted carbon | kJ | |
| Pump work | kJ | |
| XC | Carbon conversion | % |
| z | Elevation | m |
| ΔP | Pressure drop across the bed | Pa |
| Greek letters | ||
| ε | Bed voidage | – |
| η | Efficiency | % |
| μ | Gas viscosity | Pa·s |
| ρg | Gas density | kg/m3 |
| ρs | Particle density | kg/m3 |
| Subscripts | ||
| en/ex | Energy/exergy | |
| i/o | Inlet/outlet | |
| mf | Minimum fluidization | |
References
- Sridevi, V.; Surya, D.V.; Reddy, B.R.; Shah, M.; Gautam, R.; Kumar, T.H.; Puppala, H.; Pritam, K.S.; Basak, T. Challenges and opportunities in the production of sustainable hydrogen from lignocellulosic biomass using microwave-assisted pyrolysis: A review. Int. J. Hydrogen Energy 2024, 52, 507–531. [Google Scholar] [CrossRef] [Scilit]
- de Kleijne, K.; de Coninck, H.; van Zelm, R.; Huijbregts, M.A.J.; Hanssen, S.V. The many greenhouse gas footprints of green hydrogen. Sustain. Energy Fuels 2022, 6, 4383–4387. [Google Scholar] [CrossRef] [Scilit] [PubMed]
- Abbasian Hamedani, E.; Alenabi, S.A.; Talebi, S. Hydrogen as an energy source: A review of production technologies and challenges of fuel cell vehicles. Energy Rep. 2024, 12, 3778–3794. [Google Scholar] [CrossRef] [Scilit]
- Ding, K.; Liu, S.; Huang, Y.; Liu, S.; Zhou, N.; Peng, P.; Wang, Y.; Chen, P.; Ruan, R. Catalytic microwave-assisted pyrolysis of plastic waste over NiO and HY for gasoline-range hydrocarbons production. Energy Convers. Manag. 2019, 196, 1316–1325. [Google Scholar] [CrossRef] [Scilit]
- Husin, H.; Erdiwansyah, E.; Ahmadi, A.; Nasution, F.; Rinaldi, W.; Abnisa, F.; Mamat, R. Efficient hydrogen production by microwave-assisted catalysis for glycerol-water solutions via NiO/zeolite-CaO catalyst. S. Afr. J. Chem. Eng. 2022, 41, 43–50. [Google Scholar] [CrossRef] [Scilit]
- Samidin, S.; Isahak, W.N.R.W.; Ahmad, K.N.; Mijan, N.A.; Yusop, M.R.; Samsuri, A.; Abdulkareem-Alsultan, G.; Yarmo, M.A. Improving green hydrogen production: Microwave-assisted synthesis of diverse Ni-based nanocatalysts on Al2O3 for thermochemical water splitting. Fuel 2024, 373, 132370. [Google Scholar] [CrossRef] [Scilit]
- Habib, M.A.; Abdulrahman, G.A.Q.; Alquaity, A.B.S.; Qasem, N.A.A. Hydrogen combustion, production, and applications: A review. Alex. Eng. J. 2024, 100, 182–207. [Google Scholar] [CrossRef] [Scilit]
- Gunathilake, C.; Soliman, I.; Panthi, D.; Tandler, P.; Fatani, O.; Ghulamullah, N.A.; Marasinghe, D.; Farhath, M.; Madhujith, T.; Conrad, K.; et al. A comprehensive review on hydrogen production, storage, and applications. Chem. Soc. Rev. 2024, 53, 10900–10969. [Google Scholar] [CrossRef] [Scilit] [PubMed]
- Zhao, J.; Wang, D.; Zhang, L.; He, M.; Ma, W.; Zhao, S. Microwave-enhanced hydrogen production: A review. RSC Adv. 2023, 13, 15261–15273. [Google Scholar] [CrossRef] [Scilit]
- Horikoshi, S.; Takahashi, L.; Sueishi, K.; Tanizawa, H.; Serpone, N. Microwave-driven hydrogen production (MDHP) from water and activated carbons (ACs). Application to wastewaters and seawater. RSC Adv. 2021, 11, 31590–31600. [Google Scholar] [CrossRef] [Scilit]
- Sánchez-Bastardo, N.; Schlögl, R.; Ruland, H. Methane Pyrolysis for CO2-Free H2 Production: A Green Process to Overcome Renewable Energies Unsteadiness. Chem. Ing. Tech. 2020, 92, 1596–1609. [Google Scholar] [CrossRef] [Scilit]
- Available online: www.iea.org (accessed on 1 January 2026).
- Cocco, R.; Karri, S.R.; Knowlton, T. Introduction to fluidization. Chem. Eng. Prog. 2014, 110, 21–29. [Google Scholar]
- Salakhi, M.; Thomson, M.J. A particle-scale study showing microwave energy can effectively decarbonize process heat in fluidization industry. iScience 2025, 28, 111732. [Google Scholar] [CrossRef] [Scilit] [PubMed]
- Dai, F.; Zhang, S.; Luo, Y.; Wang, K.; Liu, Y.; Ji, X. Recent Progress on Hydrogen-Rich Syngas Production from Coal Gasification. Processes 2023, 11, 1765. [Google Scholar] [CrossRef] [Scilit]
- Zhao, S.; Ding, L.; Ruan, Y.; Bai, B.; Qiu, Z.; Li, Z. Experimental and Kinetic Studies on Steam Gasification of a Biomass Char. Energies 2021, 14, 7229. [Google Scholar] [CrossRef] [Scilit]
- Bai, X.; Muley, P.D.; Musho, T.; Abdelsayed, V.; Robinson, B.; Caiola, A.; Shekhawat, D.; Jiang, C.; Hu, J. A combined experimental and modeling study of Microwave-assisted methane dehydroaromatization process. Chem. Eng. J. 2022, 433, 134445. [Google Scholar] [CrossRef] [Scilit]
- Lin, C.H.; Wan, C.; Ru, Z.; Cremers, C.; Mohapatra, P.; Mantle, D.L.; Tamakuwala, K.; Höfelmann, A.B.; Kanan, M.W.; Rivas-Davila, J.; et al. Electrified thermochemical reaction systems with high-frequency metamaterial reactors. Joule 2024, 8, 2938–2949. [Google Scholar] [CrossRef] [Scilit]
- Mallapragada, D.S.; Dvorkin, Y.; Modestino, M.A.; Esposito, D.V.; Smith, W.A.; Hodge, B.-M.; Harold, M.P.; Donnelly, V.M.; Nuz, A.; Bloomquist, C.; et al. Decarbonization of the chemical industry through electrification: Barriers and opportunities. Joule 2023, 7, 23–41. [Google Scholar] [CrossRef] [Scilit]
- Zuliani, A.; Cano, M.; Calsolaro, F.; Puente Santiago, A.R.; Giner-Casares, J.J.; Rodríguez-Castellón, E.; Berlier, G.; Cravotto, G.; Martina, K.; Luque, R. Improving the electrocatalytic performance of sustainable Co/carbon materials for the oxygen evolution reaction by ultrasound and microwave assisted synthesis. Sustain. Energy Fuels 2021, 5, 720–731. [Google Scholar] [CrossRef] [Scilit]
- Mishra, R.R.; Sharma, A.K. Microwave–material interaction phenomena: Heating mechanisms, challenges and opportunities in material processing. Compos. Part A Appl. Sci. Manuf. 2016, 81, 78–97. [Google Scholar] [CrossRef] [Scilit]
- Bhattacharya, M.; Basak, T. A review on the susceptor assisted microwave processing of materials. Energy 2016, 97, 306–338. [Google Scholar] [CrossRef] [Scilit]
- Menéndez, J.A.; Arenillas, A.; Fidalgo, B.; Fernández, Y.; Zubizarreta, L.; Calvo, E.G.; Bermúdez, J.M. Microwave heating processes involving carbon materials. Fuel Process. Technol. 2010, 91, 1–8. [Google Scholar] [CrossRef] [Scilit]
- Campello Gómez, I.; Gutiérrez, C. Desorption strategies in CO2 capture technologies: Novel approaches and future perspectives. J. Environ. Chem. Eng. 2025, 13, 116109. [Google Scholar] [CrossRef] [Scilit]
- Sharifvaghefi, S.; Zheng, Y. Microwave vs conventional heating in hydrogen production via catalytic dry reforming of methane. Resour. Chem. Mater. 2022, 1, 290–307. [Google Scholar] [CrossRef] [Scilit]
- Serra, J.M.; Borrás-Morell, J.F.; García-Baños, B.; Balaguer, M.; Plaza-González, P.; Santos-Blasco, J.; Catalán-Martínez, D.; Navarrete, L.; Catalá-Civera, J.M. Hydrogen production via microwave-induced water splitting at low temperature. Nat. Energy 2020, 5, 910–919. [Google Scholar] [CrossRef] [Scilit]
- Chehade, G.; Lytle, S.; Ishaq, H.; Dincer, I. Hydrogen production by microwave based plasma dissociation of water. Fuel 2020, 264, 116831. [Google Scholar] [CrossRef] [Scilit]
- Younas, M.; Shafique, S.; Hafeez, A.; Javed, F.; Rehman, F. An Overview of Hydrogen Production: Current Status, Potential, and Challenges. Fuel 2022, 316, 123317. [Google Scholar] [CrossRef] [Scilit]
- Dominguez, A.; Fidalgo, B.; Fernandez, Y.; Pis, J.; Menendez, J. Microwave-assisted catalytic decomposition of methane over activated carbon for CO2-free hydrogen production. Int. J. Hydrogen Energy 2007, 32, 4792–4799. [Google Scholar] [CrossRef] [Scilit]
- Dadsetan, M.; Khan, M.F.; Salakhi, M.; Bobicki, E.R.; Thomson, M.J. CO2-free hydrogen production via microwave-driven methane pyrolysis. Int. J. Hydrogen Energy 2023, 48, 14565–14576. [Google Scholar] [CrossRef] [Scilit]
- Salakhi, M.; Liddo, L.D.; Thomson, M.J. Modeling microwave heating in fluidized bed reactors: Revealing the interaction between microwave absorption and fluidization hydrodynamics. Chem. Eng. Sci. 2025, 315, 121884. [Google Scholar] [CrossRef] [Scilit]
- Suttisawat, Y.; Horikoshi, S.; Sakai, H.; Abe, M. Hydrogen production from tetralin over microwave-accelerated Pt-supported activated carbon. Int. J. Hydrogen Energy 2010, 35, 6179–6183. [Google Scholar] [CrossRef] [Scilit]
- Shi, K.; Yan, J.; Luo, X.; Lester, E.; Wu, T. Microwave-assisted pyrolysis of bamboo coupled with reforming by activated carbon for the production of hydrogen-rich syngas. Energy Procedia 2017, 142, 1640–1646. [Google Scholar] [CrossRef] [Scilit]
- Erguvan, M.; Boylu, R.; Strobel, M.; Amini, S. An experimental study on microwave-assisted direct air capture of CO2 under fluidized bed conditions. Sustain. Energy Fuels 2025, 9, 1247–1267. [Google Scholar] [CrossRef] [Scilit]
- Guo, F.; Dong, Y.; Tian, B.; Du, S.; Liang, S.; Zhou, N.; Wang, Y.; Chen, P.; Ruan, R. Applications of microwave energy in gas production and tar removal during biomass gasification. Sustain. Energy Fuels 2020, 4, 5927–5946. [Google Scholar] [CrossRef] [Scilit]
- Ahmed, I.; Duchesne, M.; Tan, Y.; Lu, D.Y. Electrically Heated Fluidized Beds—A Review. Ind. Eng. Chem. Res. 2024, 63, 4205–4235. [Google Scholar] [CrossRef] [Scilit]
- Pu, X.; Jiang, L.; Suo, S.; Dai, Y.; Hamid, M.O.A.; Wang, S.; Zhang, Y.; Qi, H.; Xie, M. Large-eddy simulation and proper orthogonal decomposition analysis of wake flow in a random foam ceramic reactor. Chem. Eng. J. 2026, 548, 181880. [Google Scholar] [CrossRef] [Scilit]
- Erdemir, D.; Dincer, I. Cleaner hydrogen production by microwaves: Experimental investigation and comparative assessment. J. Clean. Prod. 2025, 509, 145602. [Google Scholar] [CrossRef] [Scilit]
- Li, T.; Xiang, X.; Liu, S.; Chen, W.; Guo, J.; Xiang, Y.; Wang, X.; Liu, J.; He, C. Analysis of dual fluidized bed gasification process based on the difference between energy efficiency and exergy efficiency. Energy Convers. Manag. 2025, 326, 119475. [Google Scholar] [CrossRef] [Scilit]
- Geldaet, D. Types of Gas Fluidization. Powder Technol. 1972, 7, 285–292. [Google Scholar] [CrossRef] [Scilit]
- Grace, J.R. Fluidized Bed Hydrodynamics. In Handbook of Multiphase Systems; McGraw-Hill: New York, NY, USA, 1982; Volume 8. [Google Scholar]
- Wen, C.Y. Mechanics of Fluidization. Fluid. Part. Technol. Chem. Eng. Progress. Symp. Ser. 1966, 62, 100–111. [Google Scholar]
- Xu, Y.; Li, T.; Musser, J.; Liu, X.; Xu, G.; Rogers, W.A. CFD-DEM modeling the effect of column size and bed height on minimum fluidization velocity in micro fluidized beds with Geldart B particles. Powder Technol. 2017, 318, 321–328. [Google Scholar] [CrossRef] [Scilit]
- Erguvan, M.; Amini, S. Experimental microwave assisted CO2 desorption of a solid sorbent in a fluidized bed reactor. Sep. Purif. Technol. 2024, 343, 127062. [Google Scholar] [CrossRef] [Scilit]
- Chen, S.G.; Yang, R.T.; Kapteijn, F.; Moulijn, J.A. A new surface oxygen complex on carbon: Toward a unified mechanism for carbon gasification reactions. Ind. Eng. Chem. Res. 2002, 32, 2835–2840. [Google Scholar]
- Dawson, E.A.; Parkes, G.M.B.; Barnes, P.A.; Bond, G.; Mao, R. The generation of microwave-induced plasma in granular active carbons under fluidised bed conditions. Carbon 2008, 46, 220–228. [Google Scholar] [CrossRef] [Scilit]
- Dai, H.; Zhao, H.; Chen, S.; Jiang, B. A Microwave-Assisted Boudouard Reaction: A Highly Effective Reduction of the Greenhouse Gas CO2 to Useful CO Feedstock with Semi-Coke. Molecules 2021, 26, 1507. [Google Scholar] [CrossRef] [Scilit] [PubMed]
- La, X.; Liu, H.; Liao, W.; Lin, X.; Shi, B.; Sun, Y.; Ren, J.; Xiong, L.; Wang, S.; Wang, J.; et al. Enhancing biochar steam gasification via frequency-tuned microwave heating for efficient CO2-to-CO conversion. Biomass Bioenergy 2026, 214, 109506. [Google Scholar] [CrossRef] [Scilit]
- Hamidani, G.; Kazemi, S.; Eslami, A.; Zarghami, R.; Sotudeh-Gharebagh, R.; Mostoufi, N. Enhancing biomass pyrolysis via microwave heating: A CFD-DEM study on intensification in fluidized beds. Fuel 2026, 406, 137081. [Google Scholar] [CrossRef] [Scilit]
- Ma, X.; Albertsma, J.; Gabriels, D.; Horst, R.; Polat, S.; Snoeks, C.; Kapteijn, F.; Eral, H.B.; Vermaas, D.A.; Mei, B.; et al. Carbon monoxide separation: Past, present and future. Chem. Soc. Rev. 2023, 52, 3741–3777. [Google Scholar] [CrossRef] [Scilit] [PubMed]
- Iyer, G.M.; Ku, C.E.; Zhang, C. Hyperselective carbon membranes for precise high-temperature H2 and CO2 separation. Sci. Adv. 2025, 11, eadt7512. [Google Scholar] [CrossRef] [Scilit] [PubMed]
- Poudel, J.; Choi, J.H.; Oh, S.C. Process Design Characteristics of Syngas (CO/H2) Separation Using Composite Membrane. Sustainability 2019, 11, 703. [Google Scholar] [CrossRef] [Scilit]
- Wang, L.; Zhou, T.; Hou, B.; Yang, H.; Hu, N.; Zhang, M. A Comprehensive Review of Biomass Gasification Characteristics in Fluidized Bed Reactors: Progress, Challenges, and Future Directions. Fluids 2025, 10, 147. [Google Scholar] [CrossRef] [Scilit]
- Li, W.; Wu, S.; Wu, Y.; Huang, S.; Gao, J. Gasification characteristics of biomass at a high-temperature steam atmosphere. Fuel Process. Technol. 2019, 194, 106090. [Google Scholar] [CrossRef] [Scilit]
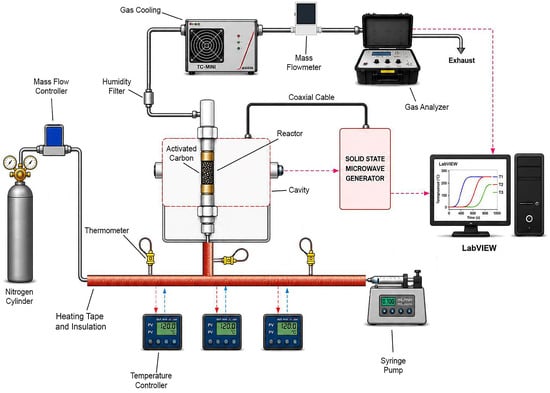
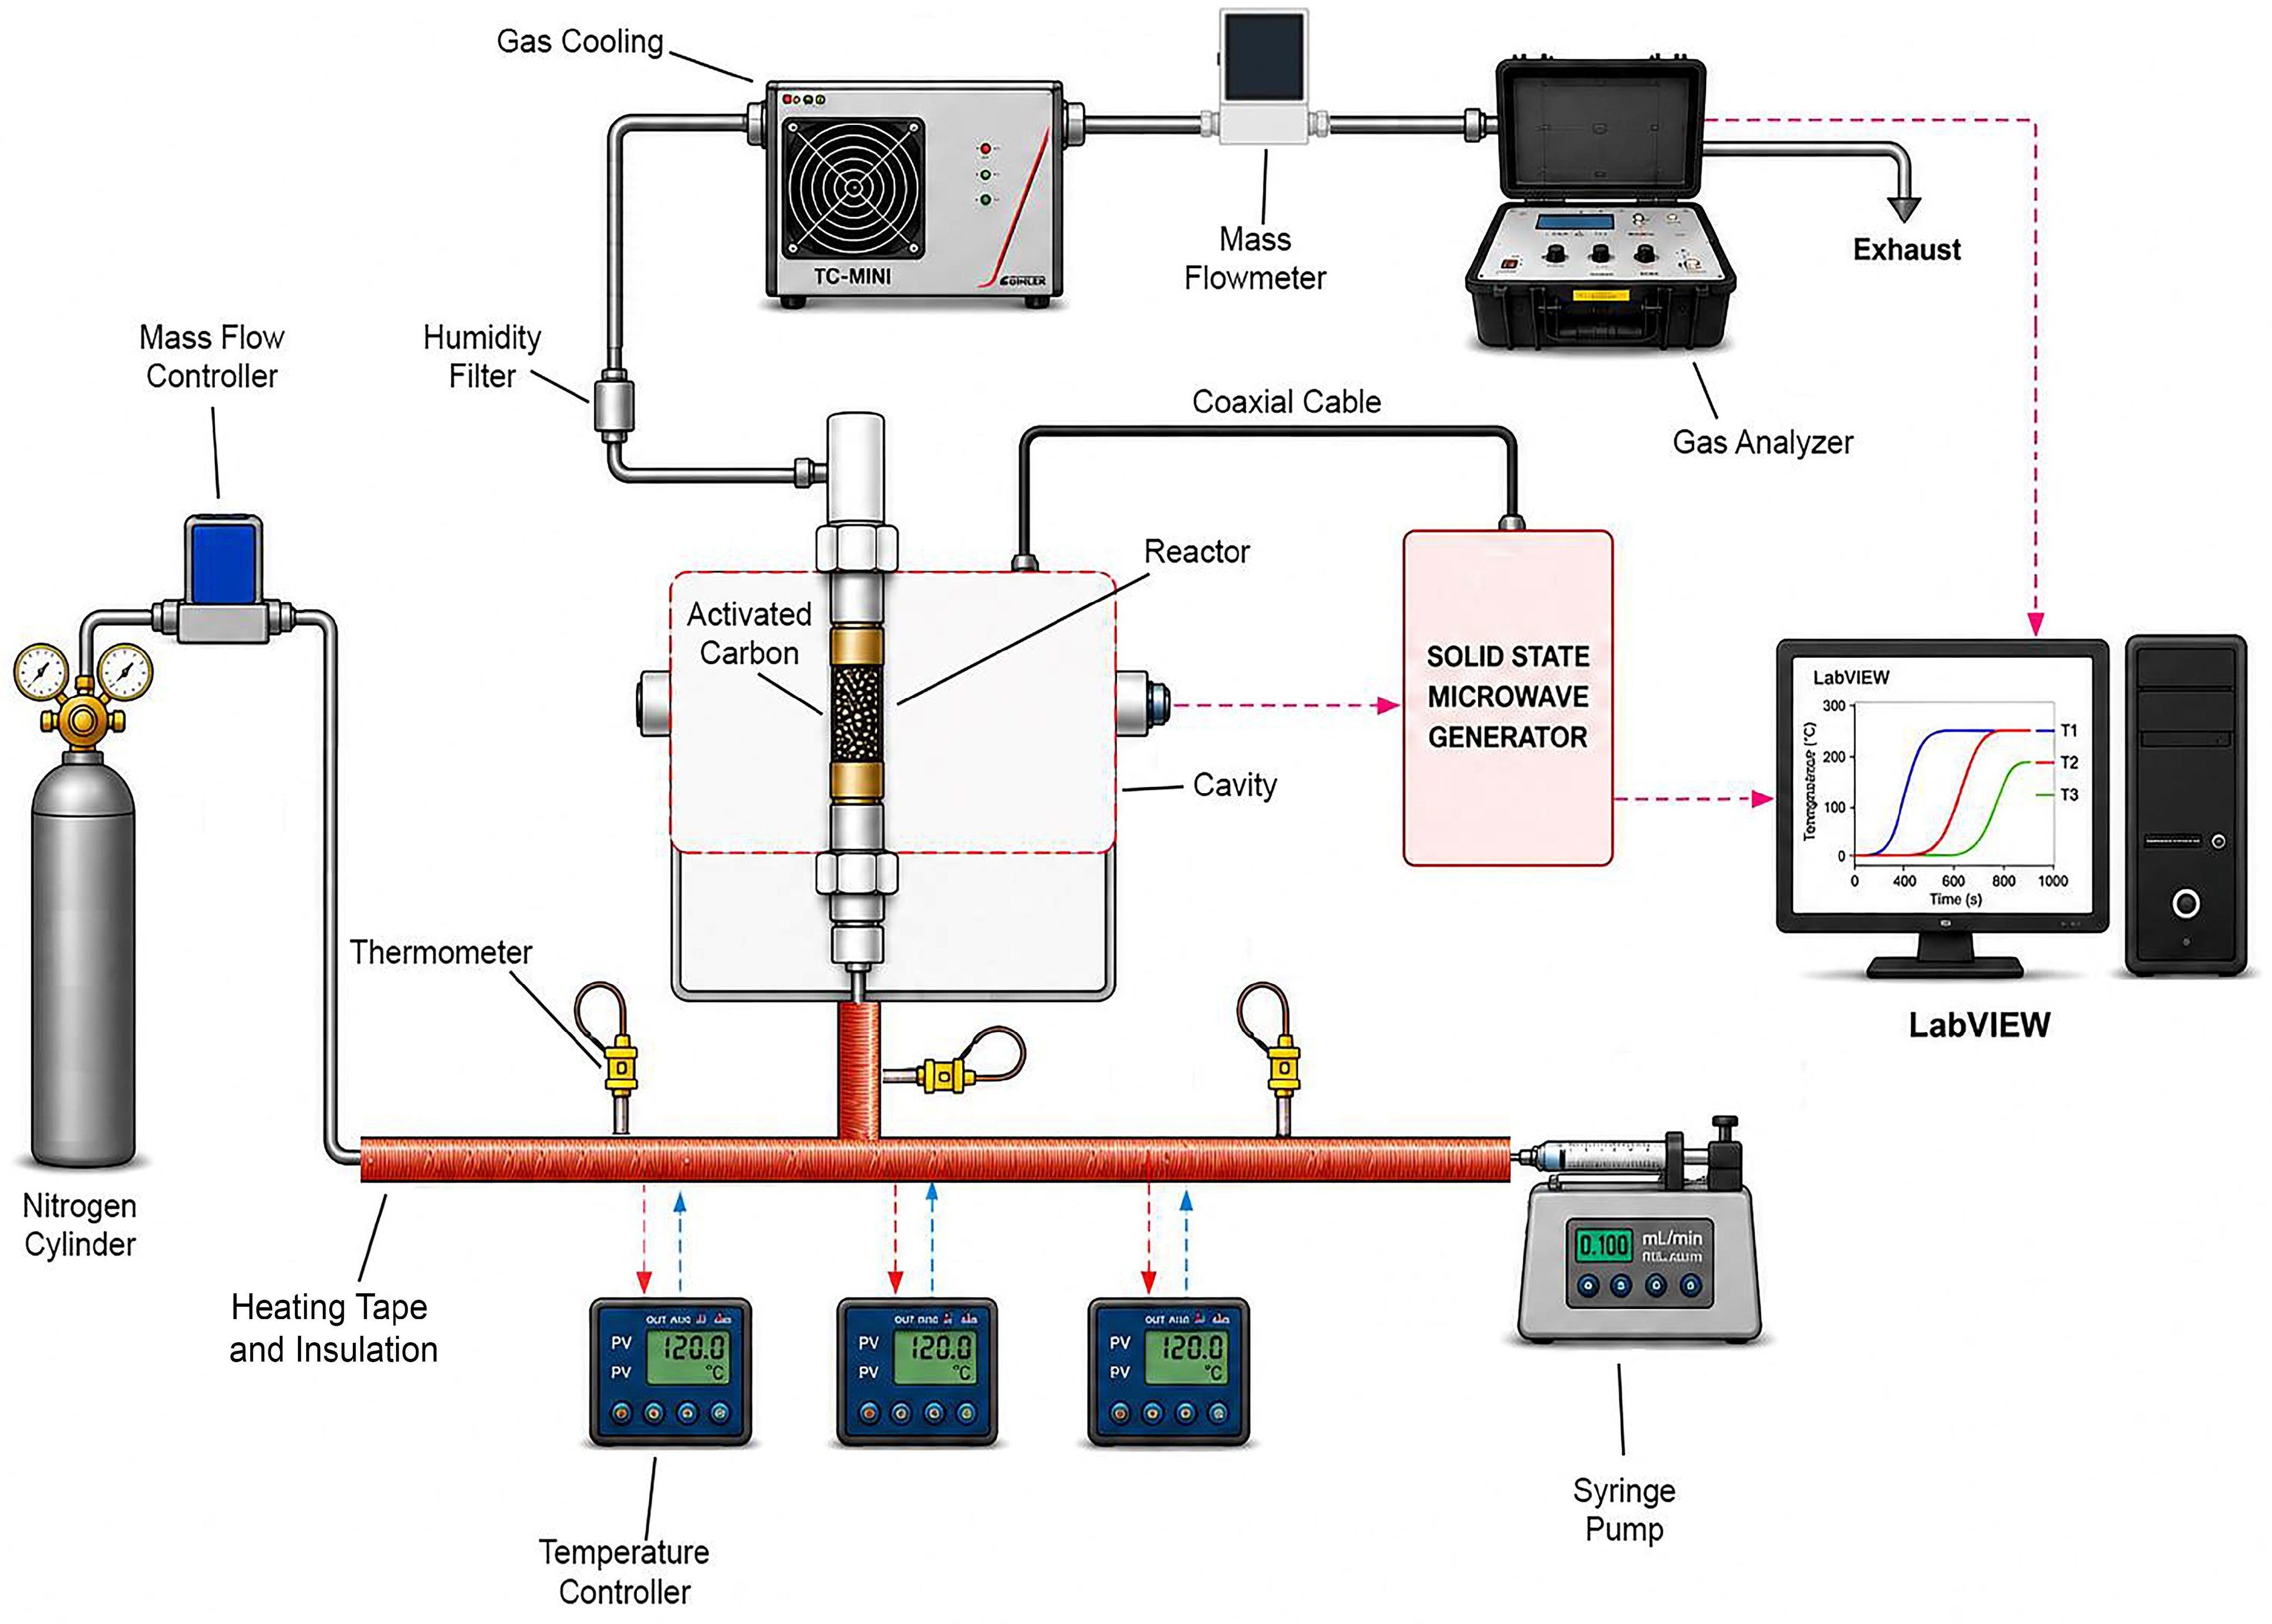
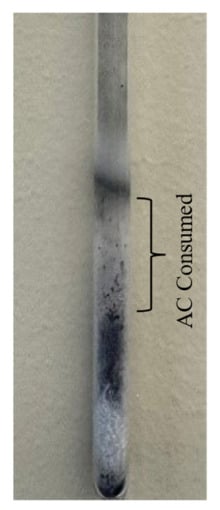
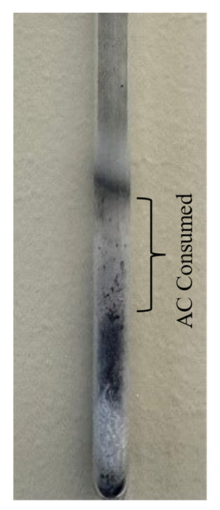
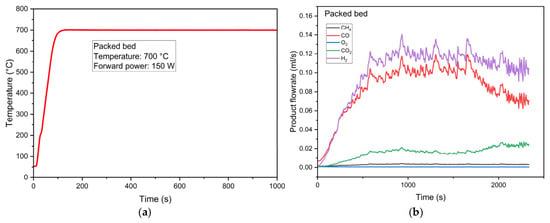
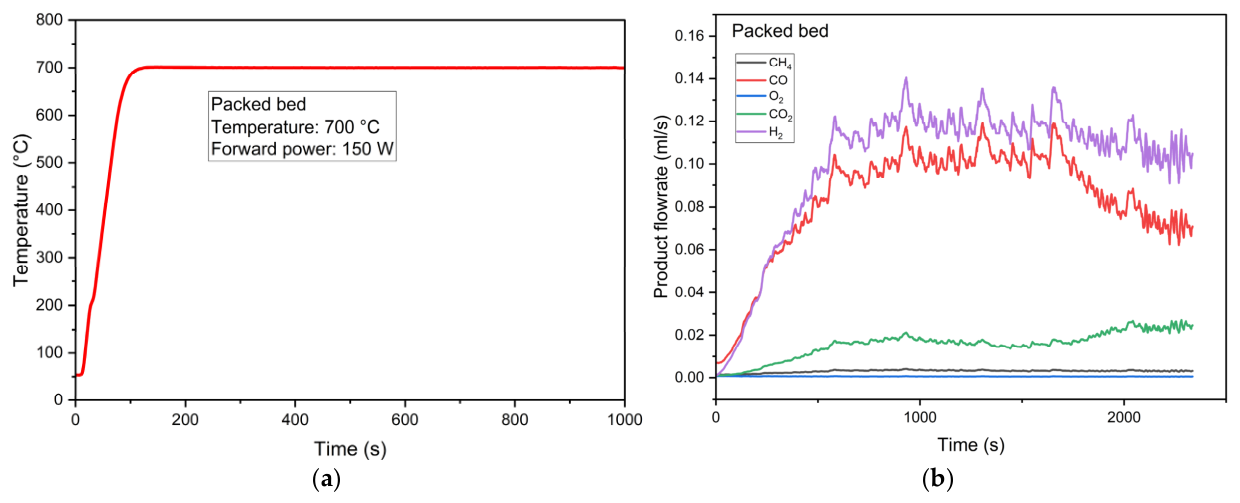
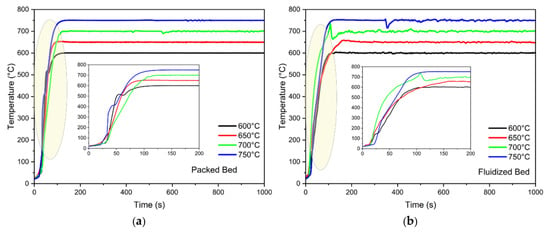
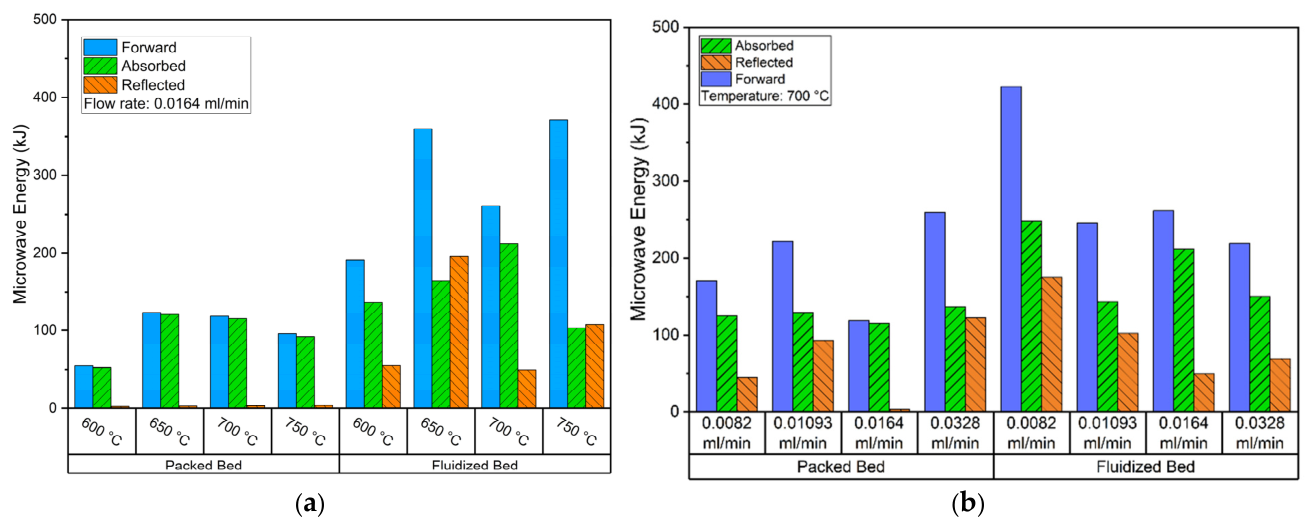
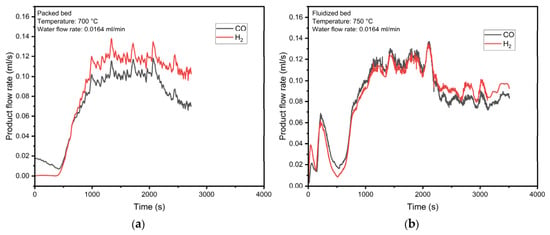
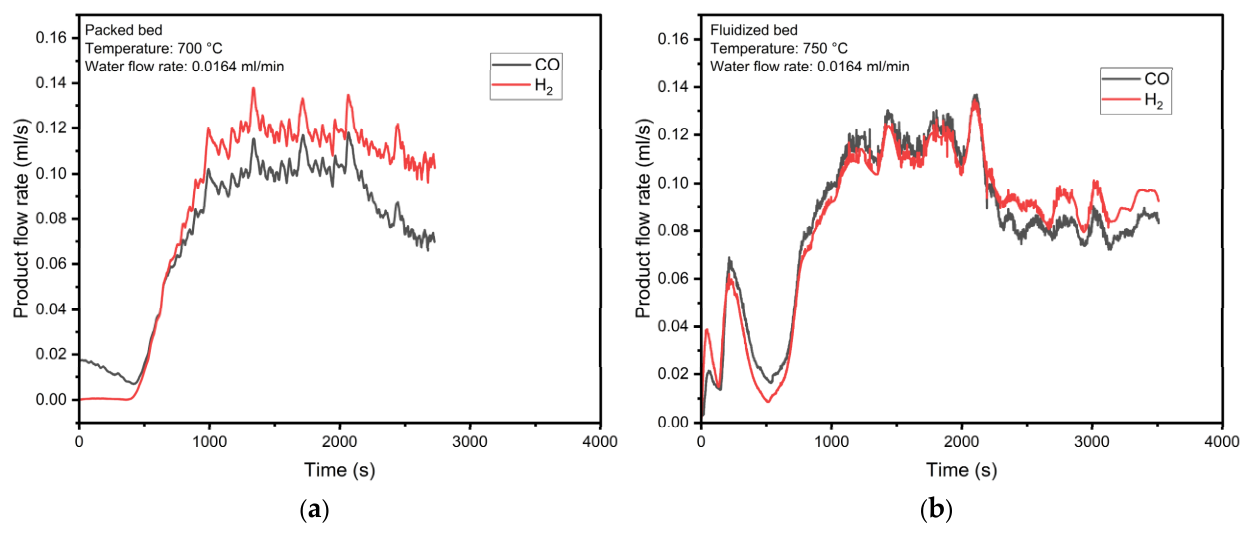
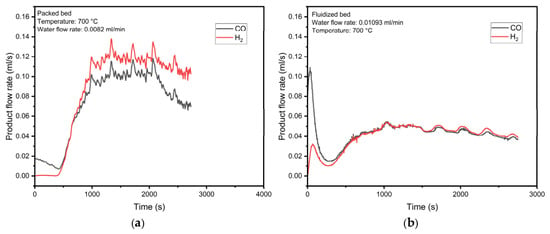
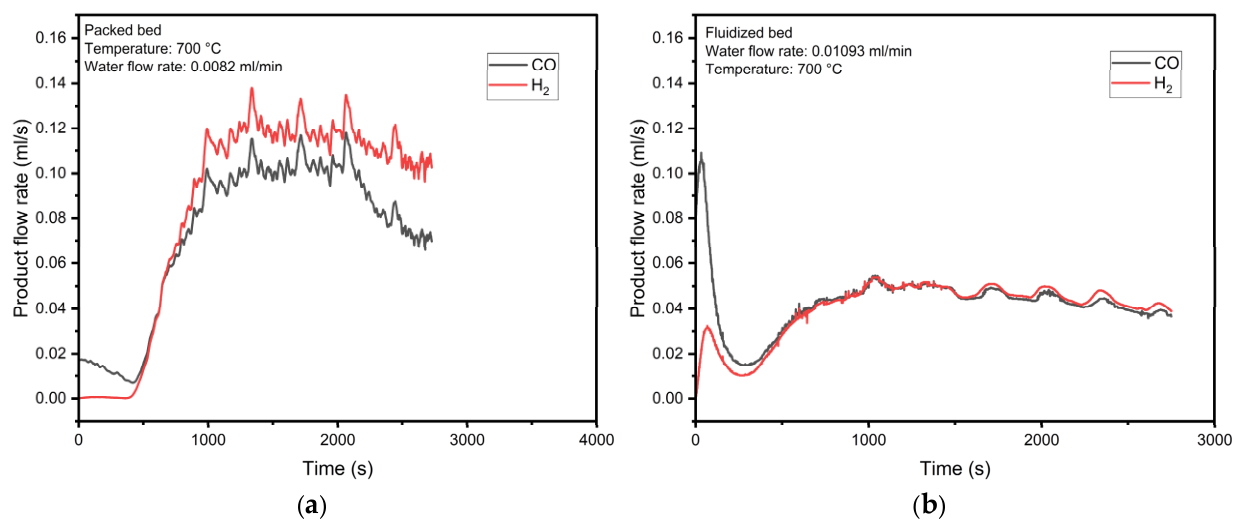
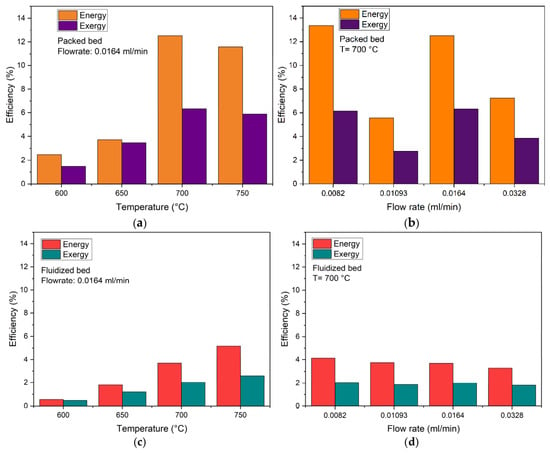
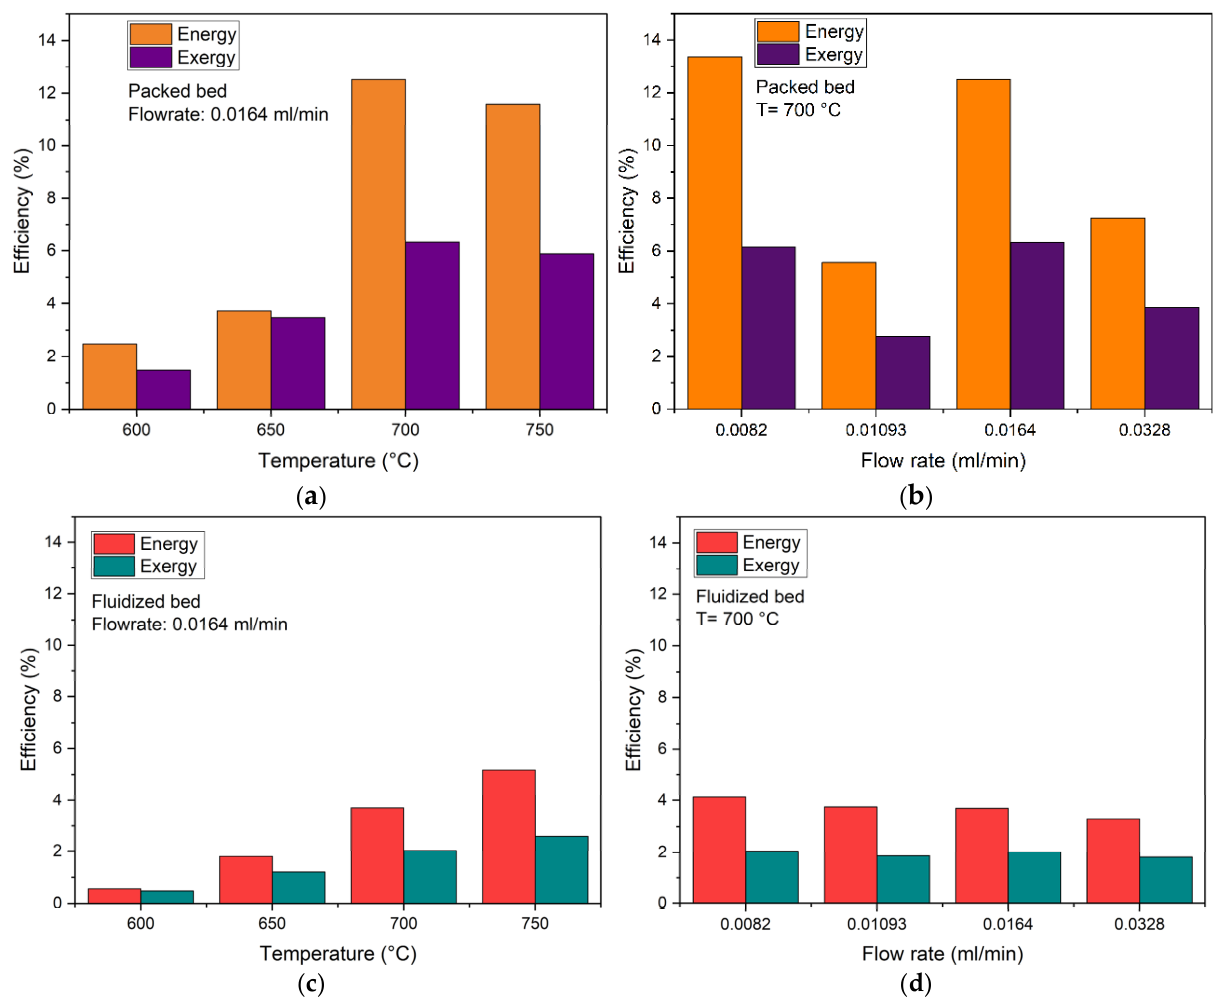
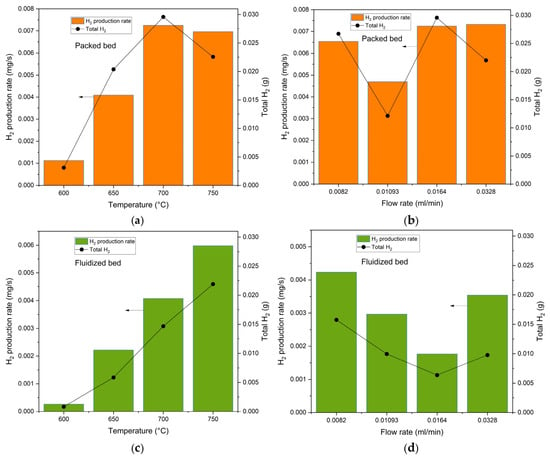
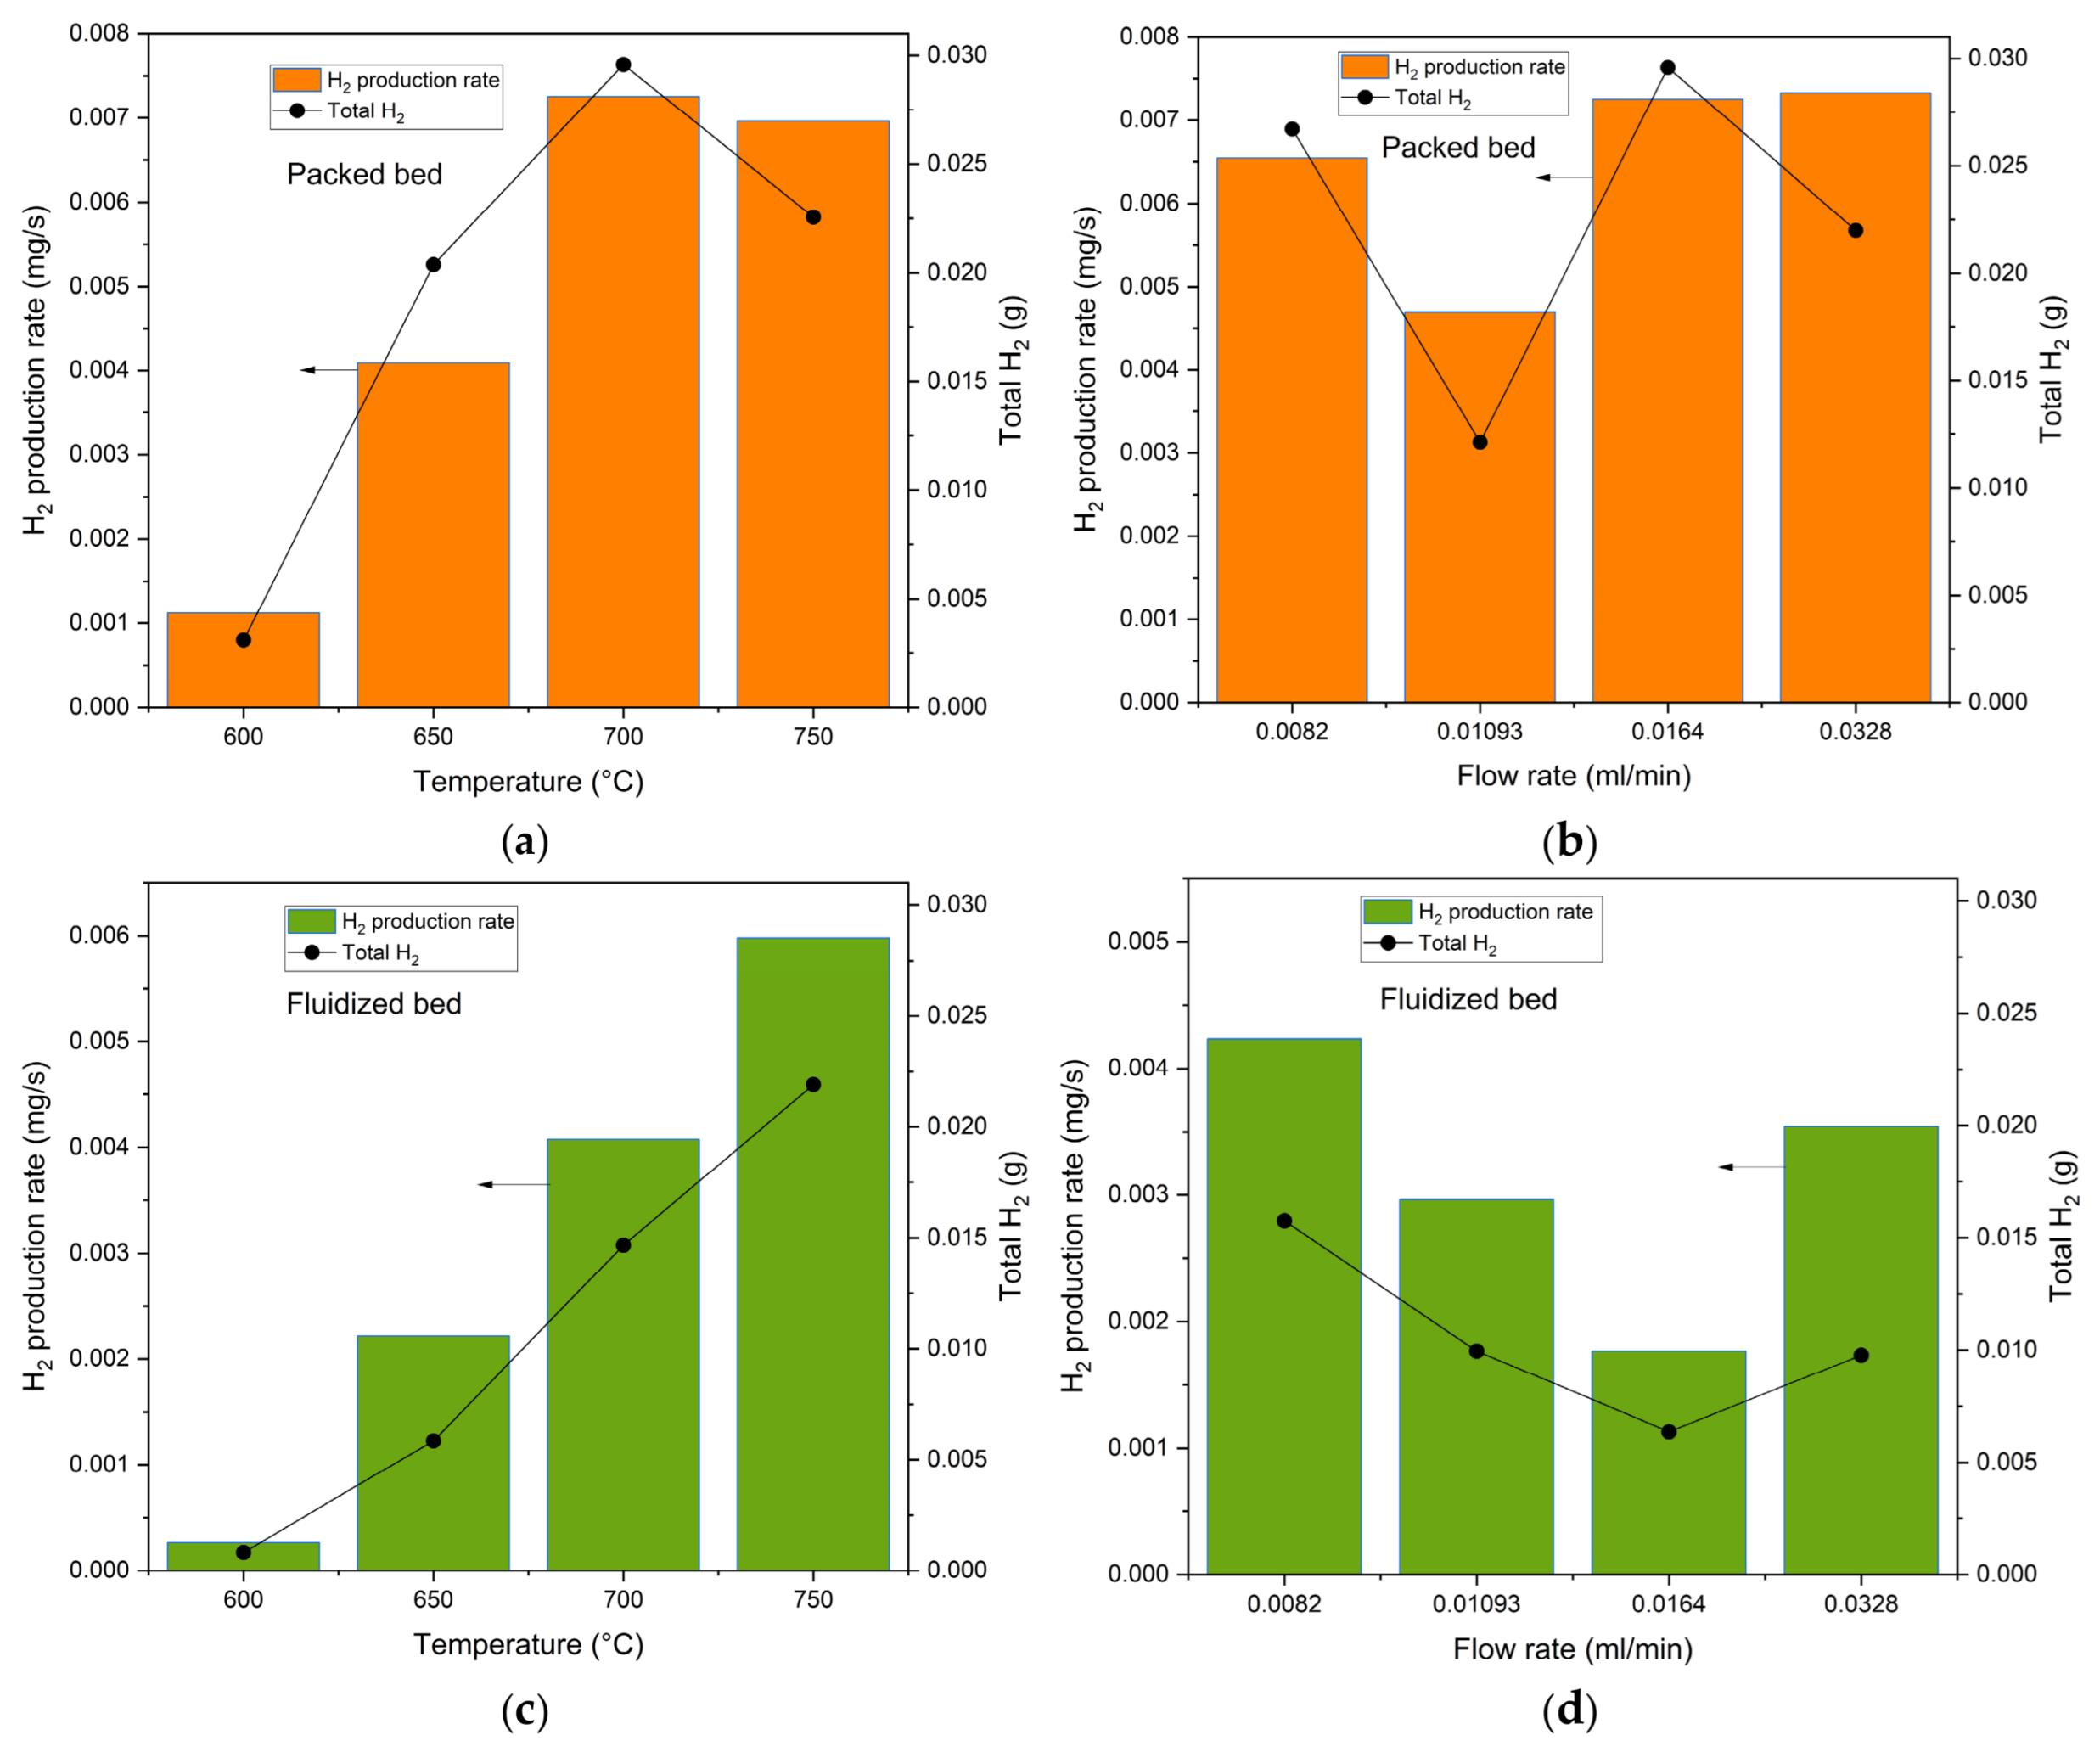
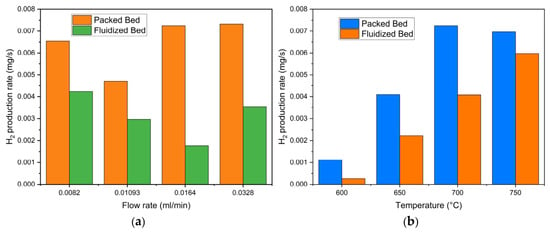
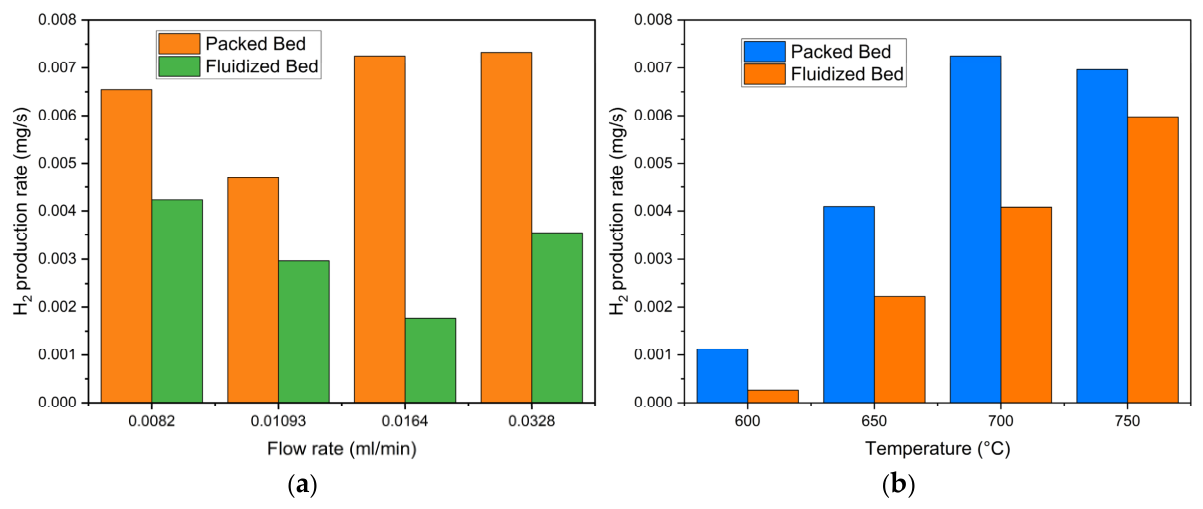

Disclaimer/Publisher’s Note: The statements, opinions and data contained in all publications are solely those of the individual author(s) and contributor(s) and not of MDPI and/or the editor(s). MDPI and/or the editor(s) disclaim responsibility for any injury to people or property resulting from any ideas, methods, instructions or products referred to in the content. |
© 2026 by the authors. Licensee MDPI, Basel, Switzerland. This article is an open access article distributed under the terms and conditions of the Creative Commons Attribution (CC BY) license.