


Abstract
The construction of underground reservoirs in coal goafs is an innovative technology to alleviate the coal–water conflict in arid mining areas of northwest China. However, its widespread application is constrained by the challenge of accurately predicting water inflow, which fluctuates significantly due to the dynamic “expansion–closure” behavior of mining-induced fractures. This study focuses on the Shendong mining area, where repeated multi-seam mining occurs, and employs a coupled Finite Discrete Element Method (FDEM) and Computational Fluid Dynamics (CFD) numerical model, combined with in situ tests such as drilling fluid loss and groundwater level monitoring, to quantify the evolution of overburden fractures and their impact on reservoir water inflow during mining, 8 months post-mining, and after 7 years. The results demonstrate that the height of the water-conducting fracture zone decreased from 152 m during mining to 130 m after 7 years, while fracture openings in the key aquifer and aquitard were reduced by over 50%. This closure process caused a dramatic decline in water inflow from 78.3 m3/h to 2.6 m3/h—a reduction of 96.7%. The CFD-FDEM simulations showed a deviation of only 10.6% from field measurements, confirming fracture closure as the dominant mechanism driving inflow attenuation. This study reveals how fracture closure shifts water flow patterns from vertical to lateral recharge, providing a theoretical basis for optimizing the design and sustainable operation of underground reservoirs.
1. Introduction
The Shendong Coalfield is located in the arid and semi-arid region of northwest China, with an average annual precipitation of less than 400 mm and evaporation reaching 2000–2500 mm [1]. The total water resources in this area account for only 3.9% of the national total. In stark contrast, the region holds approximately 25% of the country’s coal reserves, with an annual output exceeding 200 million tons [2]. The intensive coal mining activities sharply conflict with the severe water scarcity, exacerbating regional environmental pressures. Under traditional mining practices, mine water was often discharged as a hazard, leading to an annual loss of about 6 billion tons of water resources and further degrading the already fragile ecosystem [3]. To address this coal–water contradiction, the construction of underground reservoirs in coal goafs has emerged as an innovative technological approach, aiming to achieve synergistic development of coal extraction, water storage, and ecological protection [4,5].
Coal mine underground reservoir technology utilizes the pore spaces formed by collapsed rock masses in goaf areas for water storage, leveraging the filtration and adsorption effects of rock strata to achieve natural purification of mine water [6,7]. This creates an integrated cyclic system of “diversion–purification–storage–utilization” (Figure 1). Using this technology, ShenDong Coal Group has constructed 35 underground reservoirs with a total storage capacity of 32 million cubic meters, supplying over 65 million cubic meters of water annually and meeting 95% of the mining area’s water demand. However, the long-term stable operation of these underground reservoirs heavily depends on the consistency of water inflow [8], which is directly controlled by the dynamic processes of fracture expansion and closure in the mining-affected overlying strata. Mining-induced fractures in coal seam surrounding rock may trigger water inrush risks if not fully closed, endangering mining safety and increasing economic costs [9]. Conversely, excessive fracture closure will drastically reduce water inflow, rendering the construction of underground reservoirs unnecessary.
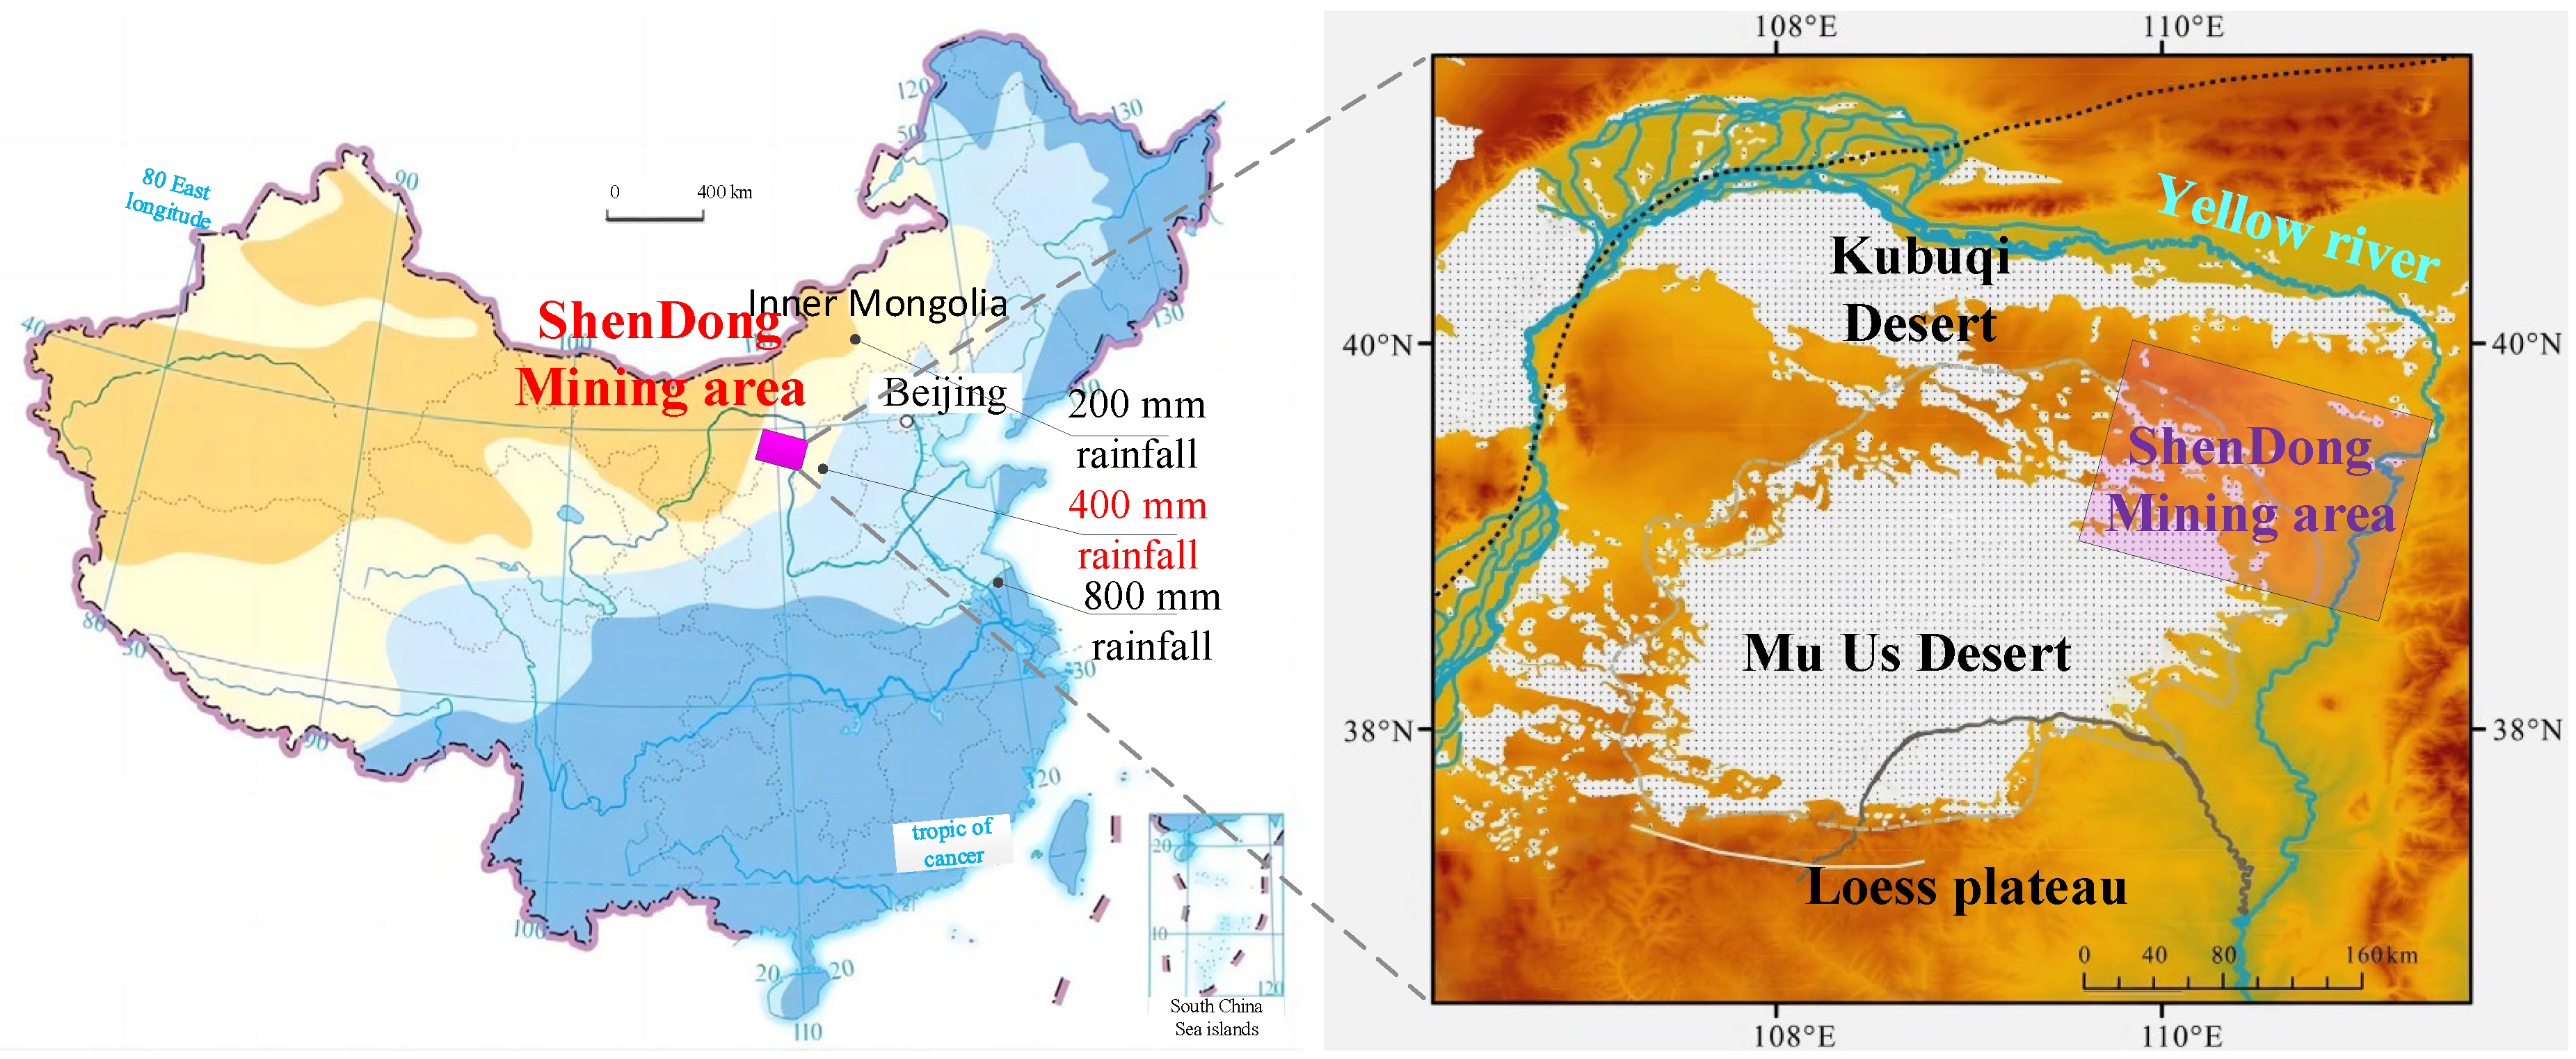
Figure 1.
Location of Shendong mining area.
However, existing research predominantly focuses on the fracture expansion process induced by mining stress, particularly the height of the water-conducting fracture zone and its impact on water inflow, with scarce attention paid to the negative effects of fracture closure on inflow reduction. For instance, Molinero et al. [10], Wang et al. [11], and Bakhshi et al. [12] identified coal seam thickness and key stratum position as critical factors controlling the height of the water-conducting fracture zone, where the seam thickness determines its lower limit and the first key stratum above the goaf governs its upper limit. Based on this, a numerical simulation method for predicting the height of water-conducting fracture zones was established and validated through in situ data such as drilling water level and fluid leakage. Wang et al. [13], Sakhno et al. [14], and Huang et al. [15] employed empirical formulas to analyze the development height of the water-conducting fracture zone in longwall mining faces, combining FLAC3D and Ansys numerical simulation (FDM or FEM) and water injection leakage tests to determine the ratio of overburden failure height to mining thickness. Zhang et al. [16], Bu et al. [17], and Xu et al. [18] utilized discrete element numerical simulations (DEM) integrated with in situ measured data, revealing a triangular envelope shape of the water-conducting fracture zone in weakly cemented overburden. For water inflow prediction in goafs, numerical simulation remains the primary method. Yu et al. [19], Islam et al. [20], and Sakhno et al. [21] applied FEM numerical simulations combined with borehole peeping, finding that aquifer water release occurs intermittently under mining influence, leading to an alternating increasing–decreasing pattern in goaf water inflow with an overall declining trend. Yin et al. [22] and Jia et al. [23], against the engineering background of water loss in Quaternary aquifers due to mining, conducted hydrogeological drilling and quantified near-surface water leakage using numerical simulation methods. Singh et al. [24], Wang et al. [25], and Wu et al. [26] employed ArcGIS 10.2 or GMS 10.8 seepage software to construct numerical models predicting the dynamic changes in roof water inflow during mining, overcoming the limitations of static inflow predictions based on the “large well method” analytical solution [27,28]. Nevertheless, these studies and methods primarily concentrate on the fracture expansion phase, often relying on continuum mechanics assumptions or static permeability coefficients, making it difficult to accurately characterize the fracture closure effect induced by post-mining stress adjustments and the consequent time-dependent attenuation of permeability.
This study investigates the dynamic “expansion–closure” mechanism of overburden fractures in underground reservoirs within the Shendong mining area. By integrating the Finite Discrete Element Method (FDEM) with Computational Fluid Dynamics (CFD), a coupled model is developed to simulate the spatiotemporal evolution of fracture networks during and after coal seam extraction. The model quantifies the time-dependent closure rates of fracture openings in key aquifers and aquicludes, as well as the corresponding changes in fracture seepage velocity. Validated against in situ data—including drilling fluid loss, groundwater level monitoring, and water inflow measurements—the coupled model demonstrates high accuracy in predicting the long-term attenuation trend of water inflow. The aims of this research study are to reveal the intrinsic mechanism of fracture closure-controlled water inflow attenuation, prevent unnecessary water loss from underground reservoirs, and mitigate flood risks associated with abrupt inflow fluctuations, thereby providing scientific support for the optimized design and sustainable operation of underground reservoirs in arid mining areas.
2. Phenomenon of Fractures Expansion–Closure in Underground Reservoir
2.1. Overview of Underground Reservoir in Shendong Coalfield
The Shendong mining area, a pivotal component among China’s 13 large-scale coal bases, spans the interprovincial region of Yulin (Shaanxi), Ordos (Inner Mongolia), and Baode (Shanxi), covering a vast area of 31,200 km2 [29]. Situated between the Mu Us and Kubuqi Deserts (Figure 1), it is characterized by a typical arid to semi-arid continental climate. The landscape is predominantly covered by aeolian sand, with sparse vegetation and severe soil erosion. Decades of intensive underground coal mining have further exacerbated these inherently fragile ecological conditions, intensifying environmental degradation [30].
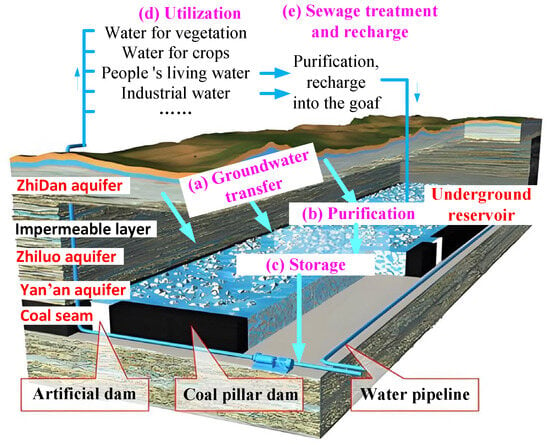
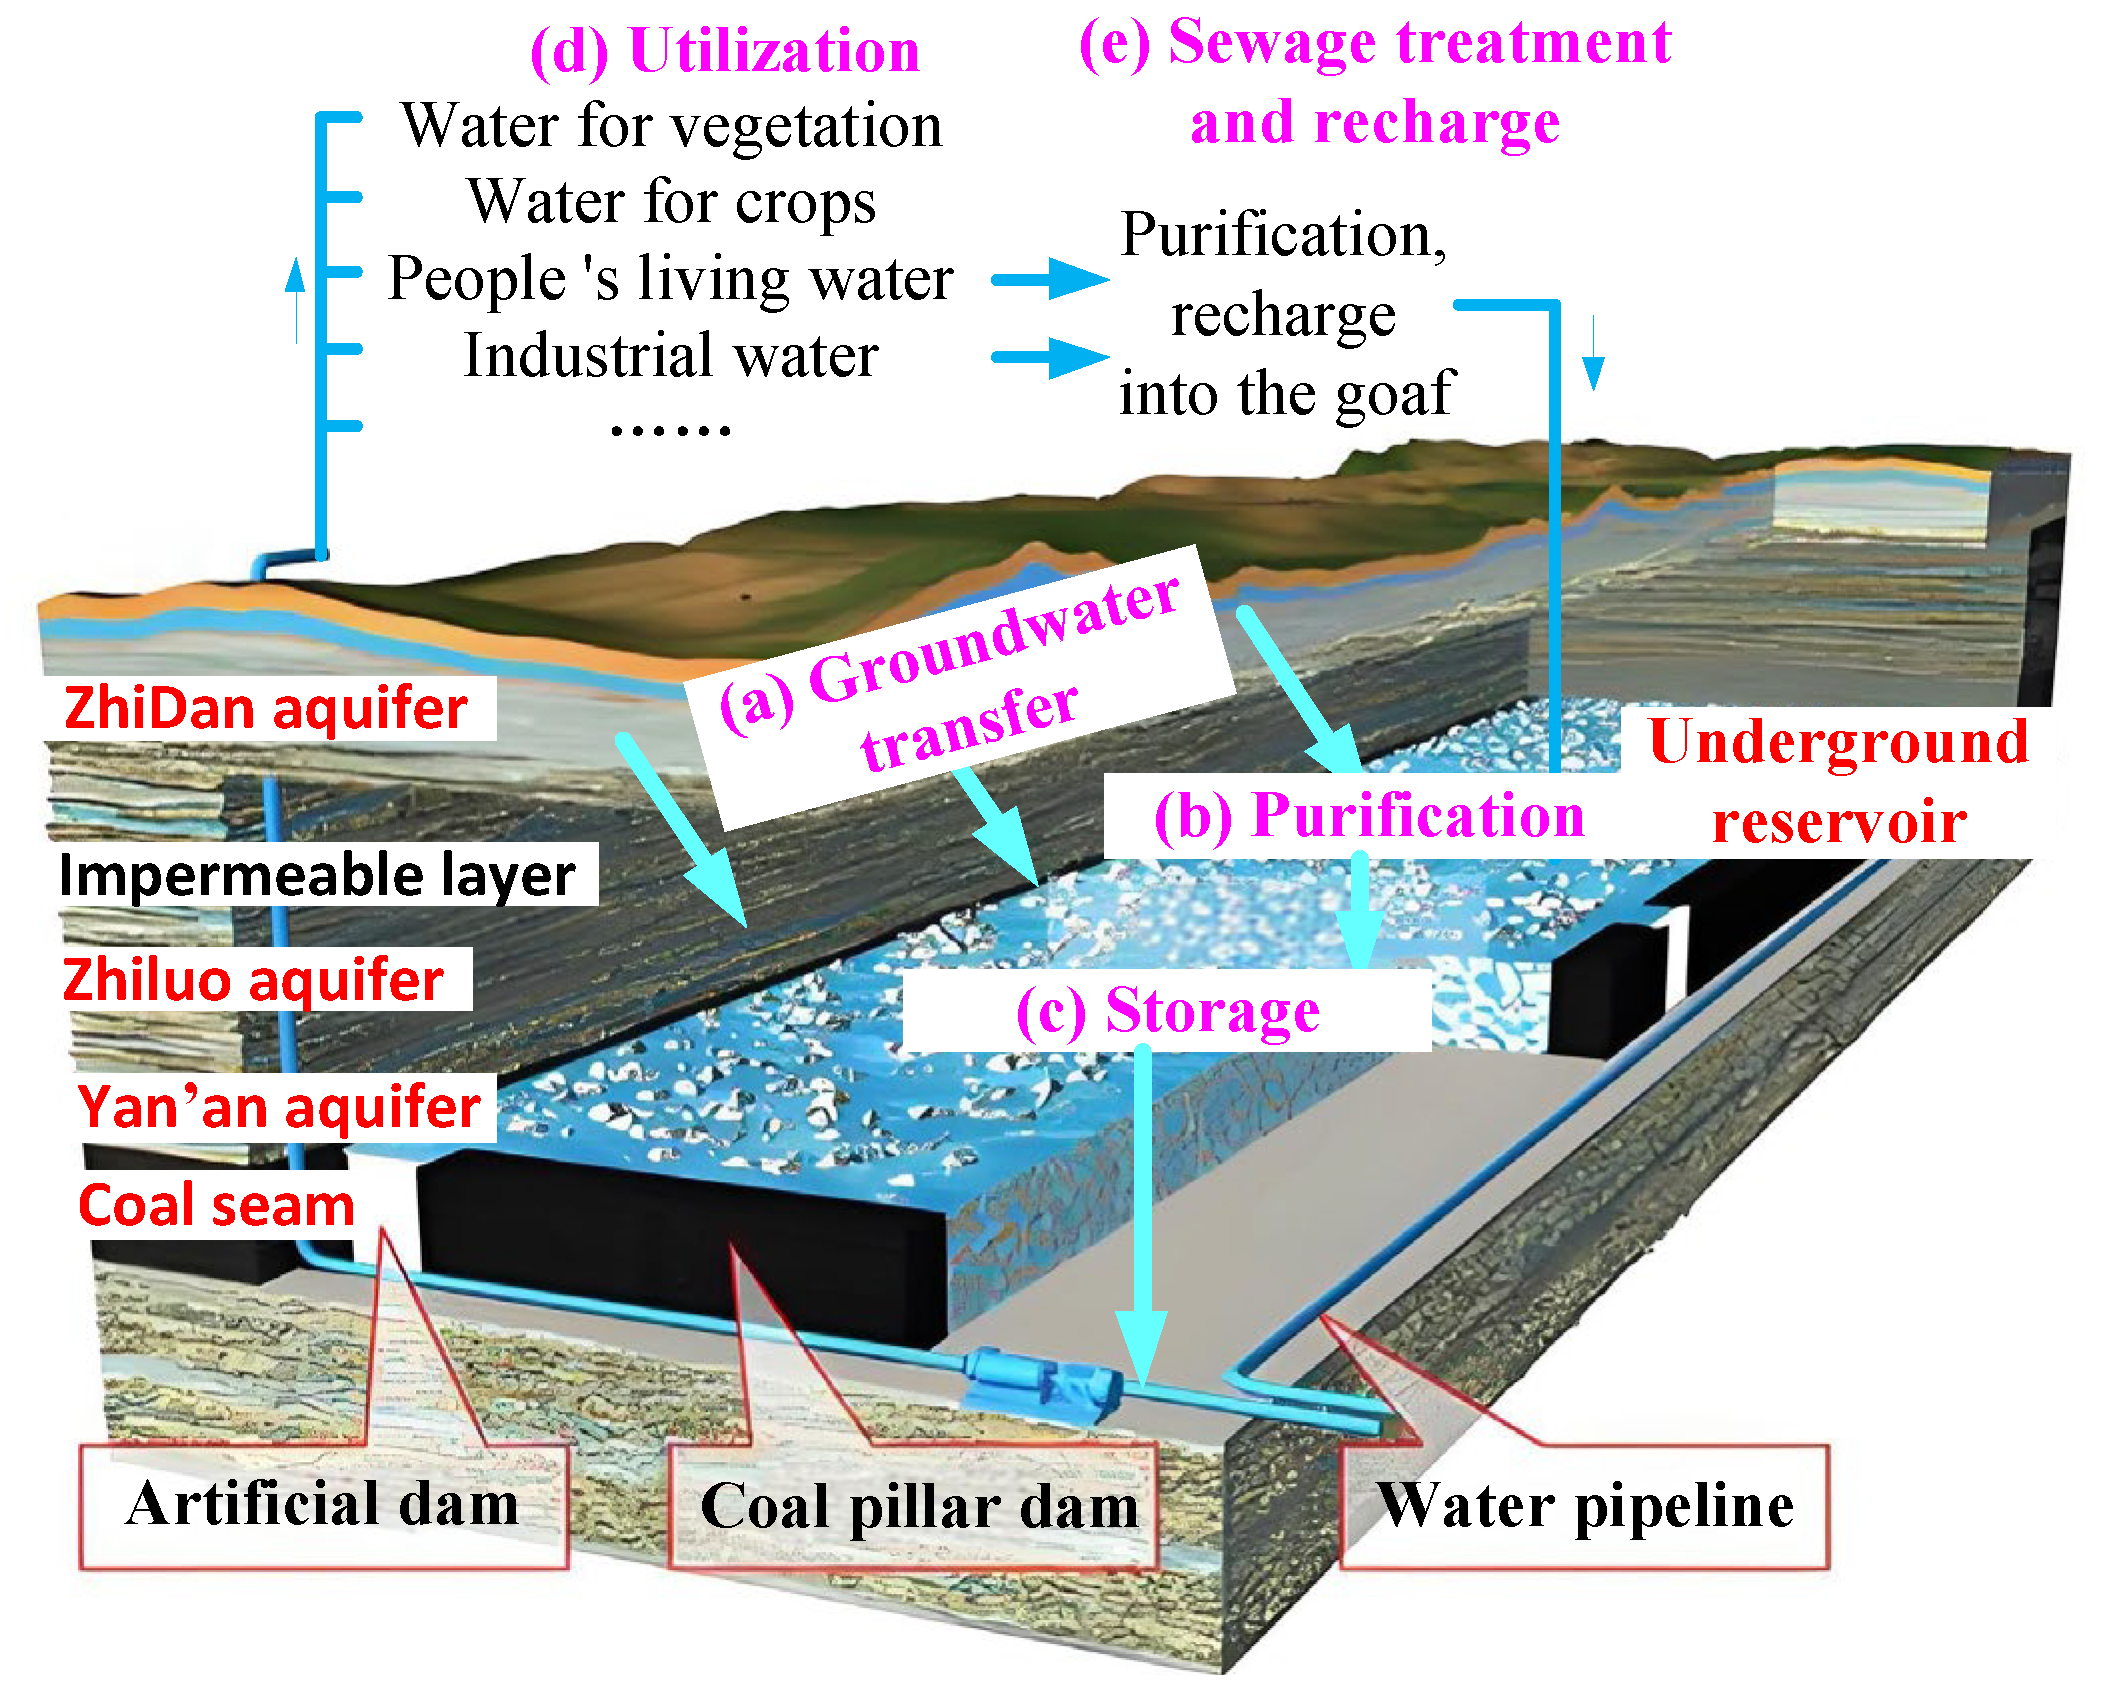
To address the prominent coal–water conflict, Shendong company has innovatively developed an underground reservoir system within coal goafs. By utilizing the water-conducting fractures formed during coal seam extraction, water gushing from working faces is channeled through artificial pipelines into sealed goafs, creating underground reservoirs (Figure 2). The abundant pores in the coal gangue within these goafs physically filter suspended solids (e.g., sediment and coal fines), while clay minerals (such as kaolinite and montmorillonite) adsorb pollutants, enabling a cyclic process of groundwater “transfer (from aquifers to reservoirs)—purification (filtration and adsorption)—storage (reservoir retention)—utilization (for agricultural, industrial, and domestic purposes)—and treated wastewater reinjection”. In practice, this approach saved over 7 × 10⁷ m3 of water in 2024, alleviating water shortages for industrial and domestic use while supporting vegetation irrigation with surplus goaf water, thus harmonizing coal extraction with water conservation.
Figure 2.
Schematic diagram of underground reservoir in coal goaf.
Despite the successful implementation of underground reservoirs in coal mines, accurately predicting water inflow—the core factor for their construction—remains a significant challenge, primarily due to the complex mechanisms governing the expansion and closure of mining-induced fractures in the overlying strata. Specifically, water inflow can increase rapidly as fractures expand, potentially jeopardizing the safety of artificial dam structures and necessitating adjustments to pipeline parameters [31]. Conversely, if fracture closure leads to insufficient water inflow, the construction of an underground reservoir may become unjustifiable [32,33]. Therefore, it is essential to elucidate the evolution patterns of overburden fractures and water inflow through in situ experiments (Section 2.2 and Section 4.3) and the establishment of a sound theoretical framework (Section 3.1).
2.2. In Situ Test of Fracture Expansion–Closure in Overlying Rock
As the main mine in the Shendong coalfield, the coal output of the Buertai Coal Mine reaches 25 million tons per year. Its main mining coal seams are coal 22 (4 m thick, 280 m buried depth) and coal 42 (6.5 m thick, 350 m buried depth). Based on the hydraulic connectivity of the overlying strata, the geological profile is conceptualized into one key impermeable layer—the mudstone layer beneath the Cretaceous Zhidan Group—and four aquifers: the Quaternary, Jurassic Zhidan Group, Jurassic Zhiluo Formation, and Jurassic Yan’an Formation aquifers.
To investigate the dynamic process of fracture expansion–closure, in situ experimental methods such as drilling flushing fluid leakage and water levels were implemented. The parameters and testing time of two ground boreholes (marked as DC-1 and DC-2) are detailed in Table 1.
Table 1.
Ground drilling parameters.
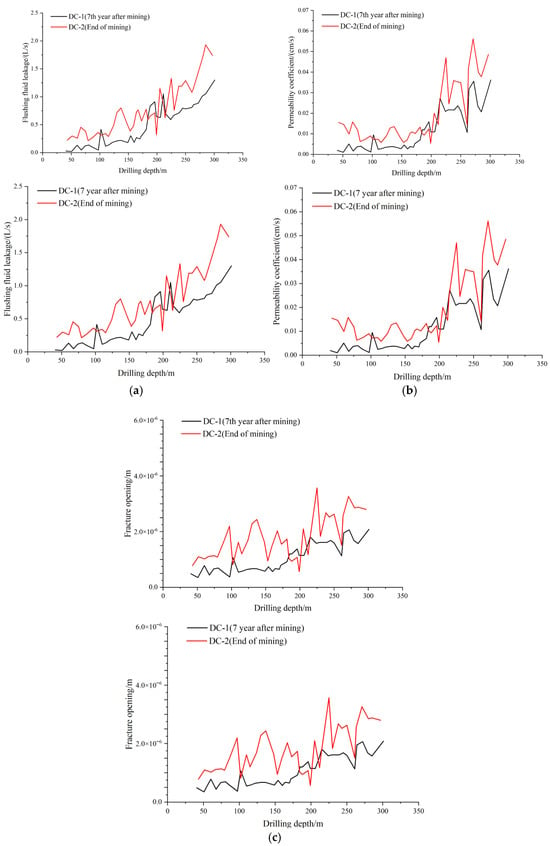
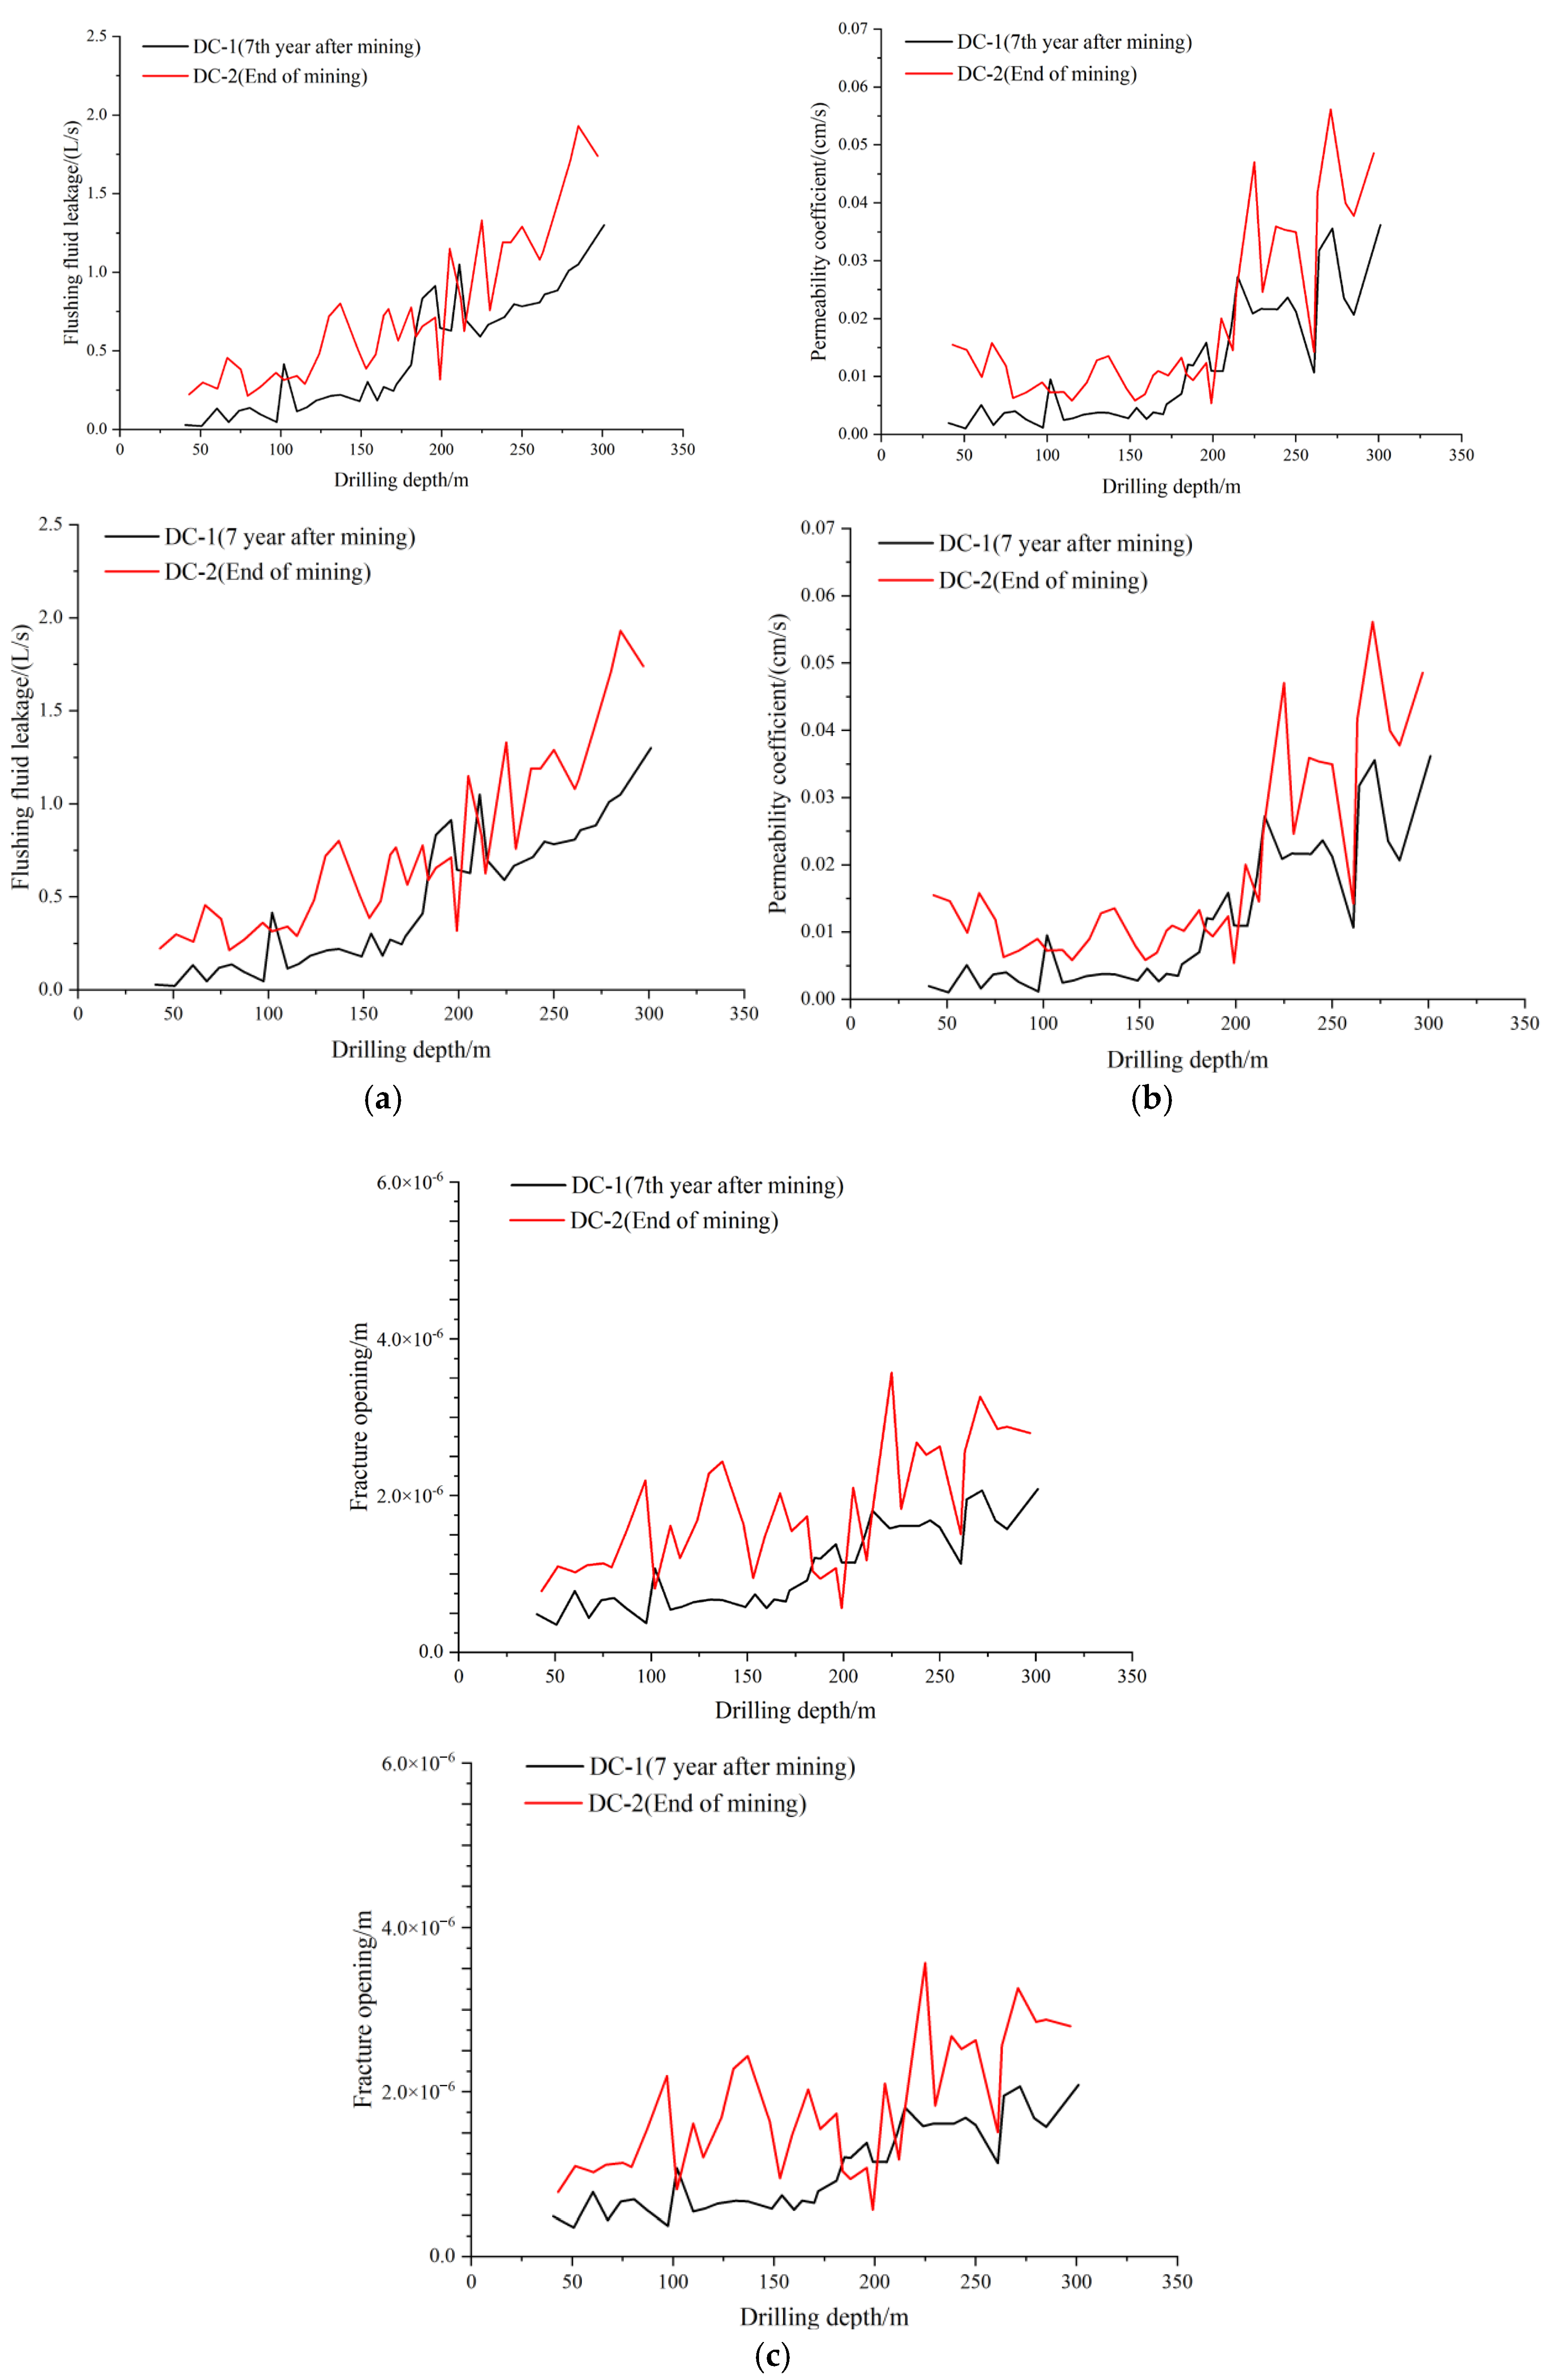
The drilling fluid loss and water level parameters in boreholes DC-1 and DC-2 were recorded during drilling. Based on the collected data, the permeability coefficients and total fracture openings for each test section (measured at 3 m intervals) were calculated using Equations (1) and (2), respectively, with the results being summarized in Figure 3.
where K is the permeability coefficient; L is the length of the test section, 3 m; r is the drilling radius; H is the height of the test water head; ρ is the density of water; G is the acceleration due to gravity; b is the crack opening; and μ is the hydrodynamic viscosity.
Figure 3.
Evolution curves of hydrological parameters with drilling depth. (a) Flushing fluid leakage–drilling depth curves. (b) Permeability coefficient–drilling depth curves. (c) Fracture opening–drilling depth curves.
A comparison of hydrological data between the immediate post-mining period (DC-2) and the 7th year after mining (DC-1) reveals a significant fracture expansion–closure process in the overlying strata. Within the borehole depth range of 0–320 m, the flushing fluid loss rate, permeability coefficient, and fracture opening measured 7 years after mining (black curves in Figure 3a–c) are systematically lower than those recorded at the end of mining (red curves), with highly consistent fluctuation patterns across all three parameters. Specifically, within the key aquifuge (100–150 m depth), the fracture opening decreased from a peak value of 4.2 × 10⁻⁶ m at mining completion to 1.8 × 10⁻⁶ m after 7 years (a reduction of 57.1%). Correspondingly, the permeability coefficient declined from 0.055 cm/s to 0.025 cm/s (a 54.5% reduction), and the flushing fluid loss rate dropped from 2.2 L/s to 1.1 L/s (a 50.0% reduction). This synergistic attenuation confirms that mining-induced fractures gradually close under long-term stress adjustments, leading to a continuous decrease in rock mass permeability and effectively blocking vertical water flow pathways. These findings provide direct evidence for explaining the mechanism behind the temporal attenuation of water inflow in underground reservoirs.
The analysis of flushing fluid loss and permeability coefficient of borehole wall further clarifies the height variation of the water-conducting fracture zone over 7 years. For borehole DC-2, at depths above 198 m, the flushing fluid loss rate generally remained below 0.7 L/s, and the permeability coefficient of the borehole wall was consistently lower than 0.015 cm/s. Beyond 198 m, however, the flushing fluid loss rate increased rapidly, exceeding 1.2 L/s, while the permeability coefficient rose above 0.035 cm/s. This indicates that the height of the water-conducting fracture zone after mining is 152 m. A similar trend was observed in borehole DC-1, but the abrupt parameter shifts occurred at greater depths. This indicates that the height of the water-conducting fracture zone decreased by approximately 22 m seven years after mining. This indicates that the height of the water-conducting fracture zone in the 7th year after mining is 130 m.
3. Numerical Simulation and Mechanism Analysis of Fractures Expansion–Closure in Overlying Rock
3.1. Theory
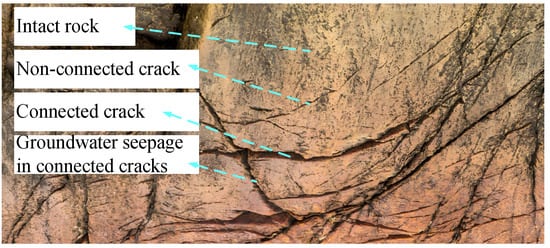
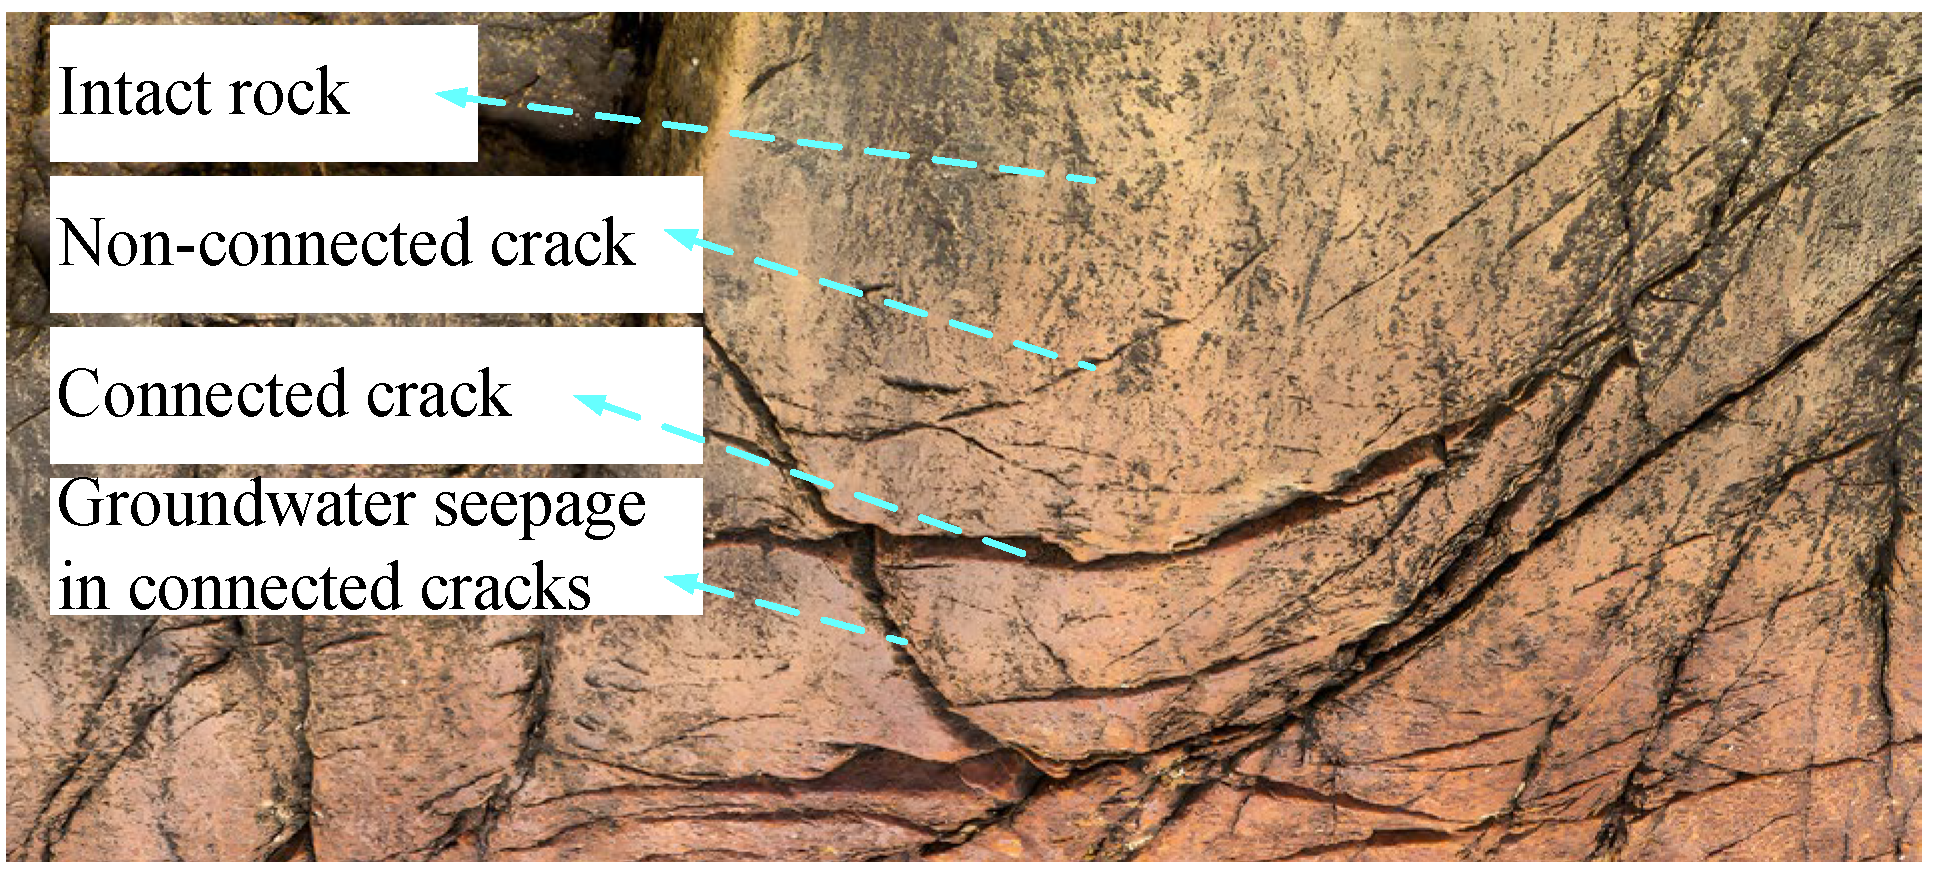
Before establishing a Finite Discrete Element Theoretical Model (FDEM) for numerical simulation of mining-induced fracture expansion and closure in overlying strata, the following assumptions are introduced: The post-failure rock mass is consistently conceptualized as comprising three fundamental components—intact rock blocks, non-connected fractures, and connected fractures (Figure 4). The corresponding constitutive relationships are established based on the mechanical characteristics of these three basic parts.
Figure 4.
Schematic diagram of rock failure and fracture fluid migration.
- (1)
- Intact rock blocks
Intact rock blocks obey the generalized Hooke’s law prior to reaching yield stress; once the stress satisfies the Mohr–Coulomb yield criterion [34], the material enters the plastic damage stage. The stress–strain relationship at this time is
where is the stress vector, I is the unit matrix, Ds is the stiffness matrix, and εs and are the total strain vector and plastic strain vector, respectively. Taking into account the two basic damage modes of rock, tensile damage ds,t and shear damage ds,c, the damage tensor ds is
where ni is the main direction vector and hea is the Heaviside function.
The unknown plastic strain in Equation (3) is resolved within the equivalent stress space by applying plasticity theory. By combining the above equations with boundary conditions, the mechanical response of intact rock blocks (or solid elements) can be solved.
- (2)
- Non-connected fractures
Non-connected fractures, represented by cohesive elements, obey the generalized Hooke’s law [35] during the elastic deformation stage of fracture initiation. Once the stress satisfies Equation (5), the rock enters the ductile fracture stage.
where σc,n, σc,s, σc,t (,,) are the elements of vector σc, representing the (maximum) stresses in the normal and two tangential directions; <> is the Macaulay symbol; Dc is the elastic stiffness matrix; and εc is the strain vector, whose relationship with the separation displacement vector S is , with a value of T0 = 1, which is the constitutive thickness of the element.
Considering the phenomena of elastic modulus degradation under tensile/shear fracture modes and significant plastic displacement in shear/mixed fracture modes during the ductile fracture stage, a constitutive equation for ductile fracture is established by incorporating damage-induced stiffness reduction and plastic displacement effects. The expression is
where dc,i, Dc,i, σc,i, , and εc,i are the damage variable, the elastic modulus, the stress, the plastic displacement, and the total displacement, respectively; i represents tensile, shear, and mixed tensile/shear fracture.
We use the Benzeggagh–Kenane fracture criterion as the criterion for complete rock fracture:
where , , and χ are the tensile and shear fracture energies and material parameters at complete fracture, respectively. The expression for the fracture energy mixing ratio ξ is
where Gc,n and Gc,S are the tensile fracture energy and the sum of the two shear direction fracture energies, respectively. By combining the above equations with boundary conditions, the mechanical response of non-connected cracks (or cohesive elements) can be solved.
- (3)
- Connected fractures
When the fracture criterion satisfies Equation (7), the cohesive elements undergo complete fracture, after which they are deleted and the corresponding contact pair is activated, thereby resulting in the formation of a connected fracture. At this stage, the rock blocks on either side of the fracture may exhibit distinct mechanical states, including separation, compression, and shear-friction sliding.
When the distance between any two nodes of adjacent solid elements is greater than 0 (marked l > 0), the rock blocks separate from each other, and the interaction force is 0. We directly calculate the motion of rock masses under volumetric force using Newton’s second law.
When l = 0, if σn ≠ 0 and σS = 0, then adjacent rock blocks only exist in compression, and their constitutive relationship is
where σn is the compressive stress; Nmax is the maximum closure amount of fractures, constant; n is the closure quantity of fractures, variable; and Dn is the normal modulus, taken from the parameters of its adjacent rock blocks.
When l = 0, σn ≠ 0, and σS ≠ 0, there is shear friction between adjacent rock blocks. We assume that connected fractures comply with the Coulomb slip criterion [36]:
where φr is the residual friction angle. By combining the above equations with boundary conditions, the mechanical response of connected fractures (or contact pairs) can be solved.
Based on this, the Finite Discrete Element Method (FDEM) was developed. The spatial discretization scheme is as follows: Low-order quadrilateral elements are adopted for intact rock masses, while cohesive elements are employed at joints/fractures. The traction–separation criterion is utilized to approximate rock fracture behavior. The temporal integration scheme is as follows: The solver algorithm adopted is the central difference method. Based on Newton’s second law of motion, the displacement at the current time step is directly derived from the acceleration at the previous time step. Considering that explicit algorithms are conditionally stable, the following approximate scheme is used to determine the time step size: , where Δt denotes the time step size, β0 is a coefficient, Lmin represents the minimum size of computational meshes, and Cd refers to the wave velocity in rock.
3.2. Numerical Model and Results
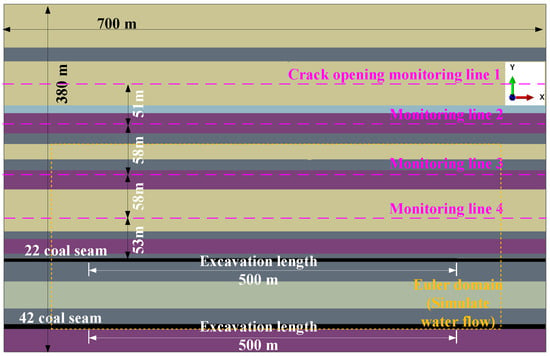
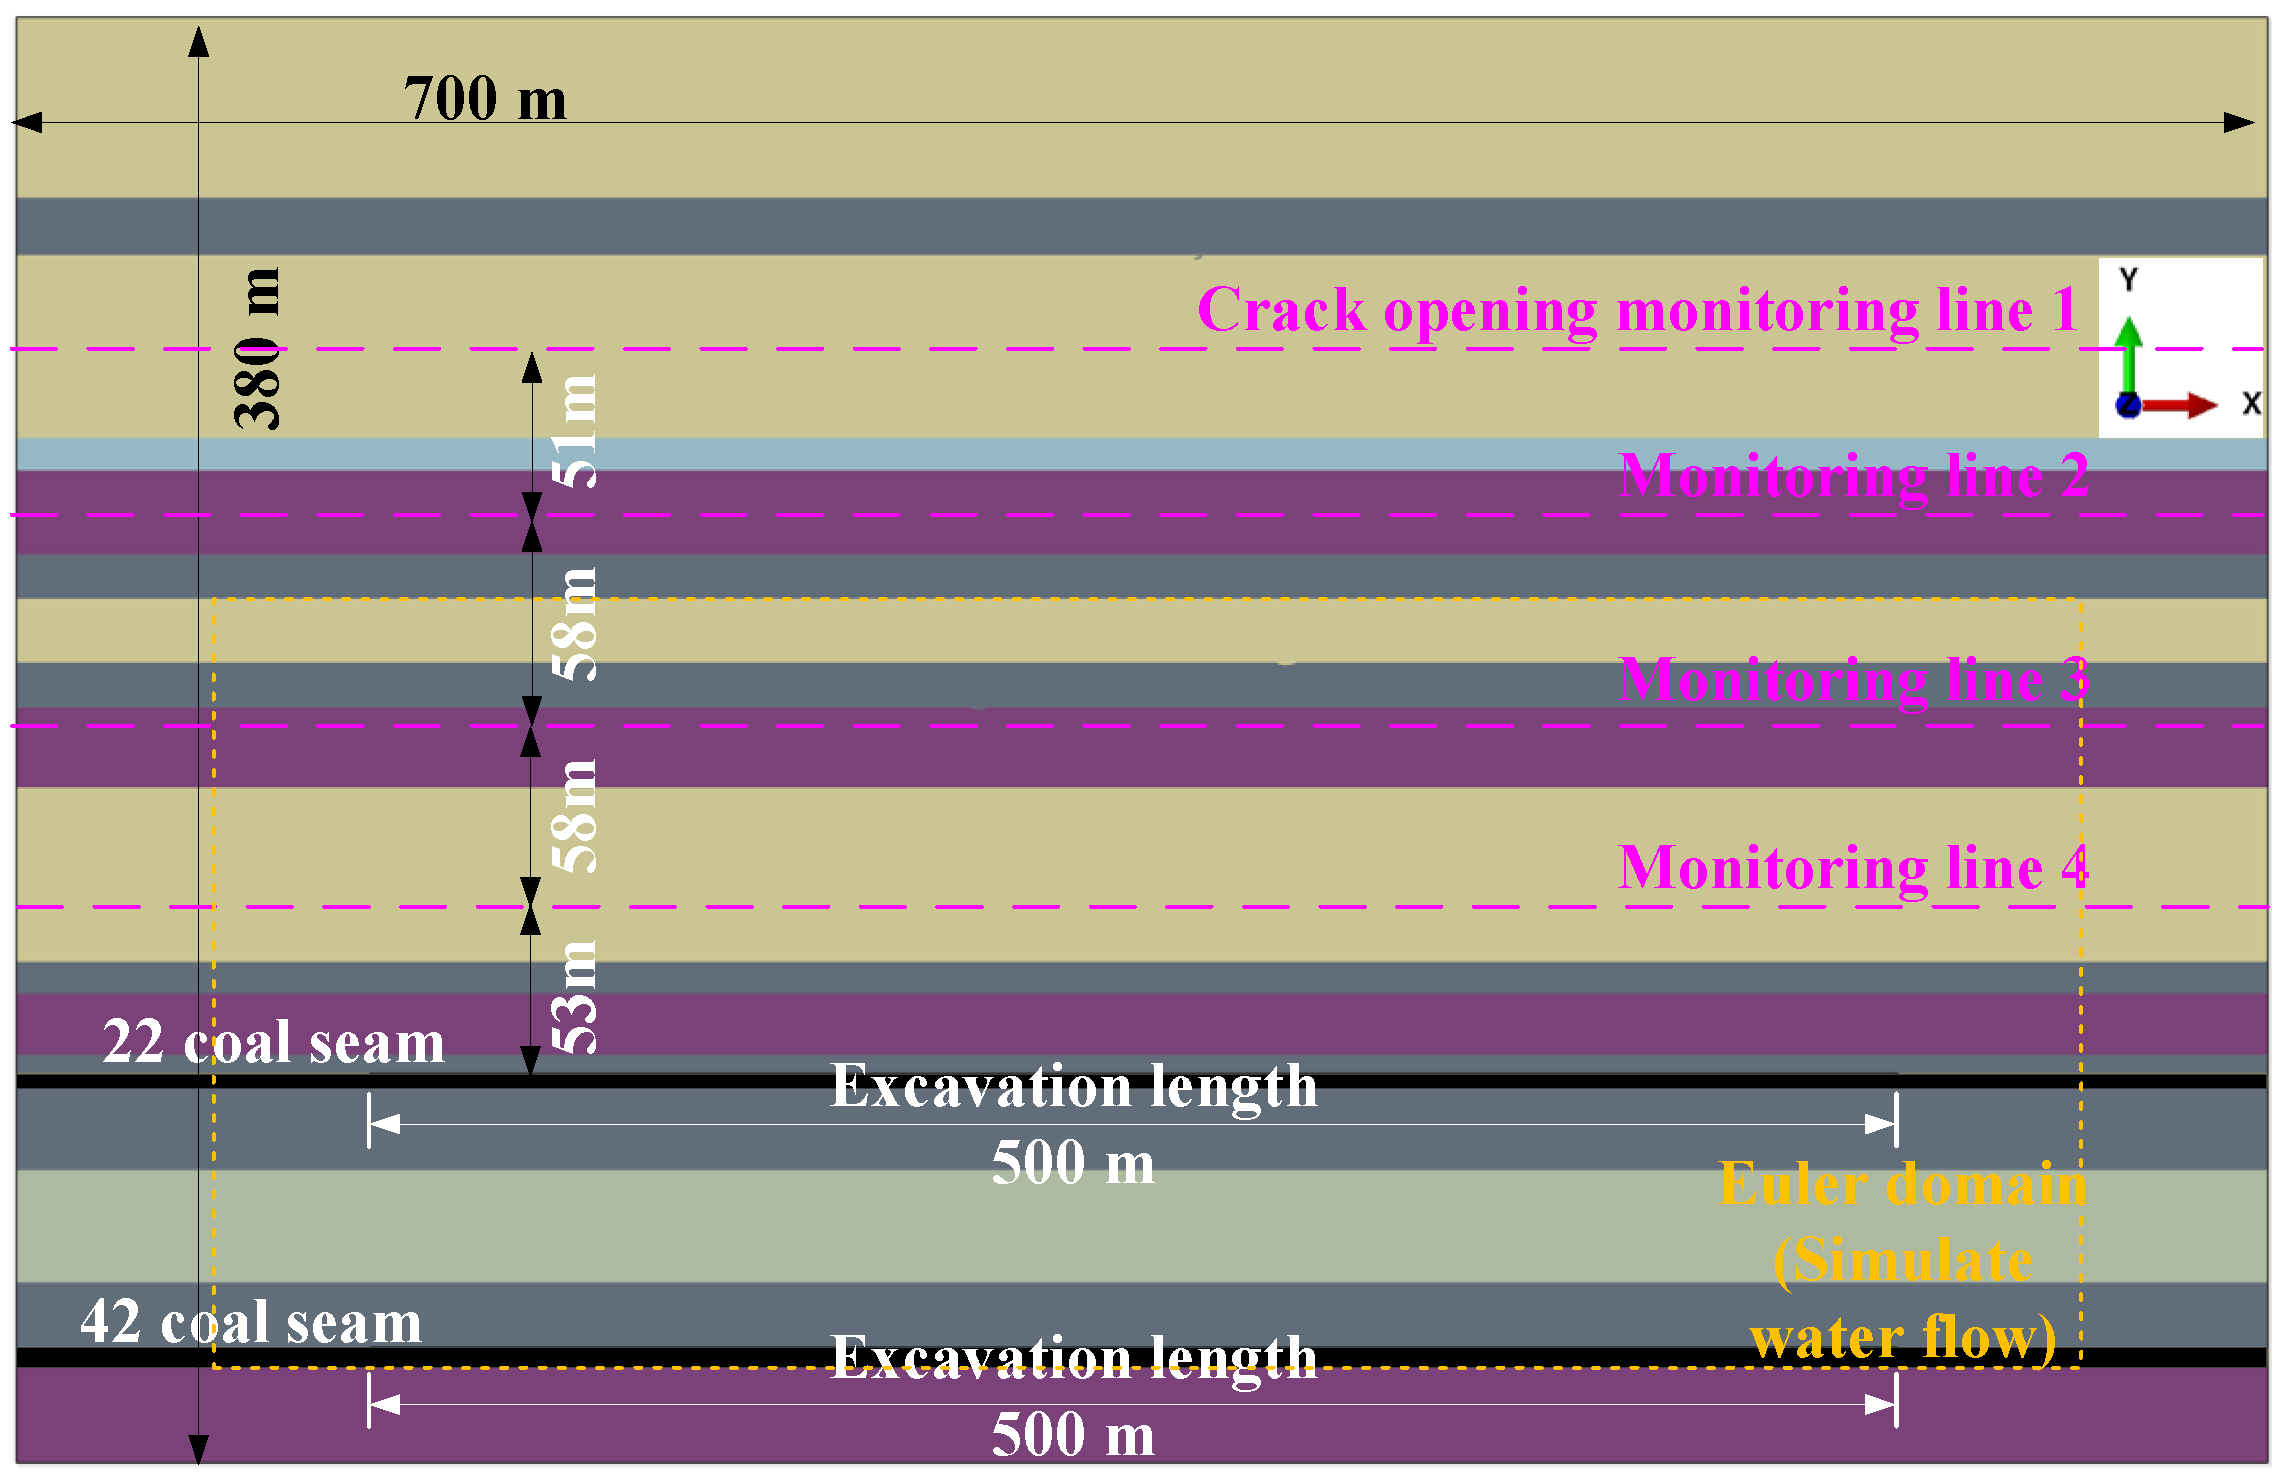
Based on the target working face and its histogram, a numerical model is established, as shown in Figure 5. The dimensions of this two-dimensional model are 700 m in length and 380 m in height. Given that there are almost no geological structures within the study area, the gravitational load was applied to the entire model, which was then allowed to reach a state of natural equilibrium. The top surface of the model was set as a free boundary, and the other five boundary surfaces were subjected to normal displacement constraints. Starting from a point 100 m from the left boundary of the model, coal seam 22 and coal seam 42 were excavated sequentially until a point 100 m from the right boundary was reached, with each excavation step advancing by 5 m. In the numerical model, the average size of the quadrilateral solid element was 5 m. The material parameters used are listed in Table 2.
Figure 5.
Numerical model.
Table 2.
Lithology and mechanical properties of strata.
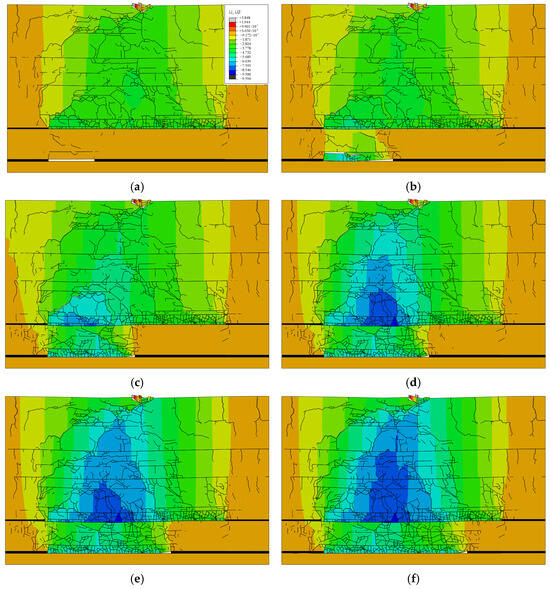
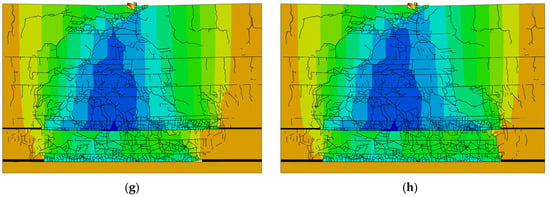
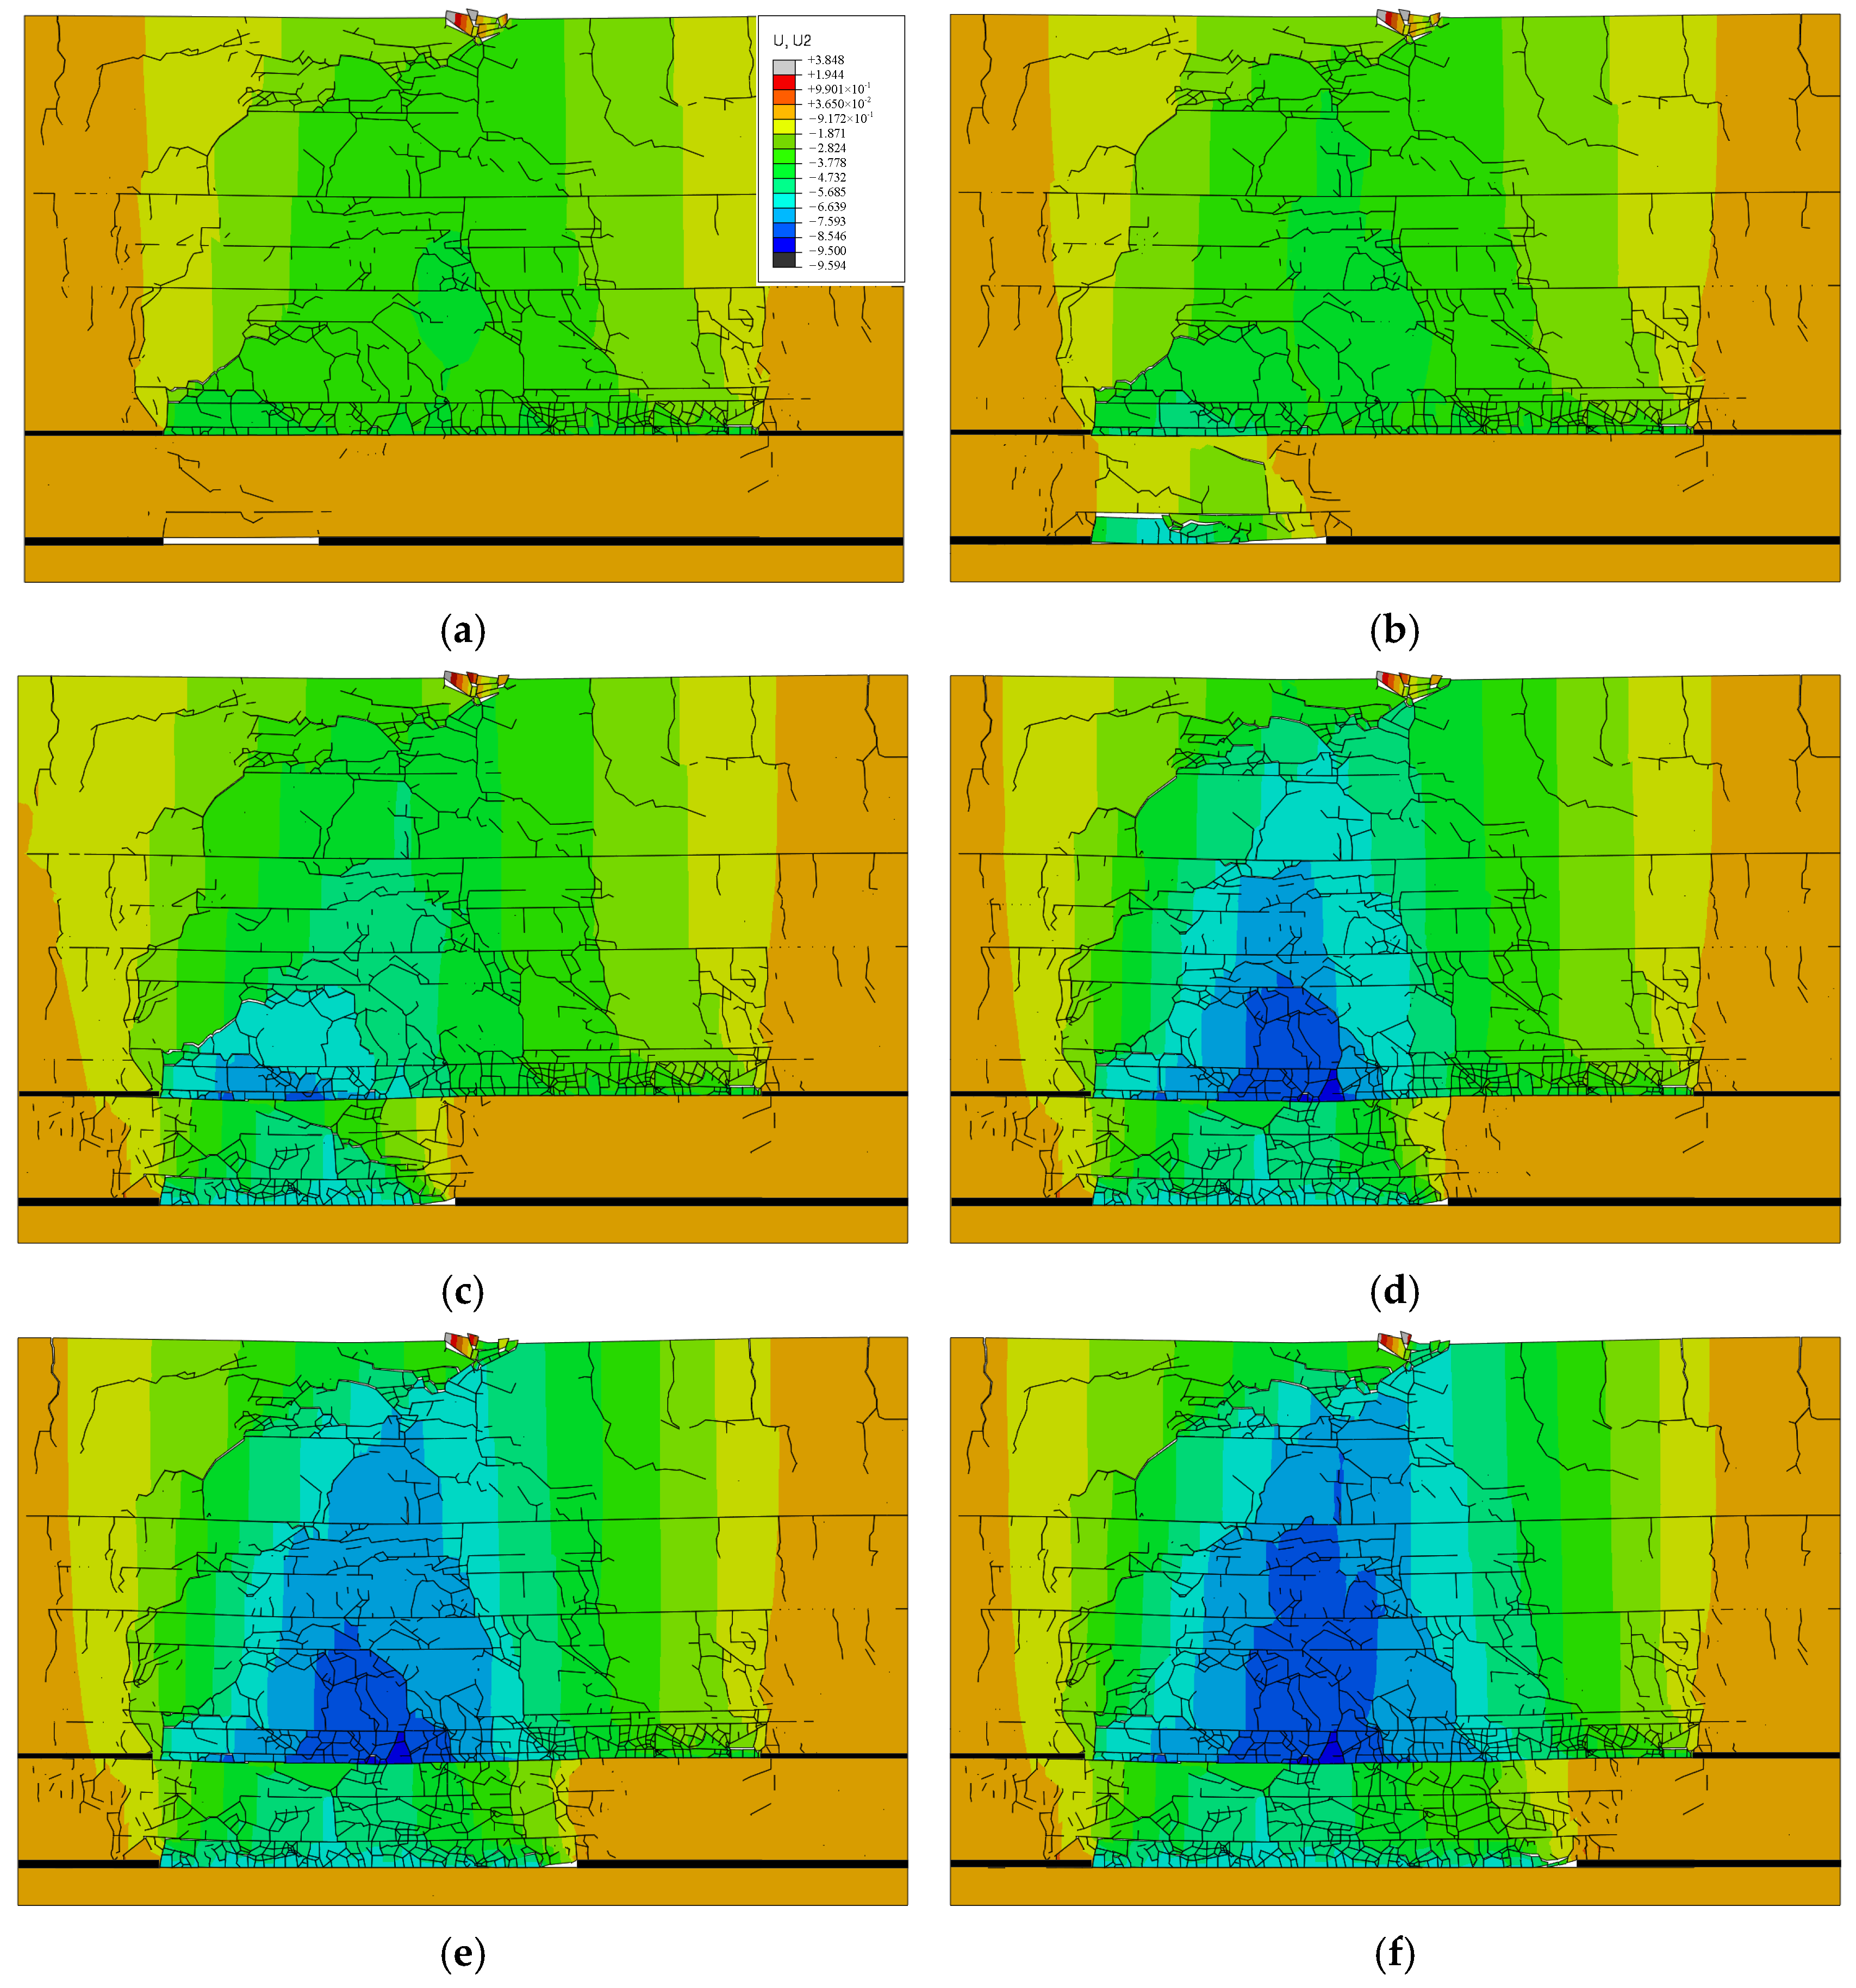
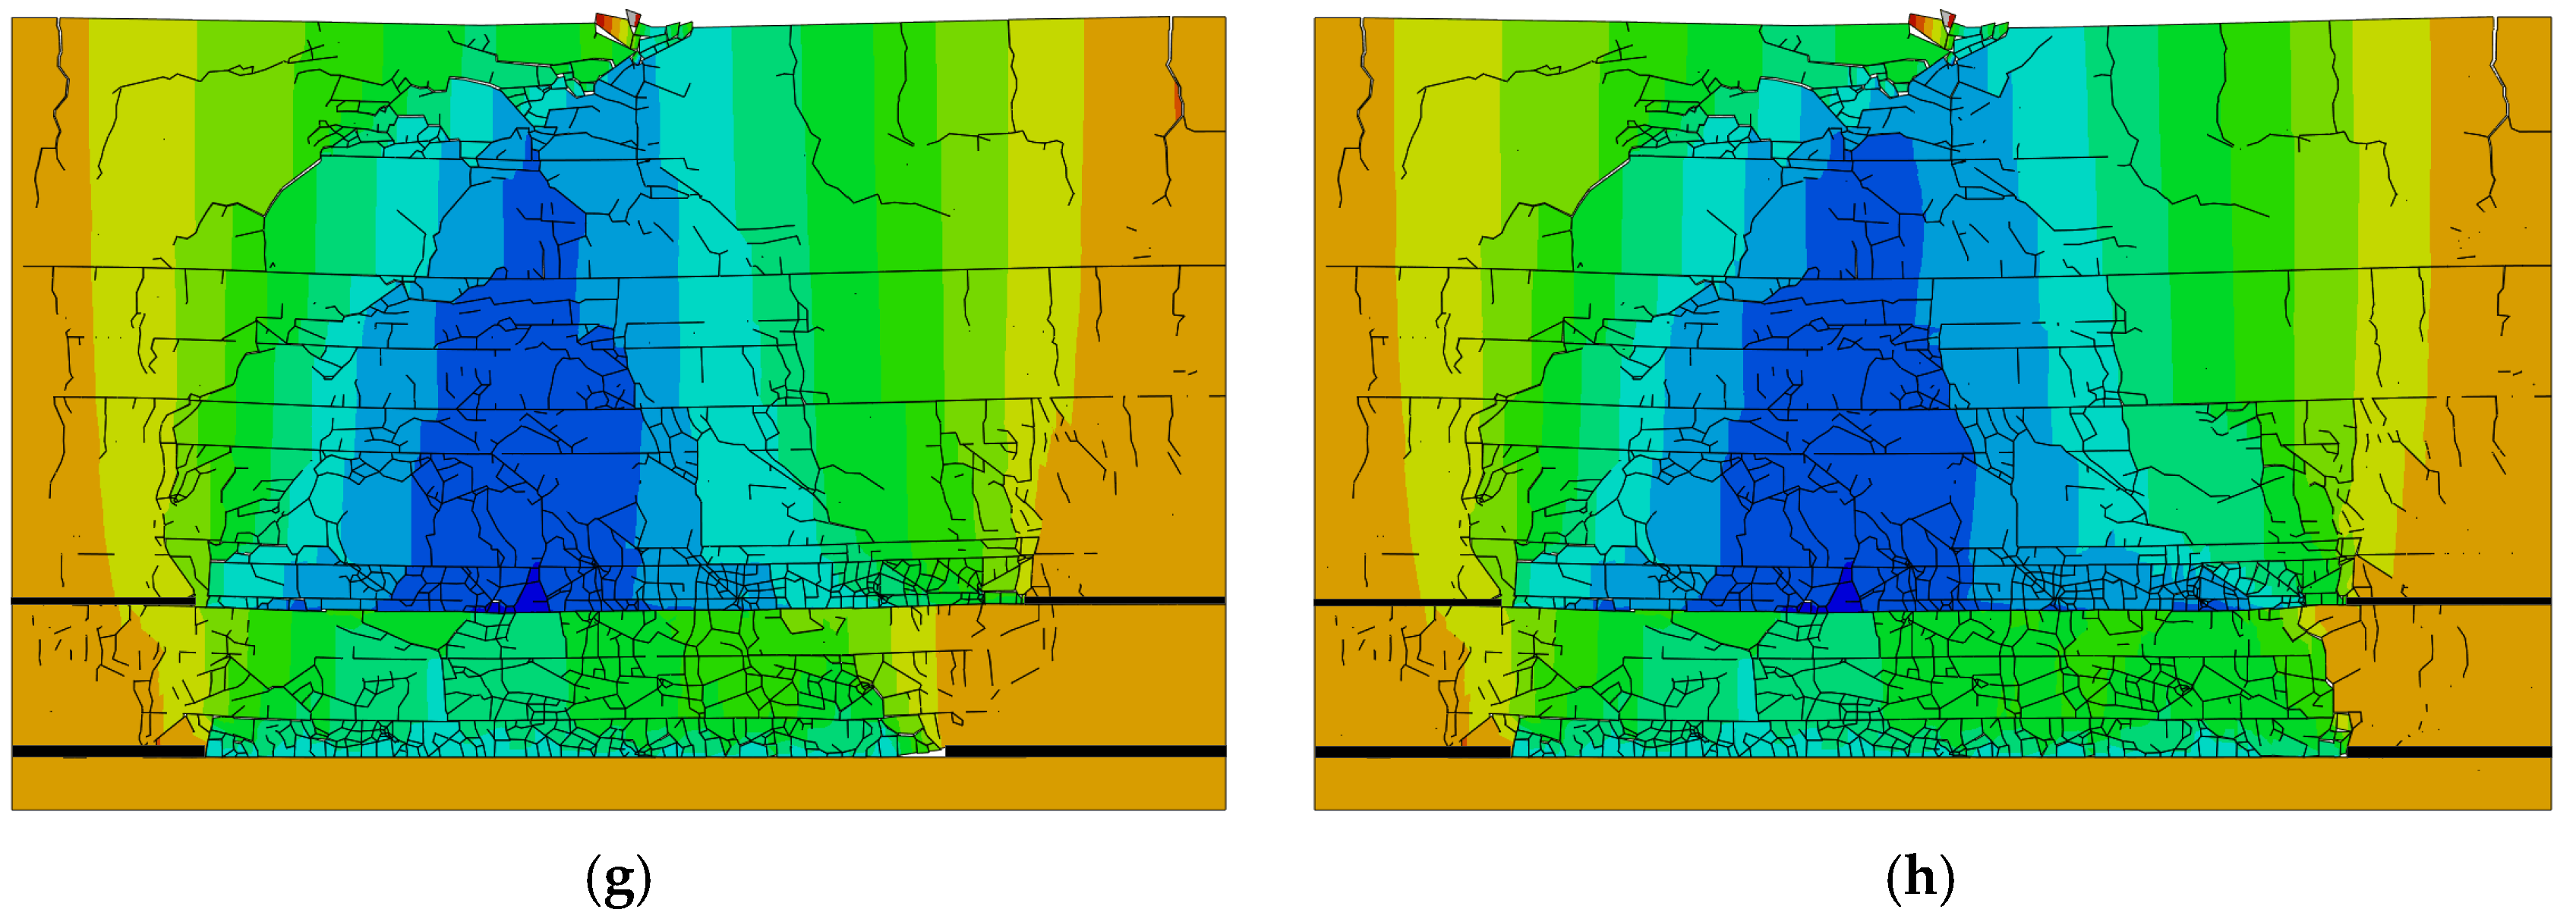
Based on the mining-induced overburden fractures development image obtained from the numerical model (Figure 5), which is illustrated in Figure 6, the total advanced distance of the coal seam 22 and coal seam 42 working faces is defined as L0, with a range of 0 m ≤ L0 ≤ 1000 m, where the advanced distance for each individual coal seam is 500 m.
Figure 6.
Simulation results of mining overburden displacement and crack distribution. (a) L0 = 550 m; (b) L0 = 600 m; (c) L0 = 650 m; (d) L0 = 700 m; (e) L0 = 750 m; (f) L0 = 800 m; (g) L0 = 850 m; (h) L0 = 1000 m.
As illustrated in Figure 6a, when the working face of coal seam 42 advanced to L0 = 550 m, numerous tensile cracks had formed on the surface near the starting cut of coal seam 22. Simultaneously, the Zhidan Group sandy mudstone between the goaf center and the coal seam 22 starting cut was severely fractured. Moreover, roof separation occurred between the sandy mudstone of the coal seam 42 roof and the overlying siltstone, while the maximum height of the fractures in the overlying strata above coal seam 42 reached 20 m.
At L0 = 600 m (Figure 6b), the 20 m thick sandy mudstone in the roof of coal seam 42 had completely fractured. This failure led to the development of numerous cracks within the overlying siltstone layer.
When the advanced distance reached L0 = 650 m (Figure 6c), the 20 m thick sandy mudstone in the coal seam 42 roof was not only completely fractured but also severely fragmented. The overlying 35 m thick siltstone layer also fractured, which subsequently induced failure in the sandy mudstone layer above it. This series of failures ultimately resulted in the formation of interconnected fractures linking the goafs of coal seam 42 and coal seam 22.
During the final stage of mining, from L0 = 700 m to L0 = 1000 m (Figure 6d–h), the density of fractures within the overlying strata of coal seam 42 continued to increase. However, the development of these new fractures was primarily confined to the rock layers beneath the first aquifuge.
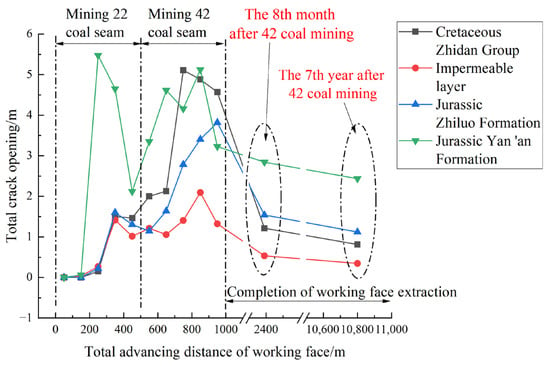
The overburden movement process mentioned above leads to a distinct cycle of fracture expansion and closure. To quantitatively describe this process, four measurement lines were established as shown in Figure 5, positioned at the midpoints of the Zhidan Group, the first aquifuge, the Zhiluo Formation, and the Yan’an Formation, to monitor the fractures opening during the mining activity and after seven years of post-mining stabilization, with the results being presented in Figure 7.
Figure 7.
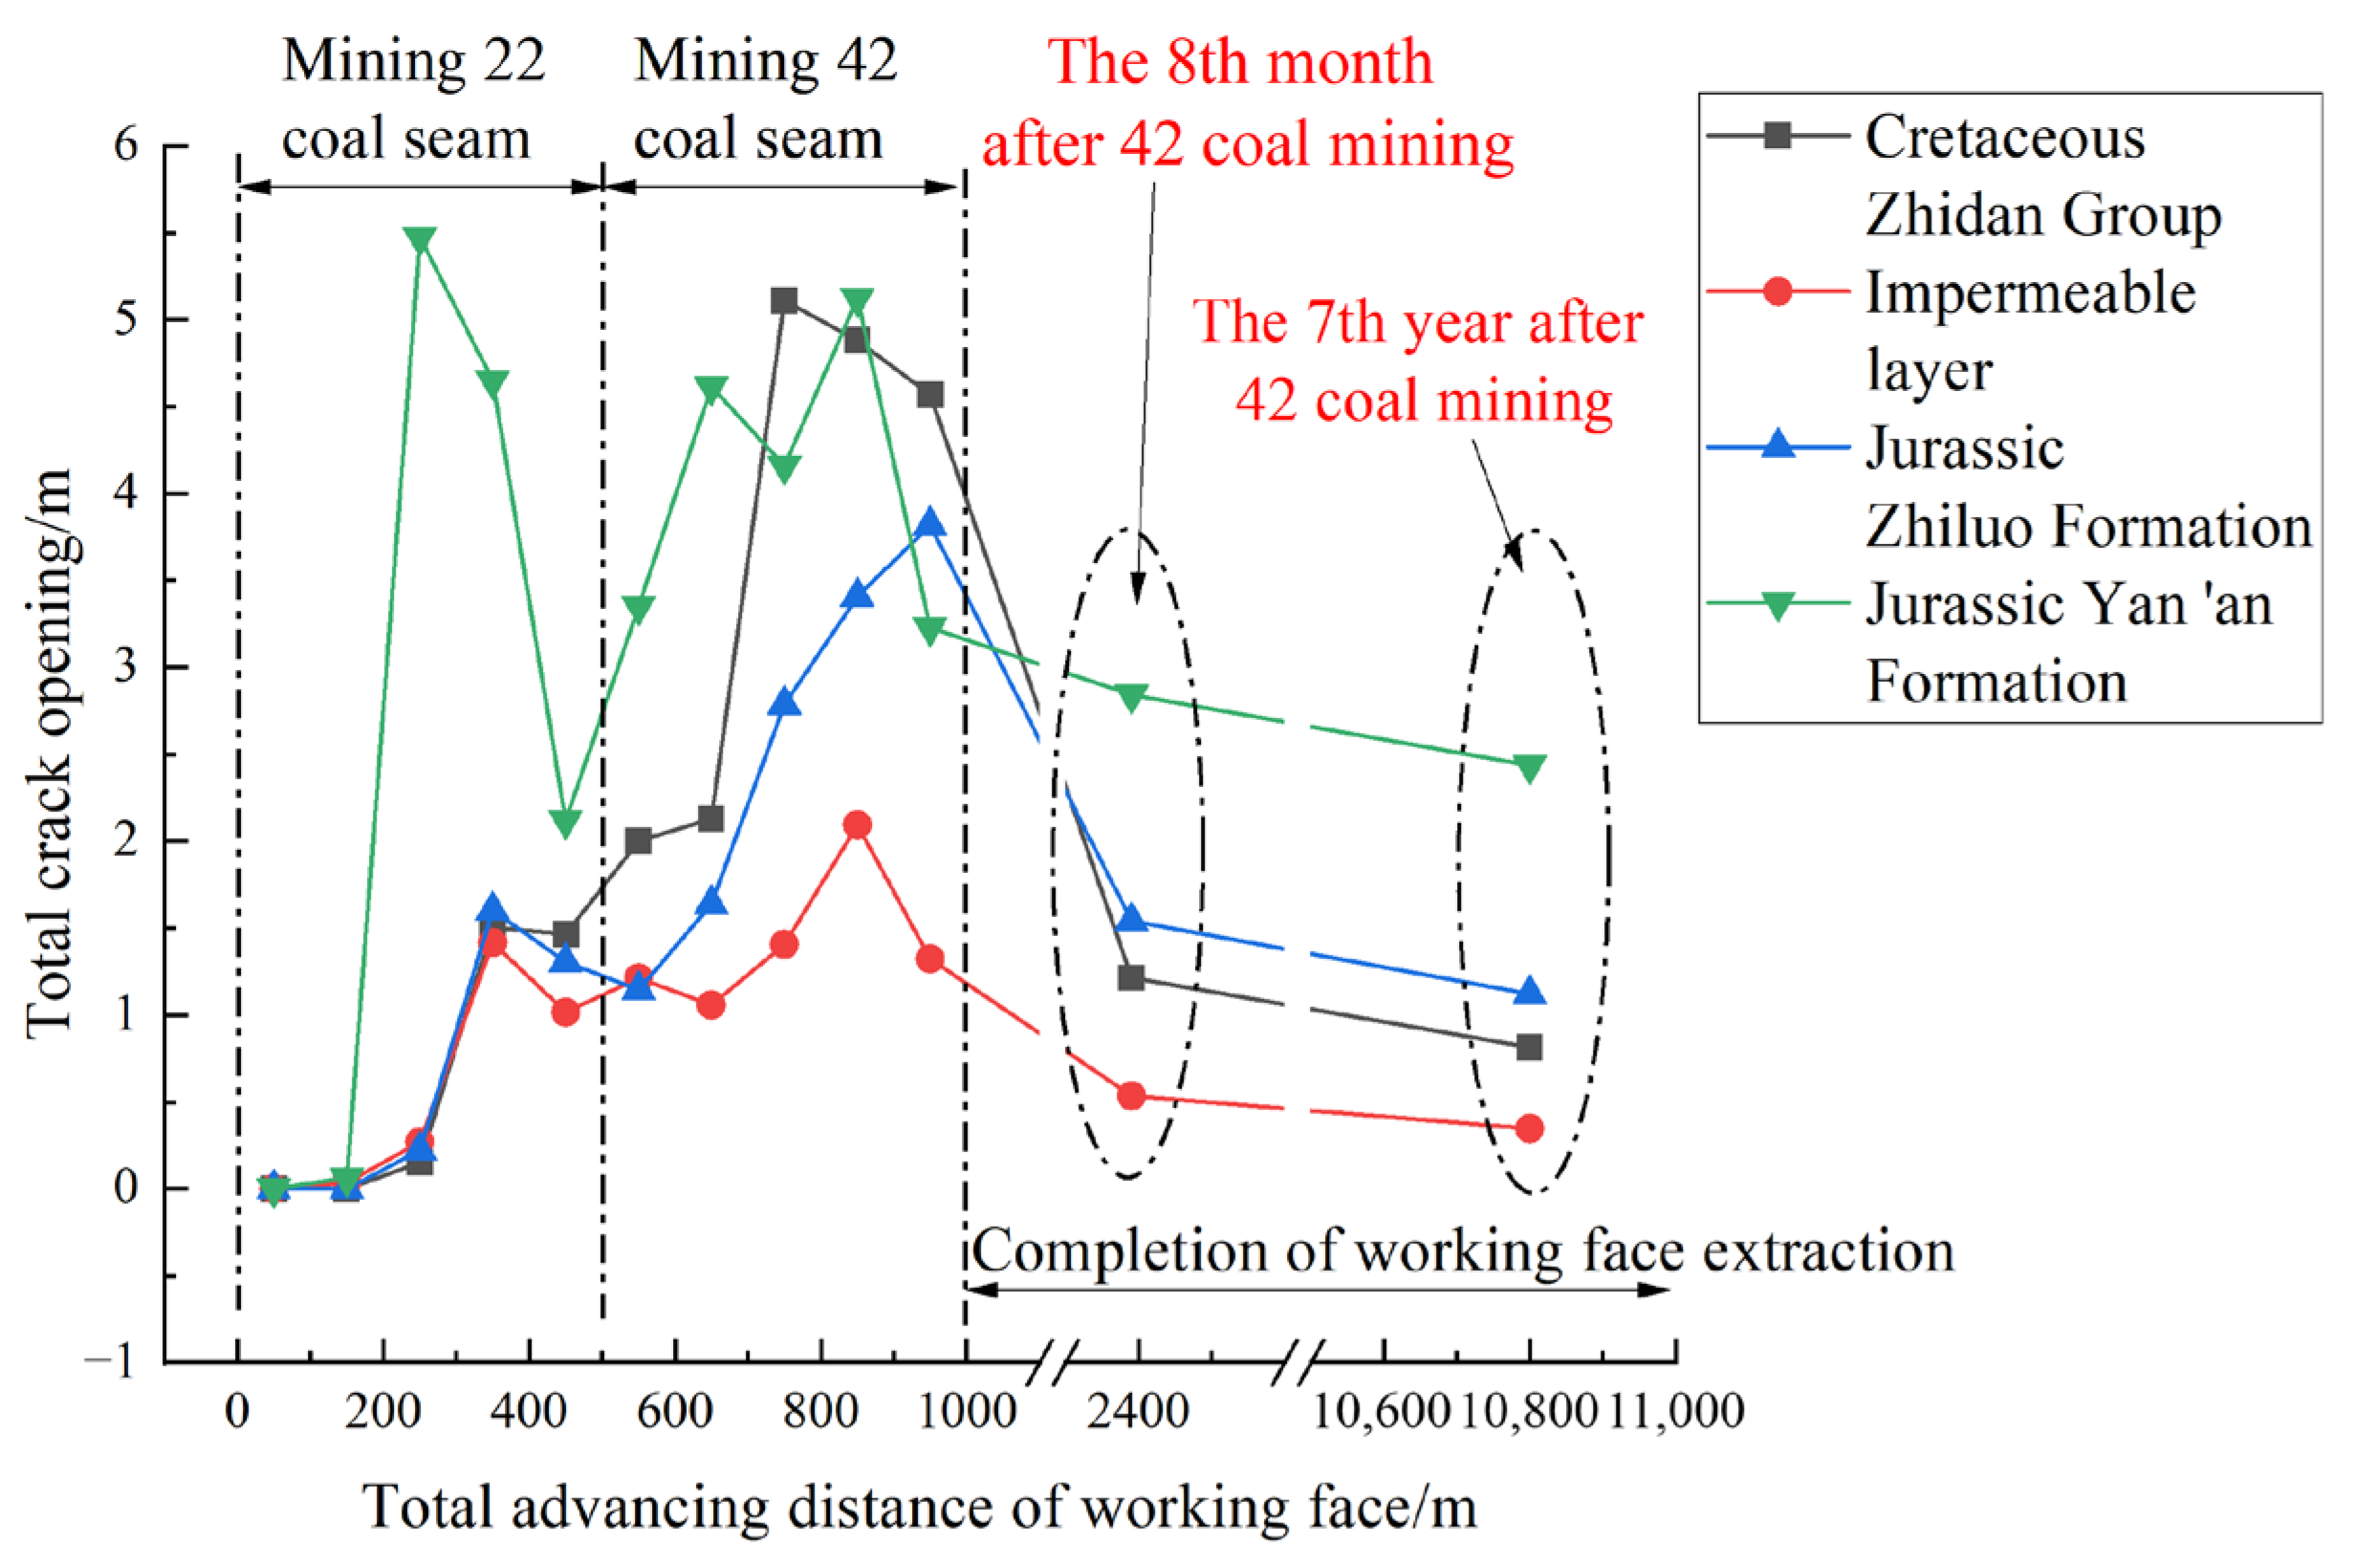
Statistical results of total opening of overlying rock fractures at each monitoring line.
As shown in Figure 7, during the advancement of the coal seam 22 and 42 working faces, the total fracture opening on the measurement lines within each rock stratum experienced significant fluctuations. Specifically, when the coal seam 22 working face advanced from L0 = 0 m to 250 m (where the working face reached its critical mining span), the total fracture opening in the Yan’an Formation sandstone rapidly increased from 0 m to 5.47 m; by the time L0 = 500 m (completion of coal seam 22 excavation), the total opening had decreased to 2.12 m. Meanwhile, when L0 = 500 m, the openings in the Zhiluo Formation, the first aquifuge, and the Zhidan Group increased from their initial values of 0.22 m, 0.26 m, and 0.15 m (at L0 = 250 m) to 1.30 m, 1.01 m, and 1.46 m, respectively.
During the period from L0 = 500 m (where coal seam 42 began to be mined) to L0= 750–850 m (where the coal seam 42 working face reached its critical mining span), the total fracture openings at the measurement lines for the Yan’an Formation, Zhiluo Formation, first aquifuge, and Zhidan Group increased from 2.12 m, 1.14 m, 1.01 m, and 1.46 m to peak values of 5.12 m, 3.40 m, 3.09 m, and 4.88 m, respectively. Upon completion of coal seam 42 excavation at L0 = 1000 m, the openings subsequently changed to 2.84 m, 3.81 m, 2.32 m, and 4.57 m for these strata, respectively.
Eight months after the completion of the mining of coal seam 42, the total fracture openings at the measurement lines for the Yan’an Formation, Zhiluo Formation, first aquifuge, and Zhidan Group had decreased to 2.84 m, 1.54 m, 0.53 m, and 1.21 m, respectively. Seven years post-mining, these values further decreased to 2.43 m, 1.12 m, 0.34 m, and 0.81 m, indicating a significant long-term fracture closure process.
According to the cubic law for fracture flow [37], when the total fracture opening of the first aquifuge decreased to 16.6% of its maximum value (in the 7th year after mining), the downward water flow volume from the Zhidan Group would be reduced to merely 0.46% of its peak. This demonstrates that the substantial reduction in the total fracture opening of the first aquifuge drastically curtailed the vertical recharge of groundwater from the Zhidan Group aquifer, which is conducive to the restoration of the water level in the Zhidan Group. Concurrently, the total fracture openings in the Zhiluo Formation and Yan’an Formation decreased to 29.4% and 47.5% of their respective maximum values, resulting in a reduction in water inflow to 2.5% and 10.7% of their peak values.
4. Impact of Fracture Expansion–Closure on Groundwater Reservoir Inflow
4.1. Numerical Prediction Method for Water Inflow
Prior to establishing a numerical method for predicting water inflow, the following assumptions are introduced:
- (a)
- Groundwater can only migrate within connected fractures, while the permeability of intact rock blocks is neglected.
- (b)
- Mining-induced stress leads to the development of a fracture zone propagating upwards from the immediate roof above the working face, which is initially filled with air. If these fractures extend into an overlying aquifer, groundwater gradually displaces the air within the fractures from the top down and subsequently enters the goaf. This process can be simplified as a gas–water two-phase flow model within the connected fracture network.
On this basis, combined with the numerical theory of Finite Discrete Element Method (FDEM) (Section 3), further Fluid Dynamics (CFD) simulations are carried out. The mass conservation equation for two-phase flow is
The momentum conservation equation is
The Mie–Gruneisen equation of state is
where t is time and u is the velocity vector. Density , where ρw and ρa are the densities of water and air, respectively; Vp is the volume fraction of water in an Eulerian element, 0 ≤ Vp ≤ 1, and is a variable. p is the fluid pressure; g is the acceleration due to gravity; Fst is the surface tension of water; τ is the stress tensor caused by viscous force; c0 is the material constant with a value of 1500 m/s; η is the nominal volumetric compression strain, η = 1 − ρ0/ρ, ρ0 is the reference density, with a value of 1000 kg/m3.
The above fluid dynamic properties are assigned to the Eulerian elements. The Finite Volume Method (FVM) is adopted to discretize the Navier–Stokes (N-S) equations. The second-order upwind scheme is used for the approximation of the convection term. An Eulerian explicit solver is implemented, and the PISO (Pressure-Implicit with Splitting of Operators) algorithm is applied to solve for fluid pressure, velocity, and other variables.
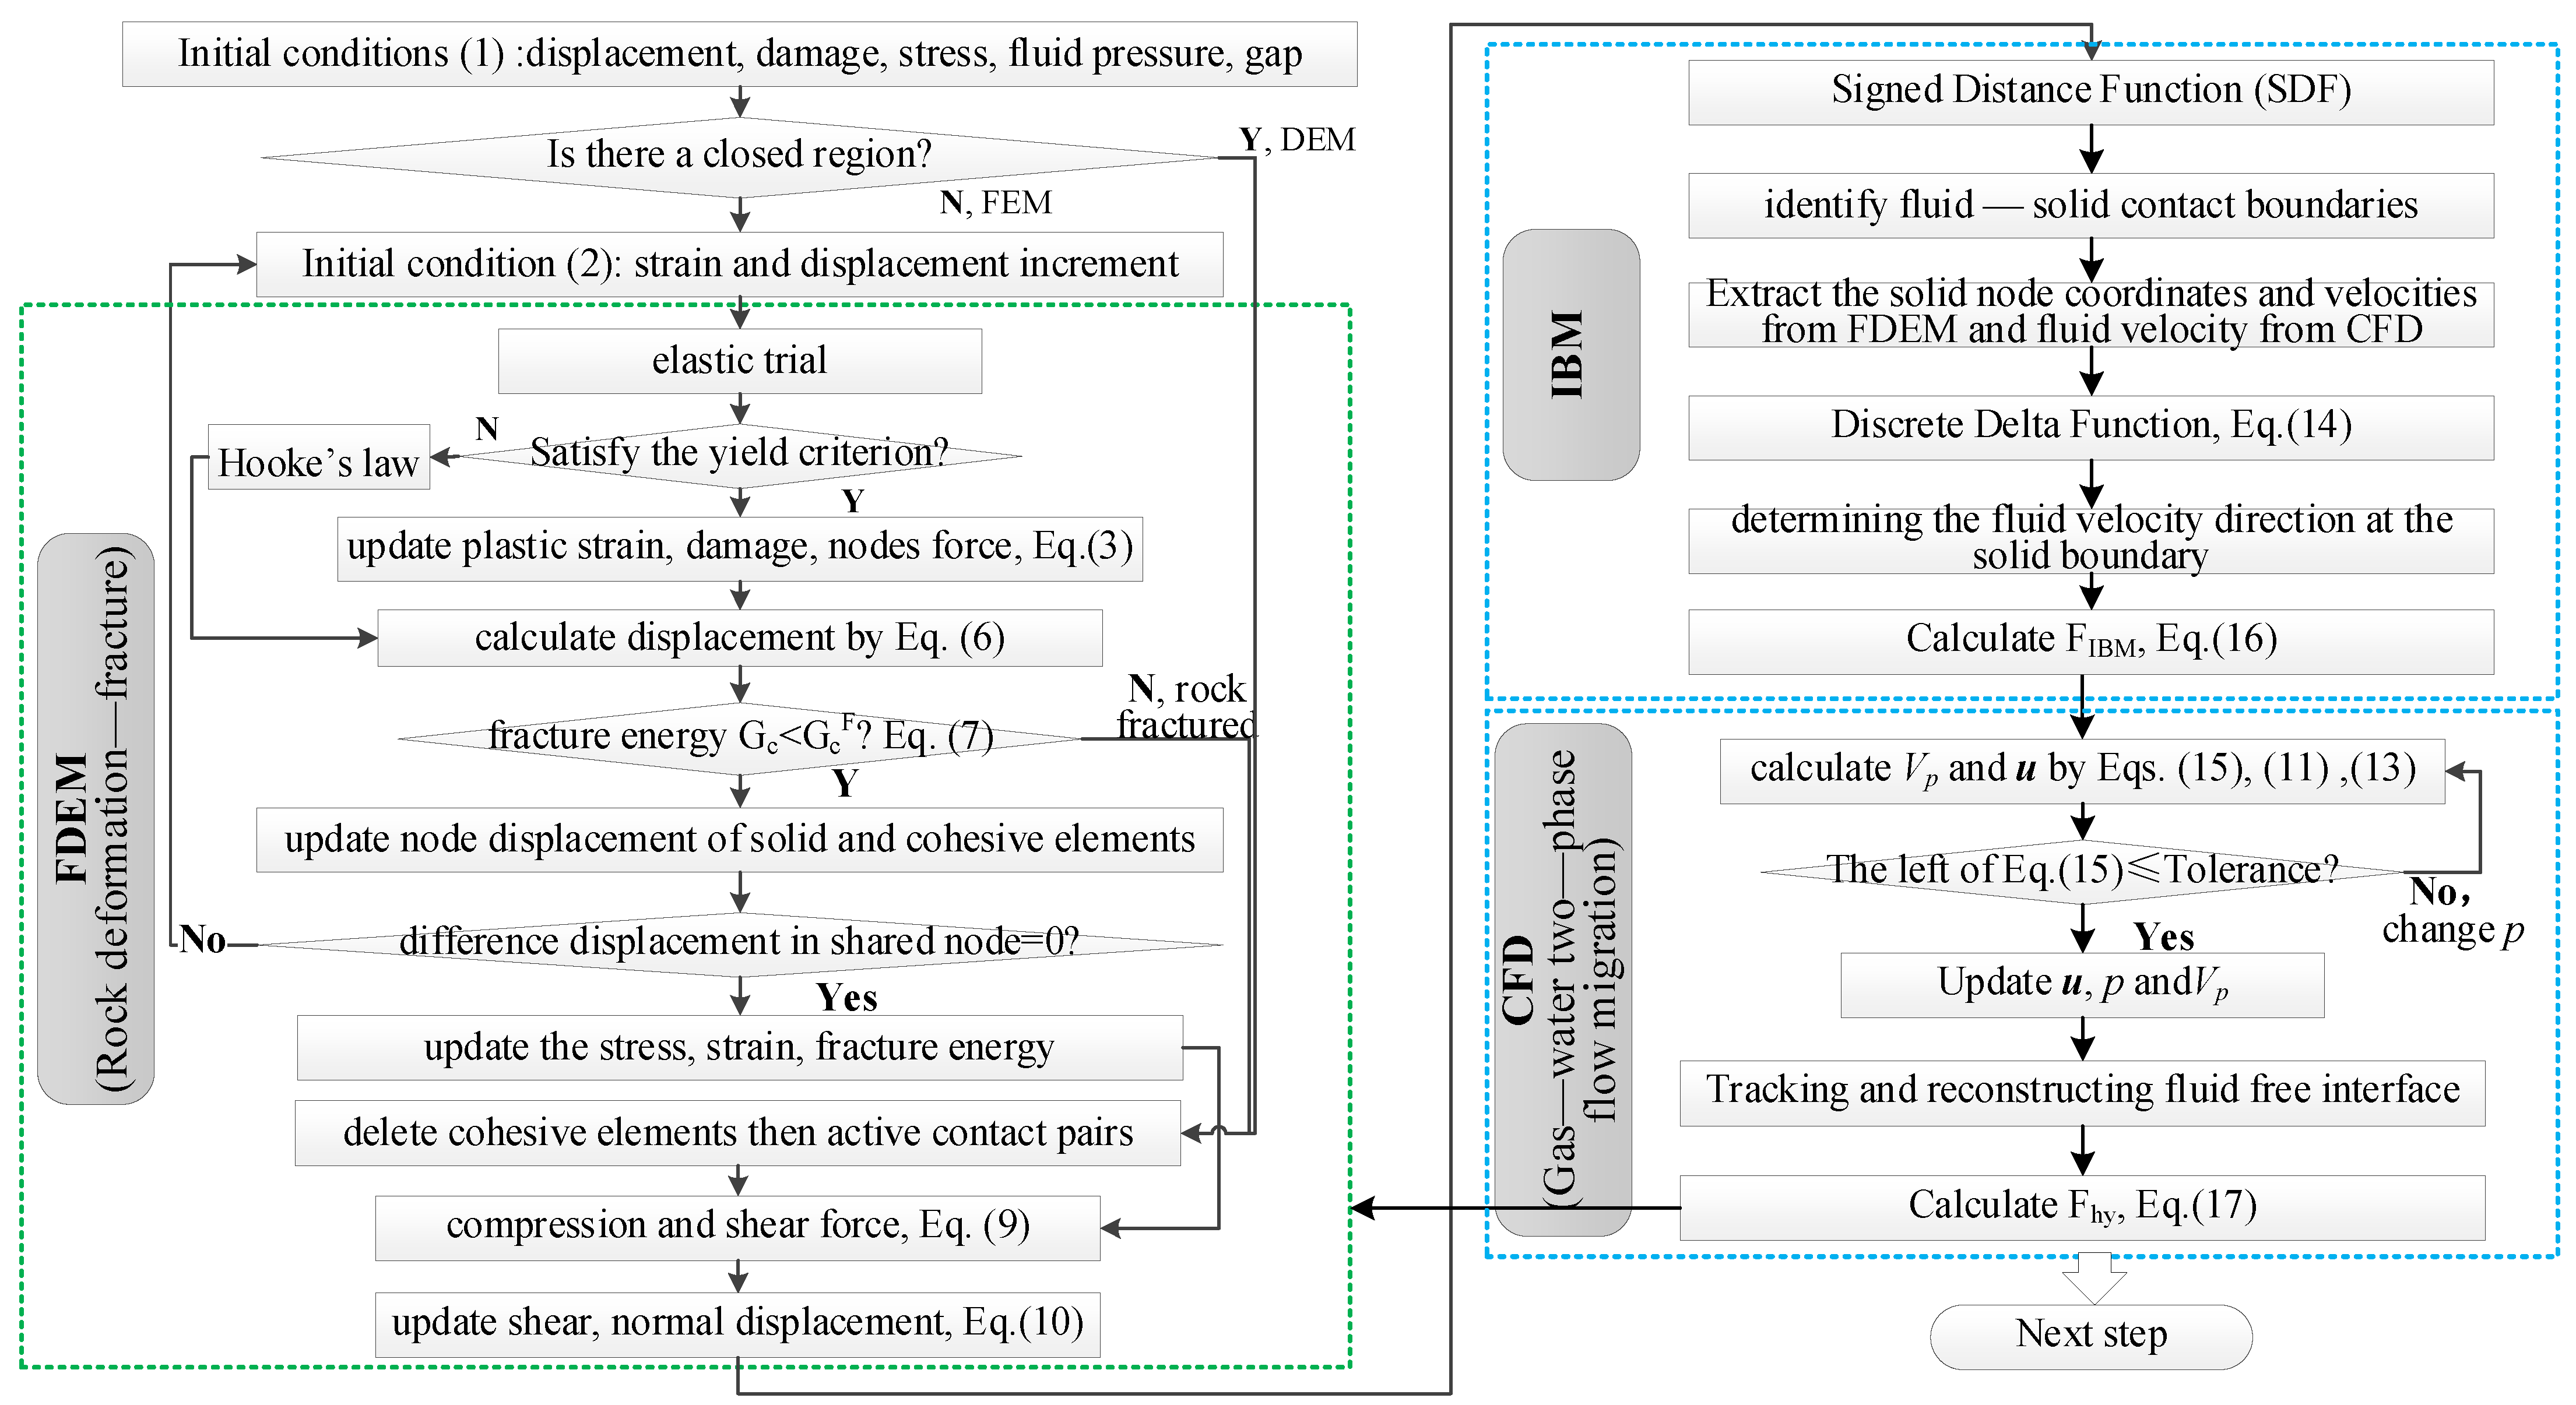
On this basis, a resolved coupling method for the interaction between CFD and FDEM was adopted, with the immersed boundary method as its core. The specific steps are as follows:
- (a)
- Solid-phase mapping and search. When the FDEM completes an increment step, the node coordinates, motion velocity, and acceleration of the rock block are updated. The Signed Distance Function (SDF) is employed to calculate the distance from each Eulerian grid node to the nearest solid surface. Simultaneously, a solid volume fraction field (α0) is defined as follows: when α0 = 1, the node is inside the solid; when α0 = 0, the node is in the fluid; and when 0 < α0 < 1, the node is on the solid boundary. This determines whether the Eulerian grid node is located inside, outside, or on the boundary of the rock block.
- (b)
- The Discrete Delta Function is employed to map the fluid velocity difference on the Eulerian grid to the Lagrangian Points on the solid surface, thereby determining the fluid velocity direction at the solid boundary.
- (c)
- Calculation of the virtual force. We extract the motion velocity vs,i of the rock block nodes/boundaries obtained from FDEM calculations. In the Eulerian elements inside the rock block, a “Forcing Term” (FIBM) needs to be added to the Navier–Stokes equation to force the fluid velocity to be consistent with the solid velocity, i.e., vf,i = vs,i. At this time, FIBM is calculated based on the relative acceleration of the fluid in the solid domain and the fluid mass within the rock range.
If a fluid node is occupied by a solid, then the fluid velocity at the Eulerian node within that region is consistent with the solid velocity, at which point
FIBM represents the immersed boundary forcing; α1 is an adjustment coefficient; ρ denotes the fluid density; usolid stands for the solid velocity; ufluid indicates the fluid velocity; and Δt is the time increment.
- (d)
- Solution of the Navier–Stokes equation with source term FIBM to obtain the fluid velocity and pressure within the fracture.
- (e)
- Utilizing the integral method, the surface forces exerted by the fluid on the solid (fluid pressure and viscous force) are fed back to the FDEM, thereby calculating the motion of the rock block at the next moment.
In addition, to reconstruct the free surface of water flow within the fracture network, the Volume of Fluid (VOF) method is employed. Its main steps are as follows:
- (a)
- Firstly, the fluid volume fraction Vp in each Eulerian grid is calculated through the fluid dynamics control equations.
- (b)
- Secondly, assuming that the interface of gas–water two-phase flow is a plane, at the Eulerian grid where the solid volume fraction field α0 = 0, centered around any Eulerian grid, the gradient of Vp of the adjacent Eulerian grid is calculated using Young’s algorithm, thereby determining the normal vector of the gas–water two-phase flow interface.
- (c)
- Finally, based on this, using the analytical equation of the plane (at this point, the normal vector has been determined, but the intercept is still undetermined) and with the volume fraction αVOF within the Eulerian grid as the fixed solution condition, the intercept of the plane is calculated, thereby determining the boundary of the gas–water two-phase flow.
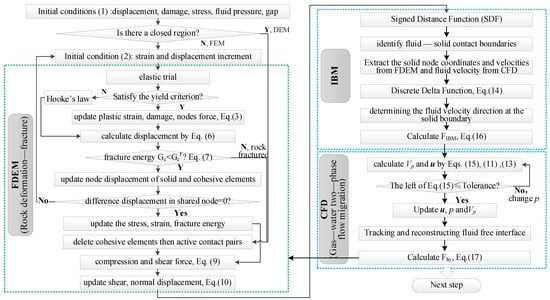
In summary, the relationship between the subprograms is as follows: The FDEM is employed to simulate rock deformation, fragmentation, and motion. The CFD framework is responsible for computing the flow field within the fracture network, where the VOF method is adopted to track the water–gas interface. The IBM maps the moving and fracturing FDEM rock mass onto the fixed CFD fluid mesh in real time, thereby enabling mesh-free reconstruction interaction between the solid and fluid phases. The above process is represented by a numerical calculation flowchart, as shown in Figure 8.
Figure 8.
Numerical calculation process.
4.2. Numerical Prediction Model and Results
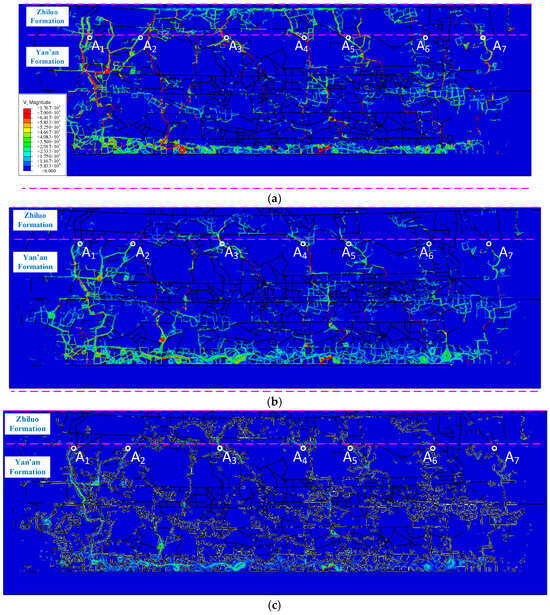
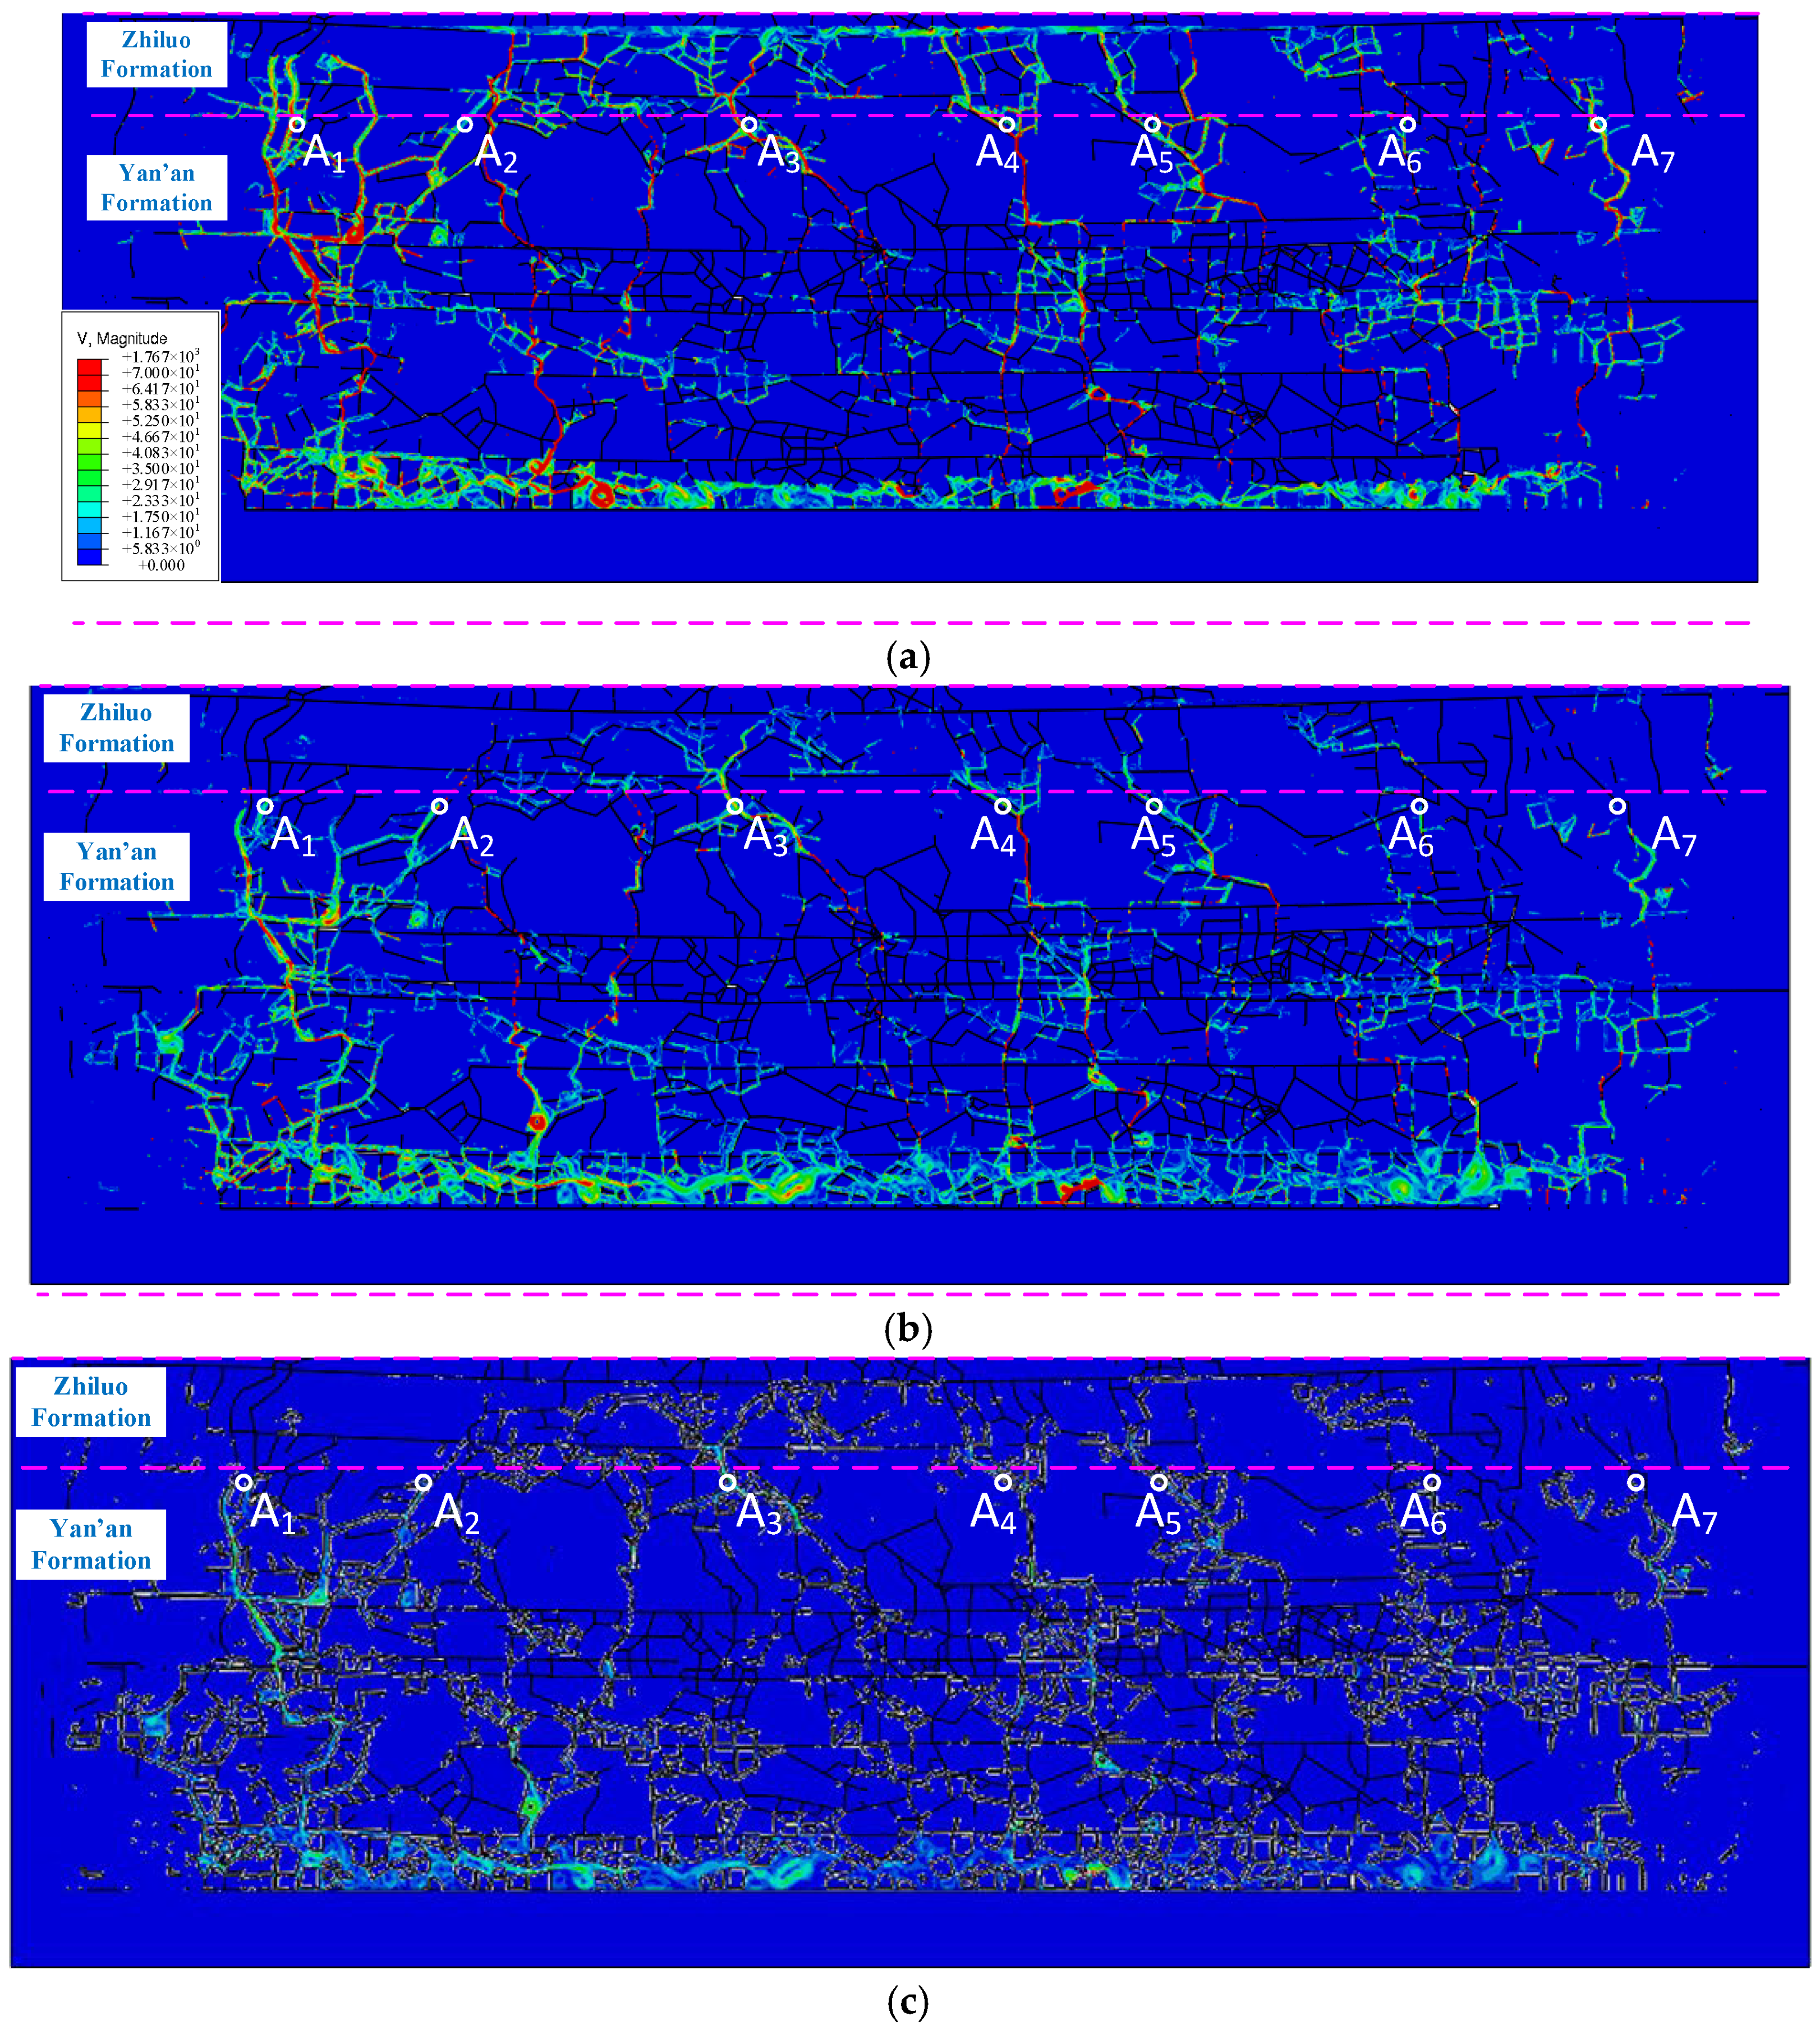
Based on the primary distribution area of mining-induced fractures (Figure 6h), the Eulerian domain dimensions were determined to be 650 m in length and 219 m in height. The domain was positioned horizontally at the center of the model, while vertically, it was arranged between the top boundary of the Zhiluo Formation and coal seam 42 floor. The boundary conditions for the Eulerian domain were defined as follows: The bottom boundary was set as a no-flow boundary (flow velocity is 0). The top boundary was assigned a specified velocity boundary of 0.003 m/d, based on field-measured data regarding the water abundance of the Zhidan Group and the permeability of the first aquifuge (Section 2.2). Given that the aquifers within the influence range of the water-conducting fractured zone have been completely drained after coal seam mining, both the initial saturation and initial pressure of the aquifers in the Zhiluo Formation and Yan’an Formation were set to 0. Gravity was applied throughout the entire Eulerian domain, thereby establishing a numerical model for predicting water inflow volume into the underground reservoir. In the numerical model, the size of the quadrilateral Eulerian element was 10−3 m. On this basis, the numerical results were obtained, as show in Figure 9.
Figure 9.
CFD numerical simulation results. (a) During the mining of coal seam 42; (b) 8 months after the completion of the mining of coal seam No. 42; (c) 7 years after the completion of the mining of No. 42 coal seam.
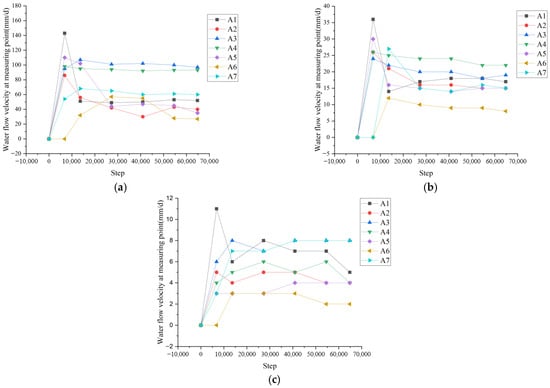
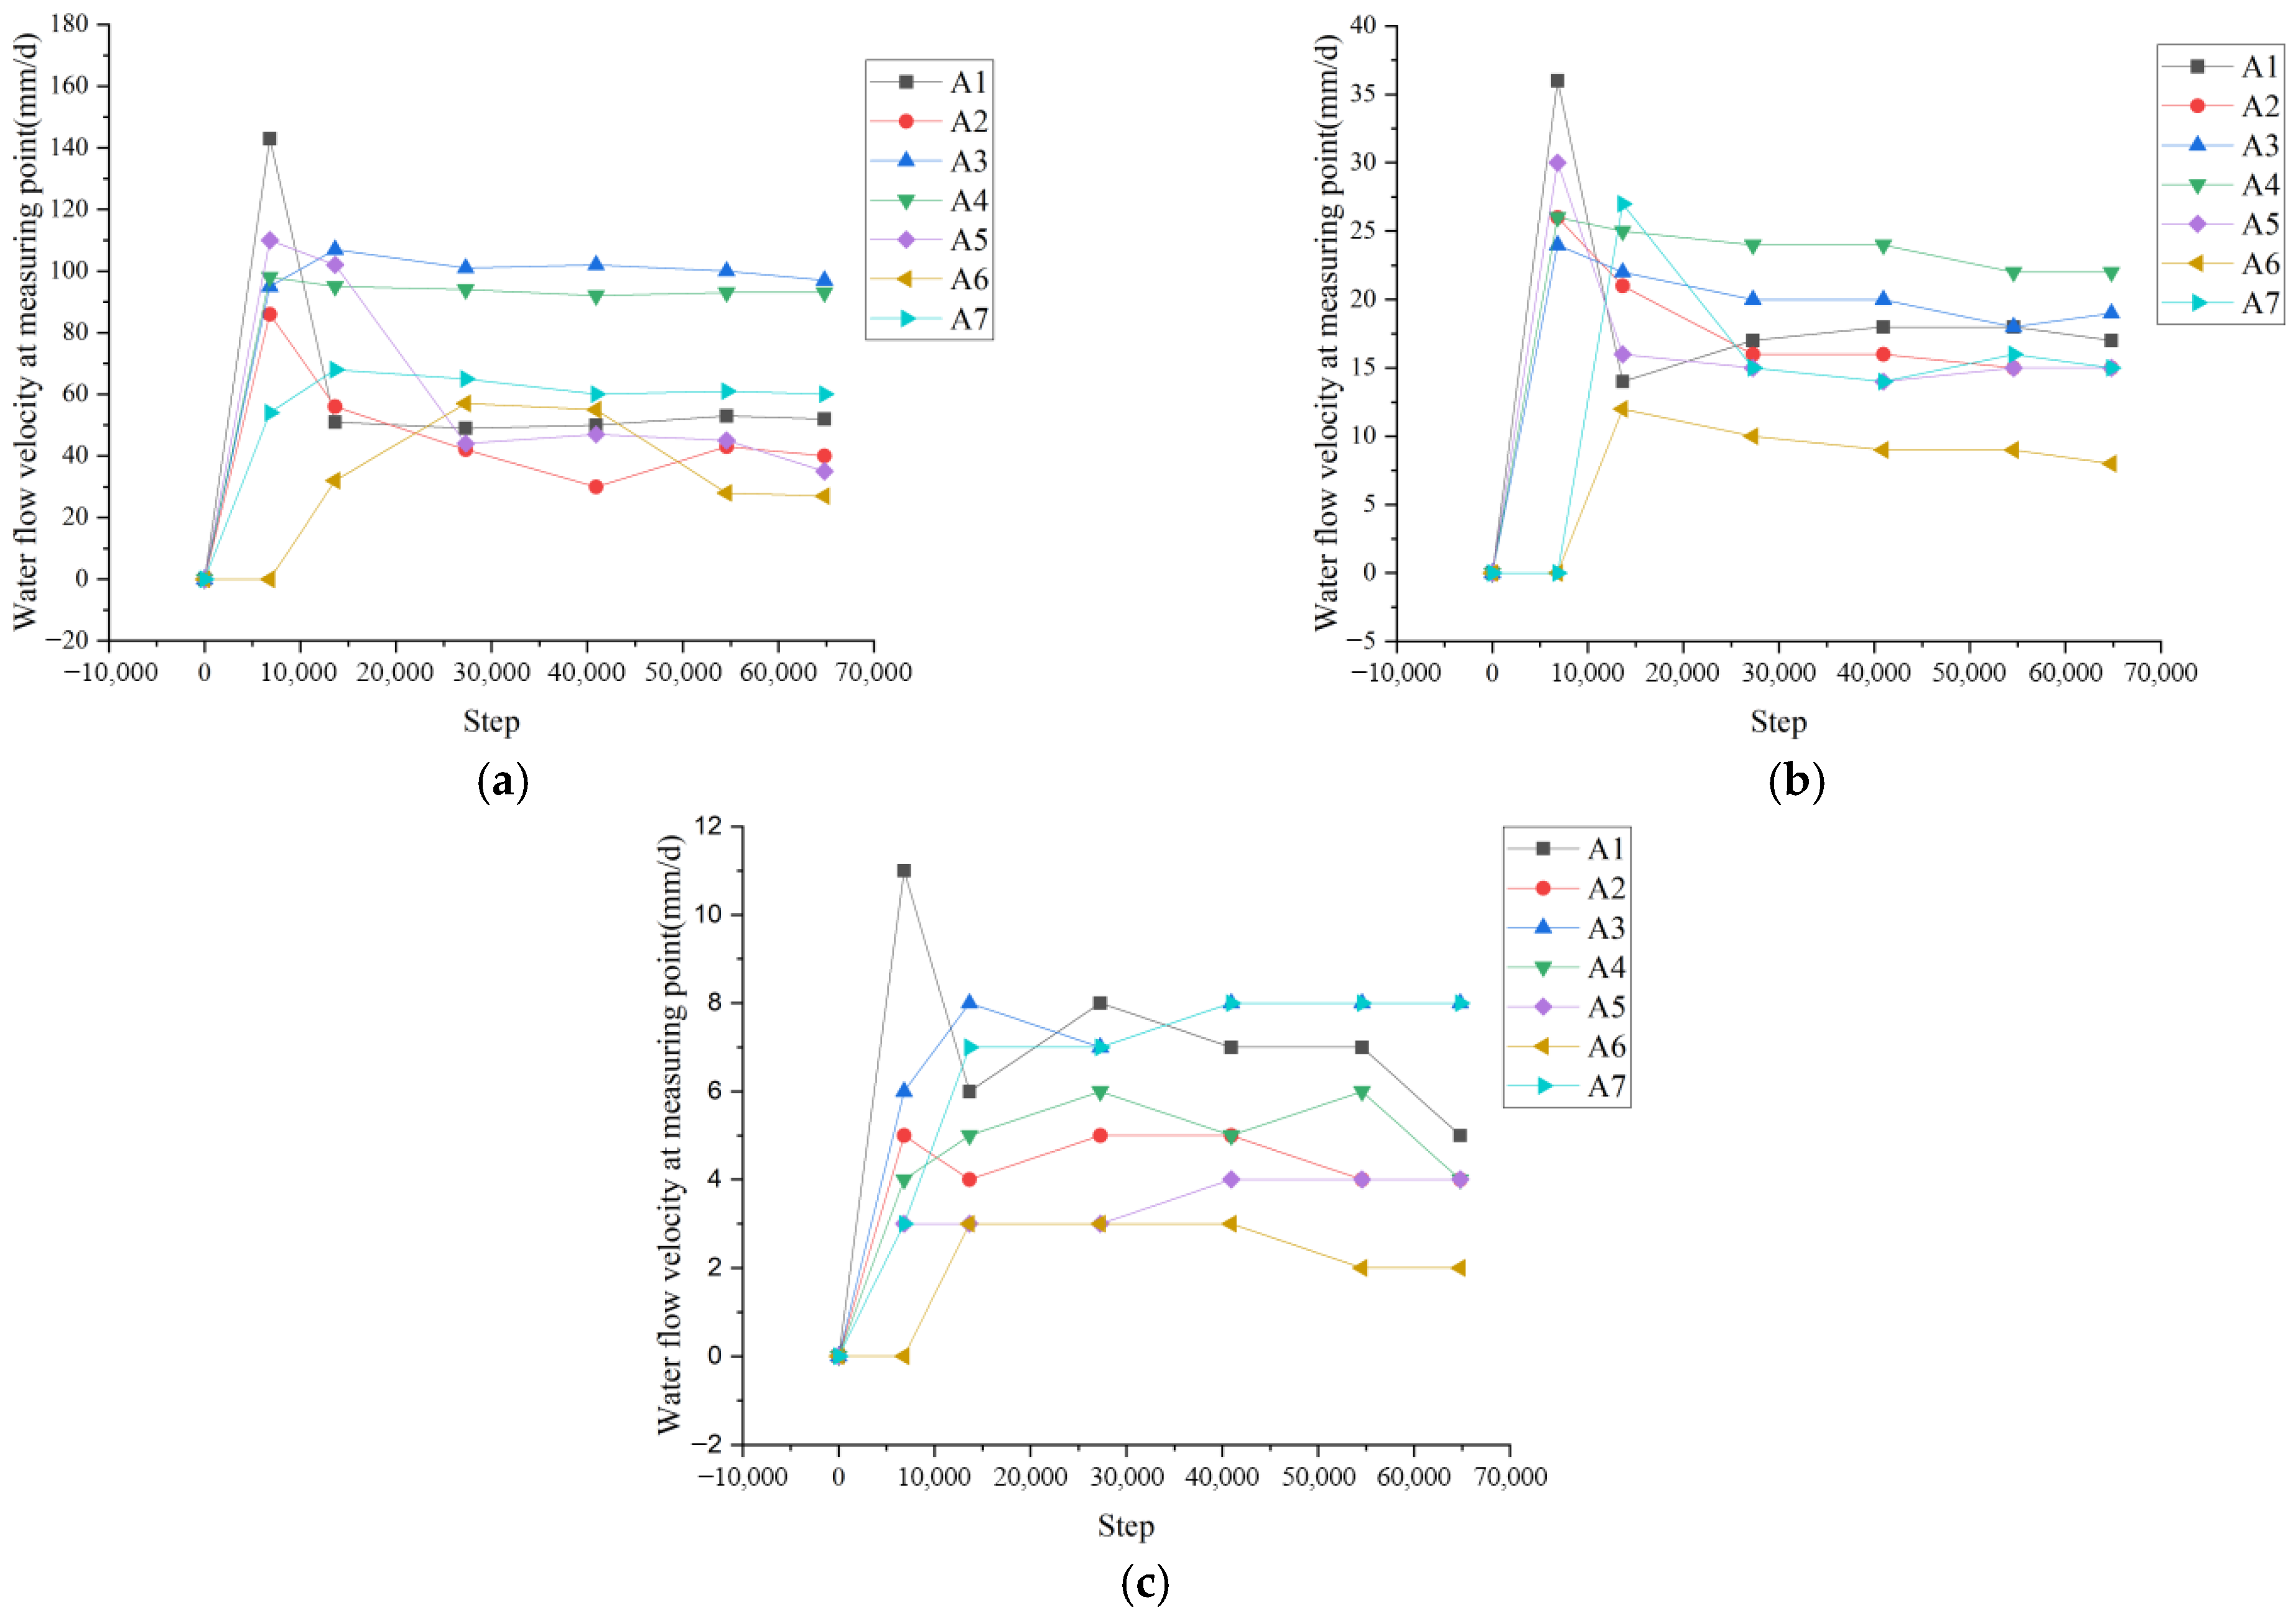
As illustrated in Figure 9, seven primary water-conducting channels (denoted by A1 to A7) were identified near the interface between the Yan’an and Zhiluo Formations under mining-induced influence. A coordinate system was established with the starting cut of the coal seam 42 working face as the origin and the advancing direction as the x-axis. The coordinates of A1 to A7 are as follows: A1 (−26 m), A2 (51 m), A3 (157 m), A4 (268 m), A5 (318 m), A6 (439 m), and A7 (505 m). The flow velocities within these channels were statistically analyzed, and the results are presented in Figure 10.
Figure 10.
Statistics of water flow velocity at measuring points A1~A7. (a) Water velocity at measuring points during coal mining; (b); 8 months after the completion of the mining of coal seam No. 42; (c) 7 years after the completion of the mining of coal seam No. 42.
According to the monitoring data (Figure 10), the following results were obtained:
- (1)
- In the mining process, the water flow velocities at all measurement points reached their peak values, with the overall flow velocity maintained at a high level (50–143 mm/d). Specifically, the flow velocities at points A3 and A4 stabilized at approximately 107 and 93 mm/d, respectively. In contrast, the velocities at points A1, A2, and A5 showed a significant drop from their initial peaks (143, 86, and 110 mm/d, respectively) before stabilizing at preliminary levels. Notably, the flow velocities at points A6 and A7 increased from their initial values of 0 and 54 mm/d to stabilize at around 27 and 60 mm/d, respectively. This indicates that the fracture system in the central part of the goaf became fully interconnected and began to function as a water-conducting pathway only after the mining activities had concluded.
- (2)
- Eight months after mining, the water flow velocities at all points had undergone substantial attenuation compared with the mining period, with the overall flow regime descending to a medium–low level (8–36 mm/d). The velocities at A3 and A4 decreased to approximately 19 and 22 mm/d, respectively, yet remained relatively higher than those at other points. The velocities at A6 and A7 increased to their secondary peaks of 12 and 27 mm/d before declining and stabilizing at around 8 and 15 mm/d, respectively. Although the velocity at A1 declined to about 17 mm/d, the absolute flow rate in the A1 and A6-A7 regions remained significantly higher than in other areas due to the complex fracture distribution, making these zones the primary persistent water-conducting channels during this stage.
- (3)
- Seven years after mining, the water flow velocities had further declined to a low-level stable state (2–8 mm/d). The velocities at A3 and A4 stabilized in the long term at approximately 8 and 6 mm/d, respectively, while those at A6 and A7 stabilized at around 2 and 8 mm/d, respectively. Although the water-conducting capacity of most measurement points had significantly weakened, points A1, A3, A4, and A7 remained the primary long-term water-conducting channels. This is attributed to their locations within areas featuring complex fracture networks and large flow cross-sections, where the flow velocity, albeit low, still supports substantial water transmission.
In summary, the predicted water inflow rate was 78.3 m3/h upon the completion of the coal seam 42 working face, decreased to 12.5 m3/h eight months after mining cessation, and further declined to 2.6 m3/h after seven years, representing a 96.7% reduction compared with the peak value.
4.3. In Situ Testing and Verification
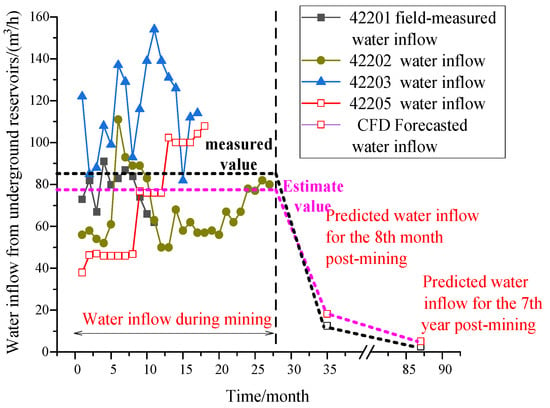
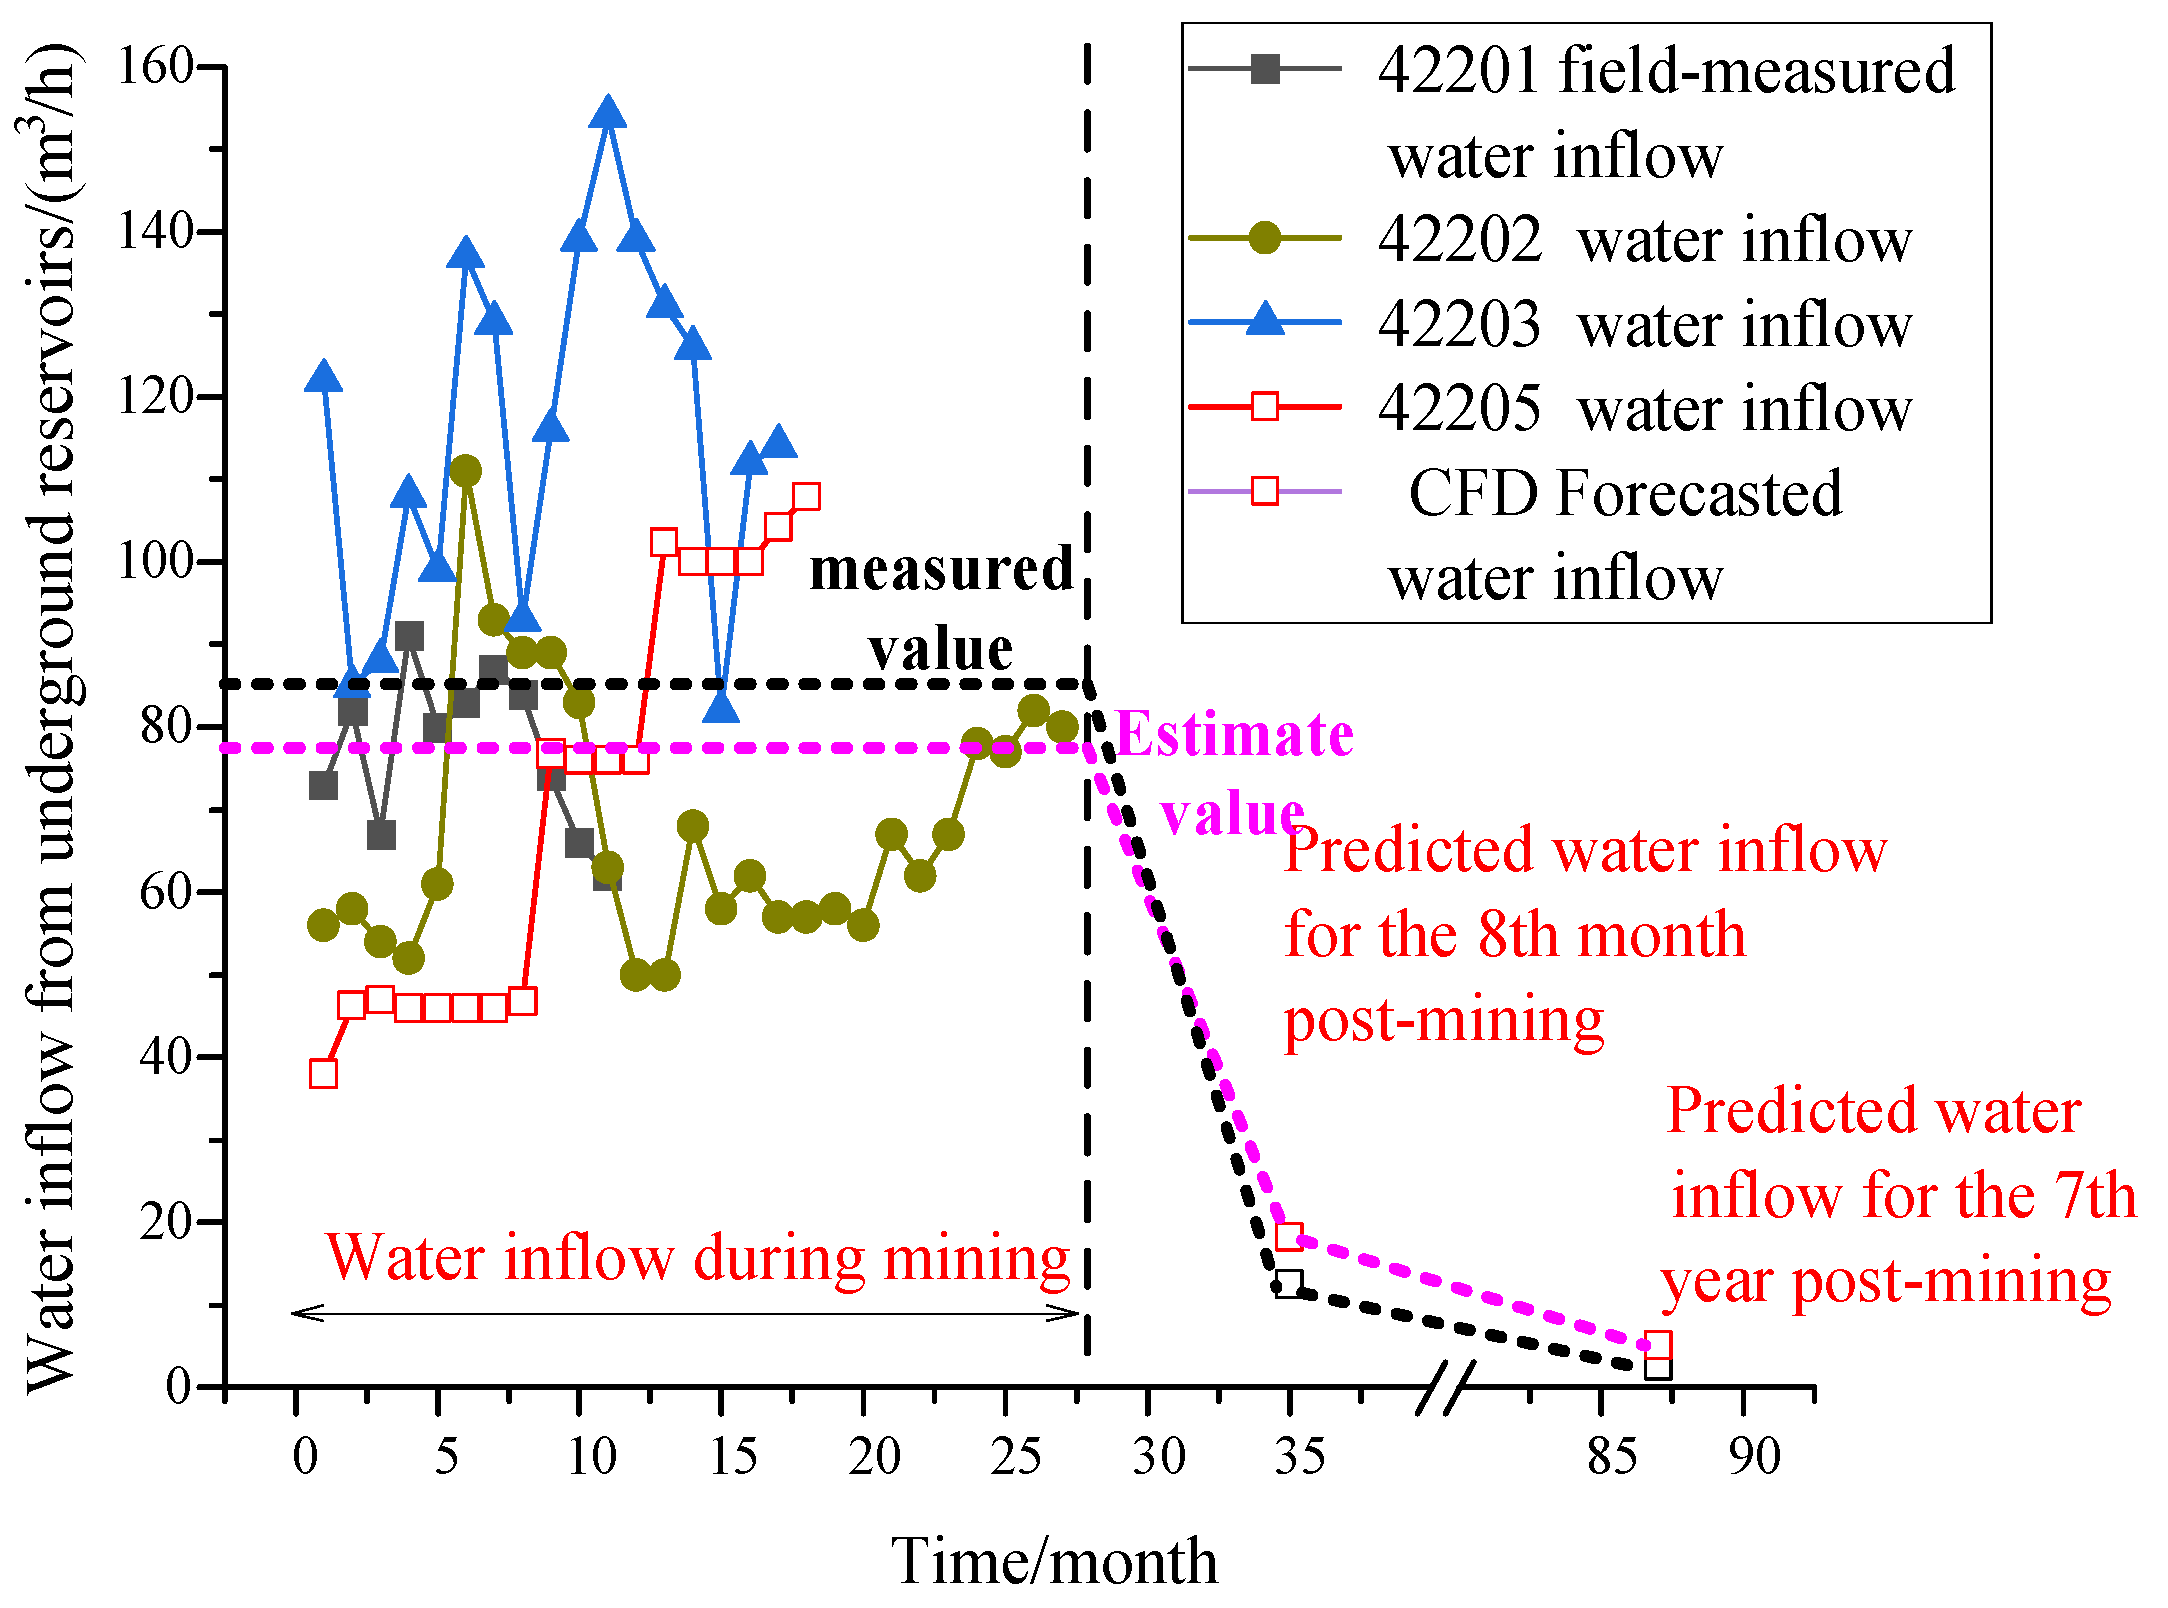
The water inflow volumes during the mining process of working faces 42201, 42202, 42203, and 42205 were statistically analyzed, and the average value of the water inflow from these three working faces was calculated, with the results being shown in Figure 11.
Figure 11.
Comparison between predicted and measured water inflow during and after mining.
The measured average water inflow during the mining process of the coal seam 42 working faces was 87.6 m3/h, with individual values of 74 m3/h for face 42201, 77 m3/h for face 42202, and 112 m3/h for face 42203. The numerically predicted result was 78.3 m3/h (Section 4.2), showing a deviation of 10.6% from the measured average. This close agreement between prediction and measurement validates the reliability of the numerical simulation method.
Following the completion of mining operations at working faces 42106 and 42202, a statistical analysis was conducted on the water inflow in their auxiliary transportation roadways, and the average water inflow volume for these two working faces was calculated, with the results being presented in Figure 11.
After the stopping of working face 42201 was completed, the water inflow in the 42201 auxiliary haulage roadway decreased rapidly from 65 m3/h (30 October 2017) to 0 m3/h (30 June 2018) within eight months. Meanwhile, the water level in observation borehole BS10 (Zhidan Group aquifer) gradually recovered from 1280 m to approximately 1310 m. This indicates that the main aquifer remained water-bearing, and the rapid decrease in water inflow was primarily due to the closure of mining-induced fractures over time, which reduced the water-conducting pathways. Similarly, as the 42202 working face approached the end of stopping, the water inflow in the goaf decreased from 25 m3/h (30 July 2019) to 2 m3/h (30 January 2020) within five months, during which the water level in borehole BS10 rose from 1196.8 m (September 2020) to around 1197.4 m (December 2020). Both cases demonstrate that the synchronous recovery of aquifer water levels and the decline in water inflow were mainly attributed to the closure of mining-induced fractures, rather than the depletion of the aquifer itself.
Numerical simulations based on Computational Fluid Dynamics (CFD) revealed that the water inflow in the goaf of working face 42205 was 12.5–18.2 m3/h 8 months after mining cessation, which decreased to 2.6–5.1 m3/h after 7 years. Comparative analysis with field measurements showed an average deviation of 10.6% between simulated and measured results, with the 7-year post-mining simulation (2.6–5.1 m3/h) closely aligning with the measured value (2 m3/h). This deviation falls within acceptable engineering tolerance, demonstrating the reliability of the CFD-based numerical prediction model in capturing the temporal evolution of water inflow in goafs.
5. Conclusions
5.1. Key Findings and Research Results
- (1)
- Mining-induced stress and subsequent stress recovery trigger a dynamic “expansion and time-dependent closure” pattern in the overburden’s water-conducting fracture zone. In situ measurements reveal that the height of this zone decreased from 152 m (during coal seam mining) to 130 m (7 years post-mining), while the average fracture openings in the main aquifers and the aquifuge were reduced by more than 50%, demonstrating a significant time-dependent closure characteristic of fracture evolution.
- (2)
- Based on CFD-FDEM coupled simulations, the total fracture opening decreased by 40.9% to 84.1% over the period from 8 months to 7 years after mining, resulting in a dramatic decline in reservoir inflow from 78.3 m3/h to 2.6 m3/h—a reduction of 96.7%. The close agreement with field measurements, showing a deviation of only 10.6%, confirms that fracture closure is the dominant mechanism controlling the attenuation of water inflow.
- (3)
- The closure of cracks in the key aquitard effectively blocks the vertical recharge of groundwater, ensuring the sustainability of the main aquifer. During the mining period, the Zhidan Group aquifer is vertically replenished to the goaf through fractures; After mining, the cracks in the first aquitard closed (reducing the opening by 83.4%), and the vertical recharge sharply decreased to a peak of 0.46%. The water flow pattern shifted to mainly lateral recharge from the Zhiluo Formation and Yan’an Formation. Thus, while maintaining the function of underground reservoirs, it promotes the recovery of water levels in near-surface aquifers.
5.2. Theoretical and Practical Contributions of This Study
- (1)
- The results elucidate the intrinsic mechanism by which fracture closure shifts the water flow pattern from vertical recharge to lateral recharge, providing a theoretical foundation for the sustainable operation of underground reservoirs.
- (2)
- The CFD-FDEM method and its corresponding theory provide a numerical simulation approach to long-term prediction of water inflow into underground reservoirs in coal mining areas.
- (3)
- This study breaks through the limitation that traditional studies focus solely on the fracture expansion phase and for the first time systematically clarifies the dynamic evolution law of “expansion-time-dependent closure” of mining-induced fractures, filling the research gap in the long-term closure effect of post-mining fractures.
5.3. Limitations of This Study
This study mainly focuses on the water inflow of coal mining faces under active mining and those with completed mining operations; however, further investigation should be conducted on the applicability of this method to coal mining operations under different conditions.
5.4. Future Research
- (1)
- The current study is conducted in a geological setting with no obvious faults or complex structures; future work should extend the numerical model to coal mining areas with developed natural joints or faults, to investigate how geological structural characteristics regulate the “expansion–closure” behavior of mining-induced fractures.
- (2)
- Research on the applicability of the method under different coal seam occurrence and mining conditions is needed, including thin or extra-thick coal seams, shallow- or deep-buried coal seams, and non-longwall mining methods, to clarify the adaptability of the coupled model to variations in mining thickness, advance speed, and roof management modes.
- (3)
- The current two-dimensional numerical model can be upgraded to a three-dimensional model, considering the spatial heterogeneity of stratum properties and the three-dimensional expansion characteristics of fractures, to further improve the reliability and engineering application value of water inflow prediction in complex underground reservoir systems.
Author Contributions
Conceptualization, S.W.; Methodology, S.W.; Software, Z.Z.; Validation, B.W.; Formal analysis, Z.Z. and D.X.; Investigation, S.W.; Resources, B.W.; Data curation, Z.Z.; Writing— original draft, S.W.; Writing—review & editing, Z.Z.; Visualization, D.X.; Supervision, D.X.; Project administration, D.X.; Funding acquisition, Z.Z. All authors have read and agreed to the published version of the manuscript.
Funding
Open Fund of the State Key Laboratory of Water Resource Protection and Utilization in Coal Mining (No. GJNY-23-37-03) and Fundamental Research Program of Shanxi Province (No. 202503021211042).
Data Availability Statement
The original contributions presented in this study are included in the article. Further inquiries can be directed to the corresponding author(s).
Conflicts of Interest
Author Shirong Wei, Duo Xu and Baoyang Wu was employed by the company National Energy Group Shendong Coal Group Co., Ltd. The remaining authors declare that the research was conducted in the absence of any commercial or financial relationships that could be construed as a potential conflict of interest.
References
- Wang, Y.; Sun, K.; Li, L.; Lei, Y.; Wu, S.; Wang, F.; Luo, J. The optimal allocation and the evaluation of water resources carrying capacity in Shendong mining area. Resour. Policy 2022, 77, 102738. [Google Scholar] [CrossRef] [Scilit]
- Ke, J.; Zhou, D.; Hai, C.; Yu, Y.; Jun, H.; Li, B. Temporal and spatial variation of vegetation in net primary productivity of the Shendong coal mining area, Inner Mongolia Autonomous Region. Sustainability 2022, 14, 10883. [Google Scholar] [CrossRef] [Scilit]
- Ma, J.; Li, X.; Wang, Z.; Gao, M.; Fu, C.; Bai, Z.; Hou, X.; Zhang, C. An evaluation method for water abundance of roof aquifer based on groundwater circulation characteristics: A case study of the Zhiluo Formation in Shendong mining area. Environ. Earth Sci. 2024, 83, 135. [Google Scholar] [CrossRef] [Scilit]
- Zhang, H.; Li, G.; Xing, Z.; Wang, L.; Zou, W. A Geological Site Selection Method of a Coal Mine Underground Reservoir and Its Application. Water 2023, 15, 2747. [Google Scholar] [CrossRef] [Scilit]
- Li, H.; Xu, D.; Li, G.; Wei, S.; Wu, B. Feasibility Study on the Construction of Underground Reservoirs in Coal Goaf—A Case Study from Buertai Coal Mine, China. Sustainability 2024, 16, 9912. [Google Scholar] [CrossRef] [Scilit]
- Jiang, B.; Gao, J.; Du, K.; Deng, X.; Zhang, K. Insight into the water–rock interaction process and purification mechanism of mine water in underground reservoir of Daliuta coal mine in China. Environ. Sci. Pollut. Res. 2022, 29, 28538–28551. [Google Scholar] [CrossRef] [Scilit]
- Tyulenev, M.; Zhironkin, S.; Litvin, O. The low-cost technology of quarry water purifying using the artificial filters of overburden rock. Pollut. Res. 2015, 34, 825–830. [Google Scholar]
- Javadi, M.; Sharifzadeh, M.; Shahriar, K. Uncertainty analysis of groundwater inflow into underground excavations by stochastic discontinuum method: Case study of Siah Bisheh pumped storage project, Iran. Tunn. Undergr. Space Technol. 2016, 51, 424–438. [Google Scholar] [CrossRef] [Scilit]
- Yıldız, T.D. Loss of profits occurring due to the halting of mining operations arising from occupational accidents or reasons related to legislation. Gospod. Surowcami Miner. 2021, 37, 153–176. [Google Scholar] [CrossRef] [Scilit]
- Molinero, J.; Samper, J.; Juanes, R. Numerical modeling of the transient hydrogeological response produced by tunnel construction in fractured bedrocks. Eng. Geol. 2002, 64, 369–386. [Google Scholar] [CrossRef] [Scilit]
- Wang, H.; Tian, J.; Li, L.; Chen, D.; Yuan, Y.; Li, B. Research on the Development Height Prediction Model of Water-Conduction Fracture Zones under Conditions of Extremely Thin Coal Seam Mining. Water 2024, 16, 2273. [Google Scholar] [CrossRef] [Scilit]
- Bakhshi, E.; Golsanami, N.; Chen, L. Numerical modeling and lattice method for characterizing hydraulic fracture propagation: A review of the numerical, experimental, and field studies. Arch. Comput. Methods Eng. 2021, 28, 3329–3360. [Google Scholar] [CrossRef] [Scilit]
- Wang, X.; Zhu, S.; Yu, H.; Liu, Y. Comprehensive analysis control effect of faults on the height of fractured water-conducting zone in longwall mining. Nat. Hazards 2021, 108, 2143–2165. [Google Scholar] [CrossRef] [Scilit]
- Sakhno, I.; Sakhno, S. Numerical studies of floor heave mechanism and the effectiveness of grouting reinforcement of roadway in soft rock containing the mine water. Int. J. Rock Mech. Min. Sci. 2023, 170, 105484. [Google Scholar] [CrossRef] [Scilit]
- Huang, J.; Fang, Y.; Wang, C.; Zhang, Z.; Li, Y. Research on 3D Geological and Numerical Unified Model of in Mining Slope Based on Multi-Source Data. Water 2024, 16, 2421. [Google Scholar] [CrossRef] [Scilit]
- Zhang, Y.; Cao, S.; Gao, R.; Guo, S.; Lan, L. Prediction of the heights of the water-conducting fracture zone in the overlying strata of shortwall block mining beneath aquifers in western China. Sustainability 2018, 10, 1636. [Google Scholar] [CrossRef] [Scilit]
- Bu, F.; Jaboyedoff, M.; Derron, M.H.; Xue, L.; Cui, Y.; Xu, C. Parametric study to implement a water-weakening process in UDEC. J. Rock Mech. Geotech. Eng. 2025, 17, 1378–1386. [Google Scholar] [CrossRef] [Scilit]
- Xu, Y.; Ma, L.; Ngo, I.; Zhai, J. Prediction of the height of water-conductive fractured zone under continuous extraction and partial backfill mining method—A case study. Sustainability 2022, 14, 6582. [Google Scholar] [CrossRef] [Scilit]
- Yu, Y.; Xin, Q.; Cheng, W.; Rui, J.; Zhang, X. Numerical simulation study on the seepage characteristics of coal seam infusion effected by mining-induced stress. Bull. Eng. Geol. Environ. 2021, 80, 9015–9028. [Google Scholar] [CrossRef] [Scilit]
- Islam, M.R.; Shinjo, R.; Faruque, M.O.; Shimada, H.; Howladar, M.F. Finite element method (FEM) groundwater inflow modeling associated with an unconfined aquifer into the open-pit coalmine of the Phulbari area, NW Bangladesh. Arab. J. Geosci. 2016, 9, 394. [Google Scholar] [CrossRef] [Scilit]
- Sakhno, I.; Zuievska, N.; Xiao, L.; Zuievskyi, Y.; Sakhno, S.; Semchuk, R. Prediction of Water Inrush Hazard in Fully Mechanized Coal Seams’ Mining Under Aquifers by Numerical Simulation in ANSYS Software. Appl. Sci. 2025, 15, 4302. [Google Scholar] [CrossRef] [Scilit]
- Yin, H.; Zhao, H.; Xie, D.; Sang, S.; Shi, Y.; Tian, M. Mechanism of mine water inrush from overlying porous aquifer in Quaternary: A case study in Xinhe Coal Mine of Shandong Province, China. Arab. J. Geosci. 2019, 12, 163. [Google Scholar] [CrossRef] [Scilit]
- Jia, L.; Wang, J.; Fang, L.; Cui, Y.; Chen, J.; Cao, L. Study on numerical simulation of groundwater flow field and slope stability in multi-aquifer open pit mine. Sci. Rep. 2024, 14, 31088. [Google Scholar] [CrossRef] [Scilit] [PubMed]
- Singh, R.; Rao, N.S.; Narayan, I.D.; Kumar, N.; Doley, T.; Bandyopadhyay, D.; Kisku, D.K. Application of 3D numerical simulations to forecast mine seepage and groundwater flow conditions with respect to progressive coal mining activity. Environ. Dev. Sustain. 2024, 26, 22367–22388. [Google Scholar] [CrossRef] [Scilit]
- Wang, X.; Sun, Y.; Xu, Z.; Zheng, J.; Zhang, C. Feasibility prediction analysis of groundwater reservoir construction based on GMS and Monte Carlo analyses: A case study from the Dadougou Coal Mine, Shanxi Province, China. Arab. J. Geosci. 2020, 13, 18. [Google Scholar] [CrossRef] [Scilit]
- Wu, C.; Wu, X.; Zhu, G.; Qian, C. Predicting mine water inflow and groundwater levels for coal mining operations in the Pangpangta coalfield, China. Environ. Earth Sci. 2019, 78, 130. [Google Scholar] [CrossRef] [Scilit]
- Zhang, K.; Cao, B.; Lin, G.; Zhao, M. Using multiple methods to predict mine water inflow in the Pingdingshan no. 10 coal mine, China. Mine Water Environ. 2017, 36, 154–160. [Google Scholar] [CrossRef] [Scilit]
- Zhai, H.; Wang, J.; Lu, Y.; Rao, Z.; He, K.; Hao, S.; Huo, A.; Adnan, A. Prediction of the mine water inflow of coal-bearing rock series based on well group pumping. Water 2023, 15, 3680. [Google Scholar] [CrossRef] [Scilit]
- Wu, Q.; Xu, H.; Yang, Y.; Hou, H.; Mi, J.; Wang, X.; Pei, Y.; Zhang, S. Identifying structure change of vegetation under long-term disturbance in the Shendong mining area. Environ. Earth Sci. 2023, 82, 450. [Google Scholar] [CrossRef] [Scilit]
- Zhang, X.; Chen, Z.; Jiao, Y.; Cheng, Y.; Zhu, Z.; Wang, S.; Zhang, H. Quantitative Analysis of Vegetation Dynamics and Driving Factors in the Shendong Mining Area under the Background of Coal Mining. Forests 2024, 15, 1207. [Google Scholar] [CrossRef] [Scilit]
- Sun, Y.; Xu, S.G.; Kang, P.P.; Fu, Y.Z.; Wang, T.X. Impacts of artificial underground reservoir on groundwater environment in the reservoir and downstream area. Int. J. Environ. Res. Public Health 2019, 16, 1921. [Google Scholar] [CrossRef] [Scilit]
- Kong, X.; Yang, W.; Shan, R.; Wang, S.; Fang, J. Ultimate water level and deformation failures of the artificial dam in the coal mine underground reservoir. Eng. Fail. Anal. 2024, 162, 108367. [Google Scholar] [CrossRef] [Scilit]
- Li, Y.; Yao, Q.; Xia, Z.; Xu, Q.; Yu, L.; Liu, Z.; Chen, S. Stability Evaluation of the Artificial Dam in Underground Reservoirs Under Storage and Drainage Cycles: A method based on concrete performance and case study. Rock Mech. Rock Eng. 2025, 58, 7725–7744. [Google Scholar] [CrossRef] [Scilit]
- Vargonen, M.; Huang, L.; Shi, Y. Evaluating Mohr–Coulomb yield criterion for plastic flow in model metallic glasses. J. Non-Cryst. Solids 2012, 358, 3488–3494. [Google Scholar] [CrossRef] [Scilit]
- Orekhov, A.V. Statistical criteria for the limits of application of Hooke’s law. Vestn. St.-Peterbg. Universiteta. Seriya 10. Prikl. Matematika. Informatika. Protsessy Upr. 2020, 16, 391–401. [Google Scholar] [CrossRef] [Scilit]
- Al-Ajmi, A.M.; Zimmerman, R.W. Relation between the Mogi and the Coulomb failure criteria. Int. J. Rock Mech. Min. Sci. 2005, 42, 431–439. [Google Scholar] [CrossRef] [Scilit]
- Zhang, X.; Chai, J.; Qin, Y.; Cao, J.; Cao, C. Experimental study on seepage and stress of single-fracture radiation flow. KSCE J. Civ. Eng. 2019, 23, 1132–1140. [Google Scholar] [CrossRef] [Scilit]


Disclaimer/Publisher’s Note: The statements, opinions and data contained in all publications are solely those of the individual author(s) and contributor(s) and not of MDPI and/or the editor(s). MDPI and/or the editor(s) disclaim responsibility for any injury to people or property resulting from any ideas, methods, instructions or products referred to in the content. |
© 2026 by the authors. Licensee MDPI, Basel, Switzerland. This article is an open access article distributed under the terms and conditions of the Creative Commons Attribution (CC BY) license.