


Abstract
With unconventional oil–gas reservoir exploration and oil and gas theory development, more and more importance is attached to the wellbore integrity. The casing deformation and damage is an integral part of the wellbore integrity theory. In the shale gas block in southwestern China, the casing deformation is grave because of the nonuniform stress of the reservoir, posing a significant influence on the productivity and economic efficiency of the shale gas development. In order to clarify the causes and mechanisms of the casing deformation caused by the nonuniform stress, the author of this paper has established the mechanical properties mathematical model of the casing under the nonuniform load as well as the casing–cement ring–stratum assembly numerical model based on the data of in situ multi-arm well logger and reservoir geological characteristics. Such models are established to study the response pattern of the casing under the nonuniform creep ground stress of the shale gas reservoir. The study herein serves as a reference for the optimization of casing design and target-specific exploration technology adjustments and lays the foundation for promoting the cost-effective development of shale gas reservoirs.
1. Introduction
Shale gas exploration and development is a strategic requirement for China’s energy development and economic restructuring. During the development, the nonuniform ground stress of shale reservoirs seriously weakens the strength of the casing and cement ring, leading to a series of casing damage and deformation problems, such as casing body instability, rupture, fracture, and yield failure [1,2]. Casing deformation is a common problem in shale gas fields in the mountainous areas of southwestern China, and such a problem is more serious especially in the Weiyuan and Changning shale gas block in the Sichuan Basin [3,4]. According to the relevant data [5,6], casing deformation has occurred in 36 of the 141 shale gas wells that have completed fracturing in the Weiyuan and Changning block, which seriously affects the development of shale gas in Sichuan. Therefore, how to avoid or reduce the damage and deformation of the shale gas well casing is a pressing problem to be addressed during shale gas development. Many scholars have conducted related research in this field.
In recent years, relevant studies have mainly focused on the mechanisms of casing deformation and its prevention and control measures in shale gas wells. Yan Xi et al. [7] argued that casing deformation is caused by small fault slips, and quantified the relationship between slip distance and the reduction in casing inner diameter through a new research method based on microseismic data and caliper measurements. Zhang Zhi et al. [8] found through a study on the local trapped additional pressure model that thermal expansion caused by temperature differences due to large-displacement injection of fracturing fluid may damage the casing, and suggested increasing the steel grade or wall thickness. Based on the “Generalized Shear Activity Criterion”—a fundamental theory of structural geology and geomechanics, Tong et al. [9,10] analyzed in detail the casing deformation phenomenon in a certain region, and further proposed a method to prevent and control casing deformation by regulating casing shear deformation. Yan Y et al. [11] established a fully coupled thermal-hydro-mechanical (THM) model incorporating the transient heat transfer process of fracturing fluid, analyzed the influence of fracturing parameters and cement mechanical parameters on cement integrity, and indicated that casing pressure and cement mechanical parameters are the main controlling factors for cement sheath failure. Zhang Wei et al. [12] adopted the Mohr–Coulomb criterion, took fault slip amount as the boundary condition, and determined the influence laws of fault-related parameters (such as friction coefficient, fault length, horizontal in situ stress, and fault angle) on the degree of casing deformation. Yin et al. [13] established a finite element model to study casing elliptical deformation in shale gas wells, found that fracturing fluid pressure and rock degradation are the main influencing factors, and proposed that controlling fracturing pressure and using flexible cement materials can reduce deformation. Zhao et al. [14] studied casing deformation caused by fault slips during multiple fracturing in shale gas wells through a dynamic mechanical model, and emphasized that optimizing the fracturing design to prevent fault slips is the key to controlling casing deformation.
While these studies advance the understanding of shale gas well casing deformation, they have common limitations for complex nonuniform creep scenarios (e.g., Sichuan Basin): most simplify formation loads as uniform/discrete events (ignoring casing–cement ring–creep coupling), overlook corrosion defects (prevalent in high-acid wells), and lack validation with field logging data or quantification of the critical deformation thresholds, restricting practical applicability.
In order to determine the cause of casing damage and deformation, the response patterns of casing under the stratum stress conditions need to be studied. Based on the field data, the author of this paper analyzes the casing deformation of the N-2 well. Based on data such as the wellbore structure, stratum information, casing size, and production commencement, the author interprets and analyzes the multi-arm logging and electromagnetic flaw detection data and takes the result as the basis for the study of the causes of casing deformation. Based on the nonuniform creep process and mechanism of the rock, the author establishes the mechanical response model of the casing under the nonuniform creep load of the shale gas reservoir through the elastoplastic mechanics and numerical simulation methods. The mechanical response model is then used to study the mechanical response pattern of the casing under the nonuniform creep load. The novelty of this study lies in revealing the linear vs. nonlinear stress evolution patterns under localized loads by introducing a multi-parameter characterization framework. Specifically, the contact ‘wrap angle’ () is employed as a key governing parameter to quantify the angular distribution of creep pressure, while the load non-uniformity coefficient and creep growth factors are integrated to capture the spatial and temporal evolution of the casing response. This approach transitions from traditional uniform assumptions to a refined parameterized model. Validated by MIT24 field data, this method significantly improves the accuracy of casing deformation prediction in complex shale reservoirs.
2. N-2 Well Casing Deformation
2.1. Well Condition Profile
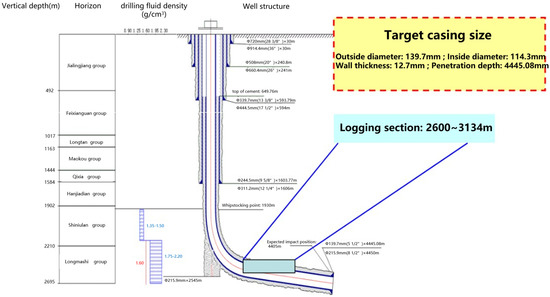
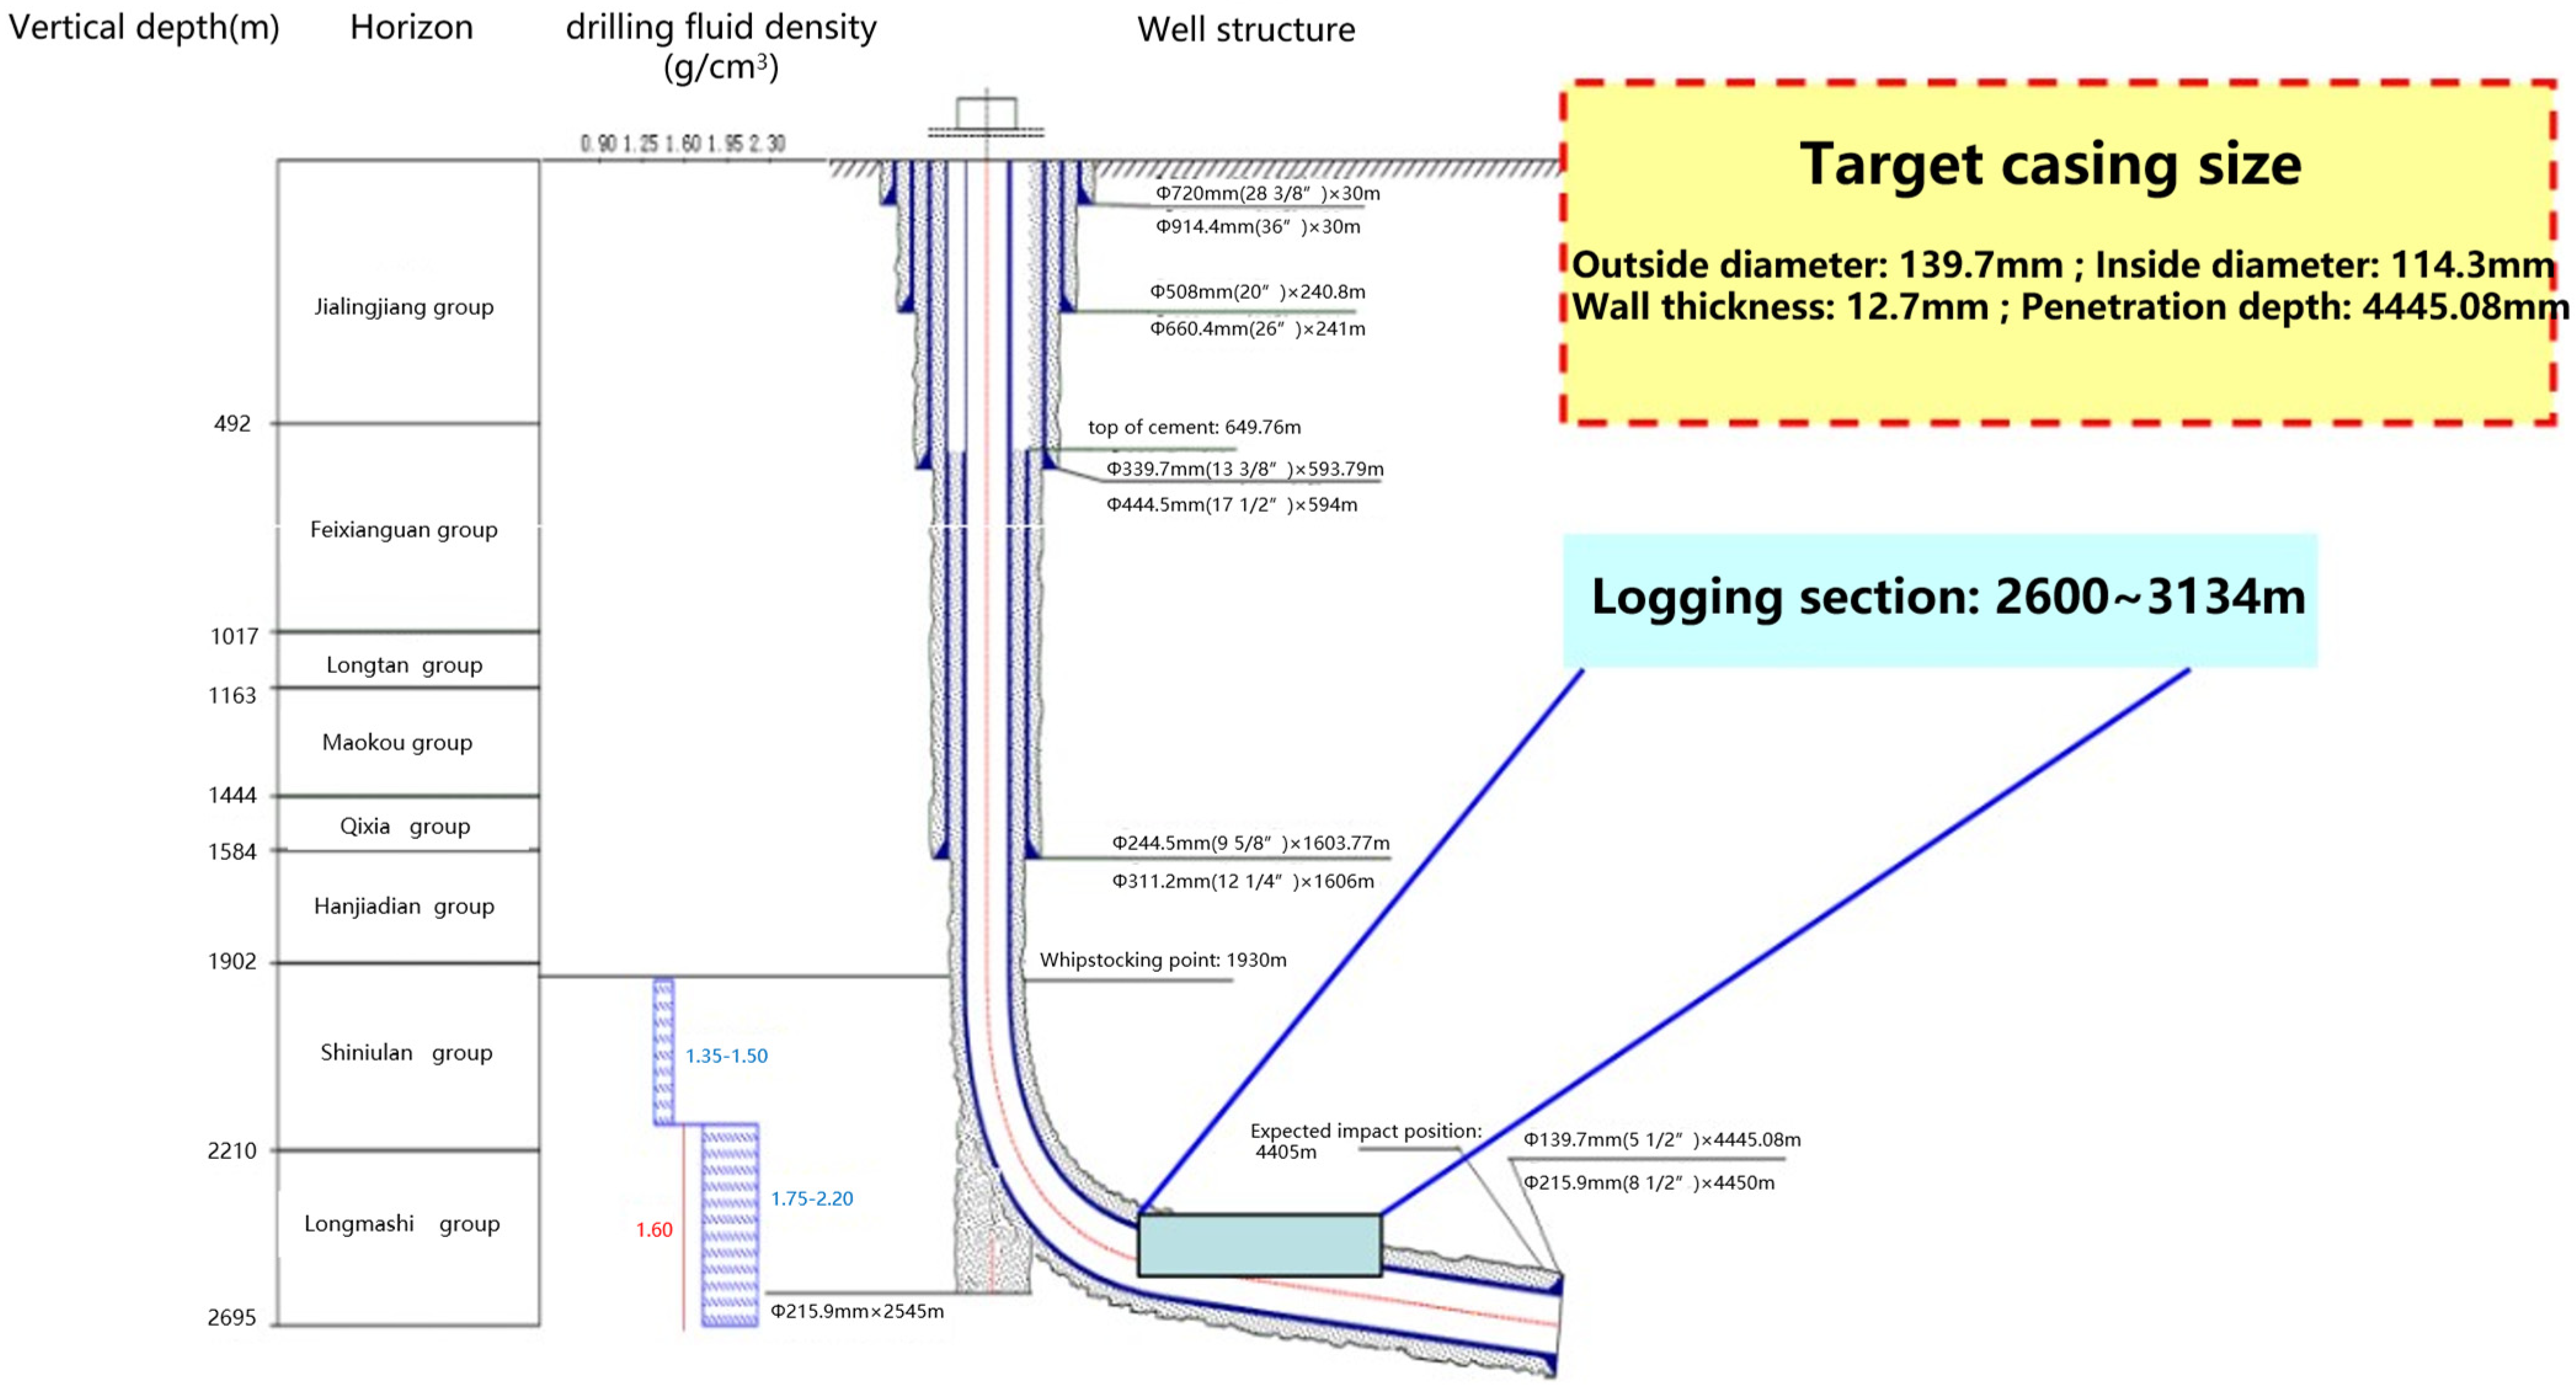
The N-2 evaluation well is a horizontal well located in the Sichuan Basin, structurally positioned on the southern wing of the Changning mid-top structure of the Ordovician period. The total measured depth (MD) of the well is 4450 m, with the target layer situated in the Longmaxi Formation. The artificial bottom-hole depth is 4403.8 m, and the kick-off point is located at a depth of 1930 m. The maximum inclination is 84.97° at a depth of 4408.82 m. The entry point of the horizontal section is at 2950 m, with a total horizontal lateral length of 1500 m. The well is completed with casing and has no tubing. The fracturing interval ranges from 2950 m to 4403 m, covering a total length of 1453 m divided into 28 stages. Casing deformation logging was conducted within the interval of 2600 m to 3134 m. The wellbore configuration is illustrated in Figure 1.
Figure 1.
N-2 well body structure.
2.2. Casing Deformation
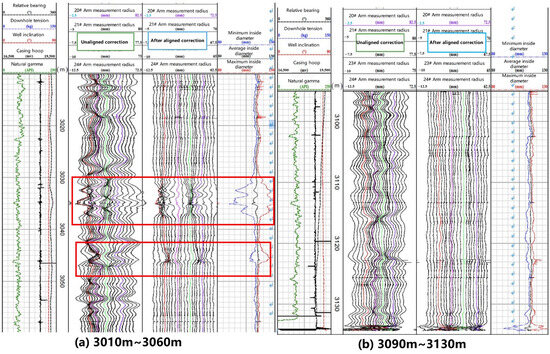
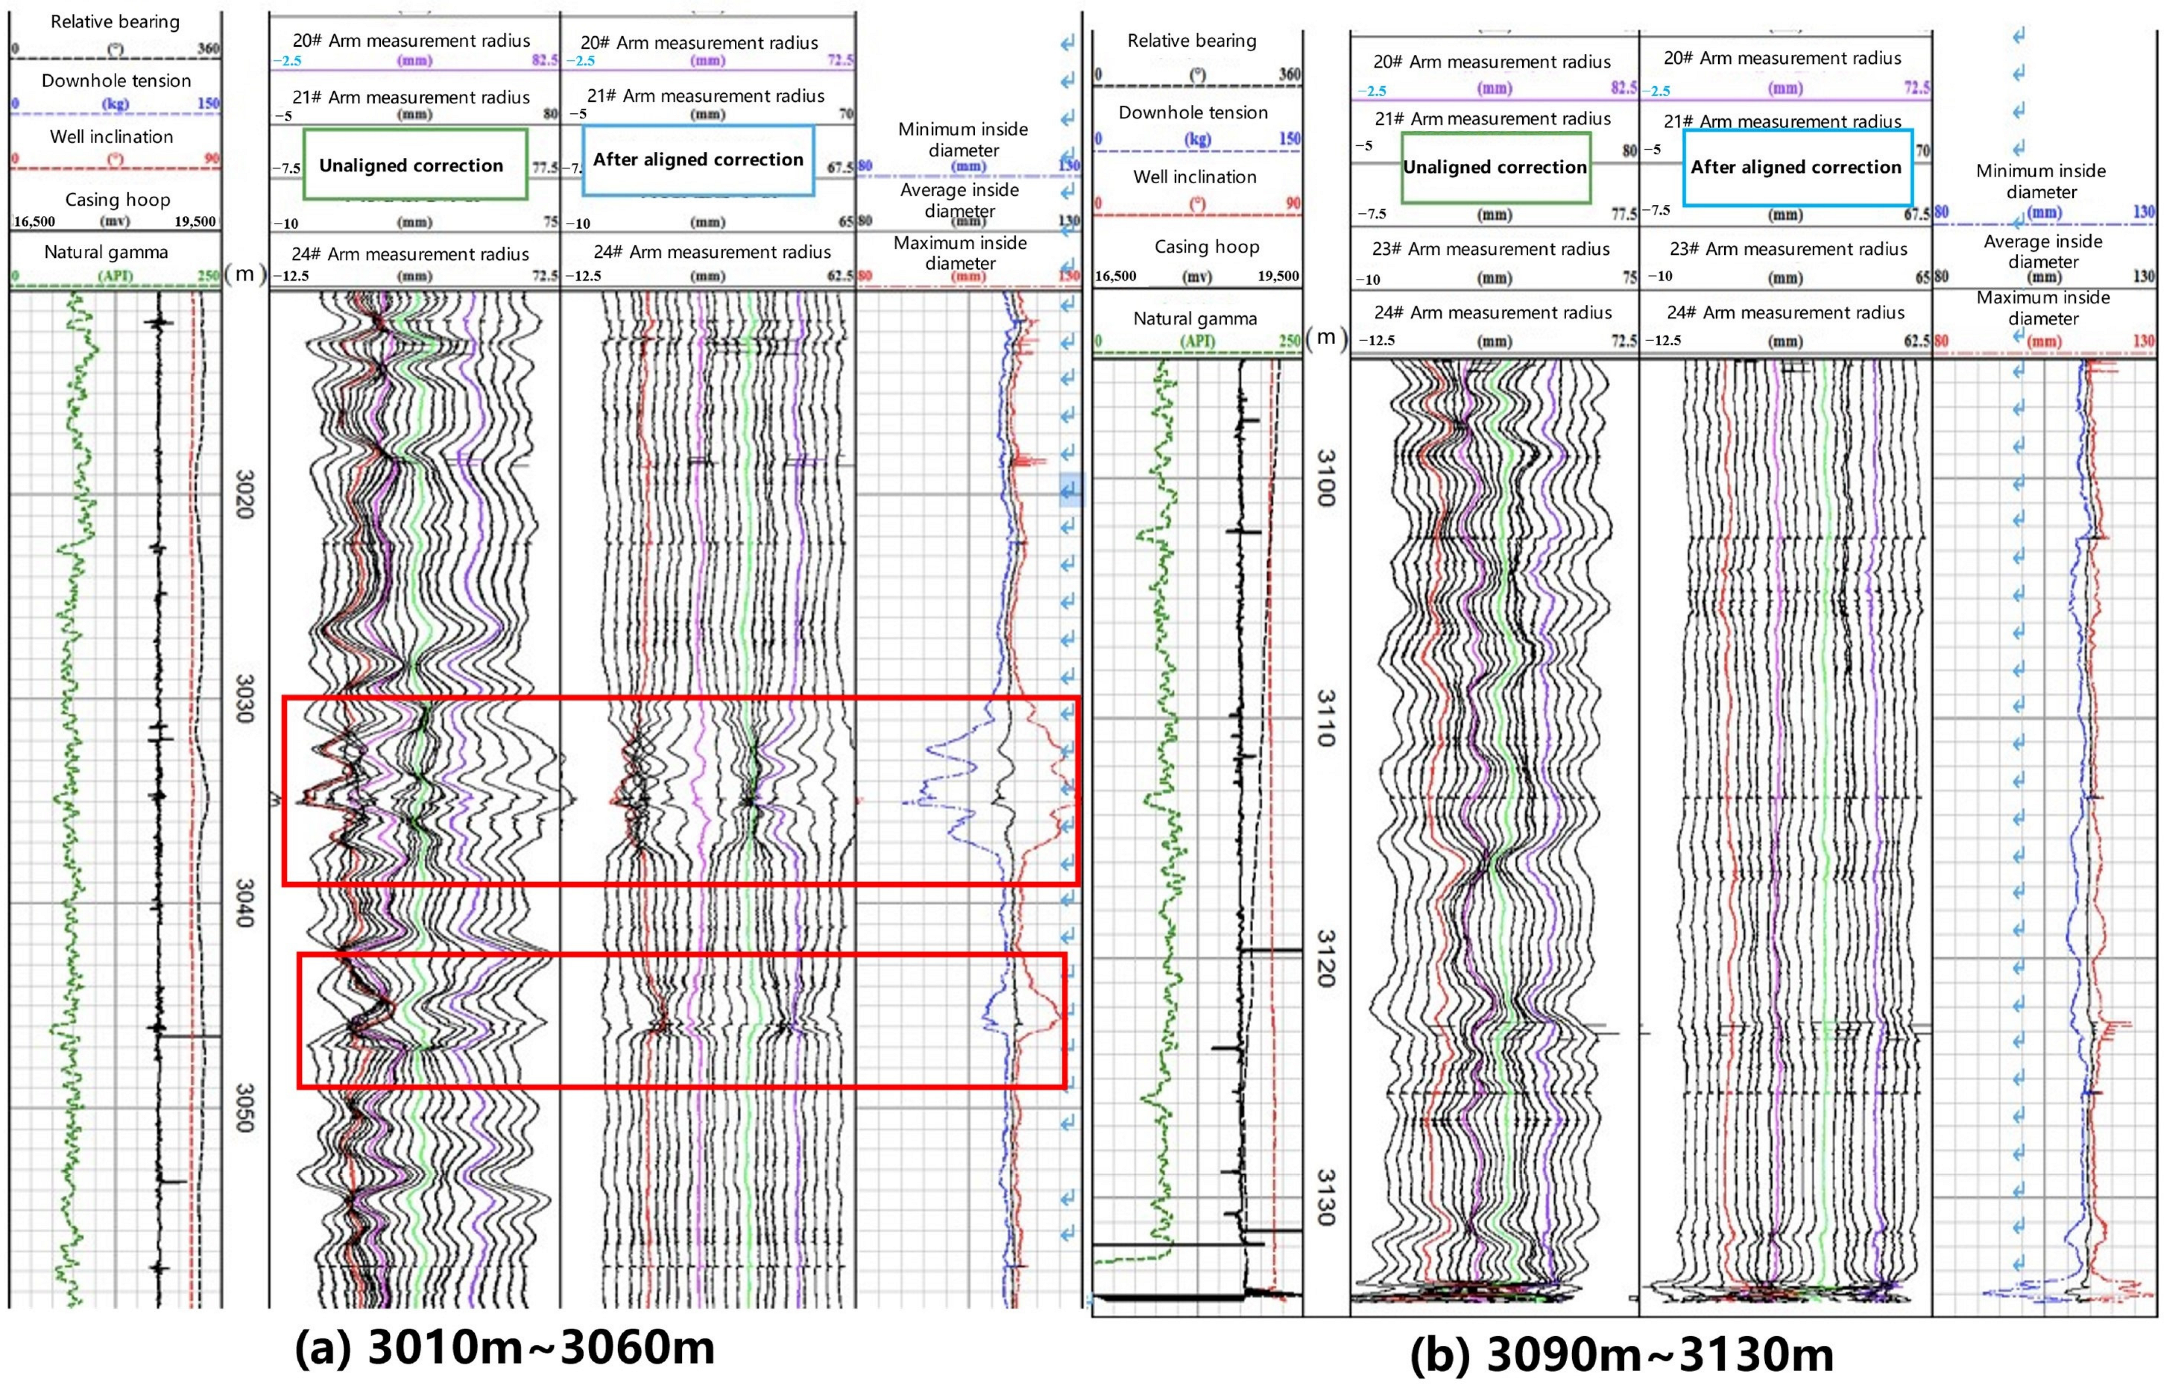
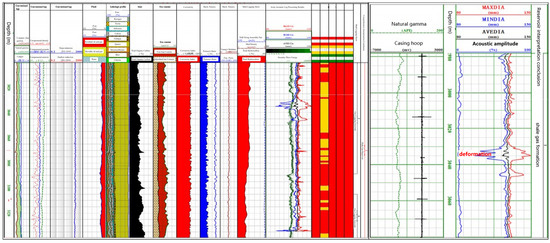
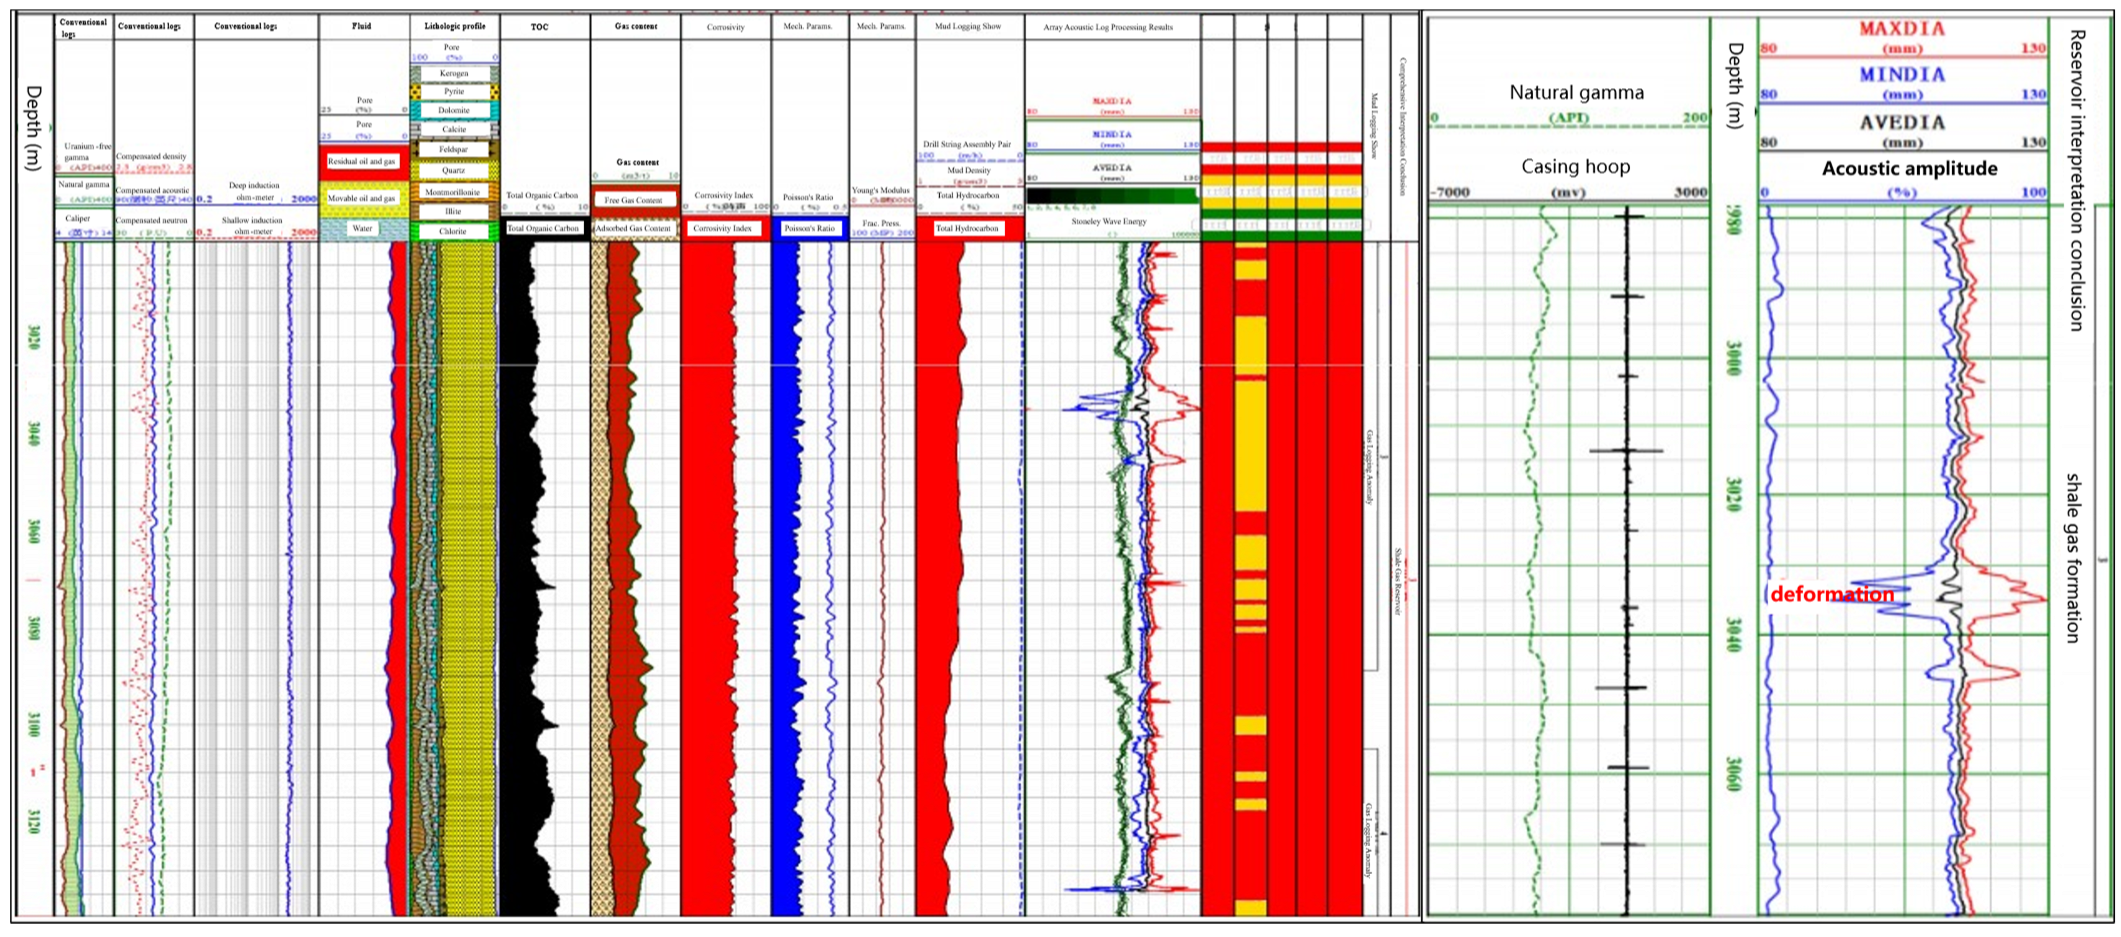
Continuous oil pipe logging was performed on well section 2600~3134 m of the N-2 with storage short joint, downhole tension, pressure magnetic positioning, natural gamma, and MIT24 multi-arm caliper. The logging results are shown in Figure 2 and Figure 3. According to the Figure, there are two obvious changes in the well diameter, an indication of casing deformation.
Figure 2.
Ning215 well 139.7 mm casing MIT24 logging curve (Note: The area within the red box is the section where the casing deformation is relatively severe).
Figure 3.
Comprehensive analysis of reservoir in N-2 well.
The interpretation procedure for MIT24 multi-arm caliper data begins with the alignment calibration of all 24 independent arms to eliminate mechanical installation bias and unify the radial measurement baseline. To ensure precise spatial positioning, the logging depth is cross-referenced with casing collar signals from the magnetic localization tool (MLT) and formation responses from the gamma ray (GR) log, preventing depth-offset-induced misjudgment.
Taking the nominal drift diameter (114.3 mm) of the 139.7 mm casing as the reference, the internal diameter data (calculated as ID = 2 × radius) from the 24 arms are analyzed simultaneously. To ensure the accuracy of the deformation identification, the measurement error of mm was utilized as a noise filtration threshold. Radial variations falling within this range were attributed to mechanical tolerances or minor wellbore roughness and were excluded from the analysis. An interval was flagged as a suspected deformation zone only if the measurements from multiple arms consistently deviated from the nominal diameter beyond this mm threshold. This criterion effectively eliminates false positives caused by measurement noise and ensures that the identified deformation zones represent statistically significant structural changes. The precise boundaries (e.g., 3028–3038 m and 3043–3047 m) are then determined by identifying the mutation points where the ID curves shift abruptly from the stable nominal value, as illustrated in Figure 2.
The reliability of the interpretation is verified through three aspects: (1) consistency in downhole tension curves to exclude interference from tool obstruction or sticking; (2) synchronized deviation across all 24 arms to eliminate pseudo-signals caused by single-arm mechanical failure; and (3) a high spatial correlation between the deformation zones and the mudstone layers shown in Figure 3, providing a geological basis for the nonuniform creep loading mechanism.
2.3. Logging Data Interpretation
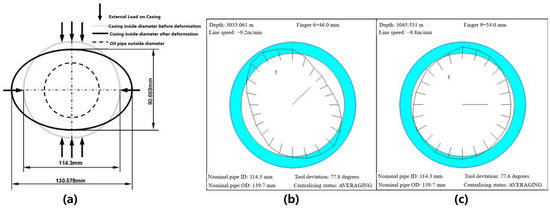
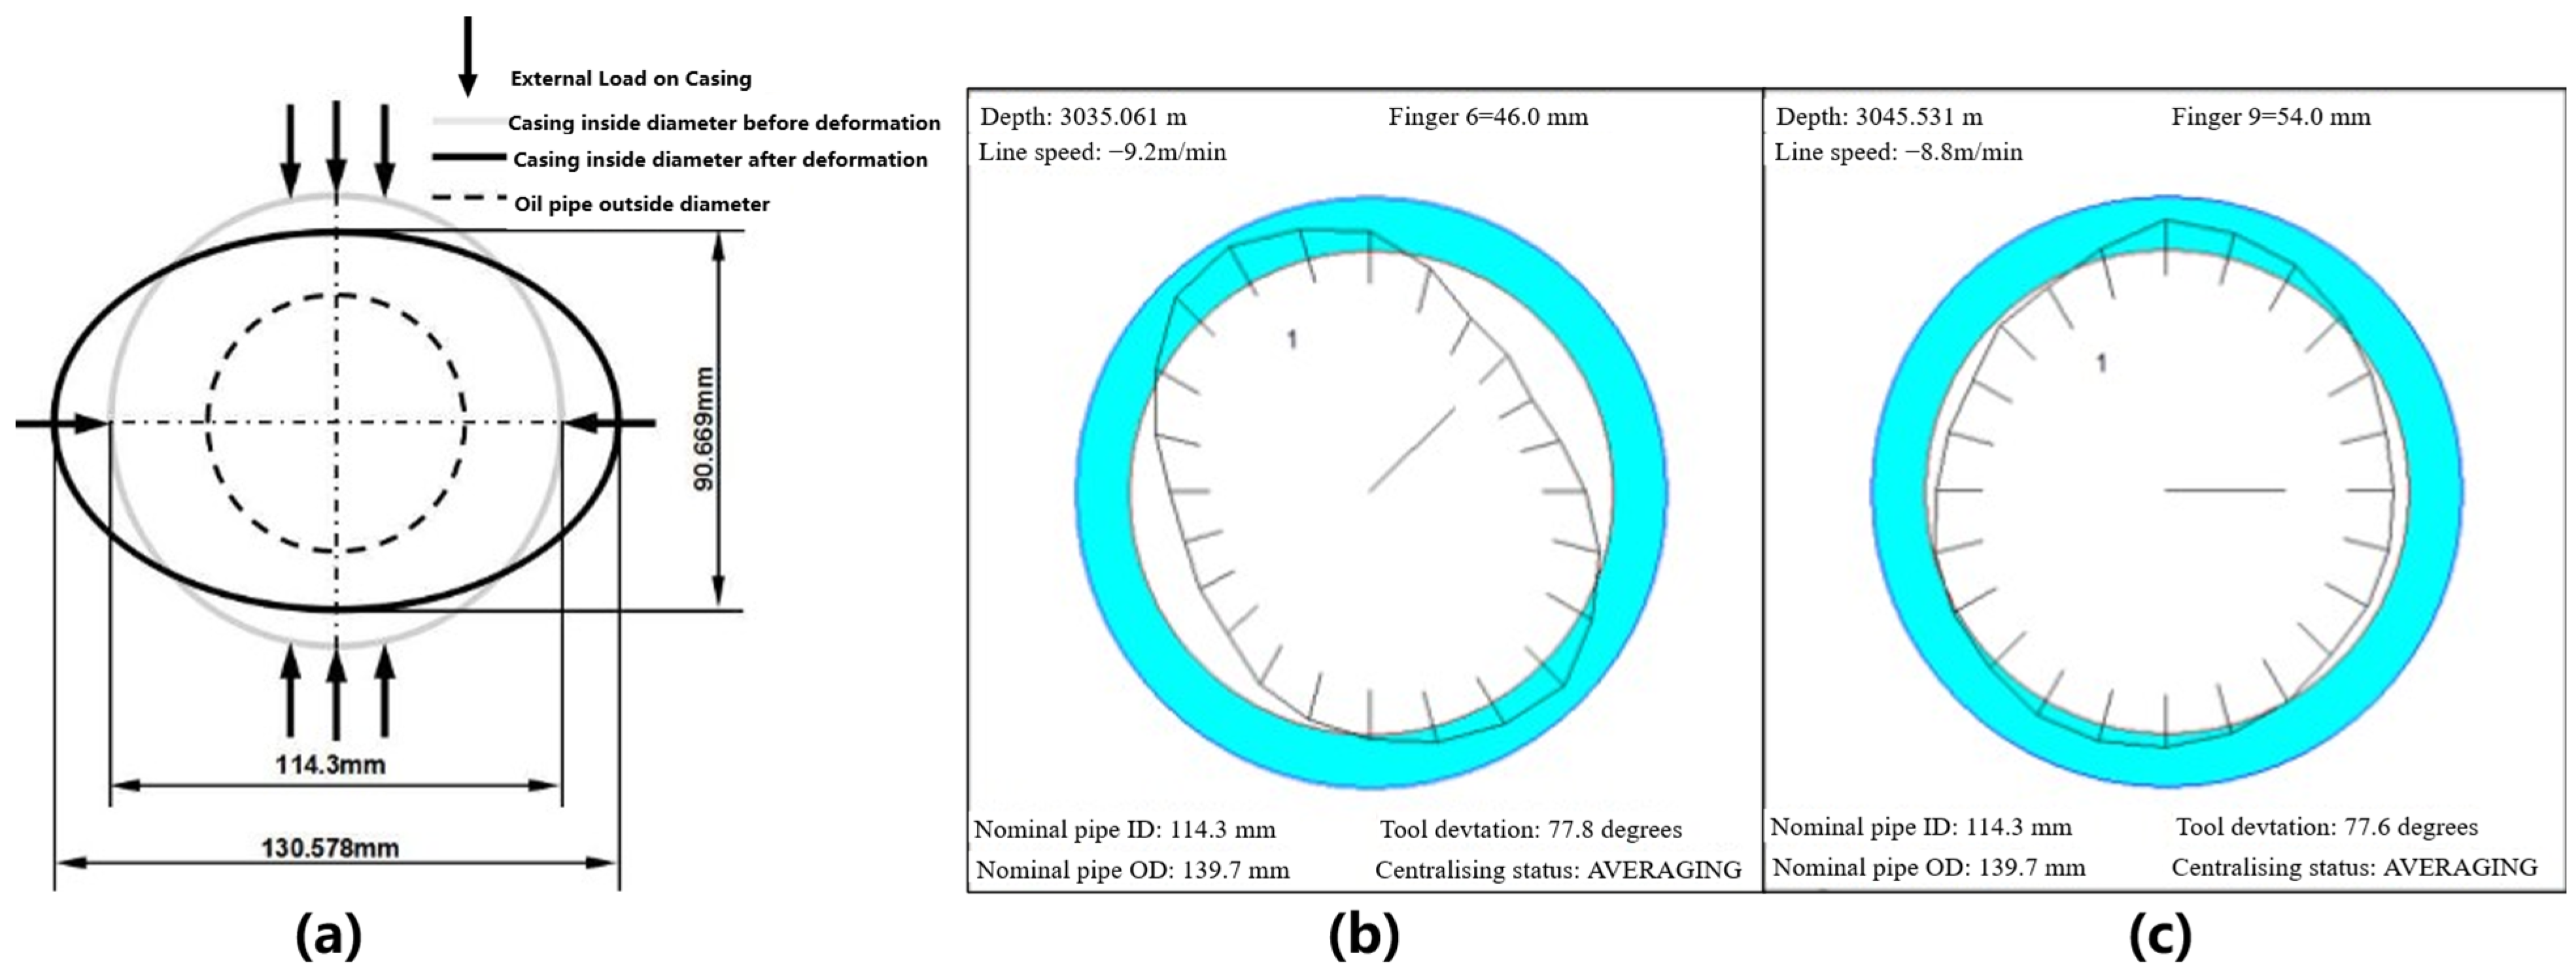
According to MIT24 multi-arm caliper logging data, the 139.7 mm casing has obvious deformation at 3028–3038 m and 3043–3047 m. The maximum deformation is at 3035.06 mm, the minimum inside diameter value reduces to 90.669 mm, and the degree of deformation is 20.67%. It belongs to level 3 deformation [15] the maximum well diameter is 130.578 mm, 114.3 mm beyond the nominal diameter of the casing, so it can be judged that the casing has been squashed due to the nonuniform external collapse load (The relevant casing deformation analysis is shown in Figure 4). No obvious deformation or damage are found in the other well sections of the casing, and the relation between the deformation section and the horizon and physical properties is not obvious. The specific conditions are shown in Table 1.
Figure 4.
Analysis of casing variation in N-2 well. (a) Casing deformation model. (b) The 3028–3038 m well section. (c) The 3043–3047 m well section.
Table 1.
N-2 well 139.7 mm casing MIT24 logging data.
3. Casing Stratum Creep Load Response Analysis
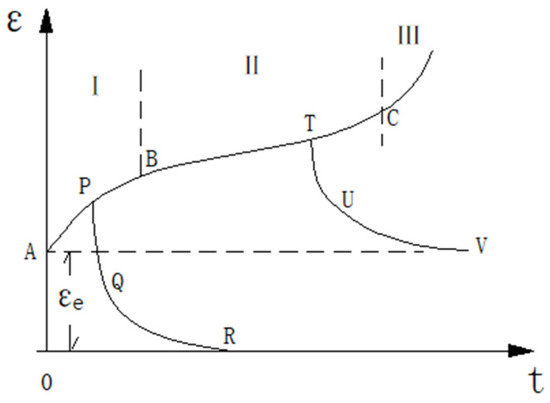
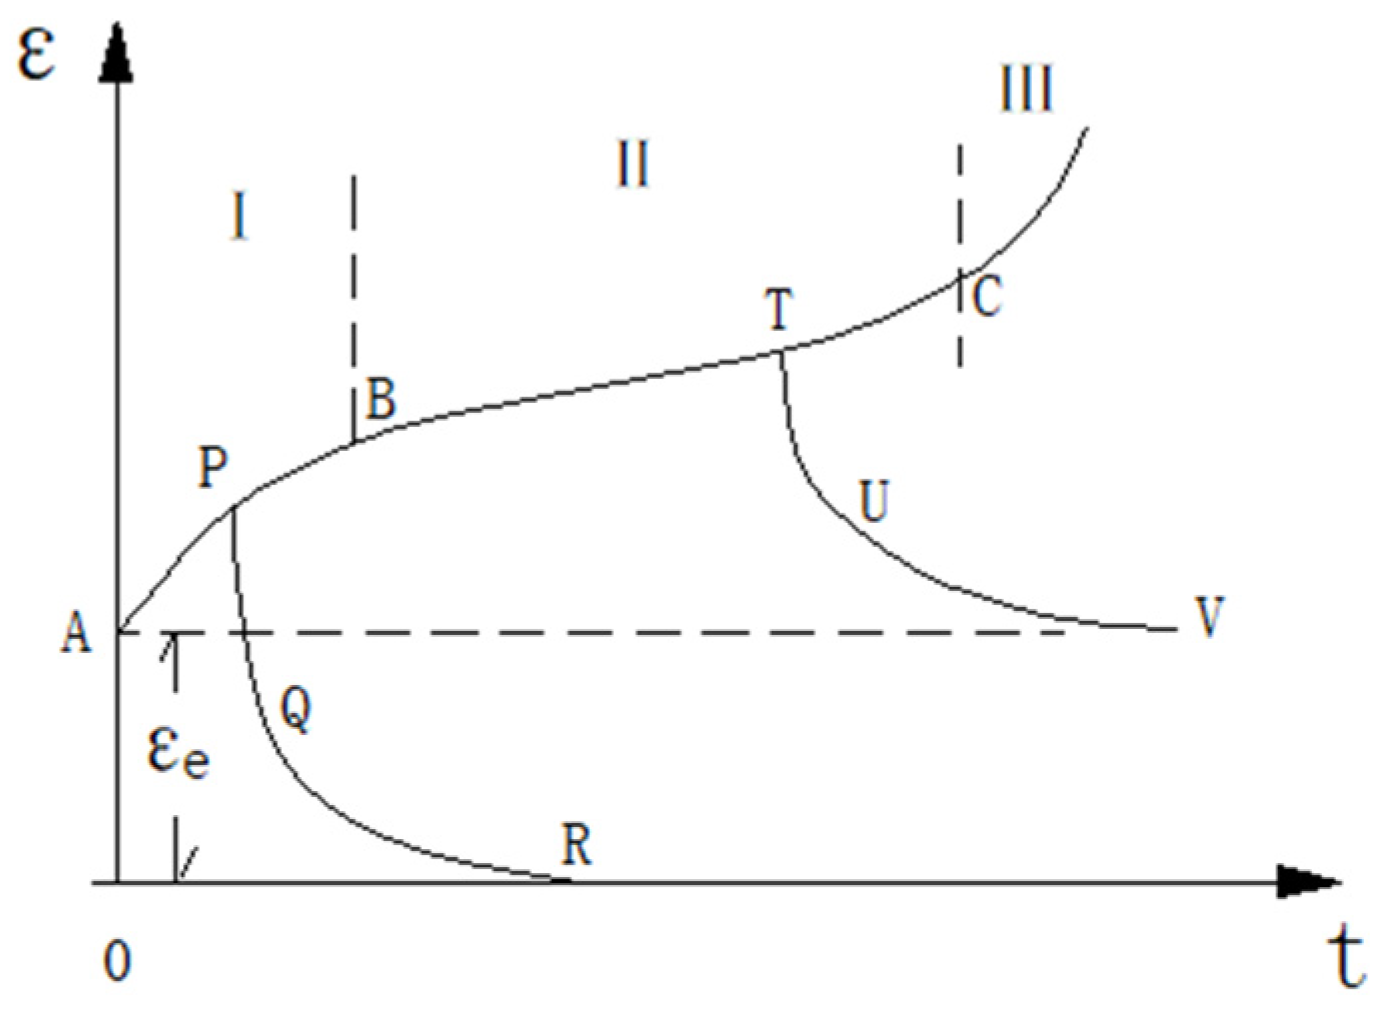
Stratum rock creep is an important reason for casing deformation. In order to make clear the response pattern of casing under stratum creep load, it is necessary to understand the characteristics of the stratum creep process. Creep refers to the phenomenon that the strain of solid materials increases with time when the external load remains unchanged [16,17]. Its deformation characteristics are shown in Figure 5.
Figure 5.
Rock creep curve.
In the Figure, the rock creep is divided into three stages [18]:
- (1)
- Initial creep (stage I): The strain increases with time and the strain rate decreases. If the stress drops to zero instantly, the strain–time curve develops along the path P–Q–R. The rock deformation disappears completely with time, without permanent deformation, indicating that the rock is still in the elastic stage.
- (2)
- Steady creep (stage II): The strain increases with time, and the rock appears plastic. If the stress is instantaneously reduced to 0, the strain–time curve develops along the path T–U–V. After a long period of time, the rock will still retain a deformation of the magnitude, that is, permanent deformation, indicating that it has entered the plastic stage.
- (3)
- Accelerated creep (stage III): The strain rate gradually increases, and the strain accelerates with time until damage occurs.
3.1. Uniform Creep Load Response
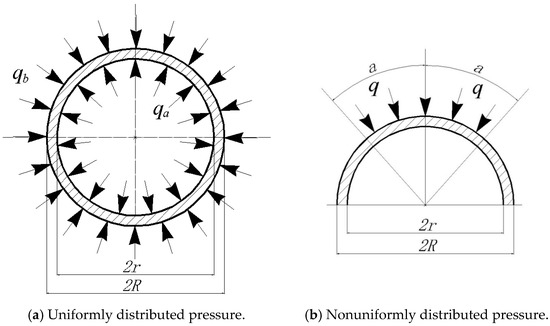
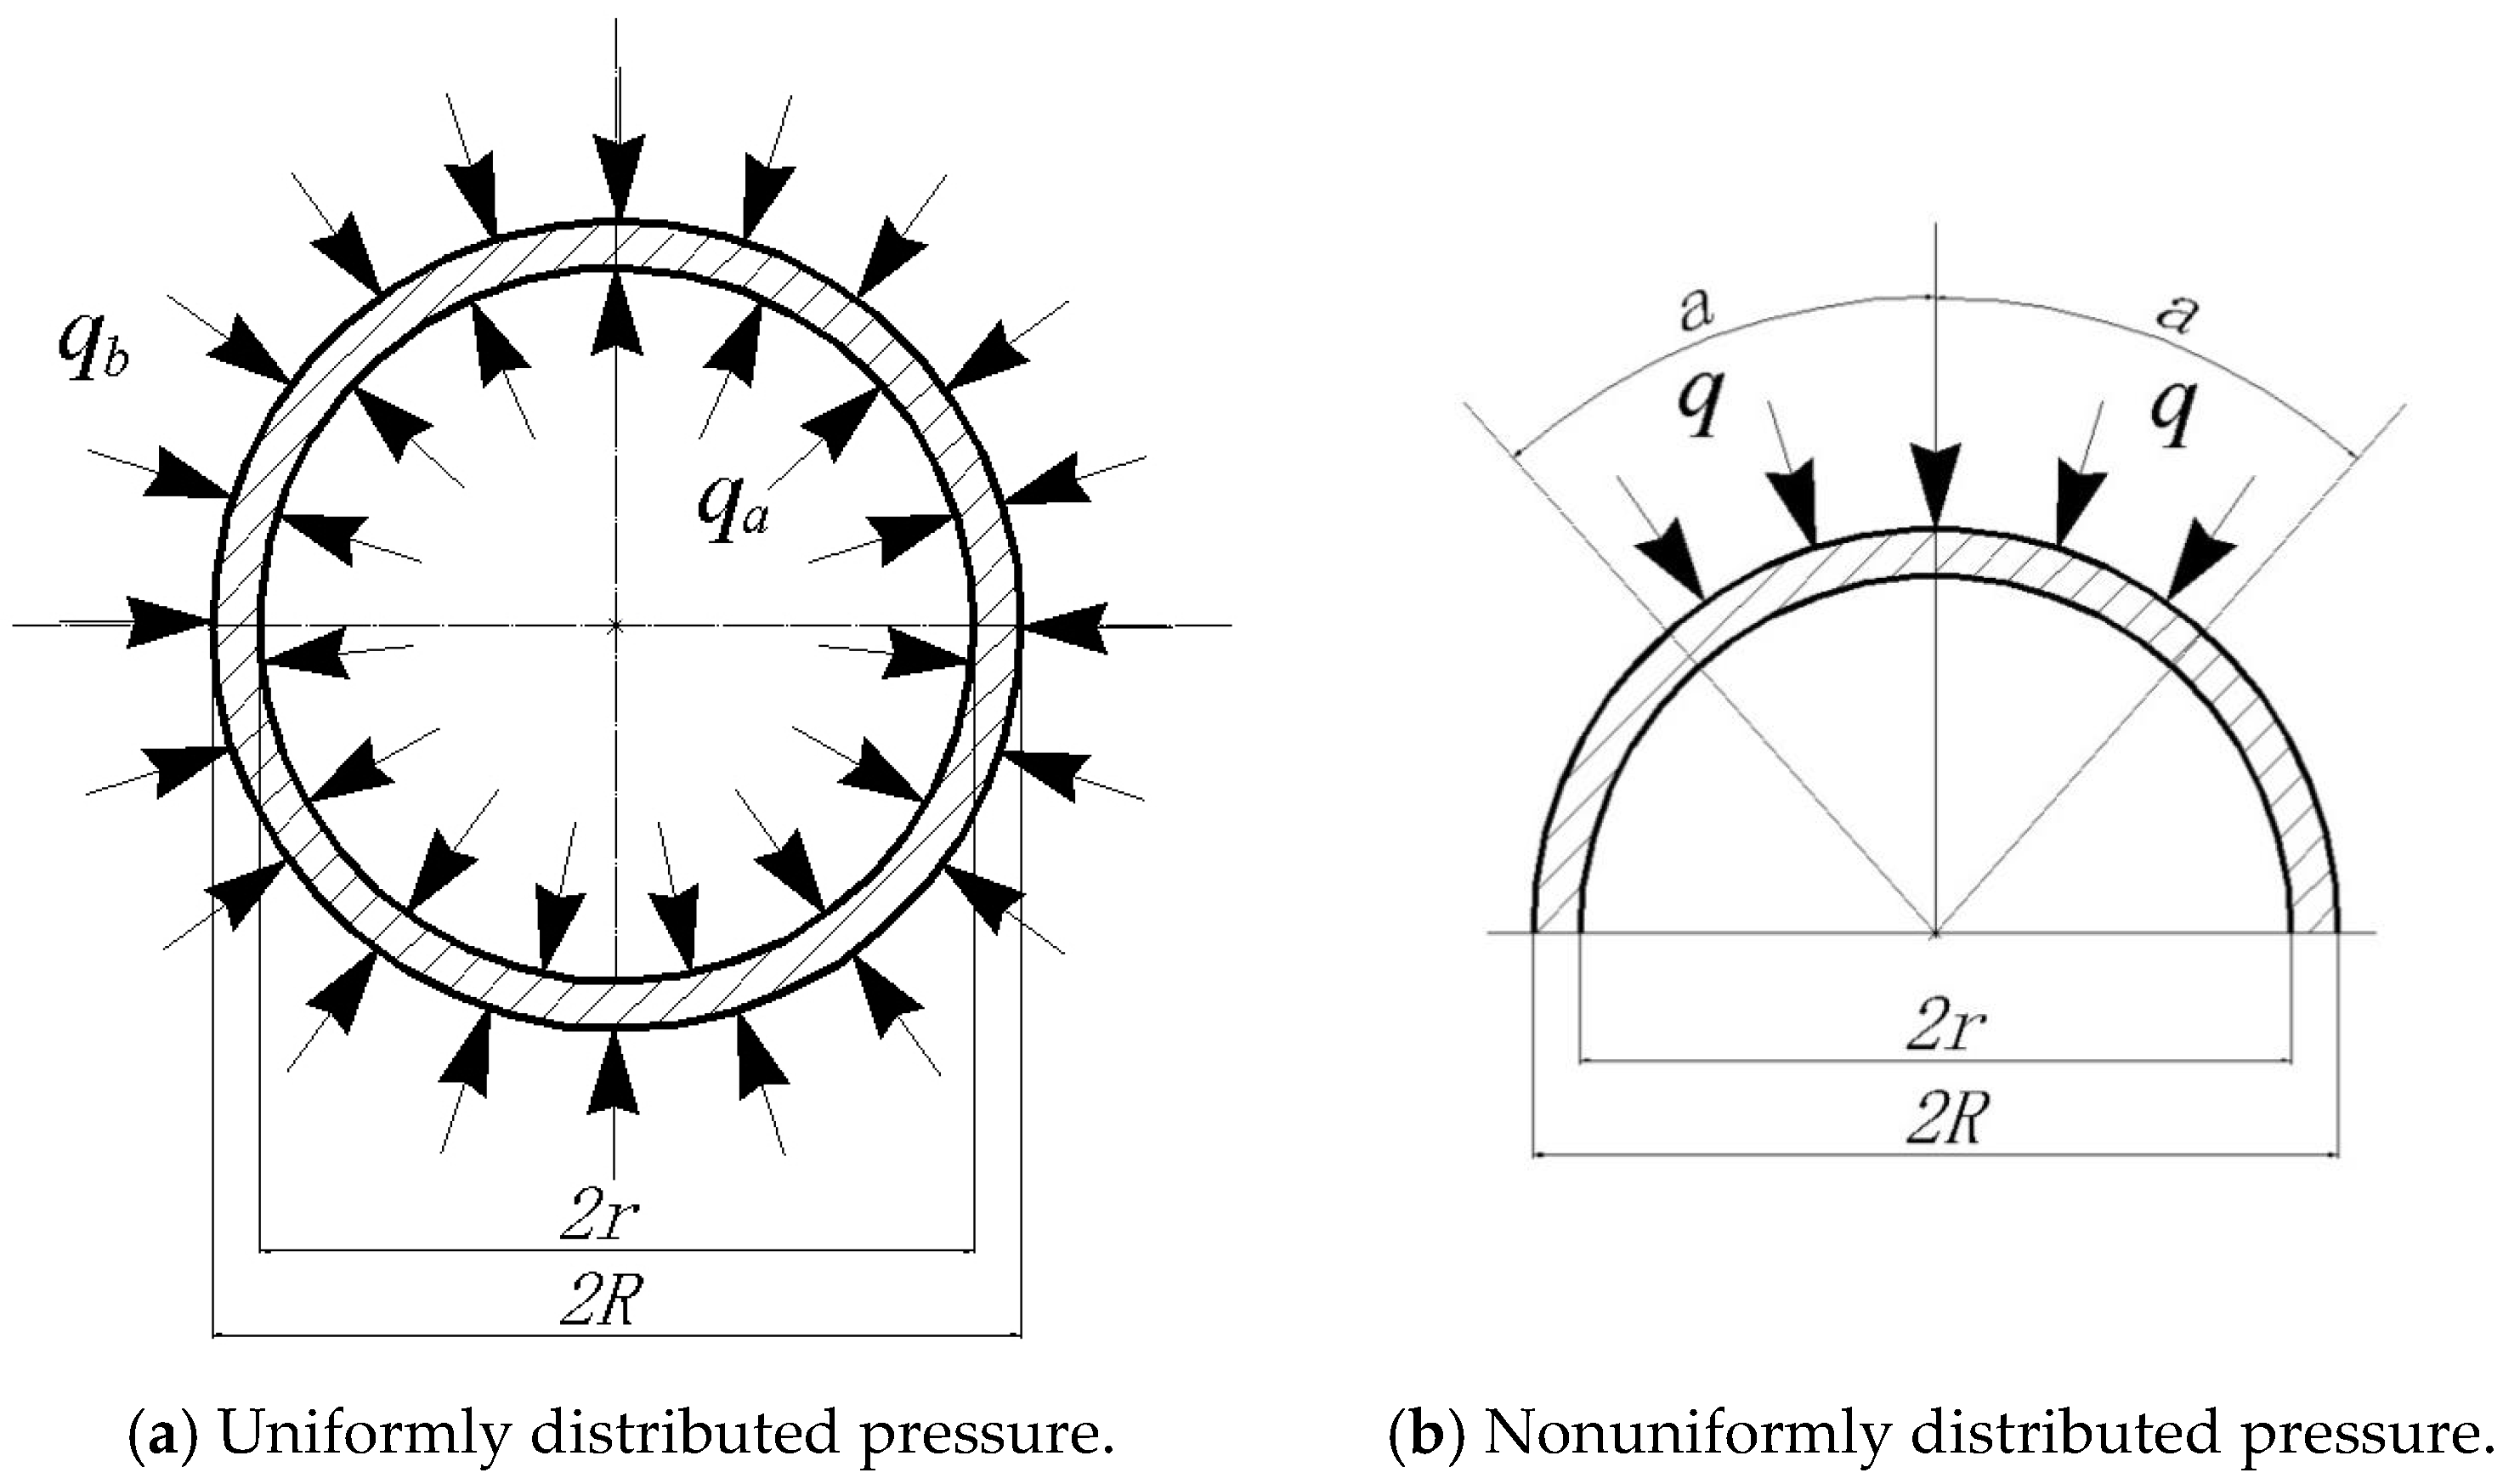
When the creep external collapse load on the casing is low or the nonuniformity is small, it can be calculated as a uniform load with a safety factor. As shown in Figure 6a, it is assumed that the casing is a uniform equal diameter cylinder with wall thickness , outer radius R, internal pressure of the casing , and external uniform creep load . The influence of the joint thread on the model’s mechanical behavior is not taken into account.
Figure 6.
Casing model stress.
Based on elastic mechanics, the stress component in the polar coordinate can be expressed as follows:
The boundary conditions are according to the following assumptions:
where —casing wall thickness, mm; —casing outer radius, mm;
—uniform internal pressure, MPa; —uniform external pressure, MPa;
—radial normal stress, MPa; — circumferential normal stress, MPa;
A, B, C—constant coefficient; —radial coordinates;
—shear stress acting on a surface perpendicular to the direction and along the direction, MPa;
—shear stress acting on a surface perpendicular to the direction and along the direction, MPa.
Based on Formulas (1)–(5), it is possible to draw the following:
To determine the constant coefficients A, B, and C, consider the displacement single value condition: in cylindrical polar coordinates, and are the same point.
where —circumferential coordinate; E—elastic modulus, MPa; H, I, K—constant coefficients.
From the displacement single value condition, B = 0 can be obtained, and the expressions of the casing under uniform internal and external pressure conditions can be obtained based on Formulas (6) and (7):
When the internal pressure generated by the medium inside the casing is to support the casing, the difference between the external pressure generated by the external creep load and the casing’s internal pressure is the actual uniform creep load on the casing. Therefore, in the case of , is effective uniform creep load:
3.2. Nonuniform Creep Load Response
The heterogeneity of creep loading is closely related to the reservoir lithology. As investigated by Yang et al. [19], the mechanical properties of continental fine-grained sediments in southwestern China exhibit significant variations based on lithological controlling factors. This provides a theoretical basis for the uneven formation loading observed in the Sichuan Basin shale reservoirs.
In actual engineering, the nonuniformity of the stratum creep load is often strong. According to the existing standards and methods, during equivalent uniform load calculation, a large safety factor is introduced to ensure the reliability of the engineering design. Such a design is too conservative, which compromises the construction efficiency and economy. Therefore, it is necessary to analyze the casing response under nonuniform creep load [20].
As shown in Figure 6b, it is assumed that the casing is a uniform equal diameter cylinder with a wall thickness , outside radius R, and intensity . The creep load is distributed on a circular arc with a wrap angle of 2. The effect of the joint thread on the model’s mechanical behavior is not taken into account. The stress analysis is performed according to 1/4 of the symmetrical model, and the center angle is used as a reference. The 1/4 model is further divided into two parts for analysis and solution. Since the normal stress on the inner wall of the casing is greater than other locations, the normal stress at any position on the inner wall of the model is used as the calculation target.
The stress expressions under nonuniform loads are derived from the general elasticity solutions (Equations (1)–(3)) by applying appropriate boundary conditions for the asymmetric loading case shown in Figure 6b. The distributed load over wrap angle is expanded in Fourier series as follows:
where the coefficients are
For each Fourier mode, the stress field is obtained by solving Equations (1)–(3) with the following boundary conditions:
The solution for the n-th mode takes the following form:
Applying the boundary conditions and considering only the dominant first harmonic () for engineering accuracy, we obtain the simplified expressions for hoop stress at the inner wall (). After rearranging and introducing the diameter–thickness ratio , these reduce to the piecewise forms given in Equations (17)–(22), with the transition at .
(1)
The model in this section is mainly subject to the circumferential force and bending moment. The response under only the bending moment is as follows:
where —circumferential coordinate;—concentrated external load, MPa; —casing diameter–thickness ratio, ; —concentrated external load wrap angle, °; the normal stress on the model under only the circumferential force is as follows:
Combining the above two situations, the total normal stress produced by the bending moment M and the circumferential force within the range of is:
(2)
The normal stress generated by the model under only the bending moment is as follows:
The normal stress generated by the model under only the circumferential force is as follows:
Combining the above two situations, the total normal stress produced by the bending moment M and the circumferential force within the range of is:
In summary, under nonuniform creep load, the expression of the normal stress on the inner wall of the casing 1/4 model is as follows:
3.3. Casing Creep Response Pattern
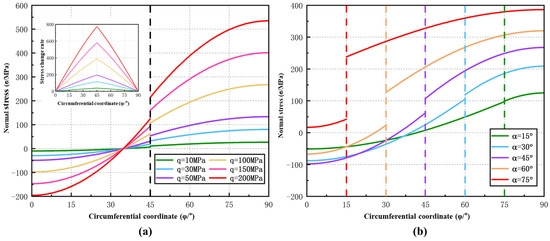
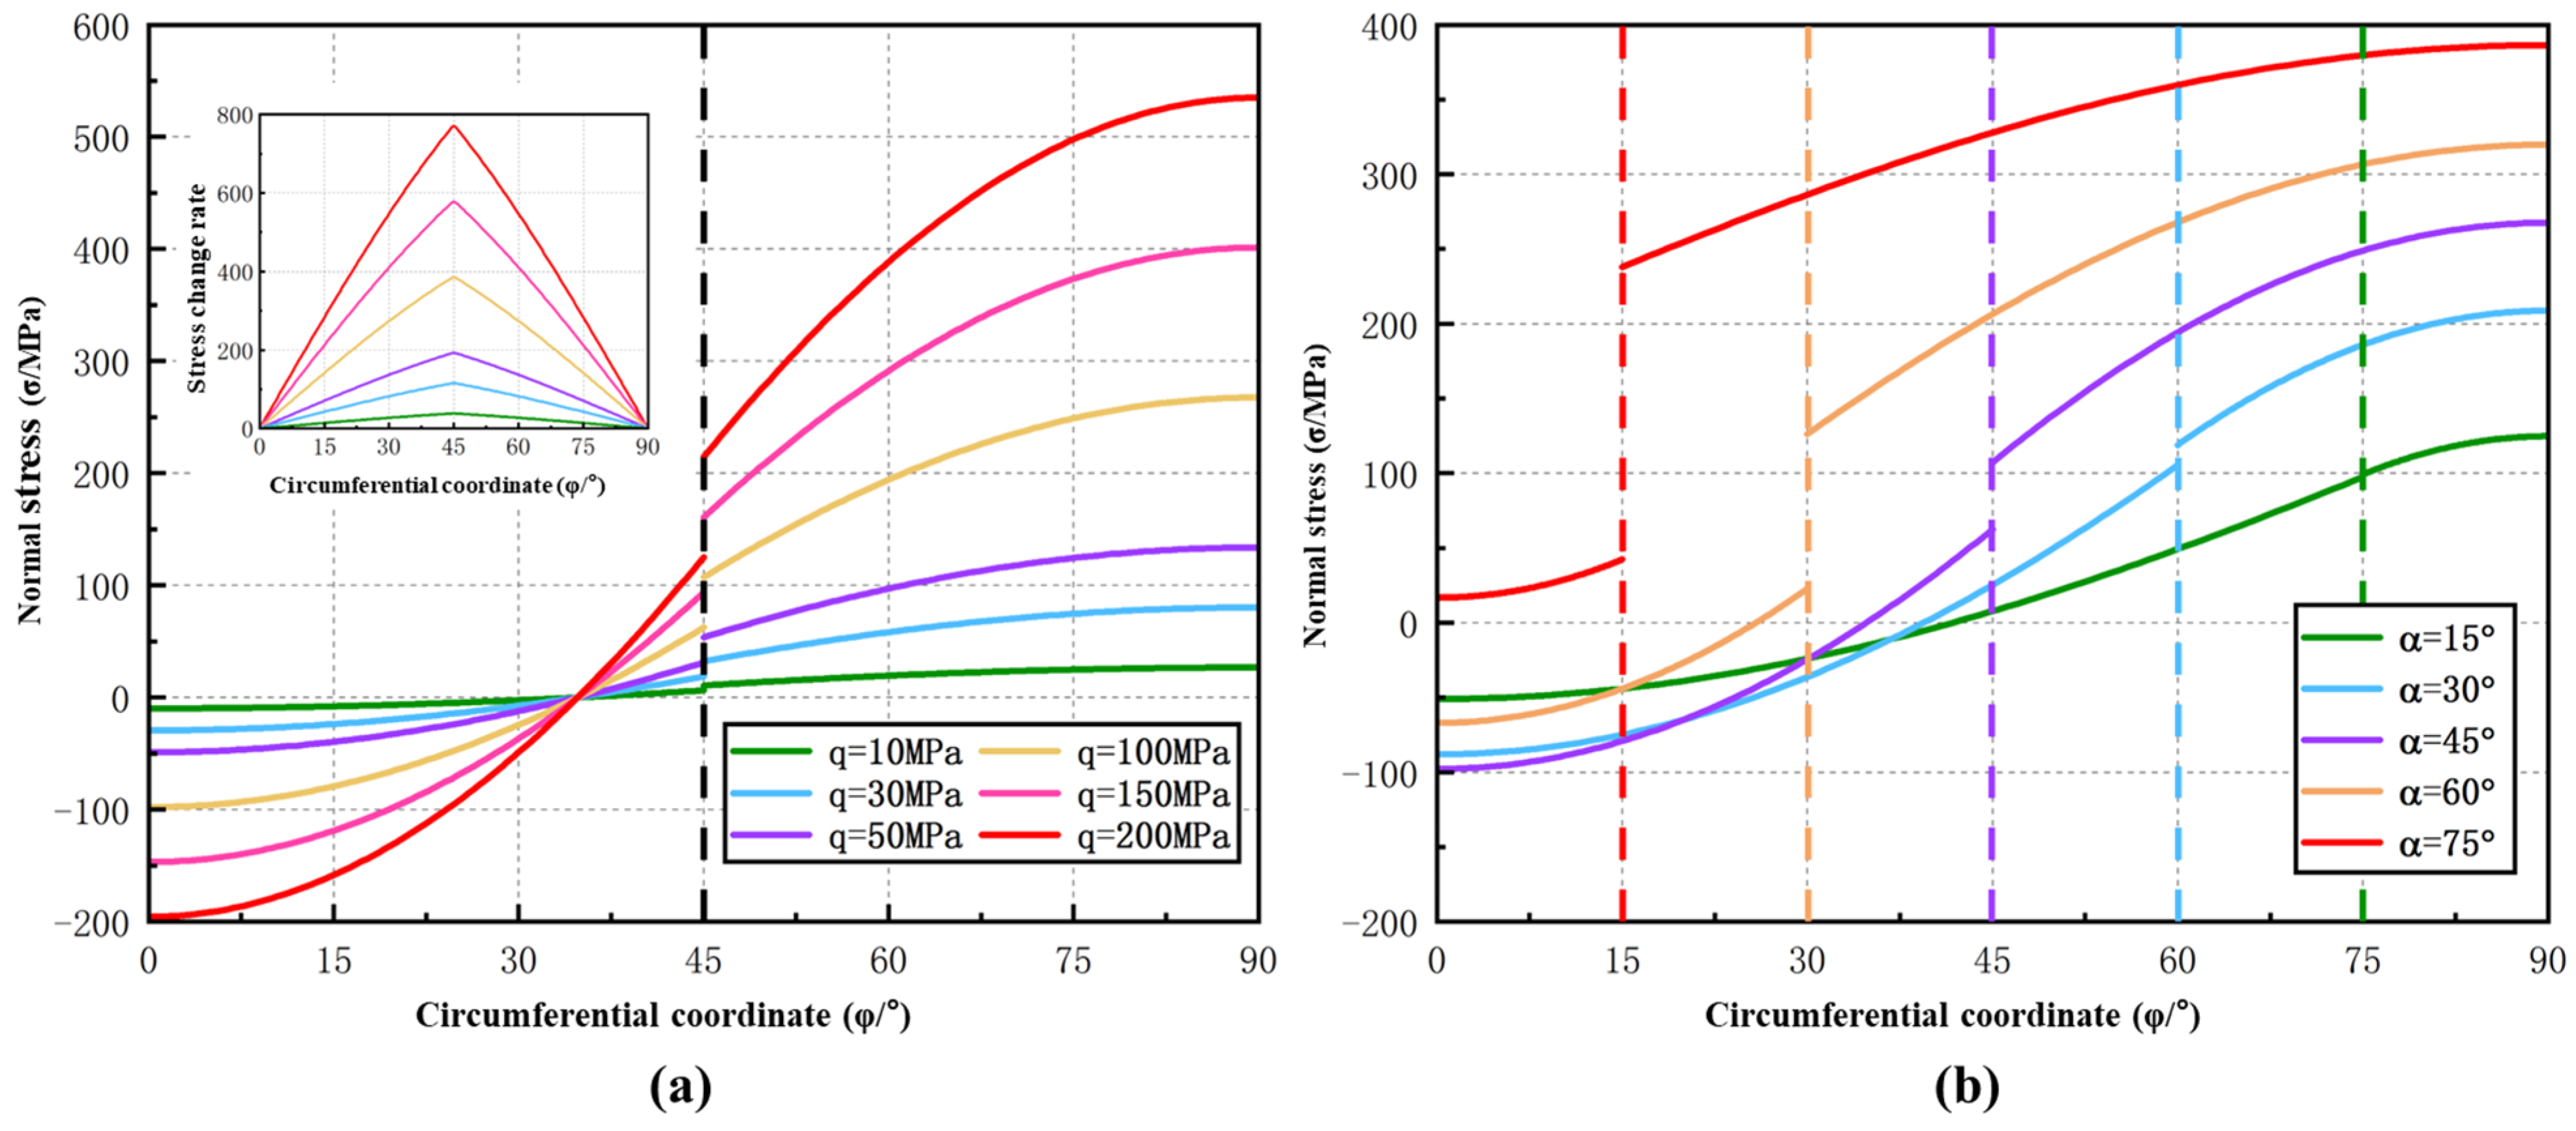
Figure 2 and Figure 3 show the response pattern of the casing’s normal stress with the circumferential coordinate. In Figure 7a, the fixed concentrated load wrap angle is . There is a step in the normal stress of the casing at the boundary of the concentrated load wrap angle. When the concentrated load increases, the absolute value of the normal stress on any circumferential coordinate increases, and the step phenomenon at the boundary of the wrap angle is more obvious. As the concentrated load increases, the peak force of the casing will go up and the load nonuniformity will also significantly improve. The nonlinearity of the stress change rate curve goes up with the increase in the concentrated load, further indicating that the concentrated load has a greater influence on the peak stress and nonuniformity. The fixed concentrated load is q = 100 MPa in Figure 7b; according to the Figure, the normal stress at any circumferential coordinate of the casing subject to the concentrated load goes up with the increase in the concentrated load wrap angle, and the rest is subject to the tensile stress when the concentrated load wrap angle is small. As the concentrated load wrap angle goes up, there is a process where the tensile stress gradually changes to compressive stress.
Figure 7.
Change pattern of normal stress with circumferential coordinate. (a) Concentrated wrap angle, 45°. (b) Concentrated external load, 100 MPa. (Note: In both plots, the vertical dashed lines indicate the position of the wrap angle (), marking the boundary of the non-uniform load application region where stress discontinuities occur).
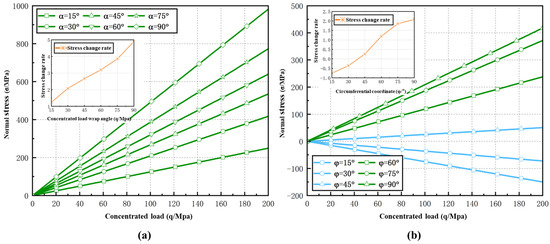
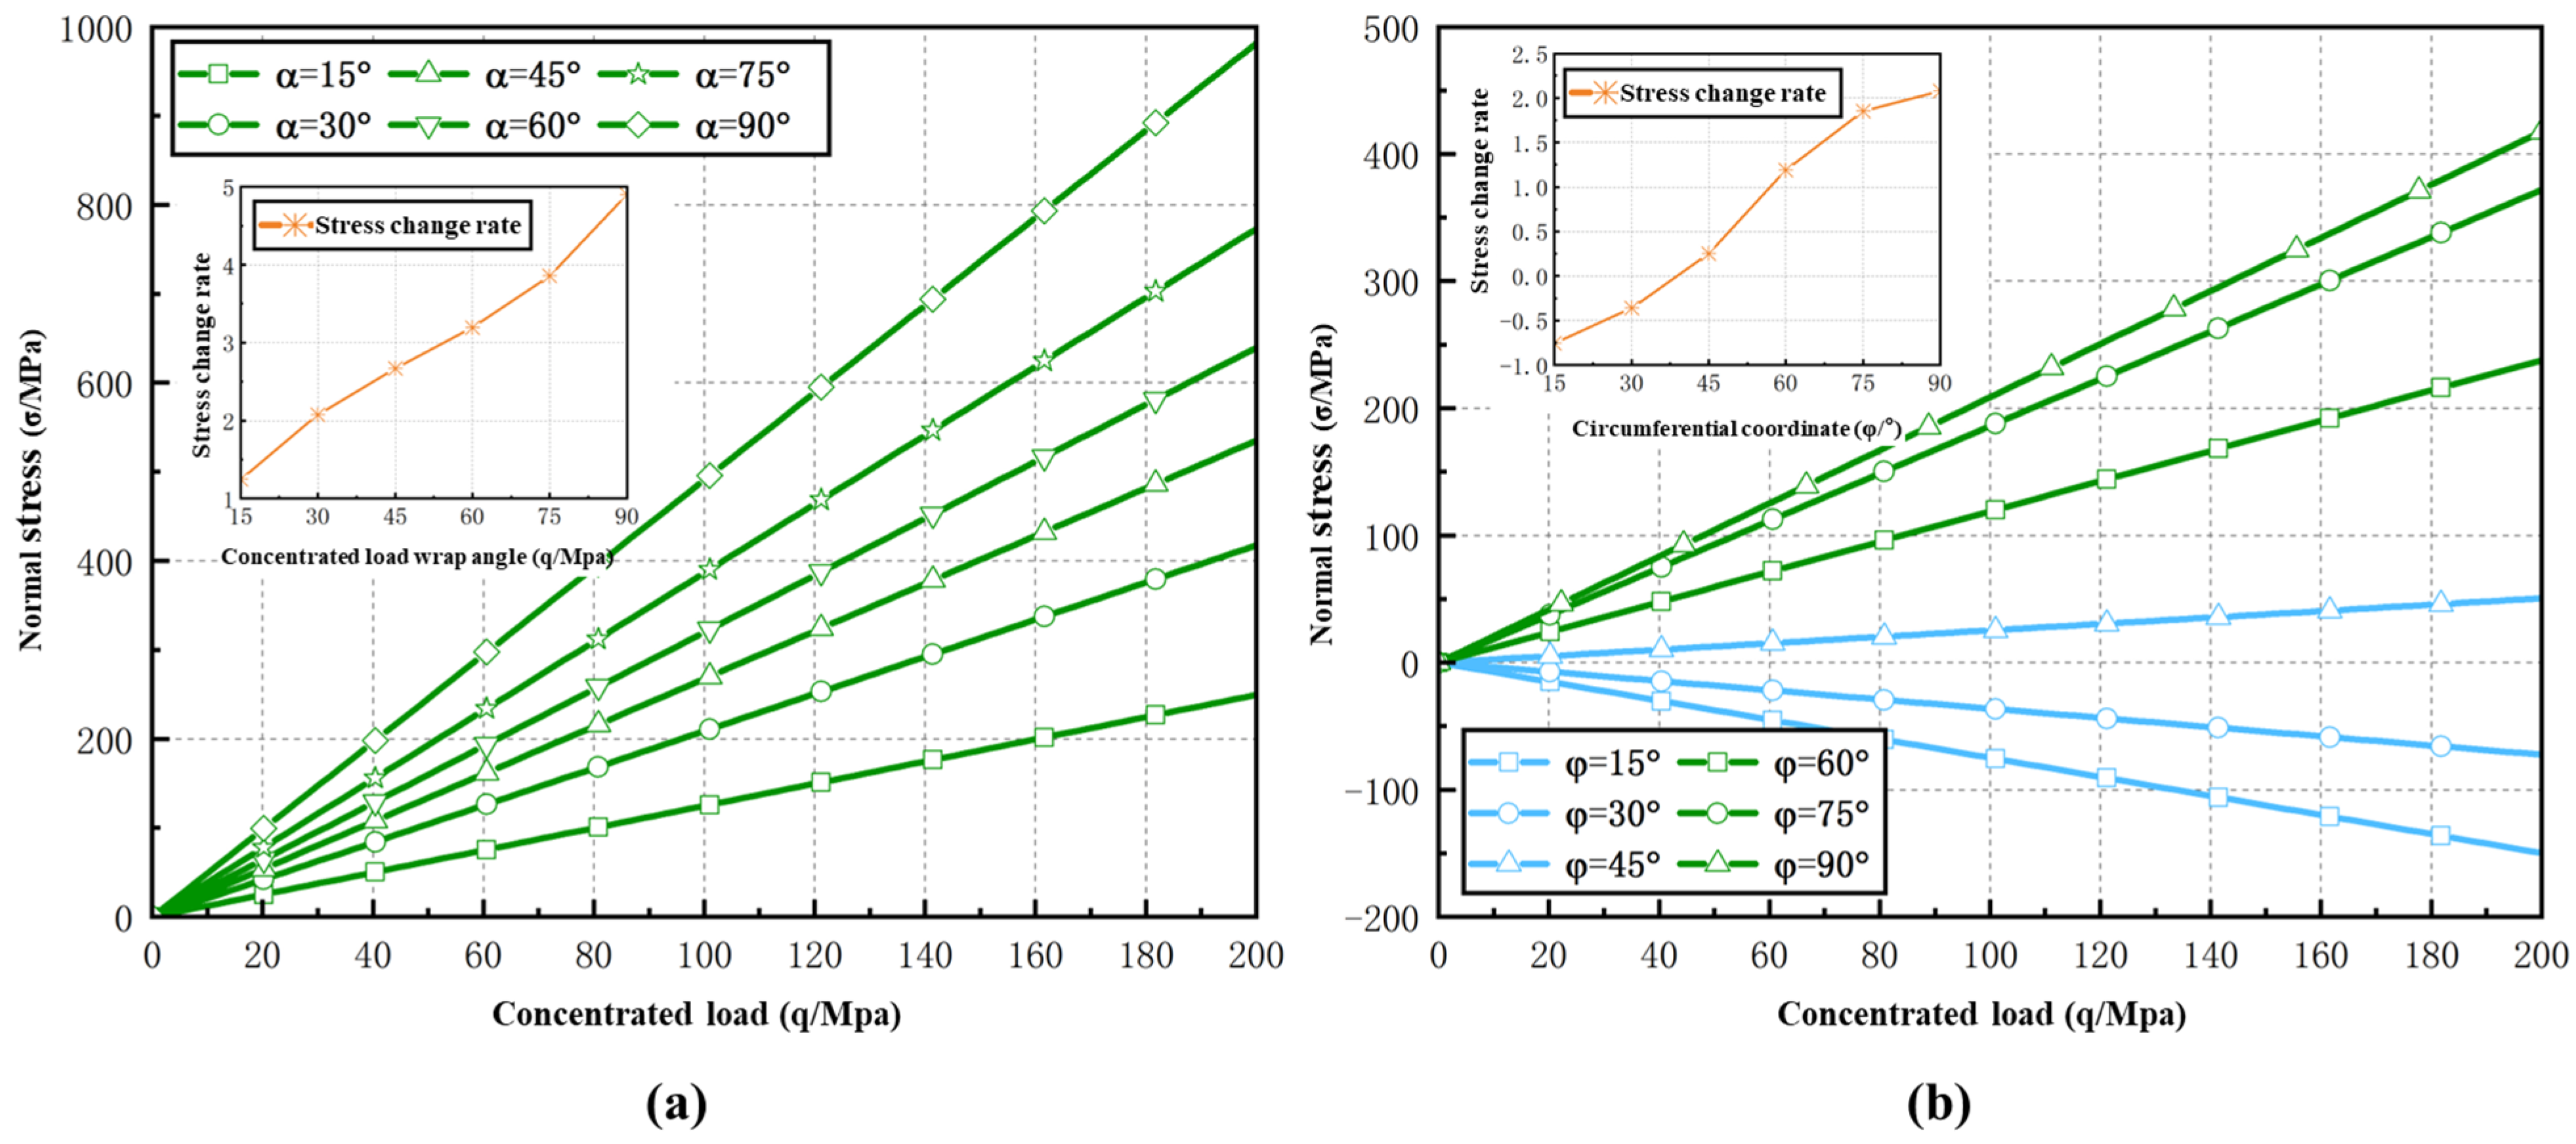
Figure 8 shows the response pattern of the casing’s normal stress with the concentrated load. Figure 8a is the hoop coordinate. In Figure 8a, at the circumferential coordinate , since the concentrated load is applied regardless of the concentrated load wrap angle, the normal stress of the casing is always positive and has a linear relation with the concentrated load. When the concentrated load wrap angle goes up, the normal stress at increases accordingly. In Figure 8b, the fixed concentrated load wrap angle is . The normal stress at any circumferential coordinate of the casing has a linear relation with the concentrated load. Based on the stress change rate curve, the stress change rate at the boundary of the concentrated load wrap angle is most significant. It means that the stress nonuniformity here is most significant.
Figure 8.
Change pattern of normal stress with concentrated load. (a) Concentrated external load, 100 MPa; (b) circumferential coordinates, 0 and 90°.
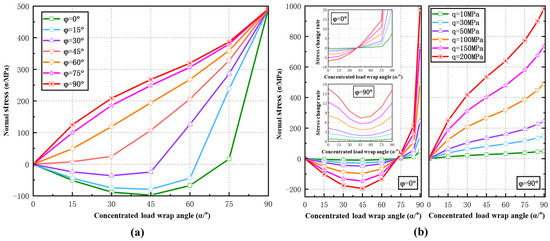
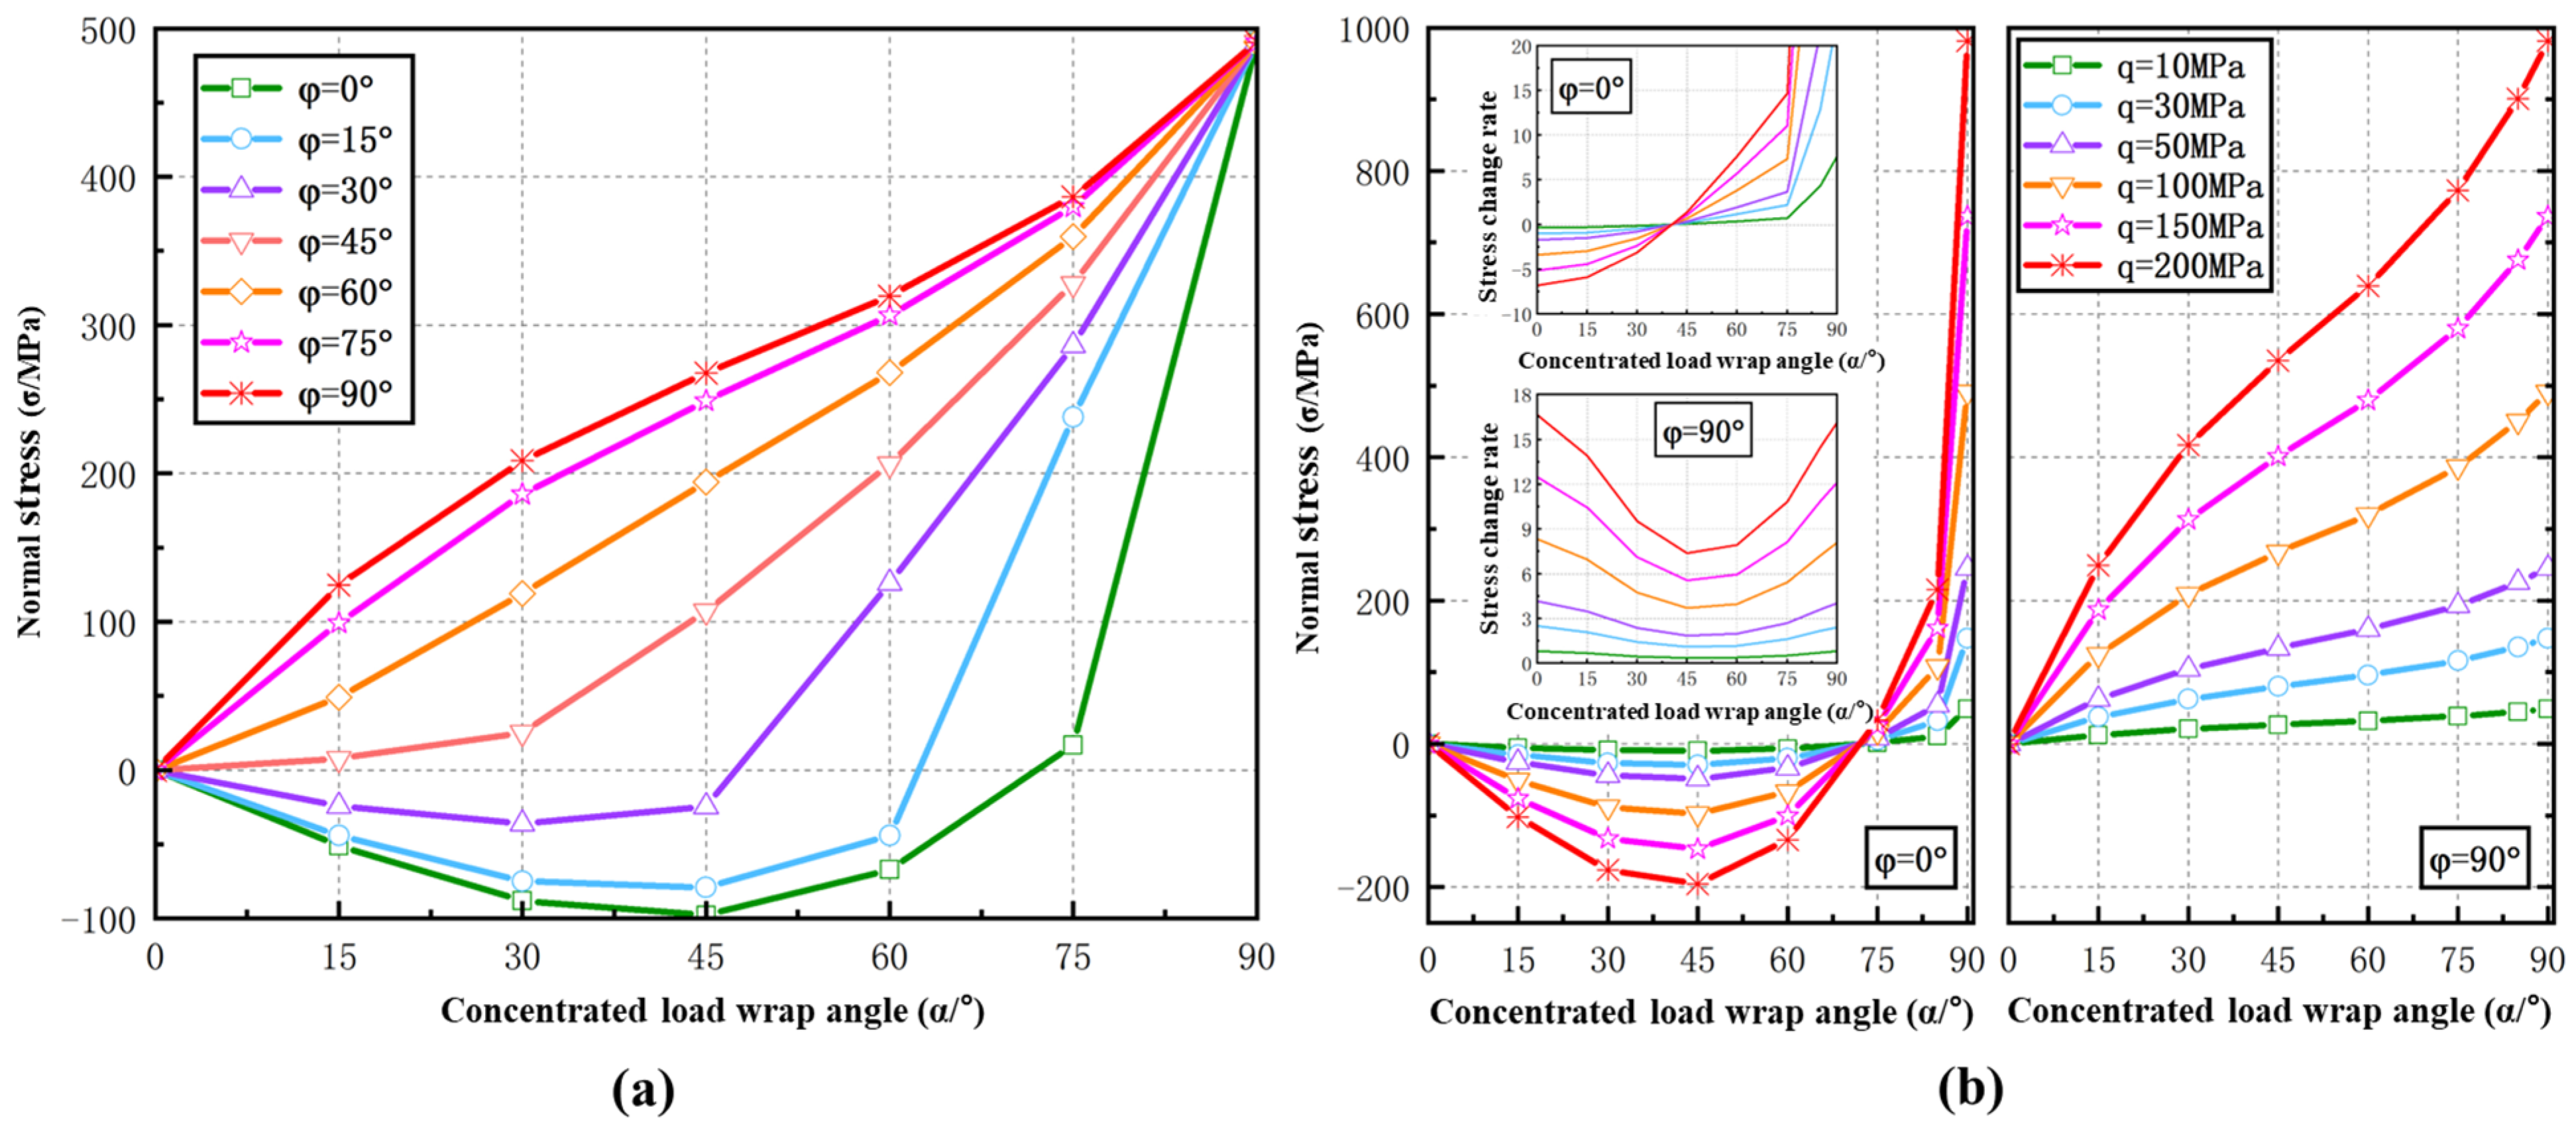
Figure 9 shows the change pattern of the casing’s normal stress with the concentrated load wrap angle. In Figure 9a, the fixed concentrated load is q = 100 MPa, and the smaller the circumferential coordinate is, the more obvious the nonlinear relation between the casing’s normal stress and the concentrated load wrap angle is; when the circumferential coordinate is below , the normal stress gradually transits from tensile stress to compressive stress. Figure 9b shows the stress change pattern during the circumferential coordinates and . According to the Figure, as the concentrated load wrap angle increases, the normal stress of the casing deforms more and more significantly. When the concentrated load wrap angle is greater than during , the stress on the casing transits from tensile force to compressive force, and the growth rate of the stress increases significantly. This phenomenon becomes more significant as the concentrated load increases. The casing stress and the concentrated load wrap angle are basically linear during . According to the stress change rate curve, the critical point of the stress change rate is at when the concentrated load wrap angle is approximately , and the overall nonlinearity is strong. The nonlinearity of the stress change rate during gradually goes up with the increase in the concentrated load, and the overall nonlinearity is weak. The overall change in the normal stress of the casing is large during , but the nonlinearity is weak. The overall change in the normal stress of the casing is small during , but the nonlinearity is strong. Therefore, even the area that the concentrated load indirectly affects is more likely to be damaged.
Figure 9.
Change pattern of normal stress with concentrated wrap angle. (a) Concentrated external load, 100 MPa; (b) circumferential coordinates, 0 and 90°.
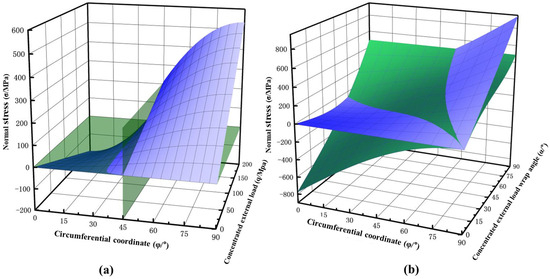
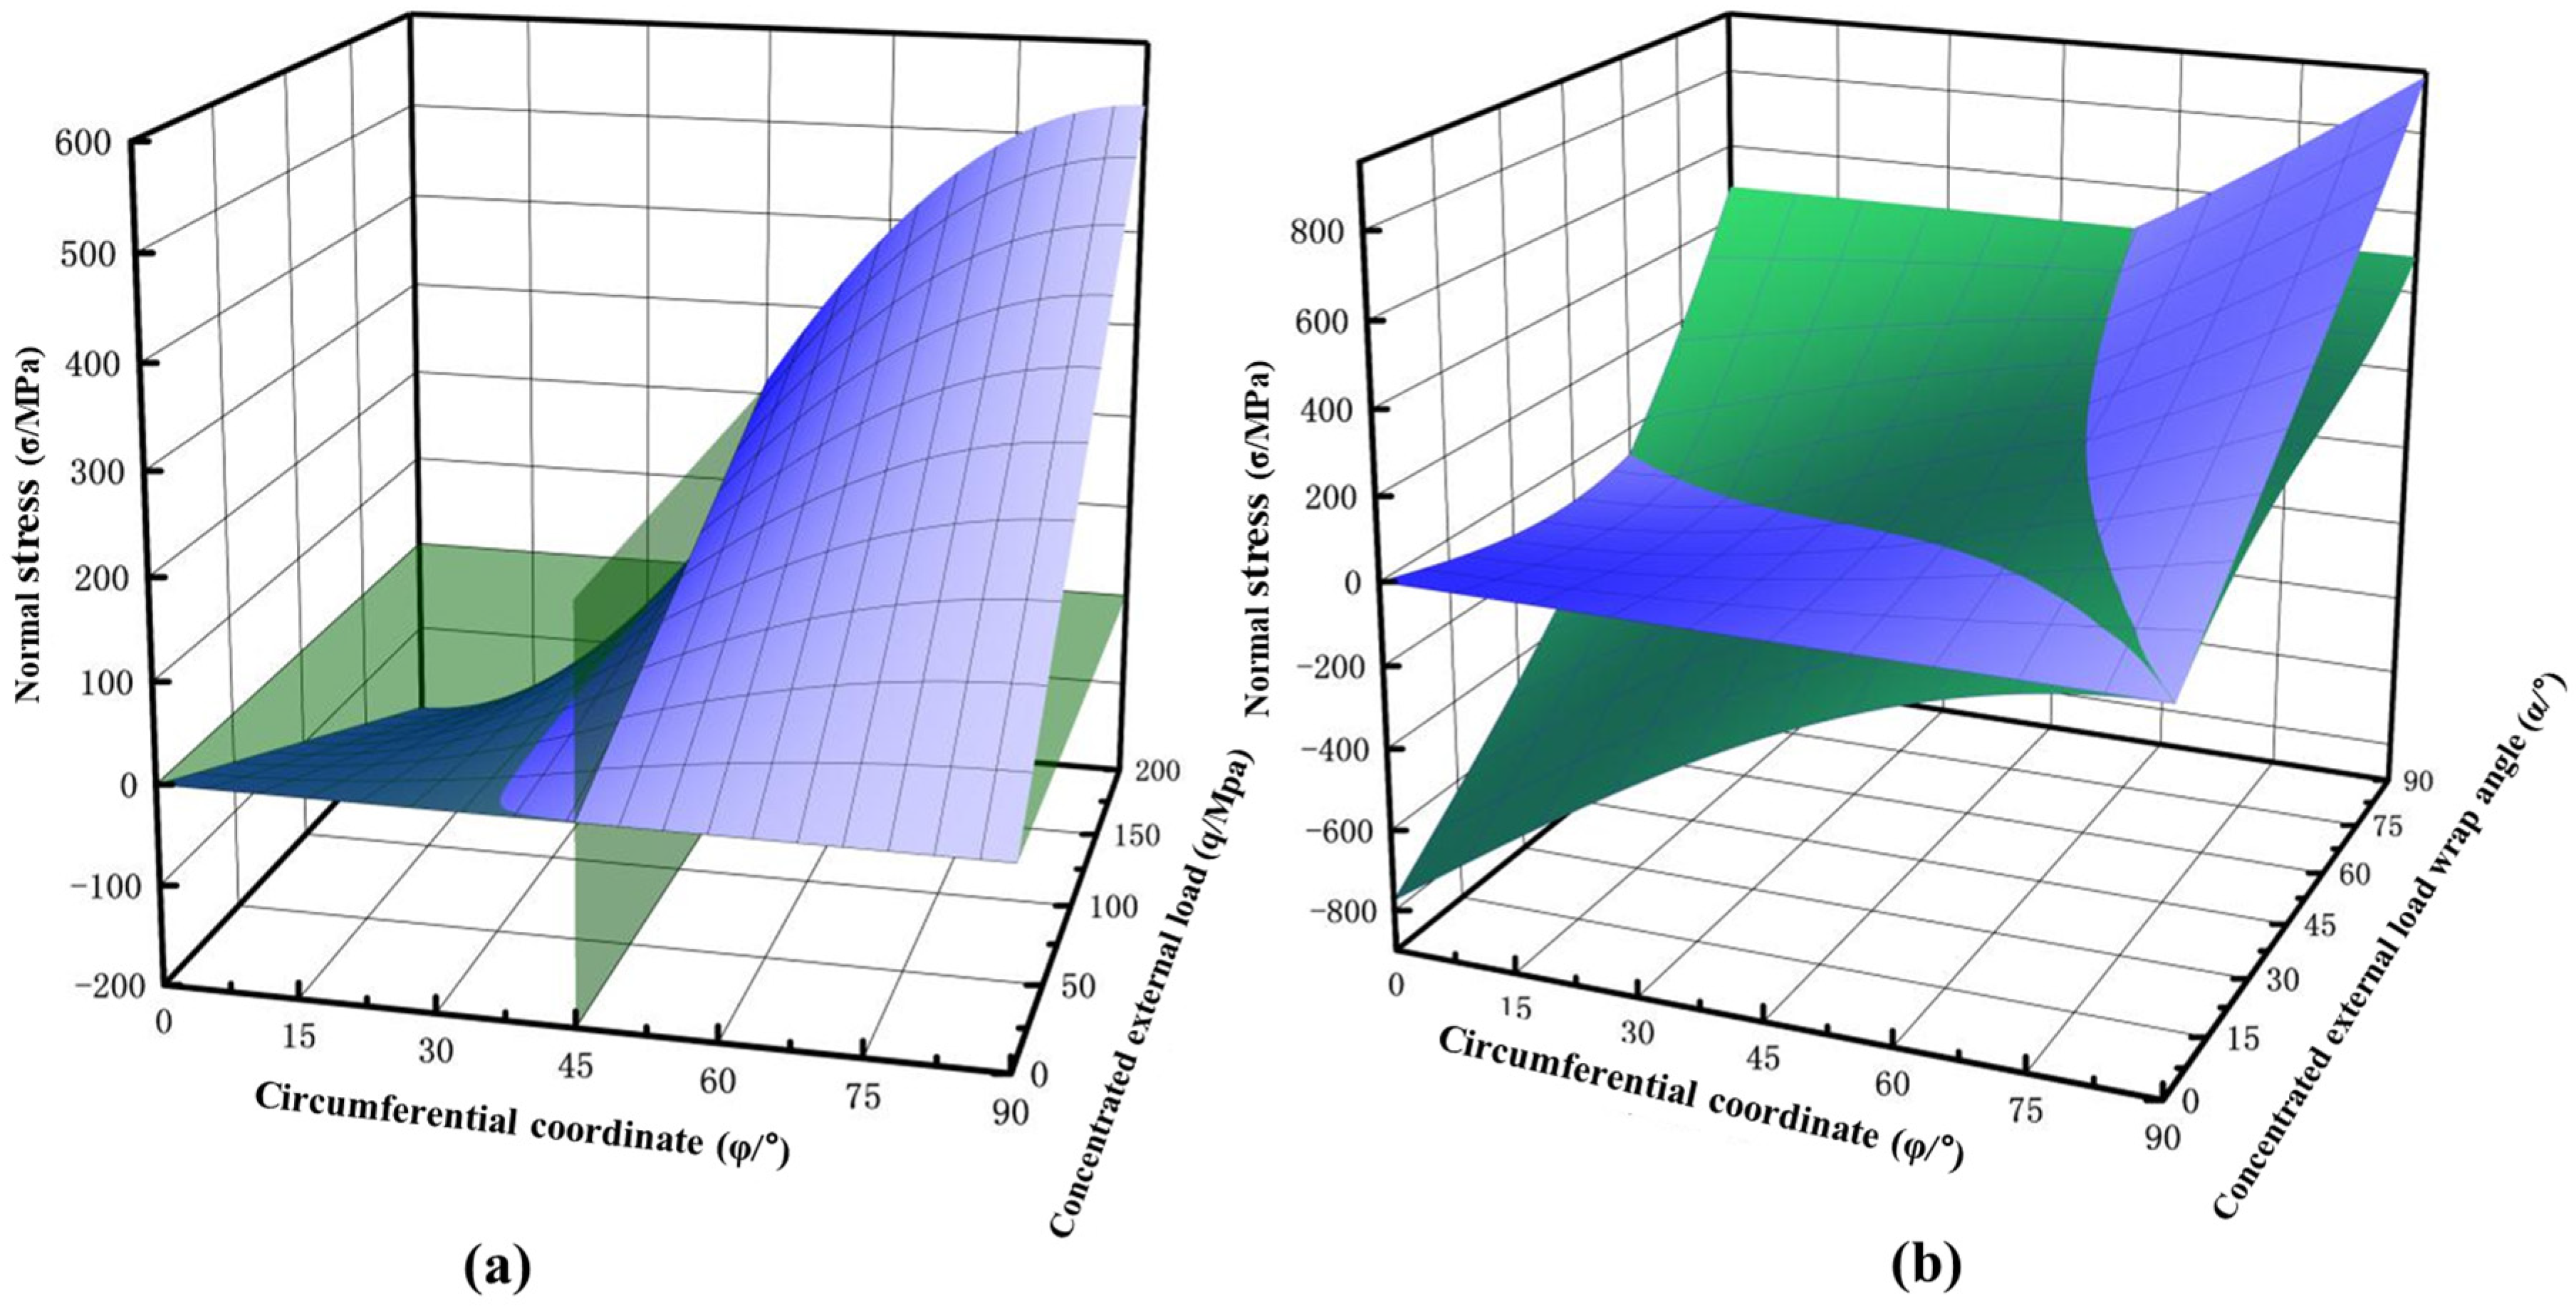
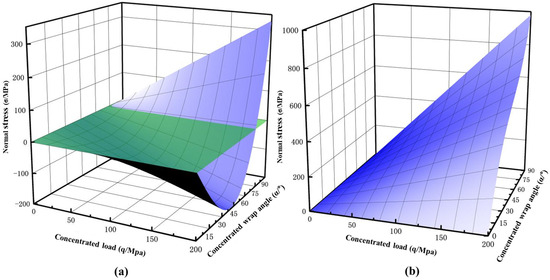
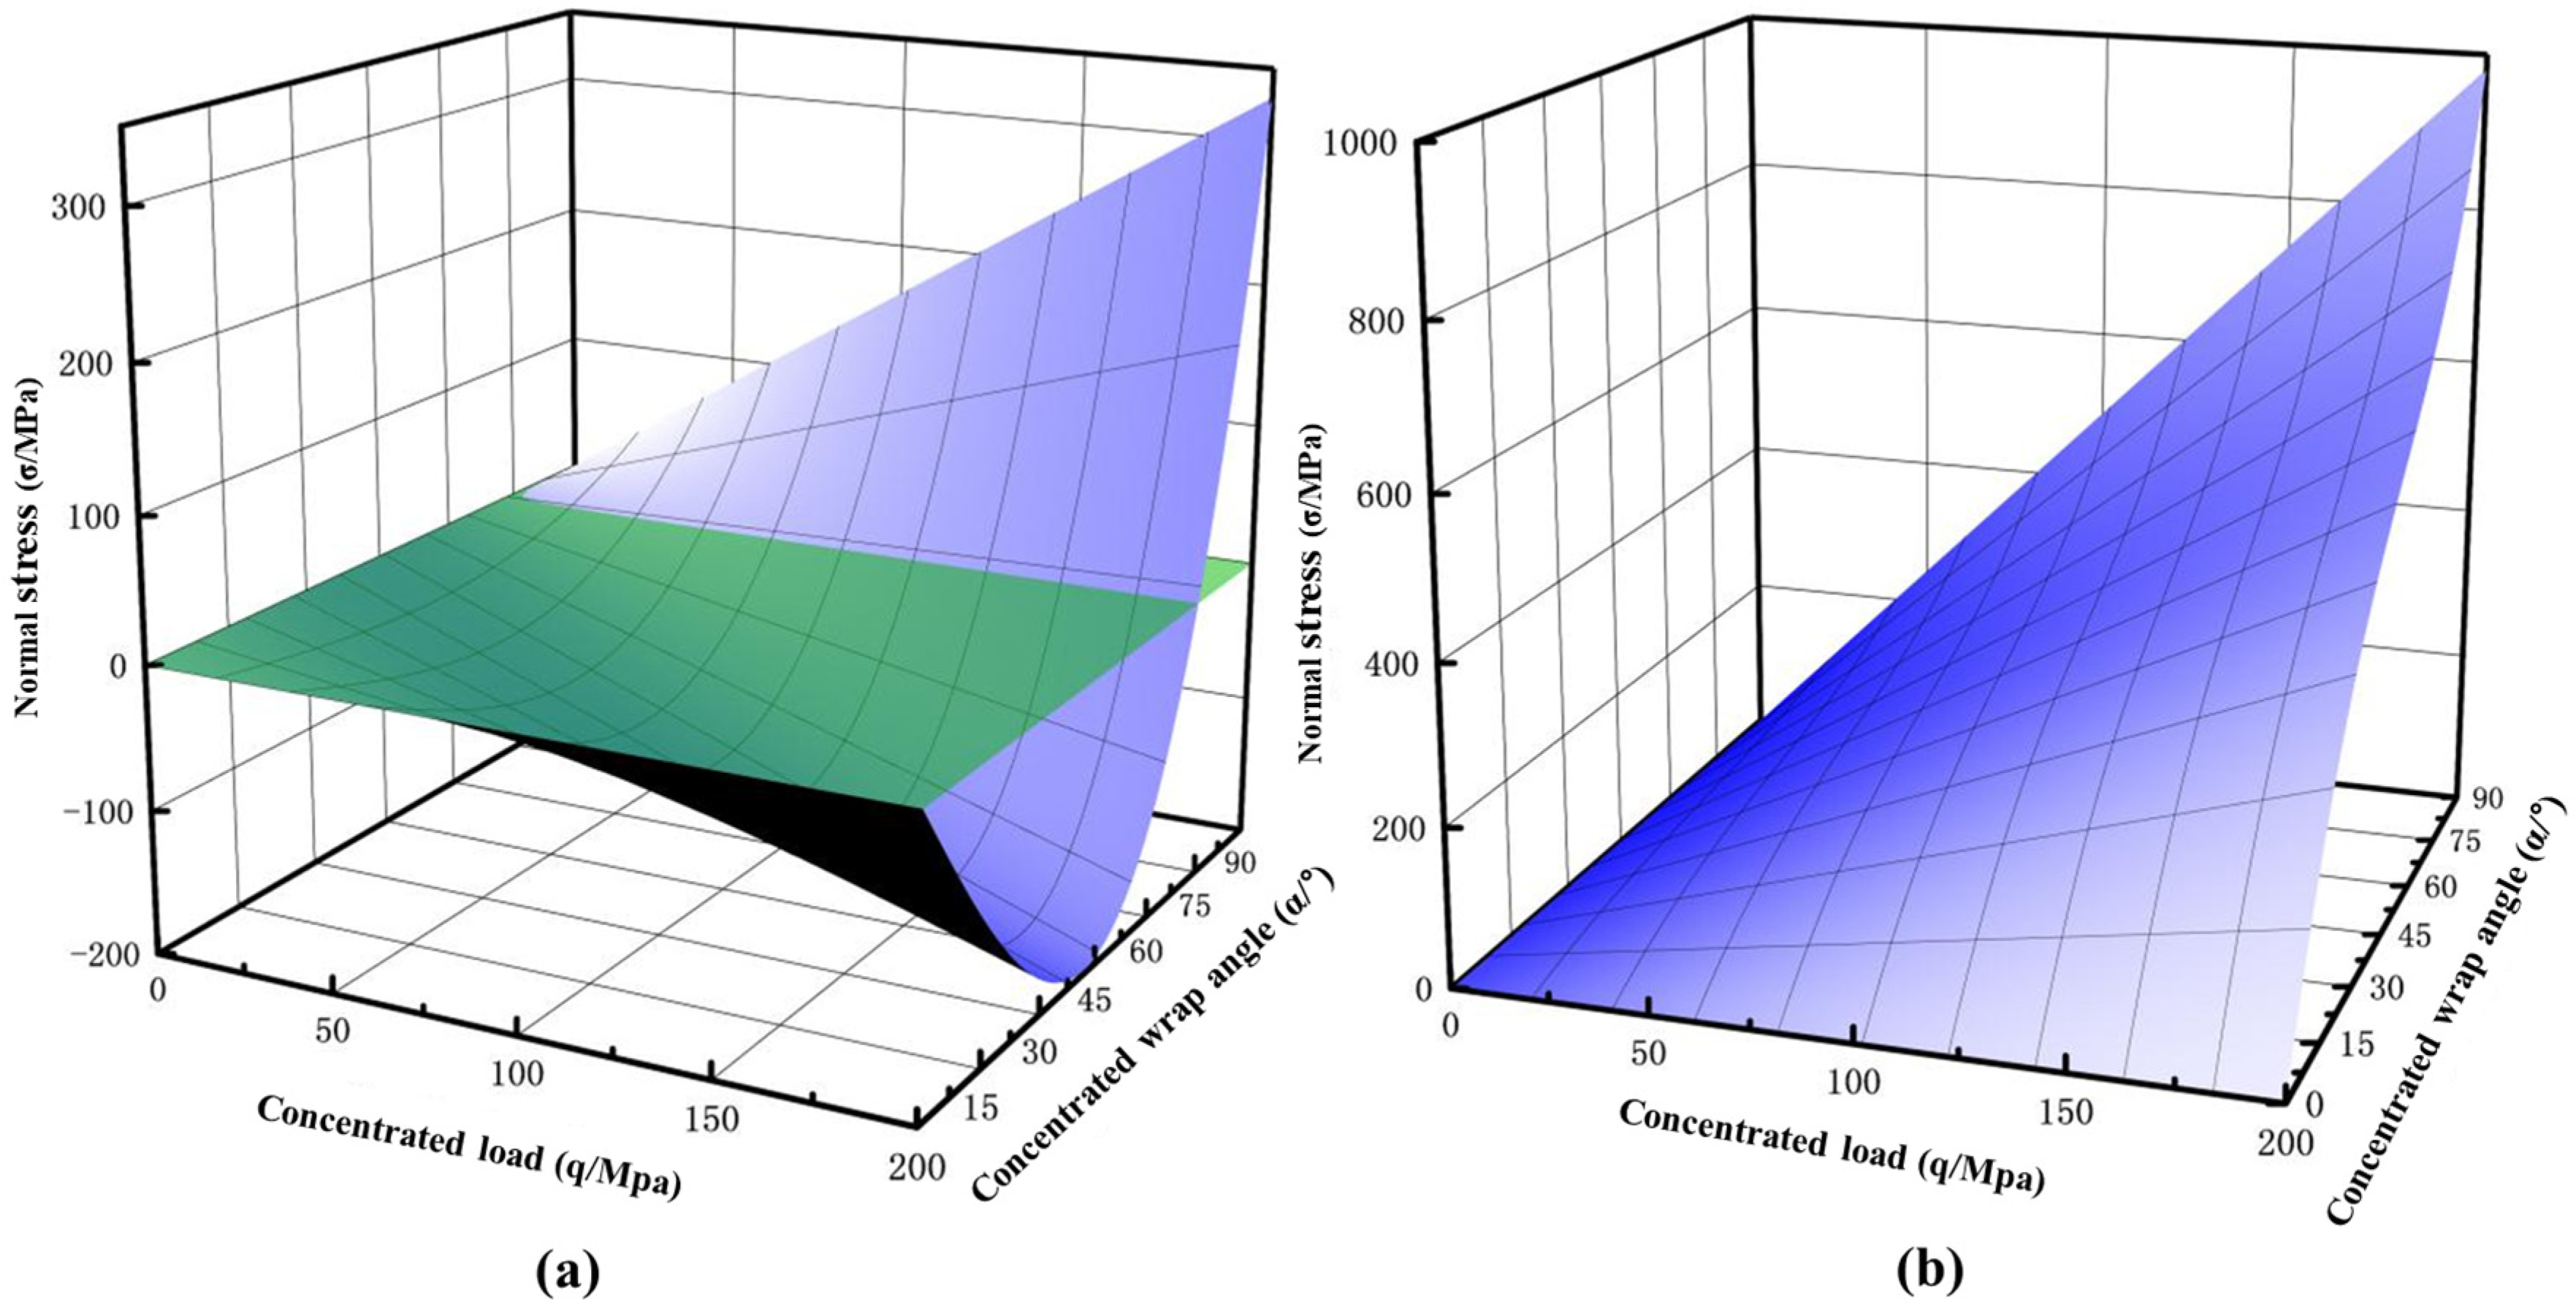
Figure 10 shows the influence of the circumferential coordinate and concentrated load distribution on the casing’s normal stress. In Figure 10a, the fixed concentrated load wrap angle is , the rising concentrated external load not only increases the normal stress amplitude, but also enhances the relation nonlinearity of the casing’s normal stress and the circumferential coordinate (the larger the value of the y axis is, the more the surface is distorted). However, the change trend of normal stress remains unchanged. In Figure 10b, the fixed concentrated load is q = 100 MPa, and the change pattern of the casing’s normal stress with the circumferential coordinate is symmetrical with the concentrated external load wrap angle. The change in the concentrated external load wrap angle does not have much influence on the nonlinearity of the change pattern of the normal stress. Its nonlinearity is largely determined by the geometry and the load distribution.
Figure 10.
Change pattern of normal stress with circumferential coordinate and concentrated load distribution. (a) Concentrated wrap angle, 45°; (b) concentrated load, 100 MPa.
Figure 11 shows the change pattern of the casing’s normal stress with the concentrated load distribution. In Figure 11a, the circumferential coordinate is , in Figure 11b the circumferential coordinate is , and the nonlinearity of the casing’s normal stress at the farthest point from the concentrated load is very strong. There is still a certain nonlinear phenomenon under the smaller concentrated load. It means that even under the smaller creep load, the casing may still be damaged due to the nonlinear stress. The distribution characteristics of the concentrated load at the place closest to the concentrated load have a basically linear influence on the normal stress of the casing. However, its stress amplitude is large, and it is prone to collapse failure.
Figure 11.
Change pattern of normal stress with concentrated load and concentrated wrap angle. (a) Circumferential coordinate 0; (b) circumferential coordinate 90°.
4. Analysis of Numerical Simulation of Casing Response Under Creep Loading of Shale Gas Reservoir
4.1. Casing Stress Analysis
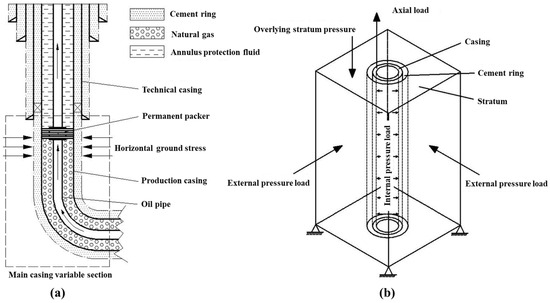
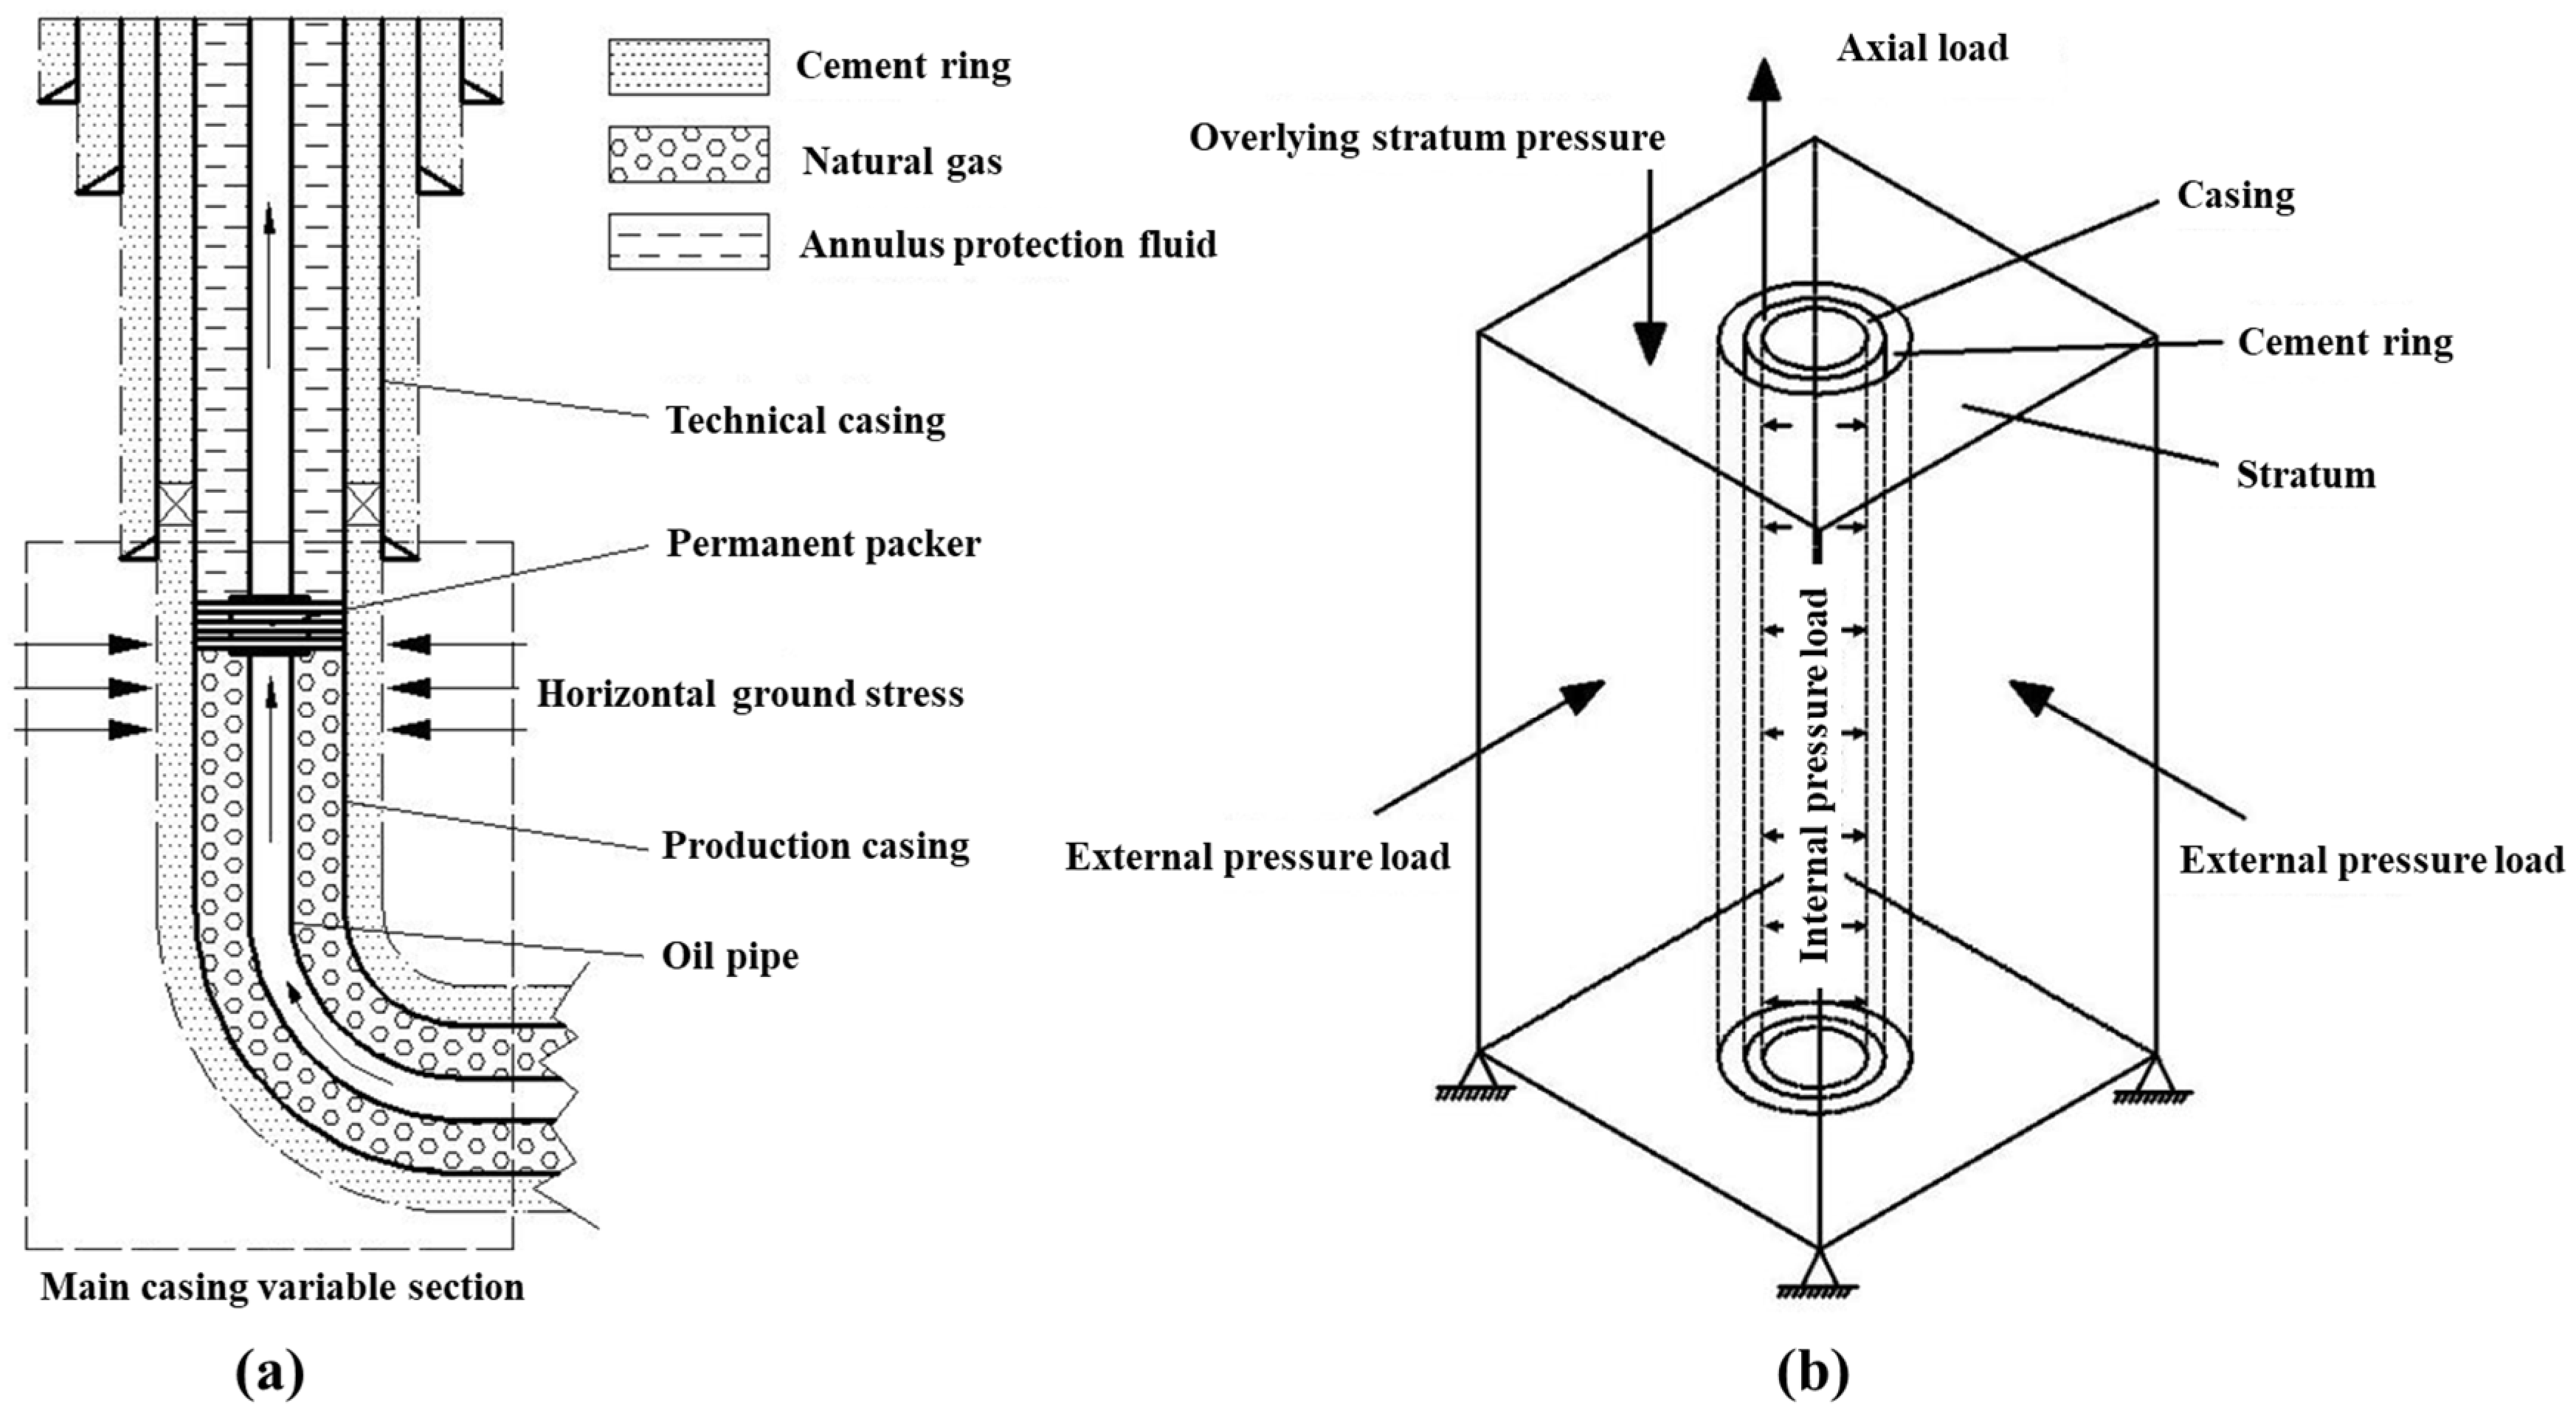
As shown in Figure 12a, the loads and stresses generated by the casing are as follows: overlying stratum pressure, stratum stress, stratum creep pressure, temperature variation stress due to stratum temperature gradient, thermal stress due to high temperature in deep wells, stress under the load due to change in diameter and wall thickness of the casing joint thread, internal pressure of natural gas on the casing, tensile stress caused by the casing string’s own weight, residual stress caused by casing welding, and fatigue load caused by the casing string vibration, etc. [21,22,23]. The production casing in the stratum creep position is separated from the stratum by only one layer of cementing ring. Without the outside protection by the technical casing, the production casing will be directly subjected to the creep external collapse load. For the inside of the production casing, the part above the permanent packer is filled with annulus protection fluid to prevent acid corrosion and balance the external collapse load. The part below the permanent packer is directly connected to the production layer, and the interior is filled with natural gas. Therefore, the model shown in Figure 12b may be used to perform a stress analysis on the main deformation section of the casing. Although the form of the load on the casing is complex, such a load on the casing may be divided into the axial force, internal pressure, and external pressure in light of the stress position and direction.
Figure 12.
Well body structure and main casing deformation section. (a) Well body structure; (b) stress diagram.
4.1.1. Axial Load
The axial load on the casing is mainly caused by the weight of the casing string, the buoyancy generated by the internal medium, and the interaction with the cement ring. The axial tensile force of the casing string in the vertical well section is as follows:
If the casing string is in contact with the downhole wall ( > 0) in the inclined well section, the axial tensile force is as follows:
where
If the casing string is not in contact with the downhole wall ( < 0), the axial tensile force is as follows:
The axial tensile force of the casing in the descending slope section is as follows:
The axial tensile force of the casing in the stable slope section is as follows:
where —effective axial force on the top of the nth section of the casing, N; —effective axial force on the upper end of the ith section of the casing, N;
—limited axial force on the lower end of the ith section of the casing, N; —length of the ith section of the casing, m;
—weight per unit length of the ith section of the casing, N/m; —the weight per unit length of the ith section of the casing in air, N/m;
—contact force between casing string and well wall per unit length, N; —curvature radius, m;
—annulus protection fluid density, 0, for the sections below the permanent packer, ;
—density of casing steel, ; —friction coefficient;
—complementary angle of inclination of the lower end of the ith section of the casing, °; —complementary angle of inclination of the upper end of the ith section of the casing, °.
4.1.2. Effective Internal Pressure Load
The internal pressure on the casing is mainly from the internal fluid action force. For production casing and production tail pipe, if the part below the permanent packer inside the pipe is filled with natural gas, the maximum internal pressure at any well depth is as follows:
If the part above the permanent packer inside the pipe is filled with annulus protection fluid, the maximum internal pressure at any well depth is as follows:
where —maximum internal pressure at calculation point, MPa; well depth at calculation point, m; —stratum or oil reservoir pressure, MPa; —annulus protection fluid density, .
4.1.3. External Pressure Load
In order to ensure the strength of the wellbore, the protection of the cement ring on the casing is generally not considered during the design phase. When the external pressure of the casing is greater than the internal pressure, it can be considered that the internal pressure can offset a part of the external pressure load, namely, the effective external pressure = external pressure load–internal pressure load. It is believed that the vertical pressure of the stratum can be fully transmitted to the casing.
In plastic creep stratum, the effective external pressure of surface casing and technical casing is as follows:
The effective external pressure of the production casing and the production tail pipe is as follows:
where —effective external pressure to the casing, MPa; —well depth at calculation point, m; —Poisson’s coefficient of rock; —pressure gradient of overlying rock formation, MPa/m.
4.2. Influence of Corrosion on Casing
During the oil–gas exploration, the gas solubility goes down with the decrease in the reservoir pressure so that plenty of gas with the stratum fluid penetrates into the pipe string. H2S and CO2 are acidic in contact with water, which will erode the pipe string and greatly reduce its anti-load capacity [24,25,26]. The main types of corrosion defect are given in Table 2 [27,28]:
Table 2.
Types of casing corrosion defects.
In this study, the complex and irregular morphology of corrosion pits is simplified into a hemispherical geometry based on the regularization principle for the safety assessment of the pressure vessels [29] (GB/T 19624-2019). As demonstrated by Zhu et al. [30], irregular corrosion defects can be effectively transferred into regular shapes to evaluate the casing collapsing strength without losing mechanical representativeness. Their sensitivity analysis indicates that the defect depth and aspect ratios are the most critical parameters influencing stress concentration and strength degradation, rather than the subtle irregularities of the pit’s edge. By adopting a regularized hemispherical model, we ensure both computational stability and a conservative assessment of the casing’s structural integrity under localized corrosion.
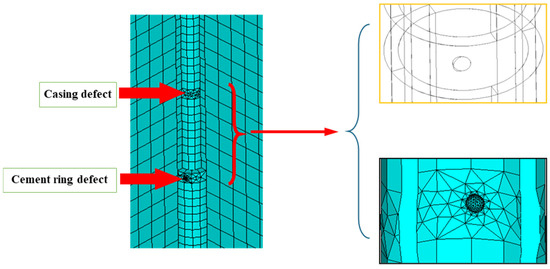
During the analysis of casing deformation under nonuniform creep load, in order to consider the influence of corrosive gas corrosion in the gas well on the casing damage, the casing in the numerical model adopts the defect characterization method that is often used to describe the casing corrosion of high-acid gas reservoirs. The irregular pit defects are uniformly taken as the hemisphere pit, as shown in Figure 13. The location of the defect and the partitioning of the follow-up grid, the defect, and its surroundings use an unstructured grid, and the rest of the main body uses a structured grid.
Figure 13.
Defect location and morphology.
While the spherical idealization of the corrosion defects is consistent with industrial standards and ensures computational convergence, it possesses certain limitations. Specifically, this simplified model may not fully capture the extreme stress concentrations associated with highly irregular or sharp-edged pits. In such cases, the spherical model provides a conservative macroscopic assessment of collapse strength, but further localized analysis might be required for specific complex defect geometries.
4.3. Establishment of Casing Creep Model of Shale Gas Reservoir
In order to simplify the calculation, it is assumed that the casing and the cement ring are ideal cylinders with uniform wall thickness and are concentric with the wellbore. The stratum, the cement ring, and the casing are in close contact, and the maximum and minimum horizontal ground stress and vertical ground stress are transmitted to the casing through the cement ring. According to the Saint-Venant principle, after the stratum boundary size is greater than eight times the borehole radius, the influence on the stress distribution around the borehole can be ignored [31].
According to Saint-Venant’s principle, the localized stress perturbation induced by the wellbore excavation dissipates as the distance from the loading area increases. To quantify this attenuation, the Lame analytical solution for a circular opening in an infinite elastic medium is employed. The radial stress () at a distance r from the center of a hole with radius R is given by
where is the far-field in situ stress and is the internal pressure (or support pressure). The stress perturbation can be expressed as follows:
At the model boundary where , the perturbation ratio relative to the maximum disturbance at the wellbore wall () is as follows:
This theoretical calculation shows that at 8R, the stress disturbance has decayed to less than 1.56%, which is well within the acceptable margin for engineering precision. This approach ensures that the boundary condition does not interfere with the localized stress concentration around the casing.
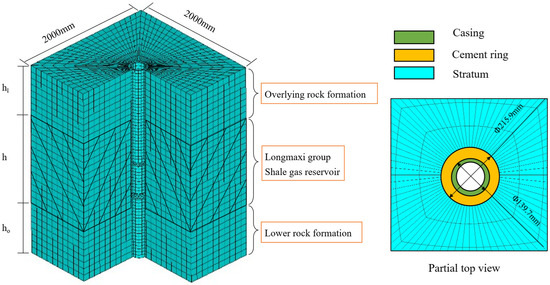
It is assumed that the stratum size is 2000 mm × 2000 mm; the surface temperature is 293 K. Parameters such as wellbore size, casing outside diameter, casing wall thickness, casing material properties, ground temperature gradient, overlying rock formation pressure, and stratum external collapse load are determined based on the actual logging geological characteristics. A 3D finite element model of casing–cement ring–stratum is established, as shown in Figure 14.
Figure 14.
Finite element model of casing–cement ring–stratum.
The mechanical parameters for the casing, cement sheath, and shale formation used in this study are summarized in Table 3. Specifically, the formation creep behavior is characterized using the Norton power-law model (). The casing material properties (including steel grade and wall thickness) and shale formation parameters selected in this model are consistent with the design standards for shale gas horizontal wells in the Sichuan Basin as suggested by Yin and Gao [32], ensuring the rationality and engineering relevance of the numerical simulation.
Table 3.
Mechanical parameters for numerical modeling.
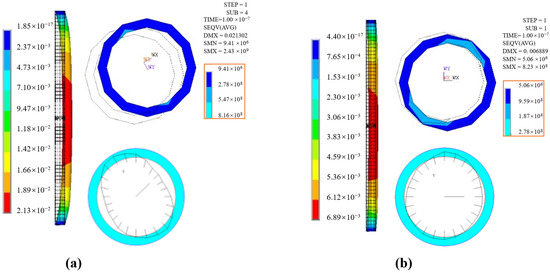
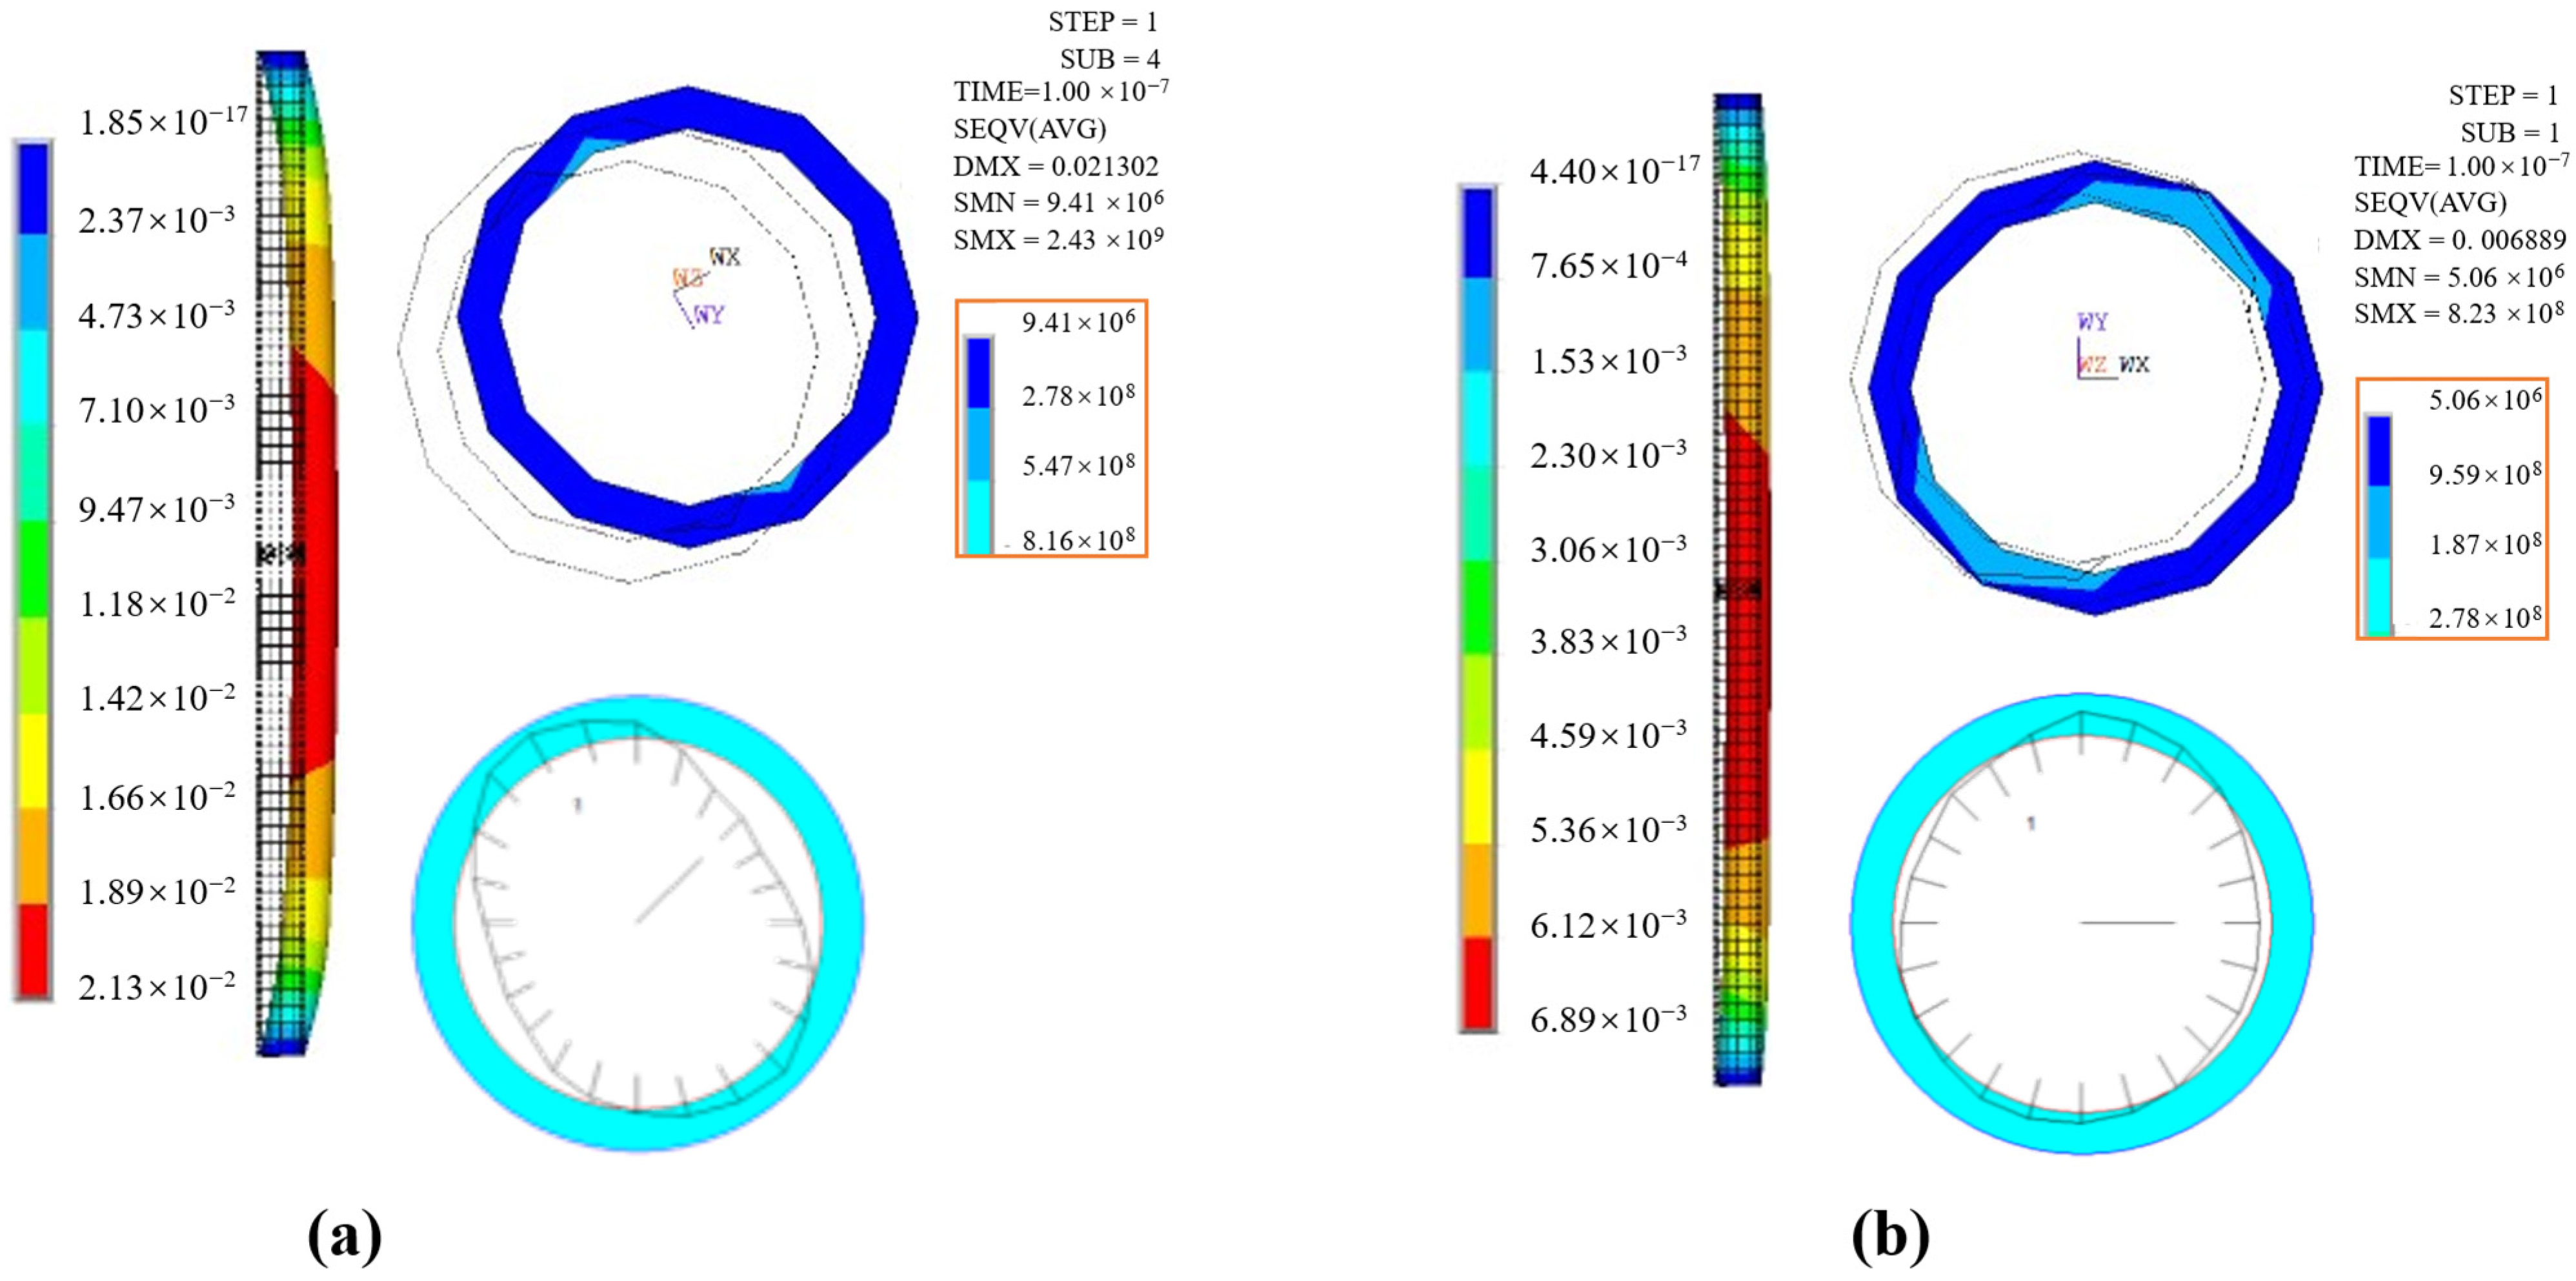
Figure 15 shows the numerical analysis results of two casing deformation sections under nonuniform creep load. Based on the simulation and logging data results, the maximum diameter variable of the 3028–3038 casing deformation sections is 0.023631 m and the casing deformation ratio is 20.67%. The numerical model analysis results show that the maximum diameter variable of this section is 0.021302 m and the casing deformation ratio is 18.64%. The deviation from the logging data is 9.86%, the maximum diameter variable of the 3043–3047 casing deformation sections is 0.006613 m, and the casing deformation ratio is 5.79%. The numerical model analysis results show that the maximum diameter variable of this section is 0.006889 m, and the casing deformation ratio is 6.03%. The deviation from the logging data is 4.17%.
Figure 15.
Response law of casing-deformed pipe sections under varying concentrated load conditions. (a) Casing deformation section; (b) casing deformation section.
The discrepancies (9.86% and 4.17%) primarily stem from three idealized assumptions in the numerical model. First, the simulation assumes perfect casing centrality and a uniform cement sheath, whereas actual downhole eccentricity leads to localized stress concentrations that are not fully captured. Second, the heterogeneity of materials (e.g., micro-defects in the cement and formation) is simplified into isotropic properties. Third, the static abstraction of dynamic far-field creep ignores the long-term stress relaxation effects. The deviation between the simulated stress values and field-measured data is within 10%, which satisfies the reliability standard for the casing deformation numerical models established in previous studies [33]. From a practical engineering perspective, since the standard safety factor for casing design typically ranges from 1.10 to 1.25, a prediction error of less than 10% is effectively covered by the engineering safety margin and does not compromise the selection of casing grades or wall thickness. Therefore, the numerical model herein may be considered to be feasible for field decision-making.
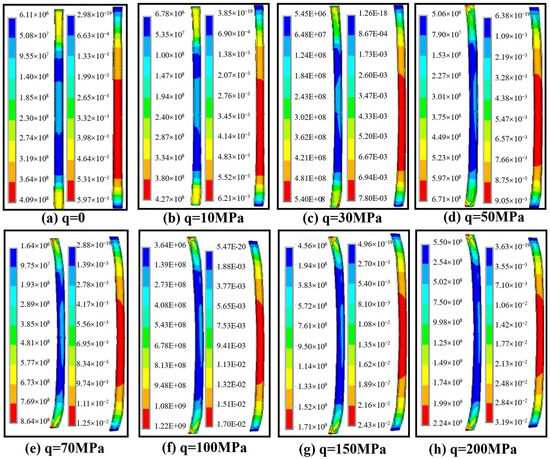
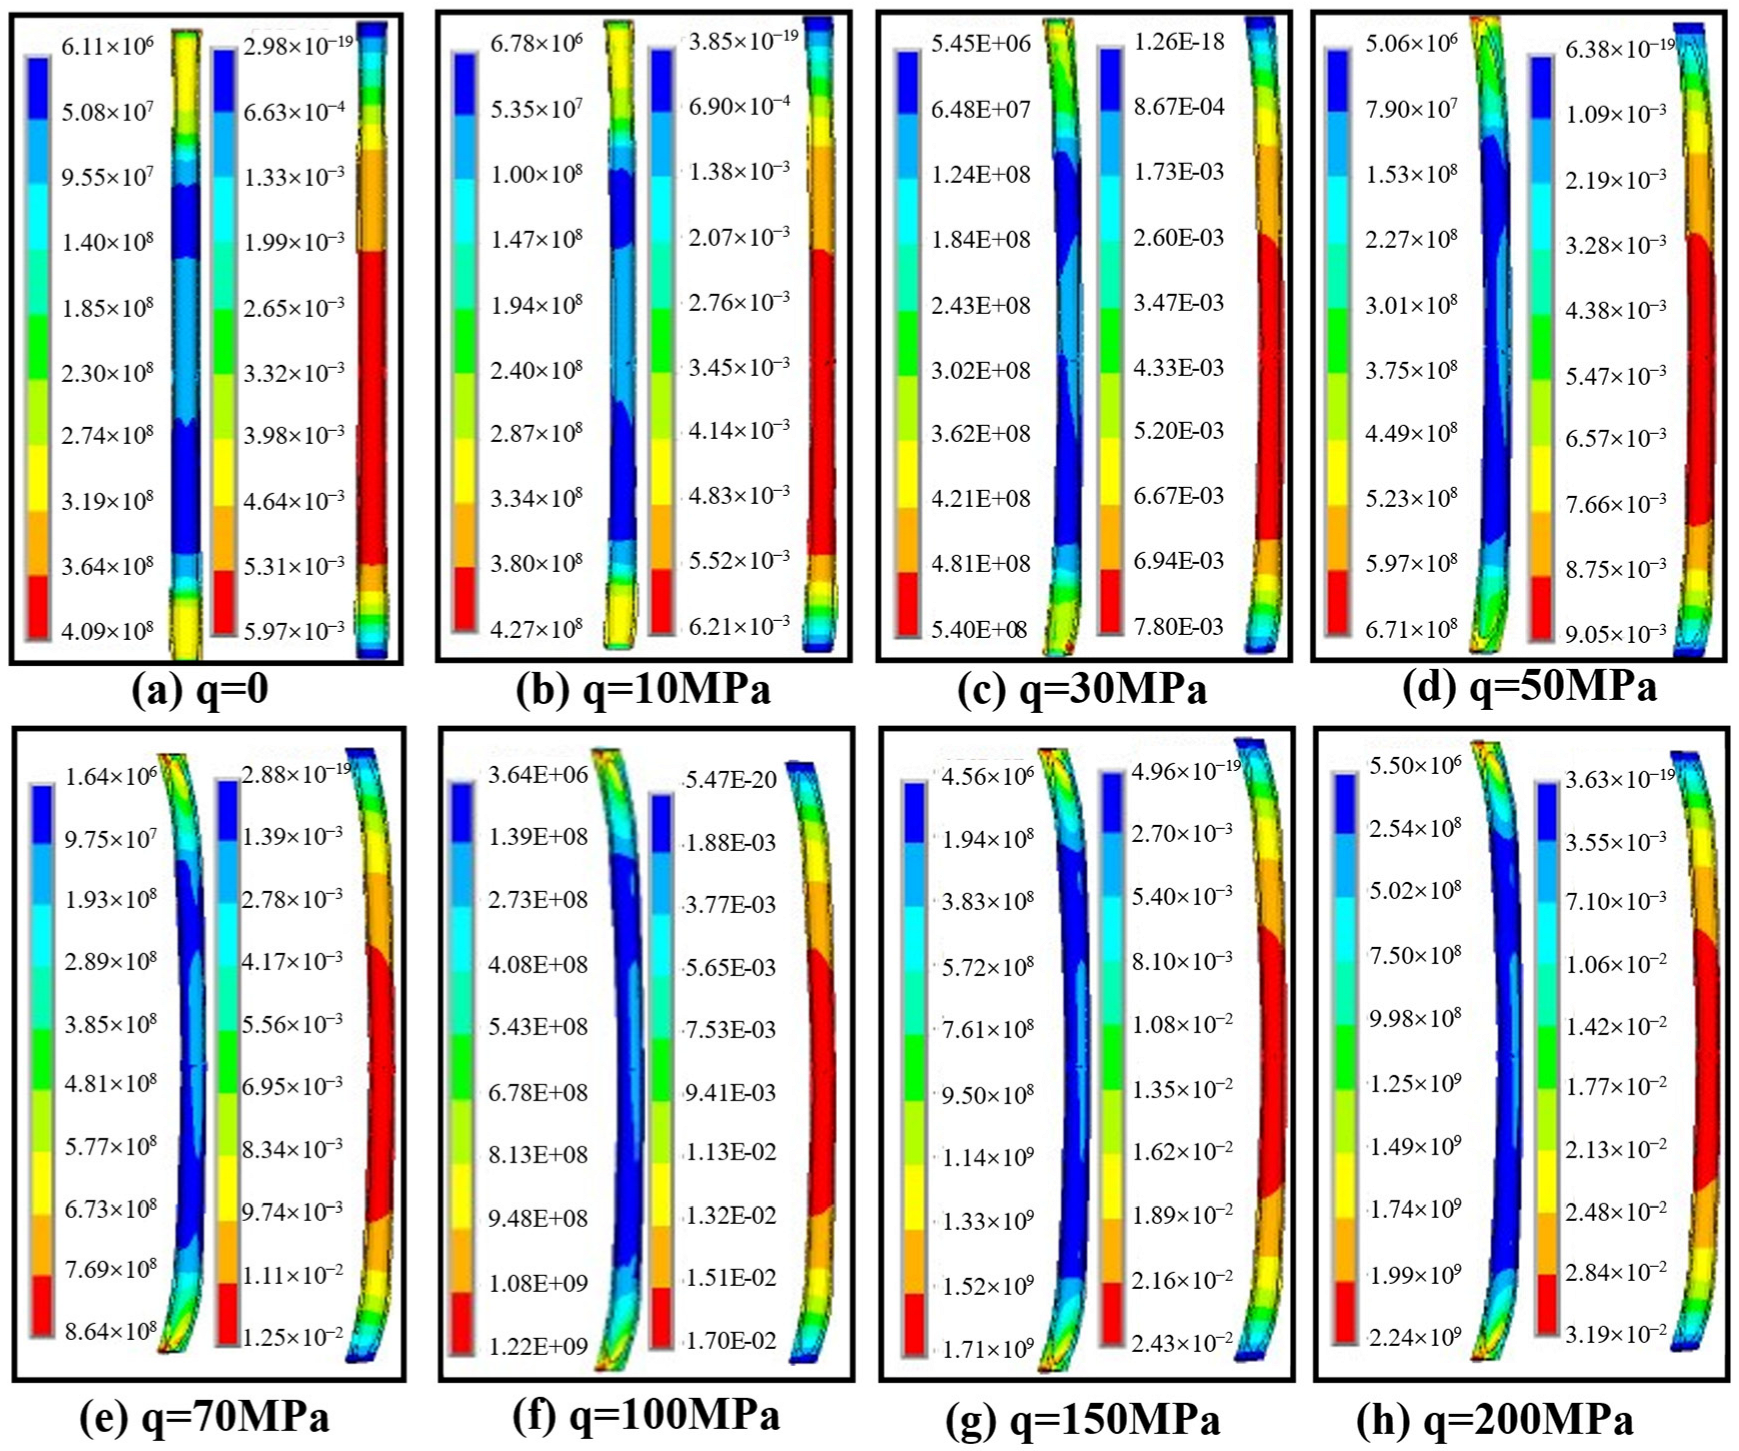
Figure 16 shows the numerical simulation results of the casing under the nonuniform creep load and concentrated external load change condition. In order to observe the deformation trend of the casing, the deformation factor is used to enlarge the model deformation. The upper and lower results are ignored to avoid the influence of boundary effects. According to the Figure, when the concentrated load is 0, with even load, the casing does not deflect and deform. Only the shrinkage deformation occurs, and the stress and deformation displacement are small. With the continuous increase in the concentrated load, the deflection of the casing becomes more and more obvious. The stress on the casing where the nonuniform load directly acts on the defect is significantly higher than the concentrated load, which is also the place where the maximum displacement occurs. Also, the stress on the casing in the area where the nonuniform load indirectly acts is close to the concentrated load.
Figure 16.
Casing response cloud diagram under varying concentrated load conditions (Note: Concentrated loads q increase from 0 MPa to 200 MPa; fixed wrap angle is 45°; stress unit: Pa; displacement unit: m).
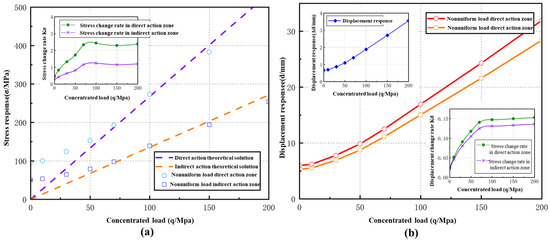
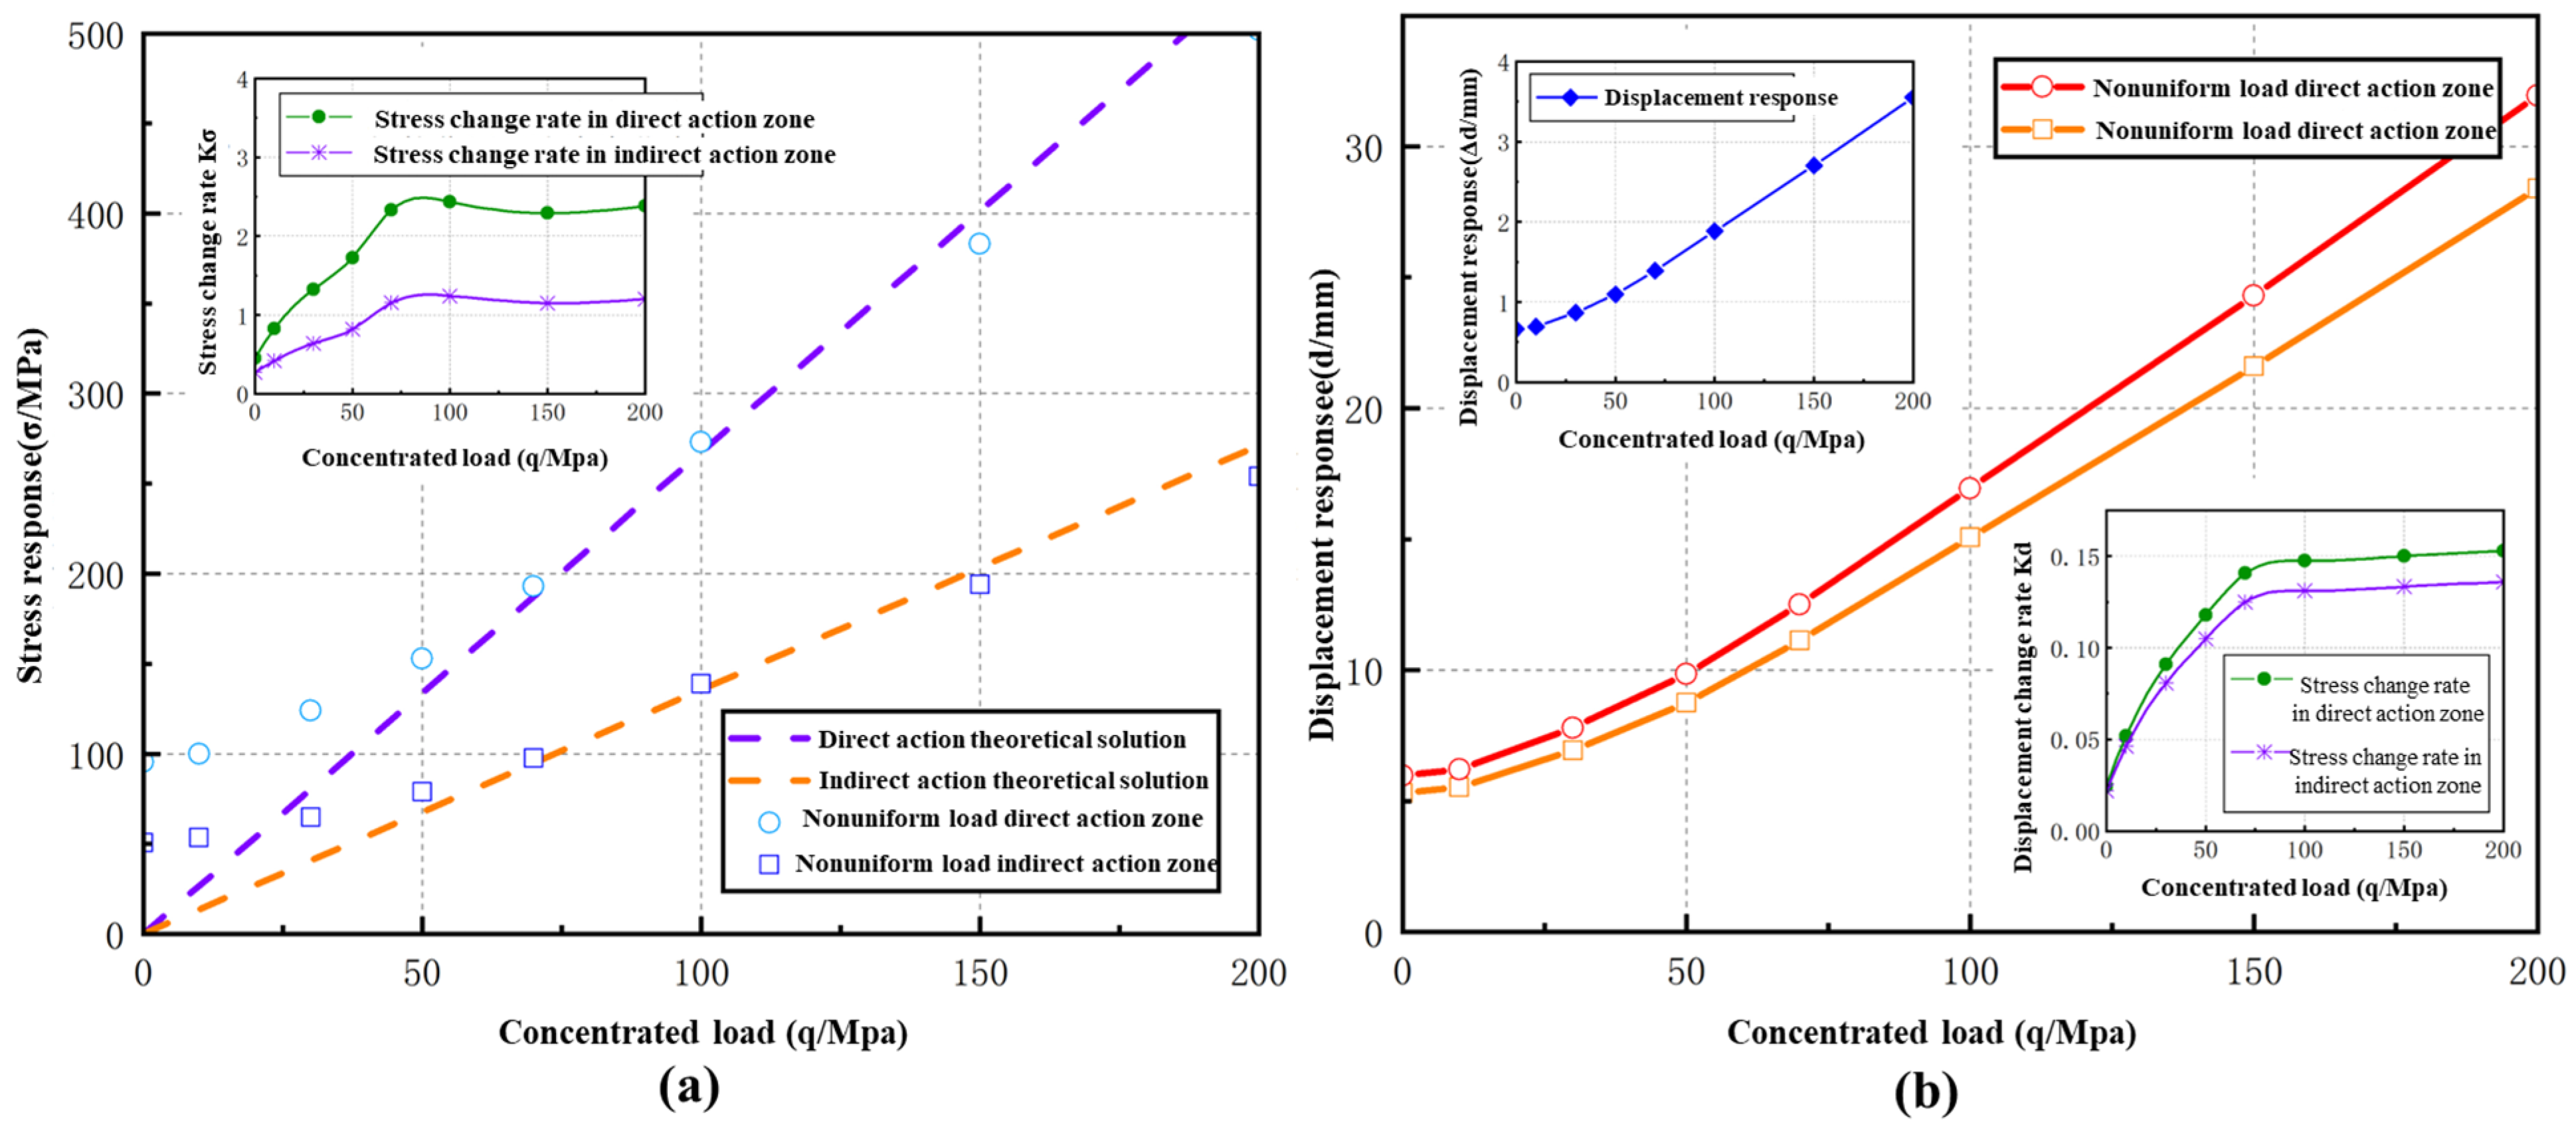
Figure 17 shows the casing mechanical response pattern under the nonuniform creep load change condition. According to the Figure, the numerical solution of the casing stress response has a good correspondence with the analysis solution of the mathematical model established above. It is a further embodiment that the mechanical response model of the casing under the stratum nonuniform creep load established herein has a certain feasibility. According to Figure 17a, which shows the stress response, when the concentrated load is small, the casing stress does not change significantly with the concentrated load, but the change rate significantly increases; at a certain critical concentrated load (i.e., the concentrated load at which the rate of stress change begins to stabilize; based on the curve of concentrated load versus stress change rate in Figure 17a, the critical concentrated load for this case is approximately 70 MPa), the casing stress change rate is the highest, and it will remain unchanged when the subsequent concentrated load continues to increase. Then, the casing stress basically has a linear relationship with the concentrated load, and the change is more significant. According to Figure 17b, which shows the displacement response pattern, the casing displacement response corresponds to the stress response, the change pattern is basically the same, and the critical concentrated load is relatively close. It means that the casing stress status directly reflects the casing deformation pattern.
Figure 17.
Casing response pattern under concentrated load change condition. (a) Stress response pattern; (b) displacement response pattern.
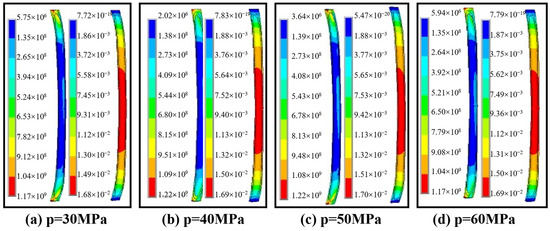
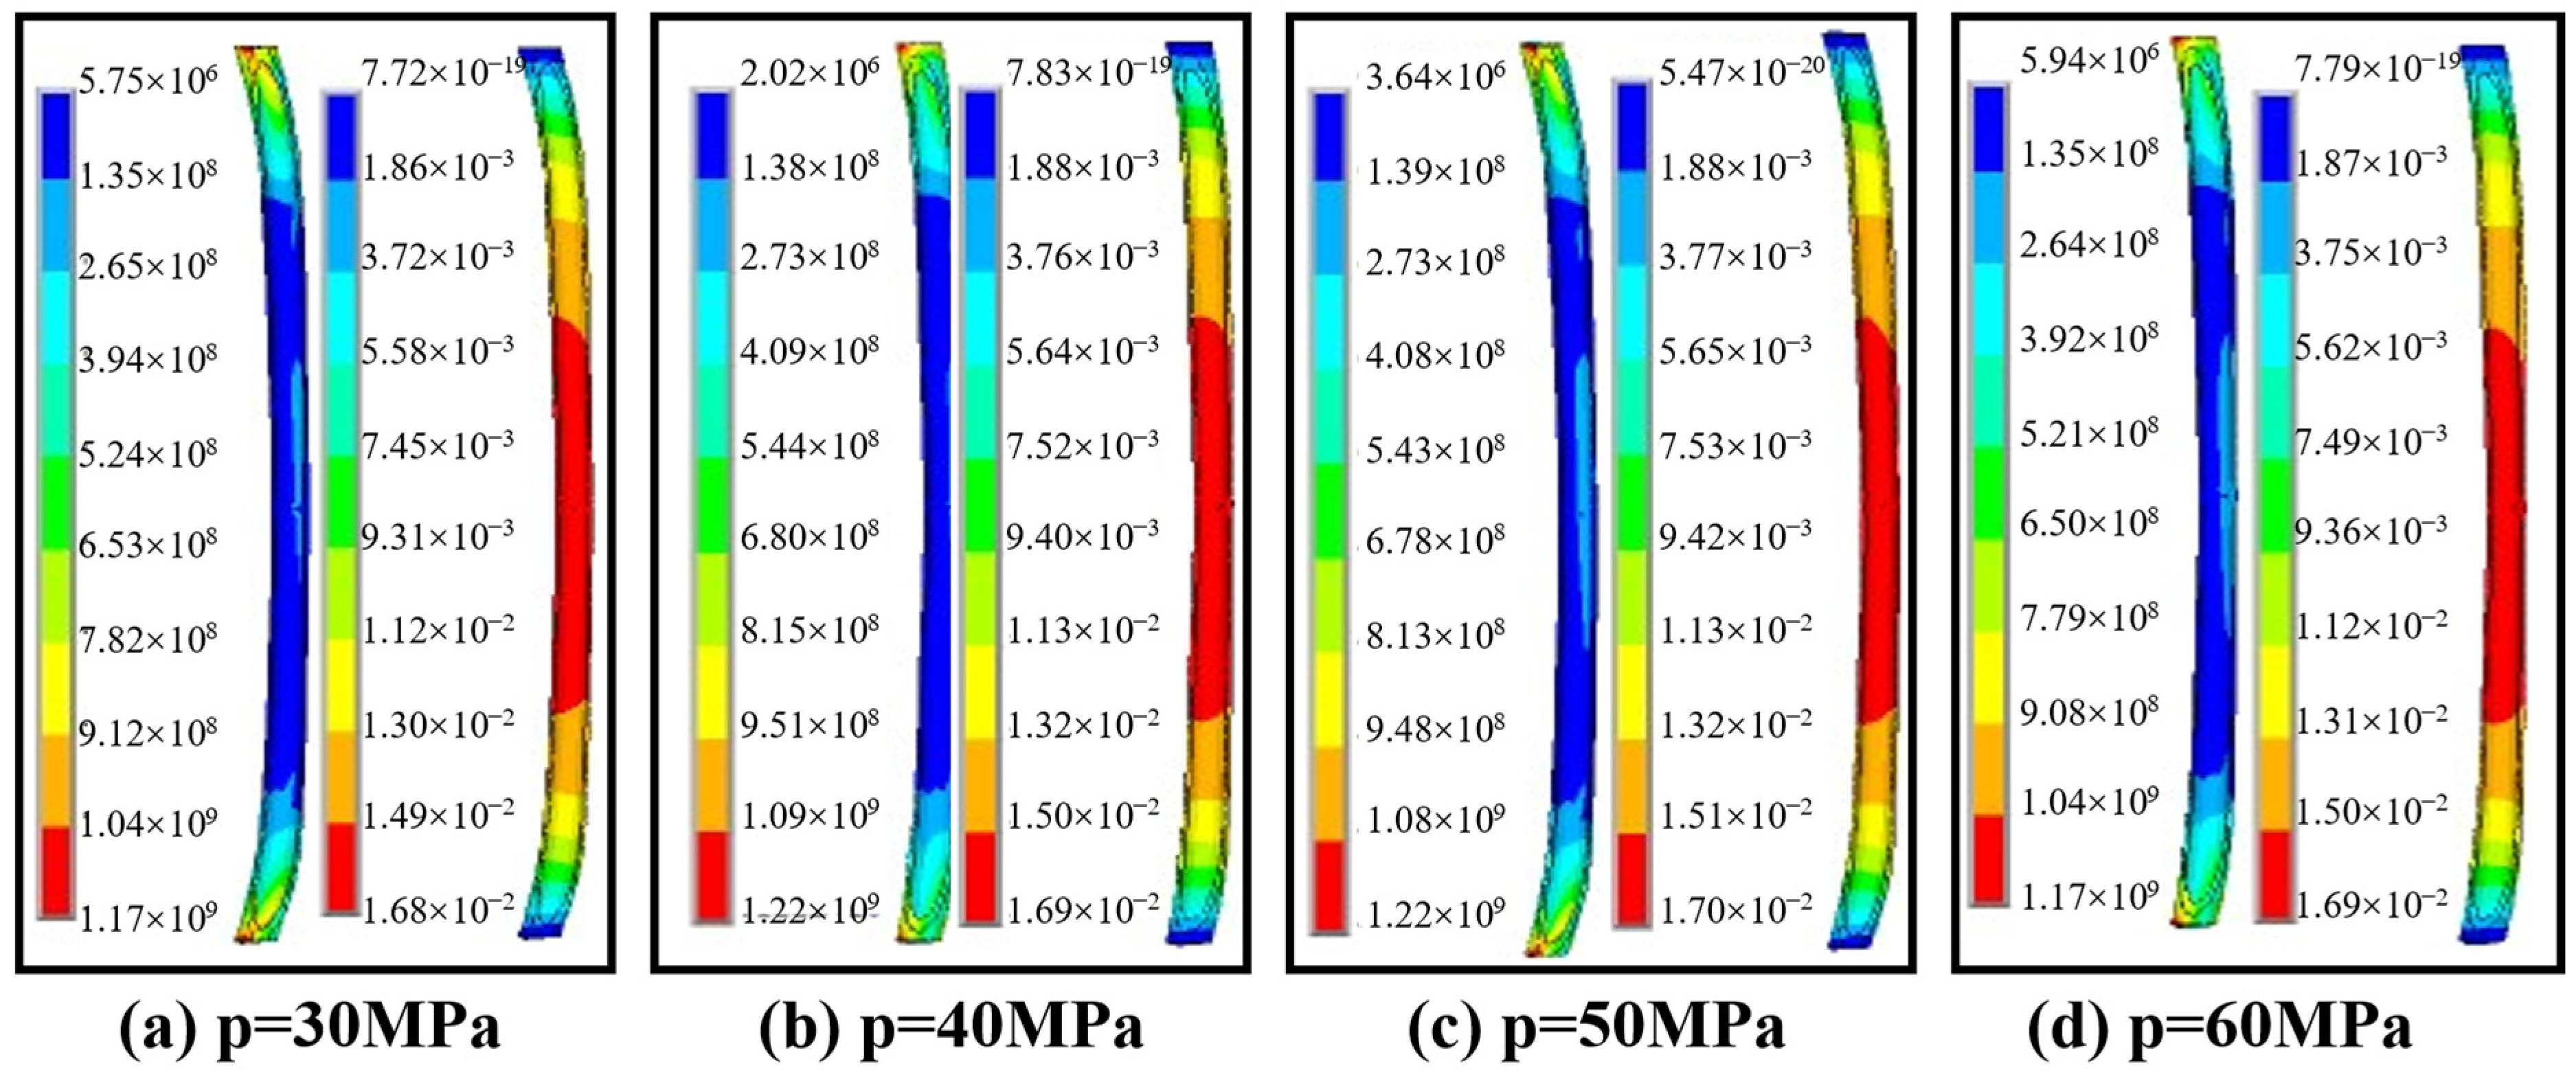
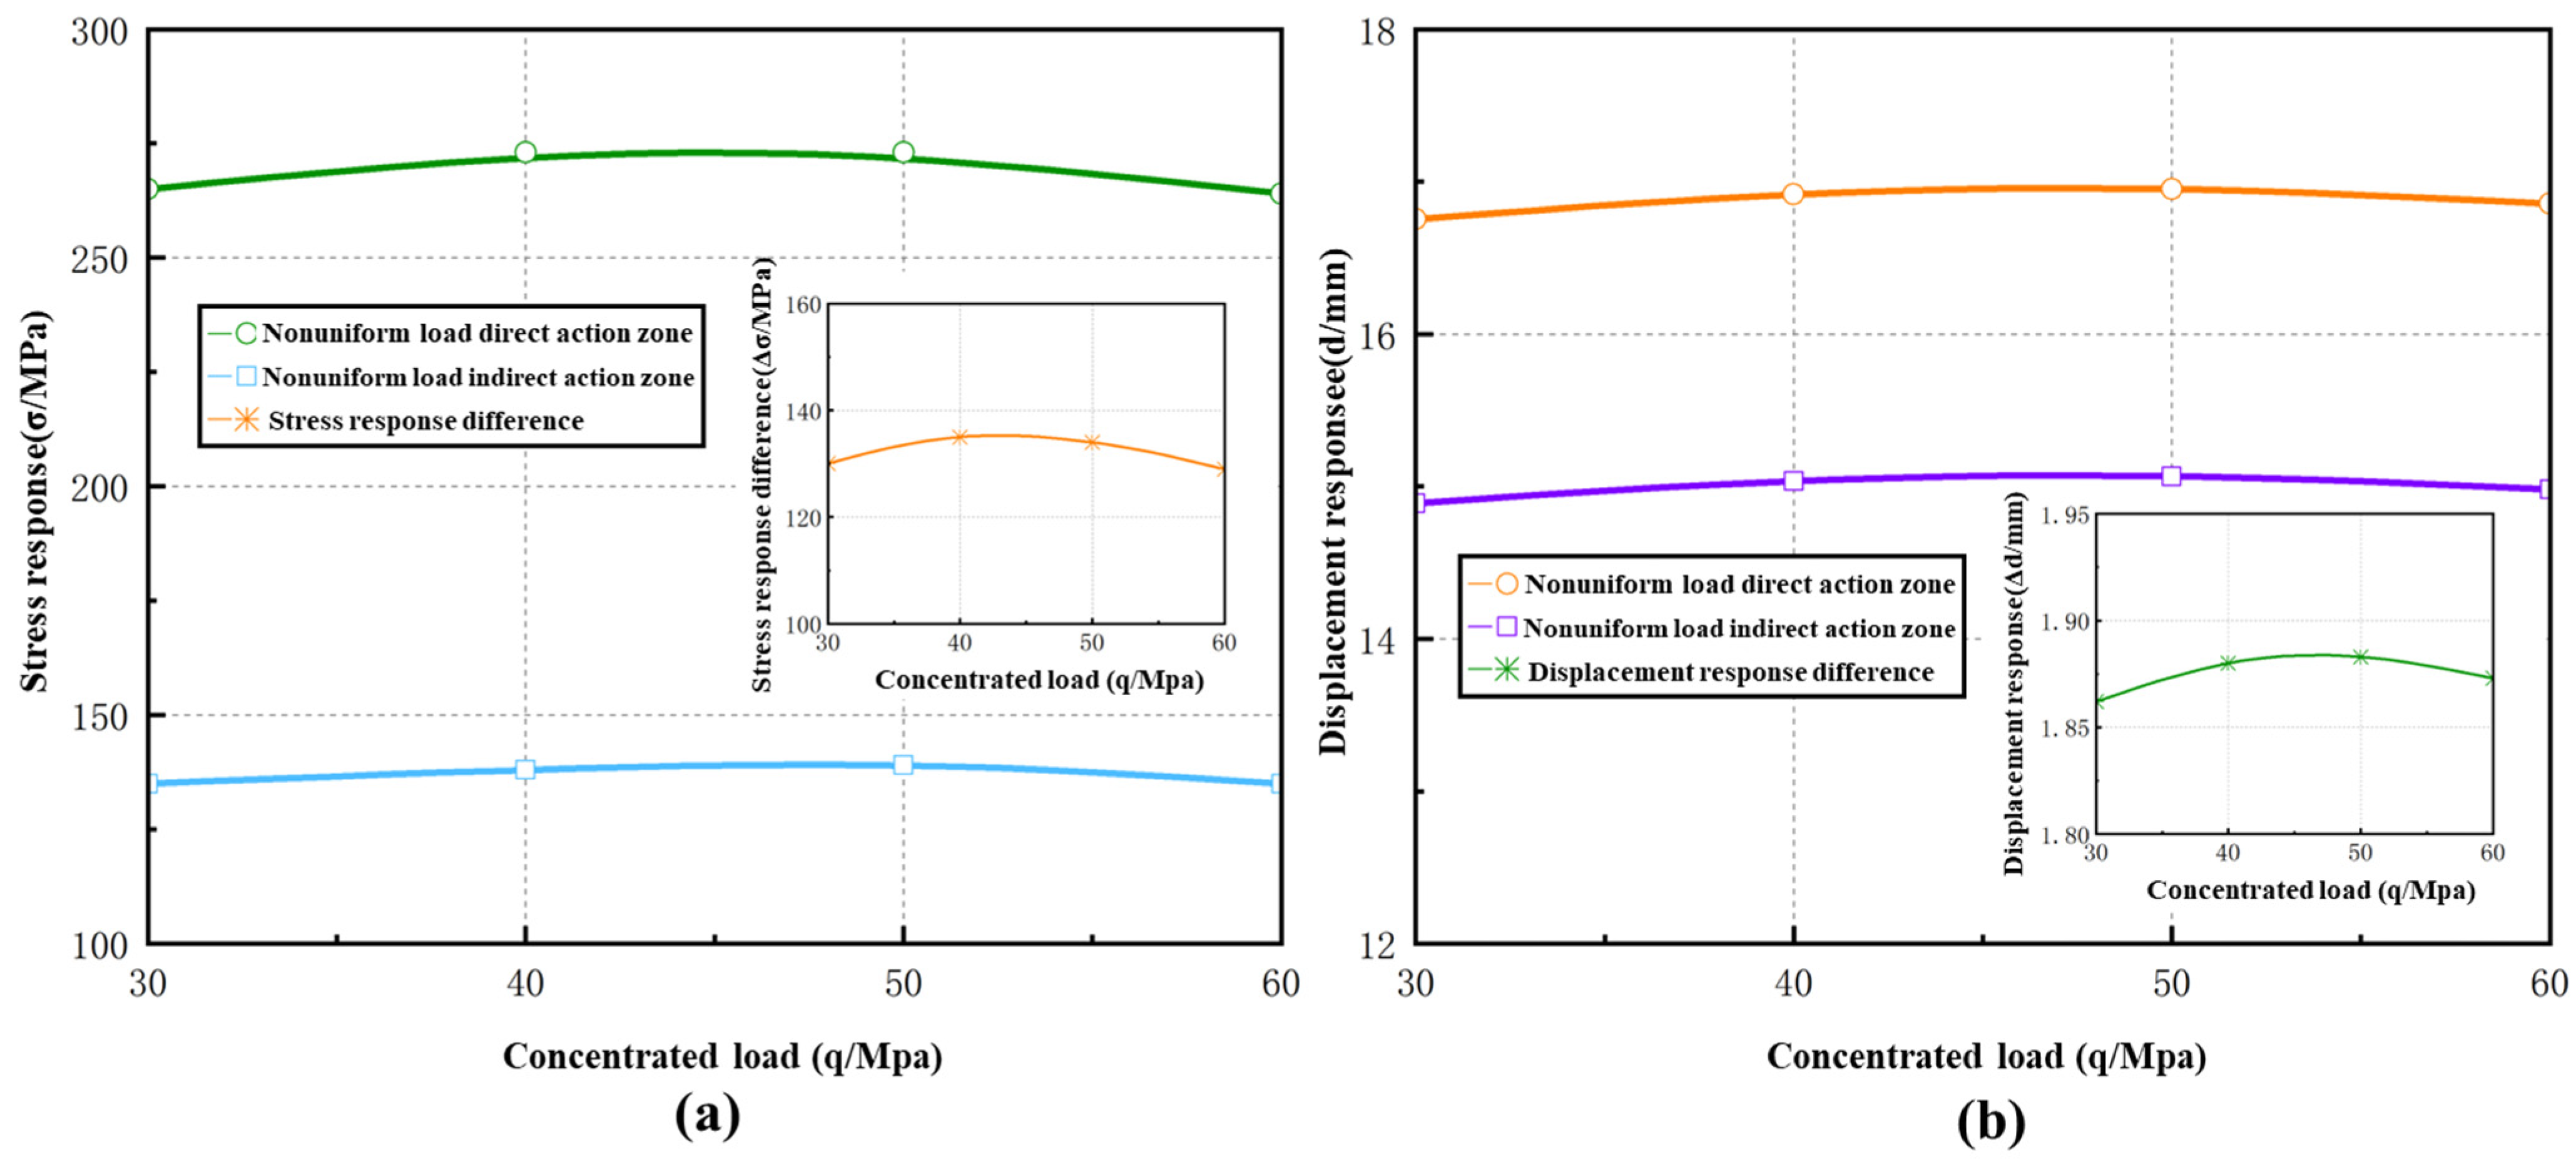
Figure 18 and Figure 19 show the casing simulation results and mechanical response pattern when the nonuniform creep load and concentrated external load are unchanged but the uniform load is changed. According to the Figures, under the same concentrated load, different uniform loads have little influence on the stress and displacement responses of the nonuniform load in the direct and indirect action zones, which indicates that the vertical depth-related ground stress gradient has little influence on the casing deformation. Based on the previous analysis, the deformation of the casing under the nonuniform load mainly depends on the difference between the peak value and the mean value of the load. The peak value and nonlinearity of the stress on the casing goes up with the increase in the difference between the peak value and the mean value. During casing design and process selection, target-specific measures should be taken for stratums with high ground stress nonuniformity. Again, the defects of the casing and cement ring shall be timely identified and modified to avoid further increase in the load nonuniformity arising out of the defects.
Figure 18.
Casing response cloud diagram under varying uniformly distributed load conditions (Note: Uniform external pressure ranges from 30 MPa to 60 MPa; fixed concentrated load magnitude and wrap angle; stress unit: Pa; displacement unit: m).
Figure 19.
Casing response pattern under uniform load change condition. (a) Stress response pattern; (b) displacement response pattern.
5. Discussion: Integrating Machine Learning for Adaptive Integrity Assessment
While the deterministic numerical model established in this study effectively reveals the mechanical response mechanisms of the casing, it relies on fixed input parameters. In complex shale reservoirs, geological and engineering uncertainties (e.g., creep law variations, cementing quality, and corrosion randomness) pose challenges for case-by-case simulations. To address this, the integration of machine learning (ML) and artificial intelligence (AI) offers a promising pathway to enhance model universality and prediction efficiency.
Recent advancements in geomechanical engineering demonstrate the potential of this approach. Kovalsky et al. [15] successfully applied machine learning algorithms, such as Random Forest and LSTM, to forecast the strength of backfill materials. Their work highlighted that ML models could significantly reduce the labor intensity of experimental work while discovering hidden nonlinear dependencies between the component proportions and the mechanical stability. Similarly, Hernández García et al. [34] utilized Artificial neural networks (ANNs) to estimate the cement consumption and mechanical strength in clayey waste mixtures. Their study proved that neural networks are highly effective in performing multivariate analysis, capturing the complex interactions between the curing temperature, organic matter content, and resilient modulus without the need for exhaustive physical testing.
Inspired by these methodologies, we propose a hybrid data-driven framework for future casing integrity assessments. By training neural networks on extensive multi-source data (logging curves, operation logs, and failure records), this framework’s aims are as follows:
- (1)
- Auto-calibrate creep parameters: Use ML to predict in situ rock creep coefficients (A and n) based on geological logging data, overcoming the limitations of static laboratory tests.
- (2)
- Assess probabilistic risk: Move beyond deterministic stress analysis to a probabilistic evaluation of casing deformation, accounting for the coupled effects of nonuniform loads and material defects.
This transition to an AI-enhanced approach will enable the development of more adaptive and real-time tools for ensuring wellbore integrity in deep shale formations.
6. Conclusions
Based on the analysis of the mechanical and numerical models validated by multi-arm caliper logging data, the response patterns of casing under nonuniform creep load are summarized as follows:
- (1)
- Distinct stress response behaviors: The casing stress in the direct action zone of the concentrated load exhibits a linear relationship with the load magnitude. In contrast, the stress in the indirect action zone shows a significant nonlinear relationship, indicating that the indirect impact area is also susceptible to damage due to complex stress concentrations.
- (2)
- Critical wrap angle effect: A critical concentrated load wrap angle exists (approximately ). When the wrap angle is below this threshold, casing shrinkage is the dominant deformation mode; when it exceeds this threshold, the deflection trend becomes dominant.
- (3)
- Dominance of load nonuniformity: The deformation pattern and structural instability are primarily governed by the load nonuniformity (the difference between peak and mean loads) rather than the magnitude of the uniform load. While the uniform load establishes the baseline hydrostatic stress state, it contributes minimally to the deviatoric stress that drives casing ovalization and localized yielding. Sensitivity analysis indicates that the bending moments induced by load anisotropy are the principal cause of structural failure. A critical concentrated load exists where the stress change rate peaks, suggesting that defects in the casing or cement ring—which exacerbate load nonuniformity—must be identified early to prevent premature failure.
Author Contributions
X.Z., Writing—original draft, Methodology, Formal analysis, Data curation.; H.S., Visualization, Validation, Data curation.; J.J., Software, Formal analysis, Data curation.; P.X., Visualization, Software, Investigation; L.K., Writing—review and editing, Methodology, Funding acquisition. All authors have read and agreed to the published version of the manuscript.
Funding
This work was supported by the National Natural Science Foundation of China (U24A2091) and the National Science and Technology Major Project for New-type Oil and Gas Exploration and Development (2024ZD1401802).
Data Availability Statement
The original contributions presented in this study are included in the article. Further inquiries can be directed to the corresponding author.
Conflicts of Interest
Author Lingxu Kong was employed by the Northwest Sichuan Gas District of Southwest Oil and Gas Field Company. The remaining author declares that the research was conducted in the absence of any commercial or financial relationships that could be construed as a potential conflict of interest.
References
- Zhu, X.; Liu, B. The reliability-based evaluation of casing collapsing strength and its application in marine gas reservoirs. Eng. Fail. Anal. 2018, 85, 1–13. [Google Scholar] [CrossRef] [Scilit]
- Tang, H. Analysis of development strategies and countermeasures for China’s shale gas. China New Technol. Prod. 2018, 2, 116–117. [Google Scholar] [CrossRef]
- Liu, K.; Gao, D.; Wang, Y.; Liu, Y. Effects of local load on shale gas well casing deformation. Nat. Gas Ind. 2016, 36, 76–82. [Google Scholar] [CrossRef]
- Gao, D.; Liu, K. Progresses in shale gas well integrity research. Oil Gas Geol. 2019, 40, 602–615. [Google Scholar] [CrossRef]
- Xi, Y.; Li, J.; Liu, G.; Zeng, Y.; Li, J. Overview of casing deformation in multistage fracturing of shale gas horizontal wells. Spec. Oil Gas Reserv. 2019, 26, 1–6. [Google Scholar] [CrossRef]
- Cao, J.; Yang, S.; Han, L.; Wang, J.; Mou, Y.; Lu, C. Research on Casing Deformation Prevention Technology of a Deep Shale Gas Well Based on Cementing Slurry System Optimization. Processes 2022, 10, 1678. [Google Scholar] [CrossRef] [Scilit]
- Xi, Y.; Li, J.; Zha, C.; Guo, B.; Liu, G. A new investigation on casing shear deformation during multistage fracturing in shale gas wells based on microseism data and calliper surveys. J. Pet. Sci. Eng. 2019, 180, 1034–1045. [Google Scholar] [CrossRef] [Scilit]
- Zhang, Z.; Liu, J.; Liu, H.; Li, L.; Zhao, Y.; Ding, J.; Yang, K.; Song, C. Mechanisms of casing damage during shale gas well fracturing treatment. Nat. Gas Ind. 2019, 39, 82–87. [Google Scholar] [CrossRef]
- Tong, H.; Zhang, P.; Zhang, H.; Liu, Z.; Ren, X.; Xiao, K.; Zhou, Y.; Deng, C. Geomechanical mechanisms and prevention countermeasures of casing deformation in shale gas horizontal wells. Nat. Gas Ind. 2021, 41, 189–197. [Google Scholar] [CrossRef]
- Tong, H.; Liu, Z.; Zhang, H.; Zhang, P.; Deng, C.; Ren, X.; Xiao, K.; Zhou, Y. Theory and method of temporary macrofracture plugging to prevent casing deformation in shale gas horizontal wells. Nat. Gas Ind. 2021, 41, 92–100. [Google Scholar] [CrossRef]
- Yan, Y.; Guan, Z.; Han, L.; Liu, Y. Coupled thermo-hydro-mechanical analysis of perforated cement sheath integrity during hydraulic fracturing. J. Pet. Sci. Eng. 2022, 218, 110950. [Google Scholar] [CrossRef] [Scilit]
- Zhang, W.; Li, J.; Zhang, H.; Wang, D.; Li, T.; Liu, H. Influence of fault slip on casing shear deformation and its prevention and control measures. Fault-Block Oil Gas Field 2023, 30, 734–742. [Google Scholar]
- Yin, F.; Shi, B.; Huang, G.; Wu, X. Integrity assessment methodology of casing ovality deformation in shale gas wells. Geoenergy Sci. Eng. 2023, 224, 211643. [Google Scholar] [CrossRef] [Scilit]
- Zhao, C.; Jin, Y.; Wang, X. Investigation on dynamic mechanism of fault slip and casing deformation during multi-fracturing in shale gas wells. Sci. Rep. 2024, 14, 13164. [Google Scholar] [CrossRef] [Scilit]
- Kovalsky, E.; Kongar-Syuryun, C.; Morgoeva, A.; Klyuev, R.; Khayrutdinov, M. Backfill for Advanced Potash Ore Mining Technologies. Technologies 2025, 13, 60. [Google Scholar] [CrossRef] [Scilit]
- Ge, W.; Chen, M.; Jin, Y.; Lu, Y.; Zhang, F.; Hou, B. Equivalent stress analysis of casing after wear in deep salt-gypsum rock formations. J. China Univ. Pet. (Ed. Nat. Sci.) 2013, 37, 75–79. [Google Scholar] [CrossRef]
- Li, P.; Deng, J.; Sun, Y.; Yan, X.; Xu, X. Experimental study on creep characteristics of salt rock and gypsum-salt rock in Chuandong Gas Field. Rock Soil Mech. 2012, 33, 444–448. [Google Scholar] [CrossRef]
- Guo, D. Study on Safety and Reliability of In-Service Casing in Marine Gas Reservoirs. Master’s Thesis, Southwest Petroleum University, Chengdu, China, 2016. Available online: https://scholar.google.com/scholar?hl=zh-CN&as_sdt=0%2C5&q=%E6%B5%B7%E7%9B%B8%E6%B0%94%E8%97%8F%E4%BA%95%E6%9C%8D%E5%BD%B9%E5%A5%97%E7%AE%A1%E7%9A%84%E5%AE%89%E5%85%A8%E5%8F%AF%E9%9D%A0%E6%80%A7%E7%A0%94%E7%A9%B6&btnG= (accessed on 12 January 2025).
- Yang, W.; Xu, L.; Chen, D.-X.; Jiang, Z.-X.; Zhang, Z.-Y.; Hao, B.; Zuo, R.-S.; Wang, Q.-Y.; Chen, R. How argillaceous reservoirs exhibit better quality than silty mudstones? Anomalous behavior of shale gas-bearing properties of continental fine-grained sediments in Southwest China and its possible forcing mechanisms. Pet. Sci. 2021, 18, 1589–1610. [Google Scholar] [CrossRef] [Scilit]
- Lin, Y.; Sun, Y.; Zeng, D.; Deng, K. Working Mechanics of Casing; Petroleum Industry Press: Beijing, China, 2015. [Google Scholar]
- SY/T 5724-2008; Design for Casing String Structure and Strength. National Development and Reform Commission: Beijing, China, 2008.
- Liu, H.; Zhang, P.; Gai, F. Study on Creep Law of Salt Rock in Sichuan Area. Chin. J. Rock Mech. Eng. 2002, 21, 1290–1294. Available online: https://rockmech.whrsm.ac.cn/CN/Y2002/V21/I09/1290 (accessed on 6 January 2026).
- Liang, Q.J. Application of quantitative risk analysis to pore pressure and fracture gradient prediction. In Proceedings of the SPE Annual Technical Conference and Exhibition, San Antonio, TX, USA, 29 September–2 October 2002; p. SPE-77354. [Google Scholar] [CrossRef]
- Wan, L. Design and Applicability Evaluation of Oil Casing in Acidic Environment. Ph.D. Thesis, Southwest Petroleum University, Chengdu, China, 2016. Available online: https://scholar.google.com/scholar?hl=zh-CN&as_sdt=0%2C5&q=%E9%85%B8%E6%80%A7%E7%8E%AF%E5%A2%83%E6%B2%B9%E5%A5%97%E7%AE%A1%E8%AE%BE%E8%AE%A1%E5%8F%8A%E9%80%82%E7%94%A8%E6%80%A7%E8%AF%84%E4%BB%B7&btnG= (accessed on 6 January 2026).
- Shen, N.; Jiang, G.; Su, K.; Wang, Q. Corrosion status and protective measures of A333 pipe material in high-sulfur gas fields. Corros. Prot. 2016, 37, 430–433. Available online: https://scholar.google.com/scholar?cluster=1059503890628124420&hl=zh-CN&as_sdt=0,5 (accessed on 6 January 2026).
- Xu, D. Study on H2S/CO2 Corrosion of Two Types of Sulfur-Resistant Steel for Oil Casing. Ph.D. Thesis, Huazhong University of Science and Technology, Wuhan, China, 2007. Available online: https://scholar.google.com/scholar?hl=zh-CN&as_sdt=0%2C5&q=%E4%B8%A4%E7%A7%8D%E6%B2%B9%E5%A5%97%E7%AE%A1%E6%8A%97%E7%A1%AB%E9%92%A2%E7%9A%84H2S%2FCO2%E8%85%90%E8%9A%80%E7%A0%94%E7%A9%B6&btnG= (accessed on 6 January 2026).
- Li, H.; Chu, W. Study on optimization of corrosion inhibitor injection parameters in Puguang Gas Field. Petrochem. Corros. Prot. 2017, 34, 21–25. Available online: https://scholar.google.com/scholar?cluster=12030350099999321624&hl=zh-CN&as_sdt=0,5 (accessed on 6 January 2026).
- Yu, H.; Zhao, W.; Jia, H.; Qiao, P.; Ren, T.; Yang, M. Phased analysis and evaluation of imported nickel-based composite pipes in Puguang Gas Field. Foundry Technol. 2013, 34, 311–313. Available online: https://scholar.google.com/scholar?cluster=11821497198851916671&hl=zh-CN&as_sdt=0,5 (accessed on 6 January 2026).
- GB/T 19624-2019; Safety Assessment of In-Service Pressure Vessels Containing Defects. China Standards Press: Beijing, China, 2019.
- Zhu, X.; Luo, S. Regularization of casing corrosion defects and collapse strength analysis. Sci. Technol. Eng. 2017, 17, 193–198. Available online: https://scholar.google.com/scholar?cluster=11537143898782556879&hl=zh-CN&as_sdt=0,5 (accessed on 6 January 2026).
- Zhu, X.; Liu, B. A method to assess the reliability of casings in marine gas reservoirs based on Bayesian theory optimization. J. Pet. Sci. Eng. 2019, 172, 1248–1256. [Google Scholar] [CrossRef] [Scilit]
- Yin, F.; Gao, D. Prediction of sustained production casing pressure and casing design for shale gas horizontal wells. J. Nat. Gas Sci. Eng. 2015, 25, 159–165. [Google Scholar] [CrossRef] [Scilit]
- Guo, X.; Li, J.; Liu, G.; Xi, Y.; Zeng, Y.; He, M.; Yan, H. Numerical simulation of casing deformation during volume fracturing of horizontal shale gas wells. J. Pet. Sci. Eng. 2019, 172, 731–742. [Google Scholar] [CrossRef] [Scilit]
- García, L.C.H.; Valencia, J.V.; Lopera, H.A.C. Modeling an artificial neural network to estimate cement consumption in clayey waste-cement mixtures based on curing temperature, mechanical strength, and resilient modulus. Constr. Build. Mater. 2025, 467, 140376. [Google Scholar] [CrossRef] [Scilit]

Disclaimer/Publisher’s Note: The statements, opinions and data contained in all publications are solely those of the individual author(s) and contributor(s) and not of MDPI and/or the editor(s). MDPI and/or the editor(s) disclaim responsibility for any injury to people or property resulting from any ideas, methods, instructions or products referred to in the content. |
© 2026 by the authors. Licensee MDPI, Basel, Switzerland. This article is an open access article distributed under the terms and conditions of the Creative Commons Attribution (CC BY) license.