


Abstract
Biofilm formation by Escherichia coli can contribute to persistence and reduced susceptibility to antimicrobial treatment. Here, we evaluated treatment-associated changes following individual exposure to preparations of the glycosidases SdBgl1B and dispersin B (DspB) and the cysteine protease papain in assays assessing changes in preformed biofilm biomass and in biomass formed during 24 h of enzyme exposure across four E. coli strains (042, 1007, P180, and 23699) using static crystal violet microtiter-plate assays. The assays comprised three independent biological replicates with three technical wells per replicate for each condition. Papain-treated wells showed reductions in preformed crystal-violet-stained biomass of up to 92.4% for strain 042 at 1.00 mg/mL and 81.4–90.8% for strain 23699 across the tested concentration range. DspB-treated wells showed 67–72% less preformed biomass for strain 23699 and approximately 89% less biomass formed over 24 h by strain 042 at 0.03–0.06 mg/mL. Exposure to SdBgl1B was associated with variable responses, including approximately 62% less biomass formed by strain 042 at the enzyme concentration of 0.50 mg/mL. These percentages describe changes relative to the corresponding controls, not statistically established rankings among strains or enzymes. Several enzyme–strain combinations displayed non-monotonic responses, and some treatments produced crystal violet signals above the control. The control scheme does not resolve vehicle- or preparation-dependent staining contributions, precluding enzyme-specific causal attribution. Because crystal violet staining quantifies total attached stained material rather than specific matrix cleavage or bacterial viability, these findings document changes in the attached biomass endpoint but do not establish biofilm eradication, a molecular degradation mechanism, or bactericidal activity. Further matrix characterization, viability, dispersal, and confocal microscopy assays are required to determine mechanism and assess translational potential.
1. Introduction
Antimicrobial resistance (AMR) remains a major global health challenge. A global burden analysis published in 2024 estimated that bacterial AMR was associated with 4.71 million deaths in 2021, including 1.14 million deaths attributable to resistance [1]. The World Health Organization (WHO) Global Antibiotic Resistance Surveillance Report 2025 estimated that approximately one in six laboratory-confirmed bacterial infections causing common infections in people worldwide in 2023 was resistant to antibiotic treatment [2]. These estimates address different outcomes and data years and should not be interpreted interchangeably. The WHO Bacterial Priority Pathogens List 2024 classifies carbapenem-resistant and third-generation cephalosporin-resistant Enterobacterales as critical priorities for research, development, and public-health action [3,4]. Because E. coli is a major member of the order Enterobacterales, resistant E. coli lineages are clinically important.
E. coli comprises diverse commensal and pathogenic lineages and is widely used as a model organism in molecular biology, genetics, and microbial ecology [5,6,7]. Pathogenic strains can cause intestinal and extraintestinal disease, and biofilm formation can support persistence on host tissues and abiotic surfaces. Biofilms are structured microbial communities embedded in a self-produced extracellular polymeric substance (EPS) matrix that commonly contains polysaccharides, proteins, extracellular DNA, lipids, and other components [8,9]. This matrix promotes surface retention, creates chemical and physiological heterogeneity, and can limit the activity of antimicrobial agents and host defenses [8,9,10].
Biofilm development is a dynamic process that includes surface attachment, microcolony formation, maturation, and dispersal, although these stages can overlap and vary according to the organism and environmental conditions [9]. In E. coli, matrix composition can include poly-β-1,6-N-acetyl-D-glucosamine (PNAG), cellulose, curli and other proteinaceous adhesins, and extracellular DNA; the relative contribution of these components is strain- and condition-dependent [8,11,12,13]. The DNABII family proteins HU and integration host factor (IHF) can help stabilize extracellular DNA networks within biofilm matrices; antibody-mediated targeting of these proteins has disrupted biofilms in experimental models [14]. DNABII-directed antibodies have also undergone early clinical evaluation, supporting interest in this family as a matrix-directed target without establishing efficacy for the enzymes or strains investigated here [15]. Consequently, an enzyme that is effective against one strain or developmental stage may have limited activity against another.
Matrix-directed enzymes have therefore been investigated as tools to reduce biofilm biomass or promote dispersal [10,16,17,18]. Glycoside hydrolases can cleave susceptible polysaccharide linkages, whereas proteases can alter proteinaceous matrix components. Recent work has demonstrated the potential of glucan-active enzymes for the degradation of E. coli biofilms, showing that recombinant exo- and endo-glucanases from Thermothelomyces thermophilus can reduce biofilm biomass, with the extent of degradation depending on the enzyme type and combination used [19]. Such approaches may increase access to conventional antimicrobials, but the release of viable dispersed cells and the stability, specificity, and delivery of enzymes must also be considered [16,17,18].
SdBgl1B is a glycoside hydrolase family 1 β-glycosidase from Saccharophagus degradans with preference for short β-linked glucosides (β-1,3 > β-1,4 ≫ β-1,6) [20]. Because some E. coli strains produce cellulose-containing matrices [11], SdBgl1B was evaluated as a candidate glucan-active enzyme, although it should not be considered equivalent to an endocellulase. Dispersin B (DspB), produced by Aggregatibacter actinomycetemcomitans, hydrolyzes PNAG and can detach PNAG-containing biofilms [21,22,23]. Papain is a broad-specificity cysteine protease from Carica papaya and has potential to alter protein-rich biofilm matrices [12,24,25].
The strain panel included four distinct E. coli isolates: the prototypical enteroaggregative E. coli (EAEC) reference strain 042 and three clinical extraintestinal isolates (1007, P180, and 23699) obtained from clinical sources and departmental collections. The published reference strain 042 (O44:H18) was originally isolated from a child with diarrhea in Lima, Peru, in 1983; its documented virulence-associated features include aggregative adherence fimbriae II (AAF/II) and the AggR regulatory system [26]. This reference-strain background is distinct from experimental characterization of the stocks used here. The clinical isolates were selected based on their verified capacity to form robust biofilms on polystyrene surfaces, providing a functional model to evaluate enzymatic antibiofilm activity under common assay conditions. Neither matrix composition nor antimicrobial-resistance phenotype was established by the present biomass assays.
The objective of this study was to compare the individual effects of SdBgl1B, DspB, and papain on (i) crystal-violet-stained biomass remaining after treatment of preformed E. coli biofilms and (ii) biofilm biomass formed during 24 h of enzyme exposure. The study was designed as an in vitro screening analysis across four E. coli strains; it did not directly measure matrix composition, enzymatic cleavage products, bacterial viability, or synergy between enzymes.
2. Materials and Methods
2.1. Bacterial Strains
The E. coli panel comprised the enteroaggregative reference strain 042 (EAEC O44:H18) and three clinical extraintestinal strains: 1007, P180, and 23699. The strains were provided by the Laboratory of Bacterial Pathogenicity, Department of Immunology, Institute of Biosciences, UNESP, Botucatu, Brazil. The published origin and genomic characterization of reference strain 042 are described by Chaudhuri et al. [26]. Strains 1007, P180, and 23699 are clinical extraintestinal isolates obtained from clinical sources and departmental collections [27]. The selection criterion for this panel was their verified baseline capacity to form robust biofilms on polystyrene microtiter plates, providing a standardized functional model to evaluate enzymatic antibiofilm activity. No antimicrobial-susceptibility measurements are reported in this study, and the panel is not designated as multidrug-resistant.
2.2. Expression and Purification of SdBgl1B and DspB
E. coli Rosetta™ (DE3) cells (Merck, Darmstadt, Germany) were transformed with the pETTRX1a/LIC-His6 construct for DspB or the pETTRXA-1a/LIC construct for SdBgl1B. Both enzymes had been cloned and functionally characterized previously [20,23].
Expression and purification were adapted from Brognaro et al. [20]. A pre-culture was prepared by inoculating 5 µL of glycerol stock into 5 mL of Luria–Bertani (LB) medium in a glass test tube with a loosely fitted cap containing kanamycin (50 µg/mL) and chloramphenicol (34 µg/mL), followed by overnight incubation at 37 °C and 180 rpm. The pre-culture was transferred to 1 L of LB medium in a 2 L unbaffled glass Erlenmeyer flask, containing the same antibiotics, and grown at 37 °C and 180 rpm to an optical density at 600 nm (OD600) of 0.6. Gene expression was induced by adding 1 mL of a 1 M IPTG stock solution (1 mM final concentration), and the culture was incubated overnight at 37 °C and 180 rpm. Cells were harvested by centrifugation at approximately 7500× g (7000 rpm) using a Sorvall RC6 Superspeed centrifuge (Thermo Fisher Scientific, Waltham, MA, USA) centrifuge for 30 min at 4 °C, and the pellet was resuspended in 50 mL of lysis buffer (50 mM Tris-HCl, pH 7.5, 300 mM NaCl, 0.25 mg/mL lysozyme, and 0.1 mM PMSF) and incubated on ice for 30 min. The suspension was sonicated on ice for eight 30 s cycles and centrifuged to clarify the sonicated lysate at approximately 34,600× g (17,000 rpm) for 40 min at 4 °C using a Sorvall centrifuge. The soluble fraction was loaded onto a column containing 2 mL of Ni Sepharose 6 Fast Flow resin (GE Healthcare, Chicago, IL, USA), washed with 10 column volumes of buffer A (50 mM Tris-HCl, pH 7.5, 300 mM NaCl, and 10 mM imidazole), and eluted with buffer B (50 mM Tris-HCl, pH 7.5, 300 mM NaCl, and 500 mM imidazole). Following elution, imidazole was removed and buffer exchange to McIlvaine buffer (pH 7.0) was performed via repeated centrifugal ultrafiltration using Amicon Ultra 30 kDa molecular weight cut-off (MWCO) centrifugal filter units (Merck Millipore, Tullagreen, Ireland). Elution fractions were analyzed by 12% SDS-PAGE, stained with Coomassie Brilliant Blue R-250 (Sigma-Aldrich, St. Louis, MO, USA), and destained with 10% (v/v) acetic acid (Merck, Darmstadt, Germany). Protein concentration was estimated using a NanoDrop 2000 spectrophotometer (Thermo Fisher Scientific, Wilmington, DE, USA).
2.3. Papain Source and Characteristics
Papain from papaya latex was purchased from Sigma-Aldrich (St. Louis, MO, USA; lot 129K7005). According to the supplier, the preparation had 82% purity and a specific activity of 28 units/mg. Concentrations of 0.03–1.00 mg/mL refer to the mass of the commercial preparation as supplied without correction for purity. Accordingly, the concentrations are nominal mass concentrations and are not directly equivalent to the catalytic activities of the recombinant glycosidase preparations.
2.4. Reduction in Preformed E. coli Biofilm Biomass Assessed by Crystal Violet Staining
The assay was adapted from Haney et al. [28] and the microtiter-plate crystal violet method described by O’Toole [29], with assay interpretation informed by comparisons of biofilm-quantification methods [30]. E. coli cultures were grown statically in 5 mL of LB broth (10 g/L tryptone, 5 g/L yeast extract, and 10 g/L NaCl) for 24 h at 37 °C. Cultures were diluted in LB broth to an optical density of 0.01, and 200 µL was transferred to each well of a 96-well plate. After static incubation for 24 h at 37 °C, the medium was removed and the wells were washed once with 200 µL of phosphate-buffered saline (PBS; 8 g/L NaCl, 0.2 g/L KCl, 1.44 g/L Na2HPO4, and 0.24 g/L KH2PO4; pH 7.0). SdBgl1B, DspB, or papain prepared in McIlvaine buffer (0.1 M citric acid and 0.2 M dibasic sodium phosphate; pH 7.0) was applied at 0.03, 0.06, 0.12, 0.25, 0.50, or 1.00 mg/mL and incubated for 4 h at 37 °C without agitation. After treatment, the solution was removed, and the wells were washed once with 200 µL of PBS. The attached material was stained with 200 µL of 0.5% (w/v) crystal violet (Sigma-Aldrich, St. Louis, MO, USA) for 5 min, washed three times with 200 µL of distilled water, and air-dried. Bound crystal violet was solubilized with 200 µL of 30% (v/v) acetic acid for 5 min, and absorbance was measured at 595 nm using a microplate reader (ELISA reader). Results were expressed relative to the corresponding control. The percentage of biofilm biomass reduction was determined using Equations (1) and (2).
The corresponding control and absorbance correction were defined as follows: the 100% biofilm control consisted of untreated bacterial cultures in the growth medium. Absorbance values were background-corrected by subtracting the blank (uninoculated growth medium). Enzyme-only staining controls were not included in this study. A buffer-only control matched to the enzyme treatment for McIlvaine-buffer exposure and handling is not documented for this comparison. Consequently, differences from the reported growth-medium control cannot be attributed exclusively to the enzyme preparation or its catalytic activity. Subtracting an uninoculated-medium blank does not exclude preparation-dependent staining contributions. The endpoint is the amount of crystal-violet-stained material remaining attached after washing; a decrease does not by itself distinguish loss of extracellular matrix from detachment or death of cells.
2.5. Biofilm Formation in the Presence of Enzymes Assessed by Crystal Violet Staining
E. coli cultures were grown statically in 5 mL of LB broth for 24 h at 37 °C and diluted in fresh LB broth to an optical density of 0.01 (600 nm). SdBgl1B, DspB, or papain prepared in McIlvaine buffer (pH 7.0) was added at final concentrations of 0.03, 0.06, 0.12, 0.25, or 0.50 mg/mL. Aliquots of 200 µL were transferred to 96-well plates and incubated statically for 24 h at 37 °C. The medium was then removed, and the wells were washed once with 200 µL of PBS, stained with 200 µL of 0.5% (w/v) crystal violet for 5 min, washed three times with distilled water, and air-dried. Bound dye was solubilized with 200 µL of 30% (v/v) acetic acid for 5 min, and absorbance was measured at 595 nm. This assay quantified total attached biomass formed over 24 h in the presence of each enzyme and did not specifically isolate the initial-attachment stage. The percentage of biofilm biomass reduction was determined using equations 1 and 2. The 24 h formation assay tested five concentrations up to 0.50 mg/mL, whereas the 4 h preformed biofilm assay also included 1.00 mg/mL. Based on preliminary optimization experiments not included in the present dataset, the formation assay was limited to concentrations up to 0.50 mg/mL. No response at 1.00 mg/mL can be inferred for the formation assay, and omission of this concentration is not evidence of toxicity or growth inhibition.
Equivalence of the McIlvaine-buffer volume fraction across the tested enzyme concentrations and control wells is not documented. This limits separation of vehicle contributions from enzyme-preparation-associated changes in the 24 h endpoint; the reported differences are therefore treated as preliminary treatment-associated changes in retained stained material.
2.6. Statistical Analysis
Statistical analyses were performed using GraphPad Prism version 10.0.0 for Windows (Boston, MA, USA). For each enzyme–strain-concentration condition, the replication design comprised three independent biological replicates (N = 3) with three technical wells per independent experiment (n = 3). The experimental unit was the independent biological replicate, and the plotted means and standard deviations (SD) were calculated from the mean values of the three biological replicates, after averaging the technical triplicates within each experiment. Normality was assessed using the Shapiro–Wilk test on the raw observations. One-way analysis of variance (ANOVA) was followed by Tukey’s multiple-comparison test at a significance threshold of p < 0.05. The comparison family was defined separately for each enzyme–strain combination, comparing all tested concentration groups against each other and against the untreated control. Letter assignments are interpreted only within the specified comparison family.
Within a specified comparison family, bars sharing at least one lowercase letter are not significantly different by Tukey’s test (p ≥ 0.05); bars with no letters in common differ significantly (p < 0.05). For example, “ab” shares a group with “a” and with “b”, whereas “a” and “b” have no letter in common. A shared letter is not evidence of equivalence, and letters from different analysis families do not establish cross-strain significance or non-significance. Percent changes are descriptive treatment-to-control estimates; no cross-strain or cross-enzyme ranking is inferred from them.
3. Results
3.1. Expression, Purification, and Analysis of SdBgl1B and DspB
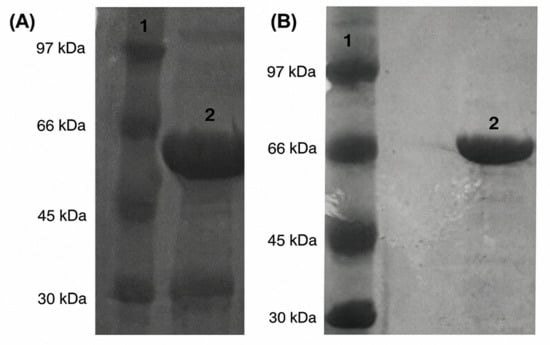
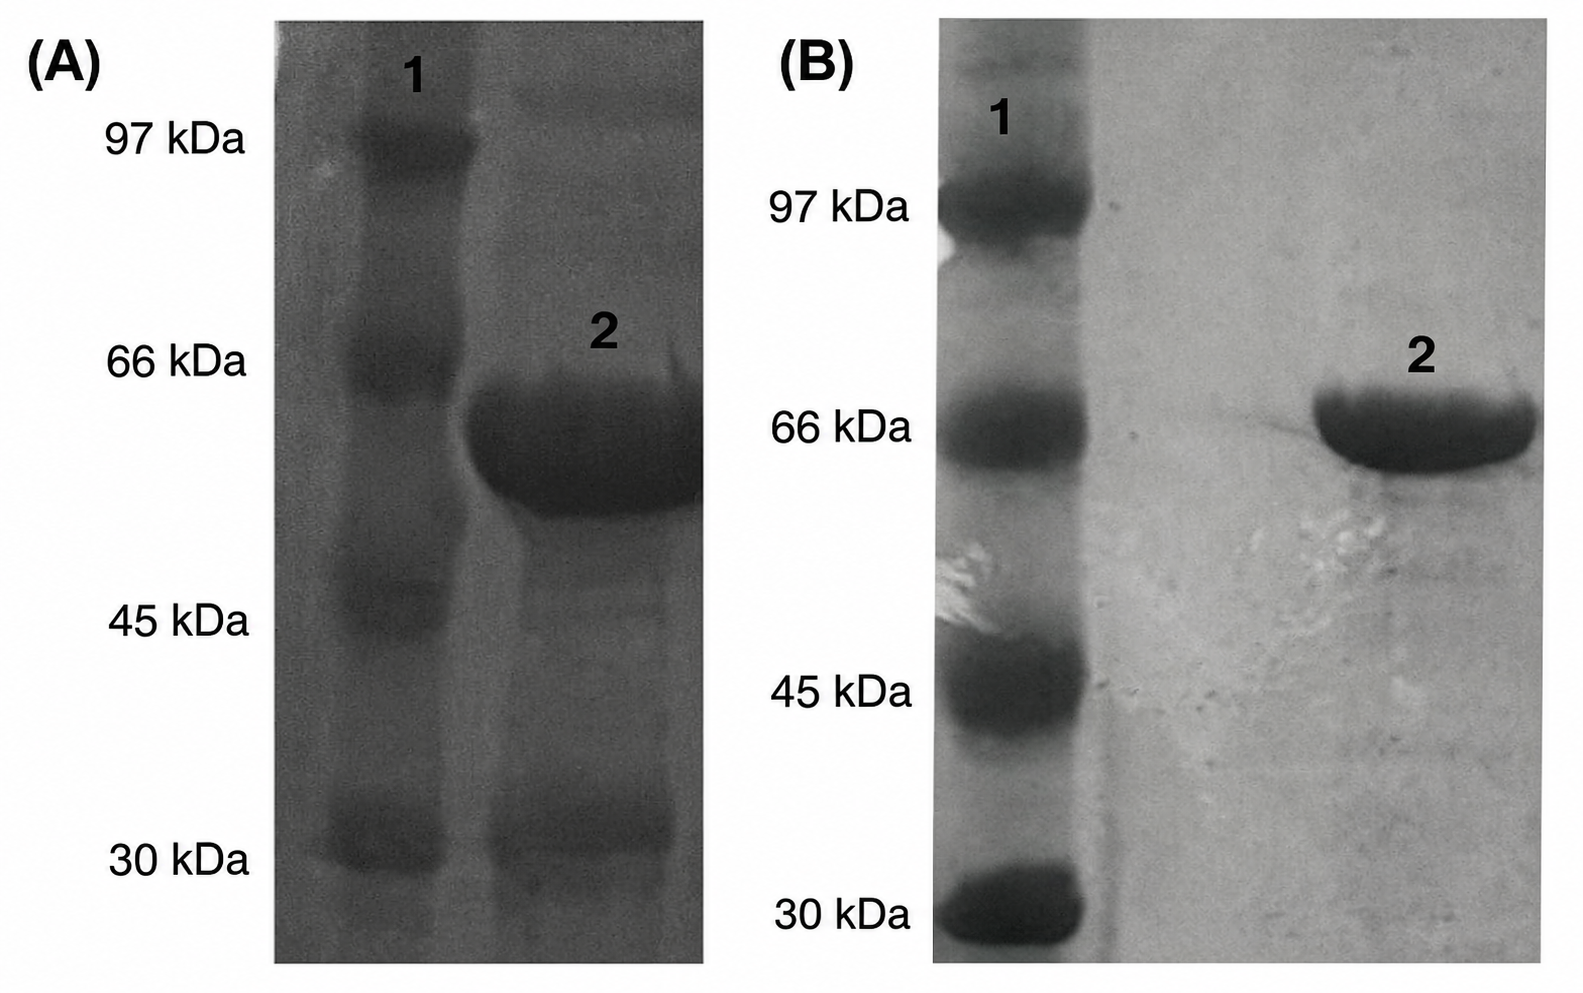
Recombinant expression yielded 44.15 mg/L SdBgl1B preparation and 8.53 mg/L DspB preparation, as estimated using a NanoDrop spectrophotometer. These values describe recovered protein preparations and are not purity-corrected target-enzyme yields. SDS-PAGE showed prominent bands at apparent molecular masses of approximately 66 kDa for SdBgl1B and approximately 60 kDa for DspB (Figure 1). The latter is a visual estimate from migration between the 45 and 66 kDa markers, rather than a sequence-derived mass. Additional bands and limited marker resolution are visible; the gel therefore provides qualitative evidence of enrichment but does not establish homogeneous preparations or a numerical purity percentage. A construct-specific theoretical mass is not reported because the complete expressed sequences, including retained fusion/tag residues, have not been verified for this comparison.
Figure 1.
Representative 12% SDS-PAGE analysis of DspB (A) and SdBgl1B (B) expression and purification. 1, molecular mass marker; 2, elution fraction with 500 mM imidazole. The original gel image is retained without selective image processing. Additional bands and limited marker resolution preclude a quantitative purity assessment; apparent molecular masses are approximate visual estimates.
3.2. Effects of Enzymes on Preformed Biofilm Biomass and Biofilm Formation
All percentage changes below are descriptive comparisons with the reported controls. Because vehicle contributions and preparation-dependent staining were not resolved, these observations are interpreted as treatment-associated changes in retained crystal-violet-stained material, not as isolated effects of catalytic enzyme activity (Section 2.4, Section 2.5 and Section 4.2).
3.2.1. SdBgl1B
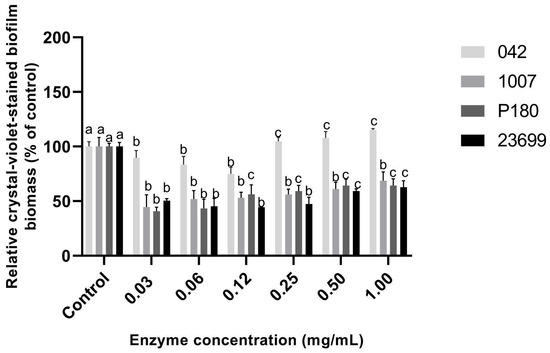
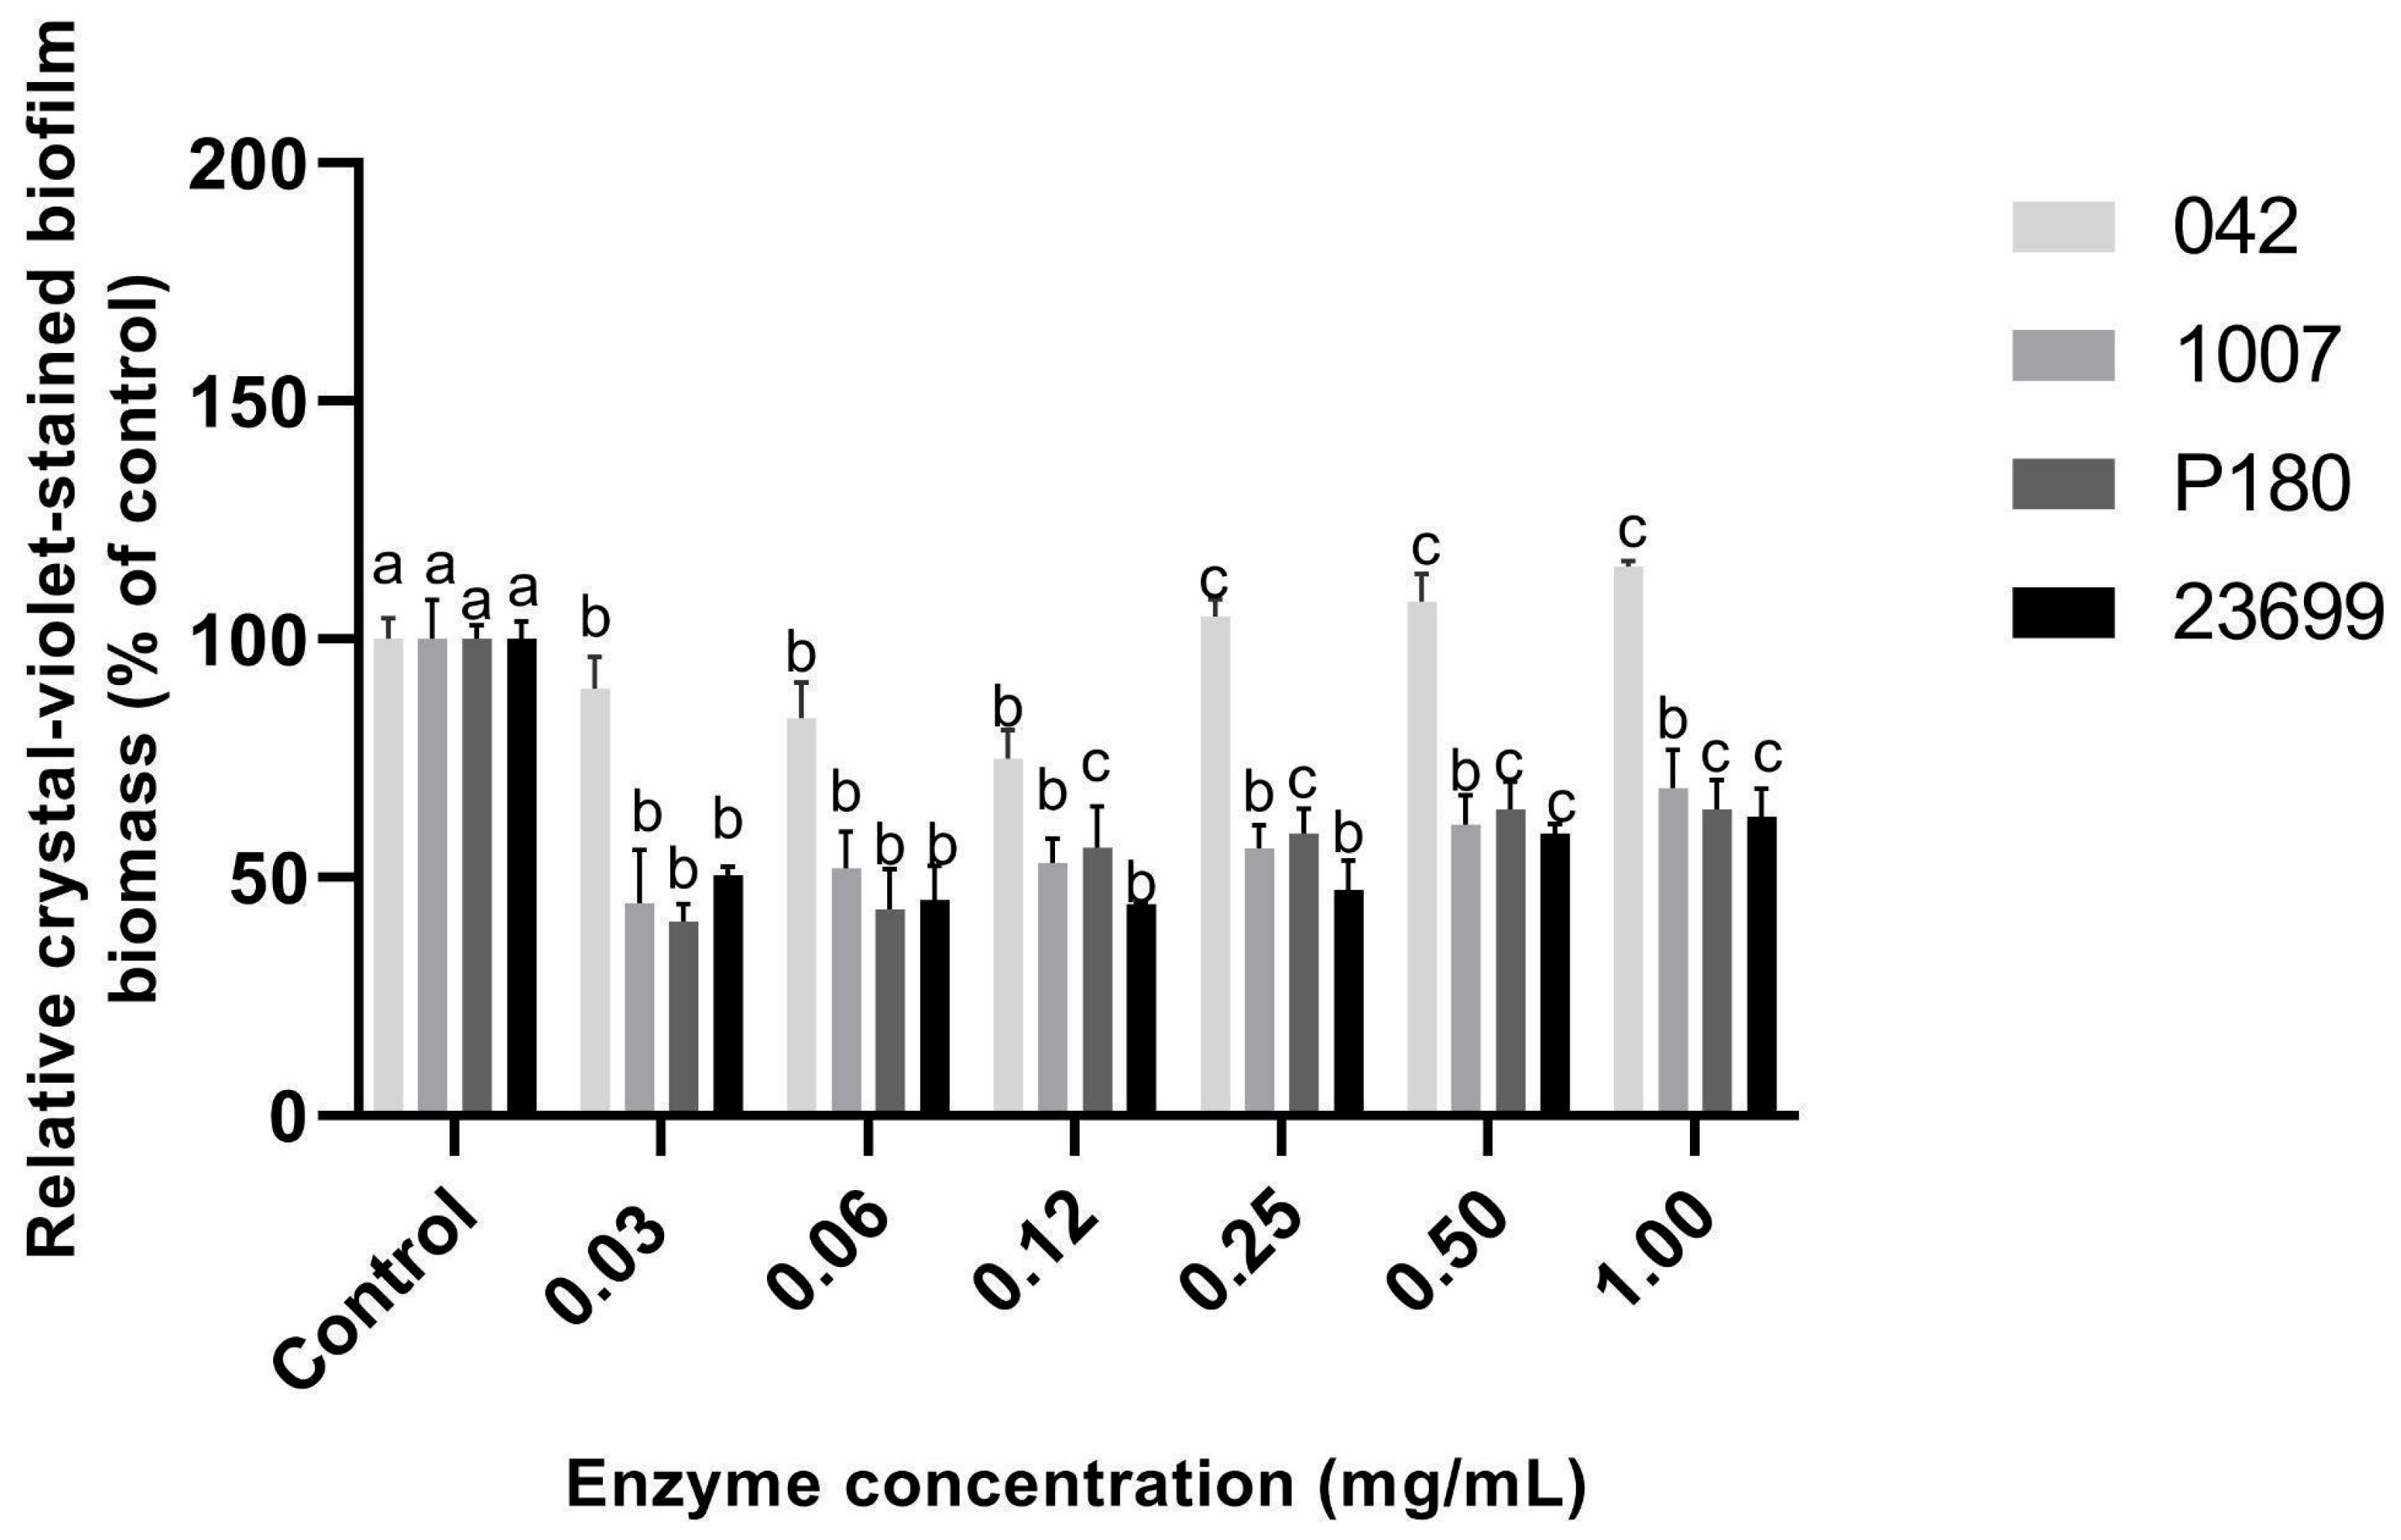
The effect of SdBgl1B on preformed crystal-violet-stained biomass varied across the four E. coli strains and was non-monotonic over the tested concentration range (Figure 2). For strain P180, treatment at 0.03 mg/mL left approximately 41% of the control signal, corresponding to an approximately 59% reduction; higher concentrations did not produce progressively larger reductions. This percentage is a descriptive within-strain change and does not demonstrate superiority over strains 1007 or 23699 at 0.03 mg/mL. For strain 23699, 0.06 and 0.12 mg/mL produced similar mean reductions of approximately 55%. The two lowest concentrations tested were 0.03 and 0.06 mg/mL. Strain 042 showed little reduction at the lower concentrations and crystal violet signals at or above the control at concentrations of 0.25 mg/mL or higher. Thus, increasing nominal enzyme concentration did not consistently decrease the measured endpoint.
Figure 2.
Relative crystal-violet-stained biomass of preformed E. coli biofilms after 4 h of SdBgl1B treatment. Bars represent means; error bars represent SD. Data are derived from three independent biological replicates (N = 3), each assayed in technical triplicates (n = 3). The Tukey comparison family was evaluated separately for each bacterial strain, comparing all enzyme concentrations against each other and against the untreated control. Within that family, bars sharing at least one lowercase letter are not significantly different (p 0.05); bars with no letters in common differ significantly (p < 0.05). Letters from separate comparison families must not be used for cross-strain comparisons. The vertical scale is 0–200% with 50-percentage-point intervals.
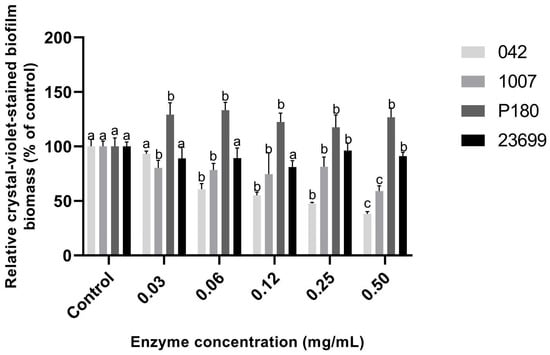
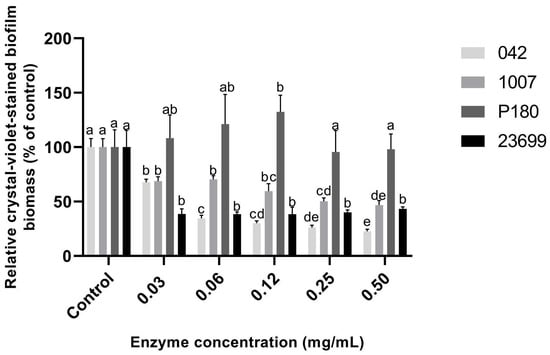
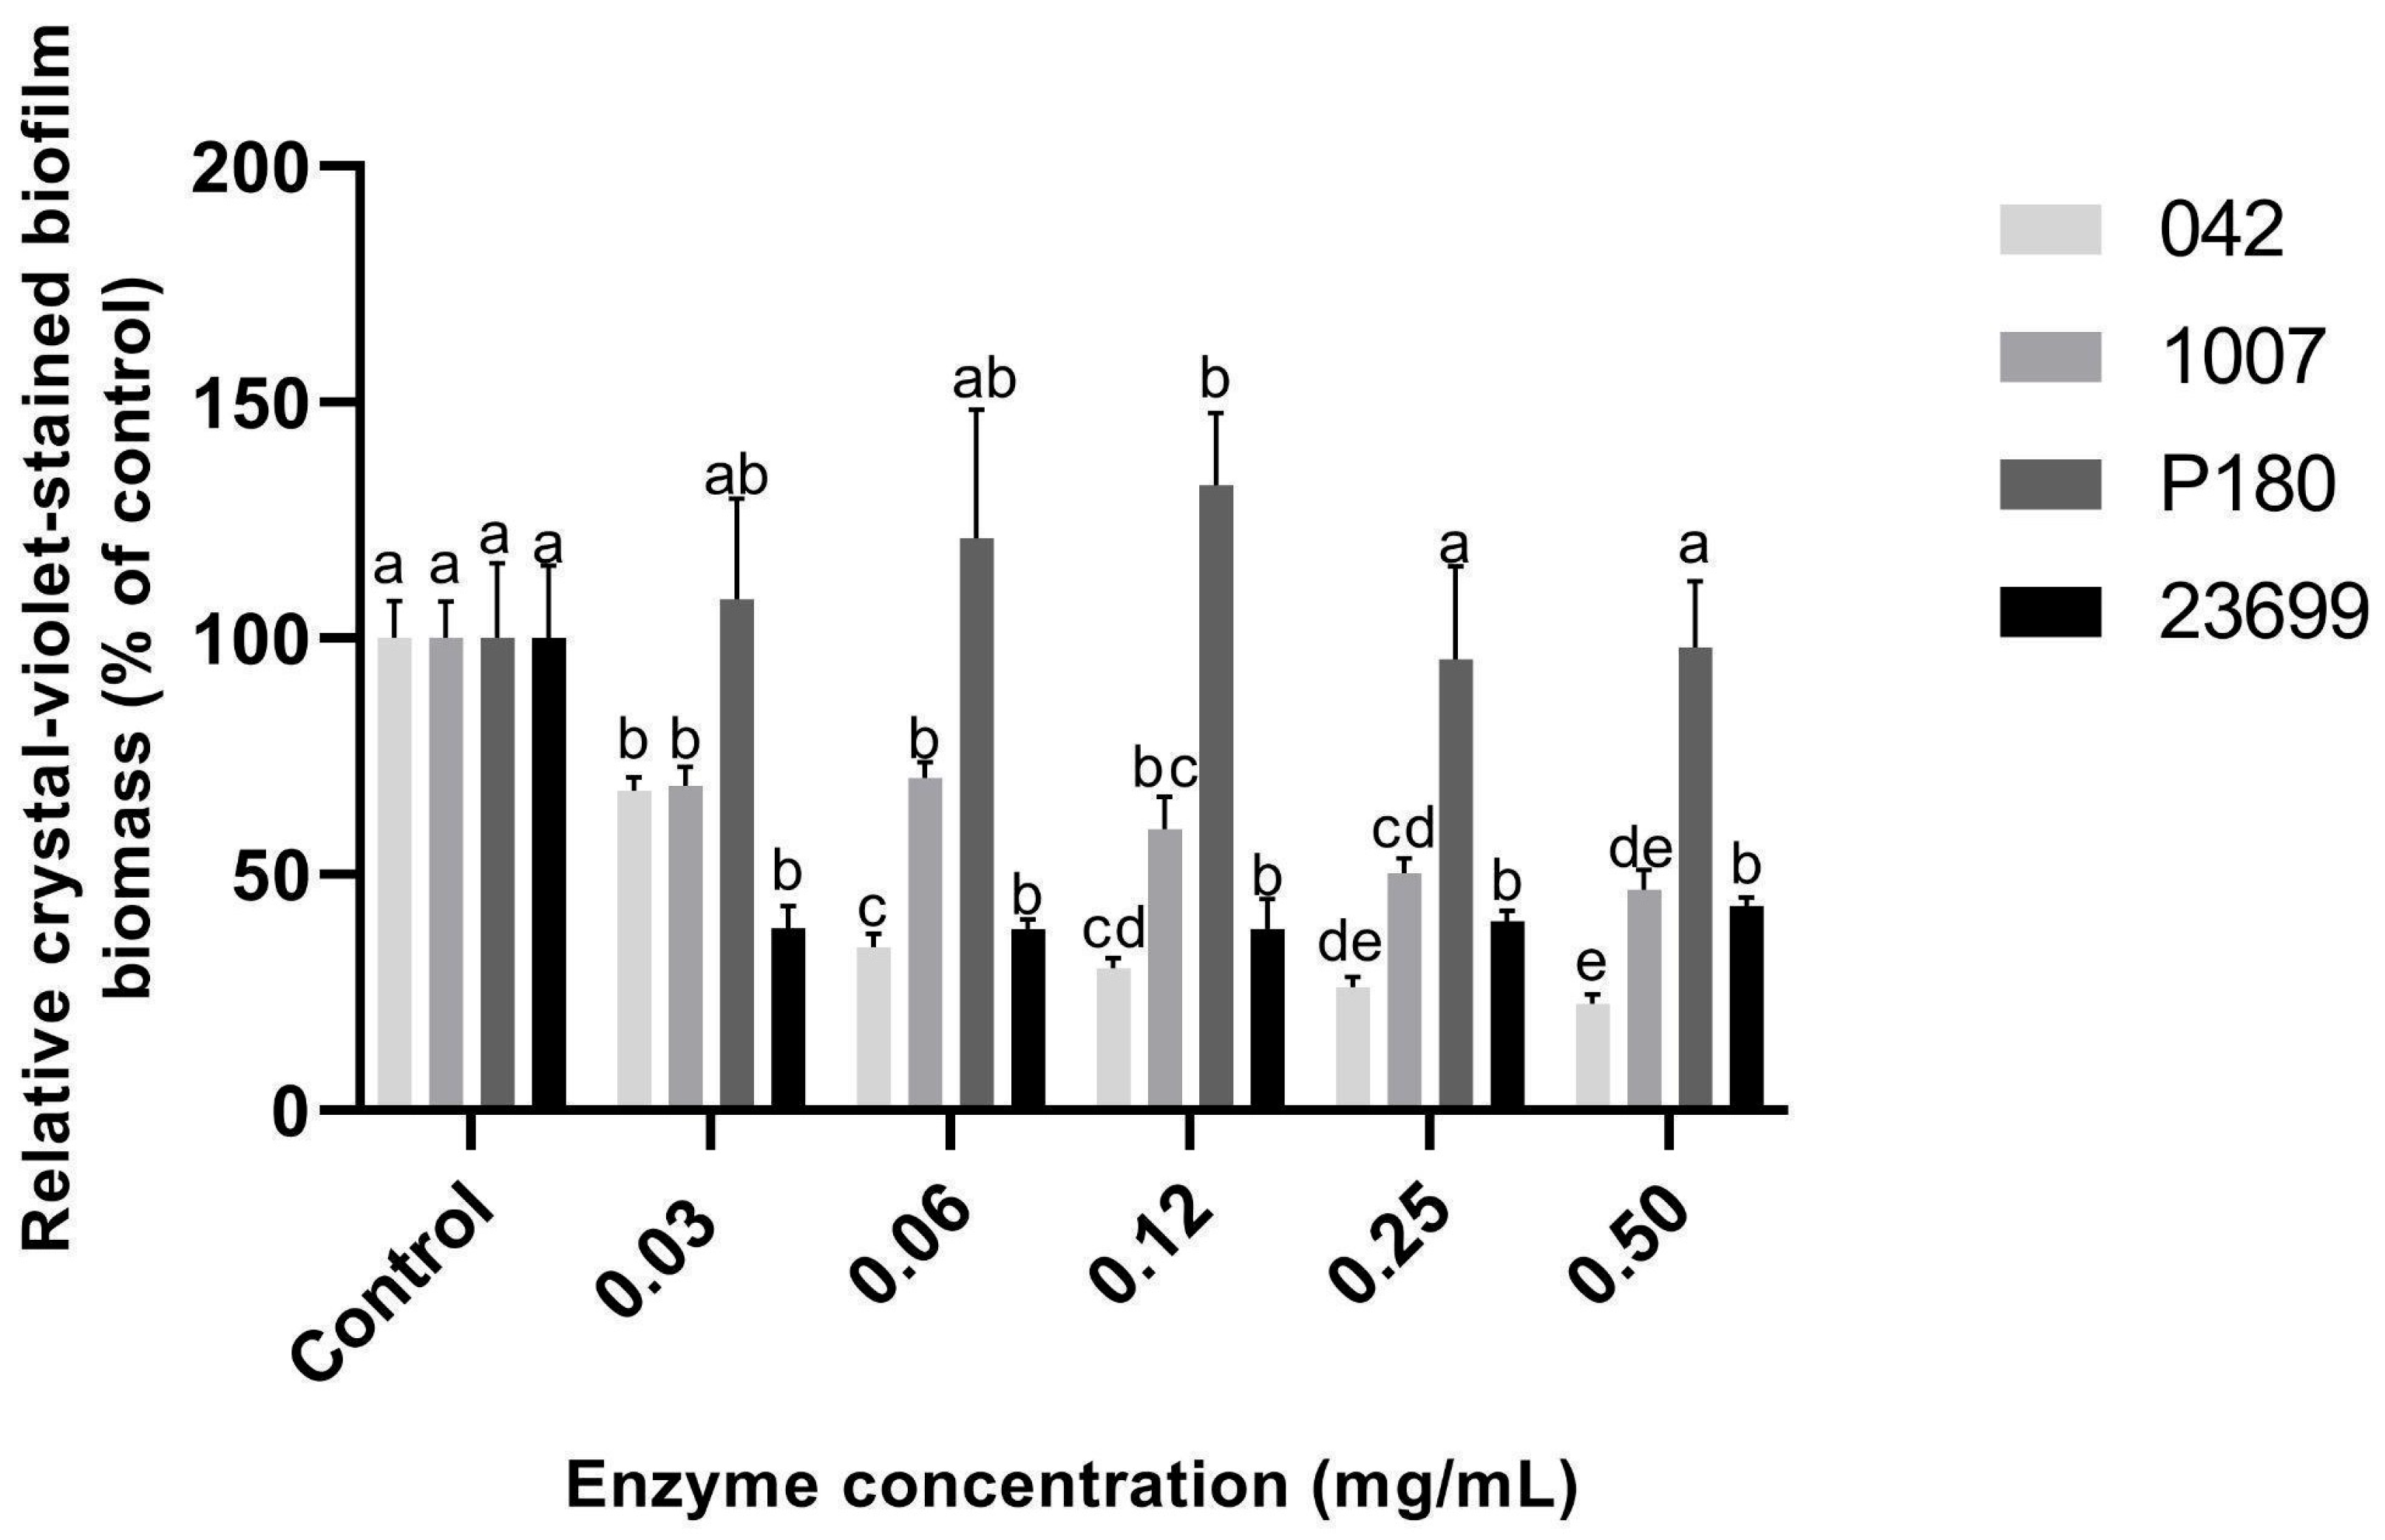
SdBgl1B also produced variable changes in biomass formed during 24 h of exposure (Figure 3). For strain 042, the largest observed mean reduction in attached stained biomass occurred at 0.50 mg/mL, corresponding to approximately 62% relative to its control. Strain 1007 showed reductions at all tested concentrations, with a maximum reported reduction of 40.8% at 0.50 mg/mL. The response of strain 23699 was limited (3.7–18.9% reduction), whereas strain P180 produced relative crystal violet signals of approximately 117–133% of its control. These above-control signals indicate more retained stained material, not demonstrated increases in viable-cell number or EPS production. As in the preformed biofilm assay, the response cannot be described as a uniformly increasing effect of enzyme concentration.
Figure 3.
Relative crystal-violet-stained biomass formed by E. coli during 24 h of exposure to SdBgl1B. Bars represent means; error bars represent SD. Data are derived from three independent biological replicates (N = 3), each assayed in technical triplicates (n = 3). The Tukey comparison family was evaluated separately for each bacterial strain, comparing all enzyme concentrations against each other and against the untreated control. Within that family, bars sharing at least one lowercase letter are not significantly different (p 0.05); bars with no letters in common differ significantly (p < 0.05). Letters from separate comparison families must not be used for cross-strain comparisons. The vertical scale is 0–200% with 50-percentage-point intervals.
3.2.2. DspB
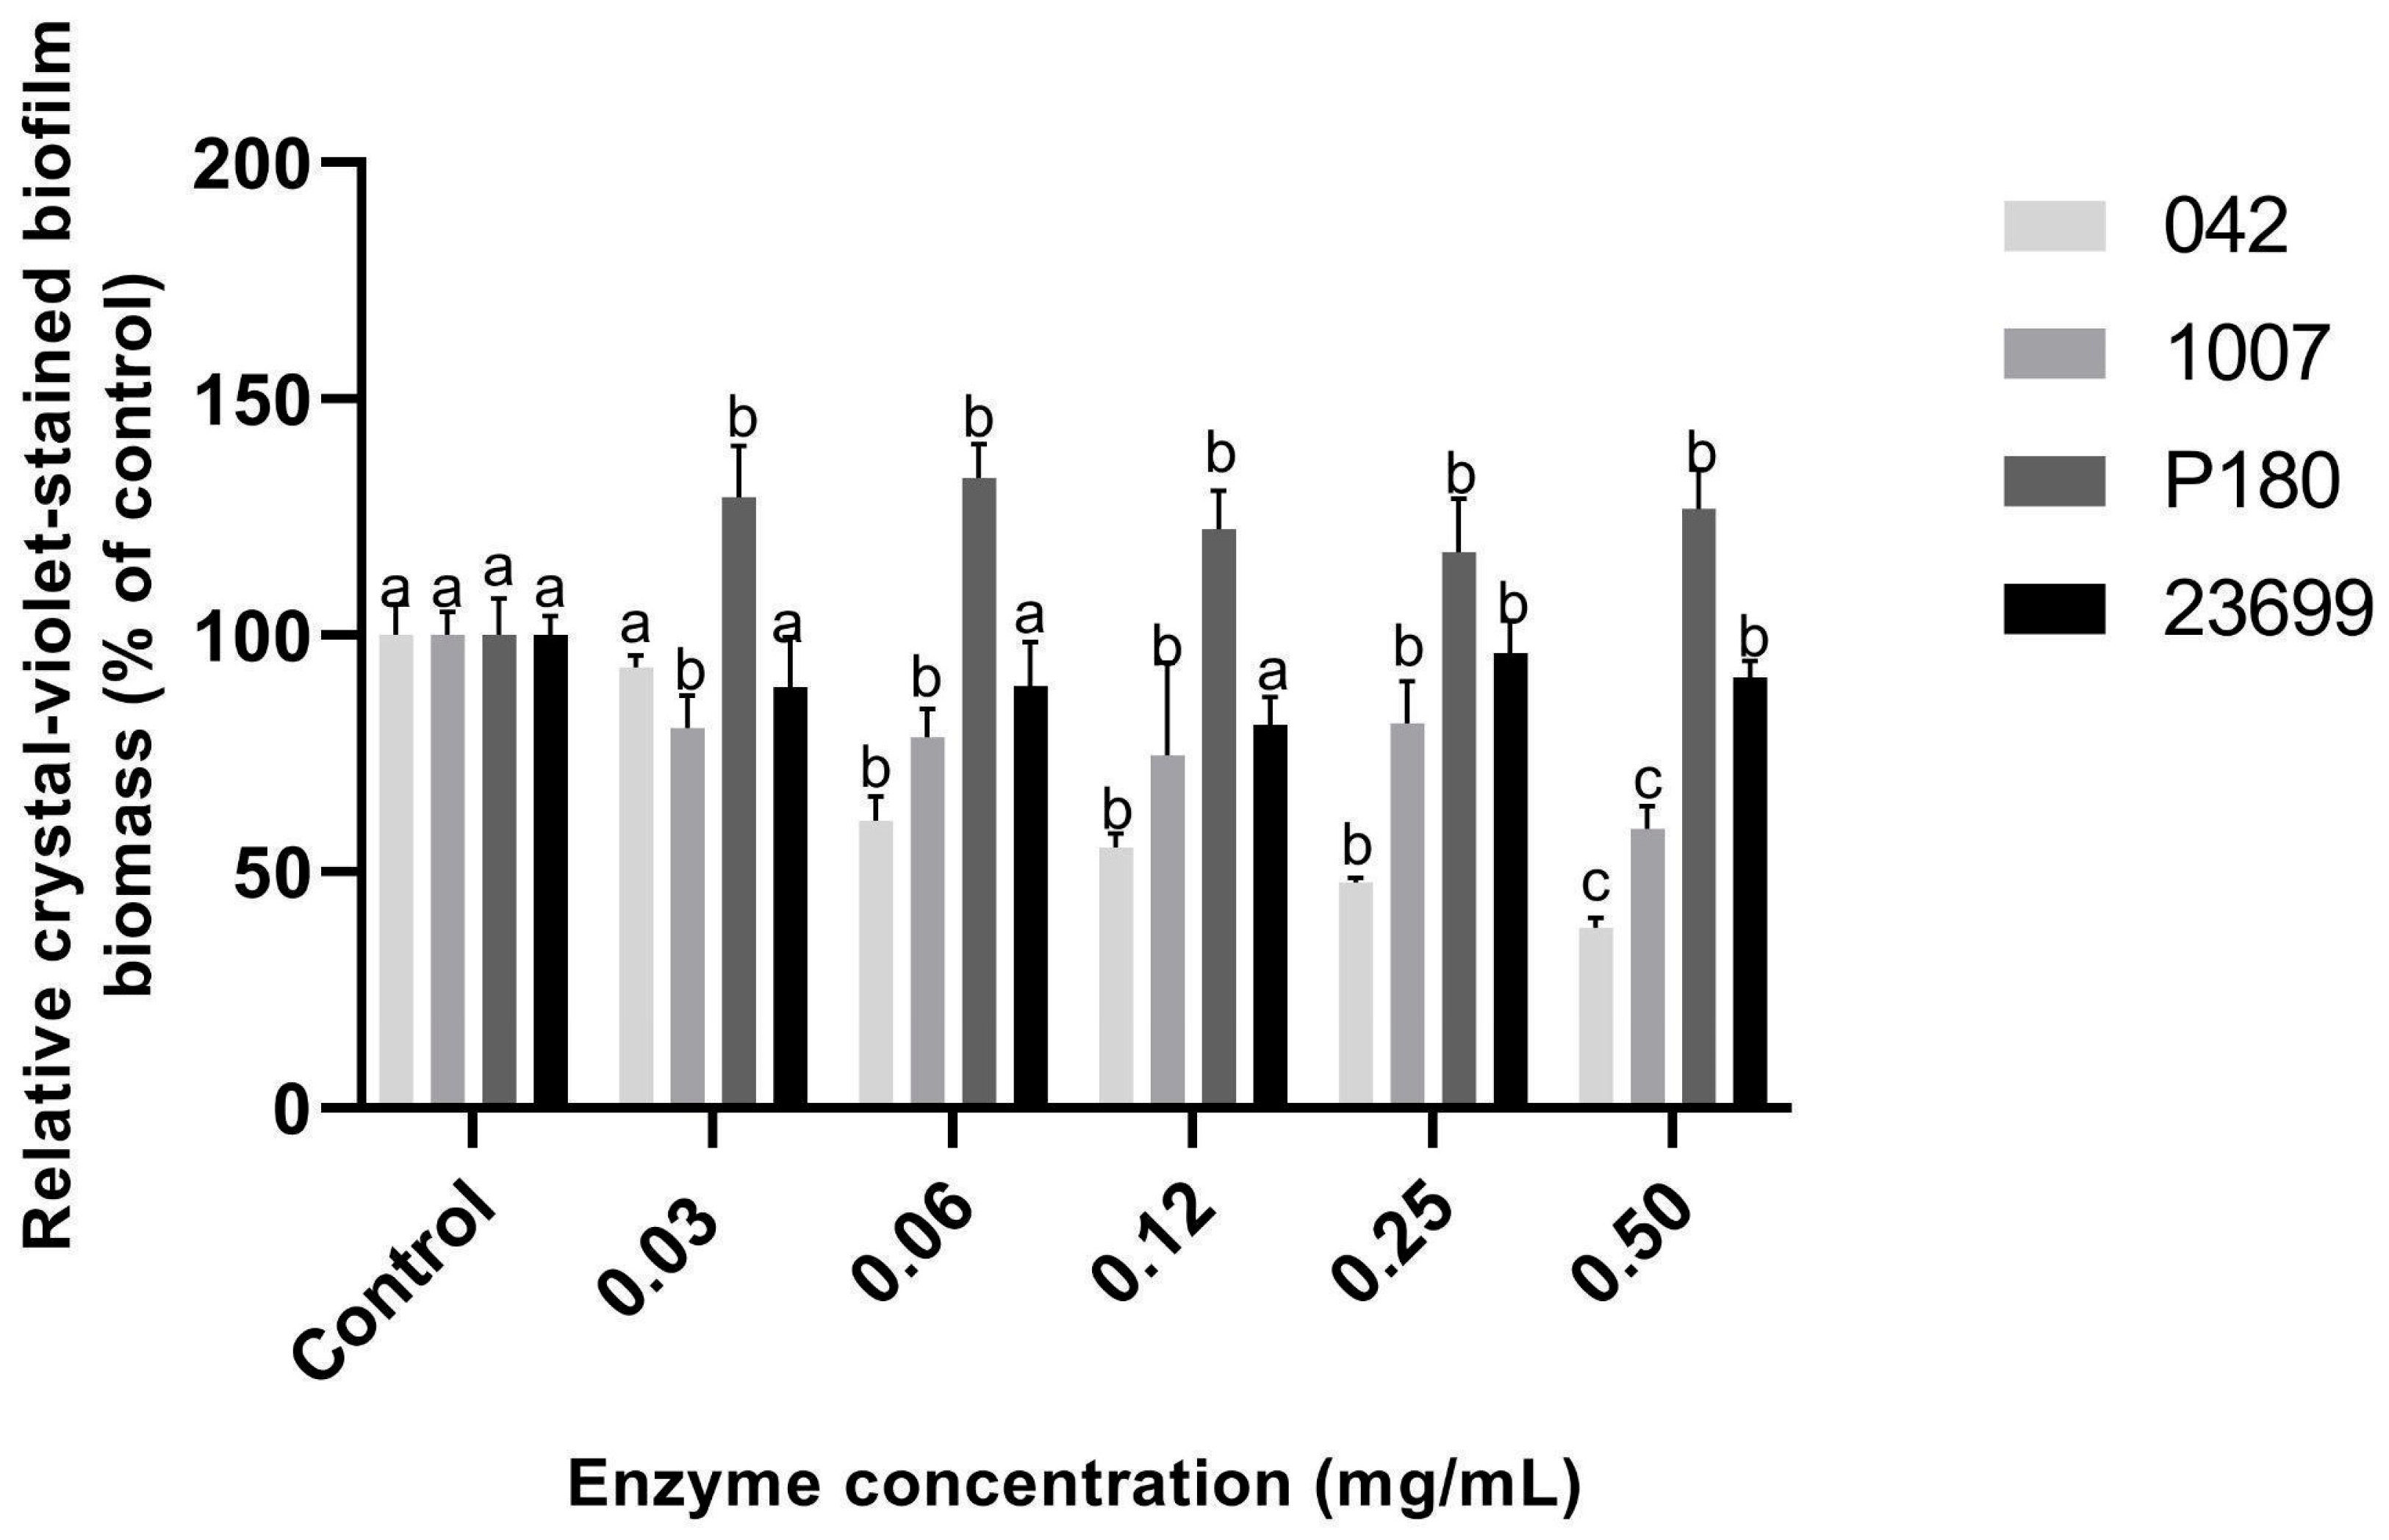
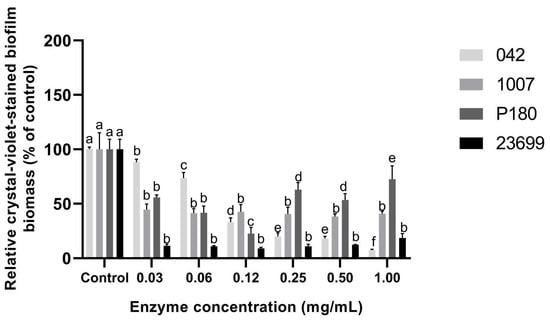
DspB produced variable reductions in preformed crystal-violet-stained biomass (Figure 4). Strain 23699 showed approximately 67–72% reductions across the tested concentration range, with similar mean responses across concentrations. For strain P180, the maximum reported reduction was 57.1% at 0.06 mg/mL. For strain 1007, the largest reported reductions (approximately 44–45%) occurred at 0.03 and 0.06 mg/mL. The response of strain 042 was weaker numerically and became minimal at the highest concentrations. These profiles were not consistently monotonic and do not identify a shared optimal concentration for all strains.
Figure 4.
Relative crystal-violet-stained biomass of preformed E. coli biofilms after 4 h of DspB treatment. Bars represent means; error bars represent SD. Data are derived from three independent biological replicates (N = 3), each assayed in technical triplicates (n = 3). The Tukey comparison family was evaluated separately for each bacterial strain, comparing all enzyme concentrations against each other and against the untreated control. Within that family, bars sharing at least one lowercase letter are not significantly different (p 0.05); bars with no letters in common differ significantly (p < 0.05). Letters from separate comparison families must not be used for cross-strain comparisons. The vertical scale is 0–200% with 50-percentage-point intervals.
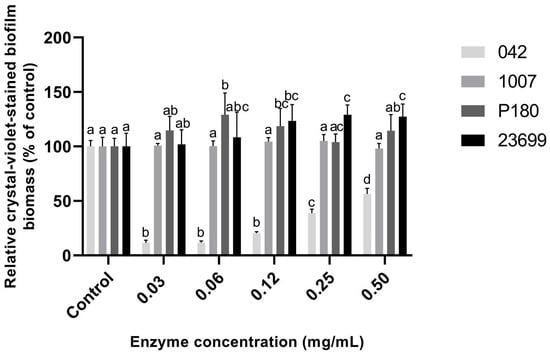
When DspB was present during biofilm formation, strain 042 showed a marked reduction in attached stained biomass (Figure 5). At 0.03 and 0.06 mg/mL, the remaining signal was approximately 11% of the control (approximately 89% reduction); the mean response at 0.12 mg/mL was also low. The numerical reduction decreased at 0.25 and 0.50 mg/mL, which left approximately 39% and 57% of the control signal, respectively. Strain 1007 showed no appreciable reduction in the reported profile, whereas strains P180 and 23699 produced relative crystal violet signals above the control at several concentrations. The latter observation is not sufficient to establish stimulation of growth, matrix synthesis, or a hormetic response.
Figure 5.
Relative crystal-violet-stained biomass formed by E. coli during 24 h of exposure to DspB. Bars represent means; error bars represent SD. Data are derived from three independent biological replicates (N = 3), each assayed in technical triplicates (n = 3). The Tukey comparison family was evaluated separately for each bacterial strain, comparing all enzyme concentrations against each other and against the untreated control. Within that family, bars sharing at least one lowercase letter are not significantly different (p 0.05); bars with no letters in common differ significantly (p < 0.05). Letters from separate comparison families must not be used for cross-strain comparisons. The vertical scale is 0–200% with 50-percentage-point intervals.
3.2.3. Papain
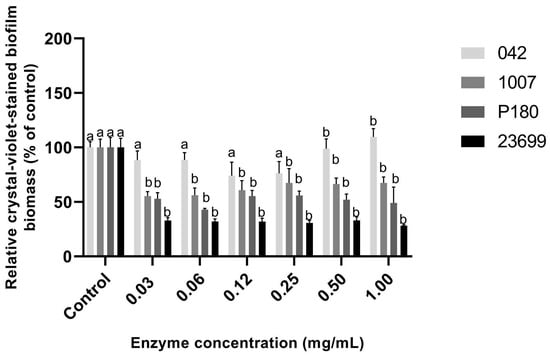
Papain produced substantial numerical reductions in preformed crystal-violet-stained biomass (Figure 6). For strain 042, the largest reported reduction was 92.4% at 1.00 mg/mL; 0.25 and 0.50 mg/mL produced similar mean reductions of approximately 80–82%. Strain 23699 showed reductions of 81.4–90.8% across all tested concentrations. Strain 1007 showed reductions of approximately 55–62%, whereas strain P180 reached a maximum reported reduction of 77.3% at 0.12 mg/mL. For P180, higher concentrations did not increase the numerical reduction, again indicating a non-monotonic profile. These percentages refer to attached stained biomass and not to the fraction of cells killed or matrix specifically degraded.
Figure 6.
Relative crystal-violet-stained biomass of preformed E. coli biofilms after 4 h of papain treatment. Bars represent means; error bars represent SD. Data are derived from three independent biological replicates (N = 3), each assayed in technical triplicates (n = 3). The Tukey comparison family was evaluated separately for each bacterial strain, comparing all enzyme concentrations against each other and against the untreated control. Within that family, bars sharing at least one lowercase letter are not significantly different (p 0.05); bars with no letters in common differ significantly (p < 0.05). Letters from separate comparison families must not be used for cross-strain comparisons. The vertical scale is 0–200% with 50-percentage-point intervals.
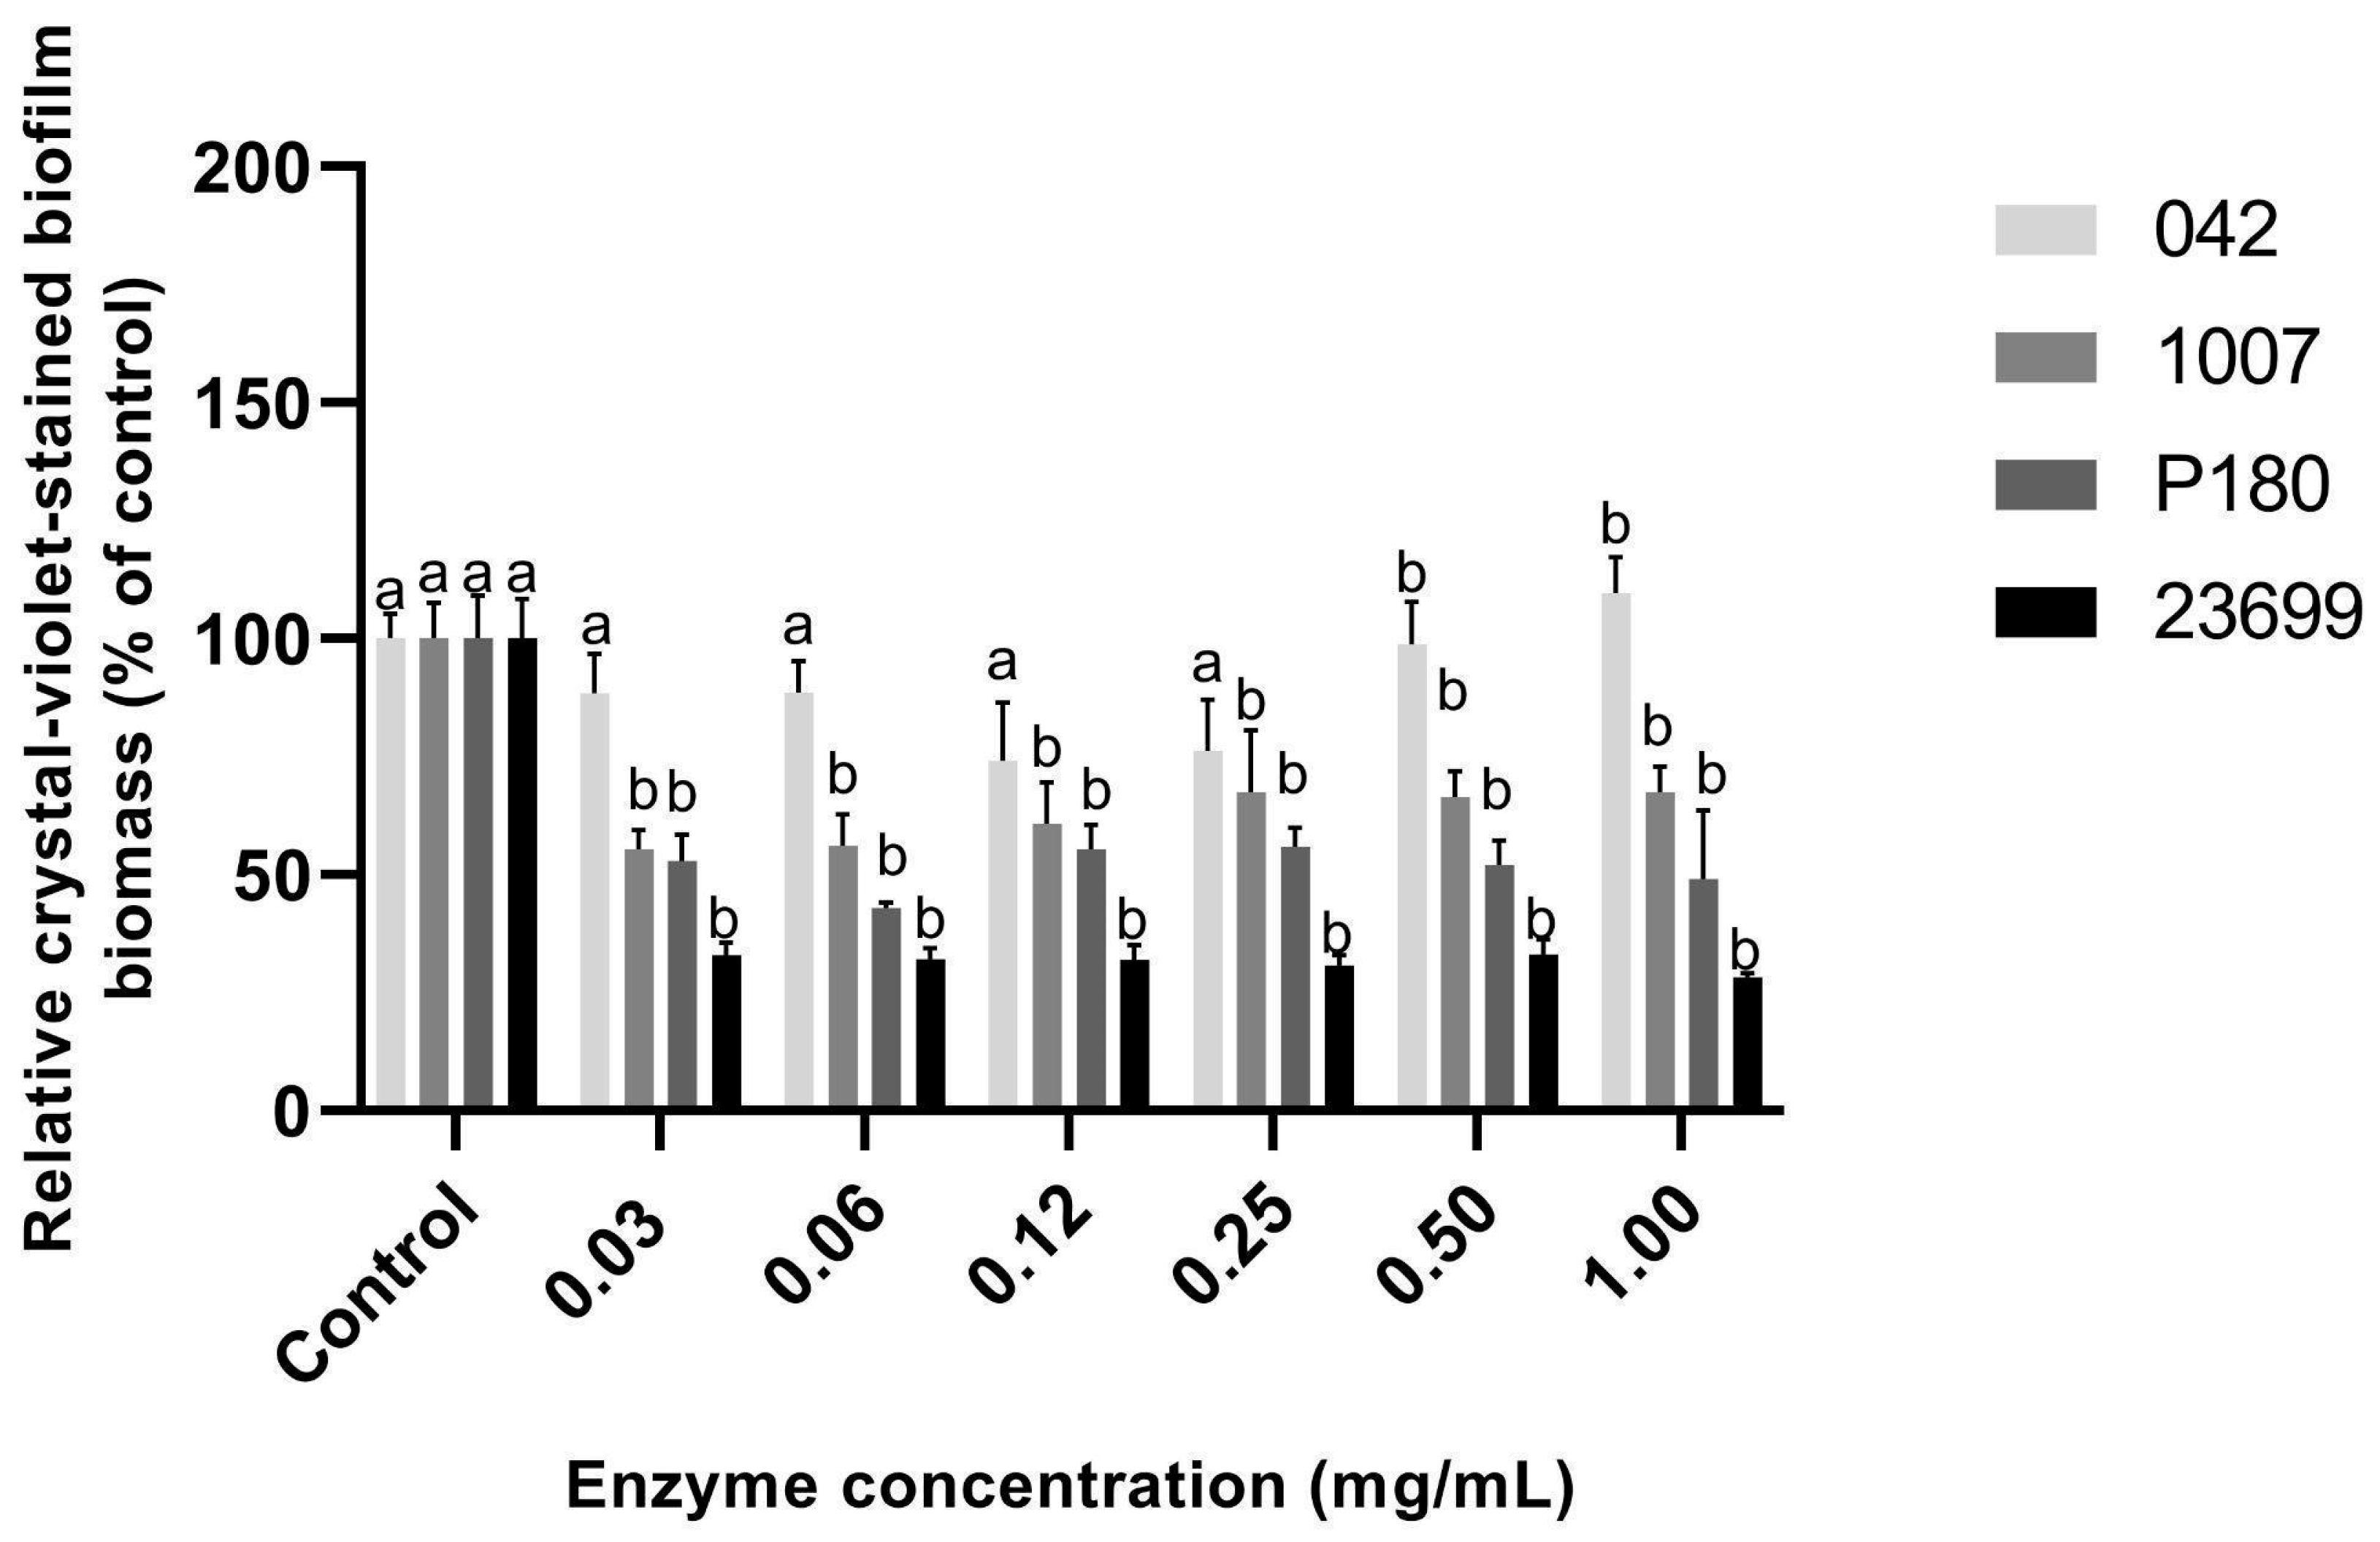
Papain also altered biomass formed during the 24 h assay (Figure 7). For strains 042 and 1007, all tested concentrations reduced the mean attached biomass signal relative to the corresponding control, with the largest reported reductions at 0.50 mg/mL: approximately 77% for strain 042 and 53% for strain 1007. Strain 23699 showed reduced mean signals across the concentration range. Strain P180 showed no reduction at 0.25 or 0.50 mg/mL and produced a signal above the control at 0.12 mg/mL. The P180 profile was non-monotonic; the above-control signal cannot distinguish a biological change from altered retention or staining of attached material.
Figure 7.
Relative crystal violet-stained biomass formed by E. coli during 24 h of exposure to papain. Bars represent means; error bars represent SD. Data are derived from three independent biological replicates (N = 3), each assayed in technical triplicates (n = 3). The Tukey comparison family was evaluated separately for each bacterial strain, comparing all enzyme concentrations against each other and against the untreated control. Within that family, bars sharing at least one lowercase letter are not significantly different (p 0.05); bars with no letters in common differ significantly (p < 0.05). Letters from separate comparison families must not be used for cross-strain comparisons. The vertical scale is 0–200% with 50-percentage-point intervals.
A summary of the reported changes in biofilm biomass for each enzyme-strain combination is presented in Table 1.
Table 1.
Descriptive summary of reported changes in crystal-violet-stained biomass for each enzyme–strain combination.
4. Discussion
4.1. Interpretation of the Biomass-Screening Results
SdBgl1B produced an approximately 59% reduction in the preformed P180 signal at the lowest tested concentration and reduced preformed biomass of 23699 at 0.06–0.12 mg/mL. These are descriptive observations, not evidence that P180 responds significantly more than other strains at a shared concentration. When present during biofilm formation, SdBgl1B reduced the signal for strain 042 by approximately 62% at 0.50 mg/mL. SdBgl1B is a GH1 β-glycosidase with preference for short β-linked glucosides rather than an endocellulase that directly attacks crystalline cellulose [20]. Hydrolysis of accessible glucan-derived substrates or indirect changes in biomass accumulation are possible explanations, but neither was measured here. Lim et al. [25] reported inhibition of E. coli O157:H7 biofilms using the commercial cellulase preparation Onozuka RS; that result does not establish cellulose cleavage by SdBgl1B in the present strains.
DspB hydrolyzes β-1,6-linked N-acetylglucosamine polymers and can detach PNAG-containing biofilms [21,22,23]. In the present study, it produced approximately 67–72% reductions in preformed 23699 biomass and approximately 89% less biomass formed by strain 042 at low concentrations. These observations are compatible with, but do not demonstrate, a contribution from accessible PNAG. The pgaABCD locus has been linked to polysaccharide adhesin synthesis in E. coli [13]; this general finding does not establish that strain 042 is critically dependent on PNAG under our assay conditions. PNAG abundance, pgaABCD expression, and substrate cleavage were not measured. Conversely, a weak response to DspB cannot be taken as proof that a strain lacks PNAG.
Papain produced substantial reductions in the preformed-biomass endpoint, including 92.4% for strain 042 and more than 80% for 23699. Proteins and proteinaceous fibers can contribute to adhesion and matrix organization alongside extracellular DNA and polysaccharides [8,12]. Proteinase K has reduced E. coli O157:H7 biofilms in a previous study [25], and papain has been investigated against Pseudomonas aeruginosa biofilms [31]. These reports provide a rationale for studying proteolytic preparations, but the present crystal violet measurements do not establish which proteins were cleaved or whether proteolysis caused the observed changes.
Although all four study strains (EAEC reference strain 042 and clinical isolates 1007, P180, and 23699) belong to E. coli, differences in matrix composition or expression could contribute to their distinct treatment responses. Matrix heterogeneity is documented in the literature [8,12], but comparative genetic, transcriptional, and matrix-composition measurements were not performed on this specific panel. Similar strain-dependent variability has been observed in enzymatic biofilm degradation in other bacterial species. Silva et al. [32] reported that the PgaB orthologue KaPgaB from Klebsiella aerogenes showed different levels of activity against biofilms formed by distinct Staphylococcus aureus strains, despite targeting a matrix-associated polysaccharide component. The authors suggested that differences in biofilm matrix composition may contribute to the observed variation in susceptibility [32]. Although this study involved S. aureus and a different enzyme, it provides a relevant cross-species comparison supporting the possibility that the abundance and accessibility of enzymatic targets may contribute to strain-specific responses to matrix-directed treatments. Accordingly, the results obtained across these four isolates must not be interpreted as a demonstrated separation between protein-dependent and polysaccharide-dependent biofilms, or generalized as a pathotype-wide response pattern across EAEC or extraintestinal clinical strains.
The structural contribution of proteins to biofilms is not restricted to conventional adhesins: extracellular DNABII proteins can stabilize DNA-containing matrix networks [14]. However, neither DNABII abundance nor susceptibility to papain was examined in this study. The greater numerical reductions observed with papain in several preformed biofilm conditions cannot therefore be attributed to cleavage of particular structural proteins or to a universal mechanism independent of polysaccharide composition.
Across several enzyme–strain combinations, increasing nominal enzyme concentration did not produce progressively lower crystal violet signals. Enzyme accessibility, retention, stability, and delivery are recognized considerations for matrix-directed interventions [33], but this study did not test these factors. Limited substrate accessibility, concentration-dependent changes in preparation behavior, or assay-related effects are hypotheses rather than demonstrated explanations for the non-monotonic profiles. The observed profiles do not justify a general dose-escalation recommendation or an activity optimum defined solely by mass concentration.
Above-control crystal violet signals, including the 117–133% signals for P180 during exposure to SdBgl1B, require particularly cautious interpretation. Possible explanations include altered attachment or cell aggregation, morphological changes affecting dye retention, adsorption of material from enzyme preparations, and staining or washing variability; changes in growth or matrix production are additional biological possibilities. None of these alternatives was distinguished experimentally. A hormetic response or compensatory EPS overproduction is therefore only an untested hypothesis, not a demonstrated adaptive defense mechanism. This distinction applies to above-control signals in all enzyme–strain combinations.
4.2. Limitations and Future Work
This study is limited to an exploratory static microtiter-plate screen using crystal violet, which measures total attached stained material [29,30]. No measurements of viable biofilm-associated cells, planktonic or released-cell populations, extracellular DNA, EPS, or total biofilm proteins were performed. Consequently, reductions in absorbance cannot distinguish matrix loss, altered growth, cellular detachment, or bactericidal activity, and do not establish eradication. Confocal laser scanning microscopy (CLSM) with viability and matrix stains was not performed; biofilm thickness, architecture, spatial viability, and matrix distribution therefore remain unresolved.
The control design also limits causal attribution. In the preformed biofilm assay, enzyme preparations in McIlvaine buffer were compared with the reported untreated growth-medium control, without a documented buffer-only control matched for vehicle exposure and handling. In the formation assay, an equivalent vehicle fraction across conditions is not documented. Enzyme-only staining controls were not included. Therefore, vehicle composition, preparation-derived material, dye retention, or washing may have contributed to the observed signals. These limitations do not demonstrate that the results are artefactual, but they prevent attribution of the observed changes exclusively to catalytic enzyme activity.
The biochemical characterization of the preparations is also limited. The available SDS-PAGE image contains additional bands and a poorly resolved marker, and no chromatographic profiles or quantitative purity measurements are presented. The contribution of co-purifying proteins or other preparation constituents cannot be excluded. Furthermore, nominal mass concentrations (0.03–1.00 mg/mL) do not establish comparable catalytic exposure across the enzymes; because papain was evaluated as supplied based on total mass without adjusting for its 82% supplier purity and recombinant enzymes were qualitatively enriched, equal mass concentrations do not imply equivalent specific catalytic activities or molar enzyme quantities. Activity against the relevant matrix substrates was also not measured under the assay conditions. Additionally, a limitation when comparing assay formats is the difference in tested concentration ranges (up to 0.50 mg/mL for biofilm formation versus 1.00 mg/mL for preformed biofilms). The upper limit for the formation assay was based on preliminary optimization experiments not included in the present dataset; however, because cell viability was not directly measured, the omission of the 1.00 mg/mL dose should not be interpreted as evidence of bacterial toxicity or growth inhibition. These differing ranges, along with the exposure periods and the four-strain panel, further limit generalization and direct comparisons between assay formats. No clinical efficacy, safety, or superiority over antimicrobial treatment can be inferred.
Future work should pair the attached biomass assay with viable counts from both the attached biofilm and the planktonic/released fraction, together with growth measurements, eDNA, EPS, and total-protein quantification. CLSM with complementary viability and matrix stains would help characterize architecture and retain biomass. Mechanistic testing should also include better-characterized enzyme preparations; vehicle-only controls matched for buffer fraction, incubation, and washing; enzyme-only staining controls; catalytic-activity controls; and direct measurements of substrate cleavage or matrix composition. Only after these distinctions are established should enzyme combinations, papain-based formulations, and combinations with conventional antibiotics be assessed for synergy. No combination or synergy result is presented as evidence in the current study.
5. Conclusions
Under the static assay conditions tested, exposure to SdBgl1B, DspB, and papain preparations was associated with preparation-, strain-, concentration-, and assay-dependent changes in crystal-violet-stained attached biomass. Papain-treated wells showed a numerical reduction of up to 92.4% in the preformed biofilm signal for strain 042 at 1.00 mg/mL and substantial reductions for 23699. These values describe the measured biomass endpoint, not percentages of matrix degradation, bacterial killing, or biofilm eradication.
DspB-treated wells showed approximately 89% less biomass during formation by strain 042 at 0.03–0.06 mg/mL, whereas SdBgl1B-treated wells showed approximately 62% less biomass for the same strain at 0.50 mg/mL. These descriptive responses do not establish PNAG dependence, a specific matrix-cleavage mechanism, or statistically supported superiority across strains or enzymes. Non-monotonic profiles and above-control signals were observed, but their causes remain unresolved; they do not demonstrate hormesis or compensatory EPS production.
The findings support further investigation of these preparations as modifiers of attached biofilm biomass rather than conclusions about therapeutic efficacy or a universal antibiofilm mechanism. These observations cannot be attributed exclusively to catalytic enzyme activity because the reported comparisons do not resolve possible vehicle effects or preparation-dependent staining. Viability, matrix composition, microscopy, purity, and appropriately vehicle-, staining-, and activity-controlled studies, as outlined in Section 4.2, are needed before mechanism or translational value can be established.
Author Contributions
Conceptualization, I.P., M.d.O.N., J.P.S., P.R.V.H. and J.C.P.; methodology, J.C.P., R.T.H., J.P.S., P.R.V.H. and I.d.A.F.; validation, J.C.P. and E.F.L.; formal analysis, J.C.P. and E.F.L.; investigation, J.C.P. and E.F.L.; resources, I.d.A.F.; data curation, J.C.P. and E.F.L.; writing—original draft preparation, J.C.P.; writing—review and editing, J.C.P., E.F.L. and M.d.O.N.; visualization, J.C.P.; supervision, M.d.O.N., I.P. and R.T.H.; project administration, M.d.O.N. and I.P.; funding acquisition, M.d.O.N. All authors have read and agreed to the published version of the manuscript.
Funding
This research was funded by Coordenação de Aperfeiçoamento de Pessoal de Nível Superior—Brasil (CAPES), Finance Code 001, and Fundação para o Desenvolvimento Médico e Hospitalar (FAMESP), grant number 973604/2024.
Data Availability Statement
The data presented in this study are available on request from the corresponding author.
Acknowledgments
The authors thank the Laboratory of Bacterial Pathogenicity (Department of Immunology, Institute of Biosciences, UNESP, Botucatu) for providing the E. coli strains and for technical and scientific support. The authors also thank the Molecular Biotechnology Group at the Institute of Physics of São Carlos, University of São Paulo (IFSC-USP), for providing the enzymes used in this study. During the preparation of this manuscript, the authors used Gemini (version July 2026, Google) for the purposes of statistical interpretation review and English language text editing and polishing. ChatGPT (GPT-5.6 Luna, OpenAI) was used to assist with English language editing, grammar refinement and structural formatting. The authors have reviewed and edited the output and take full responsibility for the content of this publication.
Conflicts of Interest
The authors declare no conflicts of interest.
References
- GBD 2021 Antimicrobial Resistance Collaborators. Global Burden of Bacterial Antimicrobial Resistance 1990–2021: A Systematic Analysis with Forecasts to 2050. Lancet 2024, 404, 1199–1226. [Google Scholar] [CrossRef] [Scilit] [PubMed]
- World Health Organization. Global Antibiotic Resistance Surveillance Report 2025; World Health Organization: Geneva, Switzerland, 2025; Available online: https://www.who.int/publications/i/item/9789240116337 (accessed on 8 September 2026).
- Sati, H.; Carrara, E.; Savoldi, A.; Hansen, P.; Garlasco, J.; Campagnaro, E.; Boccia, S.; Castillo-Polo, J.A.; Magrini, E.; Garcia-Vello, P.; et al. The WHO Bacterial Priority Pathogens List 2024: A Prioritisation Study to Guide Research, Development, and Public Health Strategies against Antimicrobial Resistance. Lancet Infect. Dis. 2025, 25, 1033–1043. [Google Scholar] [CrossRef] [Scilit] [PubMed]
- World Health Organization. WHO Bacterial Priority Pathogens List, 2024: Bacterial Pathogens of Public Health Importance to Guide Research, Development and Strategies to Prevent and Control Antimicrobial Resistance; World Health Organization: Geneva, Switzerland, 2024; Available online: https://www.who.int/publications/i/item/9789240093461 (accessed on 1 July 2026).
- Cobo-Simón, M.; Hart, R.; Ochman, H. Escherichia coli: What Is and Which Are? Mol. Biol. Evol. 2023, 40, msac273. [Google Scholar] [CrossRef] [Scilit] [PubMed]
- Foster-Nyarko, E.; Pallen, M.J. The Microbial Ecology of Escherichia coli in the Vertebrate Gut. FEMS Microbiol. Rev. 2022, 46, fuac008. [Google Scholar] [CrossRef] [Scilit] [PubMed]
- Kaper, J.B.; Nataro, J.P.; Mobley, H.L.T. Pathogenic Escherichia coli. Nat. Rev. Microbiol. 2004, 2, 123–140. [Google Scholar] [CrossRef] [Scilit] [PubMed]
- Flemming, H.-C.; Wingender, J. The Biofilm Matrix. Nat. Rev. Microbiol. 2010, 8, 623–633. [Google Scholar] [CrossRef] [Scilit] [PubMed]
- Sauer, K.; Stoodley, P.; Goeres, D.M.; Hall-Stoodley, L.; Burmølle, M.; Stewart, P.S.; Bjarnsholt, T. The Biofilm Life Cycle: Expanding the Conceptual Model of Biofilm Formation. Nat. Rev. Microbiol. 2022, 20, 608–620. [Google Scholar] [CrossRef] [Scilit] [PubMed]
- Koo, H.; Allan, R.N.; Howlin, R.P.; Stoodley, P.; Hall-Stoodley, L. Targeting Microbial Biofilms: Current and Prospective Therapeutic Strategies. Nat. Rev. Microbiol. 2017, 15, 740–755. [Google Scholar] [CrossRef] [Scilit] [PubMed]
- Da Re, S.; Ghigo, J.-M. A CsgD-Independent Pathway for Cellulose Production and Biofilm Formation in Escherichia coli. J. Bacteriol. 2006, 188, 3073–3087. [Google Scholar] [CrossRef] [Scilit] [PubMed]
- Ballén, V.; Cepas, V.; Ratia, C.; Gabasa, Y.; Soto, S.M. Clinical Escherichia coli: From Biofilm Formation to New Antibiofilm Strategies. Microorganisms 2022, 10, 1103. [Google Scholar] [CrossRef] [Scilit] [PubMed]
- Wang, X.; Preston, J.F., III; Romeo, T. The pgaABCD Locus of Escherichia coli Promotes the Synthesis of a Polysaccharide Adhesin Required for Biofilm Formation. J. Bacteriol. 2004, 186, 2724–2734. [Google Scholar] [CrossRef] [Scilit] [PubMed]
- Goodman, S.D.; Obergfell, K.P.; Jurcisek, J.A.; Novotny, L.A.; Downey, J.S.; Ayala, E.A.; Tjokro, N.; Li, B.; Justice, S.S.; Bakaletz, L.O. Biofilms Can Be Dispersed by Focusing the Immune System on a Common Family of Bacterial Nucleoid-Associated Proteins. Mucosal Immunol. 2011, 4, 625–637. [Google Scholar] [CrossRef] [Scilit] [PubMed]
- Conway, J.; Delanois, R.E.; Mont, M.A.; Stavrakis, A.; McPherson, E.; Stolarski, E.; Incavo, S.; Oakes, D.; Salvagno, R.; Adams, J.S.; et al. Phase 1 Study of the Pharmacokinetics and Clinical Proof-of-Concept Activity of a Biofilm-Disrupting Human Monoclonal Antibody in Patients with Chronic Prosthetic Joint Infection of the Knee or Hip. Antimicrob. Agents Chemother. 2024, 68, e00655-24. [Google Scholar] [CrossRef] [Scilit] [PubMed]
- Ramakrishnan, R.; Singh, A.K.; Singh, S.; Chakravortty, D.; Das, D. Enzymatic Dispersion of Biofilms: An Emerging Biocatalytic Avenue to Combat Biofilm-Mediated Microbial Infections. J. Biol. Chem. 2022, 298, 102352. [Google Scholar] [CrossRef] [Scilit] [PubMed]
- Rumbaugh, K.P.; Sauer, K. Biofilm Dispersion. Nat. Rev. Microbiol. 2020, 18, 571–586. [Google Scholar] [CrossRef] [Scilit] [PubMed]
- Wang, S.; Zhao, Y.; Breslawec, A.P.; Liang, T.; Deng, Z.; Kuperman, L.L.; Yu, Q. Strategy to Combat Biofilms: A Focus on Biofilm Dispersal Enzymes. npj Biofilms Microbiomes 2023, 9, 63. [Google Scholar] [CrossRef] [Scilit] [PubMed]
- Samaniego, L.V.B.; Scandelau, S.L.; Silva, C.R.; Pratavieira, S.; de Oliveira Arnoldi Pellegrini, V.; Dabul, A.N.G.; Esmerino, L.A.; de Oliveira Neto, M.; Hernandes, R.T.; Segato, F.; et al. Thermothelomyces thermophilus exo- and endo-glucanases as tools for pathogenic E. coli biofilm degradation. Sci. Rep. 2024, 14, 22576. [Google Scholar] [CrossRef] [Scilit] [PubMed]
- Brognaro, H.; Almeida, V.M.; de Araujo, E.A.; Piyadov, V.; Santos, M.A.M.; Marana, S.R.; Polikarpov, I. Biochemical Characterization and Low-Resolution SAXS Molecular Envelope of GH1 β-Glycosidase from Saccharophagus degradans. Mol. Biotechnol. 2016, 58, 777–788. [Google Scholar] [CrossRef] [Scilit] [PubMed]
- Kaplan, J.B.; Ragunath, C.; Ramasubbu, N.; Fine, D.H. Detachment of Actinobacillus actinomycetemcomitans Biofilm Cells by an Endogenous β-Hexosaminidase Activity. J. Bacteriol. 2003, 185, 4693–4698. [Google Scholar] [CrossRef] [Scilit] [PubMed]
- Itoh, Y.; Wang, X.; Hinnebusch, B.J.; Preston, J.F., III; Romeo, T. Depolymerization of β-1,6-N-Acetyl-D-Glucosamine Disrupts the Integrity of Diverse Bacterial Biofilms. J. Bacteriol. 2005, 187, 382–387. [Google Scholar] [CrossRef] [Scilit] [PubMed]
- Breslawec, A.P.; Wang, S.; Li, C.; Poulin, M.B. Anionic Amino Acids Support Hydrolysis of Poly-β-(1,6)-N-Acetylglucosamine Exopolysaccharides by the Biofilm-Dispersing Glycosidase Dispersin B. J. Biol. Chem. 2021, 296, 100203. [Google Scholar] [CrossRef] [Scilit] [PubMed]
- Fernández-Lucas, J.; Castañeda, D.; Hormigo, D. New Trends for a Classical Enzyme: Papain, a Biotechnological Success Story in the Food Industry. Trends Food Sci. Technol. 2017, 68, 91–101. [Google Scholar] [CrossRef] [Scilit]
- Lim, E.S.; Koo, O.K.; Kim, M.-J.; Kim, J.-S. Bio-Enzymes for Inhibition and Elimination of Escherichia coli O157:H7 Biofilm and Their Synergistic Effect with Sodium Hypochlorite. Sci. Rep. 2019, 9, 9920. [Google Scholar] [CrossRef] [Scilit] [PubMed]
- Chaudhuri, R.R.; Sebaihia, M.; Hobman, J.L.; Webber, M.A.; Leyton, D.L.; Goldberg, M.D.; Cunningham, A.F.; Scott-Tucker, A.; Ferguson, P.R.; Thomas, C.M.; et al. Complete Genome Sequence and Comparative Metabolic Profiling of the Prototypical Enteroaggregative Escherichia coli Strain 042. PLoS ONE 2010, 5, e8801. [Google Scholar] [CrossRef] [Scilit] [PubMed]
- Dias, R.C.B.; Vieira, M.A.; Moro, A.C.; Ribolli, D.F.M.; Monteiro, A.C.M.; Camargo, C.H.; Tiba-Casas, M.R.; Soares, F.B.; dos Santos, L.F.; Montelli, A.C.; et al. Characterization of Escherichia coli Obtained from Patients Undergoing Peritoneal Dialysis and Diagnosed with Peritonitis in a Brazilian Centre. J. Med. Microbiol. 2019, 68, 1330–1340. [Google Scholar] [CrossRef] [Scilit] [PubMed]
- Haney, E.F.; Mansour, S.C.; Hilchie, A.L.; de la Fuente-Núñez, C.; Hancock, R.E.W. High-Throughput Screening Methods for Assessing Antibiofilm and Immunomodulatory Activities of Synthetic Peptides. Peptides 2015, 71, 276–285. [Google Scholar] [CrossRef] [Scilit] [PubMed]
- O’Toole, G.A. Microtiter Dish Biofilm Formation Assay. J. Vis. Exp. 2011, 47, e2437. [Google Scholar] [CrossRef] [Scilit] [PubMed]
- Peeters, E.; Nelis, H.J.; Coenye, T. Comparison of Multiple Methods for Quantification of Microbial Biofilms Grown in Microtiter Plates. J. Microbiol. Methods 2008, 72, 157–165. [Google Scholar] [CrossRef] [Scilit] [PubMed]
- Datta, S.; Nag, S.; Roy, D.N. Papain: An Antimicrobial Enzyme of Papaya Latex Inhibits the Production of Biofilm and Disrupts Pre-Formed Biofilm Matrix of Pseudomonas aeruginosa. Arch. Microbiol. 2026, 208, 83. [Google Scholar] [CrossRef] [Scilit] [PubMed]
- Silva, J.P.; Dabul, A.N.G.; Mores Rall, V.L.; Silva, C.R.; Esmerino, L.A.; Pileggi, M.; Tuon, F.F.; de Oliveira Neto, M.; Nakayama, D.; Miranda, A.E.; et al. Klebsiella aerogenes PgaB orthologue can efficiently hydrolyze Staphylococcus aureus biofilms. World J. Microbiol. Biotechnol. 2025, 41, 353. [Google Scholar] [CrossRef] [Scilit] [PubMed]
- Thorn, C.R.; Howell, P.L.; Wozniak, D.J.; Prestidge, C.A.; Thomas, N. Enhancing the Therapeutic Use of Biofilm-Dispersing Enzymes with Smart Drug Delivery Systems. Adv. Drug Deliv. Rev. 2021, 179, 113916. [Google Scholar] [CrossRef] [Scilit] [PubMed]
Disclaimer/Publisher’s Note: The statements, opinions and data contained in all publications are solely those of the individual author(s) and contributor(s) and not of MDPI and/or the editor(s). MDPI and/or the editor(s) disclaim responsibility for any injury to people or property resulting from any ideas, methods, instructions or products referred to in the content. |
© 2026 by the authors. Licensee MDPI, Basel, Switzerland. This article is an open access article distributed under the terms and conditions of the Creative Commons Attribution (CC BY) license.