


Abstract
The pore structure and connectivity of coal directly control fluid storage and migration and provide an important basis for evaluating coal-seam permeability and gas-drainage performance. To quantitatively characterise the pore structure of anthracite and improve the accuracy of permeability prediction, anthracite from the Sihe Mine in Jincheng was investigated using porosity–permeability testing, CT scanning and digital-core reconstruction. Image filtering, threshold segmentation and black-hat compensation were used to extract the pore phase. The minimum REV was determined from porosity stability, and the connected pore network was extracted using the maximal ball algorithm. The box-counting dimension and a fractal permeability model were then applied to predict permeability. The average porosity and permeability of the coal samples were 1.8769% and 0.17708 μm2, respectively. The total CT porosity was 2.7128%, and the connected porosity of the REV was 1.358%. The fractal-model prediction was 0.1894 μm2 and the Stokes simulation result was 0.186436 μm2; both were close to the experimental values. The results provide a reference for quantitative pore-structure characterisation and permeability prediction of coal samples.
1. Introduction
The internal pores, fractures and connectivity of coal have a direct effect on fluid storage and migration. They are also fundamental to coal-seam permeability evaluation, gas drainage analysis and mine-water hazard prevention [1,2,3,4,5]. With the increasing depth of coal mining, coal and rock are subjected to more complex in situ stress, pore pressure and tectonic disturbance. Under such conditions, the controlling effect of microscopic pore structure on macroscopic seepage behaviour becomes increasingly important. Pores provide storage space for gas and water, whereas throats and fractures determine migration paths and flow resistance. Therefore, accurately characterising the pore structure of coal and establishing a quantitative relationship between pore-structure parameters and permeability are important for revealing coal seepage mechanisms and improving permeability prediction accuracy.
Common methods for characterising the pore structure of coal and rock include scanning electron microscopy, mercury intrusion porosimetry, low-temperature nitrogen adsorption and nuclear magnetic resonance [6,7,8]. These methods can provide useful information on pore morphology, pore-size distribution and fluid occurrence. However, they still have limitations in describing three-dimensional connectivity, pore-throat spatial structure and non-destructive continuous characterisation. By contrast, X-ray computed tomography (CT) has the advantages of being non-destructive, three-dimensional and visualisable. It can obtain internal grey-scale images while maintaining the integrity of samples, and it can then be combined with image filtering, threshold segmentation and three-dimensional reconstruction to establish a digital core model. Such a model provides a geometric basis for pore-network extraction and pore-scale seepage simulation [9,10,11,12,13,14,15,16,17,18]. More specifically, SEM provides local two-dimensional morphology; mercury intrusion and low-temperature nitrogen adsorption provide statistical pore-size information but do not directly preserve three-dimensional topology; and NMR is sensitive to fluid-bearing pore populations but does not explicitly reconstruct pore-throat geometry. CT therefore complements rather than replaces these methods, by providing direct three-dimensional geometry and connectivity at the resolvable scale.
In recent years, digital core methods have been widely used to analyse the pore structures of coal, sandstone, shale and other porous media. Many studies have reconstructed three-dimensional pore space from CT images and extracted pore radius, throat length, coordination number, pore–throat ratio and connected porosity to evaluate the development of pore networks and their influence on seepage capacity. However, coal pore systems are highly heterogeneous and irregular. Conventional geometric parameters alone are not sufficient to describe the complexity and scale distribution of the pore space. Fractal theory provides a means of describing self-similarity and heterogeneity at different scales and has been applied to pore-complexity evaluation and permeability model construction [19,20,21,22,23,24,25,26,27,28,29,30]. Further work is still needed on representative elementary volume determination, the distinction between total pores and connected pores, and cross-validation of fractal prediction results with numerical simulation and physical permeability tests. Recent research on fractured porous media has likewise shown that channel morphology and connectivity exert a strong controlling effect on flow conduction [31].
In this study, anthracite from the Sihe Mine in Jincheng was selected as the research object. Porosity–permeability testing, CT scanning and digital core reconstruction were conducted. First, median filtering, threshold segmentation and black-hat compensation were used to extract the pore phase and construct a three-dimensional digital core. The minimum representative elementary volume (REV) was then determined according to the stability of porosity with increasing cell size. The connected pore network was extracted using the maximal ball algorithm, and pore–throat parameters, including pore radius, coordination number, throat length and pore–throat ratio, were analysed. Subsequently, the box-counting dimension was used to characterise the fractal features of the pore structure. A fractal permeability prediction model was established, and pore-scale flow simulation based on the Stokes equation was performed. By comparing the fractal prediction value, numerical simulation value and physical test value, this study clarifies the influence of digital core pore-structure parameters on coal permeability prediction and provides a reference for quantitative pore-structure characterisation and permeability evaluation. The main methodological contribution is the integration of a porosity-based minimum REV, through connected pore-network extraction, fractal structural description, analytical permeability prediction and pore-scale Stokes simulation within the same CT-derived geometry. This workflow links local pore structure with macroscopic permeability while explicitly distinguishing total CT porosity from connected pore space.
2. Materials and Methods
2.1. Sample Preparation and Porosity-Permeability Testing
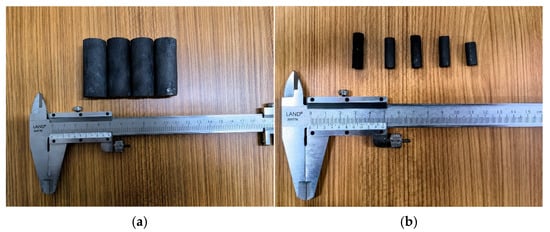
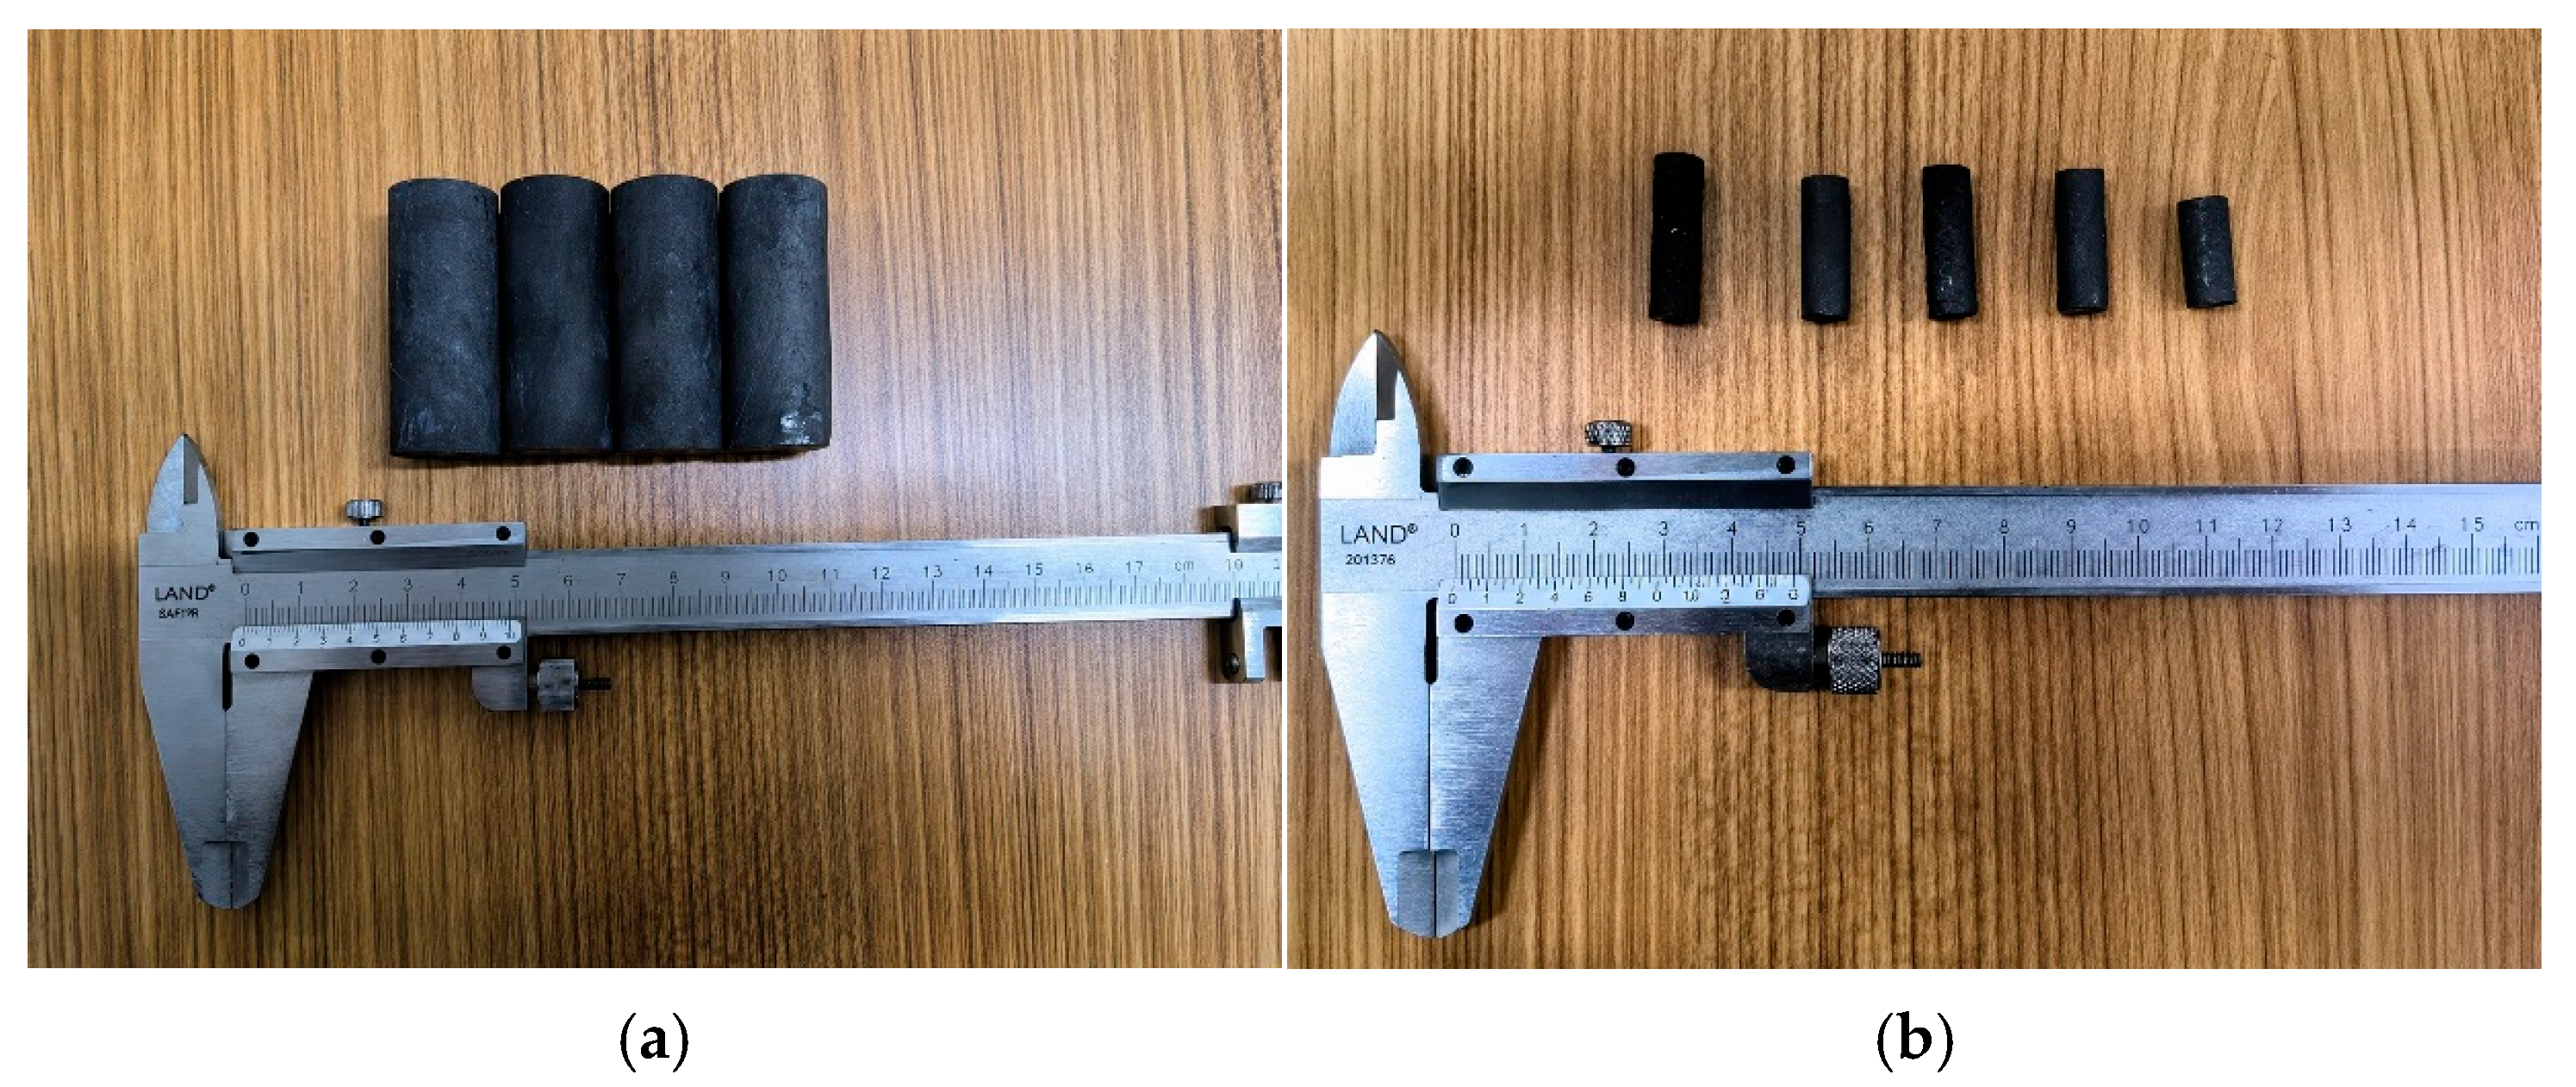
The coal samples used in the test were anthracite collected from the Sihe Mine in Jincheng. To reduce the influence of the external environment on the structure and moisture state of the samples after collection, the original coal was sealed immediately after sampling. During subsequent processing, artificial disturbance and damage to primary pores and fractures were minimised. According to the different sample-size requirements of gas porosity–permeability testing and CT scanning, the original coal was first processed into cylindrical samples with a diameter of 25 mm and a height of 50 mm for macroscopic porosity and permeability measurement. After the gas porosity–permeability test, a small CT sample with a diameter of 7.5 mm was drilled from a local part of the sample and finely polished to meet the requirements for high-resolution scanning and three-dimensional digital core reconstruction. Representative samples prepared for permeability testing and CT scanning are shown in Figure 1.
Figure 1.
Test samples. (a) Sample for permeability testing; (b) sample for CT scanning.
The porosity–permeability test was conducted in accordance with GB/T 34533–2017. Three independent cylindrical specimens were denoted as Coal I, Coal II and Coal III. Before testing, the specimens were dried at 105 °C to constant mass to minimise the influence of free water. Porosity was measured with a helium porosimeter (PHI220) according to Boyle’s law. The grain volume was determined from helium expansion between calibrated reference and sample chambers, and porosity was calculated from the difference between bulk volume and grain volume. Gas permeability was determined using a gas-permeability apparatus according to Darcy’s law under steady-flow conditions. Before measurement, the system was calibrated with a standard component of known volume. The measured results are listed in Table 1.
Table 1.
Porosity–permeability test results for the samples.
The three values in Table 1 represent three independent coal specimens rather than repeated measurements on a single specimen. The between-specimen standard deviations of permeability and porosity are 0.00046 μm2 and 0.00125 percentage points, respectively, corresponding to coefficients of variation of 0.257% and 0.0666%. These small coefficients indicate limited specimen-to-specimen variability within the tested group; they should not be interpreted as instrumental repeatability or full measurement uncertainty.
2.2. CT Scanning
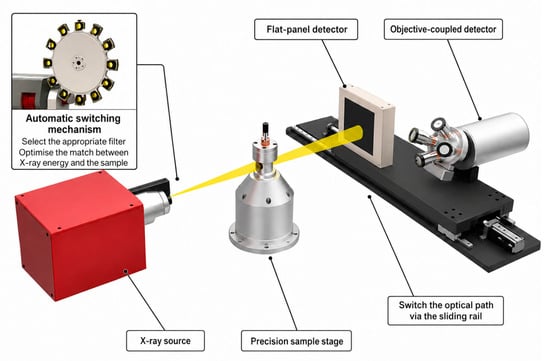
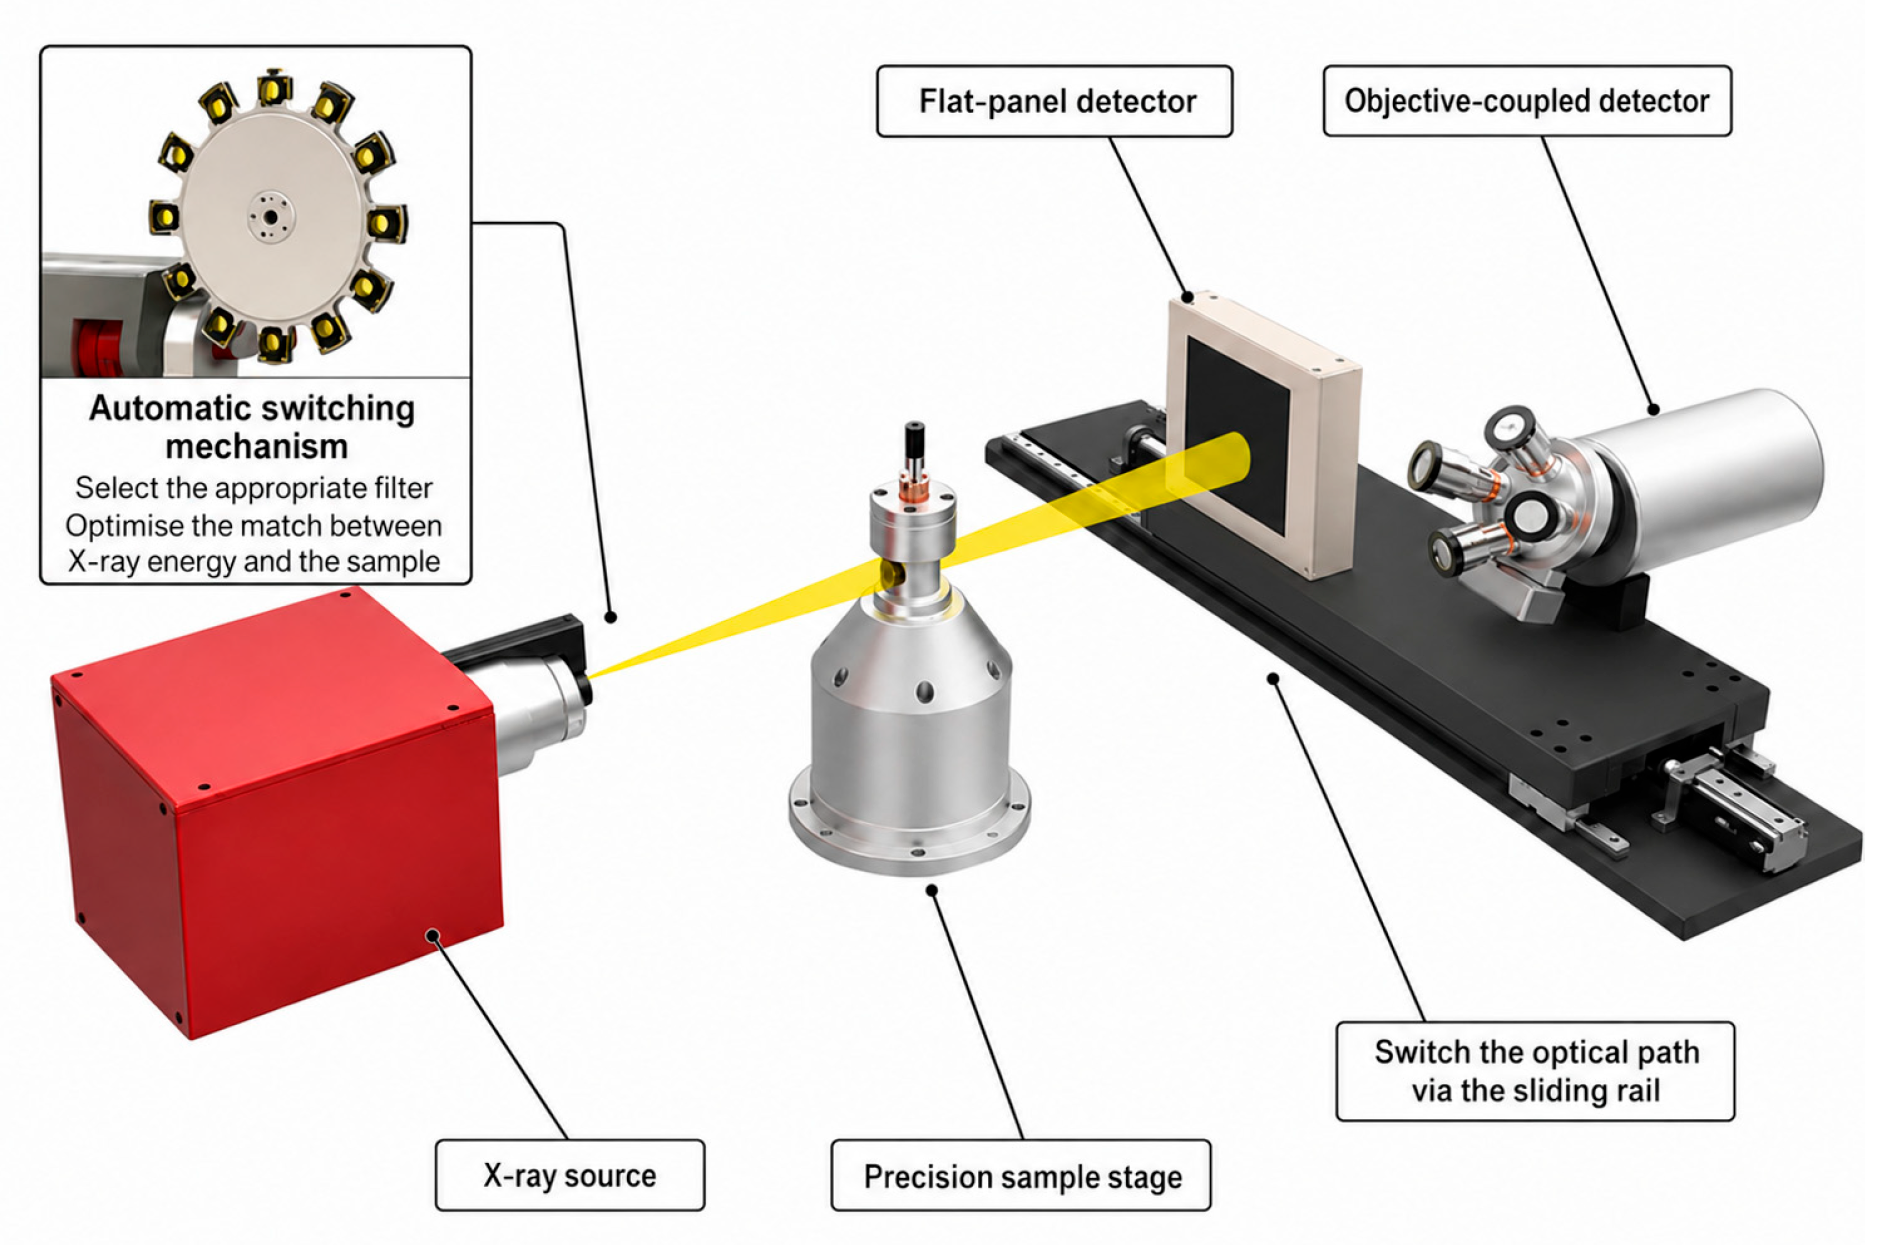
To obtain the internal pore-space structure of the coal sample, a nanoVoxel-4000 open-tube reflective high-penetration CT system (Sanying Precision Instruments Co., Ltd., Tianjin, China) was used for scanning the small sample. The scanning voltage was 100 kV, the current was 100 μA, and the spatial resolution was 3 μm. The system consisted of an X-ray source, a detector, a precision mechanical rotation stage, a computer control system and a radiation-shielding chamber. It was used to obtain continuous internal slice images without damaging the sample structure. Figure 2 presents a schematic diagram of the CT scanning system.
Figure 2.
Schematic diagram of the CT scanning system.
During scanning, a cylindrical CT sample with a diameter of 7.5 mm was fixed on the precision rotation stage. X-rays passed through the coal sample, and projection images at different angles were collected. After the sample completed a 360° rotation, a series of continuous projection data was obtained and reconstructed into two-dimensional CT slice images. Considering that different CT samples had different imaging clarity and pore-recognition effects, a sample with dimensions of approximately 7.5 mm × 21 mm and relatively good scanning quality was selected for digital core construction. The two-dimensional CT slices were the basis for pore-phase segmentation, three-dimensional reconstruction, REV determination and pore-network extraction.
2.3. Image Processing and Digital Core Construction
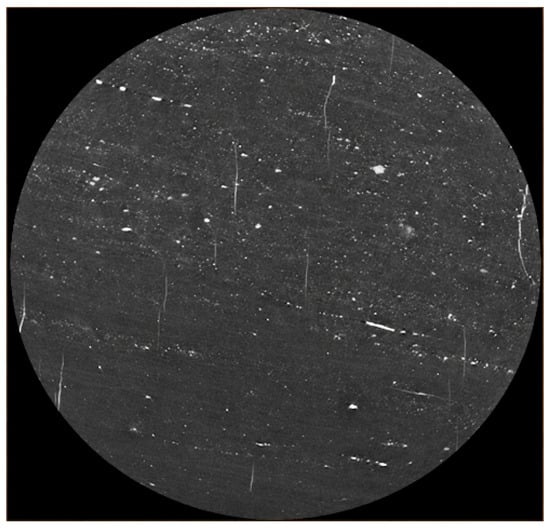
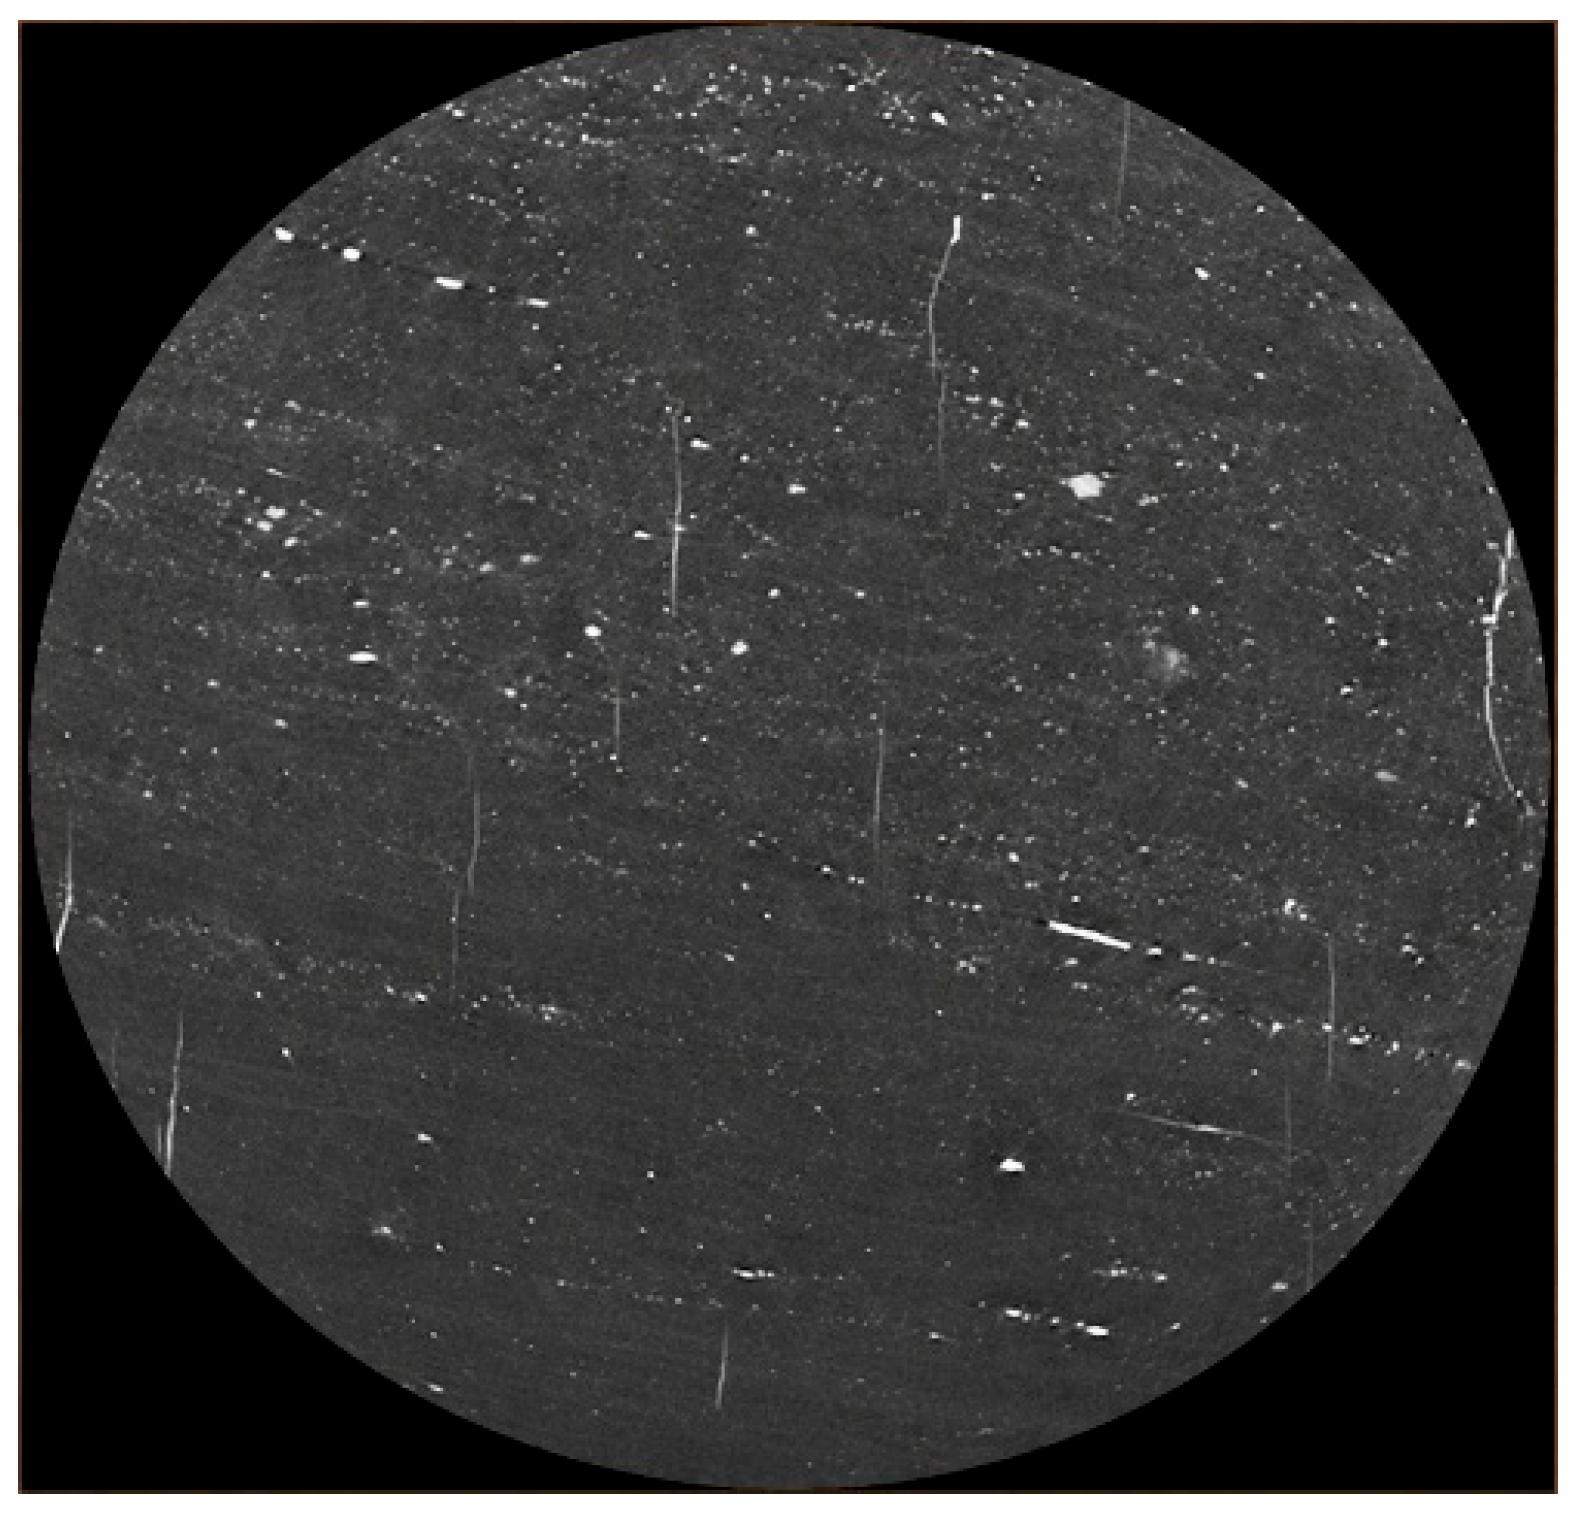
The original CT slices were inevitably affected by noise, edge artefacts and grey-scale fluctuations during image acquisition and reconstruction. If these images had been directly used for pore segmentation, fine pores may have been omitted and pore boundaries may have been misclassified. Therefore, image pre-processing is required before the digital core is constructed. Based on the grey-scale characteristics of the coal CT images, median filtering was used to reduce noise in the original slices. Median filtering can suppress non-Gaussian noise and small artificial traces while retaining pore boundaries and image details, and it was therefore considered suitable for subsequent extraction of the pore phase. An example of a median-filtered CT slice is shown in Figure 3.
Figure 3.
Example of a CT slice after median filtering.
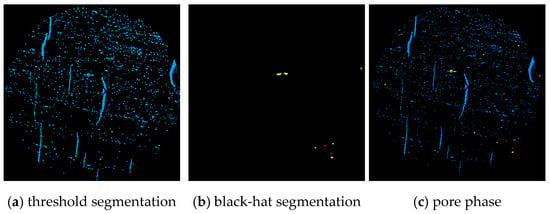
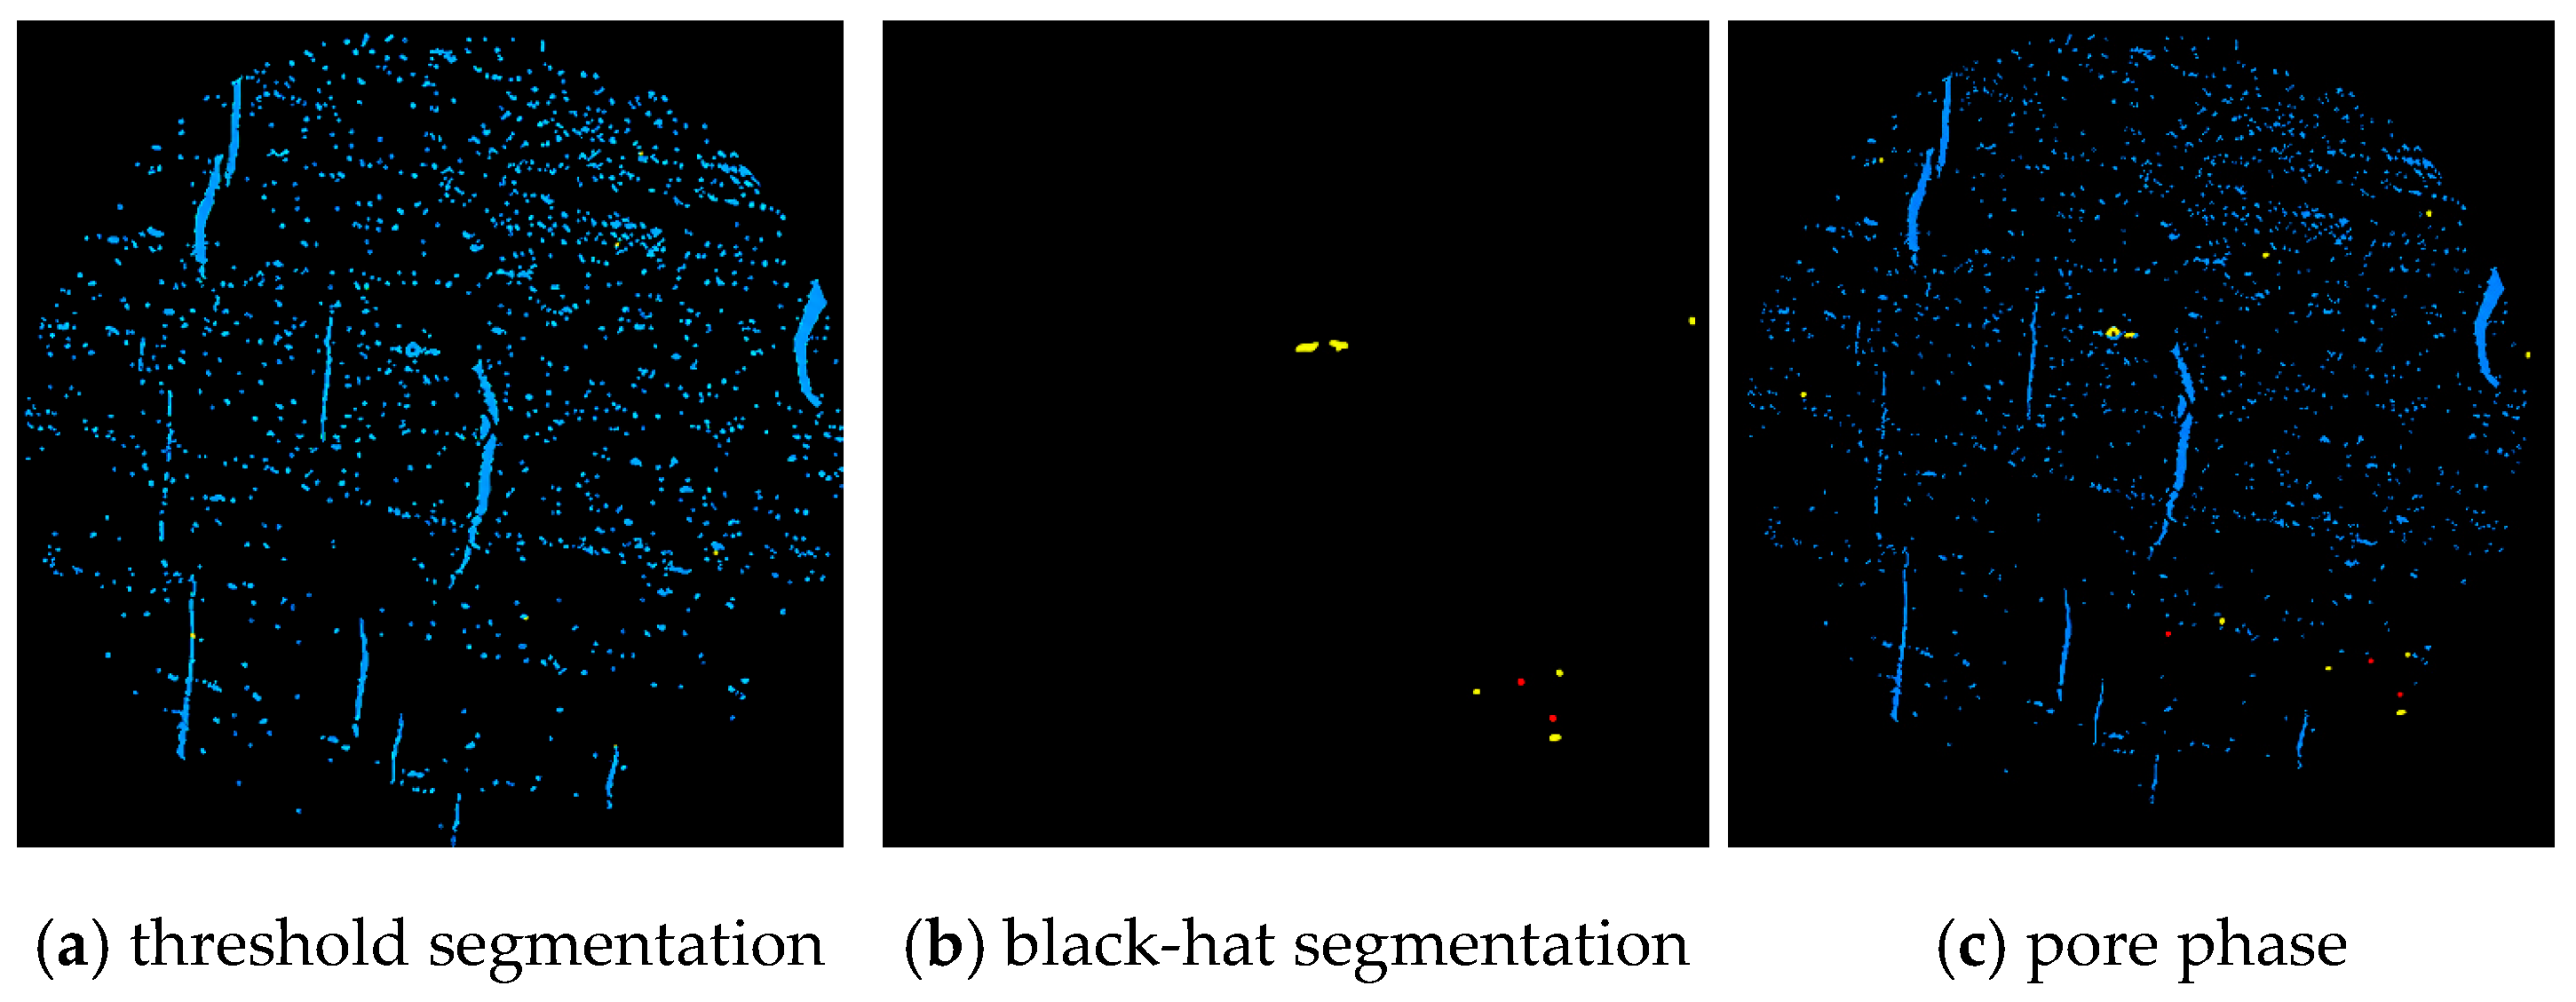
When X-rays passed through different components of the coal sample, the attenuation degree varied, so pores, coal matrix and mineral particles appeared in different grey-scale intervals. After median filtering, pore-phase segmentation was performed on the filtered CT images. The pore-threshold interval was determined from the grey-scale distribution using the maximum between-class variance criterion, avoiding the use of a single manually fixed threshold for all slices. Threshold segmentation first extracted the majority of the pore phase. Because dark pore details adjacent to high-density components can be missed by thresholding alone, a black-hat morphological operation was subsequently applied to recover these locally dark features. The threshold-derived pore phase and black-hat compensation were then merged to obtain the final pore-phase image. The same algorithmic workflow was applied consistently to the CT slice stack. The archived processing record preserves the filter type, threshold-selection criterion and compensation workflow, but it does not retain the exact numerical median-filter window or black-hat structuring-element size; therefore, unsupported numerical values are not reported. Figure 4 shows the segmentation workflow.
Figure 4.
Image segmentation process. (a) Threshold segmentation (blue pores); (b) black-hat compensation (yellow/red pore features); (c) combined pore phase. Black denotes the non-pore background.
After pore-phase extraction, the non-pore regions were uniformly assigned to the matrix phase. The pore-phase images were then stacked in the spatial order of the CT slices to obtain the three-dimensional digital core model of the coal sample. This model retains the internal pore-space morphology, pore distribution and connectivity of the sample at the three-dimensional scale. It also provides the geometric basis for subsequent porosity statistics, REV determination, connected pore-network extraction and seepage simulation.
3. Digital Core Construction and REV Determination
3.1. Pore-Phase Extraction and Porosity Distribution
Based on the filtered and segmented CT slices, the pore phase of the coal sample was extracted, while all non-pore regions were classified as the matrix phase. The pore phase includes pores and fractures that are recognisable within the CT resolution, whereas the matrix phase corresponds to the coal matrix and mineral components. By identifying the pore phase in continuous CT slices and stacking them spatially, the data required for three-dimensional digital core construction, REV selection and connected pore-network extraction were obtained.
The three-dimensional pore-phase statistics show that the total porosity of the constructed digital core was 2.7128%. This value represents the volume fraction of CT-recognisable pore space in the digital core; it is used to describe the pore-phase extraction result and the statistical basis of the digital core. It should be noted that the total CT porosity includes connected pores, isolated pores and weakly connected pores; it is not equivalent to the effective pore space that participates in seepage. Therefore, subsequent permeability prediction and pore-scale flow simulation are based primarily on the connected pore network in the REV rather than on total porosity. This method improves the correspondence between pore-structure parameters and seepage capacity.
3.2. Three-Dimensional Reconstruction of Pore and Matrix Phases
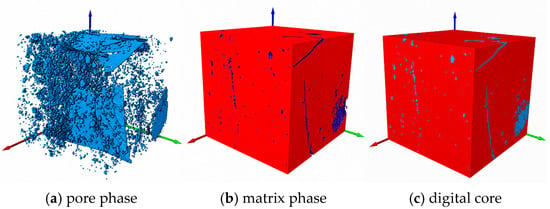
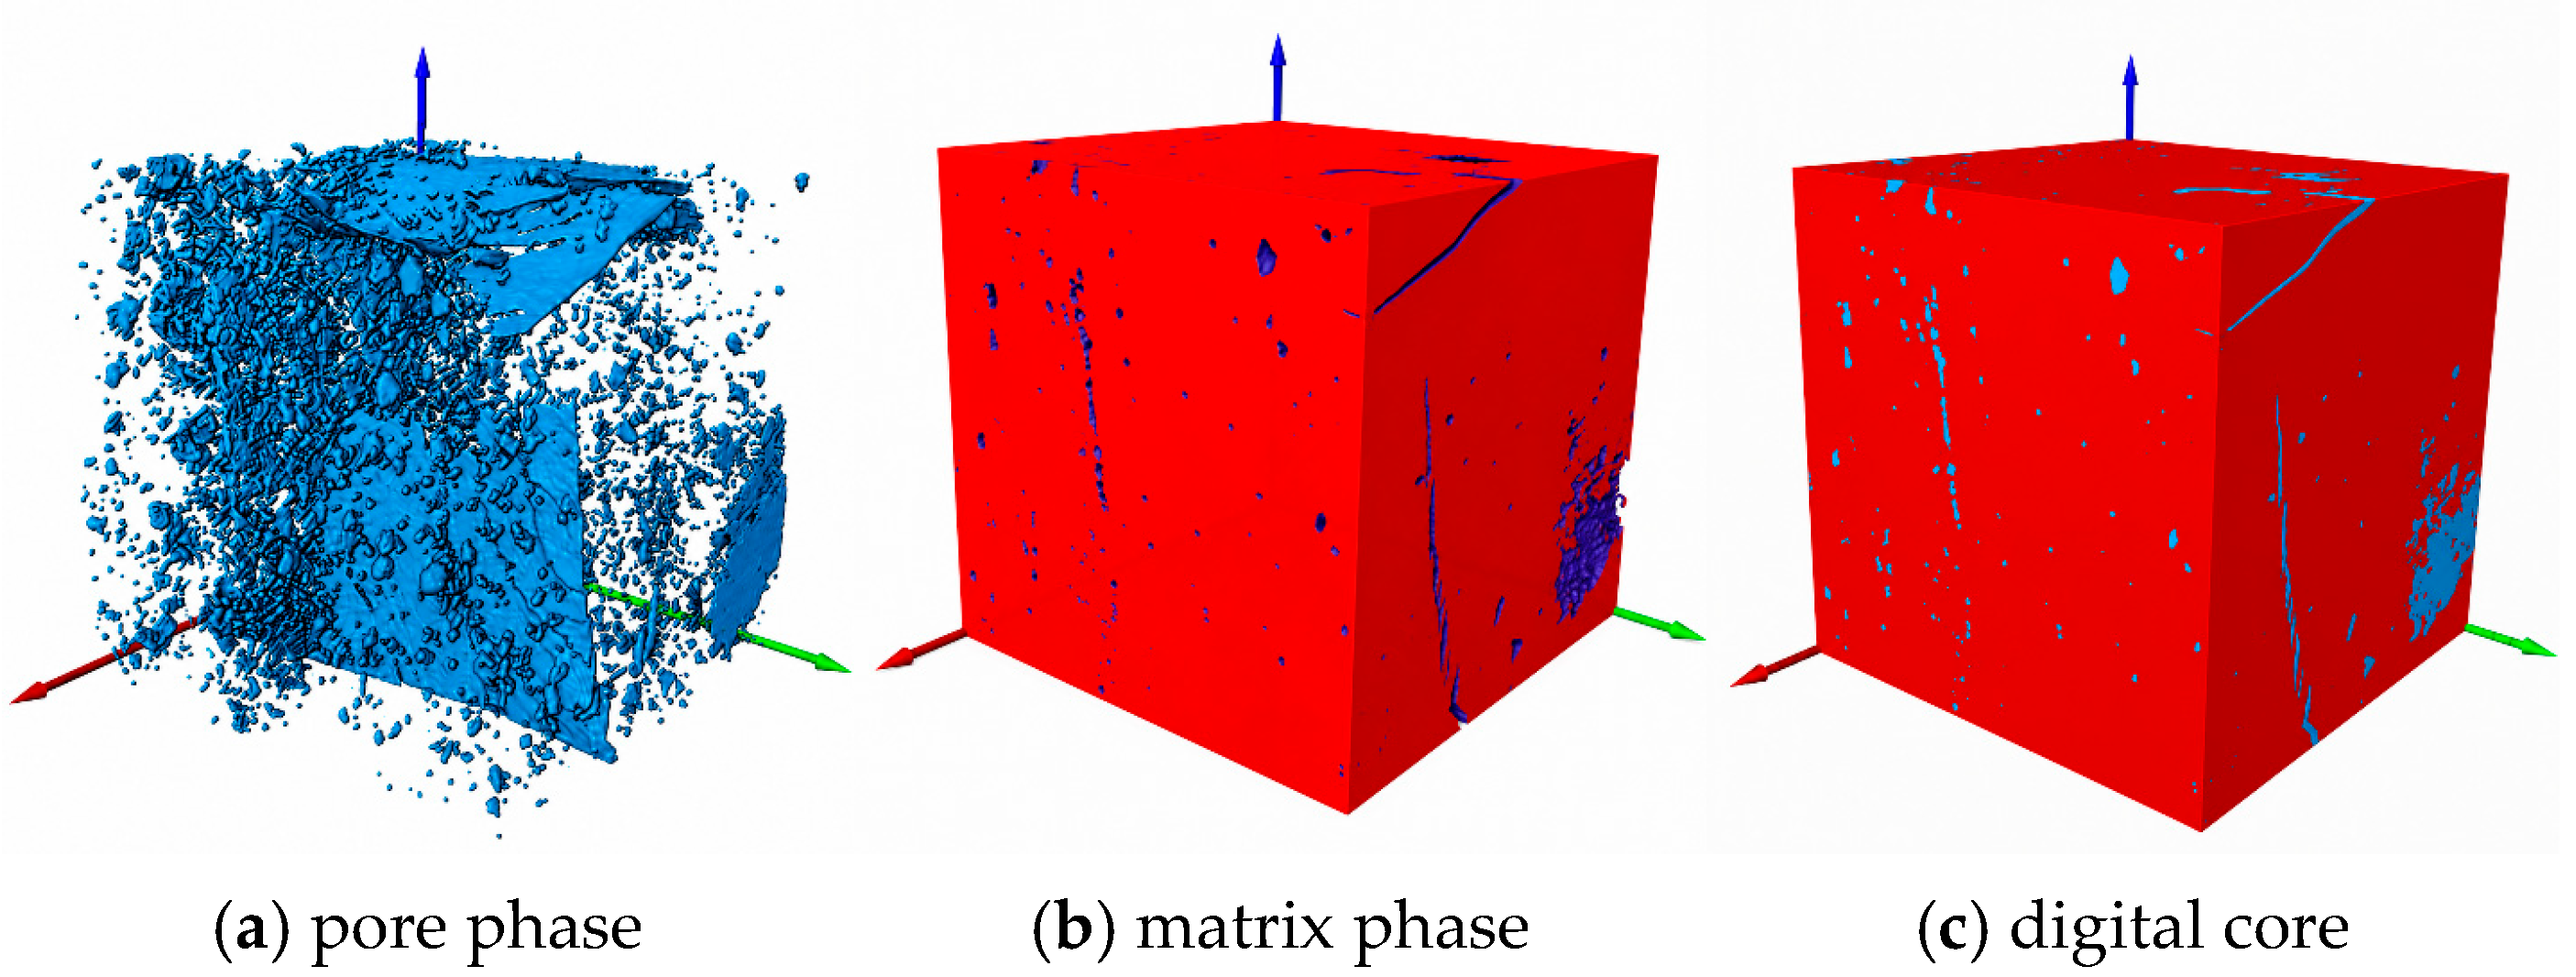
After pore-phase extraction, the non-pore regions were assigned to the matrix phase and were reconstructed together with the pore phase according to the spatial order of the CT slices. A three-dimensional digital core of the coal sample was thus obtained. The model consists of two parts: the pore phase, which represents pores and fractures recognisable at the CT resolution, and the matrix phase, which represents the coal matrix and mineral components. Figure 5 shows the construction process of the pore phase, matrix phase and digital core.
Figure 5.
Three-dimensional digital core construction. (a) Pore phase, shown in blue; (b) matrix phase, shown in red; (c) combined digital core. The red, green and blue arrows indicate the three spatial coordinate directions.
As shown in Figure 5, the extracted pore phase can intuitively reflect the distribution of pores and fractures inside the coal sample. The pore space is not uniformly distributed but is characterised by the coexistence of fracture-like pores and point-like pores. Fracture-like pores show a certain directional extension, whereas point-like pores are mostly distributed discretely. The matrix-phase model further shows that the pore phase is embedded within the coal matrix. This indicates that the digital core can preserve the morphology, position and spatial relationship between pore space and matrix at the three-dimensional scale.
The three-dimensional digital core is a geometric carrier for quantitative pore-structure characterisation. It provides a unified spatial basis for REV selection, connected pore-network extraction and pore-scale seepage simulation. By reconstructing the pore phase and matrix phase in three dimensions, the morphology, distribution and embedding relationship of CT-recognisable pores are retained, allowing subsequent pore–throat statistics and flow calculations to be performed on the same digital structure. Therefore, the digital core not only visualises the internal pore space of the sample, but it also provides a basis for establishing a quantitative link between pore-structure parameters and permeability prediction results.
The CT digital core result has a clear scale of applicability. In this study, the spatial resolution of the CT scan was 3 μm. The constructed digital core reflects micro-scale pores and fractures that can be recognised at this resolution. Fine pores below the imaging resolution, nano-scale adsorption pores and some small throats cannot be fully resolved in the three-dimensional model. Therefore, the porosity, pore–throat network parameters, fractal characteristics and seepage simulation results presented in the following sections should be understood as scale-dependent characterisations of CT-resolvable pore space. Their seepage is interpreted as mainly corresponding to flow behaviour controlled by micro-scale connected pores.
3.3. REV Determination and Connected Pore-Network Extraction
The complete CT digital core contained a large amount of voxel data. Direct pore-network extraction and pore-scale flow calculation on the entire model would significantly increase computational cost. In addition, the pore structure of coal is strongly heterogeneous, and an excessively small selected region cannot represent the statistical characteristics of the pore structure in the digital core. It is therefore necessary to determine a representative elementary volume within the three-dimensional digital core.
Porosity is a basic parameter for describing the internal structure of porous media. To determine a reasonable REV size, three different spatial positions were selected in the pore-phase model of the digital core for comparative analysis. Positions I, II and III represent three cubic units at different locations within the digital core. Their upper-left vertices were set at points (700, 700, 350), (365, 1158, 100) and (970, 1314, 0), respectively. Cubic units with different side lengths were successively intercepted, and their porosities were calculated. The statistical results are shown in Table 2.
Table 2.
Porosity statistics of REV units with different side lengths.
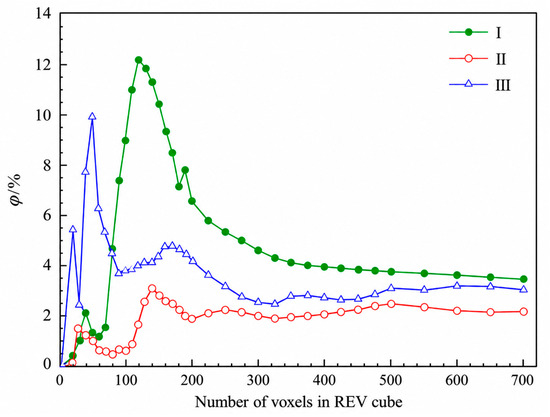
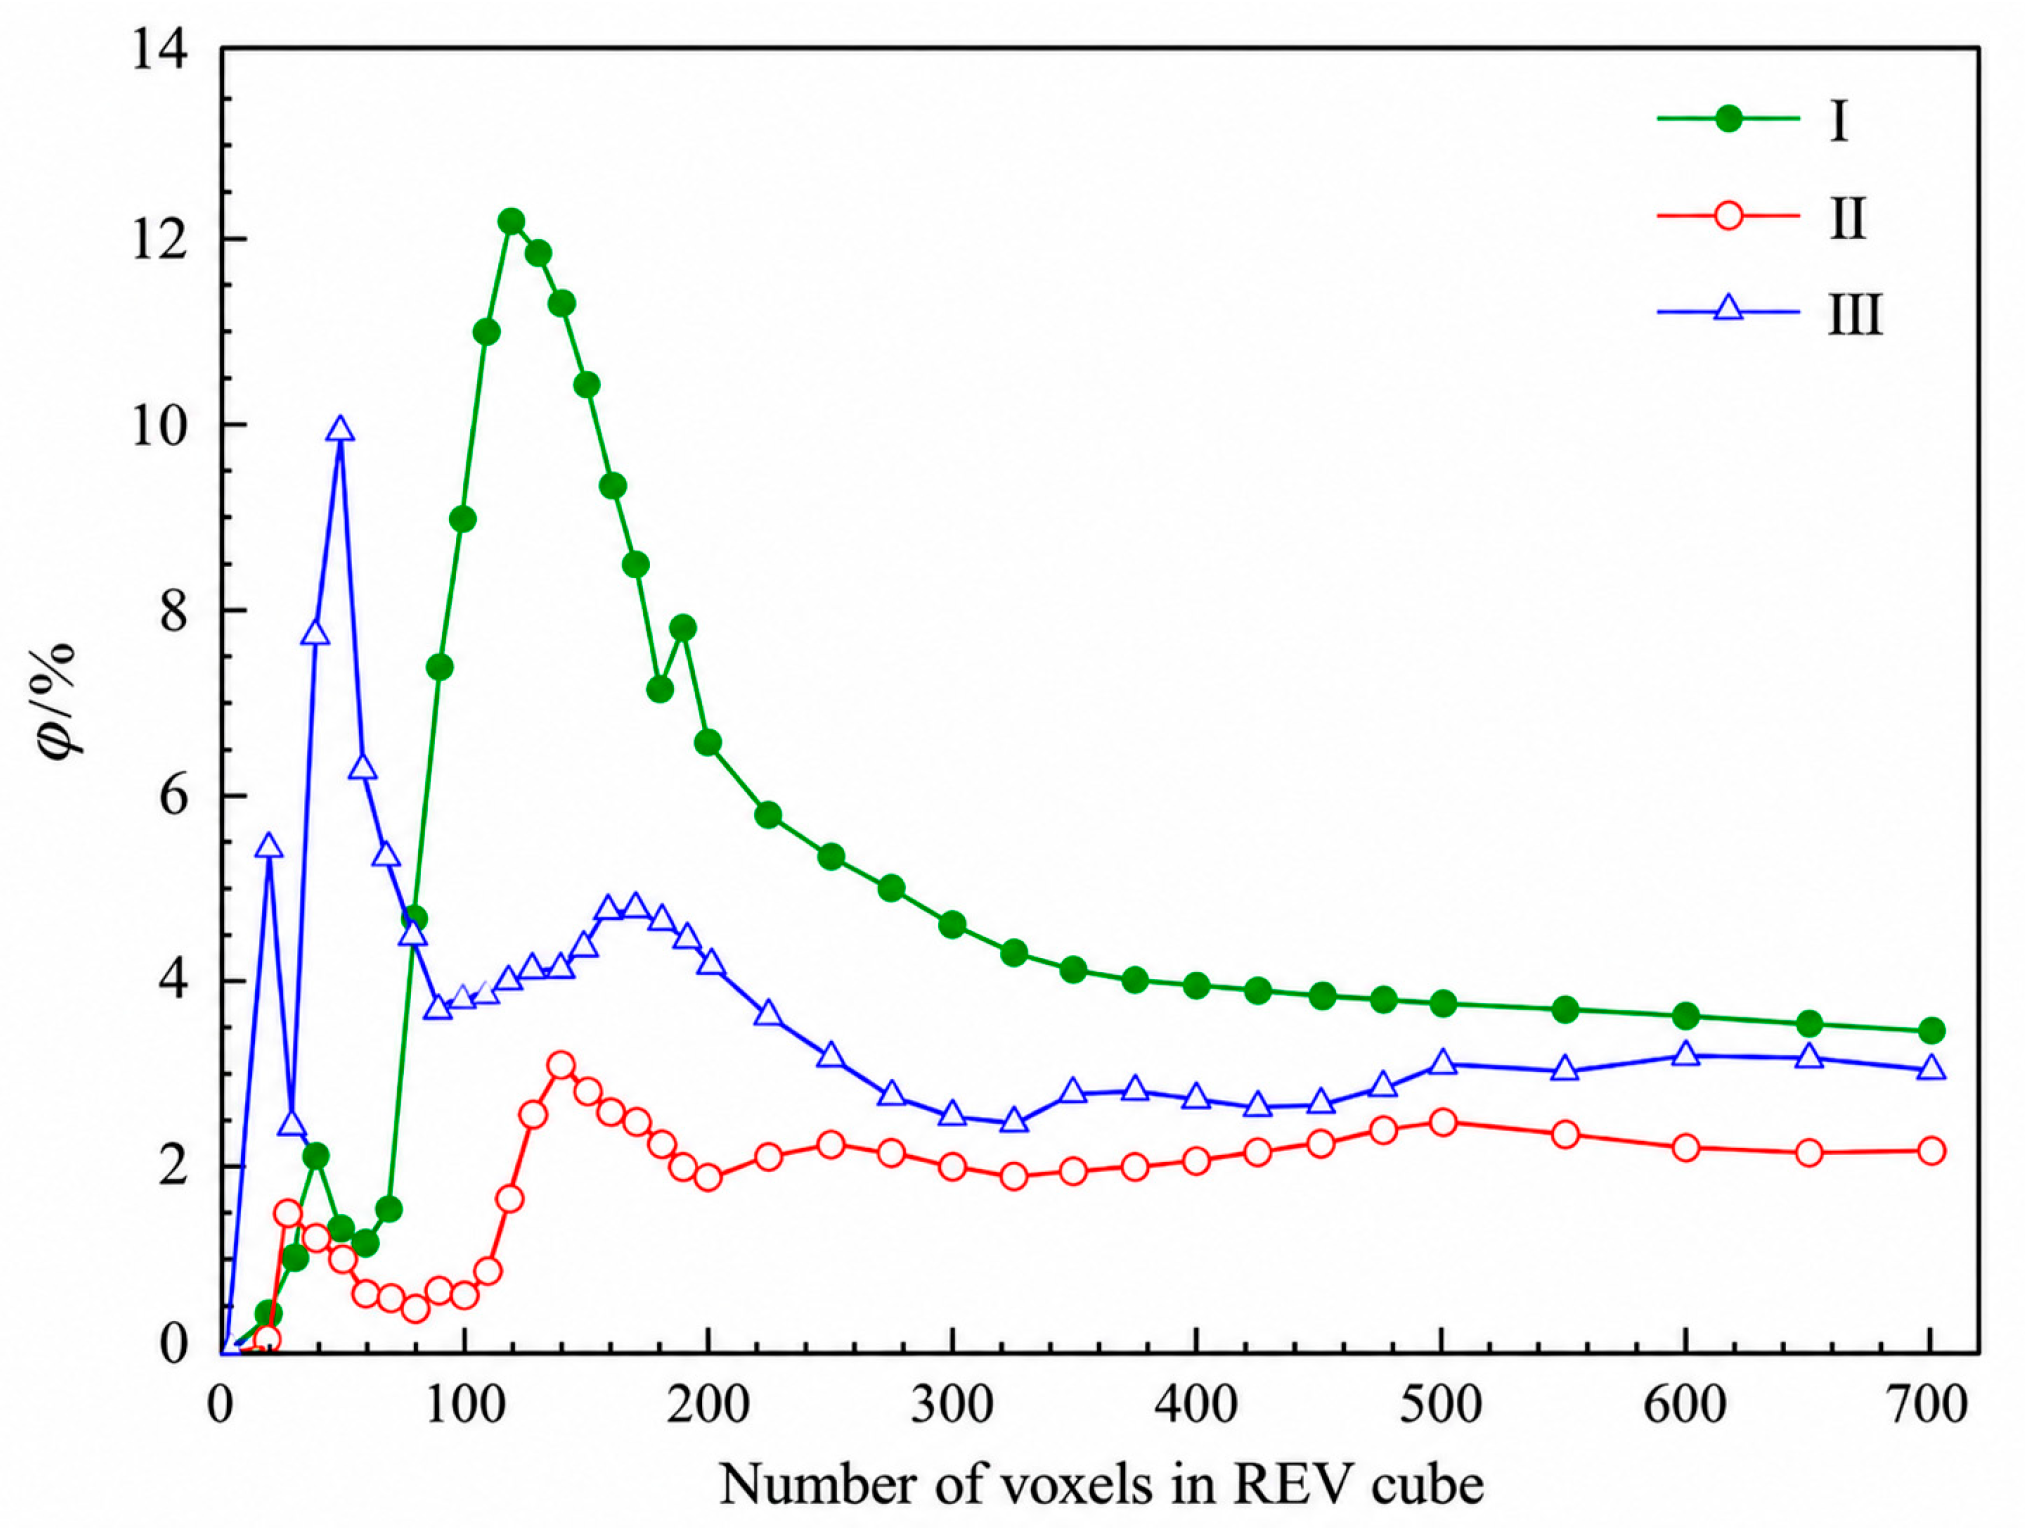
Table 2 shows that when the unit size is small, the porosities of the three selected positions differ greatly. This indicates that local pore development has a strong influence on the statistical results and that the unit is not sufficiently representative. With increasing unit size, the porosities of Positions I, II and III gradually change from obvious fluctuation to relative stability. To show this convergence process more clearly, the relationship between porosity and unit size is plotted in Figure 6.
Figure 6.
Relationship between porosity and REV side length.
As shown in Figure 6, when the side length is less than 300 voxels, the porosity variation at different positions is large, indicating that local heterogeneity still strongly affects the statistics. When the side length increases to 500 voxels, all three porosity curves enter a relatively stable range, and further increases in unit size lead to only small changes in porosity. Combining Table 2 and Figure 6, 500 voxels was therefore selected as the minimum porosity-based REV side length. At the CT spatial resolution of 3 μm, this corresponds to 1500 μm × 1500 μm × 1500 μm. For subsequent pore-network analysis, the 500 × 500 × 500 voxel cube at Position III, with upper-left vertex (970, 1314, 0), was selected; its total porosity was 3.1212%. This REV criterion is based on porosity convergence. Connectivity was subsequently verified for the selected Position III cube, whereas convergence of throat-size and coordination-number distributions was not independently tested over multiple REV sizes. Accordingly, the pore-network statistics reported below should be interpreted as local properties of this selected porosity-based REV.
After the porosity-based REV had been selected, three-dimensional connectivity analysis was performed for the selected volume. Using the same left-to-right A→B direction adopted in the subsequent flow simulation, the through-connected pore phase was identified within the Position III REV, giving a connected porosity of 1.358%. To quantify the fraction of pore volume that participates in the through-connected network, a connectivity index C was defined as the ratio of connected porosity to the total porosity of the same REV:
where C is the connectivity index, φc is the connected porosity and φt is the total porosity of the selected Position III REV. Substituting φc = 1.358% and φt = 3.1212% gives:
The resulting connectivity index is 0.4351, indicating that approximately 43.51% of the CT-recognisable pore volume in the selected REV belongs to the through-connected pore phase, while the remainder is isolated or does not form a complete A-to-B flow path. The use of total porosity and connected porosity from the same REV avoids mixing quantities from different spatial scales and provides a consistent basis for the subsequent pore–throat statistics, fractal model and pore-scale simulation.
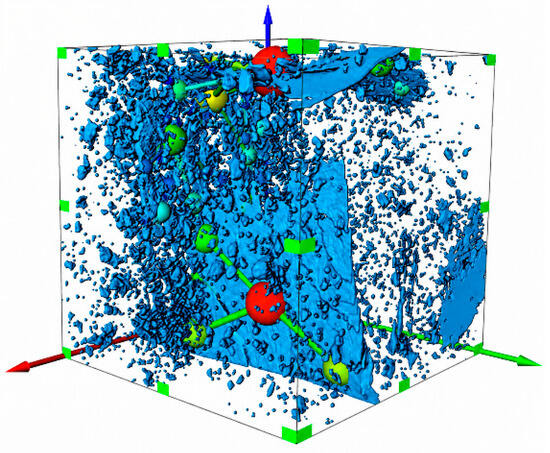
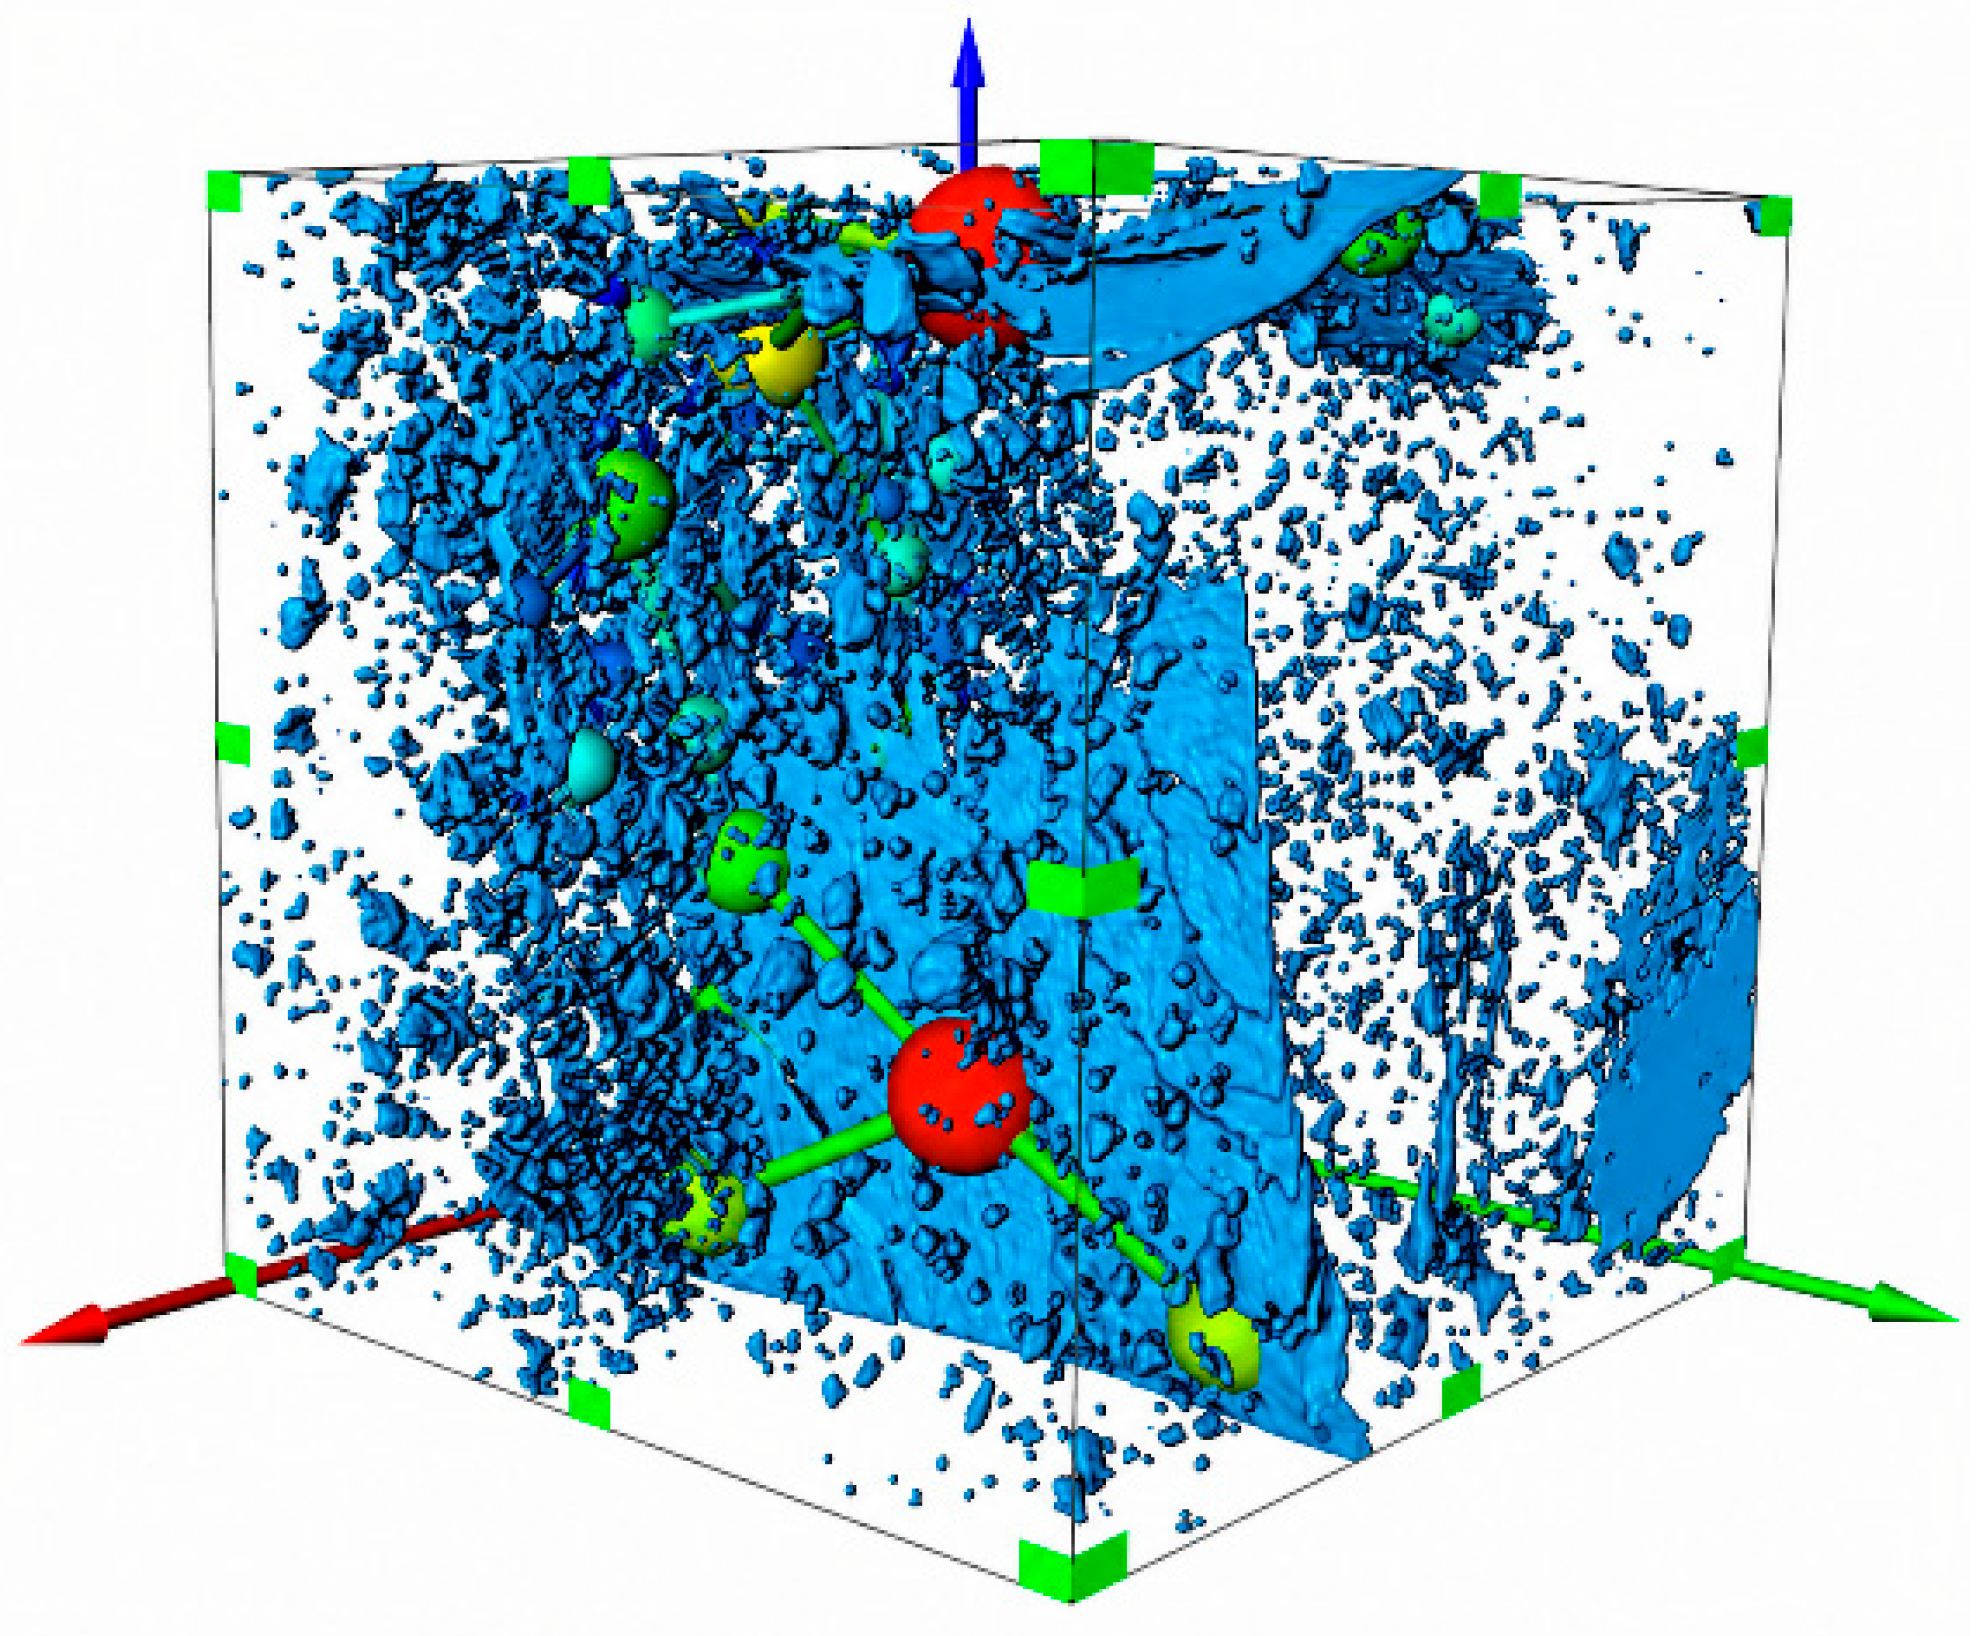
Based on the REV described above, the connected pore network was extracted using the maximal ball algorithm. The extraction result is shown in Figure 7.
Figure 7.
Connected pore-network model of the minimum REV. Blue depicts the segmented pore geometry; the coloured spheres identify extracted pore bodies. The colours are used for visual distinction, without a calibrated quantitative colour scale. Green markers outline the displayed volume, and the red, green and blue arrows indicate spatial coordinate directions.
Figure 7 shows that the maximal ball algorithm transforms the complex connected pore space in the selected REV into an equivalent pore–throat network. Pores represent local storage spaces and throats represent connections between adjacent pores. The network retains the principal through-flow topology at the REV scale and is used for subsequent statistics of pore radius, coordination number, throat length and pore-throat ratio. In summary, the selected Position III REV had a side length of 500 voxels (1500 μm × 1500 μm × 1500 μm), a total porosity of 3.1212%, a connected porosity of 1.358% and a connectivity index of 0.4351.
4. Pore–Throat Structure and Fractal Characteristics
The seepage capacity of coal is controlled not only by the number of pores and the magnitude of porosity, but also by pore size, pore connectivity, throat development and pore-space complexity. In a connected pore network, pores mainly provide fluid storage space, whereas throats control the connection between pores and the flow resistance. Therefore, extracting pore-network parameters from the minimum REV and analysing the fractal characteristics of the pore structure are useful for revealing the control mechanism of microscopic structure on permeability.
4.1. Pore Scale and Connectivity Characteristics
Only pores linked by effective throats and forming continuous pathways contribute directly to through-flow. Therefore, pore-size statistics should be interpreted together with connectivity and throat parameters when evaluating the seepage capacity of the selected REV.
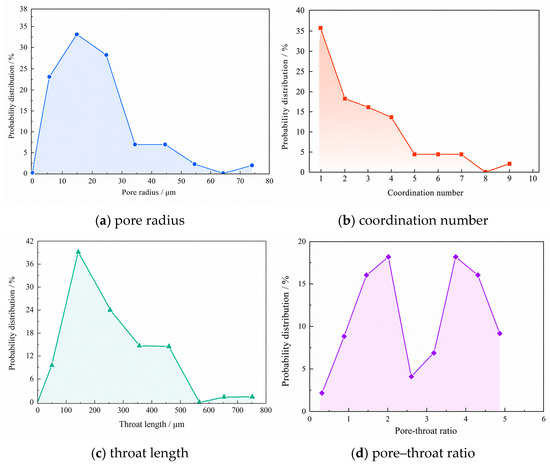
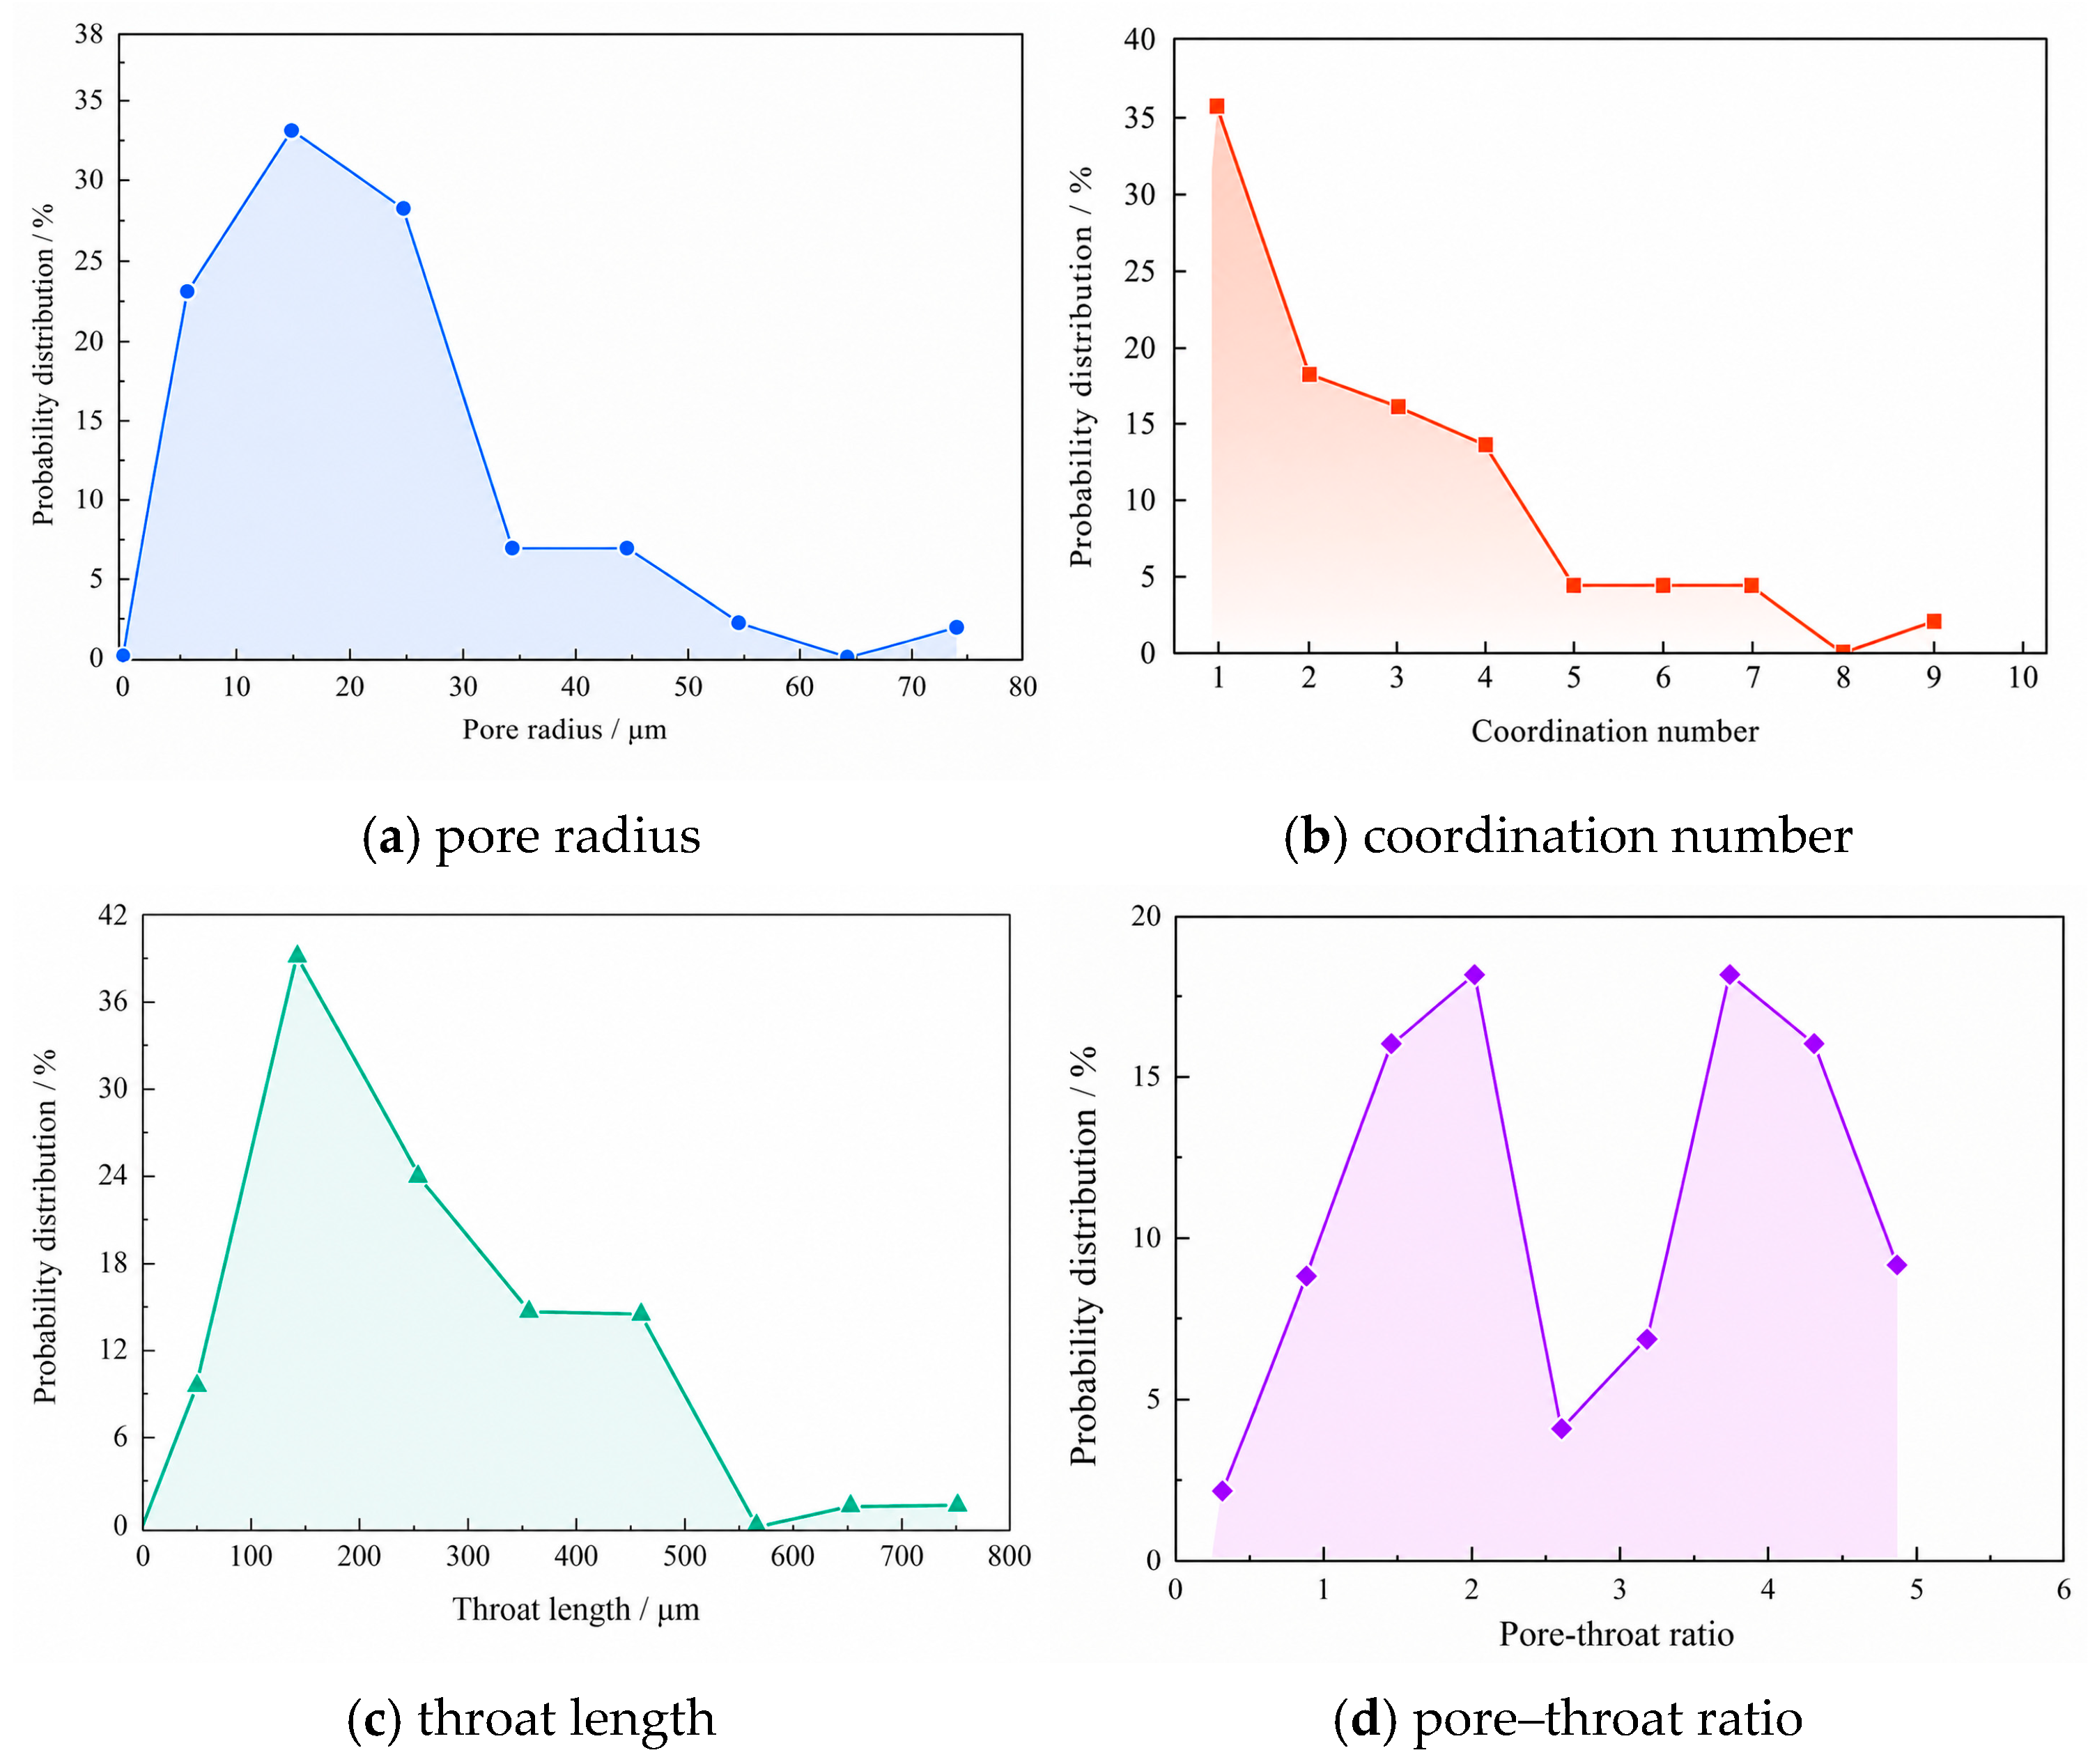
Based on the connected pore network of the minimum REV, pore radius, coordination number, throat length and pore–throat ratio were extracted. Pore-radius distribution reflects pore-space scale. Coordination-number distribution indicates the degree of pore connection. Throat length and pore–throat ratio further characterise the extension of connecting channels and the scale matching between pores and throats. Figure 8 shows the pore–throat parameter distributions within the connected pore network.
Figure 8.
Pore–throat parameter distributions of the minimum REV. (a) Pore radius; (b) coordination number; (c) throat length; (d) pore–throat ratio.
Figure 8a shows the pore-radius distribution of the connected pore network. Pore radius reflects the scale of pore space and is an important parameter for evaluating storage-space development. The pore radius ranges from 3.462 μm to 70.94 μm, and most pore radii are concentrated between 5 μm and 25 μm, accounting for 83.61% of the total number of pores. The numbers of pores with radii of approximately 35 μm and 45 μm are relatively small, together accounting for 13.11%. This indicates that pore sizes in the minimum REV are strongly concentrated, with medium and small pores dominating and a limited number of larger pores locally developed.
Figure 8b shows the coordination-number distribution. The coordination number represents the number of neighbouring pores connected to a single pore and is an important indicator of pore-network connectivity. A larger coordination number indicates more connection paths and more available migration channels for fluid in the pore network. The maximum coordination number in this pore network is 9, and the average coordination number is close to 3. Coordination numbers are mainly distributed from 1 to 4, accounting for 84.09% of all pores. The high proportion of low-coordination pores indicates that the network contains many terminal or weakly connected pores. Nevertheless, the occurrence of local high-coordination pores enhances network connectivity and provides a structural basis for main seepage channels.
Combining pore-radius and coordination-number distributions, the minimum REV is not composed of uniformly developed pores. Instead, it shows the characteristics of dominant medium and small pores, locally developed large pores and evident spatial differences in connectivity. This structural feature means that fluid migration in coal is not a uniform diffusion process but tends to occur along locally well-connected pore channels.
4.2. Throat Structure and Pore–Throat Ratio
In a pore network, throats are the main flow channels connecting adjacent pores, and their geometric characteristics directly affect migration paths and local flow resistance. Unlike pores, which mainly control storage space, throats have a more direct influence on permeability. Well-developed throats make it easier for pores to form continuous flow paths, whereas narrow or poorly connected throats increase migration resistance and reduce permeability.
Figure 8c shows the throat-length distribution. The throat length in the minimum REV ranges from 70.60 μm to 710.91 μm and is mainly concentrated between 50 μm and 450 μm, accounting for 96.72%. This indicates that most throats in the REV have a certain extension scale and can form relatively continuous connections between pores. The presence of longer throats helps to expand the fluid migration range. However, their contribution to seepage capacity is jointly controlled by throat radius, local contraction and connection direction. Therefore, throat length alone cannot fully represent flow capacity and should be interpreted together with pore–throat ratio and network connectivity.
Figure 8d shows the pore–throat ratio distribution. The pore–throat ratio reflects the scale matching between pores and throats and can be used to characterise pore-space uniformity and local flow-resistance variation. In general, a smaller pore–throat ratio indicates a weaker difference between pore and throat scales, so the local contraction effect is relatively small when fluid enters a throat from a pore. A larger pore–throat ratio indicates a marked scale difference, which can produce greater local resistance at pore–throat connections.
The pore–throat ratio of the minimum REV shows a bimodal distribution and is mainly concentrated between 0.5 and 4.5. This indicates that the pore–throat structure of the REV is heterogeneous, but the overall scale difference between pores and throats is within a relatively acceptable range. Local regions with low pore–throat ratios favour smoother flow channels, whereas high-ratio regions may become local resistance positions that restrict fluid migration. Combined with the connected pore-network results in Section 3, these findings indicate that the upper part of the REV has better pore connectivity and relatively well-developed throats.
Therefore, pore radius, coordination number, throat length and pore–throat ratio jointly determine the seepage capacity of the connected pore network. Pore radius mainly affects fluid storage space, coordination number reflects network connectivity, throat length affects migration scale, and pore–throat ratio reflects scale matching between pores and throats.
4.3. Fractal Characteristics of the Pore Structure
The pore structure of coal is highly irregular and heterogeneous. Geometric parameters such as pore radius, throat length and coordination number cannot fully describe pore-space complexity. Fractal dimension can describe the complexity and spatial distribution of pore structures from the perspective of scale variation. A larger fractal dimension generally indicates a more complex spatial distribution and higher irregularity of the pore phase, whereas a smaller value indicates a relatively simple pore structure and lower spatial occupation.
The box-counting method was used to characterise the fractal features of the pore phase in two-dimensional CT slices of the minimum REV. The study object was covered by boxes of side length r, and the number of boxes required to cover the pore phase was counted. The two-dimensional fractal dimension D2d was calculated from the relationship between Nr(A) and r at different box scales:
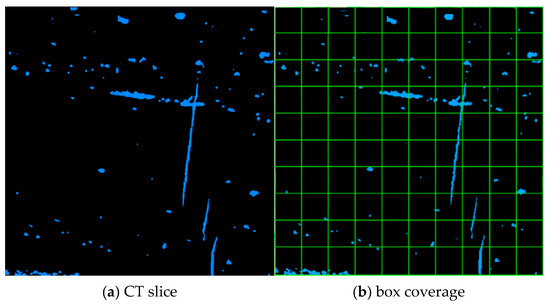
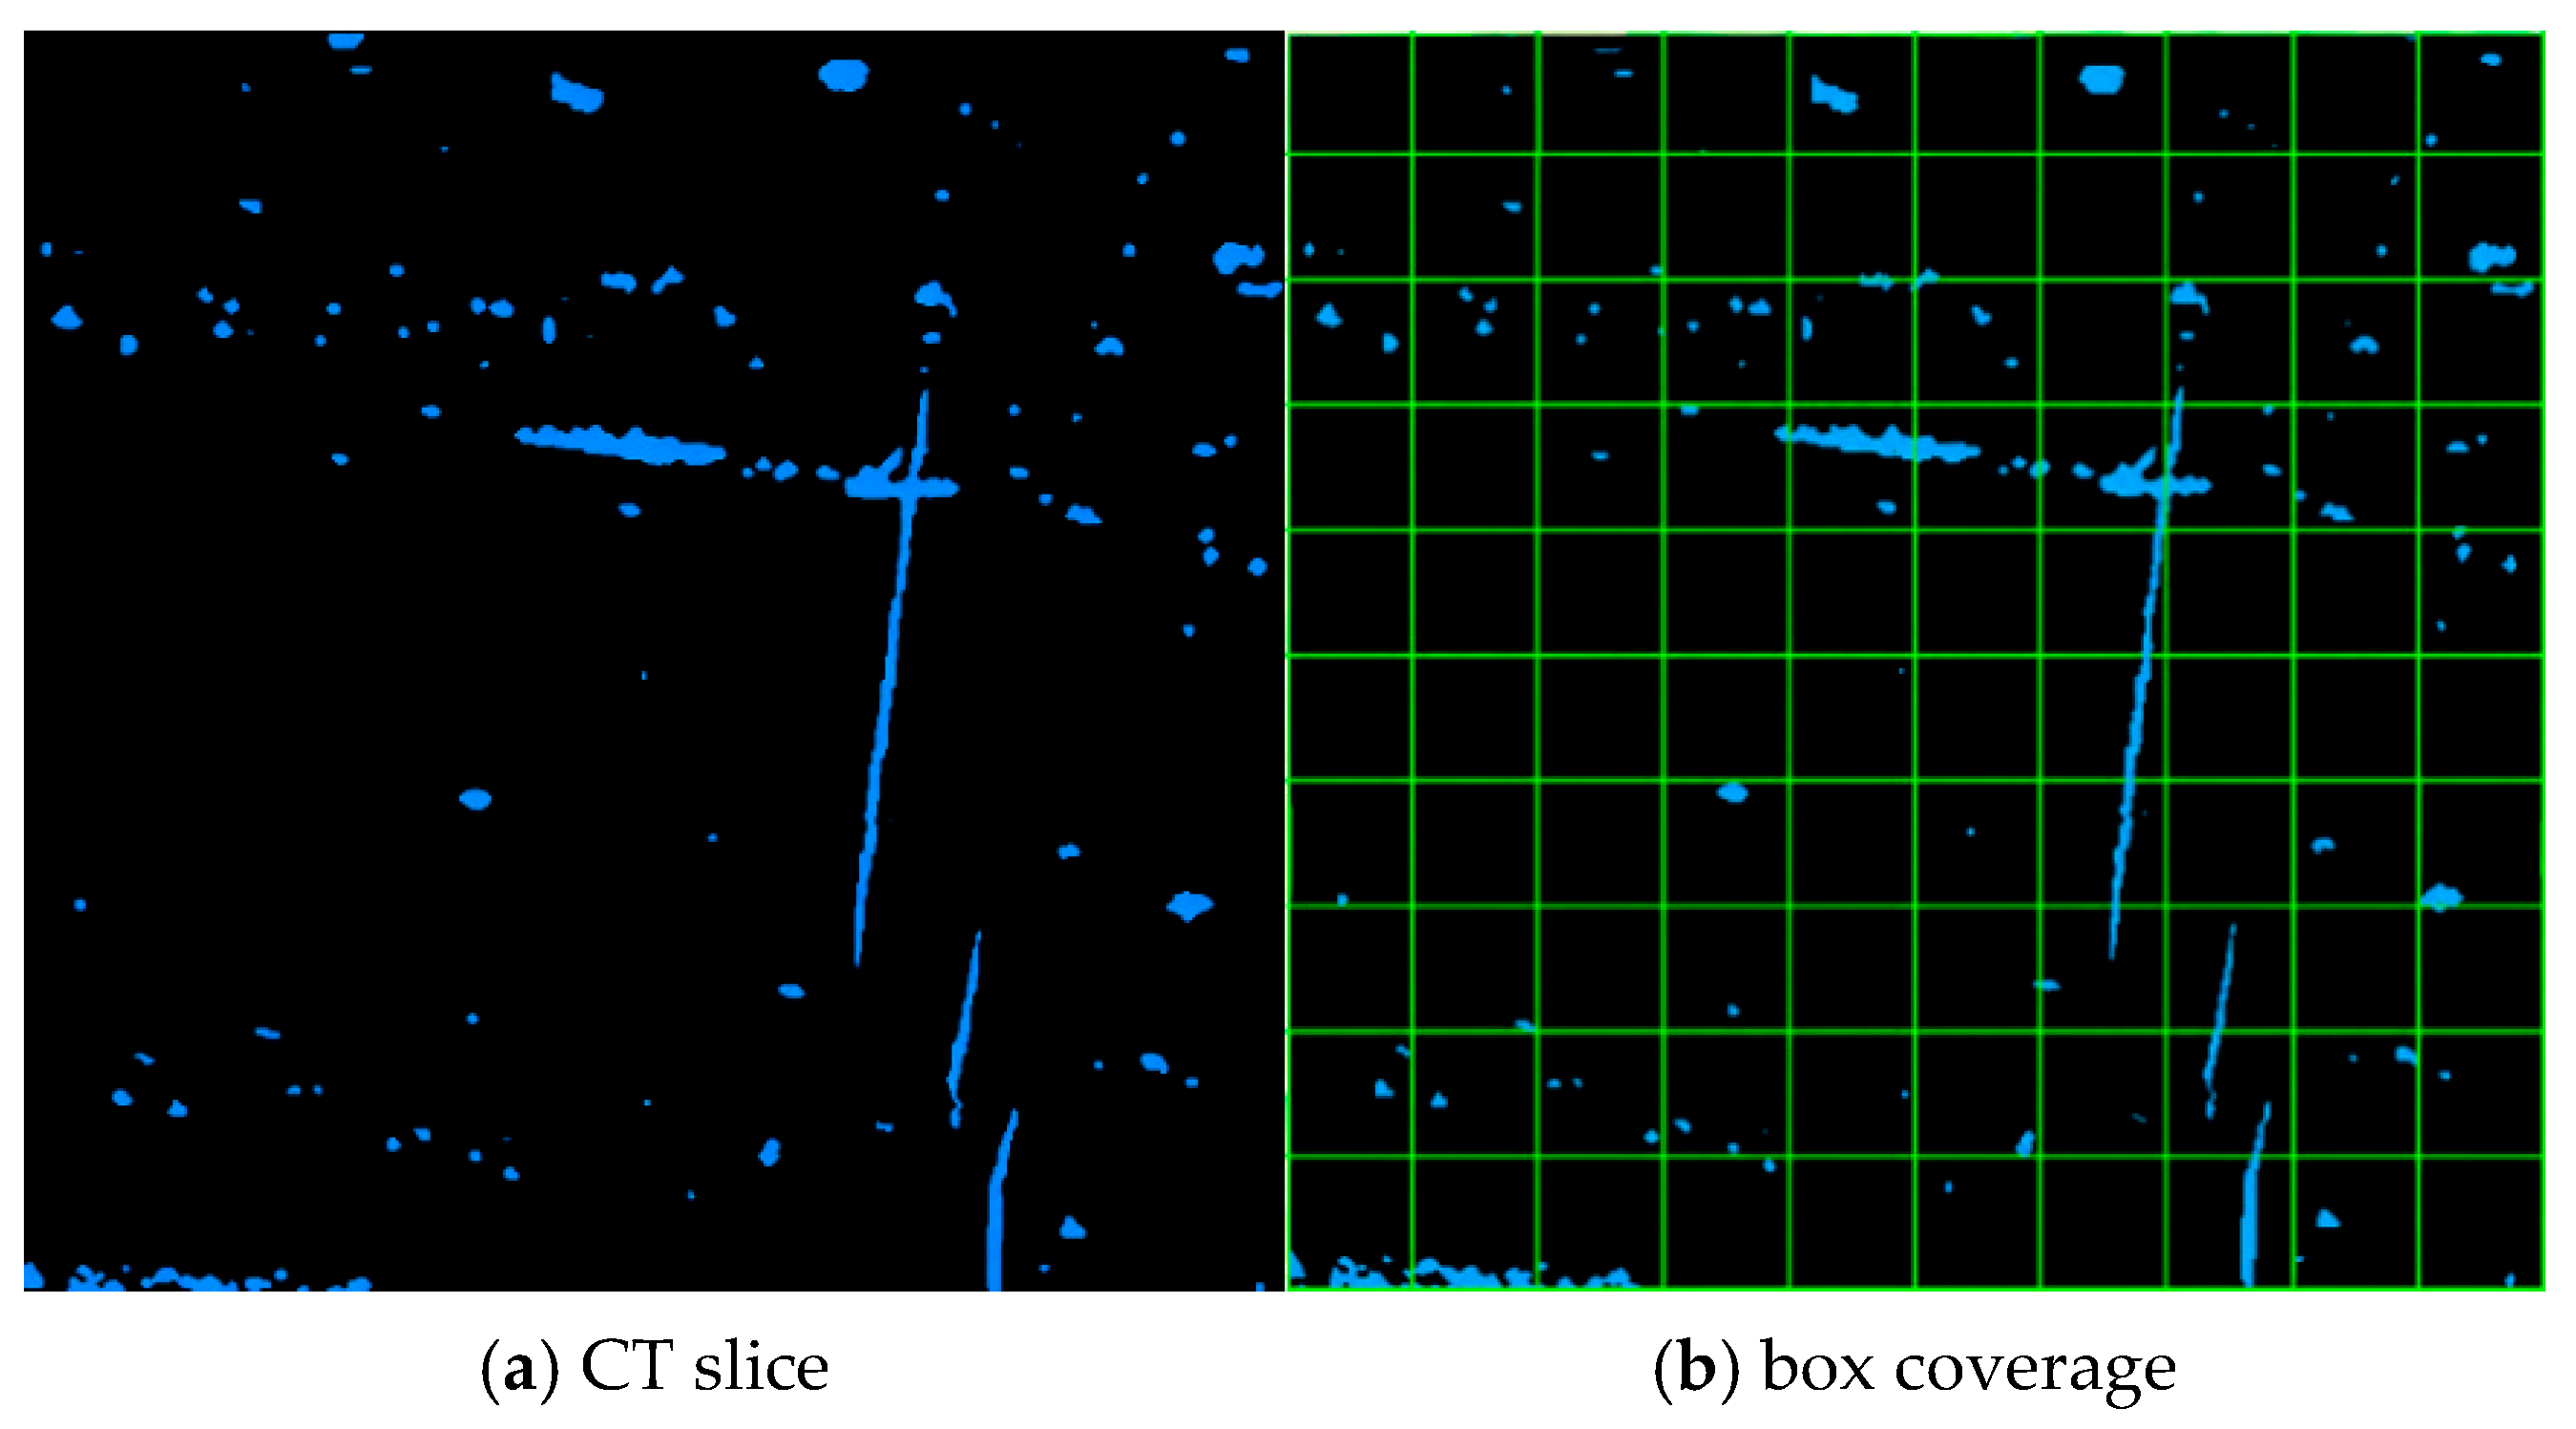
where D2d is the two-dimensional fractal dimension of the pore phase in a CT slice, r is the box side length, and Nr(A) is the number of boxes of side length r required to cover the pore phase. To reduce the effect of omitted boundary boxes, factors compatible with the image dimensions were selected as box scales so that the CT slice could be covered as completely as possible. Figure 9 illustrates the basic box-counting procedure.
Figure 9.
Schematic diagram of the box-counting method. (a) CT slice with the pore phase shown in blue against a black non-pore background; (b) the same slice overlaid with a green counting grid. The green lines define the boxes used to count pore occupancy at a given box size.
As shown in Figure 9, the box-counting method covers the pore phase in a CT slice using boxes of different sizes and counts the number of boxes required at each scale. The variation of Nr(A) with box side length r reflects the spatial occupation and morphological complexity of the pore phase in two dimensions. When the pore phase is more dispersed and its boundary more tortuous, the covering-box count changes more markedly with scale, and the corresponding fractal dimension better reflects pore-structure complexity. Thus, D2d supplements porosity statistics by describing pore heterogeneity from a fractal perspective.
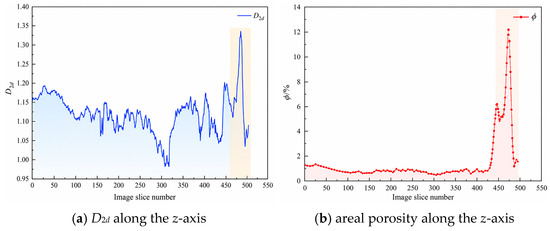
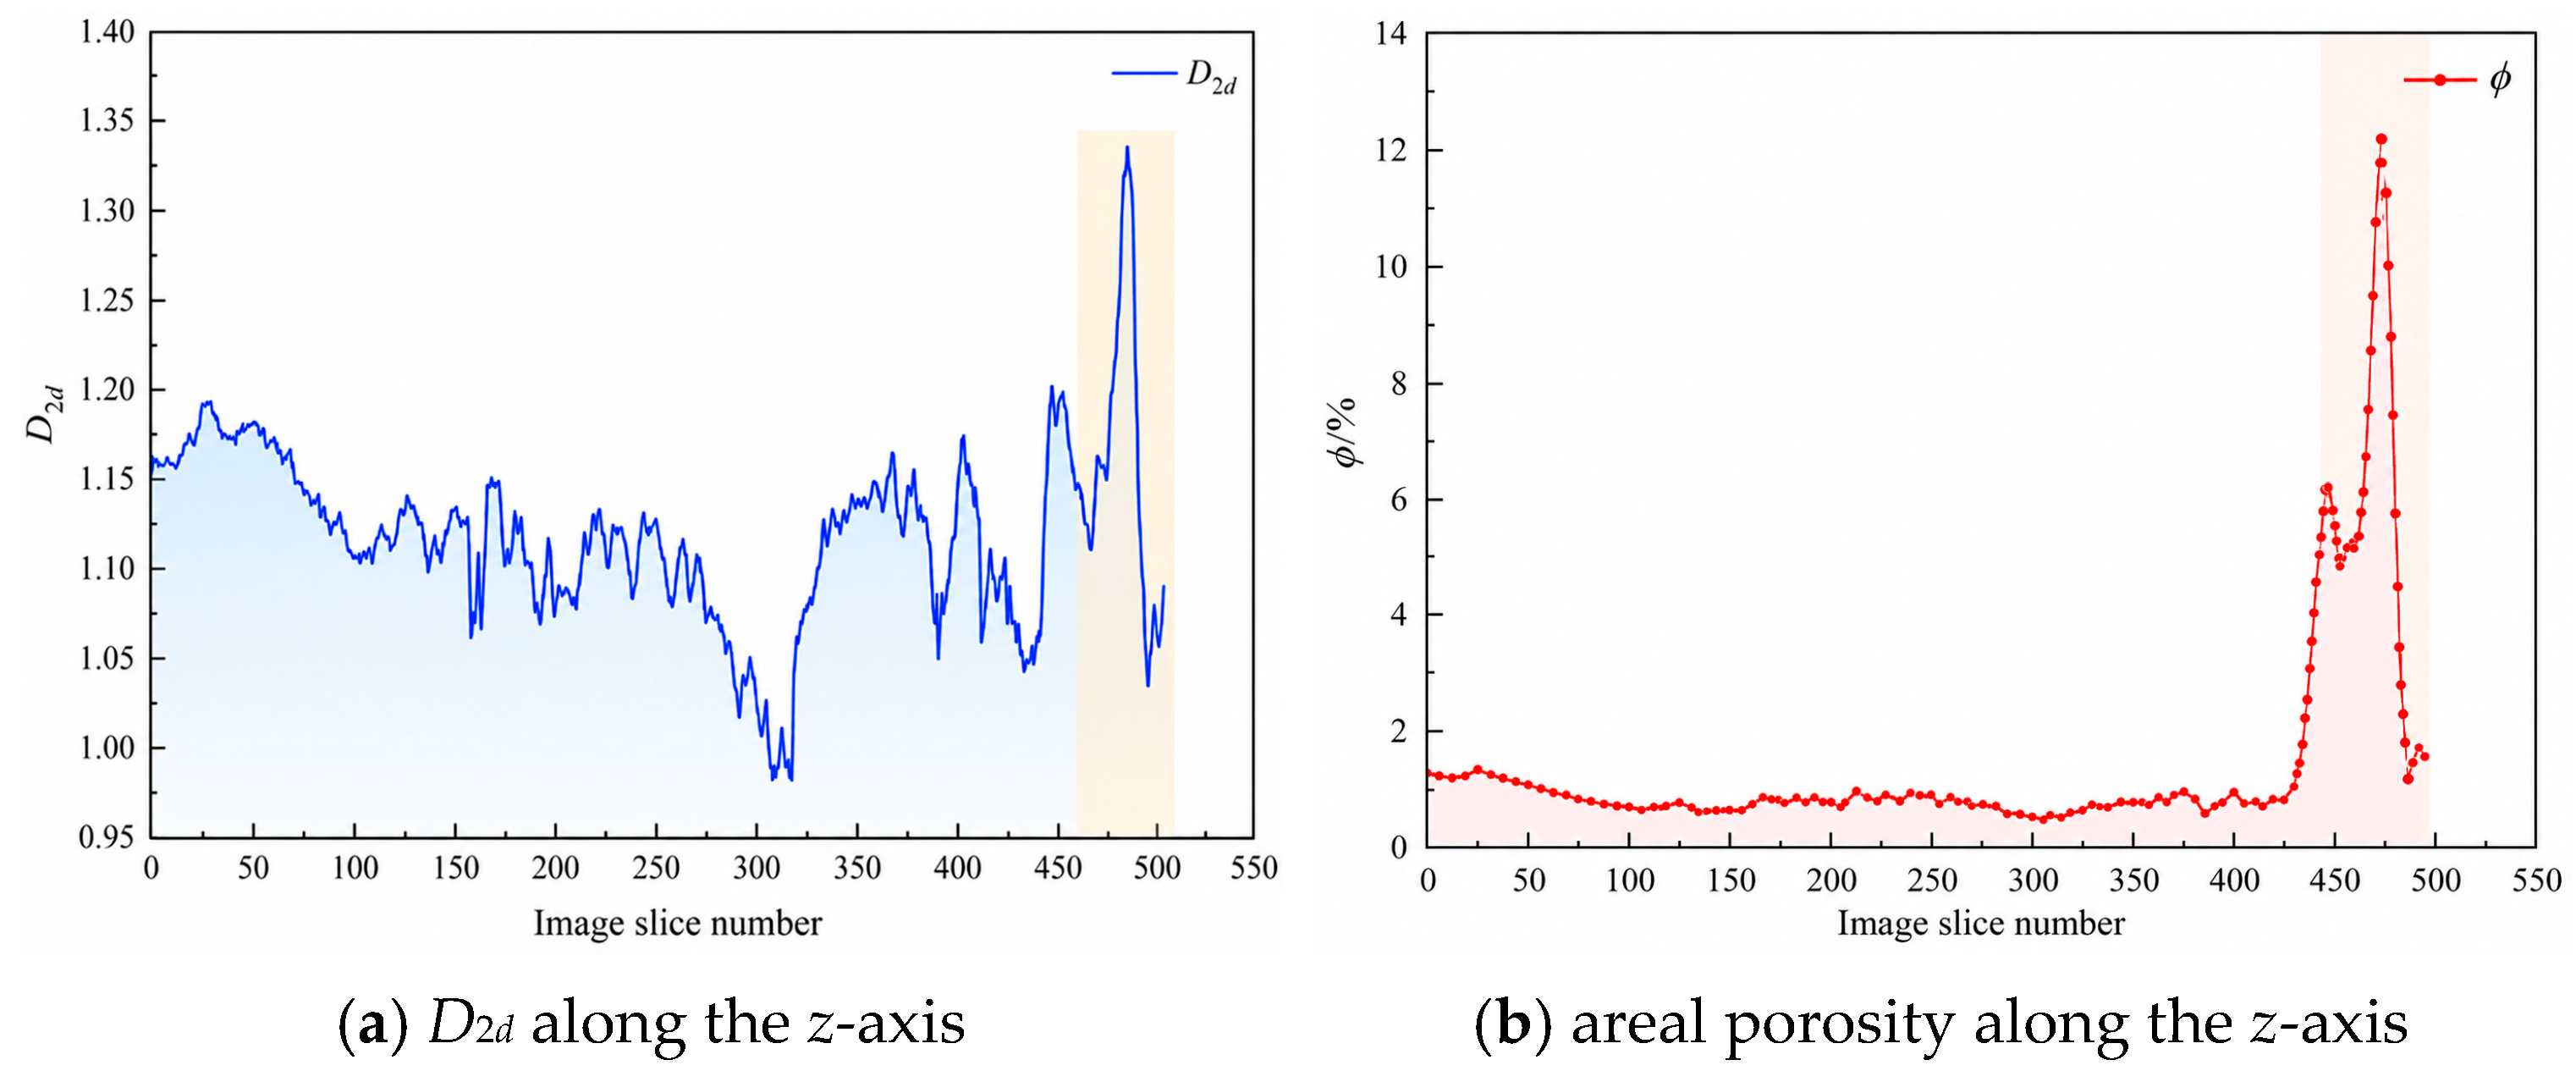
The box-counting dimension was then calculated for continuous CT slices in the minimum REV and compared with the corresponding areal porosity. Figure 10 shows the statistical results of D2d and areal porosity along the slices. D2d represents the spatial occupation and boundary complexity of the pore phase in a single slice, whereas areal porosity reflects the area fraction of the pore phase in that slice.
Figure 10.
Comparison between D2d and areal porosity in continuous CT slices. (a) Two-dimensional fractal dimension along the z-axis; (b) areal porosity along the z-axis.
Figure 10 shows that the average D2d value is 1.116 and the maximum value is 1.346, indicating that the pore phase in the minimum REV has certain fractal characteristics and spatial heterogeneity at the two-dimensional slice scale. Overall, D2d has a certain correspondence with areal porosity. When the proportion of the pore phase in a slice is high, pore boundaries and spatial distribution are usually more complex, and D2d increases accordingly. When the areal porosity is low, spatial occupation of the pore phase decreases and D2d tends to decrease.
However, D2d and areal porosity are not equivalent. Areal porosity mainly reflects the area proportion of the pore phase, whereas D2d emphasises morphological complexity, boundary tortuosity and spatial non-uniformity. It is therefore reasonable that their peak positions are not completely consistent. This indicates that pore-structure complexity is controlled not only by pore area fraction, but also by pore morphology and spatial distribution. D2d can therefore be used as a supplementary index to porosity statistics for describing pore-structure heterogeneity in coal.
5. Permeability Prediction Model and Seepage Simulation Consistency Assessment
Coal permeability is jointly controlled by pore scale, pore–throat connectivity, porosity, tortuosity and pore-space complexity. The preceding sections show that the pore-throat structure in the minimum REV is markedly heterogeneous: pore sizes are concentrated in a certain range, local high-coordination pores are developed, throat lengths vary, and the two-dimensional fractal dimension corresponds to areal porosity to some extent. It is therefore necessary to establish a permeability prediction model that reflects pore complexity and to assess its consistency through comparison with pore-scale flow simulation and laboratory test results.
5.1. Establishment of the Fractal Permeability Model
Because the internal pore structure of coal is complex, the actual pore network cannot be directly described by a regular geometric model. To establish a quantitative relationship between pore-structure parameters and permeability, the connected pore network in the minimum REV can be represented by an equivalent capillary bundle with fractal characteristics. This treatment does not imply that coal pores are composed entirely of regular capillaries; rather, it provides an equivalent description of the combined effects of pore-size distribution, porosity, specific surface area and tortuosity on fluid-flow capacity.
The model is based on the following assumptions: the connected pore network can be represented by an equivalent fractal capillary bundle; the fluid is a single-phase incompressible Newtonian fluid; pore-scale flow is steady and occurs at a low Reynolds number; the solid skeleton does not deform during flow; and gas adsorption, slip effects and stress sensitivity are neglected. Under these assumptions, permeability is controlled primarily by the connected pore structure and its fractal characteristics.
According to fractal theory, the relationship between pore radius r and the number Nr(A) of pores with radii greater than r can be expressed as follows:
where Nr(A) is the number of pores with radii greater than r, rmax is the maximum pore radius and Dp is the model fractal parameter describing the complexity of the pore-size distribution. Differentiating Equation (4) gives the number of pores with radii between r and r + dr:
where −dN(r) describes the decrease in pore number with increasing pore radius. The negative sign indicates only the inverse relationship between pore number and pore radius; the magnitude is used in the subsequent integration.
In the fractal capillary-bundle model, the apparent volume of the REV can be written as:
where V is the apparent model volume, L is the model length and A is the model cross-sectional area. Accounting for pore tortuosity, the pore volume can be expressed as the integral of capillary volumes over radius:
where Vpore is the pore volume and τ is the tortuosity. The connected porosity is obtained from the ratio of pore volume to apparent volume:
The pore specific surface area is the ratio of total pore surface area to the apparent model volume and can be written as:
where S is the total pore surface area and S0 is the pore specific surface area. The mean pore diameter can be calculated by weighting pore diameter by pore volume to describe the combined influence of pore scale on flow capacity.
Tortuosity describes the curvature of the pore-flow path relative to a straight path. A more complex pore structure produces a longer actual flow path, greater tortuosity and lower permeability. Based on the empirical relationship between porosity and tortuosity, τ can be expressed as follows:
After porosity, specific surface area and tortuosity have been obtained, absolute permeability can be calculated using the Kozeny–Carman equation:
where k is the absolute permeability and C is the Kozeny–Carman model parameter, distinct from the connectivity index defined in Equation (1). Considering the influence of the fractal parameter on pore-structure complexity, C can be expressed as follows:
Combining Equations (4)–(12) and introducing the minimum-to-maximum pore-radius ratio λ gives the absolute permeability prediction model based on fractal pore-structure parameters:
This model incorporates pore-size distribution, connected porosity and tortuosity into the permeability calculation and provides an equivalent description of scale variation in the connected pore network and curvature of the flow path. In the present study, an independent three-dimensional pore-size-distribution fractal exponent was not available. Therefore, the mean two-dimensional box-counting dimension of the minimum REV (D2d = 1.116) was adopted as an equivalent structural fractal parameter Dp for the analytical permeability calculation. This treatment is an empirical scale-linking approximation for the selected CT sample and should not be interpreted as a general theoretical identity between Dp and D2d.
5.2. Model Parameters and Permeability Prediction Results
According to the connected pore-network extraction result of the minimum REV, the maximum pore radius is 70.94 μm, the minimum pore radius is 3.462 μm and the connected porosity is 1.358%. The mean two-dimensional box-counting dimension D2d = 1.116 was used as the equivalent structural fractal parameter Dp in the present REV-scale permeability model, as described above. The parameters used in the model are listed in Table 3.
Table 3.
Parameters and sources used in the fractal permeability model.
Substituting these parameters into the fractal permeability model gives an absolute permeability of 0.1894 μm2 for the minimum REV. Compared with the average permeability of 0.17708 μm2 obtained from the laboratory porosity-permeability test, the relative error is 6.96%. This result indicates that the permeability prediction model constructed from the connected pore network and fractal parameters can reasonably reflect the seepage capacity of the selected anthracite at the REV scale.
The predicted value is slightly higher than the test value. This difference is mainly related to two aspects. First, the digital core model is built from a local REV, and its pore connectivity may be higher than the average connectivity of the whole physical sample. Second, the model represents the complex pore network as an equivalent fractal capillary bundle, which weakens the blocking effects of local contraction, closed pores and unrecognised fine pores. Therefore, the prediction result demonstrates the applicability of the model to the current sample, but it should not be interpreted as proof of the model’s universal validity.
5.3. Sensitivity Analysis of Model Parameters
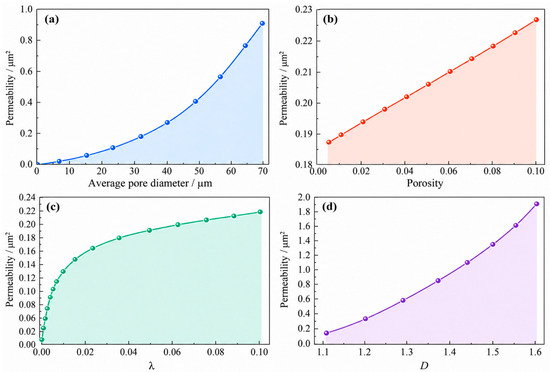
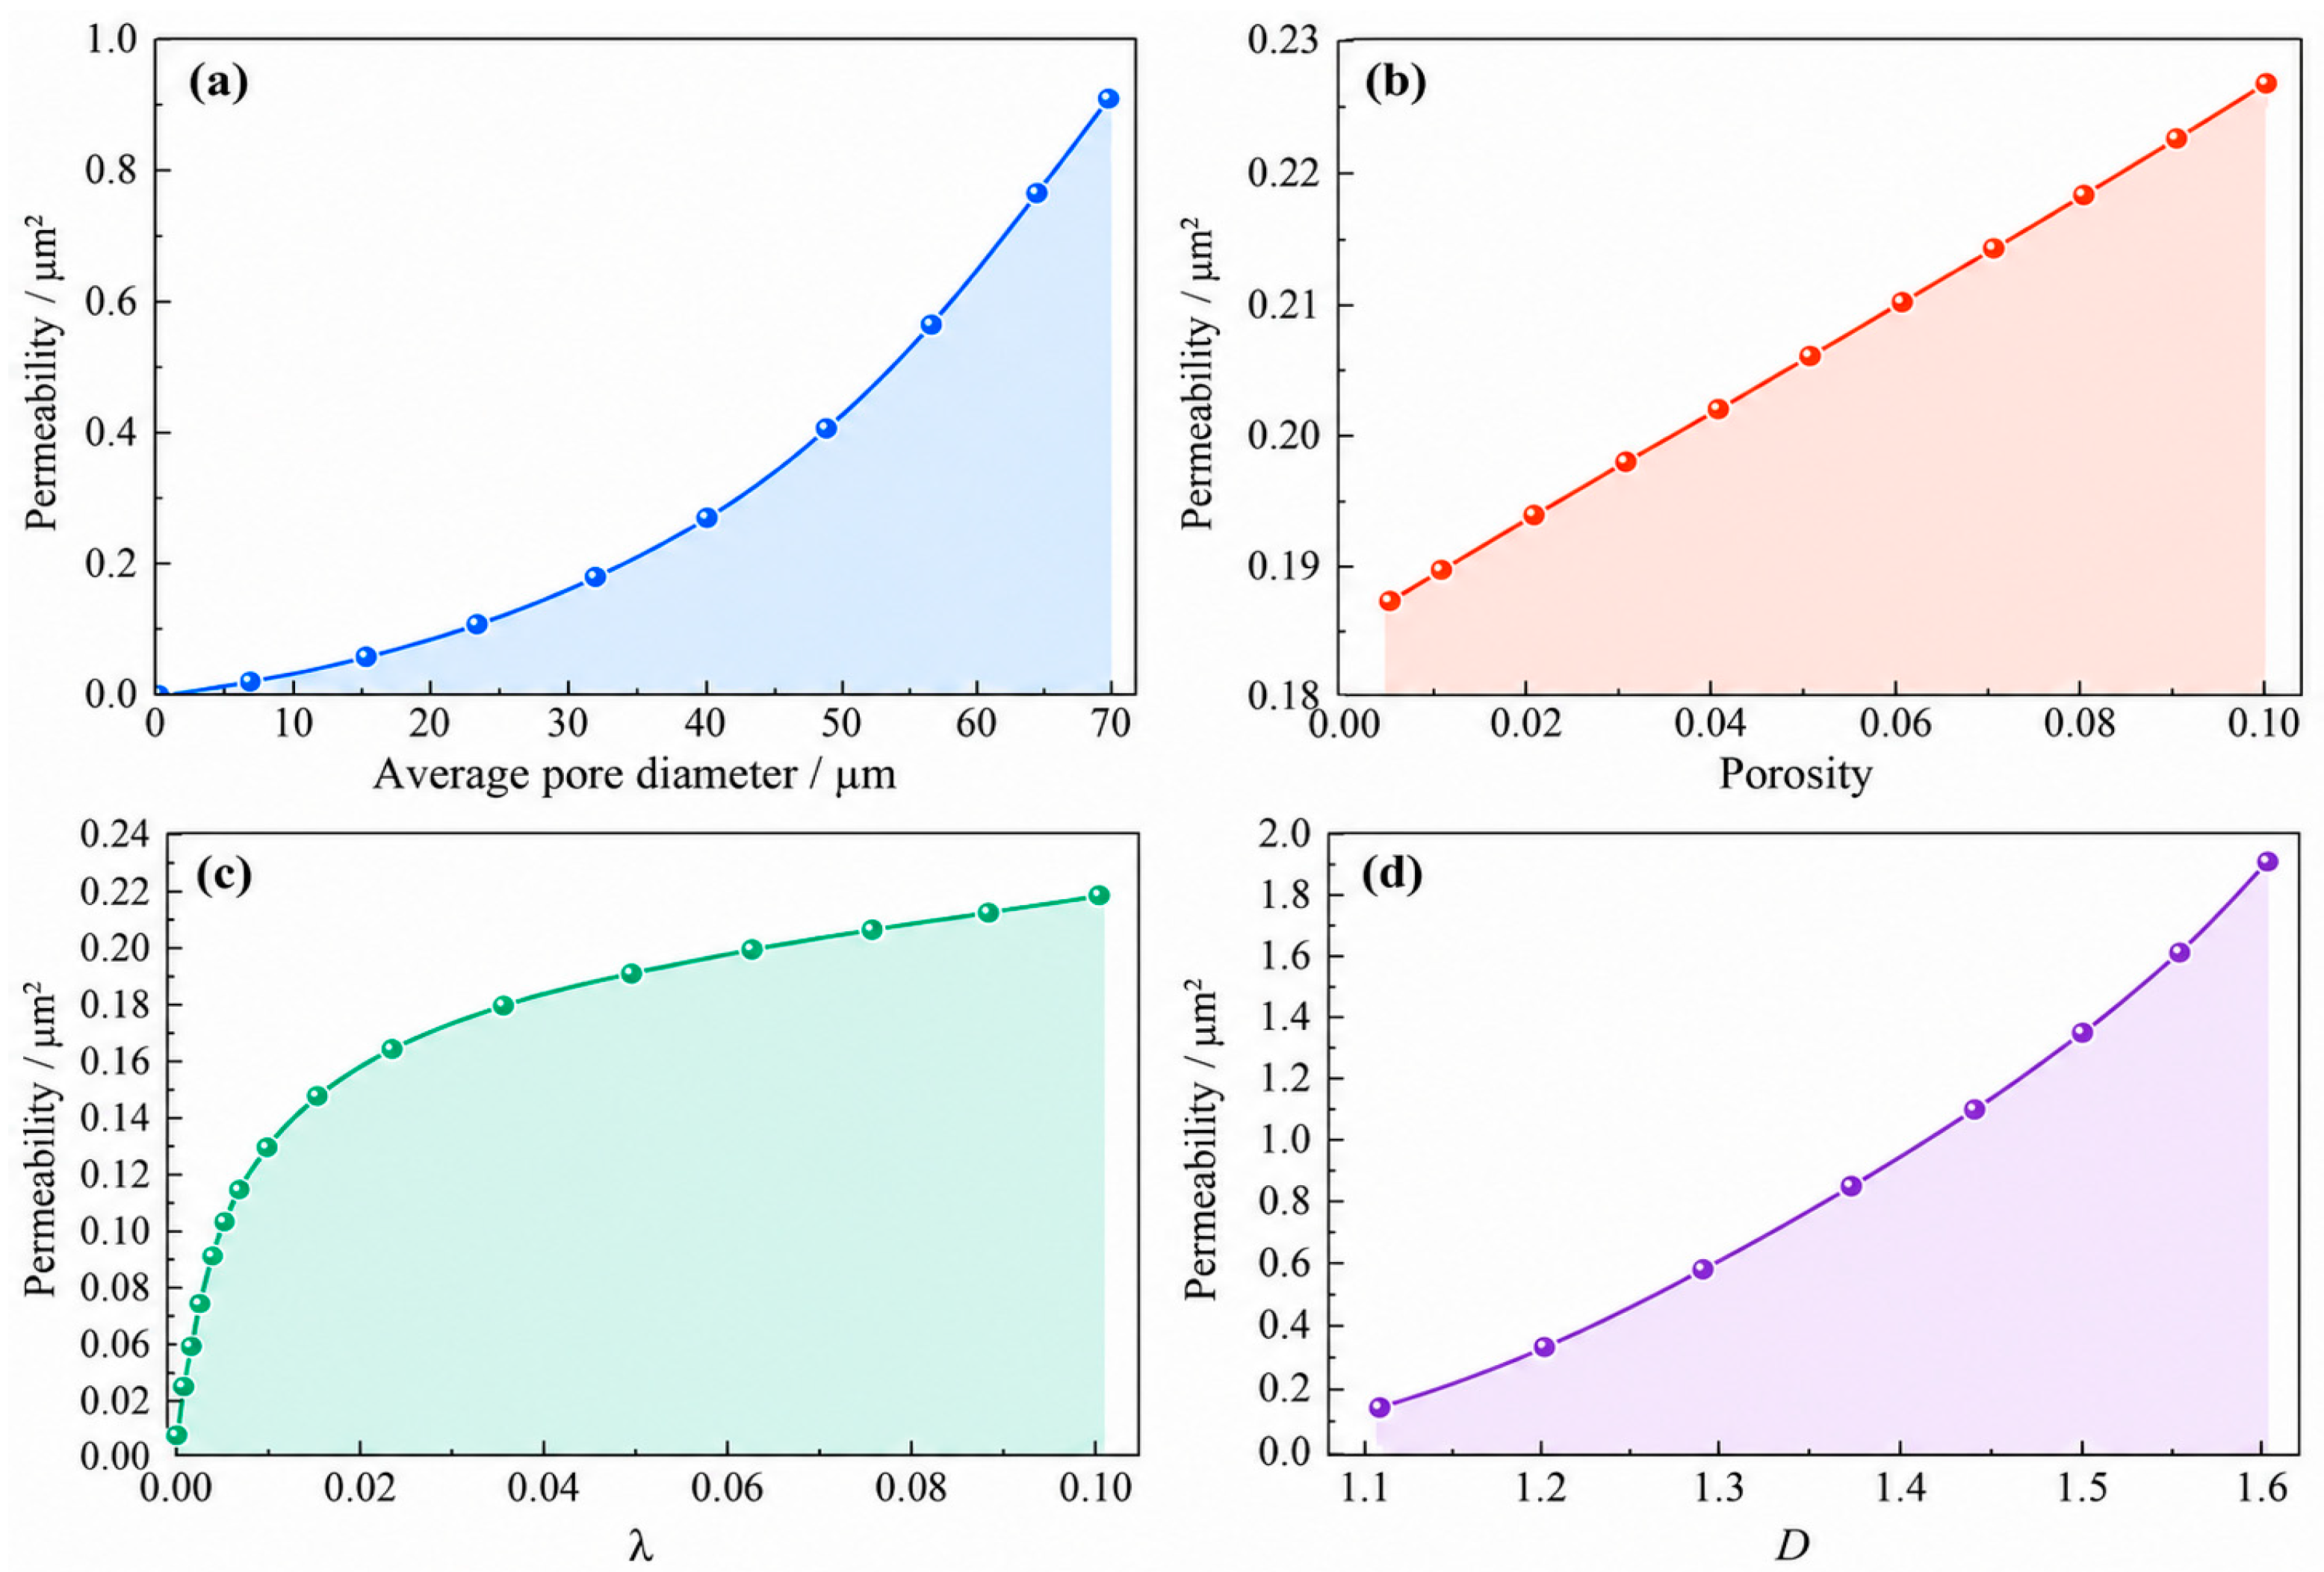
To further analyse the influence of pore-structure parameters on permeability prediction, the average pore diameter, connected porosity, minimum-to-maximum pore-radius ratio λ and fractal parameter D were varied individually in the fractal permeability model while the remaining parameters were held fixed. Figure 11 therefore represents a one-factor-at-a-time local sensitivity analysis rather than a fully coupled multi-parameter response. Figure 11a–d shows the respective responses to average pore diameter, connected porosity, λ and D. The symbol D in Figure 11 denotes the model fractal parameter used in Section 5.1.
Figure 11.
Sensitivity analysis of model parameters on permeability. Effects of (a) average pore diameter; (b) connected porosity; (c) minimum-to-maximum pore-radius ratio, λ; and (d) model fractal parameter, D. Each parameter is varied individually while the remaining parameters are held fixed.
As shown in Figure 11a, permeability increases with increasing average pore diameter, and the growth becomes more obvious when the average pore diameter is large. This is because a larger average pore diameter means a larger effective pore-space scale, wider flow channels and lower local flow resistance. When the pores are well connected, a larger average pore diameter can significantly improve fluid migration capacity. Therefore, average pore diameter is an important geometric parameter affecting coal permeability.
Figure 11b shows that permeability generally increases with connected porosity, and the rate of increase gradually becomes larger. Connected porosity reflects the scale of the pore space that forms effective flow paths. If connected porosity increases, the number or size of available flow channels in the pore network increases and seepage capacity is enhanced. By contrast, an increase in isolated pore volume does not directly contribute to through-flow. Therefore, connected porosity is more representative of effective flow capacity than total CT porosity in permeability prediction.
Figure 11c shows that permeability increases as λ increases. The initial increase is relatively rapid, and the growth rate then gradually slows. A smaller λ indicates a larger difference between the minimum and maximum pore radii, a more uneven pore-size distribution and a greater probability that small pores or fine throats form local flow bottlenecks. As λ increases, the difference in pore size decreases, pore-space development becomes more uniform, and local resistance at pore–throat connections is reduced. As a result, permeability increases accordingly.
Figure 11d shows that permeability increases as D increases, and the growth becomes more significant after D reaches a certain range. The fractal parameter represents pore-structure complexity and pore-size distribution characteristics. When D increases, the spatial occupation of the pore phase and the complexity of pore development increase. If these pores form connected channels, permeability may increase. However, the influence of the fractal parameter must be considered together with connected porosity and pore-throat structure. If the increased complexity mainly reflects more isolated pores, permeability will not necessarily improve. Only when complex pore structures develop together with effective connected channels can permeability increase significantly.
Overall, the sensitivity analysis indicates that average pore diameter and connected porosity control the effective scale of the flow space, λ reflects pore-size uniformity, and D represents structural complexity. In real coal, these parameters are not fully independent and may evolve in a coupled manner. Accordingly, the present one-factor-at-a-time results should be interpreted as first-order directional sensitivities rather than quantitative predictions of multi-parameter coupling. A coupled sensitivity framework based on a larger experimental and digital-core dataset is required for a more general assessment.
5.4. Pore-Scale Flow Simulation and Error Analysis
To assess the consistency of the fractal permeability prediction with pore-scale transport, single-phase flow simulation was performed using the connected pore geometry of the minimum REV. The Stokes equations were used to describe low-Reynolds-number flow in the pore space, and Darcy’s law was used to calculate absolute permeability. Because the analytical model and numerical simulation are derived from the same CT-based REV geometry, their comparison is treated as a consistency check rather than a fully independent validation.
Darcy’s law can be expressed as follows:
where Q is the total volumetric flow rate through the porous medium (m3/s), S is the cross-sectional area of the sample (m2), k is the absolute permeability (m2), μ is the dynamic viscosity (Pa·s), ΔP is the pressure difference across the sample (Pa), and L is the sample length in the flow direction (m).
Pore-scale flow satisfies the Stokes equations:
where v is the fluid velocity vector, P is the fluid pressure, ∇ is the gradient operator and ∇2 is the Laplacian operator. By solving the velocity and pressure fields in the pore space, the flow rate Q can be obtained and substituted into Darcy’s law to calculate the absolute permeability.
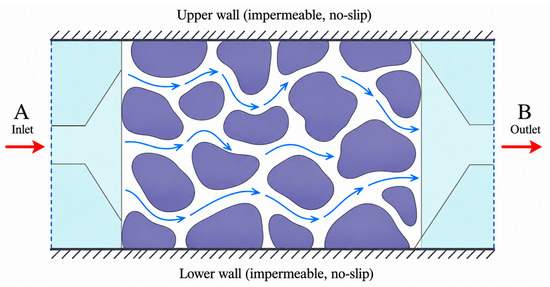
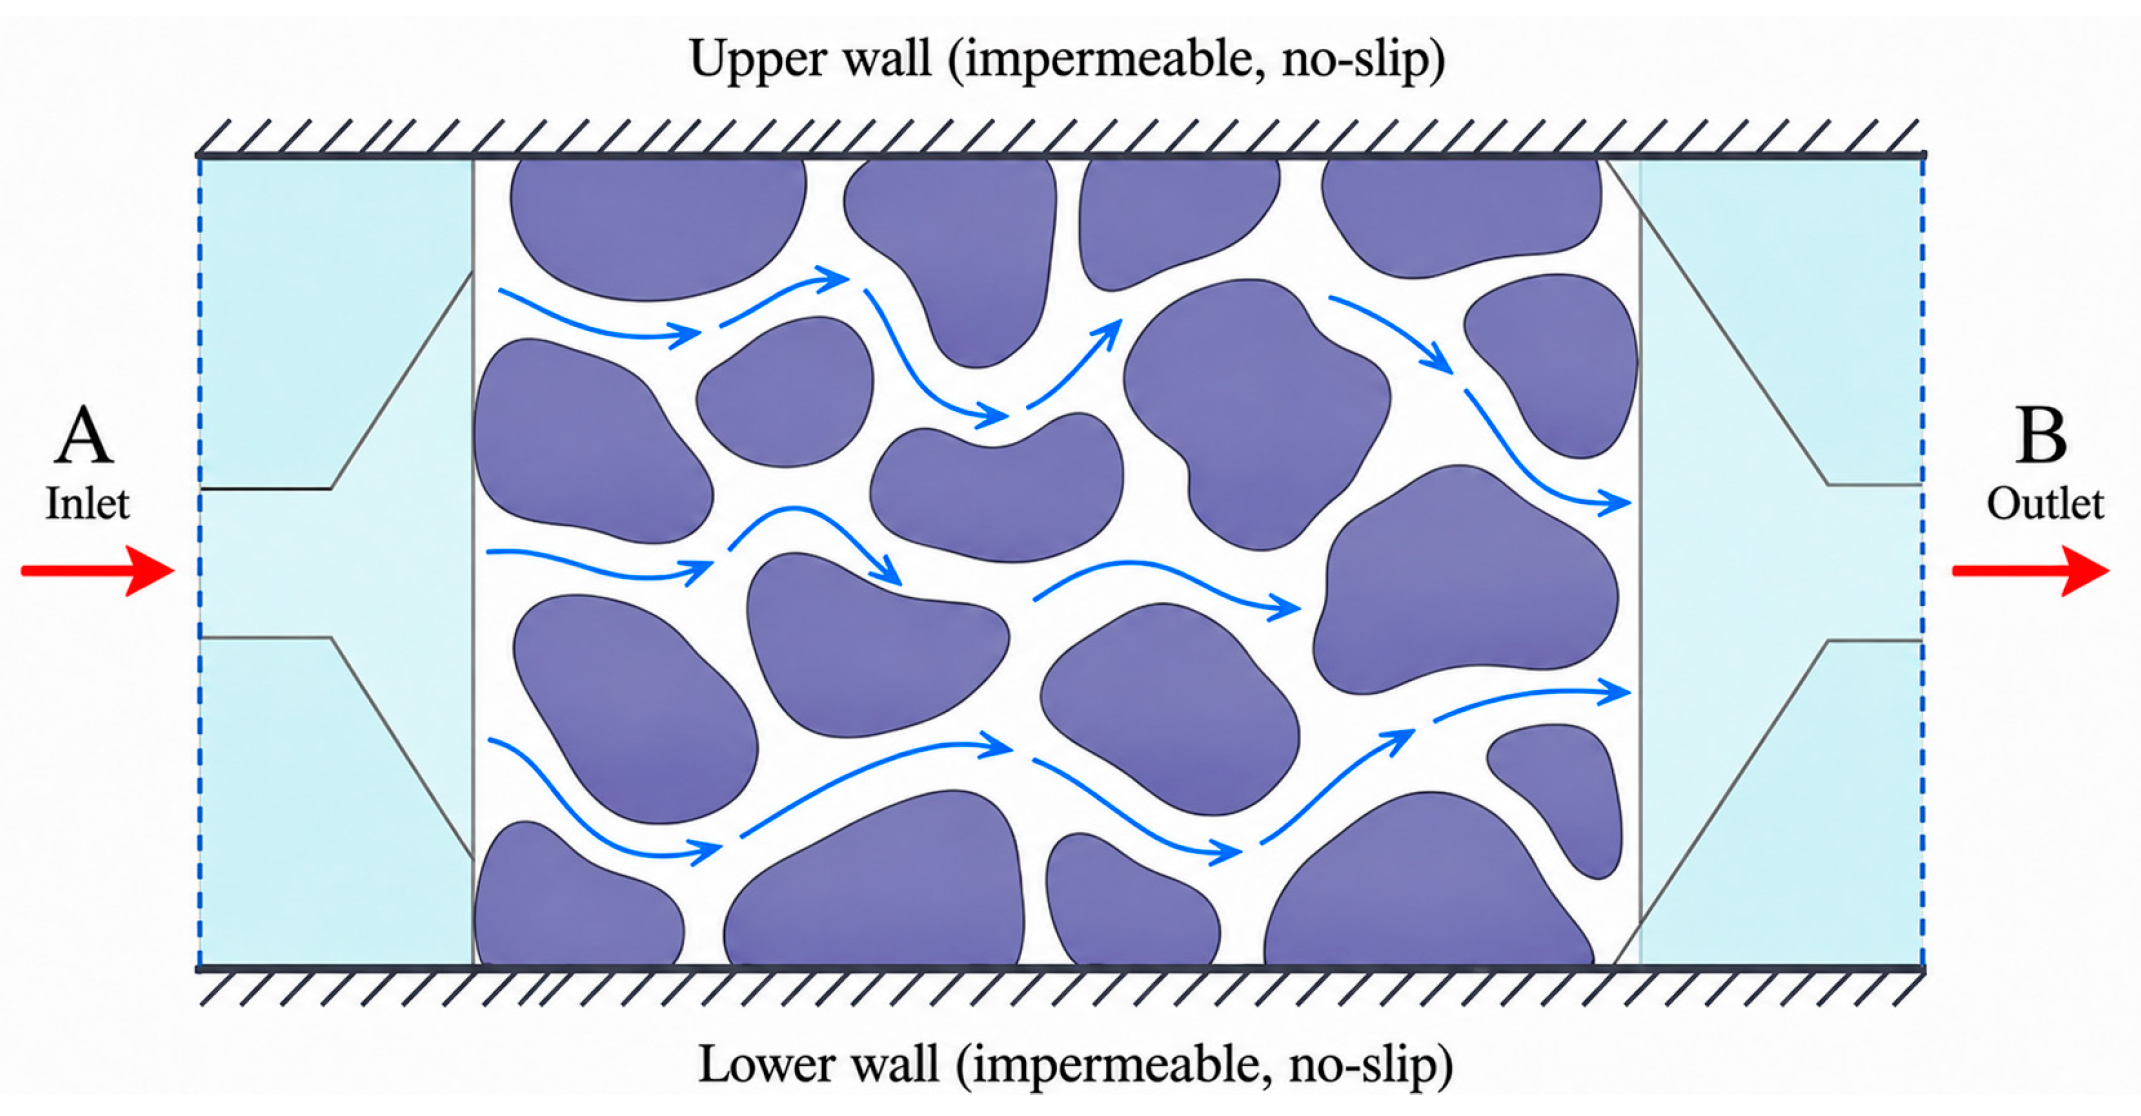
Water was used as the fluid in the numerical simulation. The inlet pressure at A (left side) was set to 1.3 × 10⁵ Pa and the outlet pressure at B (right side) to 1.0 × 10⁵ Pa; the dynamic viscosity was 1.01 × 10⁻³ Pa·s. Flow therefore proceeds from A to B (left to right) under a pressure difference of 3.0 × 10⁴ Pa. The side walls were treated as no-slip solid boundaries. The coal matrix was assumed to be rigid, and flow-induced deformation of the solid skeleton was not included in this single-phase Stokes calculation. The boundary conditions are shown in Figure 12.
Figure 12.
Boundary conditions for pore-scale flow simulation. Red arrows indicate the overall flow direction from inlet A to outlet B; blue arrows indicate local flow paths through the pore space. Purple regions represent the solid matrix, and the upper and lower boundaries are impermeable, no-slip walls.
The simulation result shows that the absolute permeability of the minimum REV is 0.186436 μm2. This value is close to the fractal-model prediction of 0.1894 μm2, with a relative difference of 1.56%. Compared with the average permeability of 0.17708 μm2 obtained from the porosity–permeability test, the relative error is 5.28%. The comparison of permeability values obtained by different methods is listed in Table 4.
Table 4.
Comparison of permeability prediction, simulation and test results.
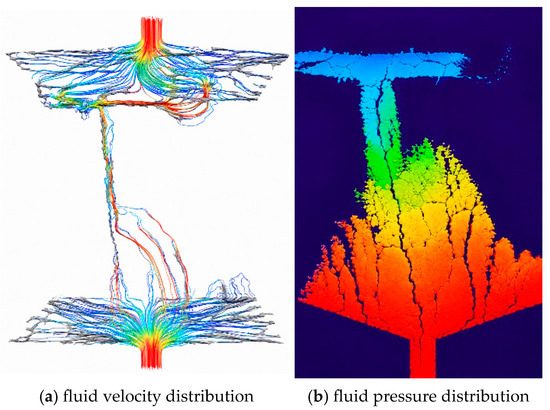
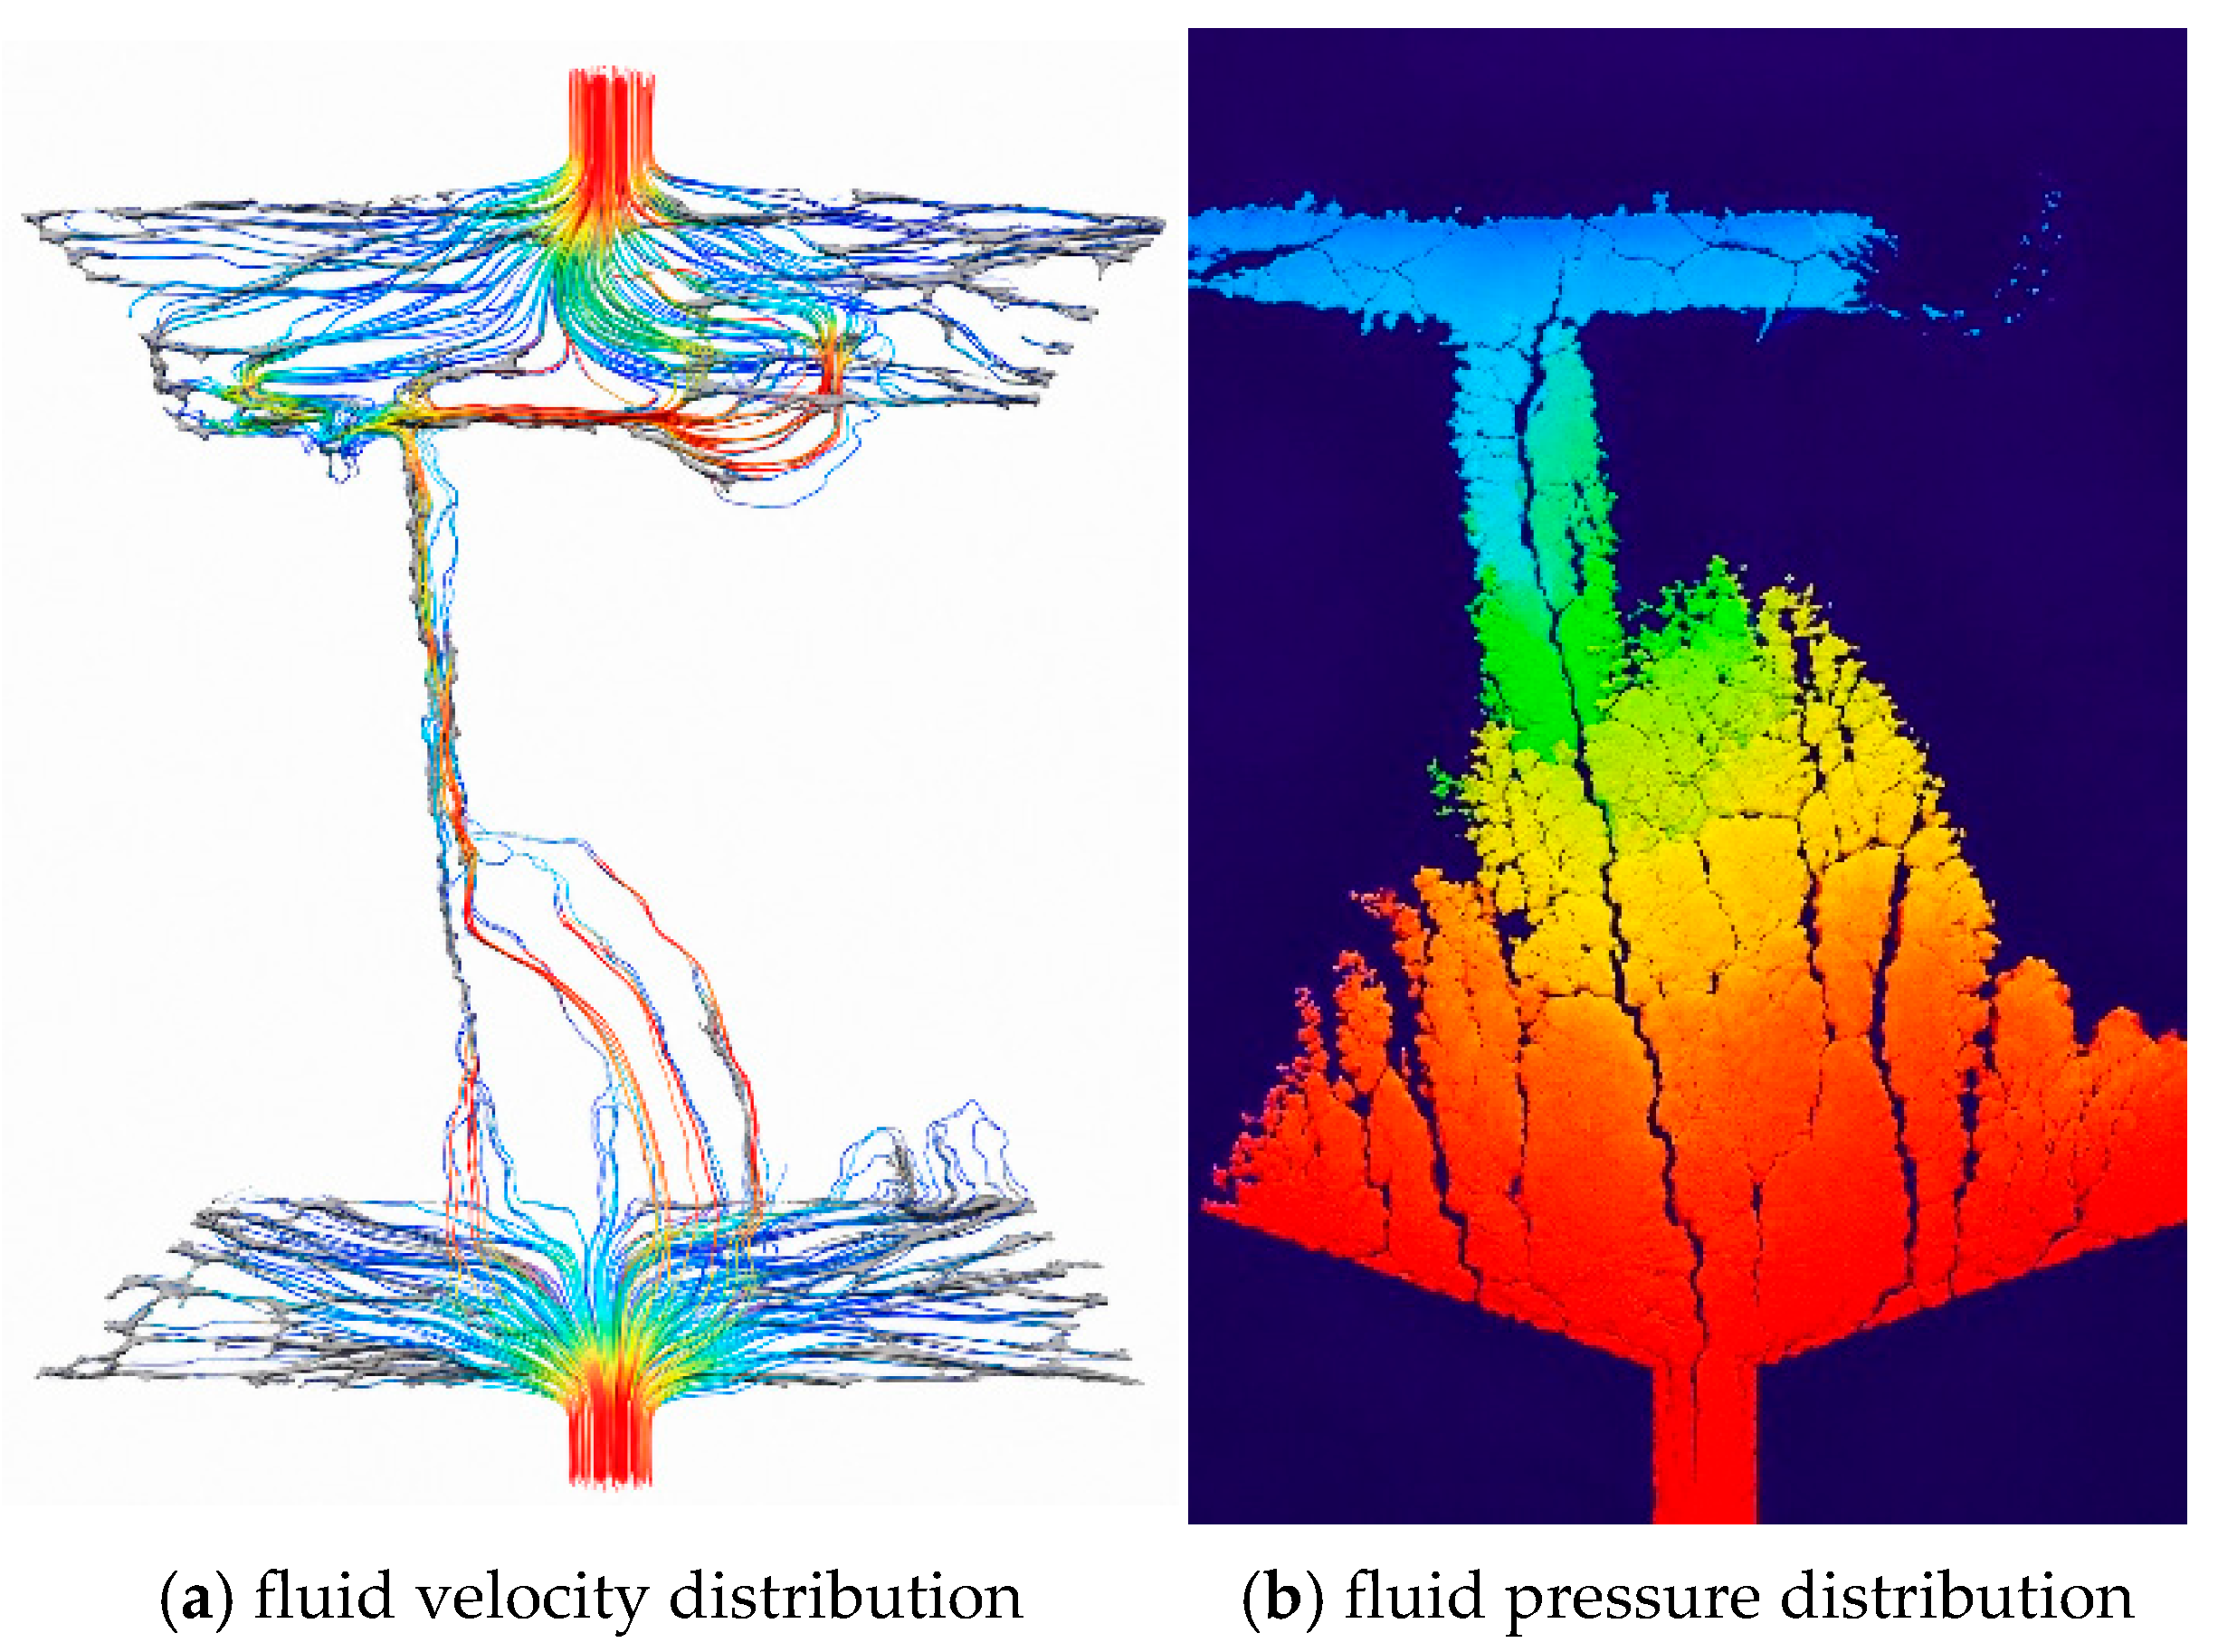
Table 4 shows that the errors between the fractal-model prediction, Stokes simulation result and laboratory test value are all less than 7%. This indicates that the fractal permeability model based on the minimum REV can reasonably reflect the seepage capacity of the connected pore network in the coal sample. The numerical simulation value is slightly lower than the fractal prediction, suggesting that Stokes simulation can more directly reflect local contraction, flow-path tortuosity and throat restriction in the pore space, whereas the fractal model simplifies local blocking effects during equivalent modelling. The velocity and pressure fields in the minimum REV are shown in Figure 13.
Figure 13.
Qualitative fluid fields: (a) velocity; (b) pressure (warm colours indicate relatively high values and cool colours relatively low values within each panel; pressure boundary values are 1.3 × 10⁵ Pa at inlet A and 1.0 × 10⁵ Pa at outlet B).
As shown in Figure 13, fluid enters from inlet A on the left and exits through outlet B on the right. The pressure therefore decreases overall along the A-to-B flow direction. Figure 13 shows a qualitative spatial field map; the colours indicate relative high-to-low values within each field rather than calibrated colour-bin values. Quantitative interpretation is based on the prescribed inlet and outlet pressures and on the calculated flow rate and permeability. A relatively high-pressure region occurs in the lower part of the unit, where fewer connected pores and stronger local constrictions increase flow resistance and delay pressure dissipation.
The velocity field further shows that relatively high-velocity zones are concentrated in better-connected regions with more continuous throats, whereas poorly connected or locally constricted regions exhibit lower velocities and larger local resistance. As the fluid reaches zones with more parallel migration paths, local pressure accumulation is reduced. This qualitative relation between channel morphology, connectivity and flow conduction is consistent with observations reported for fractured porous media [31].
There are still differences among the predicted, simulated and measured permeability values, and several limitations should be noted. First, the CT spatial resolution is 3 μm; pores and throats below this scale, including nano-scale adsorption pores, cannot be resolved. Water-vapour studies show that adsorption is preferentially associated with coal micropores and is also affected by surface chemistry [32]; the present CT model should be interpreted as a characterisation of micro-scale connected seepage pores rather than the complete adsorption-pore system. Second, threshold segmentation and black-hat compensation improve pore recognition but still introduce segmentation uncertainty. Third, the REV is a local volume selected from one CT specimen, whereas the laboratory permeability represents three larger physical specimens; therefore, scale and specimen heterogeneity remain sources of difference. Fourth, the matrix was treated as rigid, so stress sensitivity, adsorption-induced deformation and flow-solid coupling were not considered. Finally, the analytical fractal model idealises the pore network as an equivalent capillary system and does not explicitly include sub-voxel pore-wall roughness. Such roughness can reduce effective flow area and increase local resistance [33], which may contribute to the slight overprediction of permeability.
In general, the fractal prediction, Stokes simulation and laboratory measurements show close numerical consistency for the selected anthracite. This consistency supports the feasibility of linking CT-derived connected pore structure with a fractal permeability model at the REV scale, but it does not constitute independent validation of universal model accuracy because the analytical and numerical calculations share the same digital-core geometry and the laboratory measurements were made at a larger scale.
6. Conclusions
A three-dimensional digital core of anthracite from the Sihe Mine in Jincheng was constructed from CT scans. The pore structure and seepage capacity were analysed through REV selection, connected pore-network extraction, pore–throat characterisation and fractal permeability prediction, and the resulting permeability values were compared with Stokes pore-scale simulation and laboratory porosity–permeability measurements. The following conclusions were obtained:
(1) Porosity–permeability testing showed that the average porosity and permeability of the anthracite samples were 1.8769% and 0.17708 μm2, respectively. The total porosity obtained from CT image segmentation was 2.7128%. The CT-derived total porosity is higher than the porosity measured by the porosity–permeability test because CT can identify all pore space within the resolution range, including isolated and weakly connected pores, whereas the physical test more directly reflects effective pores participating in fluid migration at the macroscopic scale;
(2) According to porosity convergence at three spatial positions, a side length of 500 voxels was selected as the minimum porosity-based REV size, corresponding to 1500 μm × 1500 μm × 1500 μm. Position III was used for subsequent connected-network analysis. Its total porosity was 3.1212%, its connected porosity was 1.358%, and the corresponding connectivity index was 0.4351. The resulting pore network provided a local geometric basis for analysing seepage through the CT-resolvable connected pore space;
(3) In the minimum REV, pore radii were mainly distributed between 5 μm and 25 μm, with a maximum pore radius of 70.94 μm. The maximum coordination number was 9, the average coordination number was close to 3 and the maximum throat length was 710.91 μm. Pore radius, coordination number, throat length and pore–throat ratio jointly reflect storage space, connectivity and local flow resistance in the pore network. The variation of the two-dimensional fractal dimension D2d was generally consistent with areal porosity along the z-axis, suggesting that fractal dimension can supplement porosity by describing pore-distribution heterogeneity from the perspective of structural complexity;
(4) The permeability predicted by the fractal model was 0.1894 μm2 and the absolute permeability obtained from Stokes pore-scale flow simulation was 0.186436 μm2. Their relative differences from the laboratory mean of 0.17708 μm2 were less than 7%. The numerical consistency among the three values provides sample-specific support for the feasibility of the proposed REV-scale workflow, but it should not be interpreted as an independent validation of universal predictive accuracy;
(5) The applicability of the present model is limited by the 3 μm CT resolution, the use of one CT specimen and a local porosity-based REV, image-segmentation uncertainty, the equivalent use of the mean D2d as the model fractal parameter, and the assumptions of a rigid matrix, smooth equivalent capillaries and uncoupled model parameters. The results are therefore most appropriately interpreted for single-phase steady seepage through CT-resolvable micro-scale connected pores in the selected anthracite. Future work should incorporate multi-scale imaging, independent three-dimensional fractal parameters, multi-directional seepage, roughness and flow–solid coupling, and additional coal ranks and specimens.
Author Contributions
Conceptualization, Z.L. and B.Z.; Methodology, Z.L. and B.Z.; Software, B.Z. and H.M.; Validation, B.Z. and H.M.; Formal analysis, B.Z. and H.M.; Investigation, B.Z.; Resources, Z.L.; Data curation, B.Z. and H.M.; Writing—original draft, H.M.; Writing—review and editing, Z.L., B.Z. and H.M.; Visualization, B.Z. and H.M.; Supervision, Z.L.; Project administration, Z.L.; Funding acquisition, Z.L. All authors have read and agreed to the published version of the manuscript.
Funding
This work has been supported by the Basic Scientific Research Operating Expenses of Heilongjiang Provincial Universities and Colleges of China (No. 2024-KYYWF-1093).
Data Availability Statement
The original contributions presented in this study are included in the article. Further inquiries can be directed to the corresponding author.
Conflicts of Interest
The authors declare no conflicts of interest.
References
- Pan, Z.; Connell, L.D. Modelling permeability for coal reservoirs: A review of analytical models and testing data. Int. J. Coal Geol. 2012, 92, 1–44. [Google Scholar] [CrossRef] [Scilit]
- Xue, S.; Zheng, C.; Kizil, M.; Jiang, B.; Wang, Z.; Tang, M.; Chen, Z. Coal permeability models for enhancing performance of clean gas drainage: A review. J. Pet. Sci. Eng. 2021, 199, 108283. [Google Scholar] [CrossRef] [Scilit]
- Lu, S.; Li, M.; Ma, Y.; Wang, S.; Zhao, W. Permeability changes in mining-damaged coal: A review of mathematical models. J. Nat. Gas Sci. Eng. 2022, 106, 104739. [Google Scholar] [CrossRef] [Scilit]
- Mitra, A.; Harpalani, S.; Liu, S. Laboratory measurement and modeling of coal permeability with continued methane production: Part 1—Laboratory results. Fuel 2012, 94, 110–116. [Google Scholar] [CrossRef] [Scilit]
- Palmer, I. Permeability changes in coal: Analytical modeling. Int. J. Coal Geol. 2009, 77, 119–126. [Google Scholar] [CrossRef] [Scilit]
- Zhu, Q.; Yang, Y.; Lu, X.; Liu, D.; Li, X.; Zhang, Q.; Cai, Y. Pore structure of coals by mercury intrusion, N2 adsorption and NMR: A comparative study. Appl. Sci. 2019, 9, 1680. [Google Scholar] [CrossRef] [Scilit]
- Qin, L.; Li, S.; Zhai, C.; Lin, H.; Zhao, P.; Yan, M.; Ding, Y.; Shi, Y. Joint analysis of pores in low, intermediate, and high rank coals using mercury intrusion, nitrogen adsorption, and nuclear magnetic resonance. Powder Technol. 2020, 362, 615–627. [Google Scholar] [CrossRef] [Scilit]
- Li, Z.; Liu, D.; Cai, Y.; Wang, Y.; Si, G. Evaluation of coal petrophysics incorporating fractal characteristics by mercury intrusion porosimetry and low-field NMR. Fuel 2020, 263, 116802. [Google Scholar] [CrossRef] [Scilit]
- Blunt, M.J.; Bijeljic, B.; Dong, H.; Gharbi, O.; Iglauer, S.; Mostaghimi, P.; Paluszny, A.; Pentland, C. Pore-scale imaging and modelling. Adv. Water Resour. 2013, 51, 197–216. [Google Scholar] [CrossRef] [Scilit]
- Dong, H.; Blunt, M.J. Pore-network extraction from micro-computerized-tomography images. Phys. Rev. E 2009, 80, 036307. [Google Scholar] [CrossRef] [Scilit]
- Saxena, N.; Hows, A.; Hofmann, R.; Alpak, F.O.; Dietderich, J.; Appel, M.; Freeman, J.; De Jong, H. Rock properties from micro-CT images: Digital rock transforms for resolution, pore volume, and field of view. Adv. Water Resour. 2019, 134, 103419. [Google Scholar] [CrossRef] [Scilit]
- Wang, G.; Shen, J.; Liu, S.; Jiang, C.; Qin, X. Three-dimensional modeling and analysis of macro-pore structure of coal using combined X-ray CT imaging and fractal theory. Int. J. Rock Mech. Min. Sci. 2019, 123, 104082. [Google Scholar] [CrossRef] [Scilit]
- Shi, X.; Pan, J.; Pang, L.; Wang, R.; Li, G.; Tian, J.; Wang, H. 3D microfracture network and seepage characteristics of low-volatility bituminous coal based on nano-CT. J. Nat. Gas Sci. Eng. 2020, 83, 103556. [Google Scholar] [CrossRef] [Scilit]
- Hao, J.; Shu, L.; Huo, Z.; Fan, Y.; Wu, S.; Li, Y.; Guo, X. Quantitative characterization of pore-fracture structure of medium and high-rank coal based on micro-CT technology. Int. J. Coal Prep. Util. 2024, 44, 358–375. [Google Scholar] [CrossRef] [Scilit]
- Wang, G.; Chen, X.; Wang, S.; Chen, H. Influence of fracture connectivity and shape on water seepage of low-rank coal based on CT 3D reconstruction. J. Nat. Gas Sci. Eng. 2022, 102, 104584. [Google Scholar] [CrossRef] [Scilit]
- Zhang, W.; Zhou, S.; Wang, S.; Liu, D.; Pan, Z.; Yan, D. Digital rock characterization and CO2 flow simulation of high-volatile bituminous coal: An application to carbon geosequestration. Int. J. Coal Geol. 2023, 280, 104389. [Google Scholar] [CrossRef] [Scilit]
- Al-Raoush, R.; Papadopoulos, A. Representative elementary volume analysis of porous media using X-ray computed tomography. Powder Technol. 2010, 200, 69–77. [Google Scholar] [CrossRef] [Scilit]
- Ozelim, L.C.S.M.; Cavalcante, A.L.B. Representative elementary volume determination for permeability and porosity using numerical three-dimensional experiments in microtomography data. Int. J. Geomech. 2018, 18, 04017154. [Google Scholar] [CrossRef] [Scilit]
- Yu, B.; Li, J. Some fractal characters of porous media. Fractals 2001, 9, 365–372. [Google Scholar] [CrossRef] [Scilit]
- Yu, B.; Cheng, P. A fractal permeability model for bi-dispersed porous media. Int. J. Heat Mass Transf. 2002, 45, 2983–2993. [Google Scholar] [CrossRef] [Scilit]
- Yun, M.; Yu, B.; Xu, P.; Wu, J. Geometrical models for tortuosity of streamlines in three-dimensional porous media. Can. J. Chem. Eng. 2006, 84, 301–309. [Google Scholar] [CrossRef] [Scilit]
- Miao, T.; Yang, S.; Long, Z.; Yu, B. Fractal analysis of permeability of dual-porosity media embedded with random fractures. Int. J. Heat Mass Transf. 2015, 88, 814–821. [Google Scholar] [CrossRef] [Scilit]
- Zhao, Z.; Ni, X.; Cao, Y.; Shi, Y. Application of fractal theory to predict the coal permeability of multi-scale pores and fractures. Energy Rep. 2021, 7, 10–18. [Google Scholar] [CrossRef] [Scilit]
- Rezaeyan, A.; Pipich, V.; Ma, J.; Leu, L.; Seemann, T.; Rother, G.; Barnsley, L.C.; Busch, A. Predicting fluid flow regime, permeability, and diffusivity in mudrocks from multiscale pore characterisation. Transp. Porous Media 2022, 141, 201–229. [Google Scholar] [CrossRef] [Scilit]
- Luo, Y.; Xia, B.; Li, H.; Hu, H.; Wu, M.; Ji, K. Fractal permeability model for dual-porosity media embedded with natural tortuous fractures. Fuel 2021, 295, 120610. [Google Scholar] [CrossRef] [Scilit]
- Wang, B.; Li, B.; Li, J.; Gao, Z.; Xu, J.; Ren, C.; Zhang, Y. Measurement and modeling of coal adsorption-permeability based on the fractal method. J. Nat. Gas Sci. Eng. 2021, 88, 103824. [Google Scholar] [CrossRef] [Scilit]
- Song, L.; Gu, Y.; Zhang, L.; Wang, X. A novel permeability prediction model for deep coal via NMR and fractal theory. Mathematics 2023, 11, 118. [Google Scholar] [CrossRef] [Scilit]
- Tian, J.; Liu, J.; Elsworth, D.; Leong, Y.K.; Li, W. An effective stress-dependent dual-fractal permeability model for coal considering multiple flow mechanisms. Fuel 2023, 334, 126800. [Google Scholar] [CrossRef] [Scilit]
- Duan, S.; Li, B.; Gao, Z.; Li, J.; Song, H.; Ding, Y. Fractal apparent permeability model for coal under the coupling actions of stress and water. Energy Fuels 2023, 37, 4996–5012. [Google Scholar] [CrossRef] [Scilit]
- Vasilenko, T.A.; Kirillov, A.; Islamov, A.K.; Doroshkevich, A.S.; Łudzik, K.; Chudoba, D.M.; Mita, C. Permeability of a coal seam with respect to fractal features of pore space of fossil coals. Fuel 2022, 329, 125113. [Google Scholar] [CrossRef] [Scilit]
- Zou, Q.; Chen, Z.; Zhan, J.; Chen, C.; Gao, S.; Kong, F.; Xia, X. Morphological evolution and flow conduction characteristics of fracture channels in fractured sandstone under cyclic loading and unloading. Int. J. Min. Sci. Technol. 2023, 33, 1527–1540. [Google Scholar] [CrossRef] [Scilit]
- Li, Y.; Zhai, C.; Sun, Y.; Xu, J.; Yu, X.; Huang, T. Characterizing water vapor adsorption on coal by nuclear magnetic resonance: Influence of coal pore structure and surface properties. Energy 2023, 282, 128420. [Google Scholar] [CrossRef] [Scilit]
- Dai, J.; Li, W.; Zhang, M. A three-dimensional fractal permeability model for granular porous media incorporating pore roughness. J. Contam. Hydrol. 2026, 279, 104921. [Google Scholar] [CrossRef] [Scilit]

Disclaimer/Publisher’s Note: The statements, opinions and data contained in all publications are solely those of the individual author(s) and contributor(s) and not of MDPI and/or the editor(s). MDPI and/or the editor(s) disclaim responsibility for any injury to people or property resulting from any ideas, methods, instructions or products referred to in the content. |
© 2026 by the authors. Licensee MDPI, Basel, Switzerland. This article is an open access article distributed under the terms and conditions of the Creative Commons Attribution (CC BY) license.