


Abstract
Sodium bentonite geosynthetic clay liners (NaB GCLs) rely on the hydration-induced swelling of bentonite to achieve low hydraulic conductivity. However, the pore scale evolution linking nonuniform granule swelling to changes in intergranular flow path remains insufficiently understood. In this study, an idealized two-dimensional multiphysics finite element model was developed to investigate the coupled evolution of bentonite hydration, granule swelling and deformation, intergranular pore structure, and fluid flow. An effective moisture concentration diffusion field was coupled with hygroscopic swelling, solid deformation, fluid–structure interaction, deformation domain treatment, and laminar flow to represent the progressive hydration and swelling process. The simulations showed pronounced spatially nonuniform swelling, with the domain-averaged particle area swelling ratio increasing from 1.85% to 22.79% across the selected states. During this process, the areal porosity decreased from 0.63 to 0.55, whereas the hydraulic conductivity decreased from 3.46 × 10⁻⁵ to 2.11 × 10⁻⁷ m/s, corresponding to an approximately 164-fold reduction. The hydraulic response was strongly nonlinear relative to the reduction in total pore area. In particular, the minimum connected pore throat width decreased from approximately 3.37 to 0.45 μm between the selected 33% and 44% swelling states, accompanied by substantial flow path constriction and redistribution. These results indicate that localized pore throat narrowing, pore connectivity, and flow path tortuosity can exert a stronger influence on hydraulic response than bulk porosity alone. The developed model provides a mechanistic interpretation of the coupling between bentonite swelling, pore structure evolution, and hydraulic response within an idealized two-dimensional granular system rather than a direct quantitative prediction of real GCL performance.
1. Introduction
Geosynthetic clay liners (GCLs) have been widely used in waste containment facilities due to their low hydraulic conductivity to water, small thickness, and ease of installation [1,2,3,4,5,6]. Conventional sodium bentonite (NaB) GCLs typically consist of a thin layer of bentonite granules confined between two geotextiles and reinforced by needlepunching, with a total thickness generally less than 10 mm. Despite their small thickness, hydrated NaB GCLs can exhibit hydraulic conductivities on the order of 2 × 10⁻¹¹ m/s, allowing them to provide hydraulic barrier performance comparable to or greater than much thicker compacted clay liners (CCLs) [5,6,7,8,9].
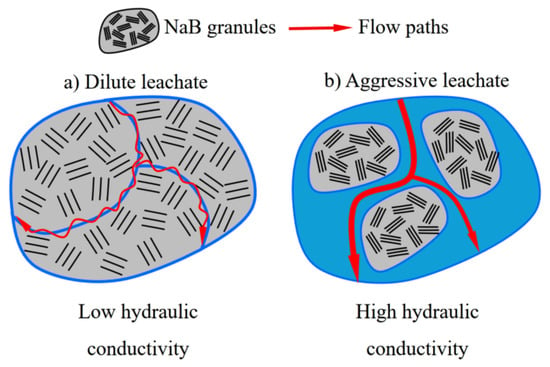
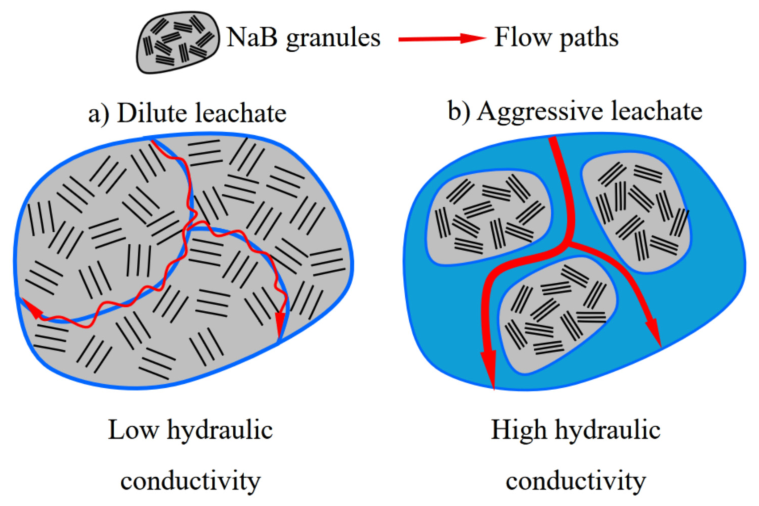
The low hydraulic conductivity of NaB GCLs is the key for the successful application of GCLs. The mechanism for NaB GCLs to achieve low hydraulic conductivity has been reported in the literature and supported with experimental data and field observation [10,11,12,13,14,15,16,17,18,19,20]. As shown in Figure 1a (modified from Benson et al. [21]), when bentonite granules in GCLs are hydrated with moisture from subgrade or with a waste leachate directly, the bentonite granules adsorb the moisture and generate swelling. The swelling of bentonite granules compresses the pore spaces between bentonite granules, narrows the flow paths for the waste leachate, and achieves low hydraulic conductivity [22,23,24,25,26,27,28,29,30,31,32,33,34]. When the swelling of the bentonite granules is suppressed by the permeant liquid, as shown in Figure 1b, the intergranule pores remain, resulting in open and connected flow paths for the permeant liquid and high hydraulic conductivity. Although this general mechanism is well established, the pore scale evolution linking progressive granule hydration and swelling to changes in the hydraulically connected pore network remains difficult to observe directly.
Figure 1.
Illustration of the swelling controlled hydraulic conductivity of sodium bentonite GCLs, with (a) for promoted swelling and (b) for suppressed swelling.
Experimental studies have demonstrated correlations between bulk bentonite swelling and GCL hydraulic conductivity [10,11], but such measurements do not directly resolve the spatially nonuniform swelling of individual granules or the associated evolution of intergranular flow paths. Previous numerical studies by Hou et al. [12,13,35] investigated the effects of bentonite granule size, swelling, and intergranular pore dimensions on GCL hydraulic behavior and demonstrated the importance of pore constriction in achieving low hydraulic conductivity. However, the progressive sequence from nonuniform hydration to differential granule swelling, evolving pore geometry, and the redistribution of hydraulically active flow paths has not been quantitatively characterized in sufficient detail. In particular, changes in total pore space alone may not fully describe the hydraulic response because locally controlling pore throats, pore connectivity, and flow path tortuosity can evolve differently as swelling progresses. A quantitative description combining these pore structure characteristics with the corresponding hydraulic response is therefore needed to better interpret the particle scale mechanism by which bentonite swelling modifies GCL behavior.
In this study, an idealized two-dimensional multiphysics finite element model was developed to examine the coupled evolution of bentonite hydration, granule swelling and deformation, intergranular pore geometry, and fluid flow. The framework couples an effective moisture concentration diffusion field with concentration-dependent hygroscopic swelling, solid deformation, fluid–structure interaction, deforming domain treatment, and laminar flow through the evolving intergranular pore space. The objectives are to: (1) characterize the spatially nonuniform swelling of bentonite granules during progressive hydration; (2) quantify the accompanying evolution of the intergranular pore structure using the domain-averaged particle area swelling ratio, areal porosity, minimum connected pore throat width, and flow path tortuosity; and (3) relate these structural changes to flow path redistribution and the calculated hydraulic response. The study is intended to provide a mechanistic interpretation of the swelling–pore structure–hydraulic response relationship within an idealized two-dimensional granular system rather than a direct quantitative prediction of the hydraulic conductivity of real GCLs.
2. Theory and Mathematical Models
2.1. Moisture Transport and Hygroscopic Swelling
The hydration-induced swelling of bentonite granules was described by coupling moisture transport with a water-dependent hygroscopic swelling relation. An effective moisture concentration, c (mol/m3), was used as the transported variable. The transient concentration field was governed by diffusion:
where t is time and Dc is the effective diffusion coefficient.
The transported variable c represents an effective moisture concentration referenced to the initial air-dried state and should not be interpreted directly as gravimetric water content. In the concentration-based hygroscopic swelling formulation used in COMSOL Multiphysics 5.4, the local swelling deformation is determined from the calculated concentration field using the hygroscopic swelling coefficient βh, the molar mass of water Mm, and the strain-free reference concentration cref.
To relate this concentration-based formulation to the gravimetric water content description used for physical interpretation and comparison with experimental swelling data, an equivalent gravimetric water content, wg (kg/kg), was defined as
The linear relationship between volumetric strain and water content/fluid concentration due to hygroscopic swelling has been widely accepted and used in practice [36,37,38,39,40,41,42]. The corresponding water content-based swelling relation is expressed as
where εv is volumetric swelling strain used in the constitutive representation and Mm is the molar mass of water. The parameters used in the present study were βh = 7 m3/kg, β = 107 mol/kg, and cref = 0 mol/m3.
εv = βMm(wg − w0)
With these definitions, Equations (2) and (3) provide an equivalent gravimetric water content representation of the concentration-based hygroscopic swelling formulation.
Importantly, the numerical implementation does not sequentially solve c, convert it into an independent wg field, and then impose wg on the solid mechanics model. The Transport of Diluted Species interface directly solves the spatially and temporally varying effective moisture concentration field. This calculated concentration field is supplied directly to the hygroscopic swelling formulation, which determines the local swelling deformation and transfers it to the solid mechanics calculation. The equivalent gravimetric water content calculated from Equation (2) is therefore a derived quantity used for physical interpretation and comparison with water content-based swelling relations rather than an independently solved field.
Consequently, swelling was not prescribed as a predefined uniform expansion of the bentonite granules. Its spatial distribution evolved from the calculated transient concentration field. The adopted formulation is a simplified constitutive representation of hydration-induced swelling; detailed physicochemical processes such as ion exchange, osmotic effects, mineral-specific adsorption, and chemo-mechanical interactions are not explicitly represented.
2.2. Intergranular Fluid Flow
Fluid flow between the bentonite granules within a GCL was calculated based on the pore size between bentonite granules, the characteristics of fluid in the pore space, and the applied pressure through boundaries using the mass conservation equation and momentum conservation equation:
where ρ is the density of the fluid (kg/m3), t is time (s), u is the velocity vector (m/s), μ is viscosity (Pa·s) p is pressure (Pa) and f is force (N/m3). Therefore, in the simulation, the hydraulic conductivity k can be calculated based on Darcy’s law:
where v is the average of the velocity of the water flow direction at the outlet of the model and i is the hydraulic gradient, which can be calculated as:
where Δh is the total head difference (m); L is the height of the soil sample (m); p is the pressure difference (Pa); ρw is the density of water (kg/m3); and g is gravitational acceleration (m/s2).
The selection of fluid physics requires the selection of a suitable flow field according to the size of the Reynolds number. The maximum Reynolds number can be calculated using Equation (9):
where Re is the Reynolds number; ρ is fluid density (kg/m3); v is the average fluid velocity (m/s); dc is the characteristic pore dimension (m), taken here as the minimum connected pore-throat width; μ is the dynamic viscosity of the fluid (Pa·s). To maintain consistency with the length and velocity scales of the numerical model, both quantities were obtained from the simulated pore system rather than from laboratory-scale flow measurements. For the initial state, the outlet averaged flow velocity was v = 2.23 × 10⁻⁵ m/s, and the characteristic pore dimension was defined as the minimum connected pore throat width, dc = 7.286 × 10⁻⁶ m. Using ρ = 1000 kg/m3 and μ = 1.0 × 10⁻³ Pa·s gives Re = 1.62 × 10⁻⁴ ≪ 1. The initial state provides the largest representative velocity and connected pore throat width among the investigated states; therefore, the Reynolds number remains of the same or a smaller order as swelling progresses. This confirms that viscous effects dominate the intergranular flow and that the simulated flow lies in the very low Reynolds number, creeping/Stokes flow regime. Accordingly, the COMSOL Laminar Flow interface was used to model fluid flow through the evolving intergranular pore space.
3. Numerical Simulation
3.1. Idealized Computational Domain and Multiphysics Coupling
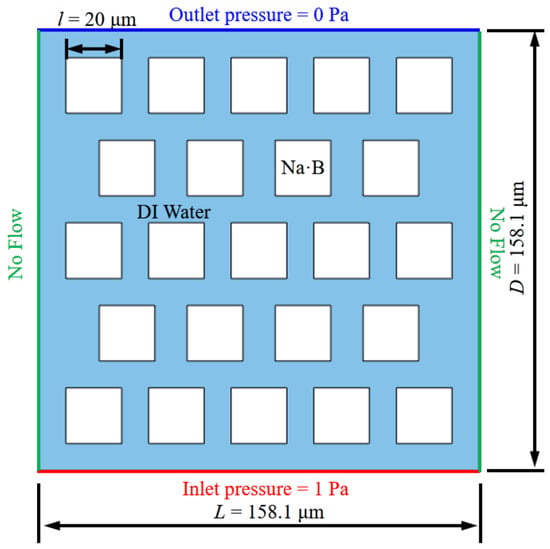
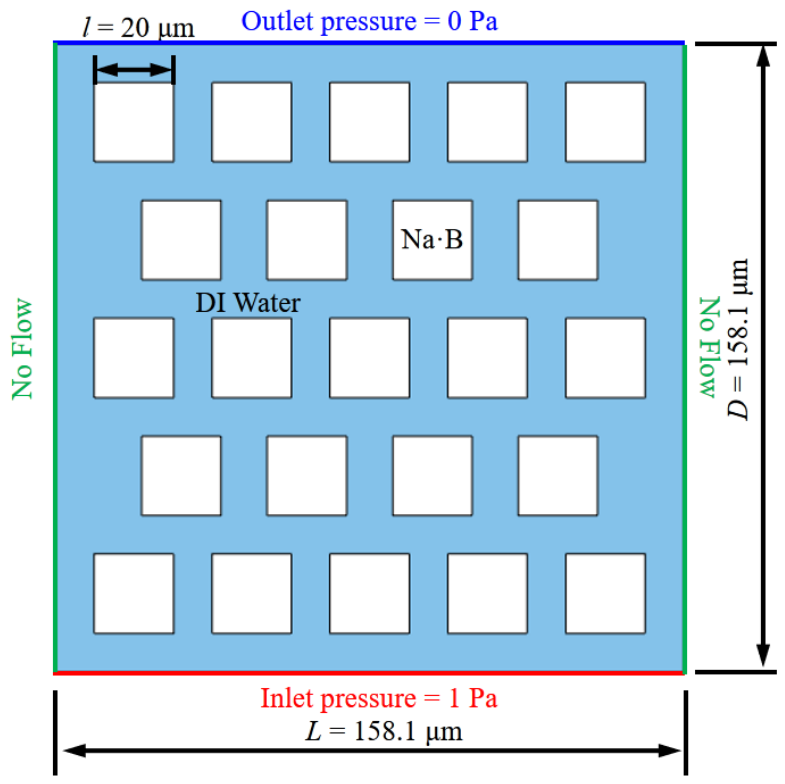
A commercial finite element tool was used to solve the partial differential equations that couple the swelling of bentonite granules and fluid flow within the intergranular pores of a cross-section of GCLs [43]. A conceptualized domain, as shown in Figure 2, was created in COMSOL following the methods described in Hou et al. [12,13]. The domain is L = 158.1 μm long and D = 158.1 μm wide. Among them, sodium bentonite granules (the white area in Figure 2) side length l = 20 μm, and bentonite particles are staggered. The blue area represents intergranular pores for fluid flow (i.e., seepage area) in GCL. No flow within the bentonite granules was simulated. The use of square granules and a regular arrangement is a deliberate simplification that permits the influence of swelling-induced pore constriction to be isolated.
Figure 2.
Idealized two-dimensional computational domain used to investigate bentonite swelling and intergranular flow.
The square particles and regular arrangement were adopted as geometric idealizations to isolate the effects of hydration-induced swelling and pore structure evolution. Therefore, the model does not directly reproduce the irregular particle shapes, particle size distribution, packing heterogeneity, or three-dimensional pore network of an actual GCL.
Hydration and swelling were simulated by coupling the transport of diluted species, hygroscopic swelling, and solid mechanics formulations. The transient moisture concentration field was first calculated and subsequently converted into local hygroscopic swelling strain.
Fluid flow through the intergranular pore space was modeled using the laminar flow interface. Fluid and solid domains were coupled through fluid–structure interaction (FSI), while changes in pore geometry caused by granule deformation were accommodated using the moving mesh (ALE) formulation. Consequently, the deformation of the granules directly altered the pore geometry and redistributed the intergranular fluid flow.
The bentonite granules were modeled as deformable isotropic linear elastic solids under a two-dimensional plane strain assumption. The center point of each granule was fixed to prevent unrestricted rigid body translation, while the remainder of the granule was allowed to deform.
No rotational displacement, prescribed rotation angle, or independent rotational degree of freedom was imposed. Therefore, any rotational-like pattern observed in the displacement field represents nonuniform deformation rather than independently modeled rigid particle rotation.
3.2. Initial and Boundary Conditions
The initial effective moisture concentration was set to c = 0 throughout the computational domain, corresponding to the initial air-dried gravimetric water content w0 = 0.10 kg/kg. An effective diffusion coefficient of Dc = 1.0 × 10⁻⁹ m2/s was used. Hydration was introduced from the lower boundary using fixed moisture concentration cint = 0.5 mol/m3 conditions. The calculated concentration field was supplied directly to the hygroscopic swelling formulation. Equation (2) was used only to derive the equivalent gravimetric water content wg for physical interpretation; wg was not solved or imposed as an independent field. The hygroscopic swelling parameters were β = 107 mol/kg, Mm = 0.018 kg/mol.
The boundary conditions of the model are shown in Figure 2. For the laminar flow calculation, the lower boundary of the numerical model was set as the fluid inlet, and the upper boundary was set as the fluid outlet to simulate a bottom-to-top flow, which is typical in laboratory experiments, to facilitate the saturation of the GCLs [21,23,44,45]. The left and right boundaries were closed no-flux walls. Since the hydraulic conductivity of GCLs is insensitive to the applied pressure and hydraulic gradient, both the inlet and outlet were set up for fully developed flow using average pressure conditions, with 1 Pa applied to the bottom and 0 Pa applied to the top. The relatively small pressure difference was selected because the purpose of the model is to compare the evolution of flow resistance as the intergranular geometry changes rather than to reproduce a particular laboratory hydraulic gradient.
3.3. Mesh and Mesh Independence Analysis
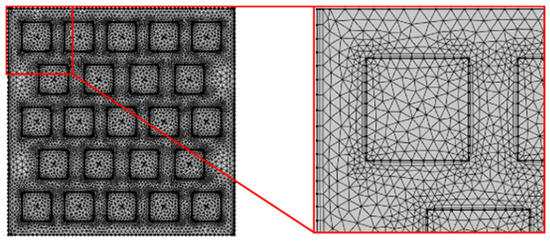
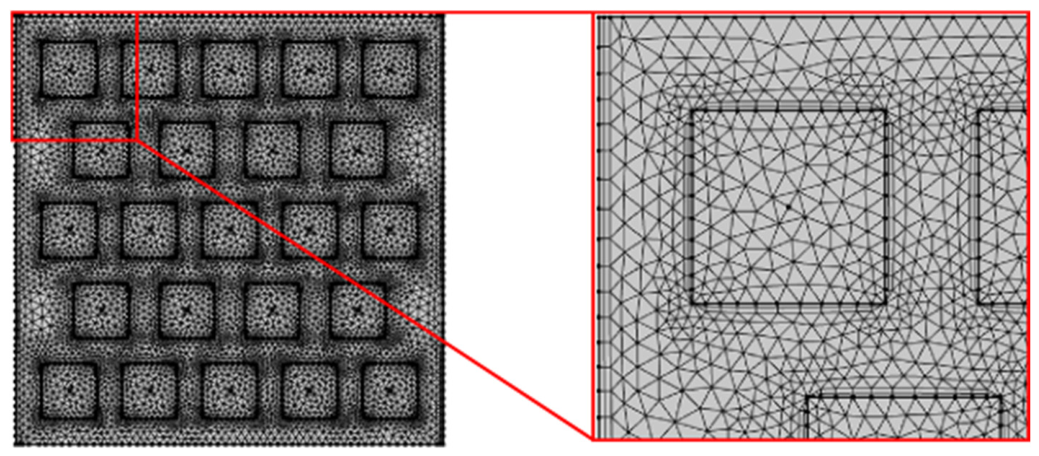
Triangle and quadrilateral mesh were used to simulate the coupling of laminar flow, solid mechanics, fluid–structure interaction, and moisture absorption expansion, as shown in Figure 3. The majority of meshes were triangles with the supplements of quadrilaterals for high precision and accuracy based on Zimmerman [46], Hou et al. [12,13], and Pu et al. [47].
Figure 3.
Finite element mesh used for the coupled multiphysics simulation.
Three mesh density levels, denoted M1, M2, and M3, were evaluated to examine the sensitivity of the calculated hydraulic response to mesh refinement (as shown in Table 1). Representative states corresponding to the selected 22%, 44%, and 55% swelling stages were used for comparison.
Table 1.
Mesh independence analysis at representative swelling states.
Increasing the mesh density from M2 to M3 changed the calculated hydraulic conductivity by approximately 0.66%, 0.40%, and 1.40% at the selected 22%, 44%, and 55% states, respectively. M2 was therefore adopted for the principal simulations as a compromise between numerical accuracy and computational cost.
The progressive deformation of the pore domain also reduced local mesh quality as granules approached one another. No explicit particle contact formulation was included. At the selected 55% state, the minimum geometric separation between neighboring granules remained positive, indicating that geometric overlap had not yet occurred. However, substantial localized ALE deformation was already present; simulations beyond this near-contact condition were therefore not interpreted quantitatively.
The coupled model was solved using a time-dependent study from 0 to 5 s. An implicit backward differentiation formula (BDF) with adaptive time stepping was used, with solutions recorded at 0.1 s intervals. The relative solver tolerance was set to 0.005.
3.4. Model Parameters
The principal parameters used in the coupled numerical model are summarized in Table 2. The parameters were grouped according to the physical processes represented in the model, including moisture transport, hygroscopic swelling, solid mechanics, and intergranular fluid flow.
Table 2.
Model parameters [35].
The effective diffusion coefficient was used to describe the spatial and temporal transport of moisture within the computational domain. The resulting local concentration field was coupled to the hygroscopic swelling formulation, in which the hygroscopic swelling coefficient, molar mass, and initial air-dried water content define the relationship between moisture uptake and the corresponding swelling strain. The calculated swelling strain was subsequently incorporated into the solid mechanics calculation to determine the deformation of the bentonite granules.
The mechanical response of the granules was characterized by their elastic and density properties, whereas the intergranular fluid behavior was defined by the fluid density and dynamic viscosity. These parameters were used consistently throughout the coupled simulations. The initial and boundary conditions associated with moisture transport and fluid flow are described separately in Section 3.2.
3.5. Quantitative Analysis
Because the present model is two-dimensional, granule swelling was quantified using the change in projected particle area rather than three-dimensional volumetric strain. For each granule,
where A0 and A are the initial and deformed projected areas, respectively.
Five representative simulation states were selected when the maximum particle area swelling ratio was approximately 11%, 22%, 33%, 44%, and 55%. These values are used to identify representative stages of progressive hydration and should not be interpreted as the average swelling of all granules.
To quantitatively characterize the evolution of the intergranular pore network, the areal porosity, minimum connected pore-throat width, and flow-path tortuosity were evaluated at each selected swelling state.
An inlet-to-outlet connected pore passage was defined as a continuous open pore region extending from the lower inlet boundary to the upper outlet boundary in the deformed geometry. Connectivity was identified by examining the deformed pore geometry together with the calculated fluid velocity field. Only pore passages that remained continuously open and contributed to inlet-to-outlet through flow were considered part of the connected pore network. Isolated pore regions, dead-end branches, and completely closed passages were excluded.
The minimum connected pore throat width, wmin,c, was determined directly from the deformed geometry in COMSOL. For the inlet-to-outlet connected pore network, the local pore throat width was measured as the shortest distance between opposing boundaries of neighboring bentonite granules, and the smallest of these distances was reported as wmin,c. If a previously controlling pore passage became completely closed, that passage was excluded because it no longer belonged to the inlet-to-outlet connected network, and wmin,c was reevaluated from the remaining connected passages.
The flow path tortuosity, , was defined as , where Lf is the actual length of the selected continuous flow path from the inlet to the outlet and L is the straight-line distance between the inlet and outlet boundaries. At each selected swelling state, the dominant inlet-to-outlet through-flow path was identified from the calculated velocity field and traced continuously from the inlet to the outlet. The length of this path was measured as Lf. Accordingly, the reported is used as a comparative descriptor of the representative through flow path rather than as a network-averaged tortuosity of all possible pore pathways.
4. Results and Discussion
4.1. Comparison with Published Swelling and Hydraulic Conductivity
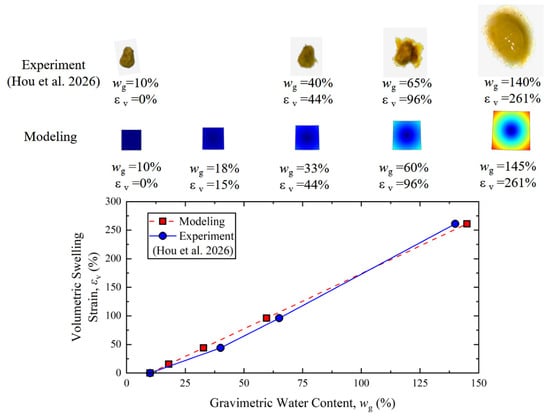
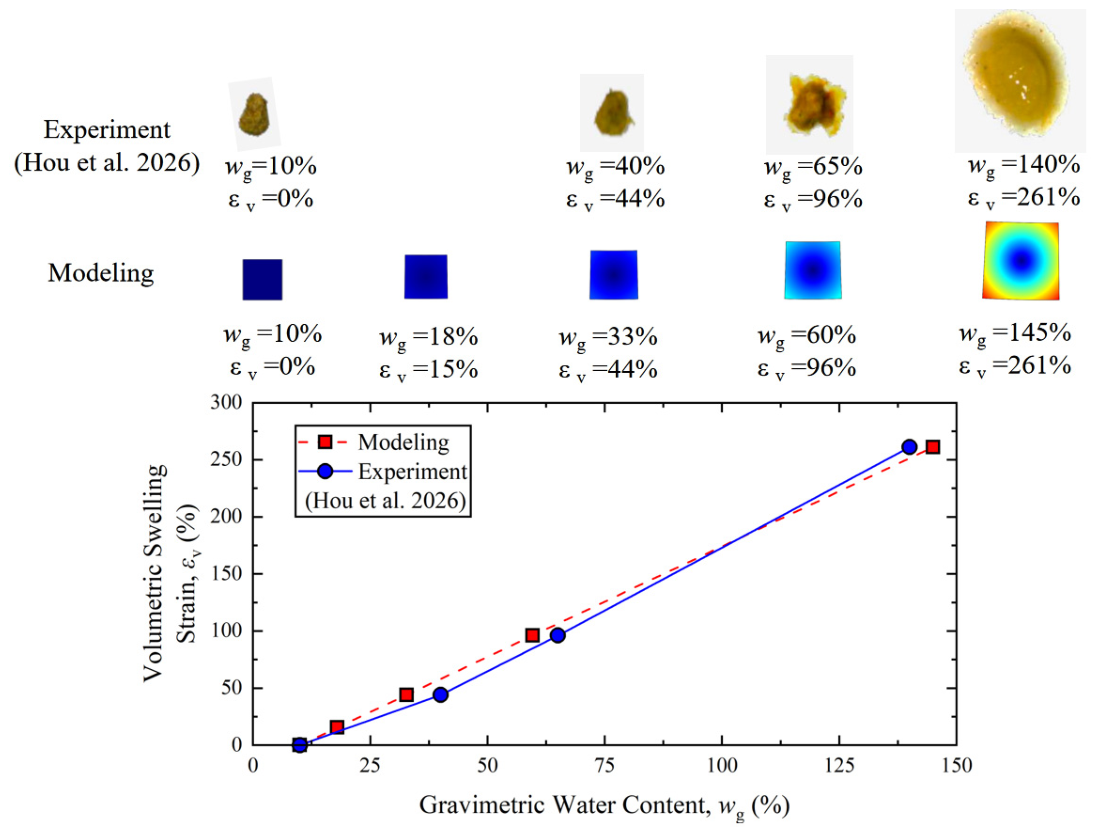
Figure 4 shows the calculated volumetric swelling strain of an idealized bentonite granule as a function of water content. The swelling strain increased with increasing water content according to the adopted constitutive relation. When the gravimetric water content reached approximately 145%, the corresponding volumetric swelling strain was approximately 261%.
Figure 4.
Relationship between water content and calculated volumetric swelling strain of an idealized bentonite granule, together with published single-granule swelling measurements reported by Hou et al. [48].
Published single-granule measurements reported by Hou et al. [48] are included for comparison. These experimental measurements were obtained by hydrating individual bentonite granules and recording their dimensional changes.
The comparison indicates that the magnitude of swelling generated using the adopted constitutive relationship is within the range of the reported single-granule observations. This comparison should not be regarded as an independent validation of the complete coupled model because Equations (2) and (3) directly govern the relationship between hydration and swelling in the simulation. Instead, it provides a consistency check on the swelling magnitude produced by the adopted constitutive formulation.
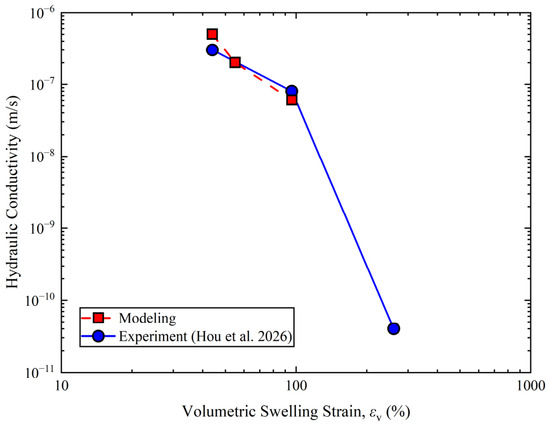
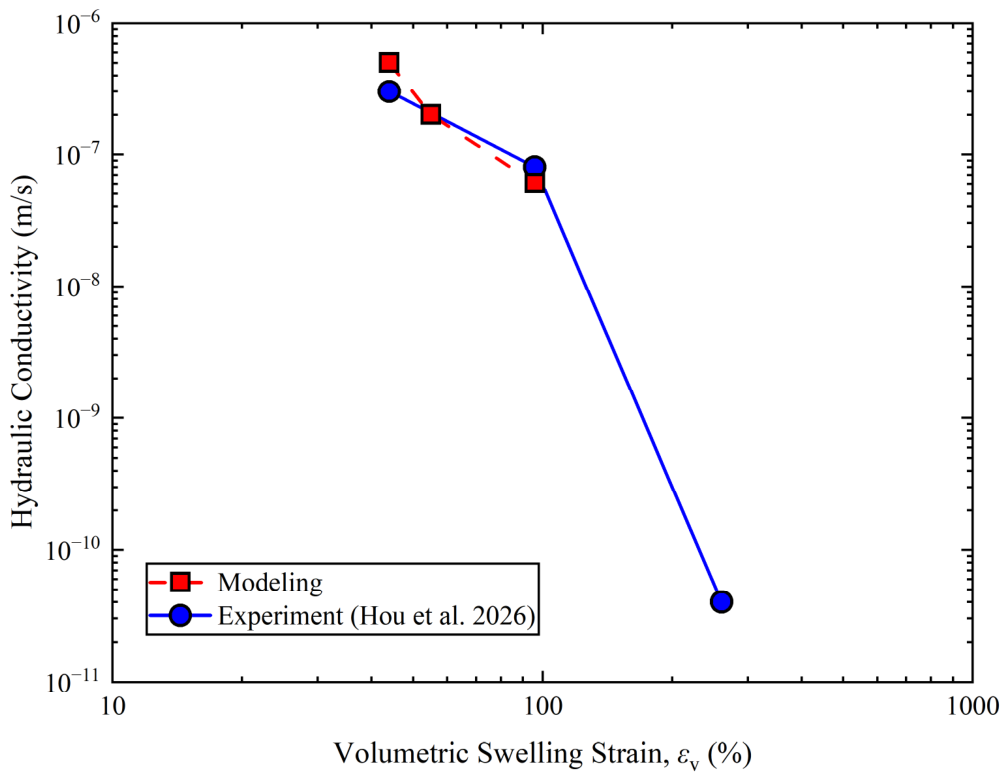
Figure 5 compares the calculated hydraulic conductivity with published observations for GCLs exhibiting different degrees of bentonite swelling. As granule swelling increases, the modeled intergranular pore space becomes progressively constricted, and the calculated hydraulic conductivity decreases substantially.
Figure 5.
Calculated hydraulic conductivity of GCL vs. the volumetric swelling strain, with experimental data from Hou et al. [48].
At a volumetric swelling strain of approximately 96%, corresponding to a gravimetric water content of approximately 60% in the adopted swelling relationship, the calculated hydraulic conductivity was approximately 6 × 10⁻⁸ m/s, which falls within the same order of magnitude as the hydraulic conductivity of GCL permeated with 100 mM calcium chloride solution as measured by Hou et al. [48], Jo et al. [10,14,15], and Kolstad et al. [11].
The numerical results reproduce the experimentally observed trend of decreasing hydraulic conductivity with increasing bentonite swelling. However, because the present model is based on an idealized two-dimensional geometry with regular square granules, numerical agreement with individual experimental values should not be interpreted as rigorous quantitative validation of the hydraulic conductivity of real GCLs.
The value of this comparison is therefore primarily mechanistic: both the numerical model and the experimental observations show that limited swelling is associated with relatively open flow pathways, whereas greater swelling is associated with substantially reduced flow capacity.
4.2. Spatially Nonuniform Hydration and Granule Swelling
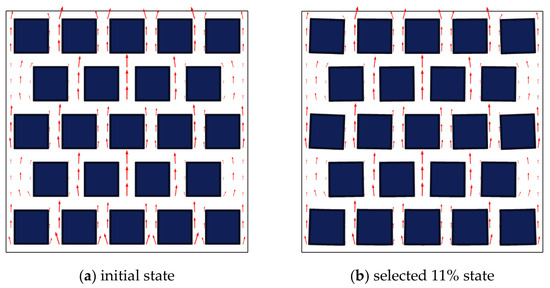
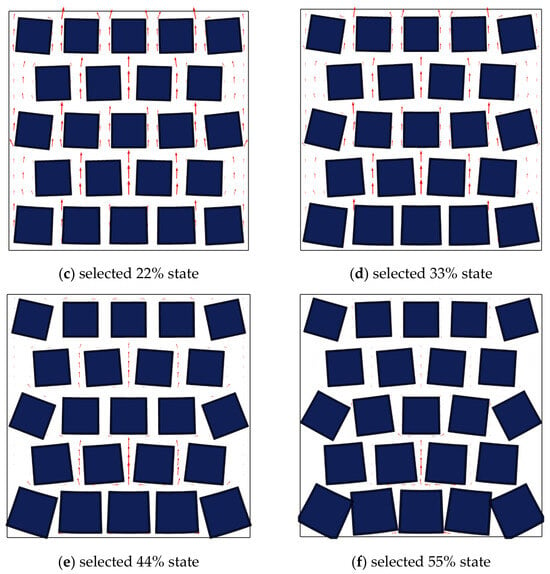
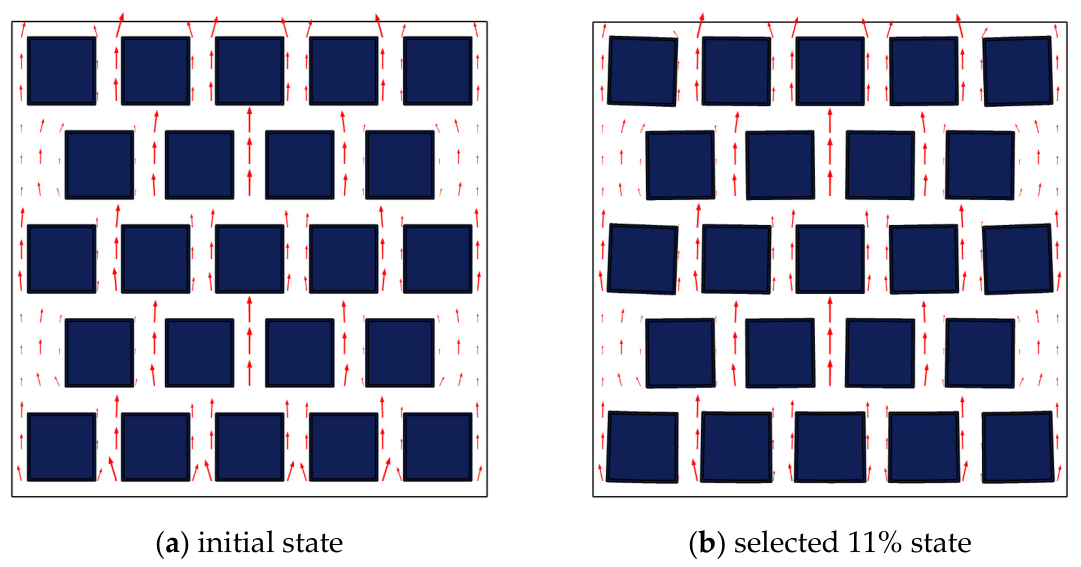
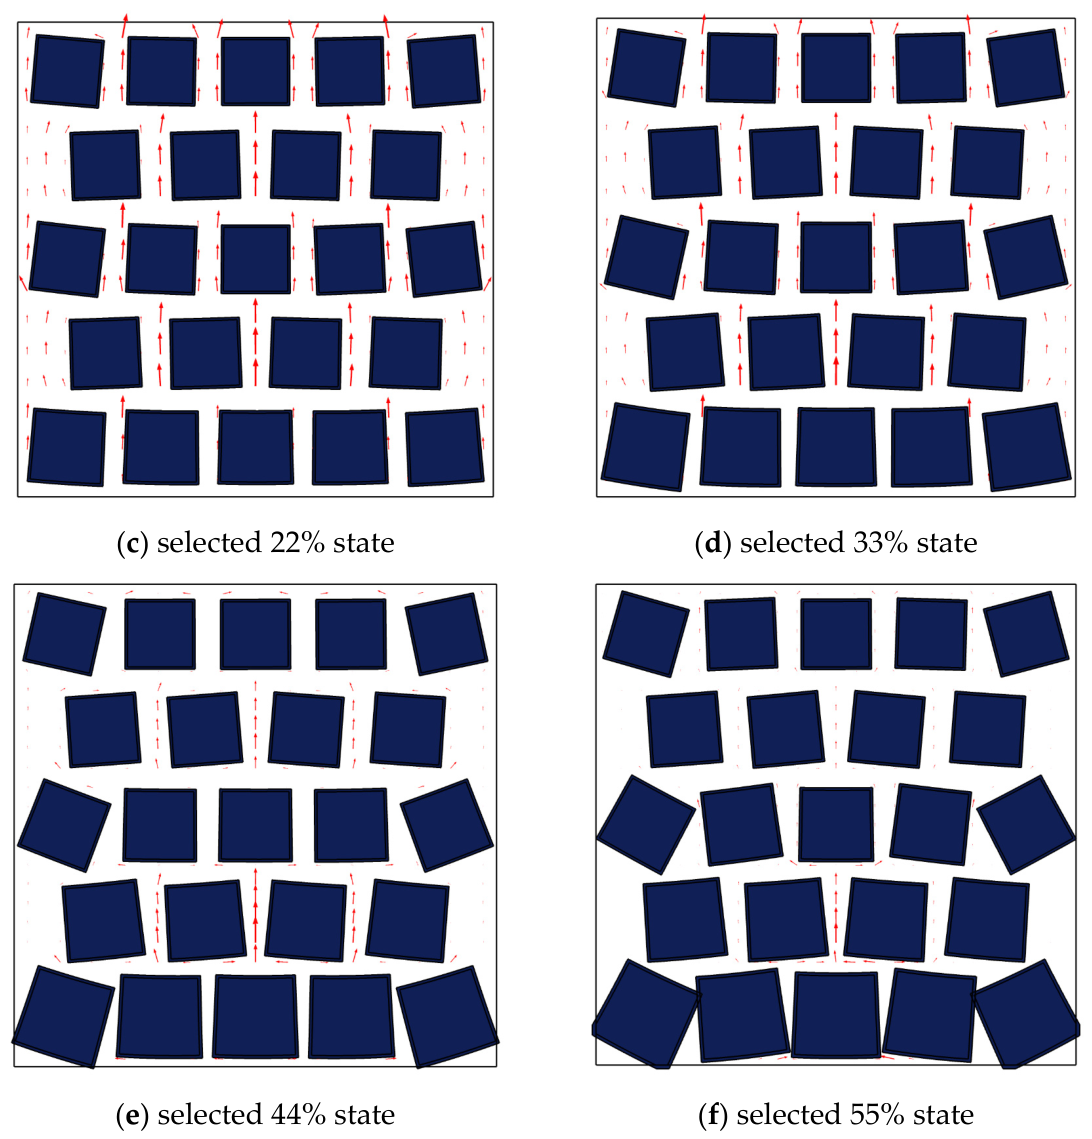
Figure 6 illustrates the progressive swelling of bentonite granules during hydration. The five representative snapshots are referred to as the selected swelling states of 11%, 22%, 33%, 44%, and 55%. These labels identify successive stages of the simulation and do not represent the spatially averaged swelling of all granules.
Figure 6.
Spatial evolution of bentonite granule swelling during hydration. The arrows indicate the fluid velocity vectors.
The projected area of each of the 23 granules was measured at each selected state to quantify the actual swelling of the two-dimensional granule assembly. Table 3 summarizes the resulting mean particle area swelling ratio and its standard deviation, together with the corresponding areal porosity, minimum connected pore throat width, flow path tortuosity, and hydraulic response. These quantities provide an integrated quantitative description of the progressive structural and hydraulic evolution of the modeled system.
Table 3.
Quantitative evolution of granule swelling, pore structure, and hydraulic response across the selected simulation states.
As shown in Table 3, the domain-averaged particle area swelling ratio increased progressively from 1.85% at the selected 11% state to 22.79% at the selected 55% state. At the same time, the standard deviation increased from 2.78 to 19.48 percentage points, demonstrating that spatial differences in swelling became progressively larger as hydration proceeded.
At the selected 11% state, the domain-averaged area swelling ratio remained below 2%, and most granules retained geometries close to their initial configuration. At the selected 22% and 33% states, swelling was more pronounced in granules closer to the lower concentration boundary, whereas upper granules remained less swollen. The spatial contrast became stronger at the selected 44% and 55% states. Thus, the model produces a strongly nonuniform hydration pattern rather than a uniform expansion of the granular assembly.
This nonuniformity is important because swelling does not reduce all intergranular pores uniformly. Greater deformation in locally hydrated regions preferentially constricts particular pore passages, whereas other regions remain more open. The hydraulic response therefore depends on both the overall amount of swelling and its spatial distribution.
4.3. Evolution of the Intergranular Flow Field
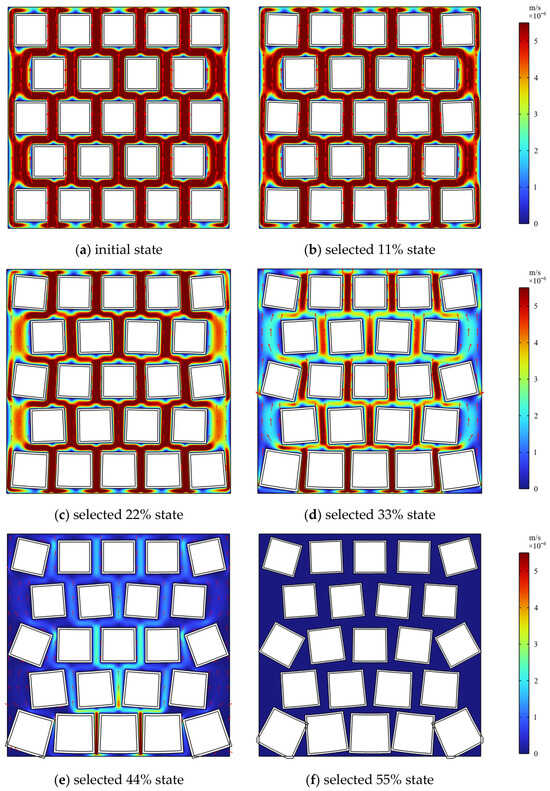
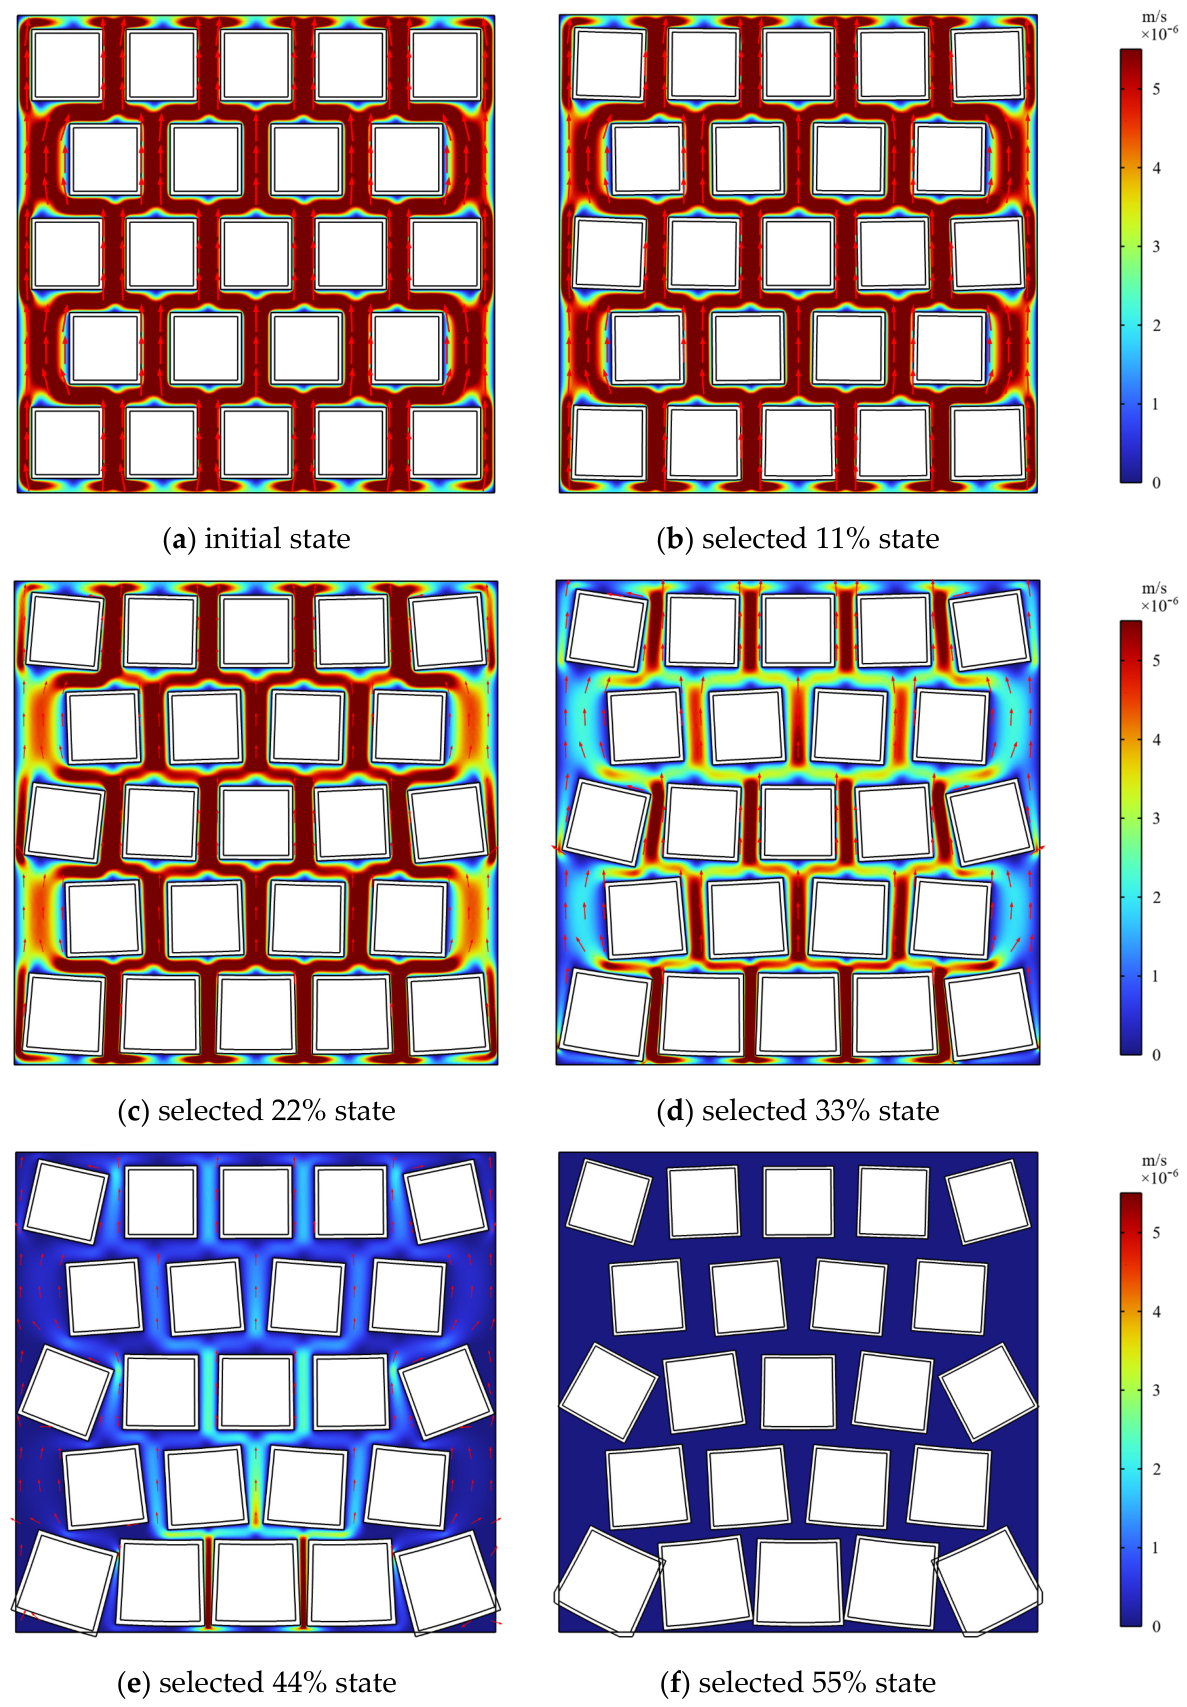
The progressive deformation of the bentonite granules altered the geometry of the intergranular flow domain and redistributed the fluid velocity field (Figure 7). At the initial reference state and selected 11% state, several continuous inlet-to-outlet pathways remained available, and the hydraulic conductivity changed only slightly from 3.46 × 10⁻⁵ to 3.41 × 10⁻⁵ m/s.
Figure 7.
Evolution of the intergranular fluid velocity field. The arrows indicate the fluid velocity vectors.
At the selected 22% state, local pore constriction became more evident, and the velocity field began to redistribute around narrowing passages, while hydraulic conductivity remained on the order of 10−5 m/s. At the selected 33% state, hydraulic conductivity decreased to 1.10 × 10⁻⁵ m/s, and flow became concentrated within fewer preferential passages.
The strongest hydraulic change in the dataset occurred between the selected 33% and 44% states, where hydraulic conductivity decreased from 1.10 × 10⁻⁵ to 5.03 × 10⁻⁷ m/s, a factor of approximately 21.9. At the selected 44% and 55% states, the velocity field became strongly localized as several intergranular passages were severely constricted or ceased to participate in the connected through flow network. Flow was consequently redistributed through the remaining connected pore system.
4.4. Quantitative Pore Structure Evolution and Hydraulic Response
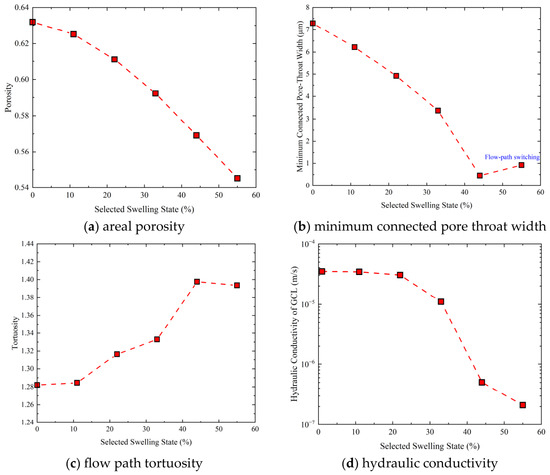
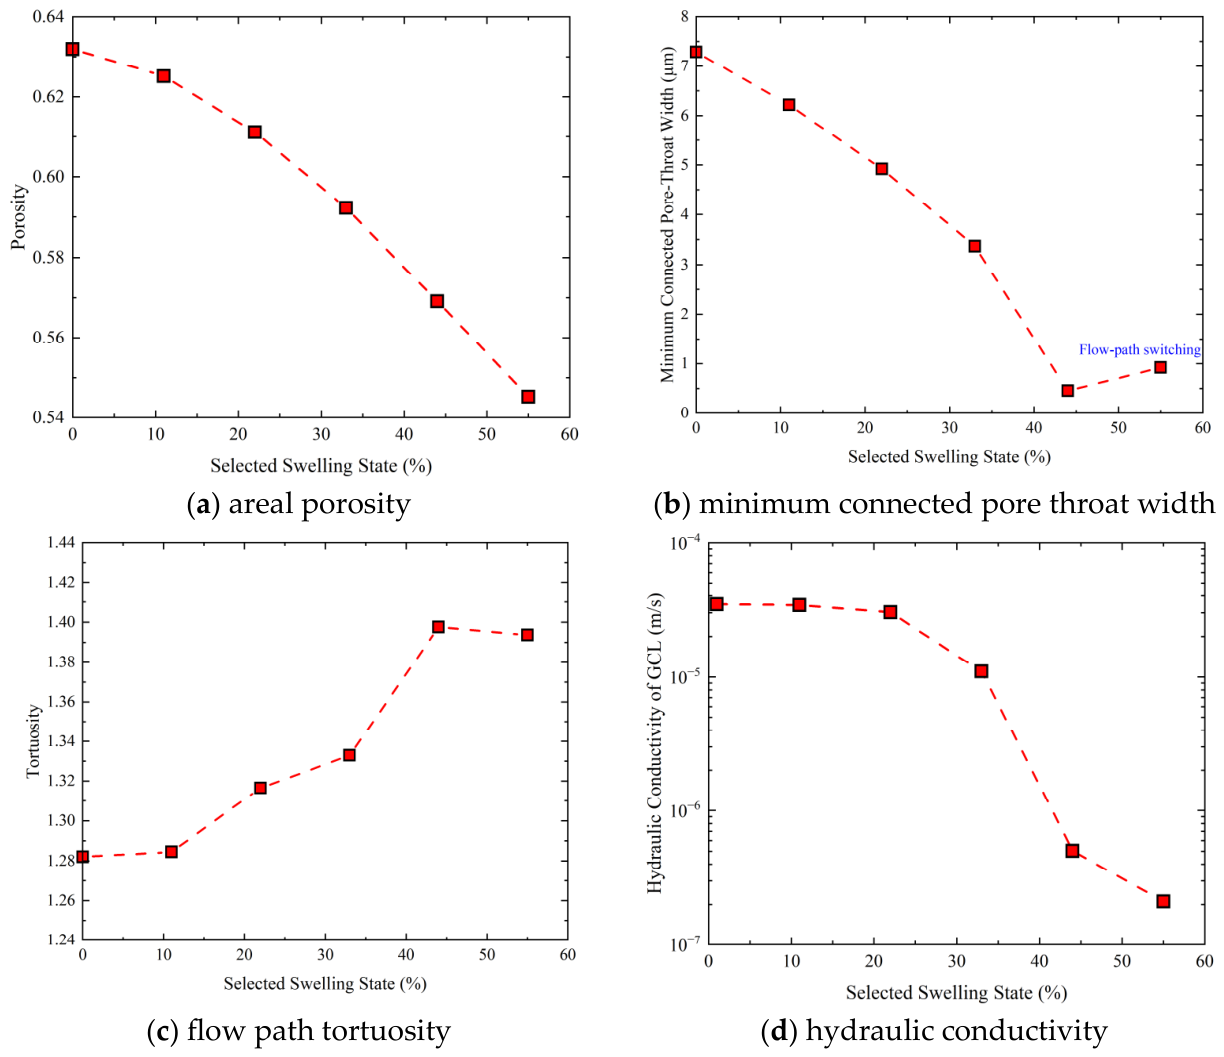
Figure 8 summarizes the evolution of areal porosity, minimum connected pore throat width, flow path tortuosity, and hydraulic conductivity.
Figure 8.
Evolution of pore structure characteristics and the hydraulic conductivity across the investigated swelling process.
Areal porosity decreased continuously from 0.63 in the initial reference state to 0.55 at the selected 55% state, corresponding to an overall decrease of approximately 12.7%. This reduction reflects the progressive occupation of the intergranular pore space by swelling bentonite granules. However, the hydraulic response was considerably more nonlinear than the change in total pore area.
For example, from the selected 33% to 44% state, areal porosity decreased only from 0.59 to 0.57, whereas hydraulic conductivity decreased from 1.10 × 10⁻⁵ to 5.03 × 10⁻⁷ m/s. This contrast indicates that total porosity alone cannot account for the large change in hydraulic response.
The minimum connected pore throat width decreased from 7.29 μm in the initial reference state to 6.22, 4.92, and 3.37 μm at the selected 11%, 22%, and 33% states, respectively. The strongest constriction occurred between the selected 33% and 44% states, when the minimum connected pore throat width decreased from 3.37 to 0.45 μm, a reduction of approximately 86.6%. This pronounced narrowing coincided with the strongest decrease in hydraulic response.
At the selected 55% state, the minimum connected pore throat width increased to approximately 0.920 μm. This apparent increase does not indicate pore reopening. The passage that controlled the minimum connected throat at the selected 44% state no longer formed part of an inlet-to-outlet connected flow path at the selected 55% state. The hydraulic bottleneck therefore shifted to an adjacent remaining connected passage. This stage is best interpreted as a transition from severe pore throat constriction to the loss of a previously active path and subsequent flow path switching.
Flow path tortuosity increased from 1.282 in the initial reference state to 1.398 at the selected 44% state, indicating that fluid was progressively forced to follow more indirect routes around narrowing passages. At the selected 55% state, tortuosity decreased slightly to 1.394. This small decrease should not be interpreted as a recovery of the original pore network; rather, it reflects a redistribution of the hydraulically active connected path after the previously controlling passage ceased to carry through flow.
Taken together, the four quantities show that the hydraulic response is not governed by a single pore structure parameter. Instead, it reflects the combined effects of pore area reduction, localized pore throat constriction, flow path tortuosity, and the loss or redistribution of connected flow pathways.
4.5. Relationship Between Areal Porosity and Hydraulic Response
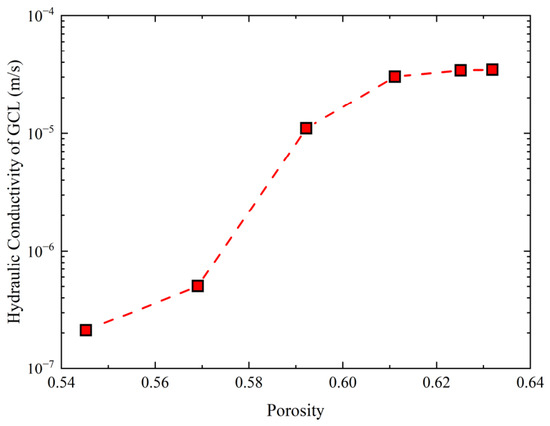
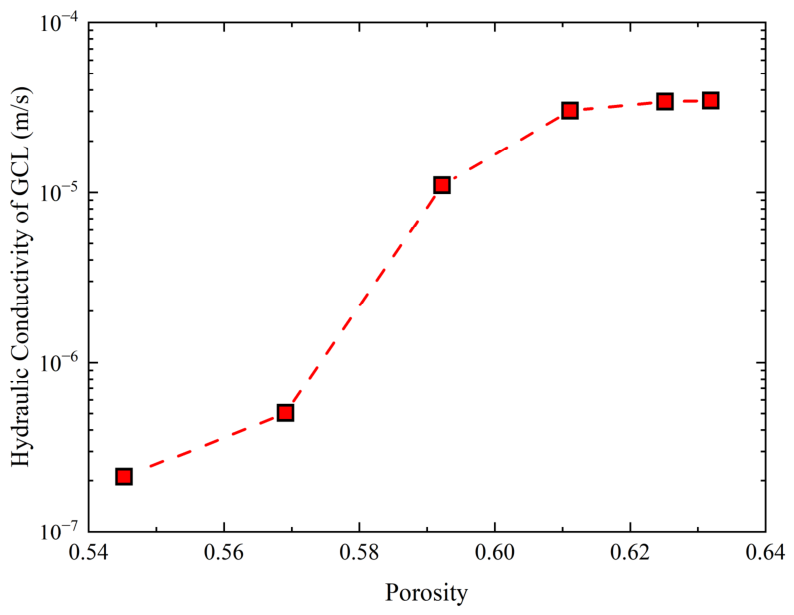
Figure 9 illustrates the direct relationship between areal porosity and hydraulic conductivity. Across the investigated process, areal porosity decreased from 0.63 to 0.55, while hydraulic conductivity decreased from 3.46 × 10⁻⁵ to 2.11 × 10⁻⁷ m/s.
Figure 9.
Relationship between the hydraulic conductivity and areal porosity across the investigated swelling states.
The relationship is clearly nonlinear. At relatively high porosities, reductions in total pore area produced only limited changes in the hydraulic response. In contrast, as areal porosity decreased to approximately 0.59–0.57, the hydraulic response changed sharply. The accompanying pore throat and tortuosity results indicate that this nonlinearity is associated with the localized constriction of hydraulically critical passages and the redistribution of the connected pore network.
Figure 9 should not be interpreted as establishing a general constitutive relationship between porosity and hydraulic conductivity for real GCLs. Rather, it illustrates within the present idealized two-dimensional model that the hydraulic response depends on both total pore space reduction and the geometry and connectivity of the hydraulically active pore network.
5. Practical Implications and Limitations
5.1. Practical Implications
The present numerical model provides an idealized framework for examining how the hydration-induced swelling of bentonite granules alters the intergranular pore network and, consequently, the hydraulic response of a GCL. Rather than treating swelling only as a bulk material property, the simulations illustrate the evolution of pore geometry at the granule scale and show how spatially nonuniform swelling can progressively reorganize the hydraulically active flow network.
The results indicate that the hydraulic response cannot be explained by the decrease in total pore area alone. The accompanying evolution of the minimum connected pore throat width and flow path tortuosity shows that localized pore constriction, the loss of hydraulically important passages, and the redistribution of connected flow pathways can exert a disproportionately large influence on through flow.
This distinction is relevant to the interpretation of granular bentonite barriers. Two pore structures with similar total porosity may exhibit substantially different hydraulic responses if their pore throat dimensions and connectivity differ. Pore network characteristics such as local constriction, connectivity, and tortuosity should therefore be considered together with bulk porosity when interpreting the effects of bentonite hydration.
The present model is intended to provide a mechanistic interpretation rather than a direct design relationship or a quantitative predictive tool for field-scale GCL performance.
5.2. Model Limitations
First, the computational domain is two-dimensional, whereas the pore network of an actual GCL is inherently three-dimensional. Flow path connectivity, pore throat geometry, and tortuosity in a three-dimensional granular system may differ substantially from those represented by a two-dimensional cross-section.
Second, bentonite granules are represented as idealized square particles with an initially regular staggered arrangement. Actual bentonite granules exhibit irregular shapes, broad particle size distributions, surface roughness, and heterogeneous packing configurations.
Third, the center of each idealized granule is fixed, and no explicit particle contact formulation is included. The simulations therefore do not reproduce unrestricted translation, rearrangement, interparticle friction, or contact force evolution.
Fourth, hydration is represented through a single effective moisture concentration diffusion field coupled to an isotropic linear hygroscopic swelling relation. No explicit solid–fluid partition coefficient, ion exchange, diffuse double layer interaction, osmotic effect, mineral specific adsorption, or permeant-dependent swelling chemistry is modeled.
Fifth, the simulations use a single idealized geometry and one set of material and transport parameters. No systematic parameter sensitivity analysis was performed for Dc, β, E, the fixed center constraint, or the initial geometry. Consequently, the numerical magnitudes and the locations of the selected transition states are configuration-specific and should not be interpreted as universal thresholds for real GCLs.
Sixth, strong local ALE distortion develops near the selected 55% state, and no explicit particle contact algorithm is available. The quantitative interpretation is therefore restricted to the investigated pre-contact/near-closure range represented here.
Finally, the manuscript does not claim an independent validation of the complete multiphysics model. Figure 4 and Figure 5 are retained only as contextual comparisons with published observations. Figure 4 concerns the approximate behavior of a simplified swelling relation and does not validate the effective concentration transport or the coupled FSI/ALE formulation. Figure 5 is used to compare the hydraulic response trend and should not be interpreted as evidence that the idealized two-dimensional model quantitatively predicts real GCL conductivity.
Future development should incorporate irregular and polydisperse granule geometries, statistically representative packing structures, explicit contact mechanics, three-dimensional pore connectivity, more physically based chemo-hydro-mechanical descriptions of bentonite hydration, and an independent experimental characterization of pore network evolution.
6. Conclusions
A coupled multiphysics model was developed to investigate the relationship between hydration-induced bentonite granule swelling, intergranular pore structure evolution, and the hydraulic response of an idealized GCL system. Within the assumptions of the present model, the following conclusions can be drawn:
- (1)
- Hydration produced strongly spatially nonuniform swelling. The domain-averaged particle area swelling ratio increased from 1.85% at the selected 11% state to 22.79% at the selected 55% state, while the standard deviation increased from 2.78 to 19.48 percentage points. The selected state labels therefore do not represent uniform swelling of the granular assembly.
- (2)
- Progressive swelling reorganized the intergranular pore network nonuniformly. Areal porosity decreased from 0.63 to 0.55, while the minimum connected pore throat width decreased from approximately 3.369 μm at the selected 33% state to approximately 0.452 μm at the selected 44% state. At the selected 55% state, the previously controlling passage no longer formed part of the connected through flow network, and the hydraulic bottleneck shifted to an adjacent passage.
- (3)
- The hydraulic response shows a strongly nonlinear decrease relative to the change in total pore area. The largest change occurs as a hydraulically critical pore throat approaches severe constriction, indicating that pore connectivity, local bottlenecks, and flow path redistribution are important in addition to total porosity.
- (4)
- The combined evolution of areal porosity, connected pore throat width, flow path tortuosity, and connectivity provides a more complete mechanistic description of the modeled hydraulic response than porosity alone. The present model should be regarded as an idealized mechanistic framework rather than a quantitative predictive model for actual GCLs.
Author Contributions
Conceptualization: J.H.; Methodology: L.G. and J.H.; Writing—original draft: F.Z.; Writing—review and editing: L.G., J.H. and F.Z.; Visualization: L.G. and F.Z.; Supervision: L.G. and J.H. All authors have read and agreed to the published version of the manuscript.
Funding
This research was funded by the National Natural Science Foundation of China (Nos. 52478349 and 52569022), the Gansu Provincial Major Science and Technology Special Project (No. 23ZDFA002), the Gansu Province Key Science and Technology Development Program (No. 24YFGA041), the Project of Higher Education Industry Support Program of Gansu Provincial Department of Education (Nos. 2025CYZC-019 and 2026CYZC-065), and the Gannan Prefecture Major Science and Technology Project (NO. 2025ZZ1S001).
Data Availability Statement
The original contributions presented in this study are included in the article. Further inquiries can be directed to the corresponding author.
Conflicts of Interest
The authors declare no conflicts of interest.
References
- Benson, C.H.; Meer, S.R. Relative Abundance of Monovalent and Divalent Cations and the Impact of Desiccation on Geosynthetic Clay Liners. J. Geotech. Geoenviron. Eng. 2009, 135, 349–358. [Google Scholar] [CrossRef] [Scilit]
- Fan, Y.; Rowe, R.K.; Brachman, R.W.I.; VanGulck, J.F. Effect of backfilling surface settlement trough on waste cover leakage. Geotext. Geomembr. 2024, 53, 277–294. [Google Scholar] [CrossRef] [Scilit]
- Rowe, R.K. Protecting the Environment with Geosynthetics: 53rd Karl Terzaghi Lecture. J. Geotech. Geoenviron. Eng. 2020, 146, 04020081. [Google Scholar] [CrossRef] [Scilit]
- Shackelford, C.D.; Benson, C.H.; Katsumi, T.; Edil, T.B.; Lin, L. Evaluating the hydraulic conductivity of GCLs permeated with non-standard liquids. Geotext. Geomembr. 2000, 18, 133–161. [Google Scholar] [CrossRef] [Scilit]
- Tan, Y.; Chen, J.; Benson, C.H. Predicting Hydraulic Conductivity of Geosynthetic Clay Liners Using a Neural Network Algorithm. In Proceedings of the Geo-Congress 2022, Charlotte, NC, USA, 20–23 March 2022; ASCE: Reston, VA, USA, 2022; pp. 21–28. [Google Scholar]
- Xie, J.; Du, Q.; Tang, Q.; Gu, F. Use of geopolymer stabilized municipal solid waste incineration bottom ash as sustainable subgrade filler: Mechanical performance and environmental impact. Transp. Geotech. 2026, 56, 101798. [Google Scholar] [CrossRef] [Scilit]
- Fan, Y.; Rowe, R.K.; Brachman, R.W.I.; VanGulck, J.F. The effect of a bench on leakage through a cover: A field and numerical assessment. Geotext. Geomembr. 2025, 53, 882–896. [Google Scholar] [CrossRef] [Scilit]
- Giroud, J.P.; Badu-Tweneboah, K.; Soderman, K.L. Comparison of Leachate Flow Through Compacted Clay Liners in Landfill Liner Systems. Geosynth. Int. 1997, 4, 391–431. [Google Scholar] [CrossRef] [Scilit]
- Tan, Y.; Zhang, P.; Chen, J.; Shamet, R.; Hyun Nam, B.; Pu, H. Predicting the hydraulic conductivity of compacted soil barriers in landfills using machine learning techniques. Waste Manag. 2023, 157, 357–366. [Google Scholar] [CrossRef] [Scilit]
- Jo, H.Y.; Katsumi, T.; Benson, C.H.; Edil, T.B. Hydraulic Conductivity and Swelling of Nonprehydrated GCLs Permeated with Single-Species Salt Solutions. J. Geotech. Geoenviron. Eng. 2001, 127, 557–567. [Google Scholar] [CrossRef] [Scilit]
- Kolstad, D.C.; Benson, C.H.; Edil, T.B. Hydraulic Conductivity and Swell of Nonprehydrated Geosynthetic Clay Liners Permeated with Multispecies Inorganic Solutions. J. Geotech. Geoenviron. Eng. 2004, 130, 1236–1249. [Google Scholar] [CrossRef] [Scilit]
- Hou, J.; Sun, R.; Benson, C.H. Hydrodynamic assessment of bentonite granule size and granule swelling on hydraulic conductivity of geosynthetic clay liners. Geotext. Geomembr. 2023, 51, 93–103. [Google Scholar] [CrossRef] [Scilit]
- Hou, J.; Zhang, J.B.; Sun, Y.Y.; Sun, R.; Liu, F.Y. Effect of particle swelling on hydraulic conductivity and meso-mechanism of GCL. Rock Soil Mech. 2023, 44, 3039–3048. (In Chinese) [Google Scholar]
- Jo, H.Y.; Benson, C.H.; Edil, T.B. Hydraulic Conductivity and Cation Exchange in Non-prehydrated And Prehydrated Bentonite Permeated with Weak Inorganic Salt Solutions. Clay Clay Min. 2004, 52, 661–679. [Google Scholar] [CrossRef] [Scilit]
- Jo, H.Y.; Benson, C.H.; Shackelford, C.D.; Lee, J.-M.; Edil, T.B. Long-Term Hydraulic Conductivity of a Geosynthetic Clay Liner Permeated with Inorganic Salt Solutions. J. Geotech. Geoenviron. Eng. 2005, 131, 405–417. [Google Scholar] [CrossRef] [Scilit]
- Katsumi, T.; Ishimori, H.; Ogawa, A.; Yoshikawa, K.; Hanamoto, K.; Fukagawa, R. Hydraulic conductivity of nonprehydrated geosynthetic clay liners permeated with inorganic solutions and waste leachates. Soils Found. 2007, 47, 79–96. [Google Scholar] [CrossRef] [Scilit]
- Scalia, J.; Benson, C.H. Effect of Permeant Water on the Hydraulic Conductivity of Exhumed GCLs. Geotech. Test. J. 2010, 33, 201–211. [Google Scholar] [CrossRef] [Scilit]
- Scalia, J.; Benson, C.H. Hydraulic Conductivity of Geosynthetic Clay Liners Exhumed from Landfill Final Covers with Composite Barriers. J. Geotech. Geoenviron. Eng. 2011, 137, 1–13. [Google Scholar] [CrossRef] [Scilit]
- Tan, Y.; Bradshaw, S.L.; Edil, T.B.; Benson, C.H. Hydraulic conductivity of geosynthetic clay liners and compacted clays to leachate with PFAS. J. Geotech. Geoenviron. Eng. 2026, 152, 04026060. [Google Scholar] [CrossRef] [Scilit]
- Xie, H.J.; Lou, Z.; Chen, Y.; Jin, A.; Zhan, T.L.; Tang, X. An analytical solution to organic contaminant diffusion through composite liners considering the effect of degradation. Geotext. Geomembr. 2013, 36, 10–18. [Google Scholar] [CrossRef] [Scilit]
- Benson, C.H.; Tan, Y.; Youngblood, J.; Bradshaw, S.L. Bentonite-Polymer Composite Geosynthetic Clay Liners for Heap Leach Liners. In Proceedings of the 5th International Conference on Heap Leach Mining Solutions, Sparks, NV, USA, 16–18 October 2022; Goodwill, J., Ed.; Heap Leach Solutions Conference: Sparks, NV, USA, 2022. [Google Scholar]
- Chen, J.; Benson, C.H.; Edil, T.B. Hydraulic Conductivity of Geosynthetic Clay Liners with Sodium Bentonite to Coal Combustion Product Leachates. J. Geotech. Geoenviron. Eng. 2018, 144, 04018008. [Google Scholar] [CrossRef] [Scilit]
- Chen, J.; Salihoglu, H.; Benson Craig, H.; Likos William, J.; Edil Tuncer, B. Hydraulic Conductivity of Bentonite–Polymer Composite Geosynthetic Clay Liners Permeated with Coal Combustion Product Leachates. J. Geotech. Geoenviron. Eng. 2019, 145, 04019038. [Google Scholar] [CrossRef] [Scilit]
- Chen, X.; Tan, Y.; Copeland, T.; Chen, J.; Peng, D.; Huang, T. Polymer elution and hydraulic conductivity of polymer-bentonite geosynthetic clay liners to bauxite liquors. Appl. Clay Sci. 2023, 242, 107039. [Google Scholar] [CrossRef] [Scilit]
- Chen, X.; Tan, Y.; Chen, J.; Peng, D.; Huang, T.; Meng, C. Hydraulic conductivity and multi-scale pore structure of polymer-enhanced geosynthetic clay liners permeated with bauxite liquors. Geotext. Geomembr. 2024, 52, 46–58. [Google Scholar] [CrossRef] [Scilit]
- Li, D.; Zhao, H.; Tian, K. Hydraulic conductivity of bentonite-polymer geosynthetic clay liners to aggressive solid waste leachates. Geotext. Geomembr. 2024, 52, 900–911. [Google Scholar] [CrossRef] [Scilit]
- Tan, Y.; Zhang, H.; Zhang, T.; Zhang, G.; He, D.; Ding, Z. Anisotropic hydro-mechanical behavior of full-scale compacted bentonite-sand blocks. Eng. Geol. 2021, 287, 106093. [Google Scholar] [CrossRef] [Scilit]
- Tan, Y.; Zhou, G.P.; Ding, Z.N.; Zhang, H.Y. Effect of Desiccation on the Hydraulic Conductivity of Compacted Bentonite–Sand Blocks. In IOP Conference Series: Earth and Environmental Science; IOP Publishing Ltd.: Beijing, China, 2021; p. 042122. [Google Scholar]
- Tan, Y.; Benson, C.; Zhou, G.; Bradshaw, S.; Edil, T. Hydraulic conductivity of two geosynthetic clay liners with different bentonite granule sizes. In Proceedings of the GeoAmericas 2024, Toronto, ON, Canada, 28 April–1 May 2024. [Google Scholar]
- Tan, Y.; Zhou, G.; Zhang, H.; Li, X.; Liu, P. Effect of drying cracks on swelling and self-healing of bentonite-sand blocks used as engineered barriers for radioactive waste disposal. J. Rock Mech. Geotech. Eng. 2024, 16, 1776–1787. [Google Scholar] [CrossRef] [Scilit]
- Xie, H.J.; Chen, L.C.; Ci, M.T.; Zhang, L.C.; Shi, Y.H. Study on microstructure and permeability of modified cut-off wall materials under chemical environmental effects. J. Contam. Hydrol. 2026, 281, 104987. [Google Scholar] [CrossRef] [Scilit]
- Zhang, H.; Tan, Y.; Zhu, F.; He, D.; Zhu, J. Shrinkage property of bentonite-sand mixtures as influenced by sand content and water salinity. Constr. Build. Mater. 2019, 224, 78–88. [Google Scholar] [CrossRef] [Scilit]
- Zhao, H.; Han, F.; Tian, K. Simulation of bentonite swelling pressure and pore structure evolution with a particle-based finite element framework. Int. J. Geomech. 2026, 26, 04026133. [Google Scholar] [CrossRef] [Scilit]
- Zhou, G.; Tan, Y.; Peng, Y.; Zhang, H.; Zhang, P.; Chen, J.; Liu, P. Hydraulic conductivity of air-dried bentonite-sand blocks permeated with synthetic groundwater from radioactive waste repository. Can. Geotech. J. 2025, 62, 1–16. [Google Scholar] [CrossRef] [Scilit]
- Hou, J.; Chu, C.X.; Benson, C.H. Evaluating the impact of bentonite particle size distribution and swelling on the hydraulic conductivity of geosynthetic clay liners. Geo-Americas 2024, 569, 14003. [Google Scholar] [CrossRef] [Scilit]
- Lin, X.; Liu, Z.; Wang, L.; Zhu, W.; Fan, S.; Chen, H.; Zhang, Y. Influence of moisture on coal apparent permeability and CO2 sequestration capacity: Coupled effects of hygroscopic swelling and water film. Fuel 2026, 406, 137127. [Google Scholar] [CrossRef] [Scilit]
- Perez, J.H.; Tanaka, F.; Uchino, T. Comparative 3D simulation on water absorption and hygroscopic swelling in japonica rice grains under various isothermal soaking conditions. Food Res. Int. 2011, 44, 2615–2623. [Google Scholar] [CrossRef] [Scilit]
- Yongzan, W.; Guanhua, N.; Zhao, L.; Wenzhou, D.; Hui, W.; Gang, W.; Zhen, L. Influence of hygroscopic expansion of clay minerals on the dynamic evolution of coal permeability. Fuel 2022, 330, 125670. [Google Scholar] [CrossRef] [Scilit]
- Lu, N.; Luo, S.; Zhou, B. Water Adsorption–Induced Pore-Water Pressure in Soil. J. Geotech. Geoenviron. Eng. 2022, 148, 04022042. [Google Scholar] [CrossRef] [Scilit]
- Lu, N.; Luo, S.; Likos William, J. Errors in Conventional Calculations of Soil Phase Relationships. J. Geotech. Geoenviron. Eng. 2024, 150, 04024052. [Google Scholar] [CrossRef] [Scilit]
- Luo, S.; Lu, N. Validating the Generality of a Closed-Form Equation for Soil Water Isotherm. J. Geotech. Geoenviron. Eng. 2021, 147, 04021138. [Google Scholar] [CrossRef] [Scilit]
- Luo, S.; Zhou, B.; Peng, J.; Likos William, J.; Lu, N. Unit Weight of Water in Clayey Soil. J. Geotech. Geoenviron. Eng. 2023, 149, 04022134. [Google Scholar] [CrossRef] [Scilit]
- COMSOL. COMSOL Multiphysics® V. 5.4 Software Package; COMSOL AB: Stockholm, Sweden, 2021. [Google Scholar]
- Tan, Y.; Basantis, A.; Benson, C.H.; Chen, J. Hydraulic Properties of Sluiced Coal Combustion Products Disposed in Impoundments. In Proceedings of the Geo-Congress 2022, Charlotte, NC, USA, 20–23 March 2022; ASCE: Reston, VA, USA, 2022; pp. 505–513. [Google Scholar]
- Tan, Y.; Benson, C.H.; Yilmaz, M.; Bradshaw, S.L.; Edil, T.B. Hydraulic Conductivity of Compacted Clay Liners to Landfill Leachates Containing PFAS. In Proceedings of the 9th International Congress on Environmental Geotechnics; International Society for Soil Mechanics and Geotechnical Engineering: Chania, Greece, 2023; pp. 252–258. [Google Scholar]
- Zimmerman, W.B.J. COMSOL Multiphysics Finite Element Method Multiphysics Modeling and Analysis; China Communications Press: Beijing, China, 2007. [Google Scholar]
- Pu, G.; Wang, X.; Tian, J.; Shi, L.; Tan, Y.; Chen, L. Geosynthetic clay liner for coal combustion product landfill: An environmental impact assessment. J. Environ. Manag. 2025, 395, 127886. [Google Scholar] [CrossRef] [Scilit]
- Hou, J.; Sun, Y.; Benson, C.H. Effect of granule size on pore structure and hydraulic conductivity of granular bentonite in geosynthetic clay liners. Can. Geotech. J. 2026, 63, 1–15. [Google Scholar] [CrossRef] [Scilit]

Disclaimer/Publisher’s Note: The statements, opinions and data contained in all publications are solely those of the individual author(s) and contributor(s) and not of MDPI and/or the editor(s). MDPI and/or the editor(s) disclaim responsibility for any injury to people or property resulting from any ideas, methods, instructions or products referred to in the content. |
© 2026 by the authors. Licensee MDPI, Basel, Switzerland. This article is an open access article distributed under the terms and conditions of the Creative Commons Attribution (CC BY) license.