


Abstract
To address the strong load rigidity and high energy consumption of large-scale broiler breeding, as well as the lack of precise load-characteristic support and efficient scheduling methods for breeding-oriented energy supply and consumption optimization, this paper conducts load-characteristic analysis for large-scale broiler houses and proposes an energy management optimization method based on the improved dream optimization algorithm (IDOA). First, year-round field monitoring was performed on a large-scale broiler farm in Laiyuan, Hebei, to analyze the load characteristics across seasons and breeding cycles and reveal the load evolution rules. Second, a comprehensive operational cost objective is established, considering the renewable operation and maintenance cost, the time-of-use power trading cost, and the carbon emission cost. Third, adaptive weight, dynamic mutation, and opposition-based learning strategies are embedded into the IDOA to better balance global exploration and local exploitation, and the improved algorithm outperforms other meta-heuristic algorithms on the CEC2017 benchmark functions. Simulation tests covering the four-season typical days and key breeding stages demonstrate that, compared with the rule-based dispatch strategy, the proposed method lowers the daily operating cost and effectively smooths the grid power profile, while the ESS state of charge is always maintained within the preset limits. Sensitivity analyses on the ESS capacity and the load and renewable forecasting errors further verify the robustness of the dispatch results, and the single-dispatch runtime of about 23 ms amply satisfies the real-time requirement of field implementation. This study offers theoretical support and practical reference for energy saving and carbon reduction in large-scale livestock breeding and breeding-park energy system scheduling.
1. Introduction
Against the dual background of the dual-carbon strategic goals and the construction of the new power system, the clean and low-carbon transition in agricultural and rural sectors has become an important intersection of the energy revolution and the rural revitalization strategy. As a pillar industry of the agricultural and rural economy, large-scale livestock and poultry farming is also one of the major sources of energy consumption and carbon emissions in agriculture. It is urgent to upgrade its energy consumption mode toward low-carbon and high-efficiency alternatives [1,2]. White-feathered broiler farming has the highest degree of scale and standardization among China’s livestock and poultry breeding industries, which generally adopts a 42-day all-in and all-out closed indoor rearing mode. The production performance of broilers is highly dependent on the precise regulation of indoor environmental parameters, and the breeding load presents the characteristics of strong rigidity, remarkable spatiotemporal fluctuation, and large peak–valley difference [3,4]. With the large-scale integration of distributed renewable energy into breeding parks, the traditional energy supply and consumption mode faces prominent problems such as insufficient source-load matching, high comprehensive operational cost, and weak low-carbon regulation capability. It is imperative to conduct research on accurate load-characteristic analysis and efficient energy management optimization, so as to provide a theoretical basis and practical support for energy conservation and carbon reduction in large-scale broiler farming, as well as the coordinated operation of source–grid–load under the new power system [3,4].
At present, scholars have conducted a series of studies on the load characteristics, energy consumption modeling, and energy management of livestock and poultry farming. In the field of breeding load characteristics, ref. [5] proposed an operation strategy for high-photovoltaic-penetration fishery-photovoltaic distribution areas by integrating flexible aquaculture loads and energy storage, indicating that breeding-related loads have distinct temporal distribution characteristics and flexible regulation potential under renewable energy integration. Ref. [6] evaluated and optimized a renewable energy-coupled multi-generation system for large-scale pig farms, showing that the integration of renewable energy can improve the energy supply performance of large-scale livestock farming systems. Ref. [7] developed and validated an energy consumption model for animal houses, revealing the coupling relationship between indoor environmental regulation and energy consumption in precision livestock farming. Ref. [8] investigated the energy impact of climate control in pig farming through dynamic simulation and experimental validation, and quantified the energy consumption required to maintain indoor temperature, humidity, and air quality under different environmental conditions.
Recently emerging studies further enriched the modeling and analytical methods for breeding energy consumption. Ref. [9] adopted the Ecotect software to simulate the monthly energy consumption of broiler houses across different climatic zones and analyzed the optimization potential of building envelopes and operation strategies. Ref. [10] constructed a NeuralProphet-based prediction model for farm ventilation energy consumption, while lacking consideration of exogenous meteorological fluctuations, resulting in limited accuracy for short-term load variation. These studies mainly focus on energy consumption modeling and climatic adaptation analysis for breeding buildings, but rarely combine long-term field monitoring data to explore the dual coupling effect of seasonal climate and breeding growth stages on electrical load. In particular, the temporal evolution characteristics of electricity loads in large-scale broiler houses in North China have not been fully explored, making it difficult to provide accurate data support for energy system planning and scheduling in local breeding parks. Ref. [11] developed an off-grid hybrid energy system integrating biogas, photovoltaic generation, and energy storage for livestock farms to support self-sufficient and low-carbon farm energy operation. Ref. [12] optimized farm energy systems by comprehensively considering seasonal variation, livestock growth characteristics, power supply reliability, and carbon emission reduction targets. Ref. [13] adopted particle swarm optimization to coordinate multiple energy devices to reduce system operation cost and carbon output. In recent intelligent scheduling research, ref. [14] applied reinforcement learning for farm battery energy management to reduce grid purchasing cost and peak load pressure, and ref. [15] constructed a multi-agent simulation platform to support farm peer-to-peer energy transaction scheduling. However, several research gaps remain in the existing literature. First, regarding the data basis, the aforementioned agricultural-microgrid studies rely on predicted loads or simulation-generated agricultural loads, while high-resolution, continuously measured load data for large-scale broiler houses are still lacking, which makes it difficult to capture the actual load evolution of poultry production. Second, regarding load characterization, the livestock load is generally treated as a constant or a seasonally independent disturbance, whereas the strong coupling between the seasonal climate and the production cycle has not been explicitly characterized for poultry houses. Third, regarding the carbon-reduction requirement, large-scale livestock farming is facing increasingly urgent demands for carbon emission reduction, yet the existing energy management studies on agricultural microgrids rarely incorporate the carbon emission target into the optimization objective, and the coordinated optimization of economic benefits and environmental performance has not been adequately addressed for broiler house microgrids.
In view of the above problems, this paper takes the microgrid system of large-scale broiler breeding parks in North China as the research object and carries out research on load-characteristic analysis and energy management optimization. The main contributions of this paper are summarized as follows:
- (1)
- Load-characteristic analysis of large-scale broiler breeding parks. Taking a large-scale commercial broiler farm in Laiyuan County, Hebei Province, as the research object, year-round continuous power load monitoring is conducted. The variation characteristics of electricity load are systematically analyzed from the dual dimensions of season and breeding cycle, and the spatiotemporal evolution law of broiler breeding load is clarified, providing basic data support for subsequent energy management optimization.
- (2)
- Construction of an objective function for system operation cost. An objective function for minimizing the comprehensive system operation cost is constructed, which integrates the operation and maintenance cost and carbon emission cost, thereby achieving coordinated optimization of economic benefits and environmental performance.
- (3)
- By introducing adaptive weight adjustment, dynamic mutation, and opposition-based learning strategies, the conventional DOA is improved to effectively balance global exploration and local exploitation. Furthermore, the IDOA is adopted to solve the constructed energy management model, and comprehensive simulation tests are conducted under multiple operating scenarios.
The remainder of this paper is organized as follows. Section 2 elaborates the energy system of the broiler house and performs load-characteristic analysis based on full-year monitoring data. Section 3 establishes the objective function and constraint conditions for energy management optimization with consideration of multiple cost dimensions. Section 4 describes the proposed multi-strategy improved DOA and the corresponding energy management method in detail. Section 5 conducts performance comparison tests of the algorithm and simulation verification of energy management. Section 6 concludes the research and presents the prospects for future work.
2. Energy System and Load-Characteristic Analysis of Broiler Houses
2.1. Energy System for Large-Scale Broiler Houses
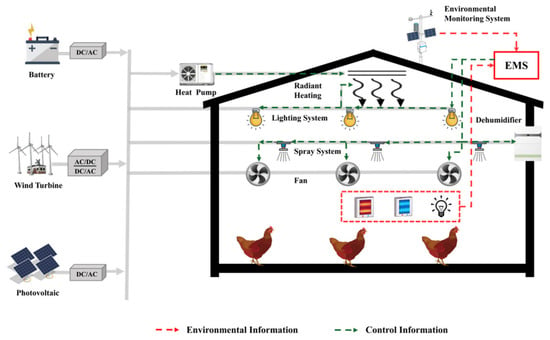
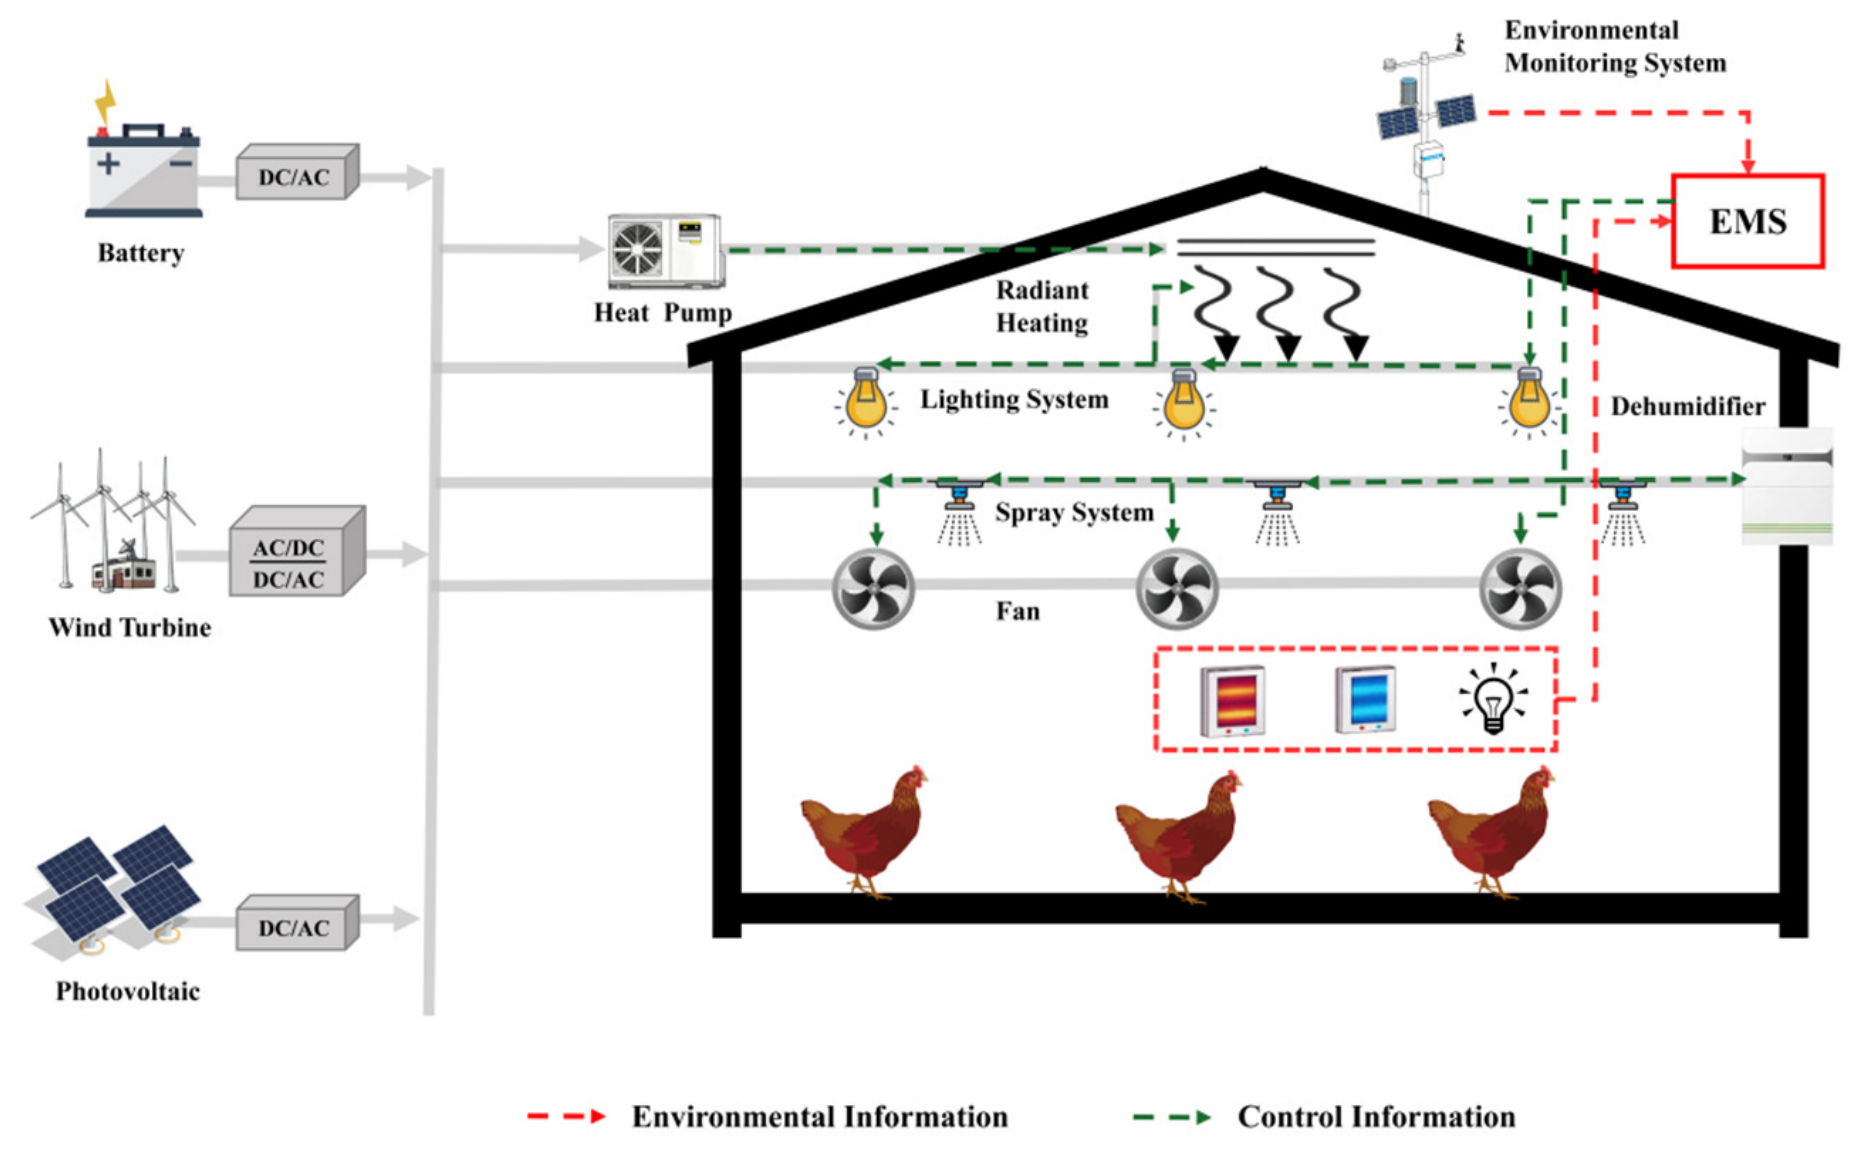
This study constructs an energy system for broiler houses oriented to the new power system. The system integrates three types of energy units, namely PV, wind power generation, and battery energy storage. It unifies the form of electric energy via power conversion devices and provides a stable and low-carbon power supply for indoor environmental regulation and loads of broiler houses, as shown in Figure 1.
Figure 1.
Schematic diagram of the energy supply system for large-scale broiler houses.
On the energy supply side, PV and wind power generation serve as the core renewable energy supply units. Battery energy storage is adopted for power fluctuation smoothing as well as peak shaving and valley filling. All power sources are connected to the common AC bus via converters. On the energy demand side of broiler houses, the actuators for indoor environmental regulation throughout the whole growth cycle of broilers are taken as the core load. It covers key electrical equipment such as heat pump heating, spray cooling, negative pressure ventilation, dehumidification, and lighting. Relying on environmental monitoring data, the energy management system (EMS) realizes closed-loop regulation for the indoor microclimate, which achieves accurate source-load matching and balances breeding environment guarantee, energy management, and economic operation [16].
Large-scale commercial white-feathered broilers generally adopt a standardized 42-day all-in and all-out rearing mode. After each batch of broilers is marketed, a house emptying period of about 10 days is reserved for thorough indoor cleaning, disinfection, and environmental restoration, enabling 6 to 7 batches of commercial broiler breeding throughout the year. Broilers present significantly different environmental requirements at various growth stages. The optimal temperature threshold gradually declines as the bird age increases. Commercial broilers are divided into three growth stages: the brooding period, the growing period, and the finishing period. During the breeding process, the coordinated regulation of the negative pressure ventilation system, evaporative pad cooling system, and heat pump heating system is required to precisely maintain indoor environmental parameters within the comfortable growth range of broilers. This ensures stable growth performance and a high survival rate of broilers. The specific requirements for the comfortable growth environment are listed in Table 1.
Table 1.
Environmental control parameters for commercial broilers at different growth stages.
2.2. Broiler House Load and Its Characteristic Analysis
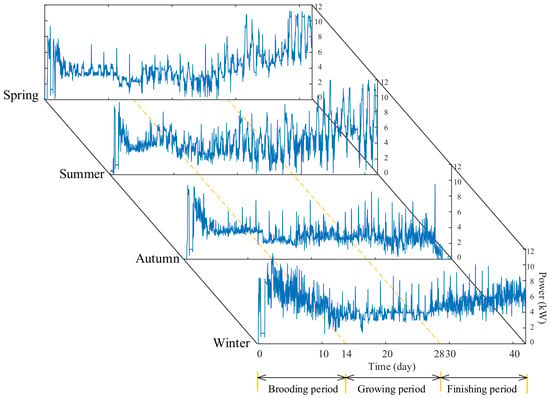
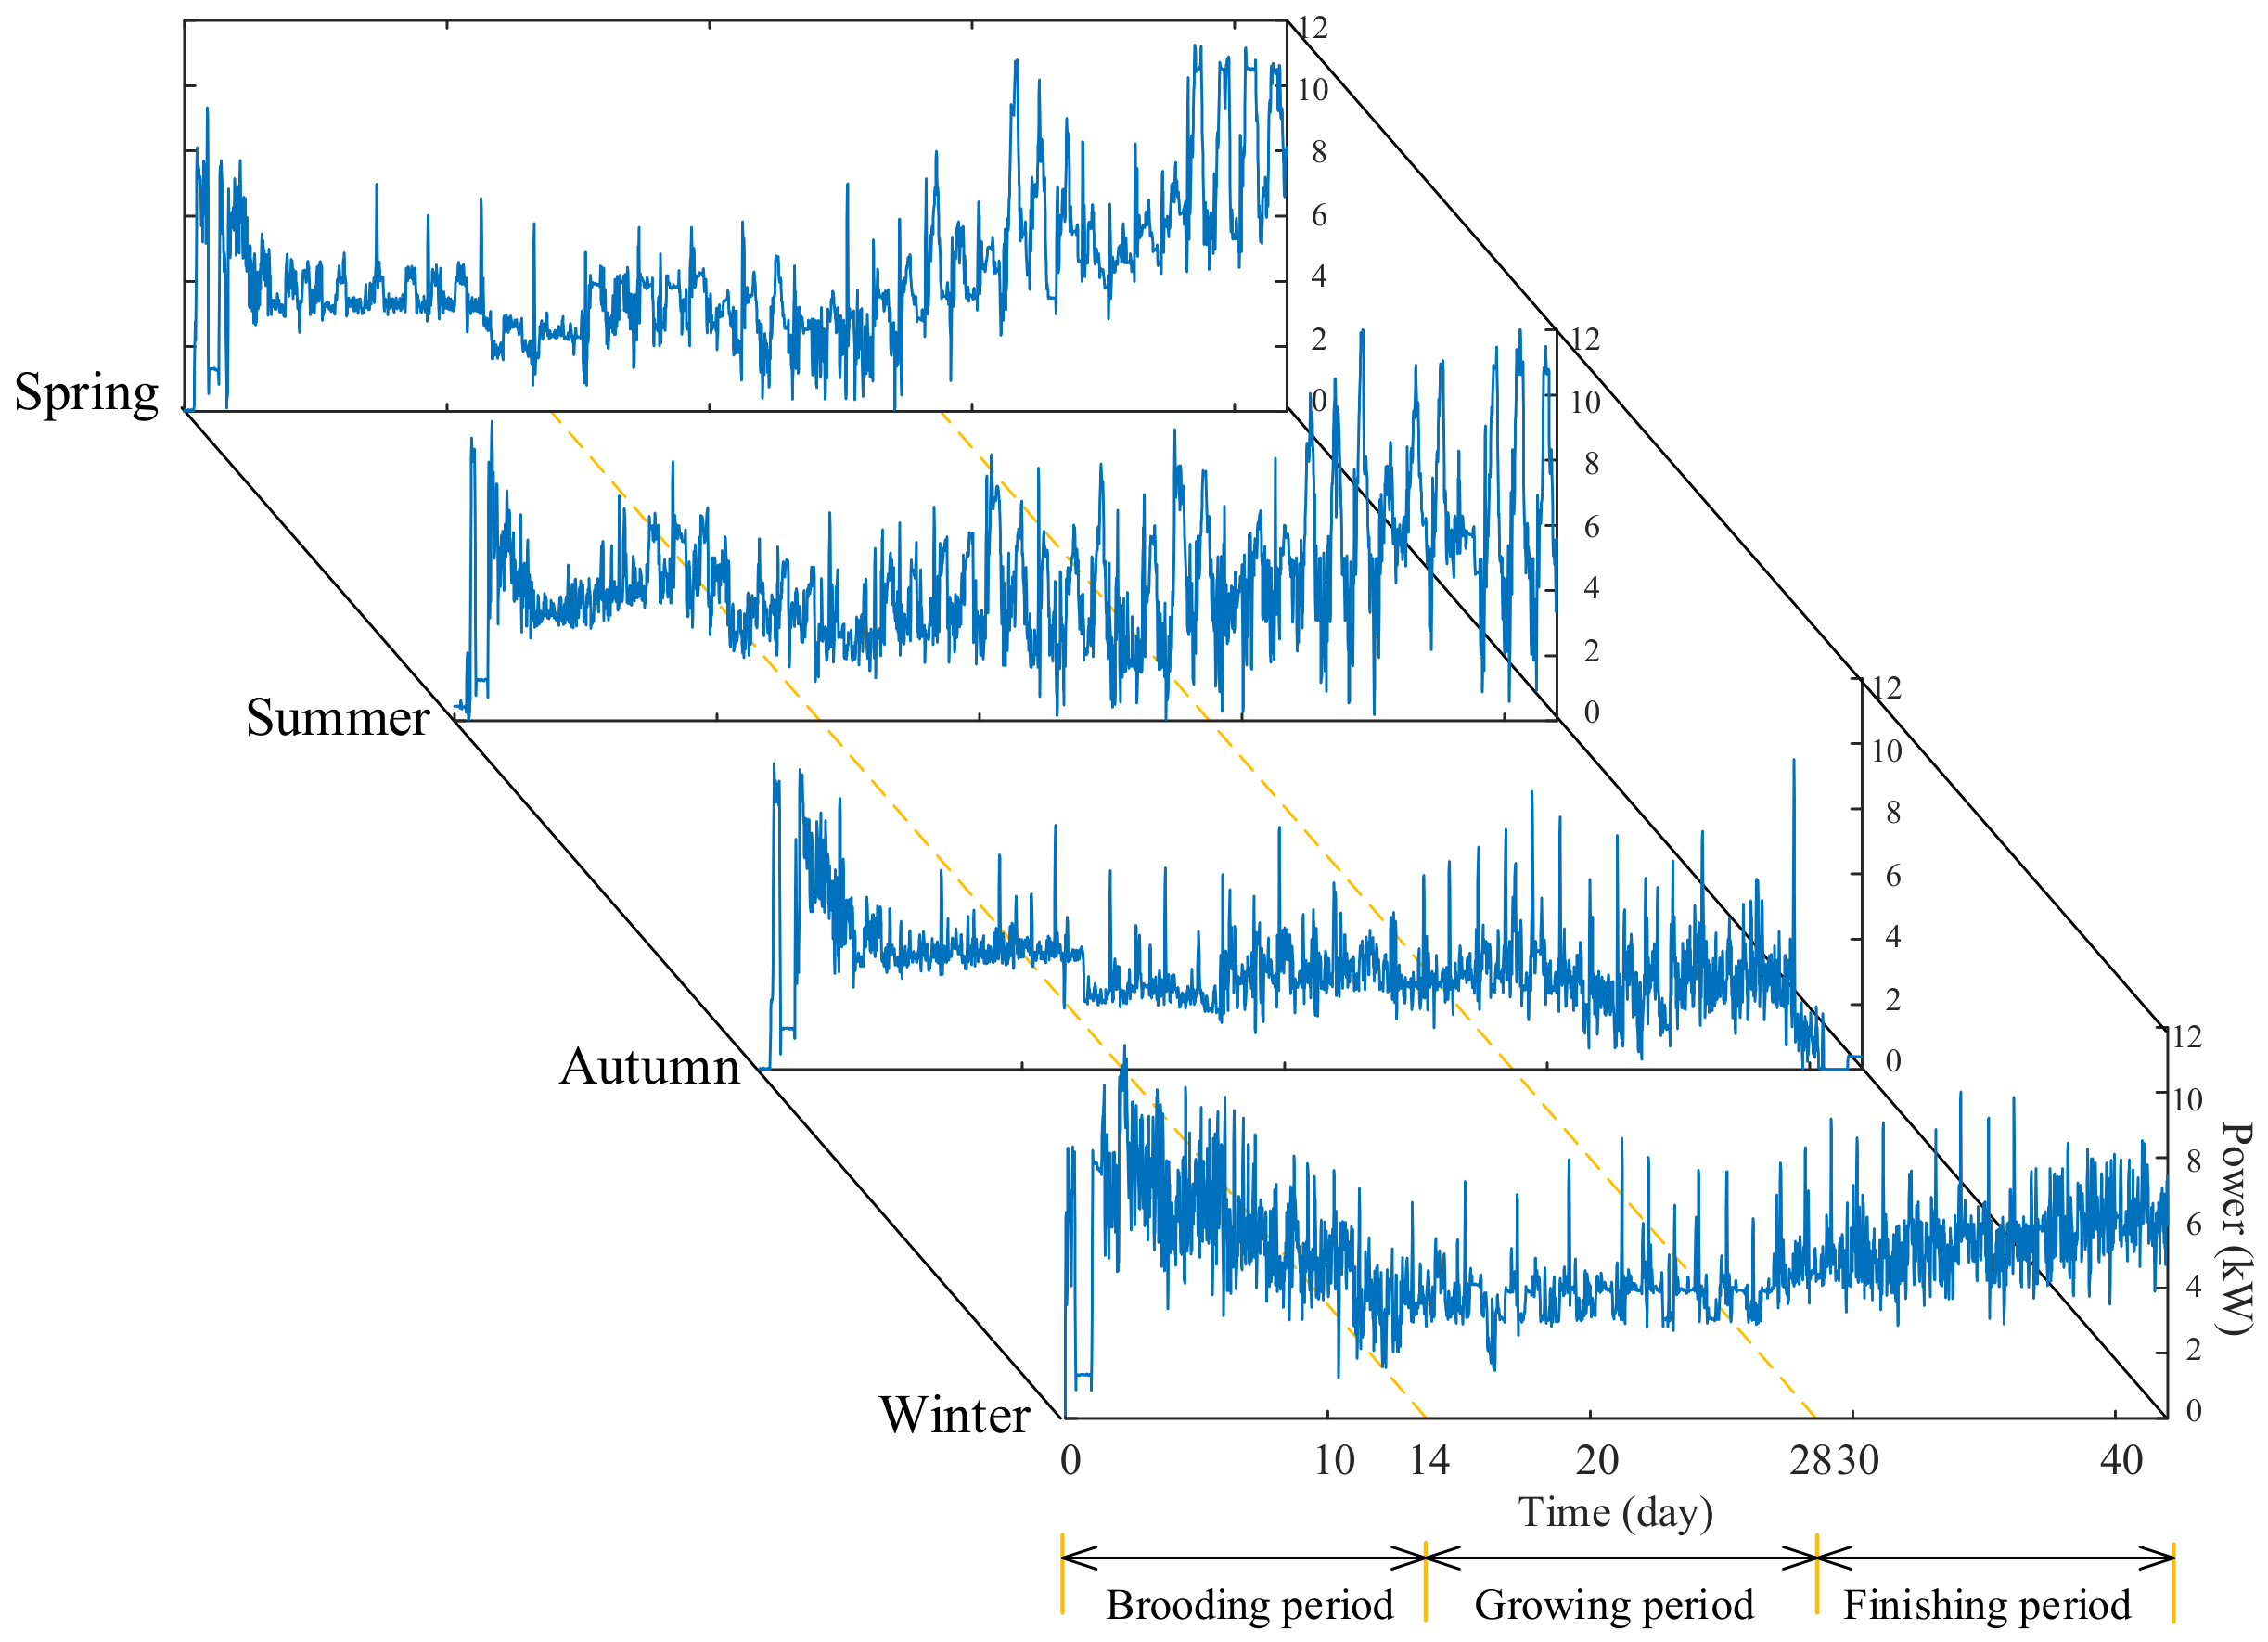
This study selects a large-scale commercial broiler farm located in Laiyuan County, Baoding City, Hebei Province as the research object, with a rearing capacity of 30,000 broilers per house. In 2025, uninterrupted online power load monitoring was carried out throughout the whole year. Time-series load data of core environmental control equipment and auxiliary production equipment were collected for different seasons and various growth stages of broilers with a sampling interval of 15 min. Within the monitoring period, the farm completed a total of seven batches of commercial broiler rearing. According to the climatic characteristics of the four seasons and the matching relationship of breeding cycles, complete load samples corresponding to spring, summer, autumn and winter were screened out for load-characteristic analysis. The load variation patterns of breeding cycles in different seasons are shown in Figure 2 and Table 2.
Figure 2.
Full-cycle load curve of broiler houses under different seasons.
Table 2.
Statistical results of broiler house loads under different seasons.
Figure 2 presents the load curves of the whole breeding cycle across four seasons. The statistical results of weekly power load are illustrated in Table 2. Based on the above figures and table, the load characteristics are analyzed from two dimensions: season and breeding cycle.
From the seasonal perspective, the total load of a single broiler house throughout the entire breeding cycle shows an obvious bimodal distribution with peaks in winter/summer and valleys in spring/autumn. The ranking of load demand is winter with 4456.75 kWh, summer with 4396.50 kWh, Spring with 3867.25 kWh, and autumn with 3607.00 kWh. Winter and summer are identified as the annual load peaks, with total loads being 23.56% and 21.89% higher than those of autumn, with the lowest load. The core driving factor is the rigid environmental control demand for persistent heating in winter and continuous cooling in summer. Such demands are determined by the temperature difference between the indoor ambient temperature and the optimal growth temperature of broilers, and possess strong irreplaceability. In the transitional seasons of spring and autumn, the ambient temperature is highly matched with the optimal growth temperature of broilers. The demand for heating and cooling is weak, and only the basic ventilation load needs to be maintained. The overall load stays at the lowest level of the whole year, forming the optimal period for economic power operation within the breeding cycle.
From the perspective of the breeding cycle, the 42-day all-in and all-out rearing mode of broilers can be divided into three core growth stages: the brooding period (Week 1), the growing period (Week 2–Week 4), and the finishing period (Week 5–Week 6). The power load of broiler houses presents obvious stage heterogeneity, and the evolution law of load along the breeding process differs distinctly among seasons. In spring, autumn, and winter, the broiler house load follows a consistent variation trend of peak load in the brooding period, gradual decline in the growing period, and stable state in the finishing period. Specifically, the power load in Week 1 of the spring reaches 1029.25 kWh, accounting for 26.61% of the total power load in the whole breeding cycle, which is the maximum load of the entire cycle. Such high load is mainly dominated by the continuous heating demand of heat pump systems to maintain the high ambient temperature of 33–35 °C required for chick growth. Upon entering the growing period, the optimal ambient temperature for broiler growth gradually decreases with age, and the power demand for heating and ventilation declines simultaneously. The weekly power consumption falls to a stable range of 550–650 kWh, with the proportion of single-week power load steadily maintained at 13–16%.
In contrast, the load variation pattern in summer is completely opposite to that in the other three seasons, showing an evolutionary characteristic of a load trough in the brooding period, a gradual rise in the growing period, and a peak value in the finishing period. The power load in Week 1 of the summer is only 678 kWh, accounting for 15.43% of the total cycle load and representing the minimum load throughout the cycle. The power load in Week 6 of the finishing period rises to 1137.25 kWh, occupying 25.87% of the total load. This is attributed to the combined effect of extremely high temperatures in summer and concentrated heat production of broiler flocks. High-power negative pressure fans and evaporative pad cooling systems need to operate continuously for a long time to maintain the indoor microclimate, leading to a substantial increase in cooling power load. The total proportion of power load in the two weeks of the finishing period exceeds 45%.
The above analytical results of load characteristics clarify that the power load of large-scale broiler houses is driven by the coupled effect of breeding growth stages and seasonal climatic characteristics, revealing the internal formation mechanism of load evolution. The findings can provide fundamental data support and a theoretical basis for the optimal configuration of wind–PV–storage-integrated micro-energy systems in broiler houses, as well as for the formulation of energy management strategies under time-of-use electricity price mechanisms.
3. Energy Management of Microgrid System for Broiler Houses
In this subsection, the cost function of the Microgrid system is constructed, and the constraint conditions of each component are clarified.
3.1. Cost Function for Energy Management
The power generation cost of the power system in large-scale chicken houses is mainly composed of four parts: renewable energy power generation cost, energy storage cost, carbon emission cost, and electricity purchase and sale cost.
3.1.1. Renewable Energy Power Generation Cost
In the energy system of broiler houses, the renewable energy generation equipment is mainly composed of PV and wind power generation units. The power generation cost consists of two parts: the operation and maintenance (O&M) cost of the equipment, and the operation loss cost of the converter. It can be simplified into the following quadratic function form [17]:
where are the cost coefficients of renewable energy generation, and is the output power of renewable energy generation.
3.1.2. Energy Storage Cost
The energy storage system (ESS), as the core equipment to smooth power fluctuations and improve power supply quality, can effectively enhance the operation stability and power supply guarantee capacity of the microgrid by storing surplus electric energy and releasing it during periods of tight supply and demand. The total cost of the ESS in the microgrid can be expressed as
where and are power loss coefficients, denotes the charging or discharging power
During the charging and discharging of ESSs, the relationship between the state of charge (SOC) of the battery and the battery power is shown in Equation (3) [18].
where SOC(k) and SOC(k + 1) denote the SOC of the battery at time k and time k + 1, respectively; denotes the dispatch cycle with the unit of hours; E denotes the rated battery capacity; and is the charging/discharging efficiency.
3.1.3. Electricity Purchase and Sale Cost
The electricity purchase and sale cost from the interaction with the main grid is one of the core components of the comprehensive operation cost of the micro-energy system. To accurately quantify the costs and benefits corresponding to power exchange with the main grid at different time periods, an electricity purchase and sale cost function is constructed based on the time-of-use (TOU) electricity price mechanism, as shown below:
where PG is the power exchanged between the microgrid and the main grid. When PG > 0, the purchase term is active, and the sale term is zero; it indicates purchasing electricity from the main grid. When PG < 0, it indicates selling electricity to the main grid. csell and cbuy are the selling price and purchasing price under the TOU price mechanism, respectively. The main grid adopts the TOU price mechanism, and the electricity price level is dynamically adjusted with different time periods to reflect the market supply and demand status. The specific electricity purchase and sale price parameters are shown in Table 3.
Table 3.
Real-time electricity prices of the main grid.
3.1.4. Carbon Emission Cost
To meet the demand for green transition, incorporating carbon cost into the optimization objective enables the conversion of carbon emissions into economic signals, and the baseline method is adopted to calculate carbon emission allowances:
where CM denotes the total carbon emission allowances within one dispatching cycle—i.e., the objective function for carbon emissions; is the unit electricity quota coefficient for system carbon emissions.
The electrical energy in the microgrid is supplied by power generation equipment, electricity purchased from the main grid, and the discharge of energy storage batteries. If the microgrid’s power generation forms are pv power generation and wind power generation, there are no CO2 emissions in this case. If the microgrid’s power generation equipment includes traditional generators, the CO2 emissions from the power generation equipment in the microgrid are calculated as follows:
where ad, bd, and cd denote the CO2 emission factors of the power generation equipment in the microgrid; and Pg represents the output power of the microgrid.
When the power generated by PV, wind, and biomass energy in the microgrid system is insufficient to meet the electricity demand, electricity needs to be purchased from the main grid. Power plants in the main grid primarily rely on thermal power generation, and the corresponding CO2 emissions are calculated by the following formula:
where aD, bD and cD denote the CO2 emission factors of the power generation equipment in the main grid.
To summarize, the total CO2 emission cost of the microgrid is calculated as follows:
where denotes the total carbon emission cost of the microgrid; is the carbon trading price; and are the CO2 emissions from the microgrid’s conventional generators and the purchased grid electricity, respectively; and is the free carbon allowance calculated by Equation (5). The signed expression in Equation (8) explicitly distinguishes two cases: when , the term in parentheses is positive and , representing the cost of purchasing additional carbon allowances to cover the emission deficit; when , the term in parentheses is negative and , representing the revenue from selling surplus allowances on the carbon market, which enters the total-cost objective as a negative cost. Thus, the carbon penalty cost and the carbon-trading revenue are automatically separated by the sign of without requiring a piecewise formulation.
3.2. Objective Function and Constraints
Taking the minimum system operation cost as the optimization objective, a comprehensive optimization objective function considering carbon emission costs is constructed under the premise of satisfying the safe and stable operation constraints of the power system in large-scale broiler houses, as follows:
where denotes the set of new energy generation equipment such as PV and wind power units, and denotes the set of energy storage devices.
To ensure the safe and stable operation of the power system in large-scale broiler houses, while meeting the electricity demand of breeding production and the system energy supply-demand balance, the following constraints are formulated for each component and the overall operation characteristics of the system:
where D is the load demand of the broiler house.
where and represent the maximum power of electricity purchase and electricity sale of the system, respectively; is the maximum output power of the distributed generator (DG), i.e., the output power of the wind turbine or photovoltaic system under maximum power point tracking (MPPT) control.
4. Energy Management Method Based on Improved Dream Optimization Algorithm
This subsection proposes a multi-strategy improved dream optimization algorithm (DOA) to solve the above cost function model, so as to achieve economically optimal energy management.
4.1. Basic Dream Optimization Algorithm
The DOA [19] is a meta-heuristic optimization algorithm inspired by the characteristics of memory retention, partial forgetting, and logical self-organization in human dreams. It achieves global optimization through the synergistic effect of exploration and exploitation phases. The optimization process of DOA is divided into an exploration phase and an exploitation phase, which share the core update strategy and differ only in parameter settings and optimization focus. The core update equations are as follows:
Basic Memory Strategy: The individual is reset to the optimal position of its group to retain high-quality memory, as shown in Equation (14):
where denotes the position of the i-th individual at the (t + 1)-th iteration; denotes the best individual of the q-th group at the t-th iteration.
Forgetting and Supplementing Strategy: By randomly forgetting some dimensions and constructing an adaptive update rule combined with the search boundary and iteration progress, the algorithm performs global search in the exploration phase based on Equation (15) and local optimization in the exploitation phase based on Equation (16), so as to achieve the cooperative balance between global exploration and local exploitation.
where is the j-th dimensional position of the i-th individual at the (t + 1)-th iteration; denotes the j-th dimensional position of the best individual of the q-th group at the t-th iteration; and are the lower and upper bounds of the search space in the j-th dimension, respectively; rand is a random number in [0, 1]; t is the current iteration number; is the maximum number of iterations; is the maximum number of iterations in the exploration phase.
Dream Sharing Strategy: Random information from other individuals in the population is introduced in the forgotten dimensions to enhance the algorithm’s ability to escape local optima. This strategy is only executed in the exploration phase, and the update method is shown in Equation (17):
where denotes the position of the j-th dimension of the i-th individual at the (t + 1)-th iteration; m is a natural number randomly selected from the interval [1, n] during each dimension update. denotes the position of the d-th dimension of the k-th individual randomly selected from the population at the t-th iteration.
4.2. Improved Dream Optimization Algorithm
In view of the inherent shortcomings of the traditional DOA, the algorithm is optimized and improved from three aspects in this paper.
4.2.1. Adaptive Weight
The adaptive weight is introduced to address the high-dimensional and piecewise non-convex nature of the broiler house microgrid dispatch problem. The decision vector contains the charging/discharging power of all dispatch intervals, and the objective involves discontinuous terms from the TOU purchase/sale price (Equation (4)). Under such a high-dimensional non-convex landscape, a fixed exploration–exploitation weight tends to either cause premature convergence in early iterations or slow convergence in late iterations. In addition, the fixed-decay update step size of the forgetting and replenishment strategy restricts the DOA’s performance in complex search spaces.
Therefore, we introduce an adaptive weight [20] to dynamically adjust this balance along the iteration process, with the modified formulas shown in Equations (18) and (19):
where is the adaptive weight.
4.2.2. Opposition-Based Learning
The basic memory strategy of the DOA directly resets individuals to the position of the best individual in the group. Although this can quickly inherit high-quality solution information, it is prone to premature convergence and slow convergence speed in complex optimization problems. For the dispatch problem of a broiler house microgrid, this risk is particularly pronounced: the decision vector involves the charging/discharging power of all dispatch intervals, which are coupled through the SOC dynamic constraint, and the objective is piecewise non-convex due to the TOU purchase/sale price. Directly resetting individuals to the best position can easily trap the population in a local optimum. To address this issue, an opposition-based learning strategy [21] is introduced to improve the basic memory strategy. By generating opposite solutions within the variable bounds, OBL expands the search coverage and enhances the ability to jump out of local optima in this high-dimensional, tightly constrained feasible region. The improved individual update strategy is presented in Equation (20).
4.2.3. Dynamic Mutation Strategy
The mutation operation is a random search strategy in evolutionary algorithms, which generates new solutions by adding certain perturbations to the current solutions. To maintain population diversity and improve the local search accuracy [22] of the algorithm, a dynamic mutation strategy is introduced into the dream sharing strategy. In the present problem, a higher perturbation probability is assigned early to maintain diversity under the high-dimensional, multi-modal objective, and a lower probability late to refine high-quality dispatches. Meanwhile, only a minority of non-elite individuals are mutated while the first m elites are preserved, protecting already-found peak-shaving and valley-filling solutions.
The update formula of the dynamic mutation strategy is shown in Equation (21).
where r ∈ [0, 1] is a uniform random number; is the Gaussian perturbation term; and decreases linearly with the number of iterations. is a random number following the standard normal distribution.
The mutation rate is set to a relatively high value in the early iterations to enhance the algorithm’s global exploration capability in the solution space. As the iterative process progresses, the mutation rate gradually decreases, thereby shifting to fine-grained local search.
4.3. Energy Management Strategy Based on IDOA
To address the energy management problem of large-scale broiler house microgrids, this paper constructs an objective function with minimum operating cost and minimum carbon emission, which is solved by the IDOA, thereby achieving economic efficiency and low-carbon operation of the microgrid. The specific implementation steps are as follows:
Step 1: Set algorithm parameters and initialize the population. Calculate the global fitness according to Equation (9) and record the initial optimal solution.
Step 2: Generate a random number rand in the range [0, 1] to determine whether to execute the exploration strategy or the exploitation strategy. If rand > u, is a parameter, go to Step 3; otherwise, go to Step 4.
Step 3: Execute the update strategy according to Equation (20), then go to Step 5.
Step 4: Execute the update strategy according to Equations (18) and (19), then go to Step 5.
Step 5: Calculate and update the fitness value according to Equation (9).
Step 6: Perform the dynamic mutation operation according to Equation (21), then calculate and update the fitness value according to Equation (9).
Step 7: Judge whether the maximum number of iterations is reached. If yes, go to Step 8; otherwise, go to Step 2.
Step 8: Output the optimal position and its corresponding fitness value.
5. Simulation and Result Analysis
5.1. Benchmark Testing for IDOA
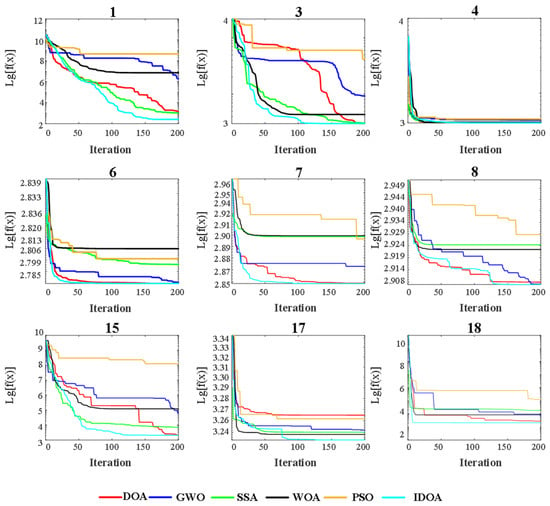
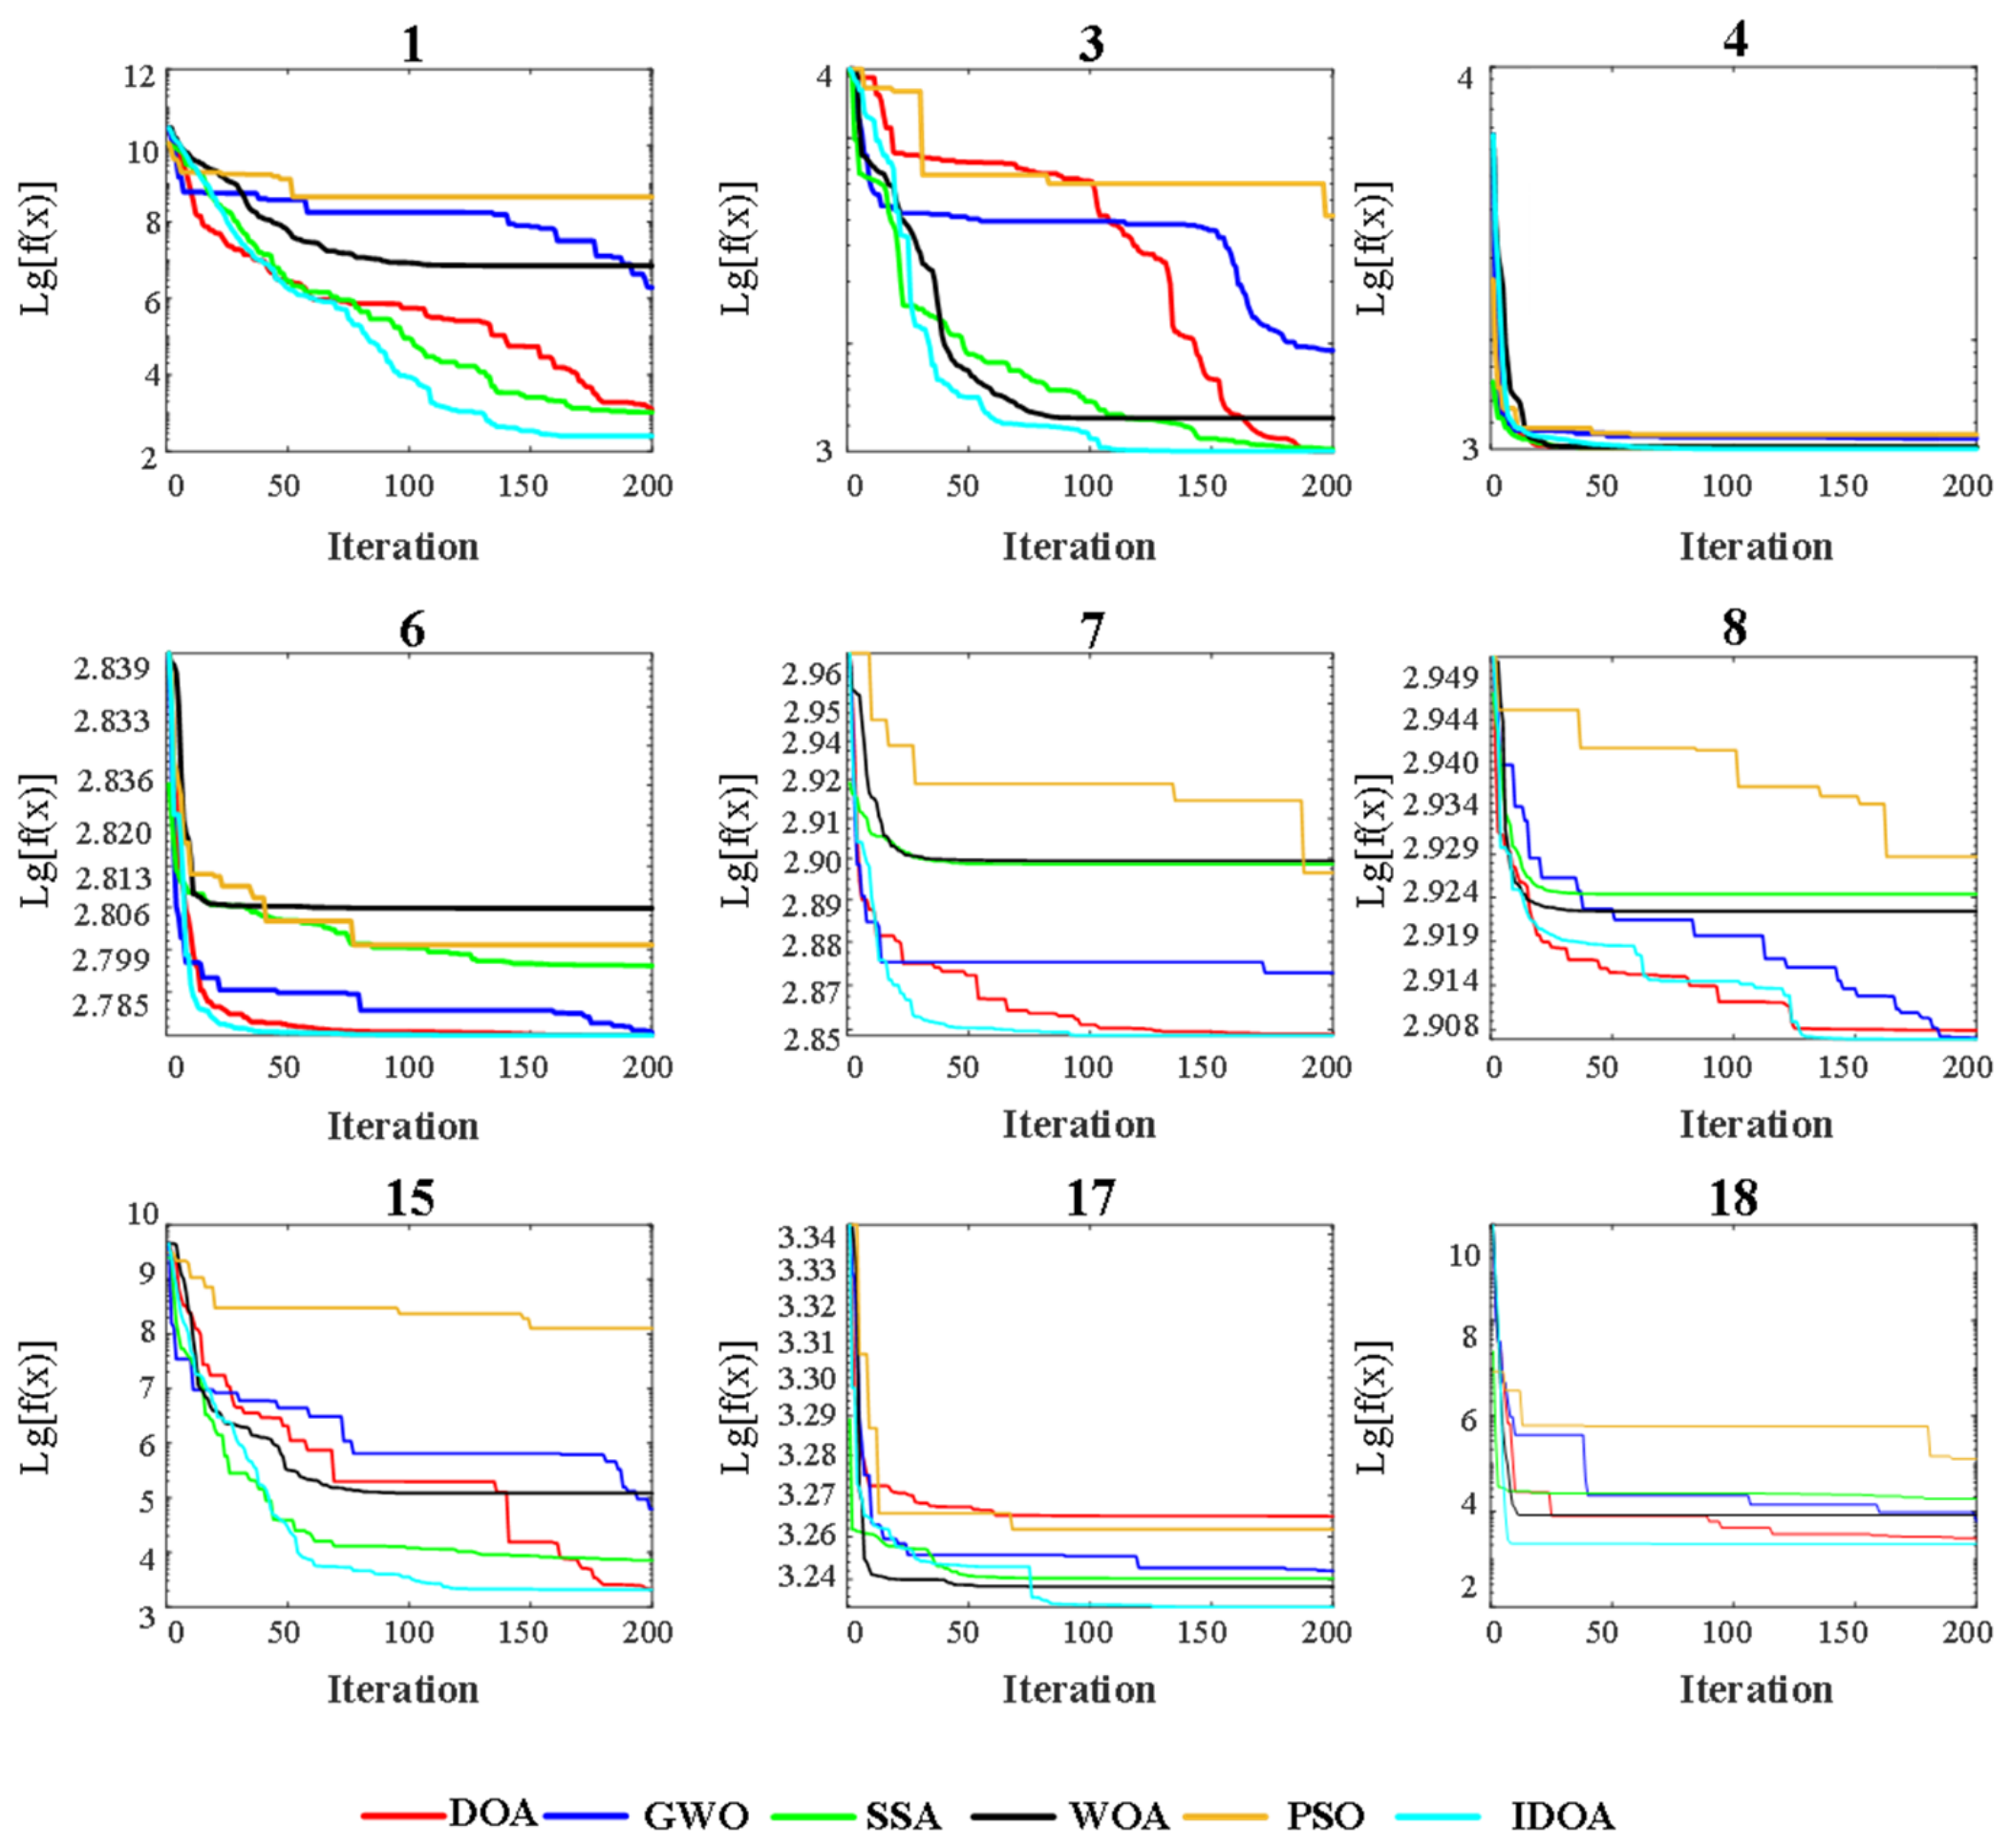
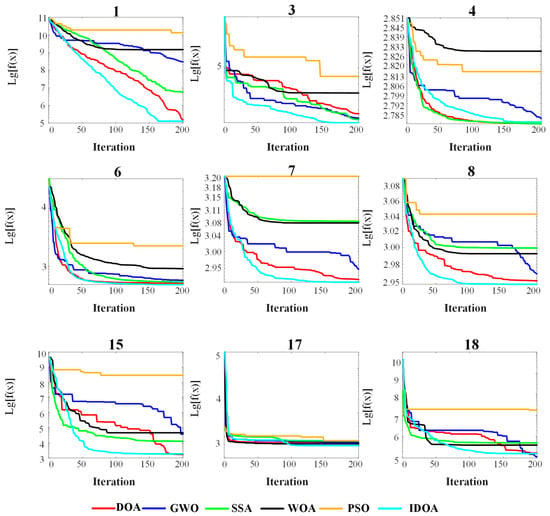
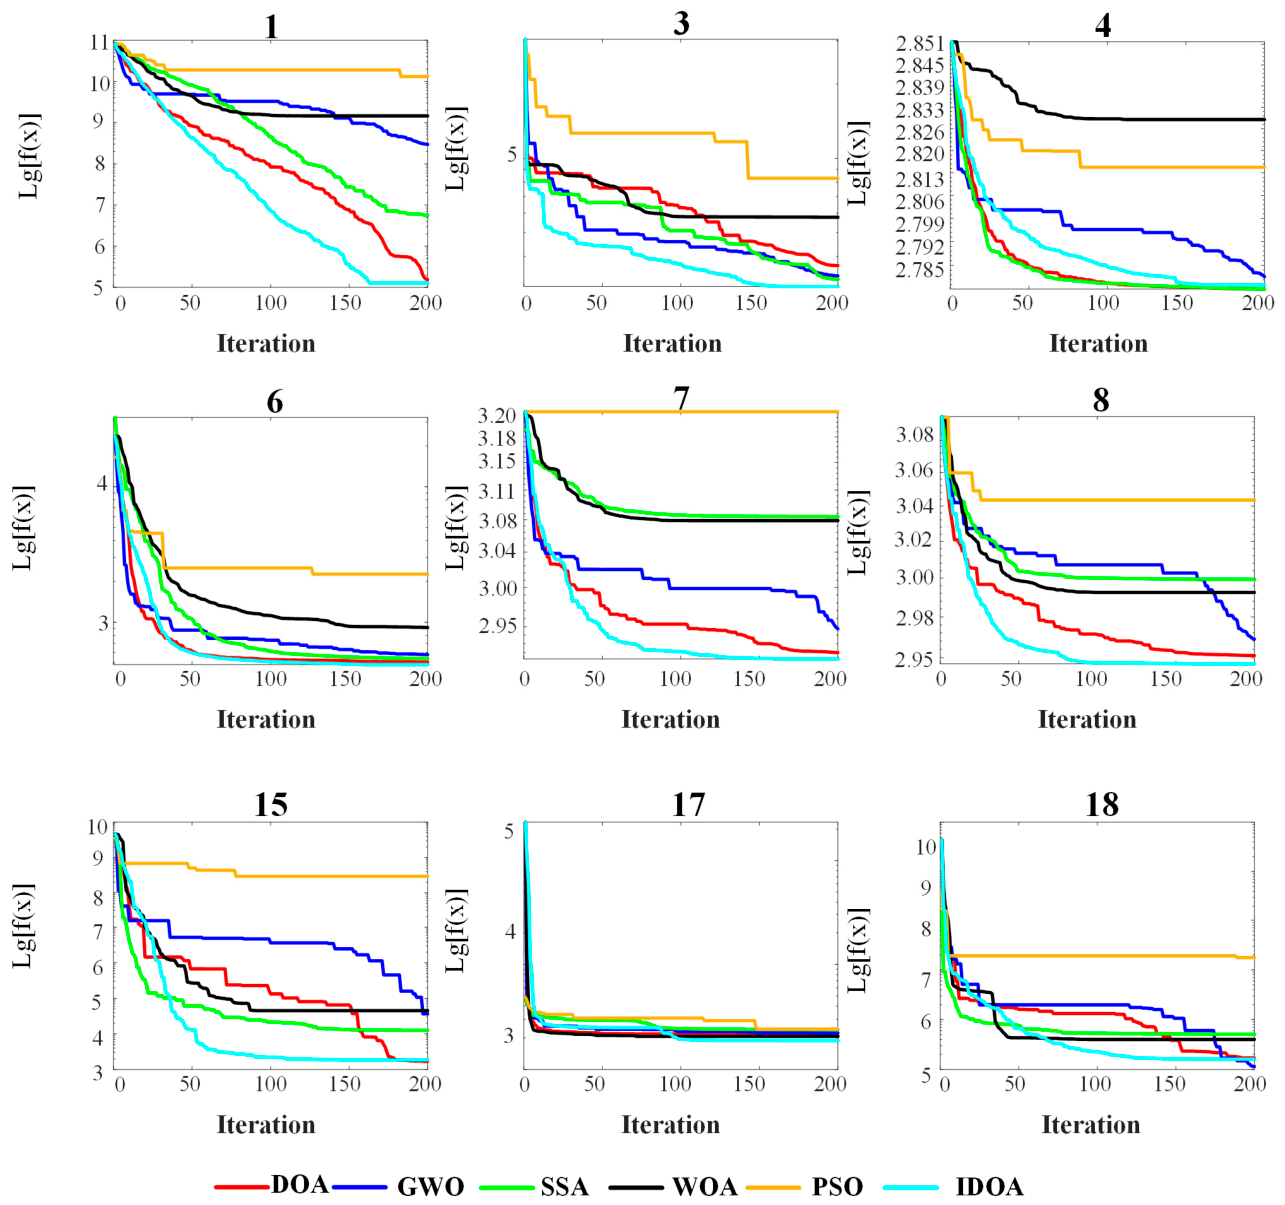
In this section, nine benchmark functions from the CEC2017 test functions [19] are selected to test the performance of IDOA under dimensions of n = 10 and n= 30. The IDOA is compared with several existing algorithms, including DOA, GWO [23], SSA [24], WOA [25], and PSO [26]. To ensure fairness in the comparison, all algorithms are configured with the same parameter settings: the population size is set to 200, the maximum number of iterations is set to 200, and the search range of each dimension is set to [−100, 100]. Considering the stochastic nature of algorithms, each algorithm is run 20 independent times, and the best value, mean value, median value, and standard deviation are recorded in Table 4 and Table 5, which are denoted by “min”, “std”, “avg”, and “median”, respectively. The convergence curves of each algorithm are shown in Figure 3 and Figure 4, where the numbers on the figures denote the indices of test functions.
Table 4.
Test results of different optimization algorithms under 10 dimensions.
Table 5.
Test results of different optimization algorithms under 30 dimensions.
Figure 3.
Convergence curves of different optimization algorithms under 10-dimensional benchmark functions.
Figure 4.
Convergence curves of different optimization algorithms under 30-dimensional benchmark functions.
It can be seen from Figure 3 and Figure 4 that the proposed IDOA exhibits the fastest convergence speed and optimal convergence accuracy on all test functions at both 10 and 30 dimensions. It can quickly approach the optimal solution in the early iterations and converges stably without obvious oscillation in the later stage. Compared with DOA, GWO, SSA, WOA, and PSO algorithms, IDOA effectively avoids premature convergence and local optimum problems, and shows superior global exploration and local exploitation capabilities on both unimodal functions and complex multimodal functions, which verifies the effectiveness of the improvement strategies.
5.2. Case Study of Energy Management
To verify the effectiveness of the proposed method, a simulation model of a microgrid system is established using MATLAB R2024a on a local high-performance computing platform. The experimental platform is equipped with an Intel Core i7-12700F processor, 32 GB memory, and an NVIDIA GeForce RTX 3060 graphics card.
The energy system of the broiler house consists of a wind power generation system, a PV system, an energy storage system, and the main grid. The experimental data are collected from a broiler farming park in Laiyuan, Hebei Province, covering key variables such as wind power output, PV output, load power, and time-of-use electricity price. The parameters of each unit are listed in Table 6 [27], where ag1, bg1, and cg1 denote the parameters of the photovoltaic (PV) generation cost function, while ag2, bg2, and cg2 denote the parameters of the wind power generation cost function.
Table 6.
Parameter settings for the broiler house microgrid system.
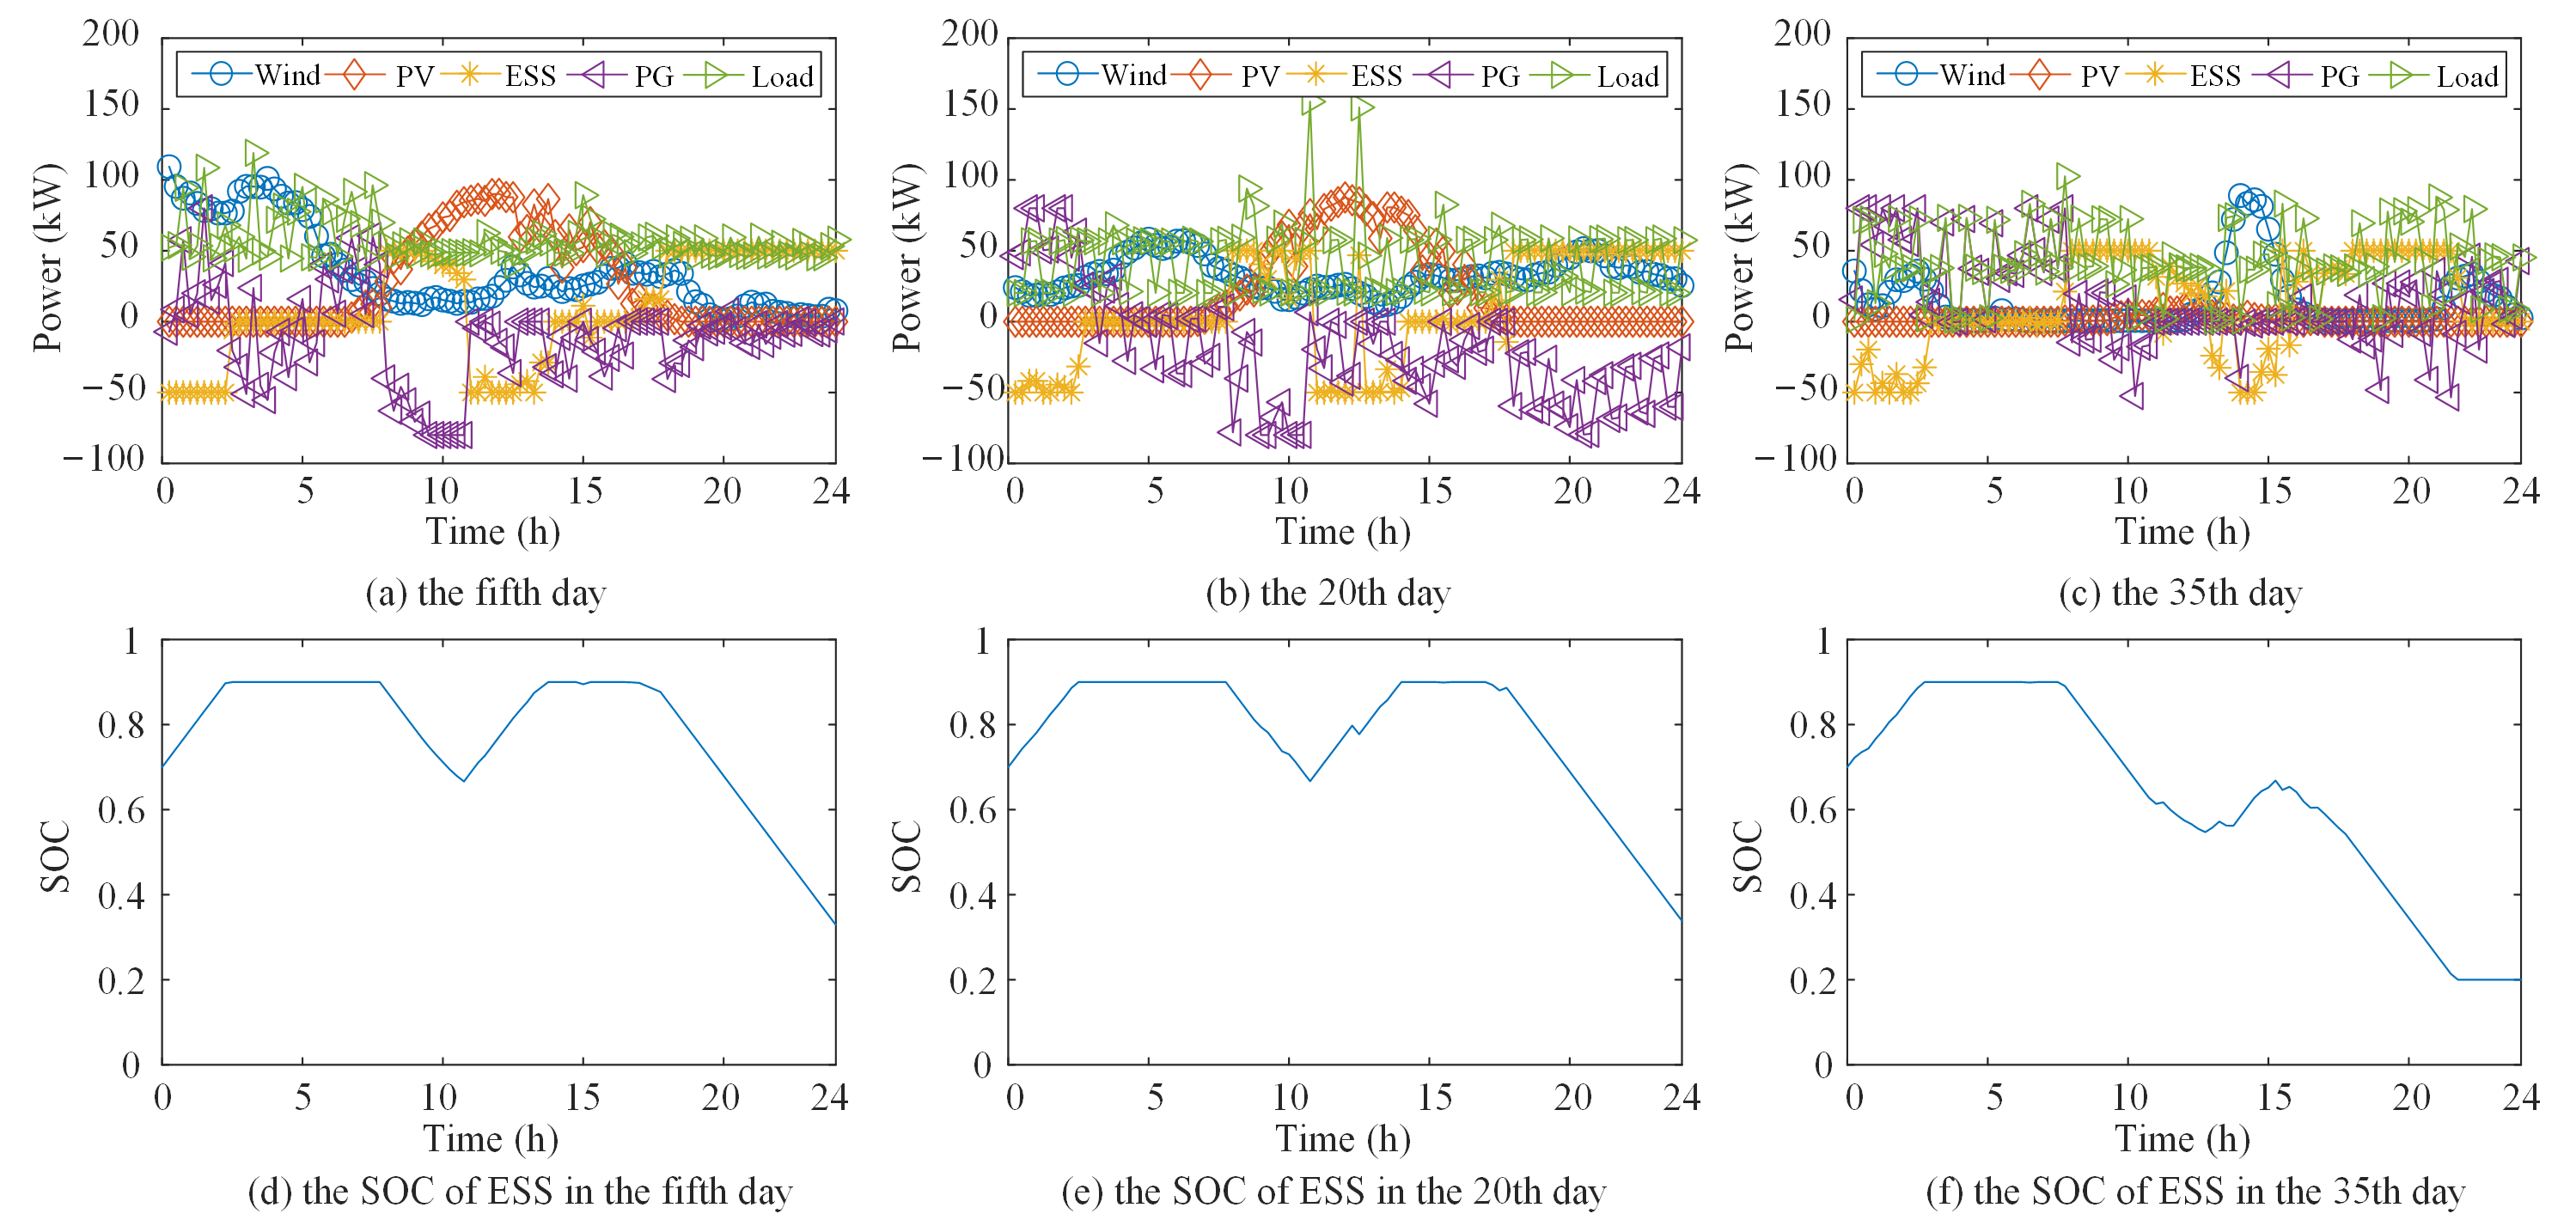
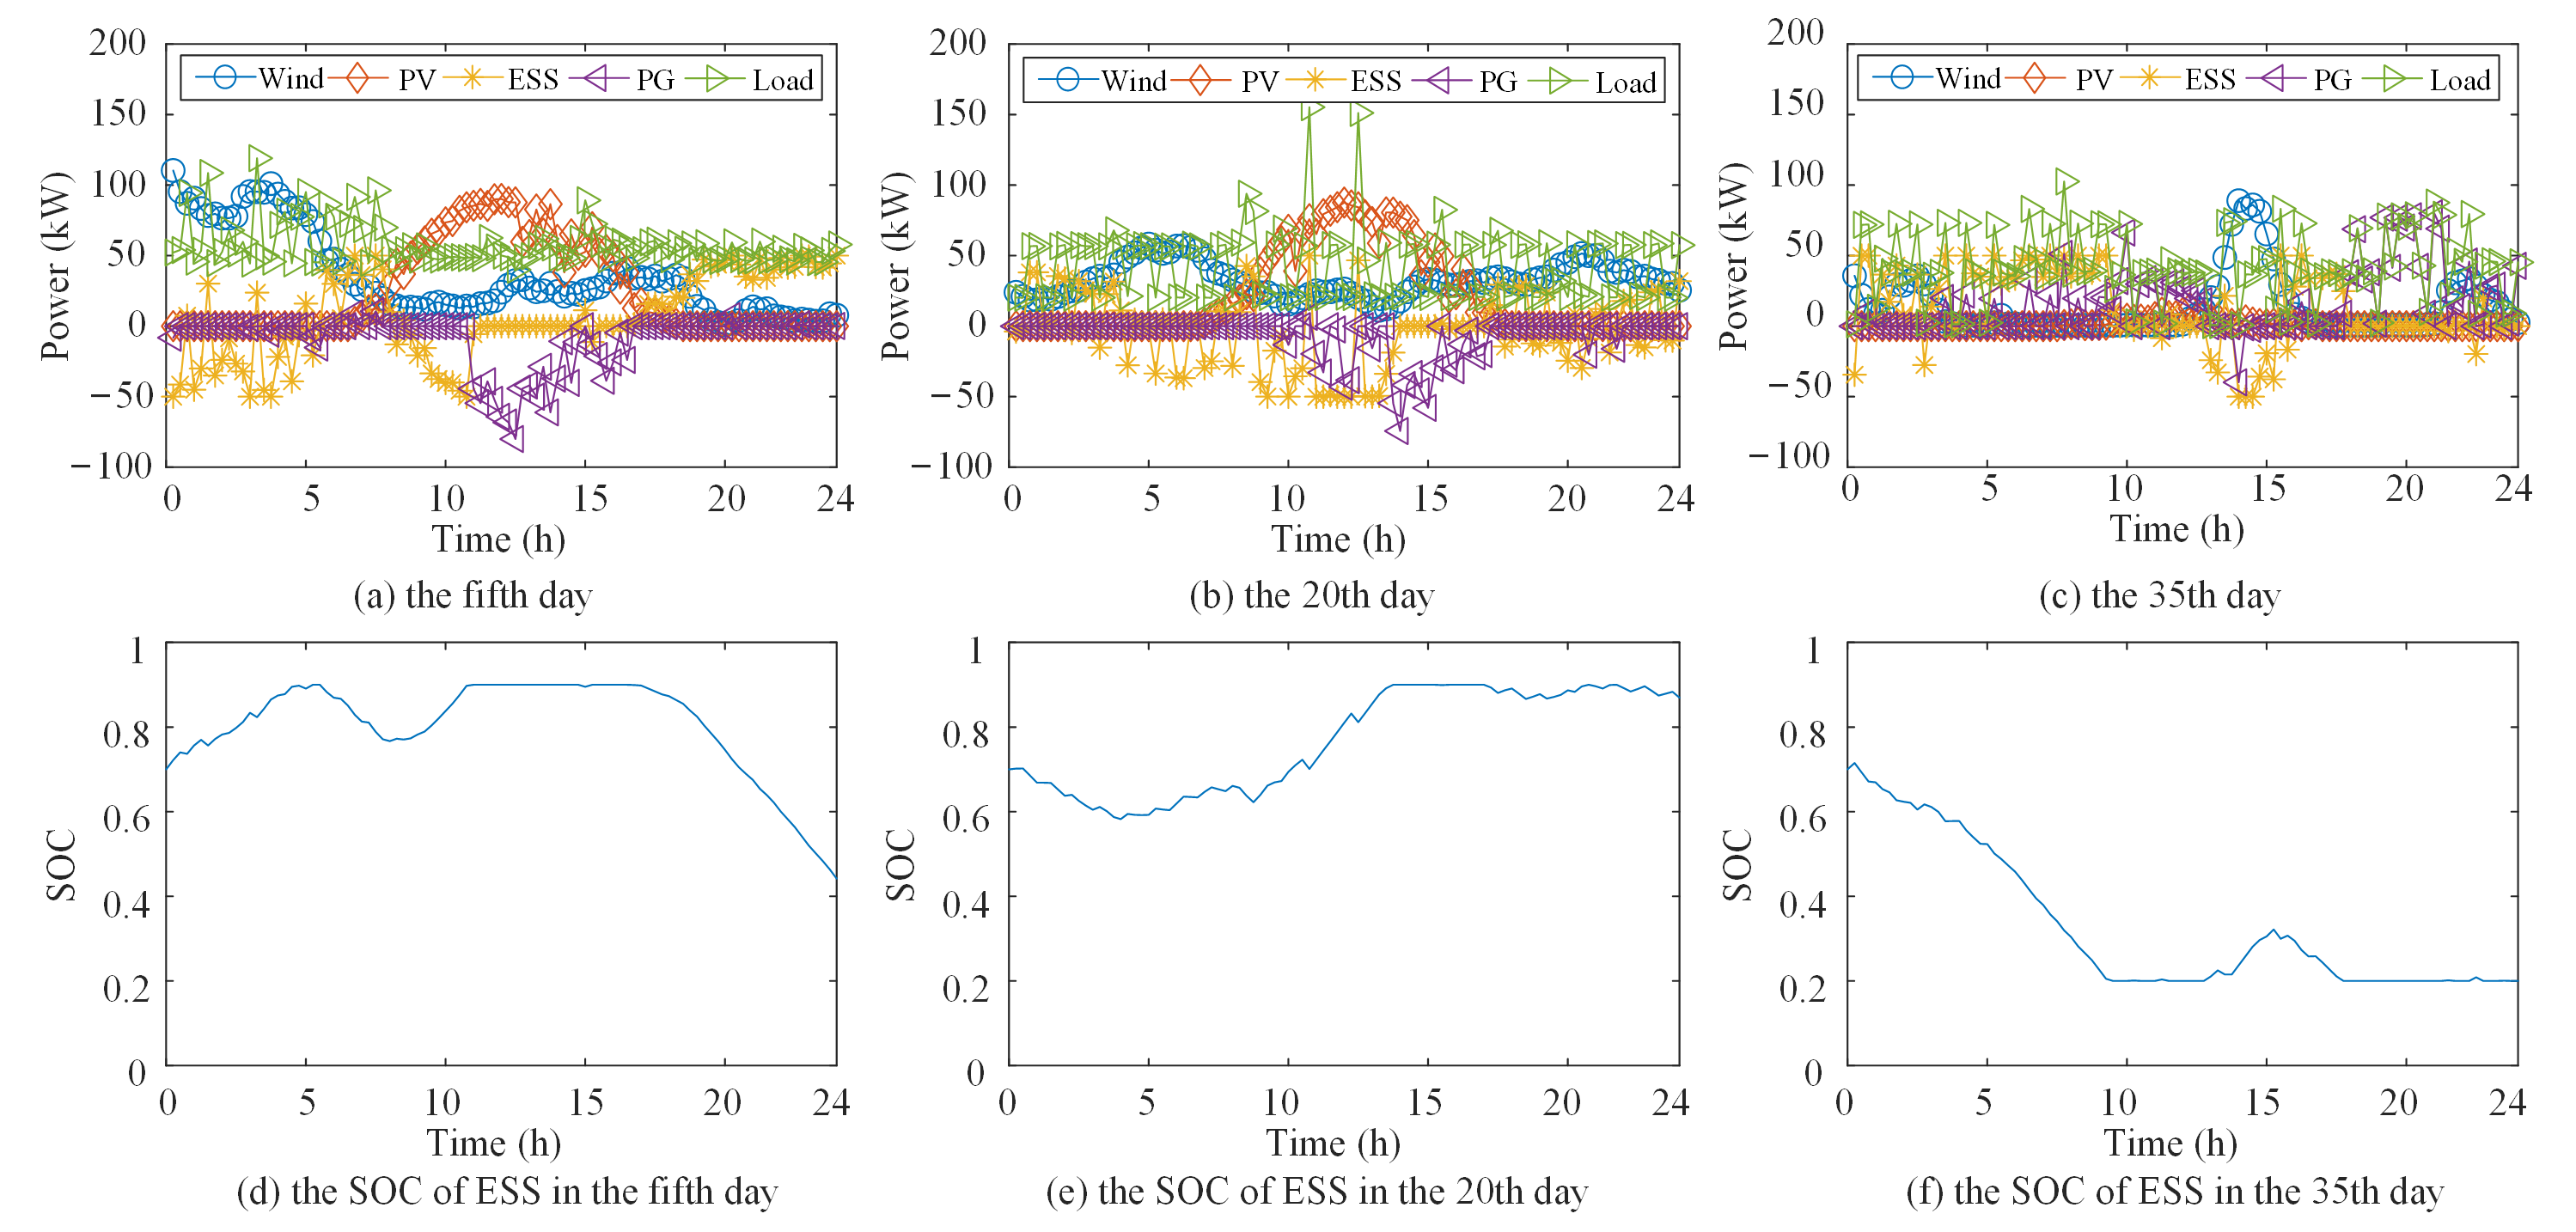
Since the electrical load of the broiler house varies significantly with growth stage and season, the brooding stage is characterized by large load fluctuations and high peak demand; the growing stage shows an overall reduction in load; and the finishing stage maintains a relatively stable but high load level. Therefore, based on the 42-day broiler growth cycle, three representative days are selected from different growth stages under each seasonal condition: the brooding stage, represented by Day 5; the growing stage, represented by Day 20; and the finishing stage, represented by Day 35. The purpose of the test is to analyze the operating performance of the proposed energy management strategy under different combinations of load demand and sustainable power output across growth stages and seasons, compared with a rule-based dispatch strategy [28], thereby verifying its adaptability to different farming scenarios.
5.2.1. Case 1: Energy Management in Spring
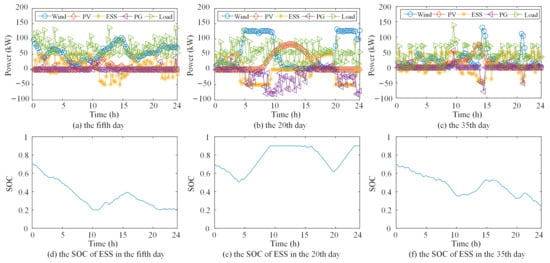
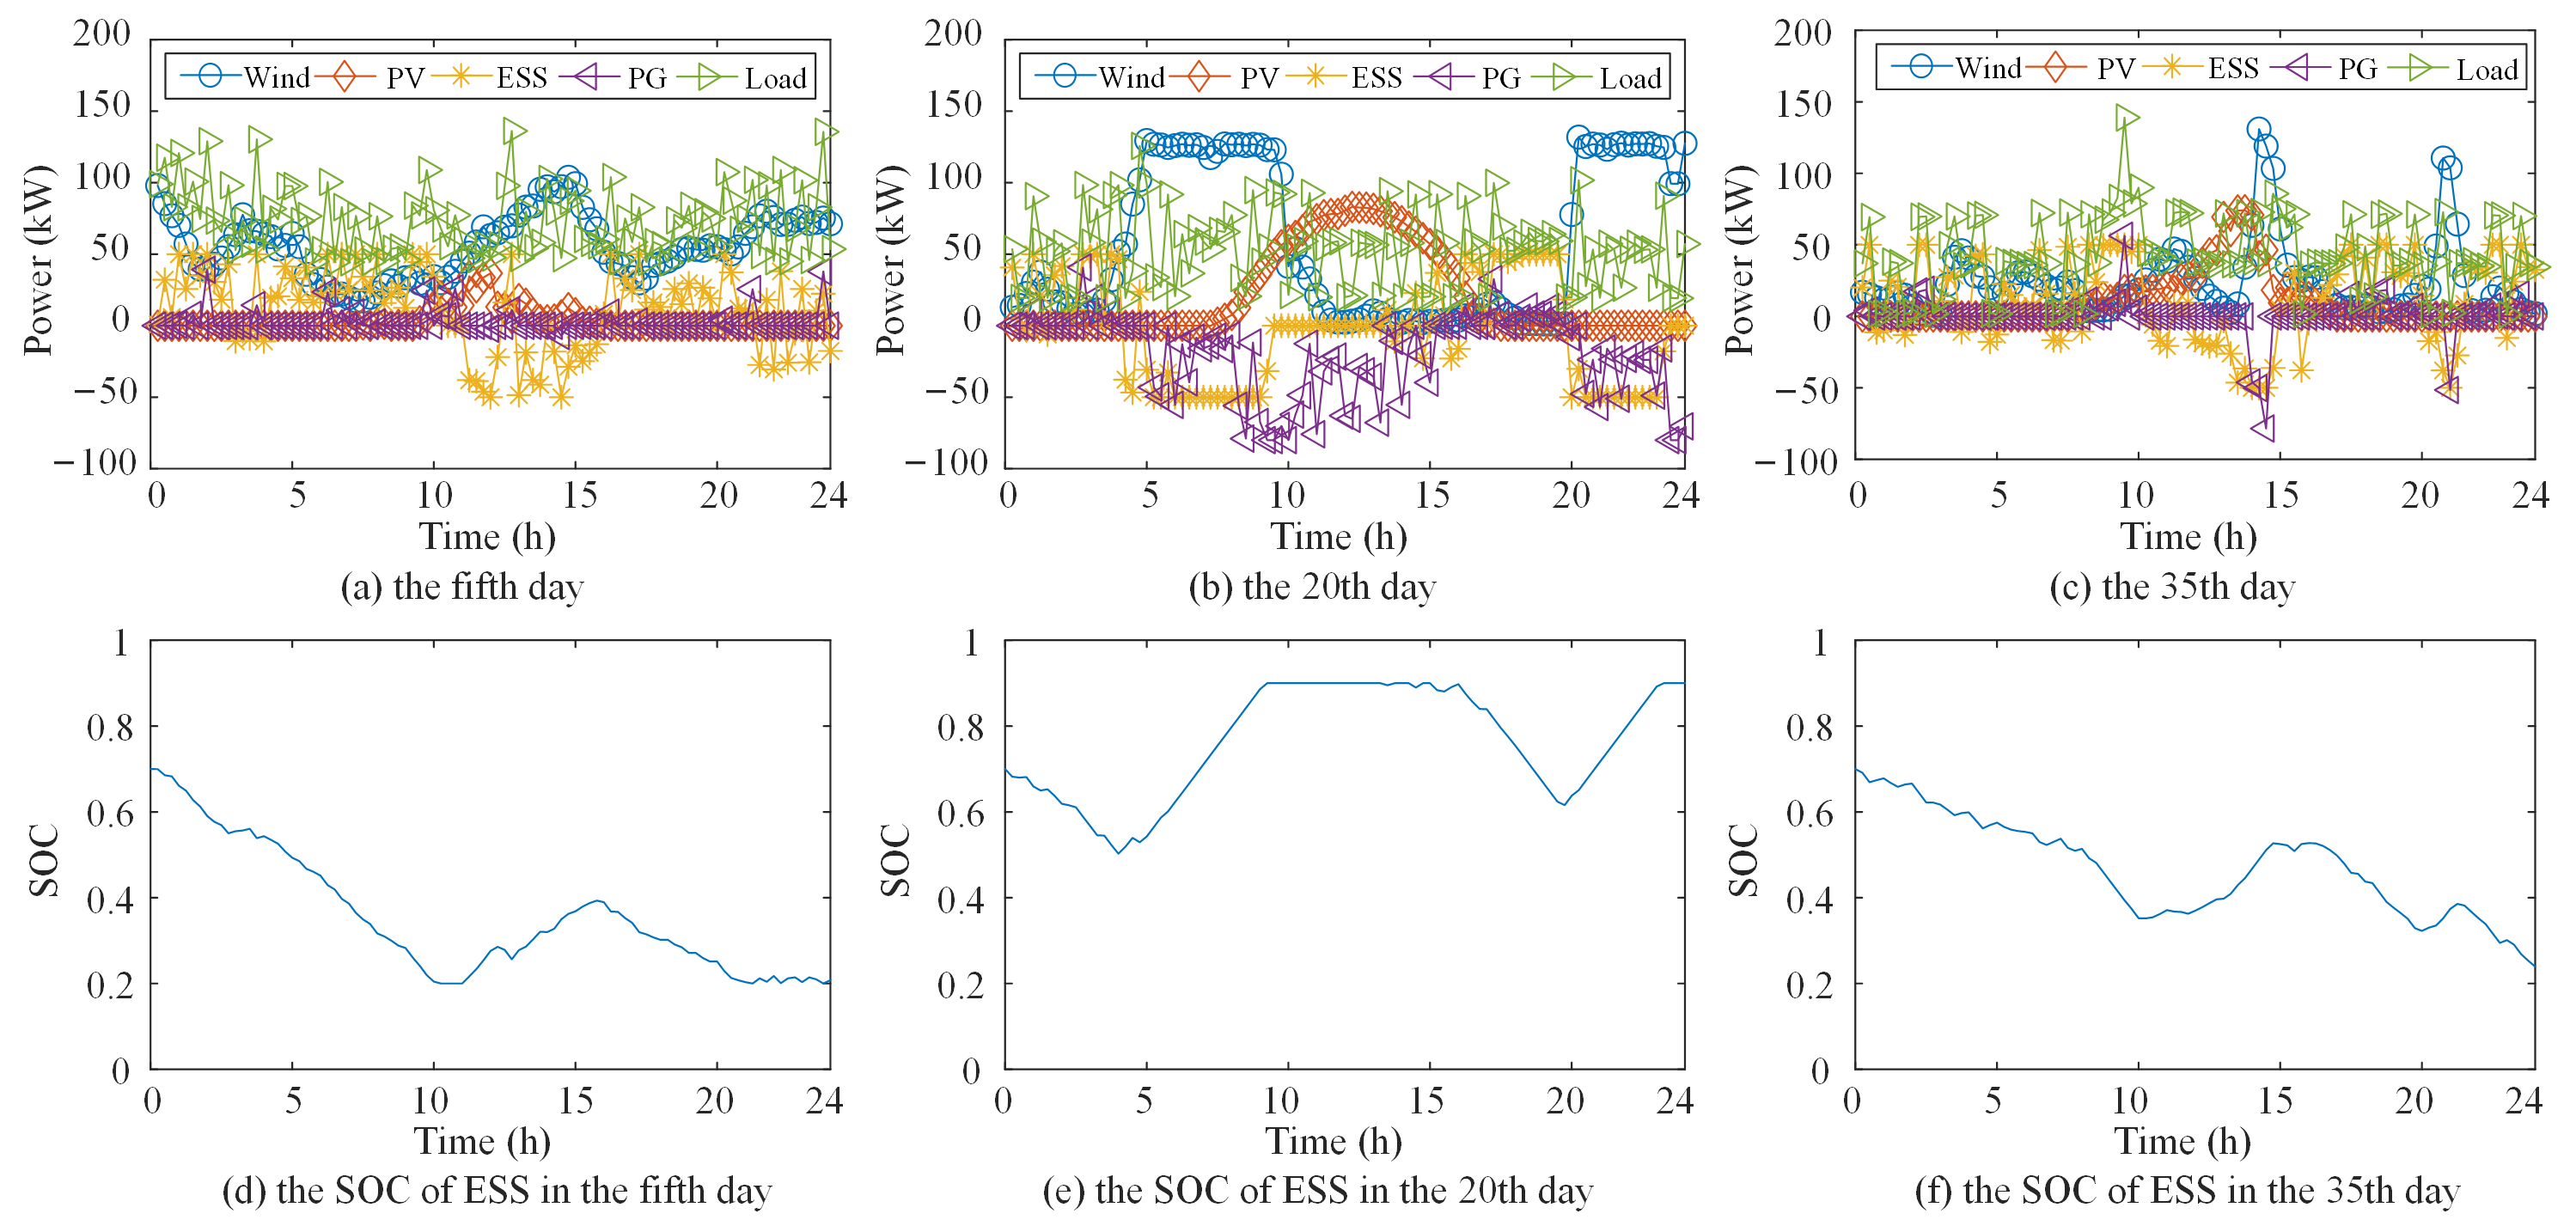
In this case, broiler farming data from 22 February to 4 April 2025 are used to conduct energy management tests on typical days corresponding to the three growth stages. The test results of the proposed and the compared methods are shown in Figure 5 and Figure 6.
Figure 5.
Energy management results of the proposed method in spring.
Figure 6.
Energy management results of the compared method in spring.
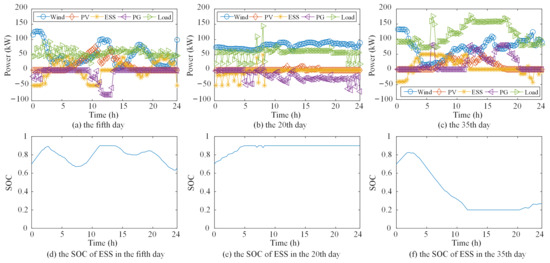
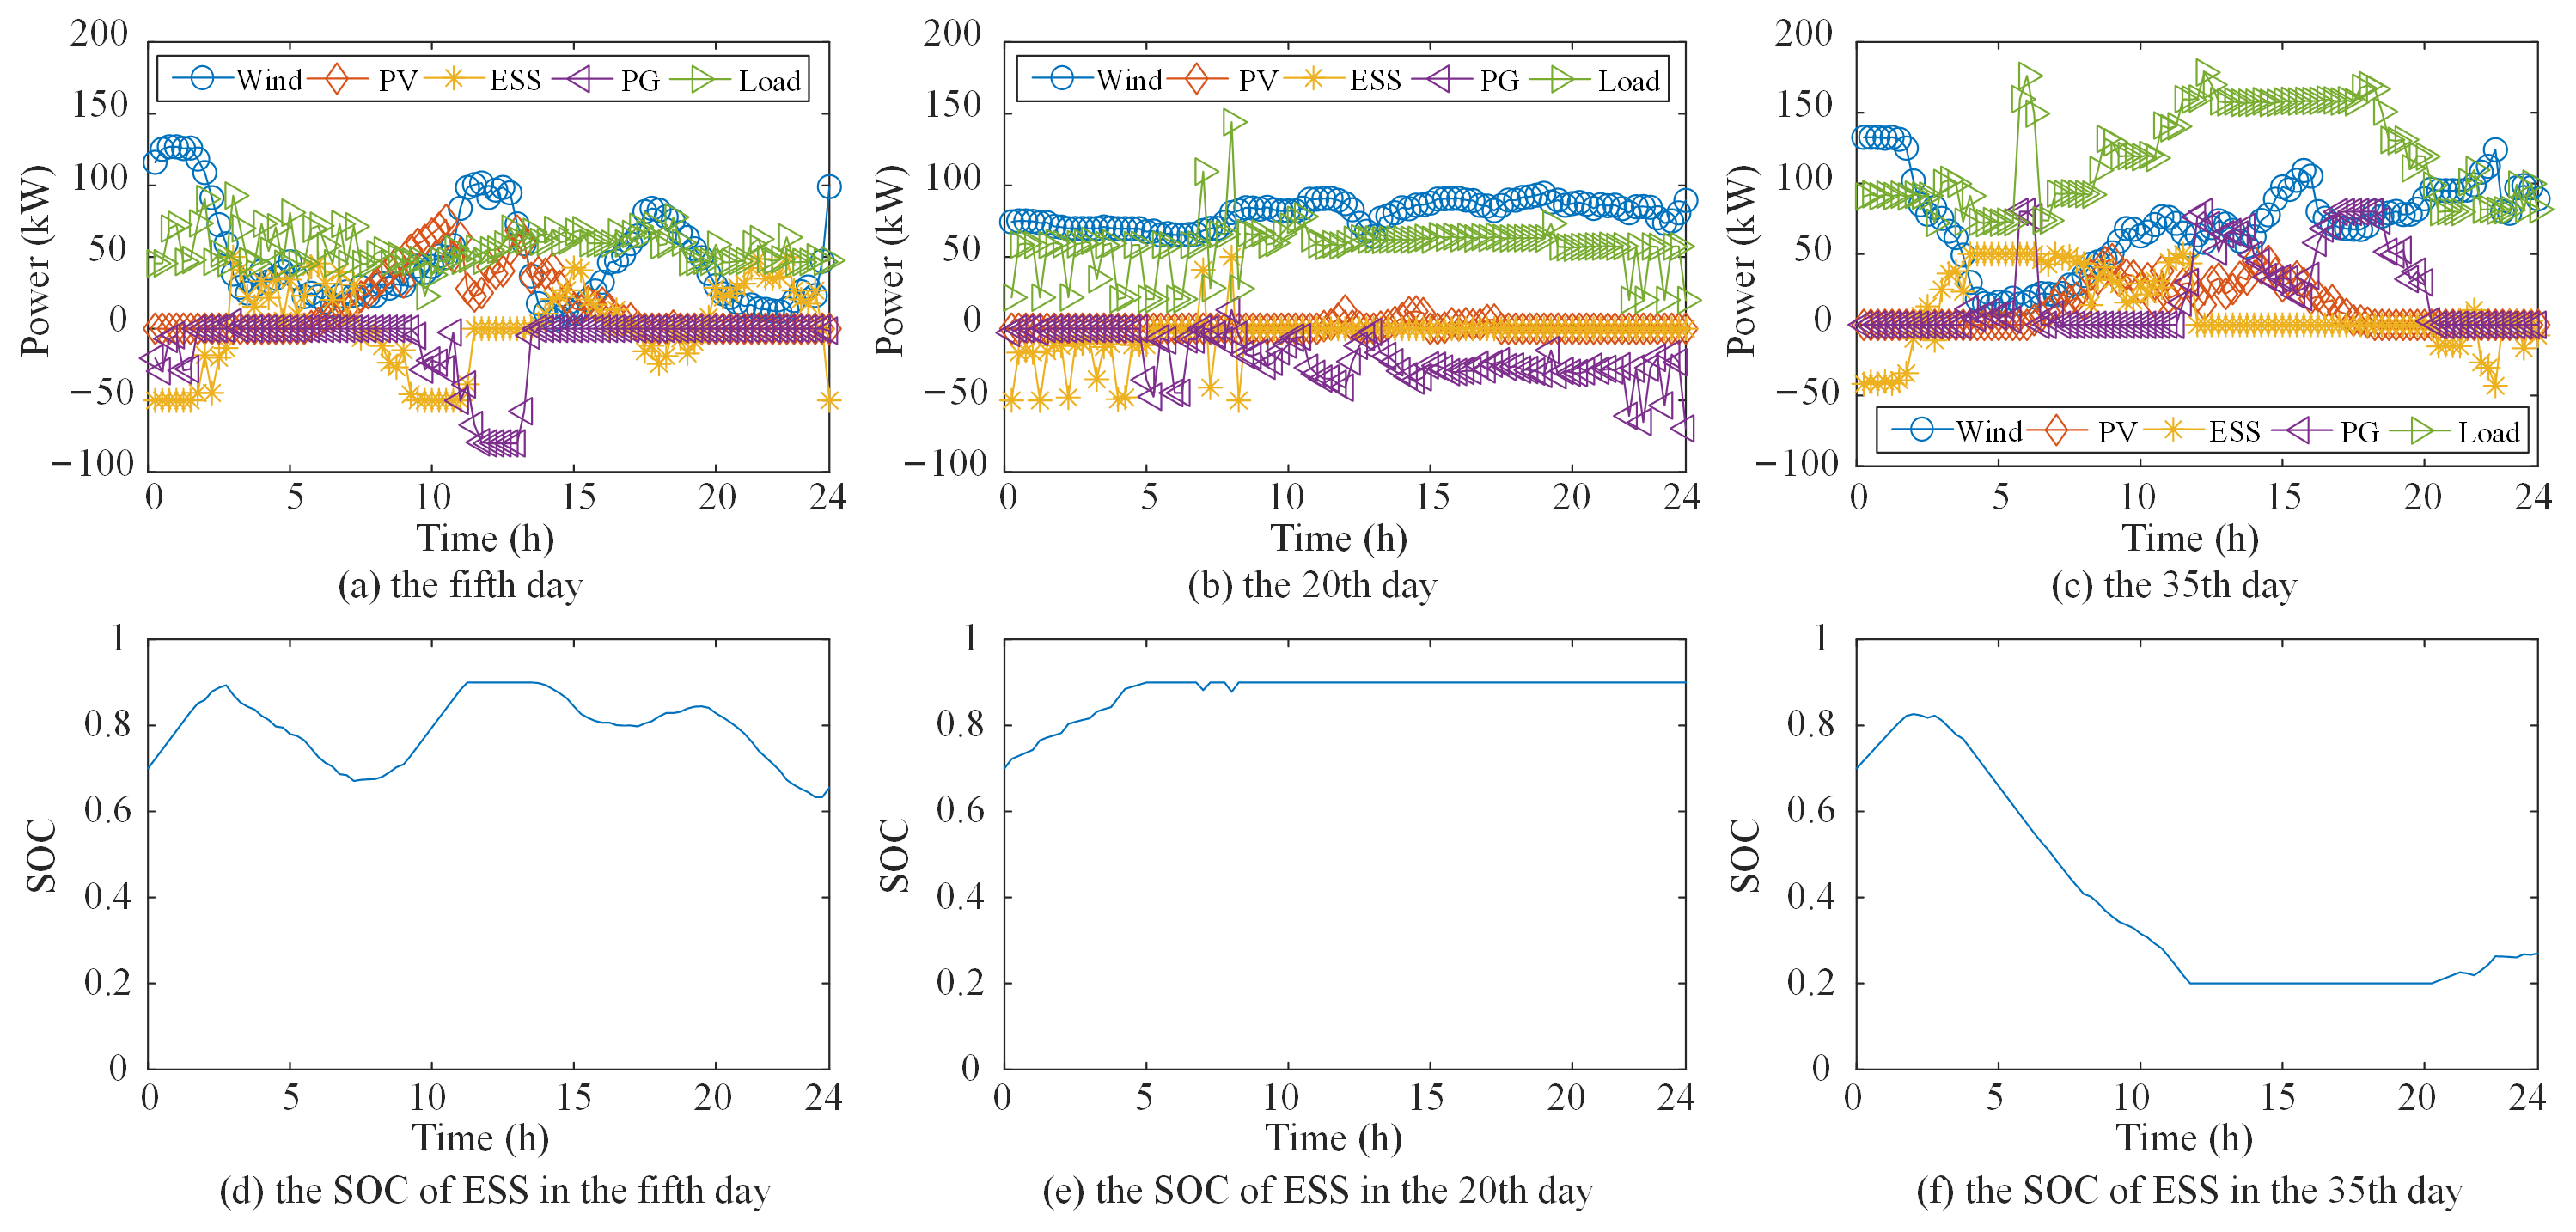
In spring, the ambient temperature is moderate with a large diurnal temperature difference. The broiler house load is high in the brooding period and low in the growing period, and rises in the finishing period according to the environmental control requirements of different breeding stages. The continuous heating demand during the brooding period pushes the peak load to 160 kW, while the temperature control demand drops to the full-cycle low of 50–80 kW in the growing period. The increased ventilation demand in the finishing period stabilizes the load in the range of 80–100 kW. As shown in Figure 5, the energy management strategy in this scenario is centered on the priority local consumption of wind and solar energy. During the early morning hours (00:00–08:00), the electricity price falls to its valley level; accordingly, the proposed method tends to purchase more power from the utility grid to serve the load and charge the ESS at a low cost. In contrast, during the morning peak period and the evening peak period, the electricity price is relatively high, so the grid purchase is correspondingly reduced, and the load is preferentially supplied by the ESS and the renewable generation. In contrast, the ESS in the compared method is not well coordinated with the grid. Its SOC is rather flat, and the charging/discharging is less active, so the ESS fails to charge in time during valley-price periods and cannot discharge effectively during peak periods, resulting in more pronounced fluctuations in the grid power profile.
5.2.2. Case 2: Energy Management in Summer
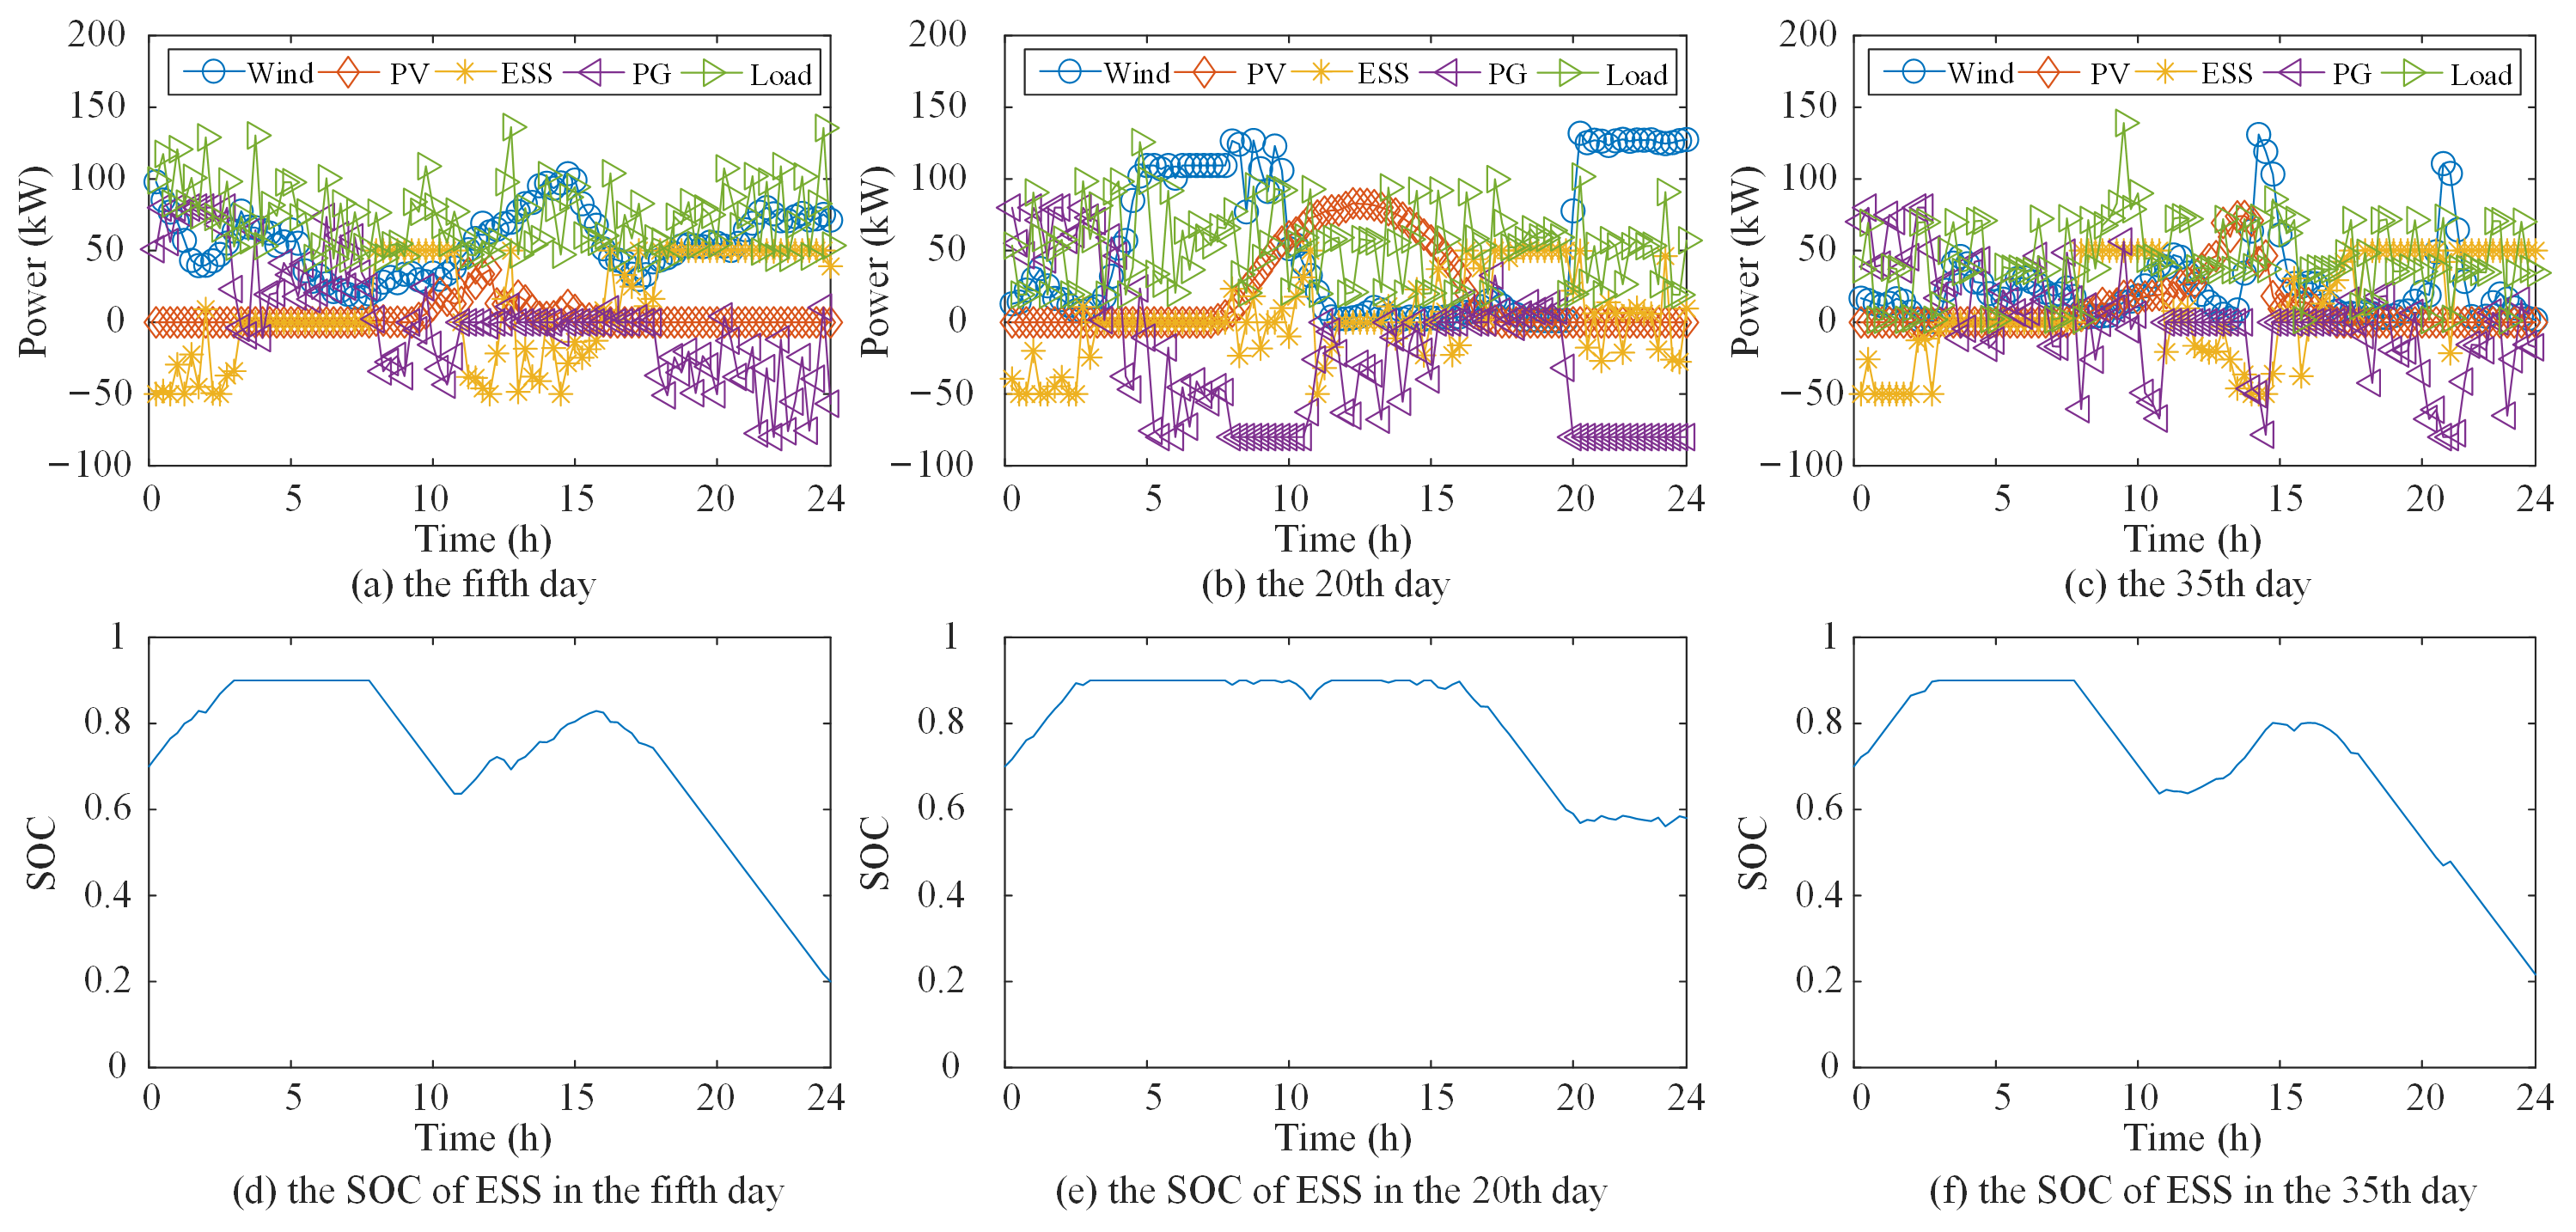
In this case, broiler farming data from 3 June to 14 July 2025 are used to conduct energy management tests on typical days corresponding to the three growth stages. The test results of the proposed and the compared methods are shown in Figure 7 and Figure 8.
Figure 7.
Energy management results of the proposed method in summer.
Figure 8.
Energy management results of the compared method in summer.
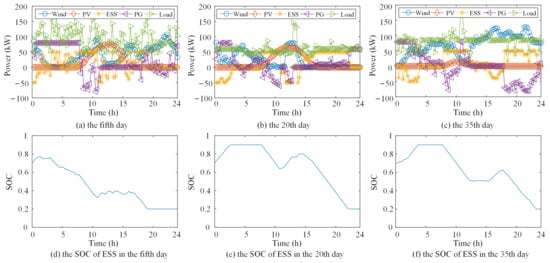
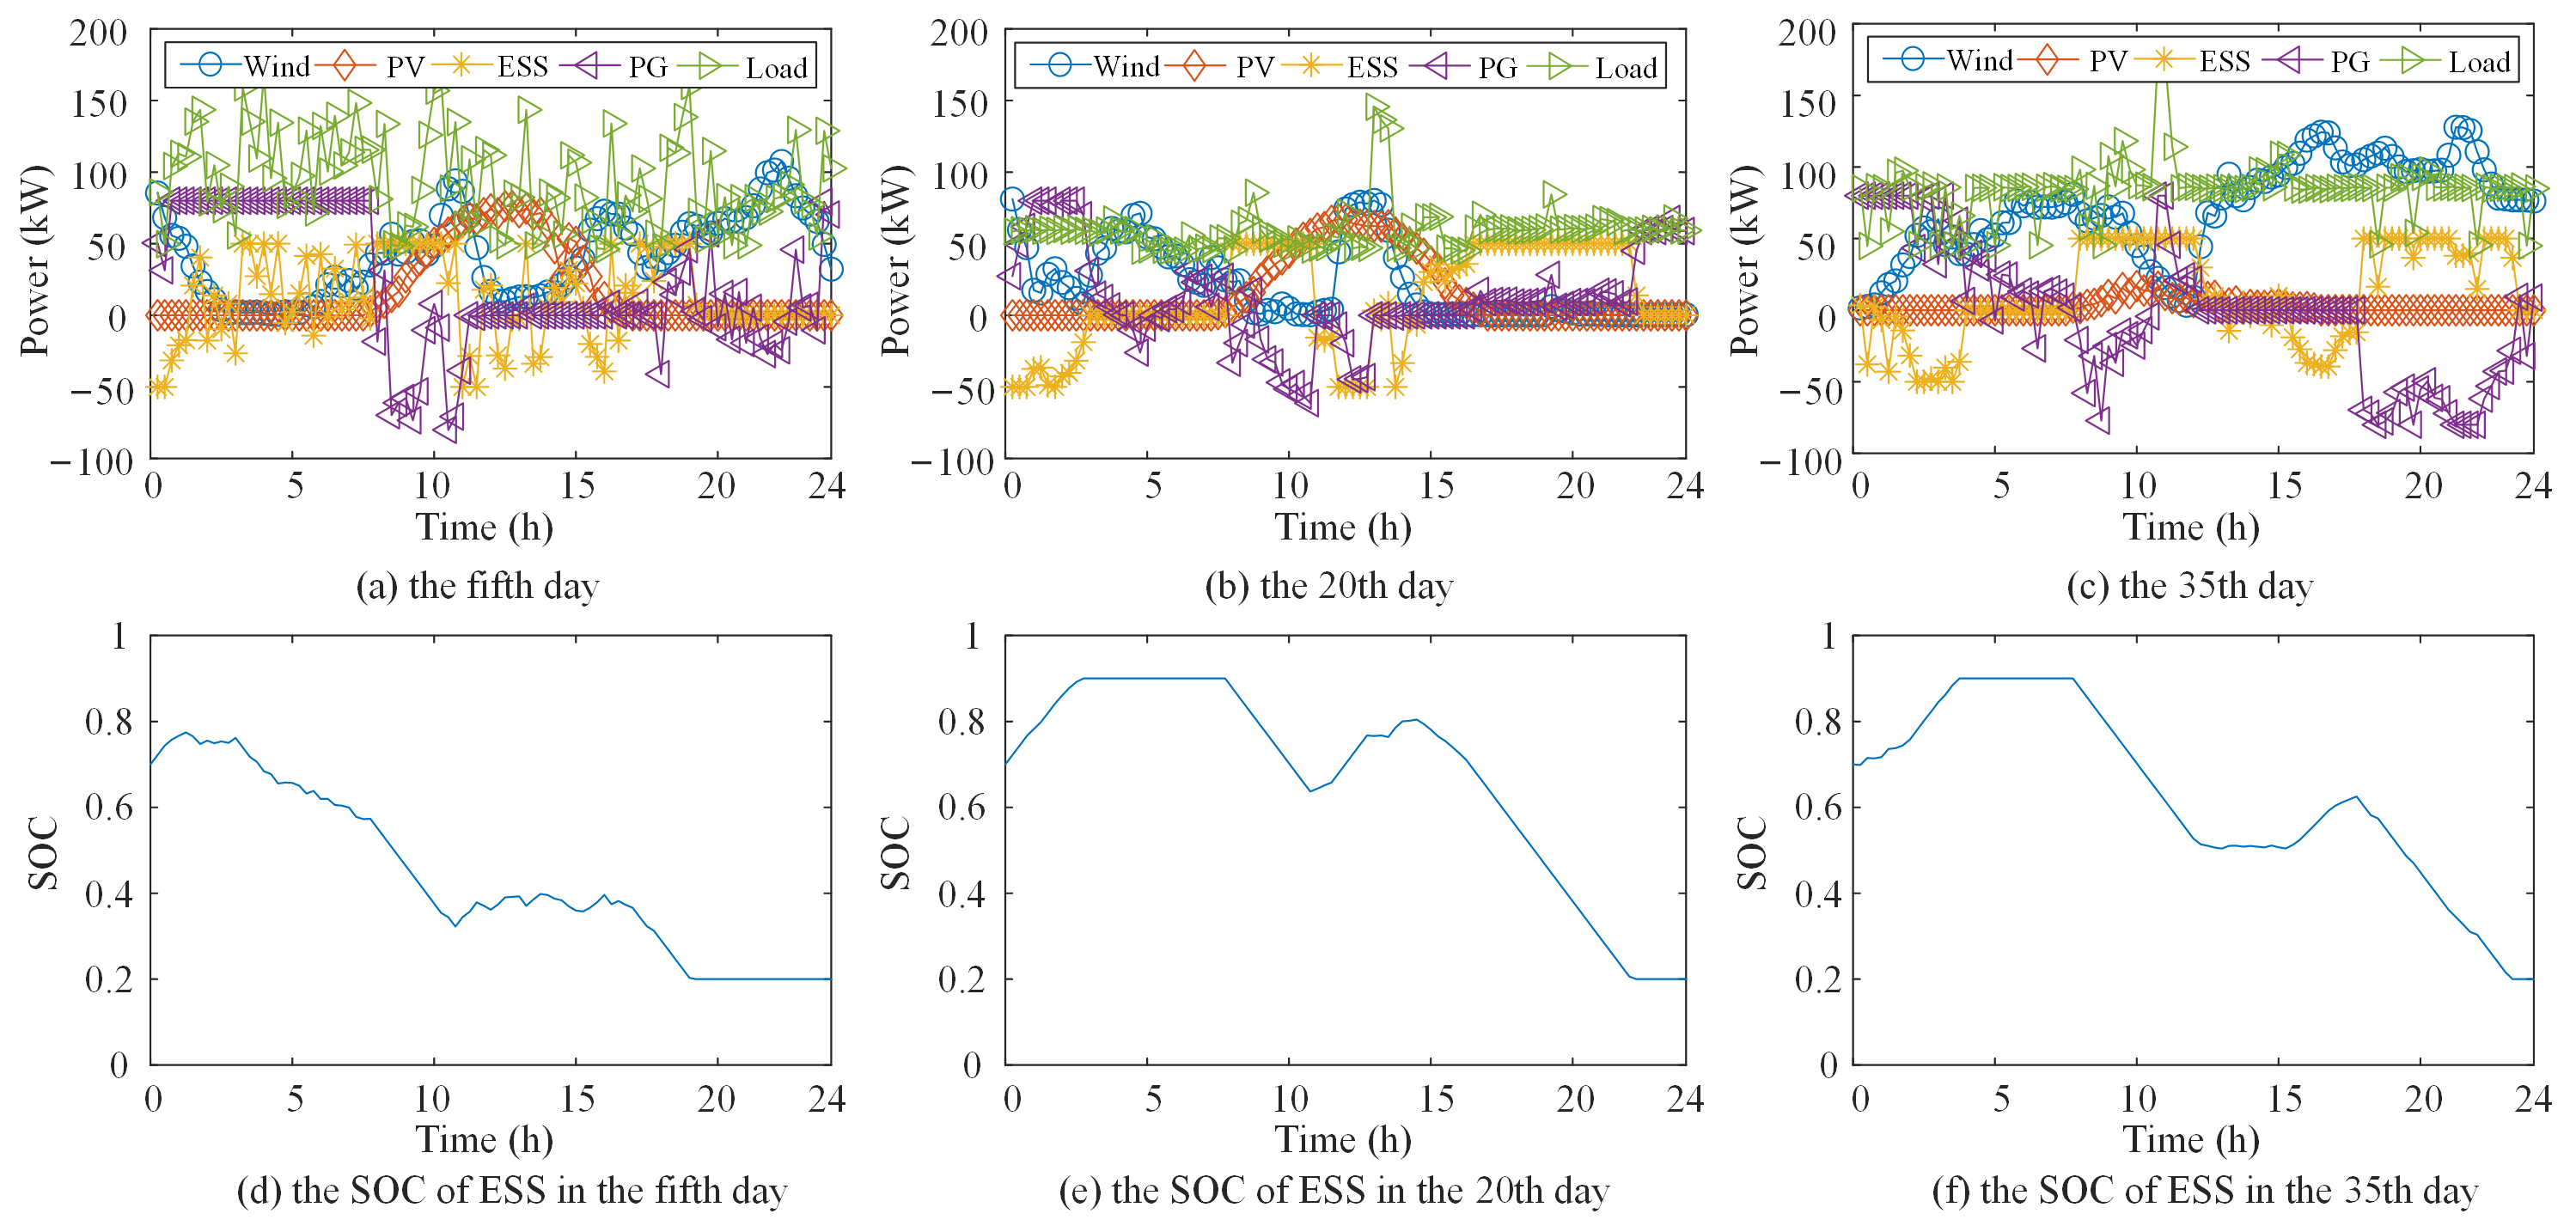
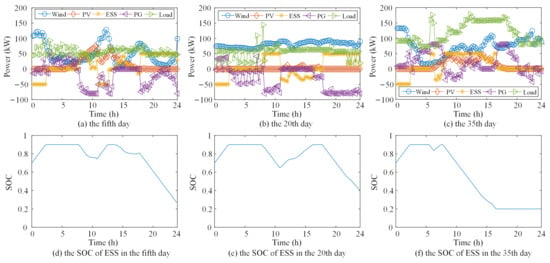
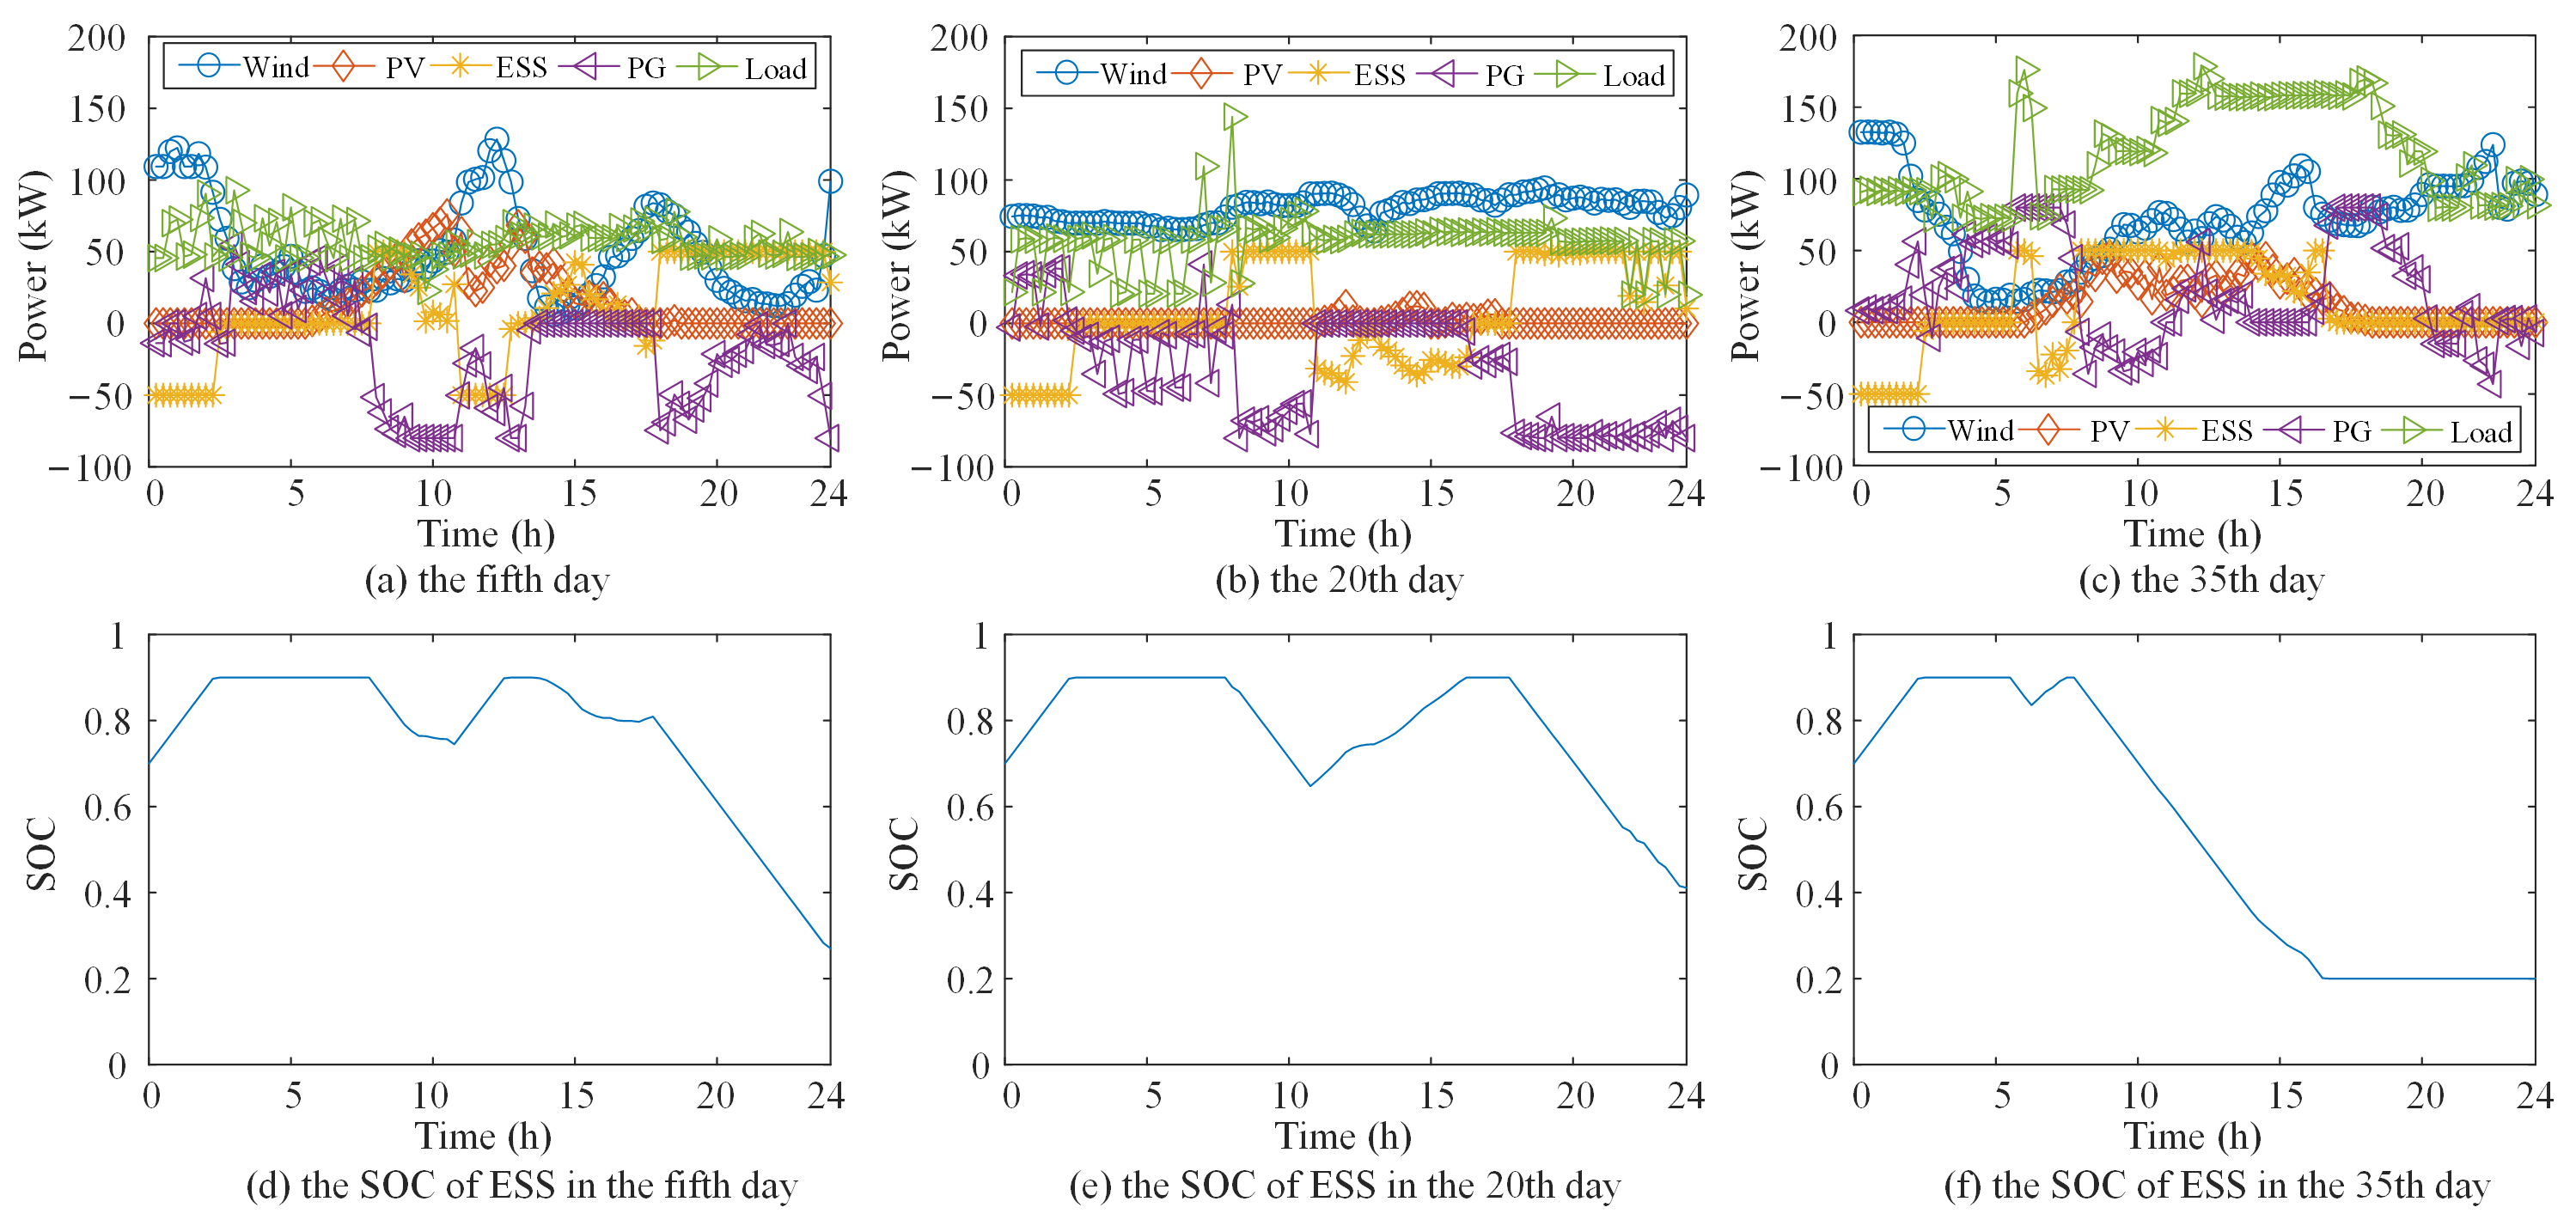
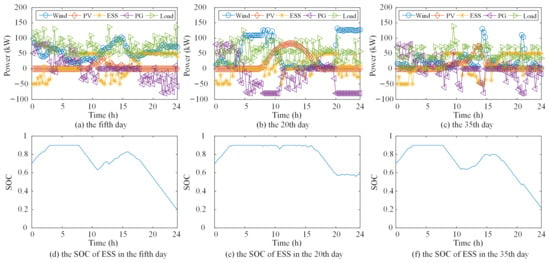
In summer, the ambient temperature is high with a small diurnal temperature difference. The core load is driven by ventilation demand, showing an overall “low in the early stage and high in the late stage” characteristic. The ambient temperature during the brooding period meets the requirements of chicks without additional heating demand, and the load stabilizes at around 60 kW. In the growing period, there is no temperature control pressure, and the load maintains the full-cycle low of 20–70 kW. In the finishing period, high temperature superimposed with concentrated heat production of broilers leads to an explosive cooling demand, pushing the peak load to exceed 180 kW.
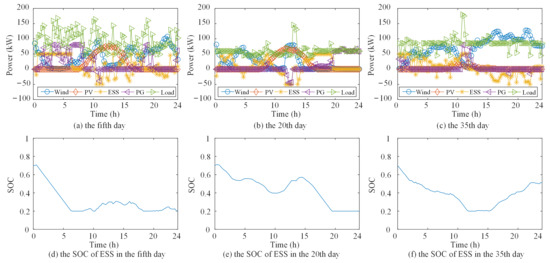
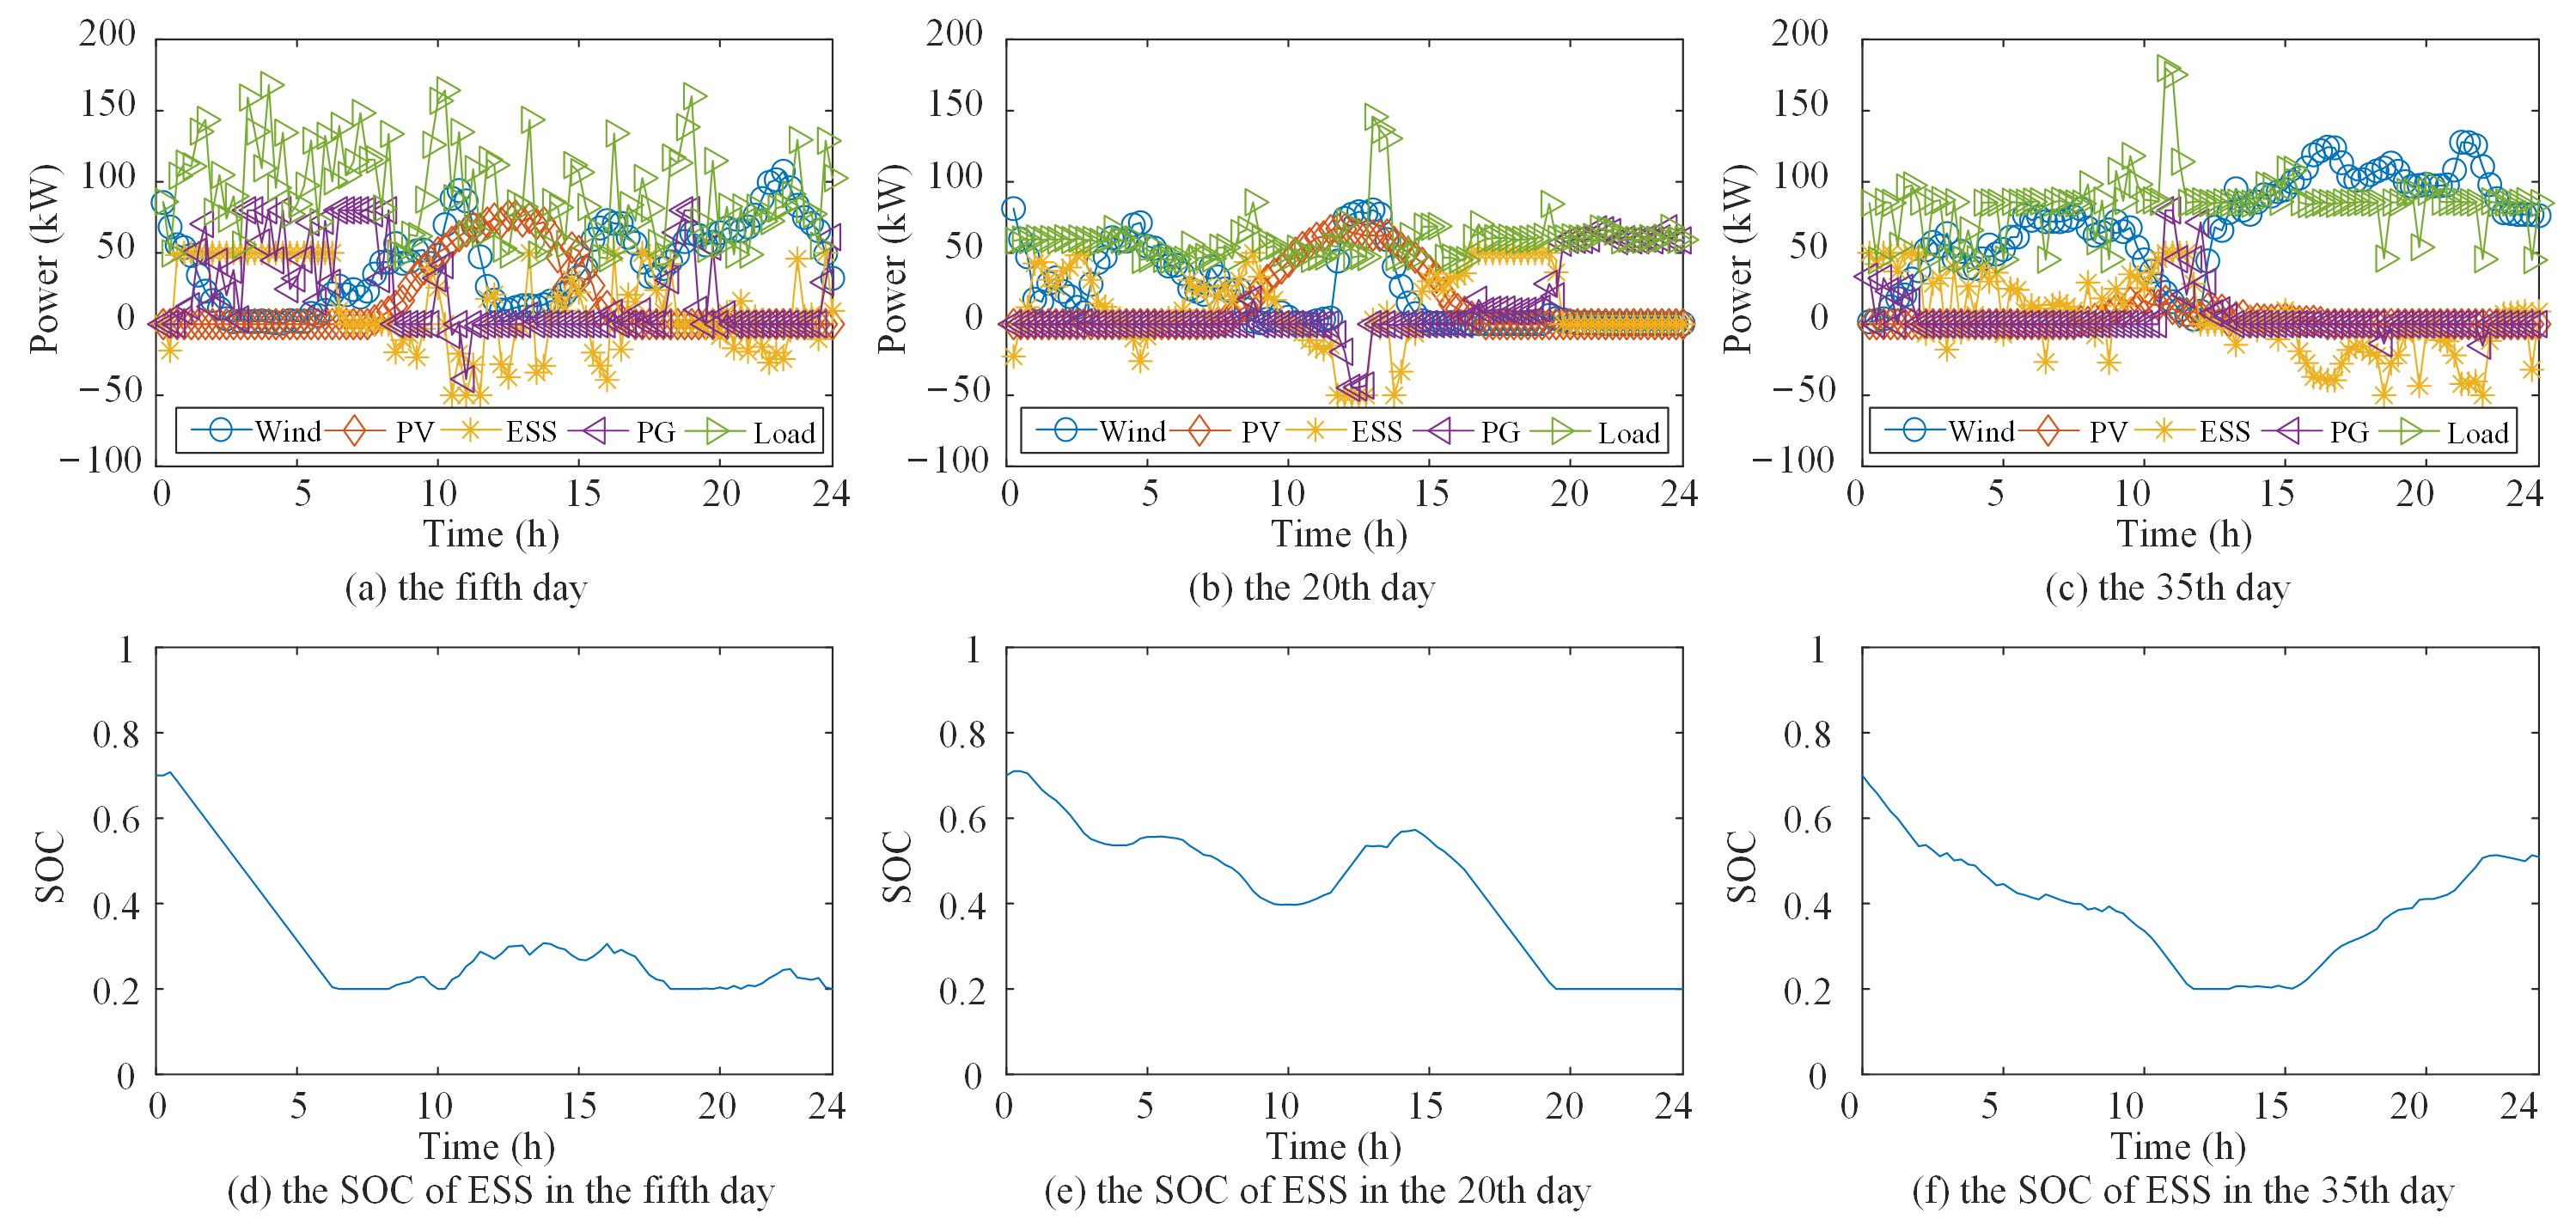
In Figure 7, guided by the time-of-use electricity price, the ESS is dispatched in a forward-looking manner. It is charged during the valley-price hours and discharged during the peak-price hours, thereby shaving the load peaks, filling the valleys, and reducing the electricity purchase cost. Moreover, the SOC of the ESS is maintained within the preset limits throughout the simulation horizon with a regular charging/discharging rhythm, which is beneficial to the safety and service life of the battery. However, as shown in Figure 8, the dispatch of the ESS with the compared method is not well coordinated with the price signals and the load profile. The SOC stays at a high level on the 20th day without discharging during the peak-price periods, while on the 35th day it drops to a low level in the afternoon, leaving insufficient energy for the evening peak. As a result, the ESS fails to shave the load peaks effectively, and the grid power profile exhibits more pronounced fluctuations.
5.2.3. Case 3: Energy Management in Autumn
In this case, broiler farming data from 16 September to 25 October 2025 are used to conduct energy management tests on typical days corresponding to the three growth stages. The test results of the proposed method and the compared method are shown in Figure 9 and Figure 10, respectively.
Figure 9.
Energy management results of the proposed method in autumn.
Figure 10.
Energy management results of the compared method in autumn.
Autumn is the transition phase between summer and winter, with the ambient temperature gradually decreasing and the diurnal temperature difference increasing significantly. The load is alternately driven by ventilation and heating demands. Intermittent heating during the brooding period results in a load fluctuation amplitude of 100 kW. The load stabilizes at the full-cycle low of 50–70 kW in the growing period. The alternating ventilation and heating in the finishing period lead to a load peak–valley difference of 120 kW. The energy management strategy in this scenario suppresses the strong fluctuation characteristics of wind power through flexible charging and discharging of energy storage, adapting to the complex working conditions of the transition season.
Similar results are obtained in the autumn scenario, as shown in Figure 9 and Figure 10. Guided by the TOU electricity price, the proposed method charges the ESS during the valley-price hours and discharges it during the peak-price hours, keeping the SOC within the preset limits and effectively smoothing the grid power profile. In contrast, the ESS in the compared method is poorly coordinated with the price signals. Its SOC remains at a high level on the 20th day without discharging during the peak-price periods, while on the 35th day it drops to a low level at an early stage, leaving insufficient energy for the evening peak. As a result, the compared method fails to shave the load peaks effectively, and the grid power fluctuates more significantly.
5.2.4. Case 4: Energy Management in Winter
In this case, broiler farming data from 8 December 2025 to 19 January 2026 are used to conduct energy management tests on typical days corresponding to the three growth stages. The test results of the proposed method and the compared method are shown in Figure 11 and Figure 12, respectively.
Figure 11.
Energy management results of the proposed method in winter.
Figure 12.
Energy management results of the compared method in winter.
In winter, the ambient temperature remains persistently low throughout the day. The full-cycle load is dominated by continuous heating demand, with the base load level second only to that in summer. Continuous heating during the brooding period pushes the peak load to 150 kW. The load remains at the full-cycle low of 50–120 kW in the growing period but with an elevated base load. The alternating ventilation and heating in the finishing period keep the load in the range of 80–150 kW for a long time. The energy management strategy in this scenario is centered on energy storage, standby peak regulation, and power deficit compensation, ensuring energy supply reliability under low-temperature conditions and prioritizing full consumption of the limited wind and solar output.
The winter scenario further confirms the effectiveness of the proposed strategy (Figure 11 and Figure 12). For the proposed method, the ESS is refilled to a high SOC level during the low-tariff morning hours on the 20th and 35th days and is then gradually released to support the load, with the SOC driven down to its lower bound by the end of each day, a sign that the stored energy is fully utilized while respecting the operating limits. In the compared method, however, the ESS is hardly recharged. The SOC merely declines from its initial value of about 0.7 and is depleted well before the evening load peak, forcing the grid to compensate for the power shortage and leaving the grid power profile clearly less stable.
5.2.5. Quantitative Analysis
To further verify the effectiveness of the proposed method, the dispatch performance of the proposed method and the comparison method in the four seasonal scenarios is quantitatively evaluated in terms of the total operating cost, the runtime, and the peak–valley difference reduction, as summarized in Table 7. Here, the peak–valley difference reduction is calculated with respect to the rule-based dispatch strategy, i.e., the reduction in the peak–valley difference in the grid-connected power profile achieved by the proposed method relative to that of the rule-based strategy.
Table 7.
Quantitative analysis of the dispatch results.
As shown in Table 7, the proposed method achieves better economic performance under seasonal operating conditions. Its total operating cost is lower than that of the rule-based benchmark method, which reduces the comprehensive operating expense of the poultry house microgrid. In terms of computational efficiency, the total runtime of the proposed method for each typical day is approximately 2.2 s, slower than the 0.009 s of the rule-based strategy. Nevertheless, the single-dispatch runtime of the proposed method is approximately 23 ms. Moreover, the communication delay of typical field-level EMS networks is on the order of milliseconds to seconds, which is negligible compared with the scheduling interval, and the sampling frequency of the field measurements matches the dispatch cycle. Therefore, the proposed method is fully compatible with the data acquisition and real-time control requirements of practical EMS hardware, and its computational burden is acceptable for real-time online dispatch.
5.3. Sensitivity Analysis of the ESS Capacity
This subsection presents a sensitivity analysis on the capacity to verify the robustness of the dispatch results. Continuous dispatch tests over the complete rearing cycle of each season (four cycles in total) are conducted under different ESS capacities, and the results are summarized in Table 8.
Table 8.
Sensitivity of the dispatch results to the ESS capacity.
As shown in Table 8, the total operating cost decreases monotonically from 9.6225 × 10⁴ to 9.0919 × 10⁴ as the ESS capacity increases from 0 to 700 kWh, corresponding to an overall reduction of 5.5% compared with the case without ESS. The charging and discharging energies increase from 6.6557 × 10³ and 6.7032 × 10³ kWh at 100 kWh to 1.3630 × 10⁴ and 1.3962 × 10⁴ kWh at 700 kWh, but the incremental throughput keeps decreasing with the capacity. This indicates that the daily energy exchange of the ESS is mainly constrained by its power rating rather than the energy capacity. Accordingly, the equivalent full cycles decrease from 0.42 to 0.12 per day as the capacity grows, meaning that a larger ESS operates at a significantly lower utilization level and most of the additional capacity remains idle. From the economic perspective, given that the marginal operating cost saving is far below the annualized investment cost of enlarging the capacity, an oversized ESS is not cost-effective. These results confirm that the adopted ESS capacity is reasonable and that the main conclusions of this paper are robust with respect to the capacity setting.
5.4. Sensitivity Analysis of Forecast Errors
To evaluate the robustness of the proposed strategy against forecasting errors, random perturbations of ±1%, ±3%, and ±5% are applied to the load, PV, and wind power data to simulate the forecasting errors, and the dispatch is re-optimized under each perturbation level based on case 1. The influence of the forecasting errors is evaluated by three indicators: the deficit rate for supply reliability, the equivalent full cycles for the ESS utilization, and the curtailment rate for the renewable accommodation. The results are summarized in Table 9.
Table 9.
Sensitivity of the dispatch results to the forecasting errors.
As shown in Table 9, the equivalent full cycles of the ESS remain almost unchanged under all error levels, indicating that the charging/discharging pattern of the proposed strategy is barely affected by the forecast uncertainties. The deficit rate increases with the error level but remains below 4% under the ±5% errors, which is within the commonly accepted reliability range of microgrids. Note that a small deficit also exists in the perfect-forecast case, 0.79% and 0.37% on days 5 and 35, which arises from the line capacity constraint. The curtailment rate decreases slightly with the error level, because an overestimated renewable forecast leads to a higher renewable commitment and consequently a higher deficit risk, while the renewable utilization is improved. Overall, the proposed strategy is robust in terms of the dispatch behavior and the renewable accommodation, and the forecast errors mainly influence the supply reliability, which remains within the acceptable range.
5.5. Results and Discussion
Through the above energy management tests, the effectiveness of the proposed method in the broiler house energy system has been verified, providing practical reference for the rational planning, scheduling, and control of broiler house energy systems. Firstly, broiler breeding is affected by external meteorological conditions, breeding cycles, and other factors, and the electricity load exhibits significant seasonal and phased differences. Heating during the brooding period in winter and cooling and ventilation during the fattening period in summer both form obvious electricity peaks, while the load distribution in spring and autumn is relatively balanced, which provides a clear basis for the time-of-use optimal scheduling of energy systems. Secondly, for the configuration of the energy system, clarifying the load characteristics of different seasons and different breeding stages can support the accurate configuration of PV, energy storage, and power distribution facilities. For the electricity peaks in the winter brooding period and summer fattening period, the energy storage capacity and PV installed capacity ratio can be optimized pertinently, avoiding equipment idleness caused by blind expansion based on extreme peak loads, while improving the local consumption ratio of renewable energy and reducing the overall system configuration cost.
Nevertheless, this study still has several limitations. First, since each season corresponds to a single production batch in one house, the seasonal effect and the batch-to-batch effect are inherently confounded in the present analysis, although all batches were reared in the same house under identical management protocols. In addition, the proposed dispatch is performed in a deterministic day-ahead manner assuming perfect forecasts of the load, PV, and wind power, although the sensitivity analysis in Section 5.4 shows that the strategy remains robust under the tested forecast errors of ±5%. To address these limitations, future work will collect multi-year, multi-batch monitoring data and adopt statistical decomposition methods to quantify the two effects separately, and will further incorporate stochastic or robust optimization methods into the energy management framework to explicitly handle the multi-source uncertainties of the load and the renewable generation.
6. Conclusions
Based on year-round field monitoring data, the load characteristics of broiler houses are analyzed from the dual dimensions of season and breeding cycle, revealing the coupling effect between the seasonal climate and the breeding growth stages. For the microgrid system, a comprehensive operating cost objective considering the renewable operation and maintenance cost, the time-of-use power trading cost, and the carbon emission cost is constructed and solved by the IDOA, in which adaptive weight, opposition-based learning, and dynamic mutation strategies are embedded to improve the convergence speed and optimization accuracy, as verified on the CEC2017 benchmark functions. Simulation tests covering the four seasonal scenarios demonstrate that the proposed energy management method can accurately perceive the load characteristics in different seasons and adaptively adjust the scheduling strategy: compared with the rule-based dispatch, it lowers the daily operating cost and effectively smooths the grid power profile, while the SOC of the ESS is maintained within the preset limits throughout the simulation horizon. Sensitivity analyses on the ESS capacity and the load and renewable forecasting errors further verify the robustness of the dispatch results, and the dispatch performance remains within the acceptable reliability range under the ±5% forecast errors. The single-dispatch runtime of about 23 ms amply satisfies the real-time requirement of field implementation. This study provides a referable practical basis and technical solutions for the engineering planning, design, and on-site energy management of large-scale broiler house microgrids in North China. Future work will consider multi-source uncertainties and animal-welfare-oriented reliability constraints to further improve and validate the proposed energy management strategy.
Author Contributions
Conceptualization, H.Y. and Z.W.; methodology, K.Z. and F.Z.; software, Z.D. and L.G.; validation, M.M., L.L. and Z.X.; formal analysis, H.Y. and Z.W.; investigation, K.Z.; resources, H.Y.; data curation, Z.X.; writing—original draft preparation, K.Z. and F.Z.; writing—review and editing, Z.X. and Z.D.; visualization, L.G.; supervision, L.L. and M.M.; project administration, L.L.; funding acquisition, H.Y. All authors have read and agreed to the published version of the manuscript.
Funding
This research was funded by [Science and Technology Project of State Grid Hebei Electric Power Co., Ltd.] grant number [kj2024-010].
Data Availability Statement
The datasets generated and analyzed during the current study are available from the corresponding author upon reasonable request.
Conflicts of Interest
The authors declare that this study received funding from the Science and Technology Project of State Grid Hebei Electric Power Co., Ltd. The funder was not involved in the study design, collection, analysis, interpretation of data, the writing of this article, or the decision to submit it for publication.
References
- Brown, P.; Göl, M. Bayesian probabilistic photovoltaic power forecasting and stochastic model-predictive control for an agricultural microgrid. Sol. Energy 2026, 304, 114197. [Google Scholar] [CrossRef] [Scilit]
- Wu, Y.; Chen, R.; Lin, Z.; Chen, Y.; Chen, Z.; Chen, X.; Yuan, J. Day-ahead scheduling model for agricultural microgrid with pumped-storage hydro plants considering irrigation uncertainty. J. Energy Storage 2024, 95, 112468. [Google Scholar] [CrossRef] [Scilit]
- Achour, Y.; Ouammi, A.; Zejli, D. A predictive control strategy for optimal operation of a chicken coop integrated microgrid. Smart Agric. Technol. 2025, 12, 101239. [Google Scholar] [CrossRef] [Scilit]
- Li, L.; Li, M.; Yu, Y.; Jia, Y.; Qian, Z.; Xie, Z. Modeling and Regulation of Dynamic Temperature for Layer Houses Under Combined Positive- and Negative-Pressure Ventilation. Animals 2024, 14, 3055. [Google Scholar] [CrossRef] [Scilit] [PubMed]
- Tian, Z.; Zhang, Y.; Liu, M.; Ma, Y.; Liu, X.; Lu, H. Operation Strategy for High-penetration Aquaculture-Photovoltaic Distribution Station Areas Integrating Flexible Aquacultural Load and Energy Storage. Autom. Electr. Power Syst. 2026, 50, 193–208. (In Chinese) [Google Scholar]
- Pan, J. Performance Evaluation and Optimization of Renewable Energy Based Multi-Generation System in Intensive Pig Farm. Master’s Thesis, Changsha University of Science and Technology, Changsha, China, 2026. [Google Scholar]
- Du, L.; Yang, L.; Yang, C.; Hu, C.; Yu, C.; Qiu, M.; Liu, S.; Zhu, S.; Ye, X. Development and Validation of an Energy Consumption Model for Animal Houses Achieving Precision Livestock Farming. Animals 2022, 12, 2580. [Google Scholar] [CrossRef] [Scilit] [PubMed]
- Costantino, A.; Comba, L.; Cornale, P.; Fabrizio, E. Energy impact of climate control in pig farming: Dynamic simulation and experimental validation. Appl. Energy 2022, 309, 118457. [Google Scholar] [CrossRef] [Scilit]
- Zhang, Z.; Zhou, Z.; Ji, H.; Xu, Y.; Teng, G. Energy consumption analysis of broiler houses in different regions based on Ecotect. J. China Agric. Univ. 2026, 31, 206–214. [Google Scholar]
- Garcia, C.A.P.; Tassinari, P.; Torreggiani, D.; Bovo, M. Predictive Modeling of Energy Consumption for Cooling Ventilation in Livestock Buildings: A Machine Learning Approach. Energies 2025, 18, 633. [Google Scholar] [CrossRef] [Scilit]
- Augustyn, G.; Mikulik, J.; Rumin, R.; Szyba, M. Energy Self-Sufficient Livestock Farm as the Example of Agricultural Hybrid Off-Grid System. Energies 2021, 14, 7041. [Google Scholar] [CrossRef] [Scilit]
- Tryhuba, A.; Hutsol, T.; Cesna, J.; Tryhuba, I.; Mudryk, K.; Francik, S.; Kukharets, S.; Mishchenko, I.; Oliinyk, R. Optimizing energy systems of livestock farms with computational intelligence for achieving energy autonomy. Sci. Rep. 2025, 15, 10777. [Google Scholar] [CrossRef] [Scilit] [PubMed]
- Hassanzadeh Fard, H.; Tooryan, F.; Dargahi, V. Standalone hybrid system energy management optimization for remote village considering methane production from livestock manure. Int. J. Hydrogen Energy 2023, 48, 10778–10796. [Google Scholar] [CrossRef] [Scilit]
- Ali, N.; Wahid, A.; Shaw, R.; Mason, K. A reinforcement learning approach to dairy farm battery management using Q-learning. J. Energy Storage 2024, 93, 112031. [Google Scholar] [CrossRef] [Scilit]
- Shah, M.I.A.; Wahid, A.; Barrett, E.; Mason, K. Peer-to-peer energy trading in dairy farms using multi-agent systems. Comput. Electr. Eng. 2024, 118, 109437. [Google Scholar] [CrossRef] [Scilit]
- Yang, F.; Fu, X.; Yang, Q.; Chu, Z. Decomposition strategy and attention-based long short-term memory network for multi-step ultra-short-term agricultural power load forecasting. Expert Syst. Appl. 2024, 238, 122226. [Google Scholar] [CrossRef] [Scilit]
- Wu, Z.; Zhang, B.; Dong, S. Considering vehicle-to-grid distributed event-triggered fixed-time energy management strategy for microgrids. IEEE Trans. Netw. Sci. Eng. 2025, 12, 4560–4574. [Google Scholar] [CrossRef] [Scilit]
- Ma, X.; Deveci, M.; Yan, J.; Liu, Y. Optimal capacity configuration of wind-photovoltaic-storage hybrid system: A study based on multi-objective optimization and sparrow search algorithm. J. Energy Storage 2024, 85, 110983. [Google Scholar] [CrossRef] [Scilit]
- Lang, Y.; Gao, Y. Dream optimization algorithm (DOA): A novel metaheuristic optimization algorithm inspired by human dreams and its applications to real-world engineering problems. Comput. Methods Appl. Mech. Eng. 2025, 436, 117718. [Google Scholar] [CrossRef] [Scilit]
- Chen, K.; Liu, X.; Zhao, Y. Research on Automatic Generation and Pumping Control Technology for Pumped Storage Power Station with Variable-speed Unit Based on Tent Particle Swarm Zebra Algorithm. J. China Inst. Water Resour. Hydropower Res. 2026, 1–2. [Google Scholar]
- Wang, D.; Jiang, H.; Zhang, A. Economic Dispatch Optimization Based on Covariance Matrix Adaptation Evolutionary Strategy with Dynamic Opposition Learning. J. Tianjin Univ. Sci. Technol. 2023, 38, 63–69. [Google Scholar]
- Long, W.; Xu, W.; Xu, M. Multi-strategy Improvement Northern Goshawk Optimization Algorithm and Applications. Sci. Technol. Eng. 2026, 26, 2037–2050. [Google Scholar]
- Liu, Y.; Sun, J.; Yu, H.; Wang, Y.; Zhou, X. An Improved Grey Wolf Optimizer Based on Differential Evolution and OTSU Algorithm. Appl. Sci. 2020, 10, 6343. [Google Scholar] [CrossRef] [Scilit]
- Wan, Y.; Mao, M.; Zhou, L.; Zhang, Q.; Xi, X.; Zheng, C. A Novel Nature-Inspired Maximum Power Point Tracking (MPPT) Controller Based on SSA-GWO Algorithm for Partially Shaded Photovoltaic Systems. Electronics 2019, 8, 680. [Google Scholar] [CrossRef] [Scilit]
- Zhang, Q.; Ling, J.; Chen, Z.; Wu, G.; Yu, Z.; Wang, Y.; Zhou, J.; Yao, J. Optimization of Laser-Induced Hybrid Hardening Process Based on Response Surface Methodology and WOA-BP Neural Network. Appl. Sci. 2025, 15, 1975. [Google Scholar] [CrossRef] [Scilit]
- Malik, S.; Kim, D. Prediction-Learning Algorithm for Efficient Energy Consumption in Smart Buildings Based on Particle Regeneration and Velocity Boost in Particle Swarm Optimization Neural Networks. Energies 2018, 11, 1289. [Google Scholar] [CrossRef] [Scilit]
- Zhang, B.; Wu, Z.Q. Distributed Fixed-Time Optimal Management of Microgrid Considering V2G and Carbon Emissions. J. Ind. Manag. Optim. 2025, 21, 2625–2641. [Google Scholar] [CrossRef] [Scilit]
- Li, S.; Gao, Z.; Qiao, J.; Wu, J. Capacity Optimization Configuration of Microgrid Based on Improved Sparrow Search Algorithm. Acta Energiae Solaris Sin. 2025, 46, 424–433. [Google Scholar] [CrossRef]

Disclaimer/Publisher’s Note: The statements, opinions and data contained in all publications are solely those of the individual author(s) and contributor(s) and not of MDPI and/or the editor(s). MDPI and/or the editor(s) disclaim responsibility for any injury to people or property resulting from any ideas, methods, instructions or products referred to in the content. |
© 2026 by the authors. Licensee MDPI, Basel, Switzerland. This article is an open access article distributed under the terms and conditions of the Creative Commons Attribution (CC BY) license.