


Abstract
Direct-print aligners are widely presented as the environmentally preferable alternative to thermoforming, but which part of the process governs the carbon released during manufacture has not been established. Four commercial printer–resin workflows were modelled: Graphy Tera Harz resin on a Uniz NBEE (A) and an Asiga MAX 2 (B), the LuxCreo iLux Pro as a closed chain (C), and Graphy resin on a DentaFab Sega Pro (D). Energy, material and throughput data came from the manufacturers. Production-phase CO2e per aligner was propagated through 10,000 Monte Carlo draws, with the resin emission factor sampled across its full published range (3.0–6.5 kg CO2e/kg) and the thermoformed comparator represented as a distribution. Mean footprints were 0.043, 0.036, 0.089 and 0.020 kg CO2e per aligner (95% uncertainty intervals were 0.032–0.056, 0.026–0.047, 0.077–0.101 and 0.016–0.025), against a thermoformed median of 0.190. Direct printing was the lower of the two in every paired iteration. Resin dominated, contributing 41–79% of the total; solvent added a further 41% in the one workflow using it, while electricity of all kinds accounted for 19–36%. Thermoforming would match direct printing only at series lengths of 45 to 202 aligners, far above the 14–30 of clinical practice; under the most unfavourable resin factor the margin narrowed but did not close. Material efficiency, not energy sourcing, is where reductions are available.
1. Introduction
Aligner treatment has become ordinary orthodontic work. What began as a tooth-positioning appliance [1] grew into a mainstream modality whose clinical accuracy and predictability are established [2,3,4,5]. Wider use has brought closer questioning of how the appliances themselves are manufactured. The conventional route still runs through single-use thermoplastic sheets shaped by vacuum or pressure [6]; alongside it, photopolymer resins processed additively account for a growing share of production. Interest in the environmental cost of healthcare, and of dentistry within it, has widened considerably [7,8,9,10,11], with clear aligners singled out as a particular concern [12]. A recent scoping review of orthodontic supply chains reached the same conclusion and identified the absence of life-cycle data as one of the principal barriers to sustainable practice in aligner therapy [13]. The bulk of that literature addresses plastic waste and what becomes of the appliance afterwards. Far fewer studies have put a number on the carbon released during manufacture in resin-based direct-print routes, and hardly any have asked which term inside that number carries the most weight.
Published life-cycle figures for thermoformed aligners place the production stage at approximately 4 kg CO2e for a treatment series [12,14]. Because case length varies, the number of appliances per series varies with it, so a per-aligner value can only be expressed as a range; the thermoformed comparator was therefore treated as a distribution rather than a point estimate. Direct printing dispenses with the thermoforming stage altogether, curing the appliance from resin within digital workflows that no longer require an analogue impression [15,16,17]. Fit, mechanical response and sensitivity to post-curing have all received attention [18,19,20], as has the wider adoption of additive manufacturing and photopolymers in dentistry and prosthodontics [21,22,23,24,25,26]. Direct printing is commonly described as the environmentally preferable option. That description has not been tested against primary manufacturer data spanning several printer–resin systems, nor has the balance between printer energy, post-processing energy, resin consumption and grid intensity been unpicked.
One reason is that generic energy values have frequently stood in for measured ones, and figures obtained that way can overstate the production burden by an order of magnitude. Across the additive-manufacturing literature the recurring finding is that how intensively a machine is used and how much electricity it consumes decide the result far more than the name of the process does [27,28,29,30,31]. A stereolithography case study makes the point: the isopropanol bath, rather than the print itself, accounted for more than half of the total carbon footprint [32], which implies that what matters may sit outside the printer. What the field lacks is a workable indicator: a per-appliance figure that a clinic or laboratory can compute from quantities it already knows, and that identifies which input to act on. Against that background, the production inventory was reconstructed from values confirmed by the manufacturers for four workflows in commercial service—three of them running one photopolymer resin across three separate printers, the fourth a closed end-to-end system—and a sensitivity analysis was used to ask what governs the footprint: the grid, the architecture of the workflow, or resin and post-processing.
2. Materials and Methods
2.1. Study Design and System Boundary
The study is a screening-level comparative carbon-footprint assessment carried out by simulation, resting on manufacturer-confirmed inputs and a probabilistic model. It follows the principles of ISO 14040 and ISO 14044 [33,34] in its treatment of system boundary, functional unit and uncertainty, but it is not a full life-cycle assessment: a single impact category is quantified and a single life-cycle stage is covered, and the study is therefore described throughout as a screening-level carbon-footprint assessment rather than an LCA [35]. Simulation was a deliberate choice: printing appliances for measurement alone would consume resin, solvent and electricity to no clinical end, which is difficult to justify in a study about sustainability.
Everything counted here belongs to the production stage—electricity for printing, the resin itself, electricity for washing, curing and drying, and the solvent—while transport, intraoral service life and disposal fall outside. The same boundary applies to thermoforming, which is also represented as a distribution, so that uncertainty is carried by both arms rather than one. Only global warming potential was quantified; water use, toxicity, resource depletion and the remaining impact categories lie outside the scope of this assessment and the conclusions are limited accordingly.
2.2. Workflows
Group A (multi-vendor). Graphy Tera Harz resin (Graphy Inc., Seoul, Republic of Korea) printed on a Uniz NBEE (UNIZ Technology, San Diego, CA, USA) and post-cured in the Tera Harz Cure unit (THC2, Graphy Inc., Seoul, Republic of Korea); surplus resin is removed by the Graphy Spinner, with no solvent bath.
Group B (multi-vendor). The identical Graphy resin, printed here on an Asiga MAX 2 (Asiga, Sydney, NSW, Australia) with heating disabled, then taken through the same Graphy post-processing sequence.
Group C (single-vendor, integrated). LuxCreo resin on the LuxCreo iLux Pro (LuxCreo, Belmont, CA, USA), followed by that manufacturer’s own iLuxWash, LuxOven Pro and iLuxCure Pro sequence, which does include an isopropanol bath.
Group D (multi-vendor). Graphy resin once more, printed on a DentaFab Sega Pro (3BFAB, İstanbul, Türkiye)—a FAST DLP machine operating at 385 nm—and post-processed exactly as in Groups A and B. Since one resin is shared by A, B and D across three machines, whatever separates them is attributable to the printer and the volume of material laid down, not to resin chemistry.
2.3. Inventory Data
Values for energy, material and throughput were supplied directly by the manufacturers during 2026 and checked against the official device documentation; they are gathered in Table 1. Two qualifications apply to these figures. First, the power values are rated or nameplate figures, or ranges quoted by the manufacturer for light-on and light-off operation, rather than metered consumption under clinical duty cycles; standby and idle draw are not included, and no independent measurement was performed. Where a manufacturer supplied a range spanning operating states, that range was carried into the model as a distribution rather than collapsed to a point. Second, resin consumption was supplied in different units by different manufacturers—millilitres per aligner for Groups A, B and D, and aligners per kilogram for Group C. All values are therefore reported on a common mass basis in Table 1, using manufacturer-stated resin densities (Graphy 1.061 g/mL, LuxCreo 1.04 g/mL).
Table 1.
Production inventory for the four workflows as confirmed by the manufacturers, with resin consumption expressed on a common mass basis and post-processing power and duration reported for every step. Power figures are rated values or manufacturer-quoted ranges spanning light-on and light-off operation, not metered consumption.
Emission factors. For the grid, 0.480 kg CO2e/kWh was used, the 2023 global average reported by Ember [36]. For isopropanol, 1.85 kg CO2e/kg was taken from a published stereolithography carbon-emissions case study [32]. The resin emission factor is the single most influential input in the model, and a resin-specific value is not available; published estimates for the photopolymer and comparable polymers span roughly 3.0 to 6.5 kg CO2e/kg. Rather than fix this factor at the 4.523 kg CO2e/kg three-polymer average reported in the same case study [32], it was therefore sampled as a triangular distribution T(3.0, 4.523, 6.5) covering that entire range, and the two bounds were additionally run as fixed scenarios (Section 3.6).
2.4. Probabilistic Model
Production-phase CO2e per aligner was computed as the sum of four terms—printing electricity, post-processing electricity, resin and solvent:
where E_print = P_print × t_build/n_build and E_post is the sum, over each post-processing step, of P_step × t_step/n_step, all expressed per aligner in kWh; m_resin and m_solvent are the masses consumed per aligner in kg; and f = 1/(1 − r) is the failed-print factor for a failure rate r. The factor f multiplies the printing electricity and the resin term only. A build that fails consumes resin and printing energy and is reprinted, but it does not pass through washing, curing and drying as a finished appliance would, so applying the same factor to post-processing would overstate the burden. A scenario in which f is applied to the post-processing term as well is reported in Section 3.6; it changes the totals by less than 1%. A single value of r is drawn per iteration and used for every term in that iteration, rather than re-drawn term by term.
CO2e = (E_print × f + E_post) × EF_grid + m_resin × f × GWP_resin + m_solvent × GWP_solvent
Propagating input uncertainty by Monte Carlo is long-established practice in life-cycle inventory work [37]; here the model was executed 10,000 times under a fixed seed in Python 3.12.3 with NumPy 2.4.4 and SciPy 1.17.1; figures were produced with Matplotlib 3.10.8. The model code was written with the assistance of Claude (Anthropic), and the manuscript text was language-edited with the same tool. The analytical approach is a standard Monte Carlo propagation of input uncertainty and involves no machine-learning method; the tool was used to write and check code, not to generate data, select inputs or interpret results. All inputs, calculations, figures and interpretations were verified by the authors. Ranges quoted by a manufacturer were sampled uniformly or triangularly across the range. Where a single figure was all that existed, a triangular distribution was centred on it and ±10% was allowed for measurement uncertainty. The failed-print rate was sampled as T(0, 0.02, 0.08). We were unable to find a published failure rate specific to photopolymer printing of dental appliances, and we do not claim one: the manufacturers we corresponded with report near-zero failure with experienced operators, and the 8% upper bound is a deliberately conservative ceiling rather than a measured value. Because the parameter is an assumption, its two bounds were run as fixed scenarios. Setting the rate to zero lowers the means by 3% to 5%; setting it to 8% raises them by 4% to 8% relative to a failure-free process (Section 3.6). The conclusions are unaffected across that whole span. The thermoformed comparator was constructed by sampling 4 kg CO2e per series (triangular, 3.5–4.5) and dividing by the aligners in a series (triangular, 14 to 30), which yields a distribution per aligner rather than one number; each direct-print draw was then paired with a thermoformed draw. Every distribution, its bounds and its source are listed in Supplementary Table S1, and the complete model code is provided as Supplementary File S2.
2.5. Crossover and Sensitivity
The weight of the grid was examined by solving, for each workflow, the emission factor at which it would meet the thermoformed median—its crossover point. Because a crossover far outside the achievable range of grid intensities is difficult to interpret clinically, a break-even series length was also computed: the number of aligners at which a thermoformed series, taken at its mean burden of 4 kg CO2e, would carry the same total footprint as the same number of directly printed appliances. Contribution analysis reports the mean share of the total attributable to printing electricity, post-processing electricity, resin and solvent separately for each workflow. Sensitivity was screened by correlating every sampled input with the total footprint of the workflow in which it appears; coefficients were computed separately for each workflow, never pooled across workflows, and both Pearson and Spearman coefficients were obtained. The two agreed to within 0.02 throughout, and Pearson values are reported [38].
3. Results
3.1. Production-Phase Carbon Footprint
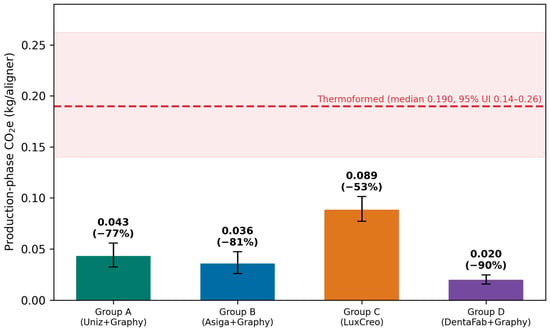
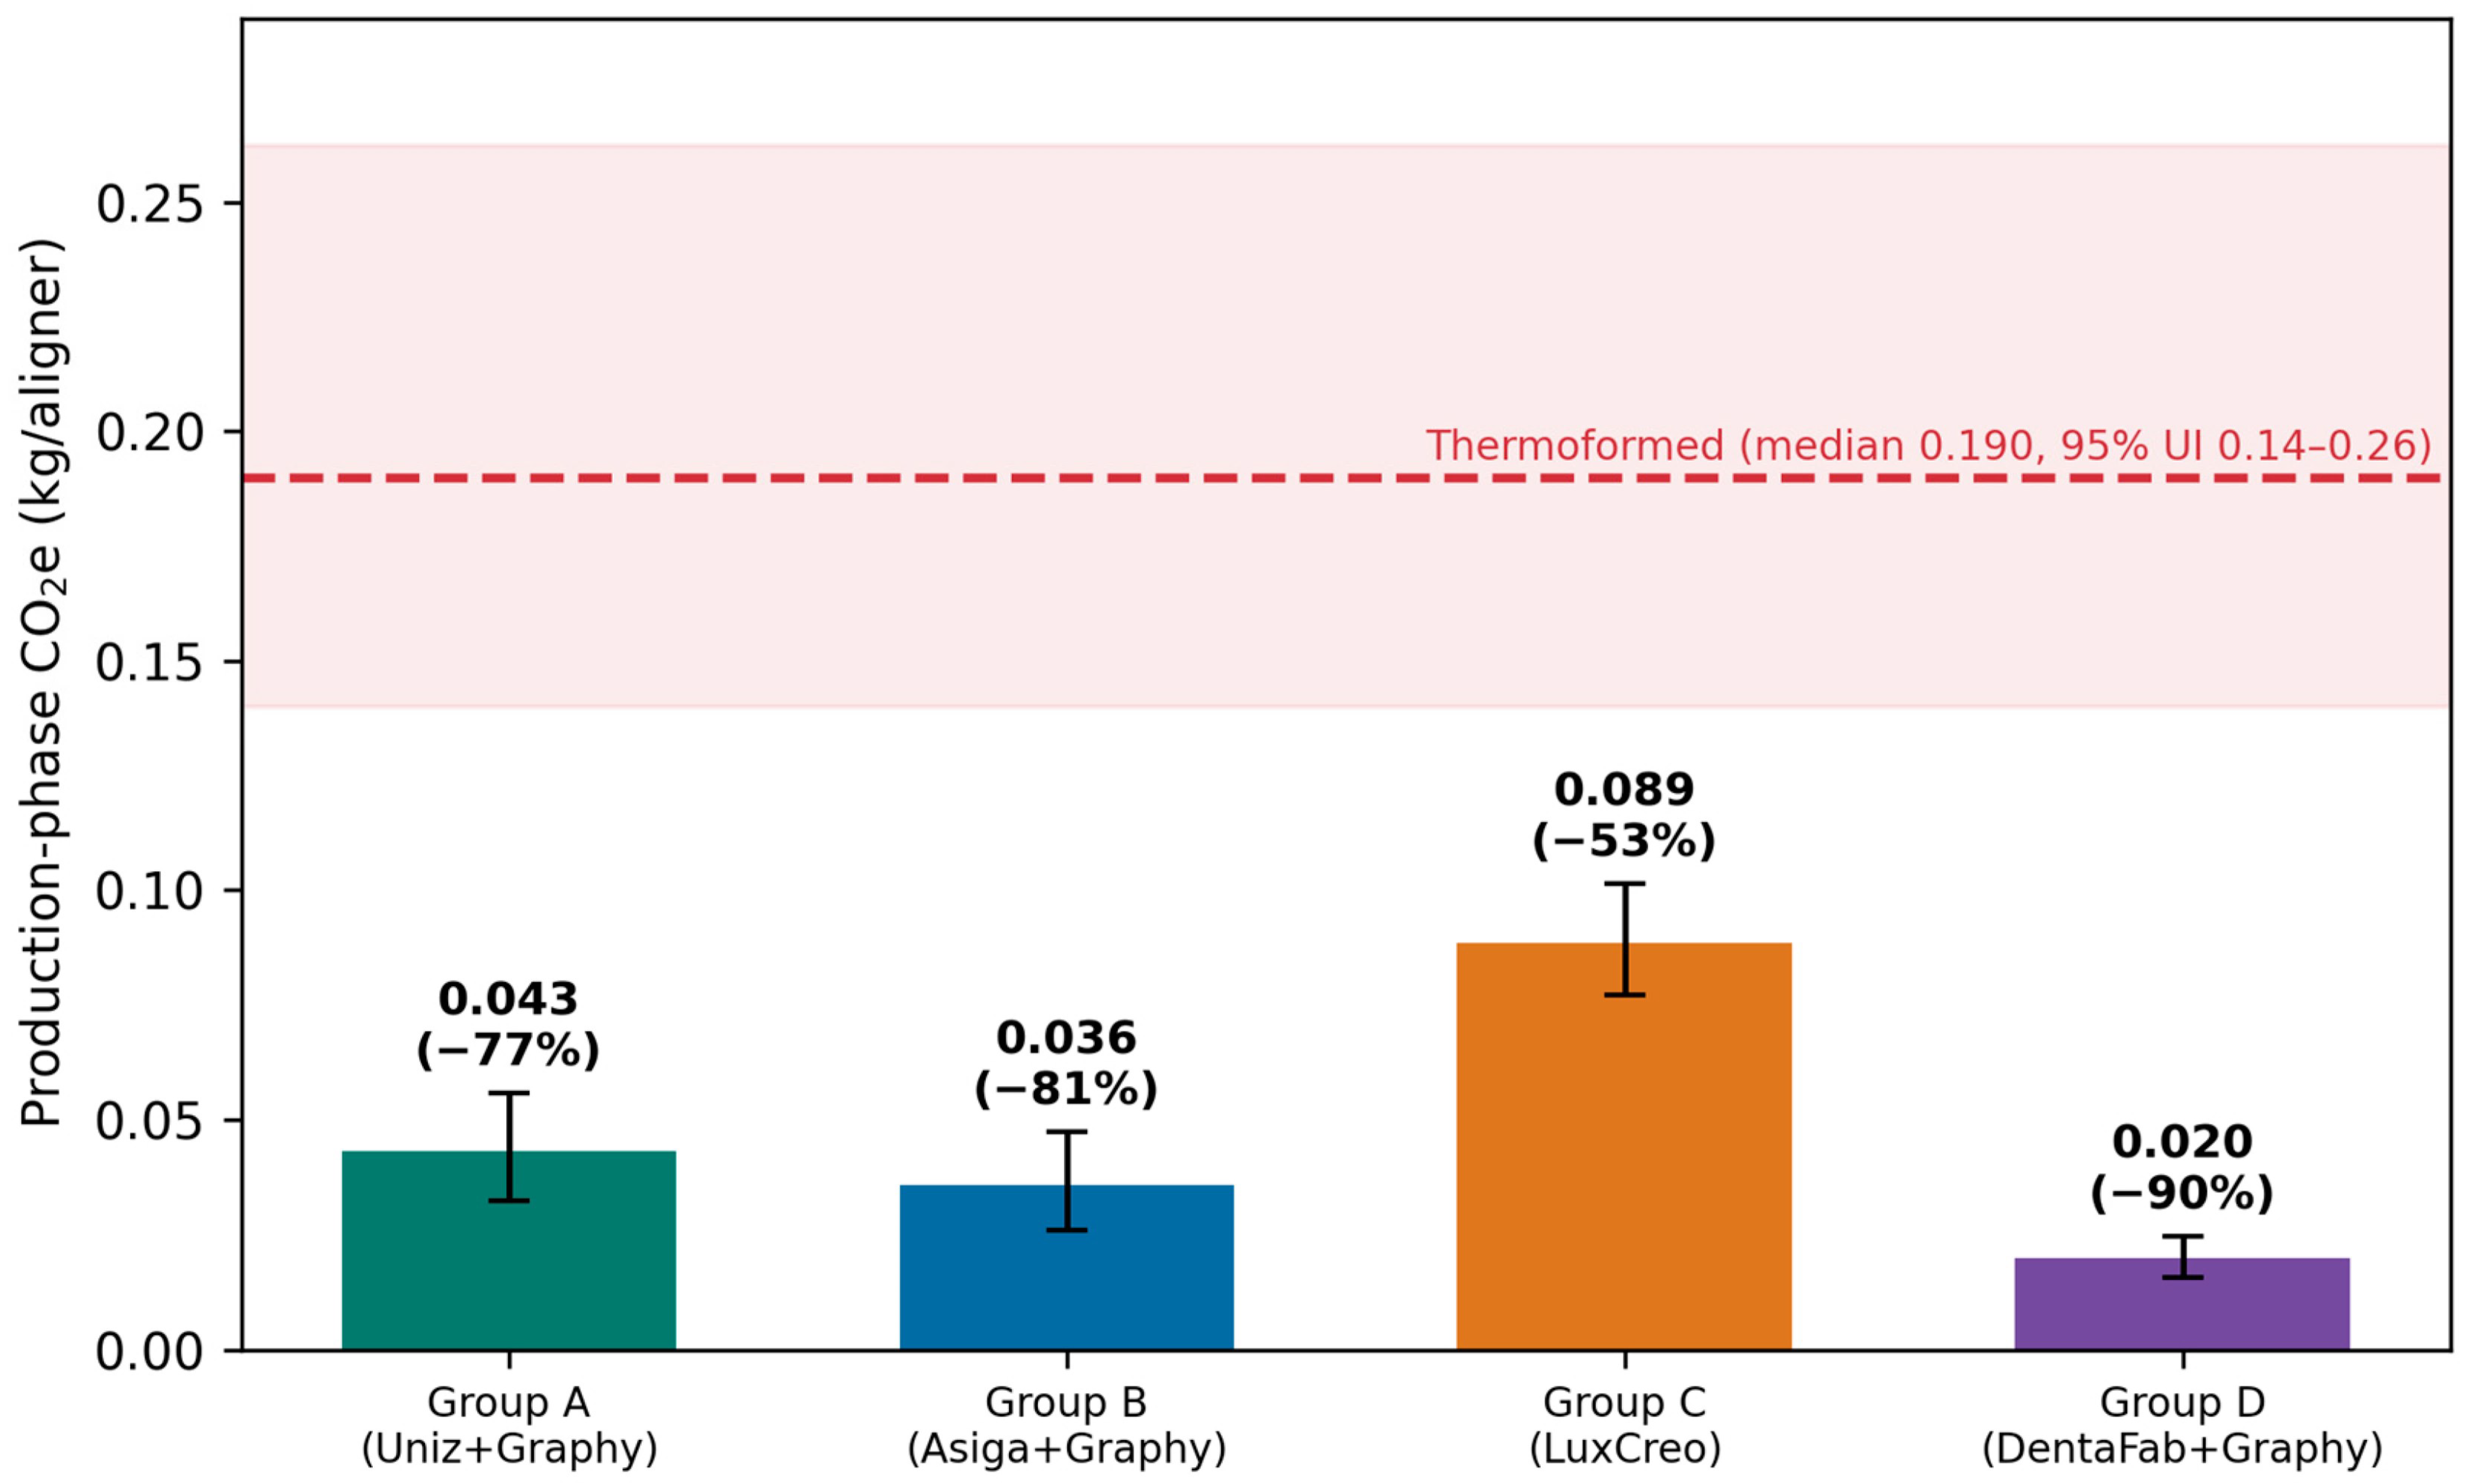
Means per aligner were 0.043 kg CO2e for Group A (95% uncertainty interval of 0.032–0.056), 0.036 for Group B (0.026–0.047), 0.089 for Group C (0.077–0.101) and 0.020 for Group D (0.016–0.025). Represented as a distribution, thermoforming had a median of 0.190 kg CO2e per aligner (95% uncertainty interval of 0.140–0.262). Pairing each direct-print draw with a thermoformed one, direct printing was the lower of the two in every one of the 10,000 iterations, for every workflow. Taken on the means, the four sat 77.3%, 81.2%, 53.3% and 89.6% under the thermoformed median (Figure 1; Table 2). The intervals quoted here and throughout are Monte Carlo uncertainty intervals derived from the input distributions; they are not confidence intervals in the sampling-theory sense.
Figure 1.
Per-aligner production-phase carbon footprint of the four workflows (Monte Carlo means with 95% uncertainty intervals; N = 10,000). The thermoformed baseline distribution is plotted for reference. In every iteration direct printing remained the lower of the two.
Table 2.
Per-aligner production-phase carbon footprint of each workflow, with the reduction achieved relative to the thermoformed median. Intervals are Monte Carlo uncertainty intervals, not confidence intervals; the final column gives the probability that the modelled direct-print footprint is lower than the thermoformed one in a paired draw.
3.2. How Much the Grid Matters
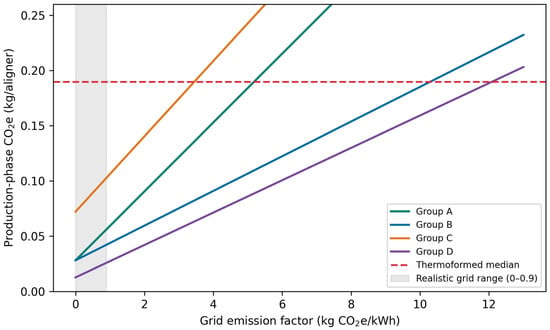
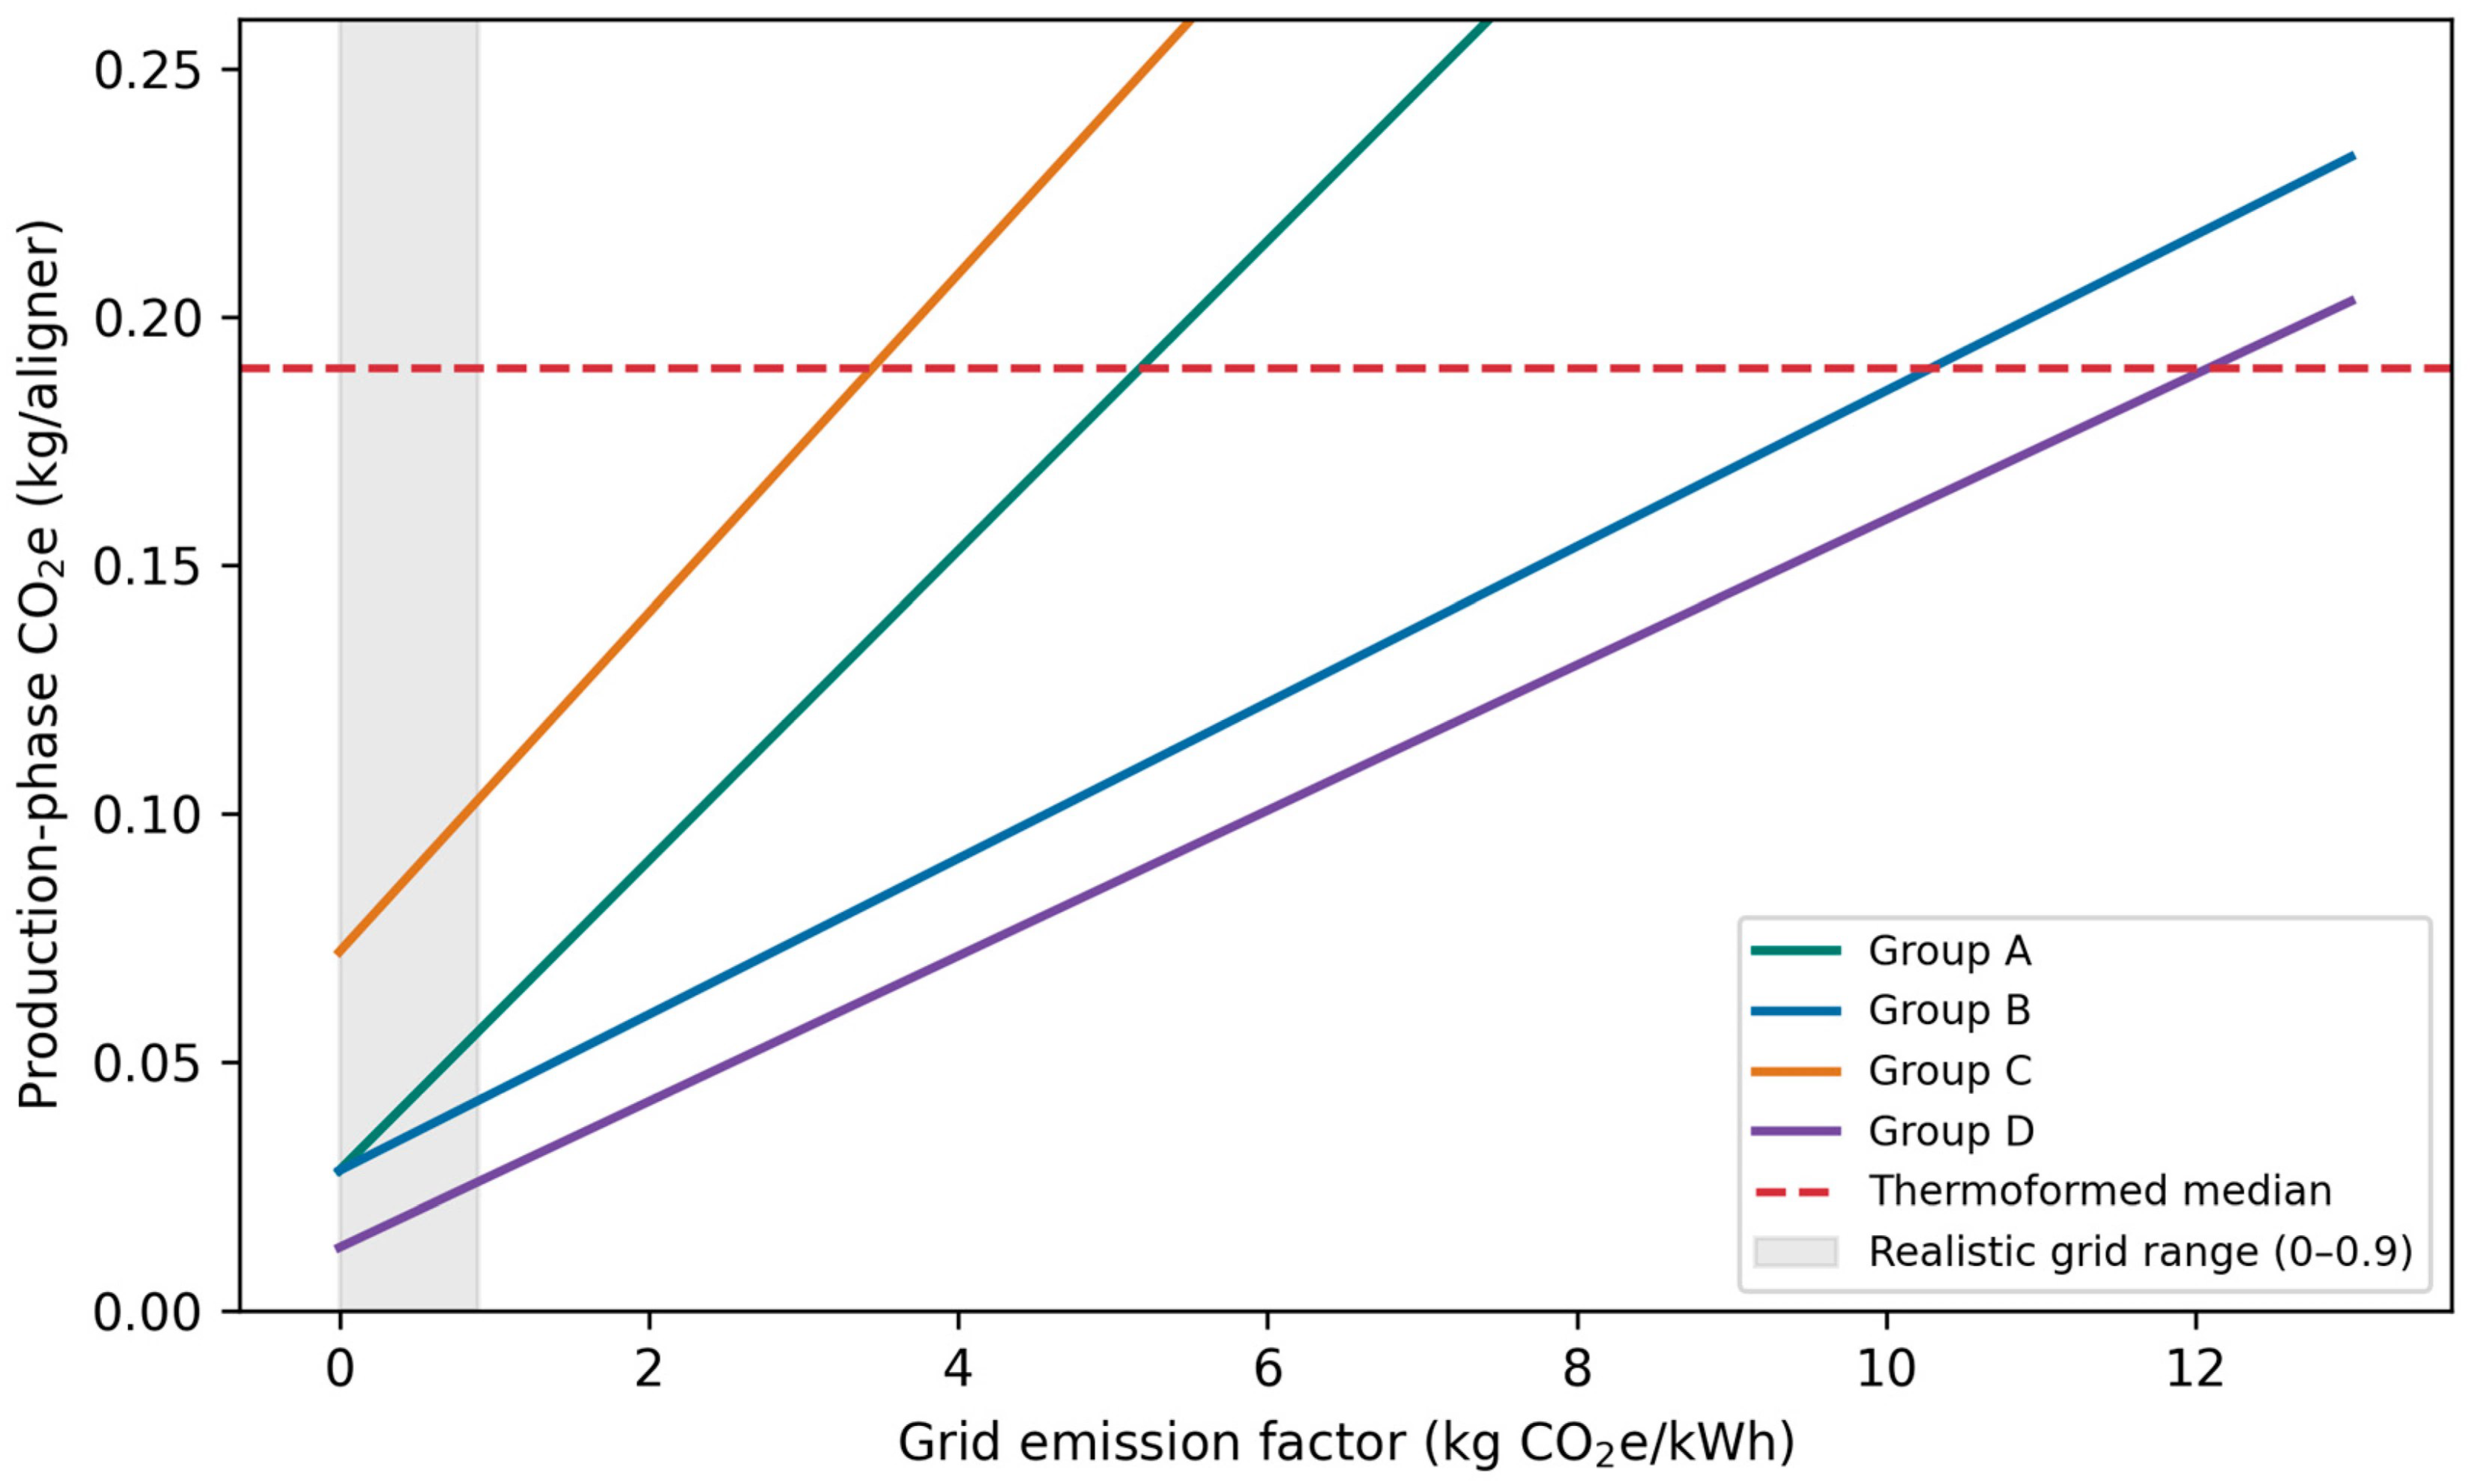
Under low-, average- and high-carbon grid scenarios alike, none of the four workflows rose above the thermoformed baseline. Crossover factors—the grid intensity that would bring a workflow level with thermoforming—came to 5.18 (A), 10.29 (B), 3.45 (C) and 12.09 (D) kg CO2e/kWh. The most carbon-intensive national grids reported in current statistics sit at roughly 0.9 kg CO2e/kWh, so these thresholds lie above the range of grid intensities encountered in practice, and the ranking is not reversed by any grid within that range (Figure 2). This conclusion is bounded by the grid intensities considered here and does not extend to conditions outside them.
Figure 2.
Footprint plotted against grid emission factor. Across the range of grid intensities encountered in practice (shaded), all four workflows remain below the thermoformed median.
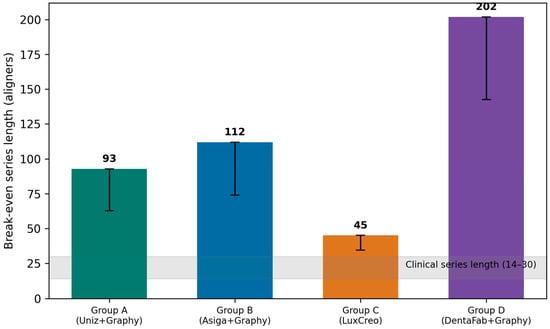
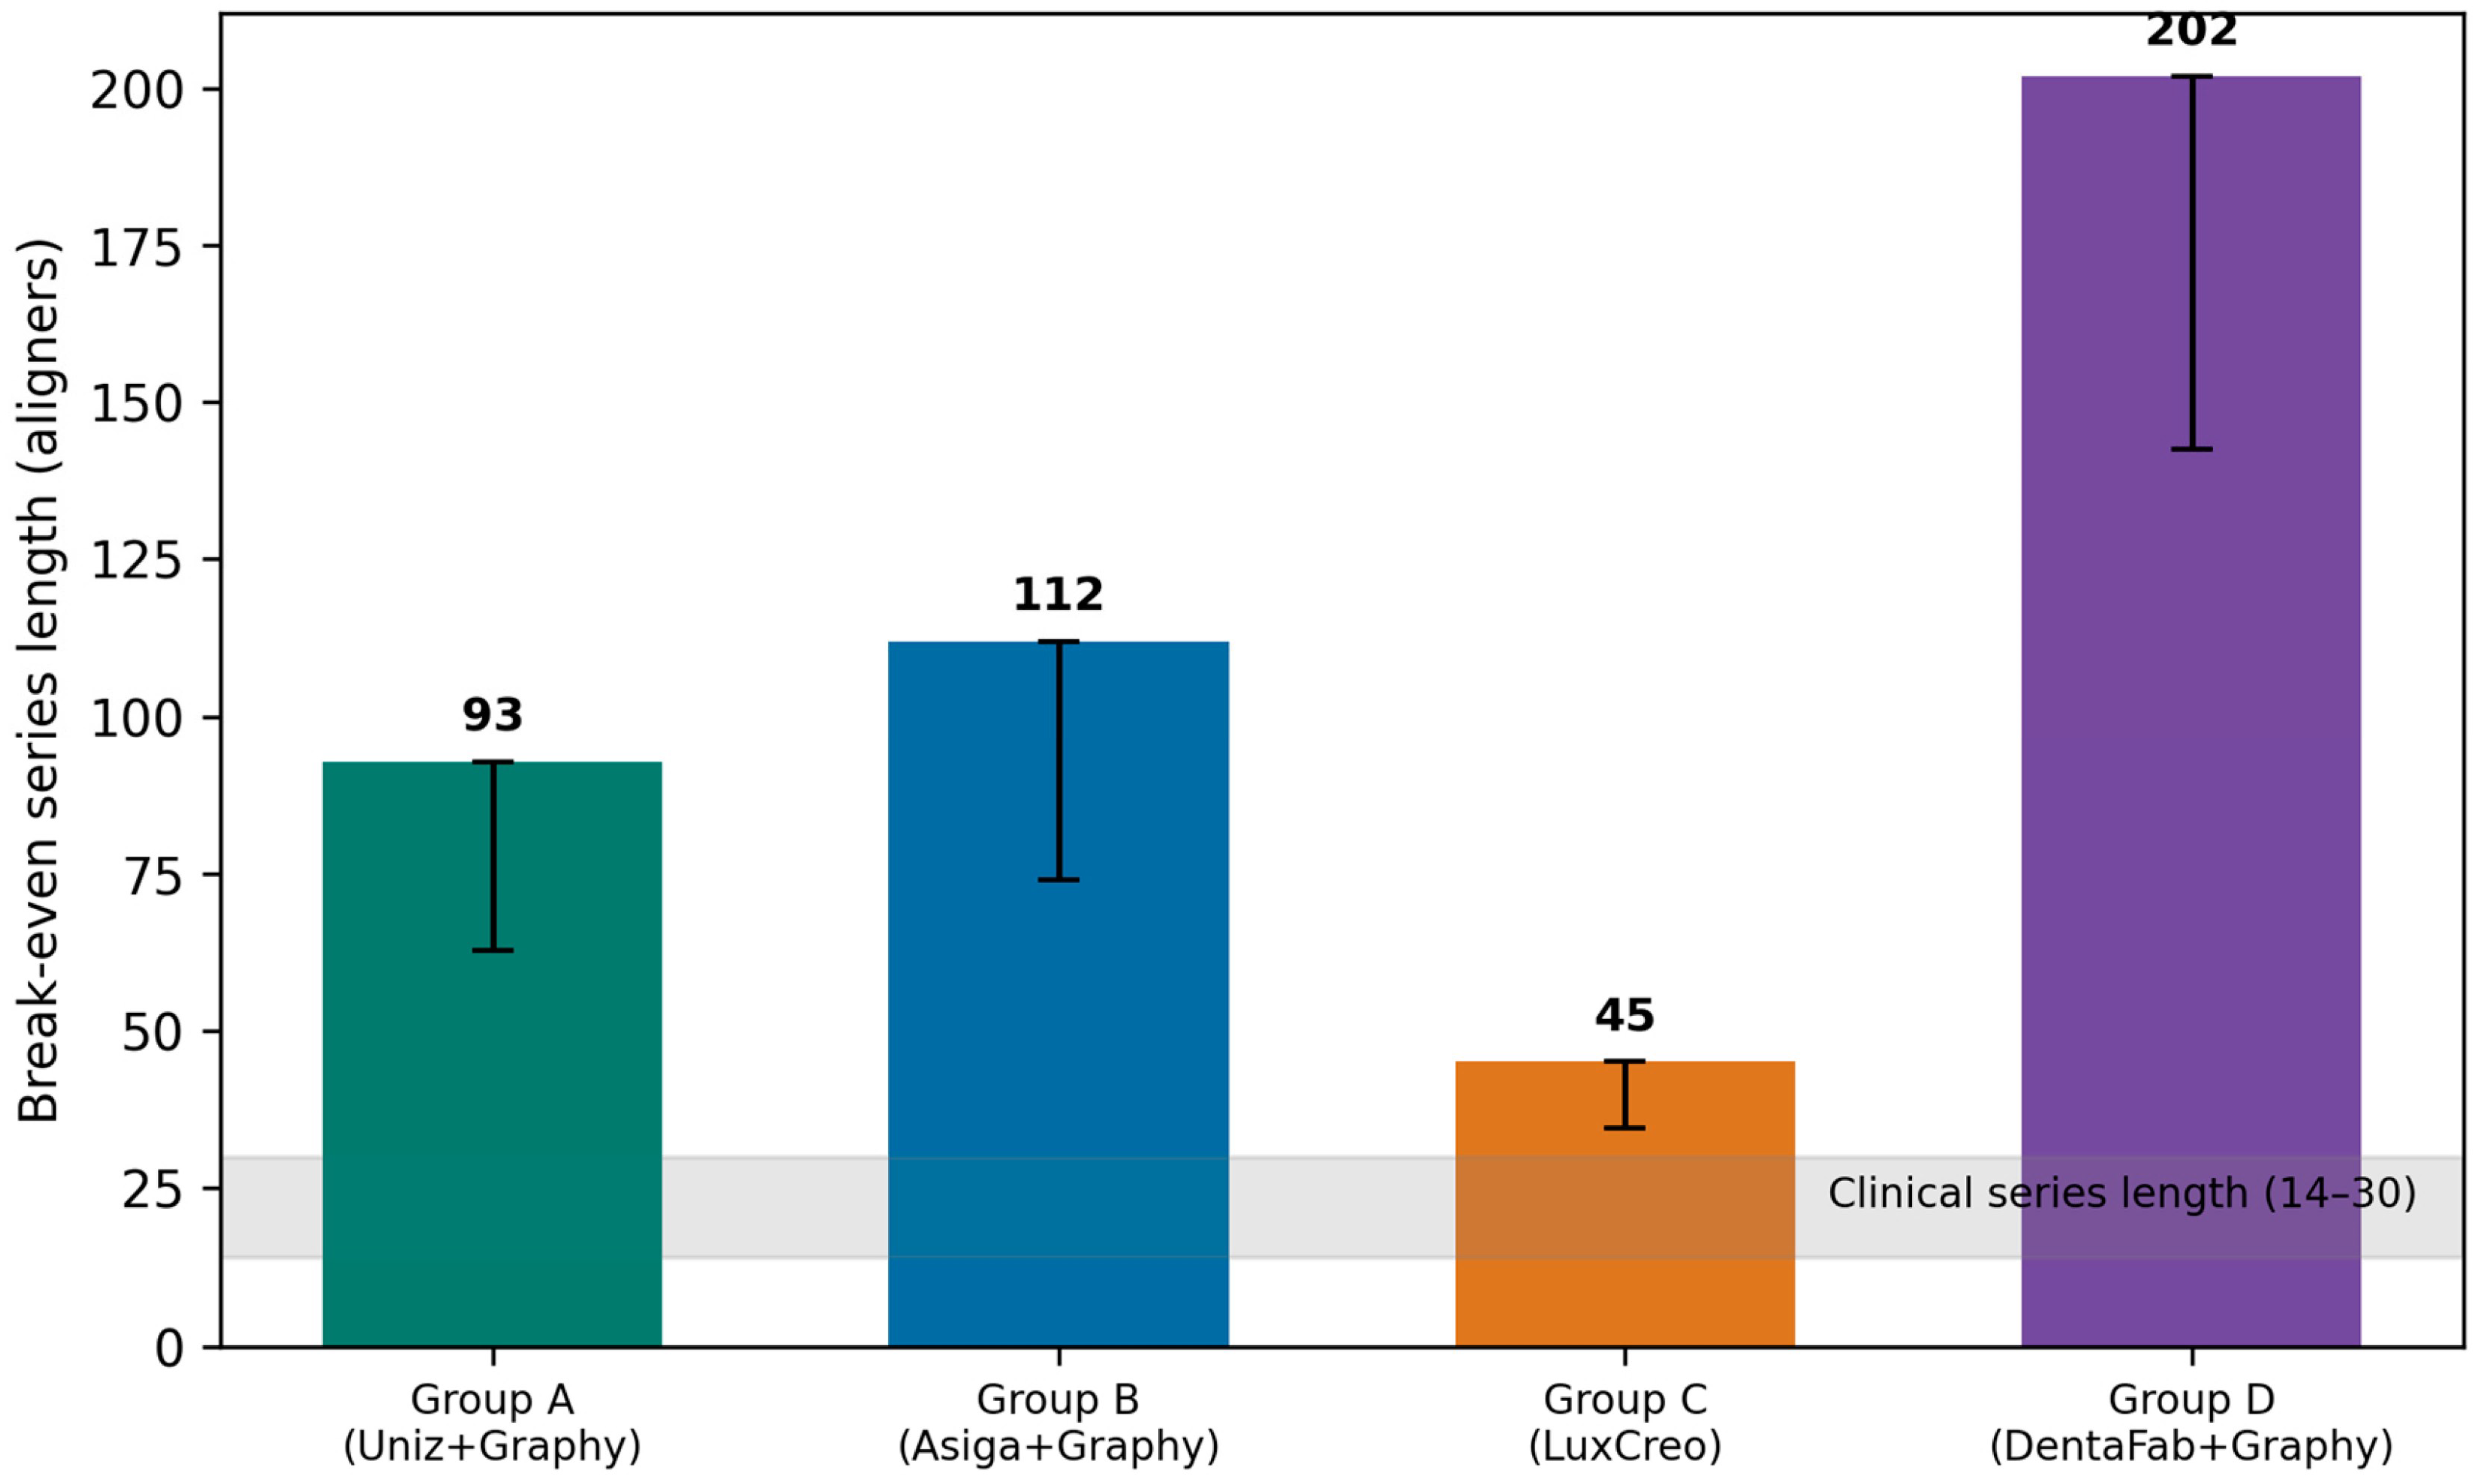
3.3. Break-Even Series Length
Break-even lengths were 93 aligners for Group A, 112 for Group B, 45 for Group C and 202 for Group D (Figure 3). Combining the most unfavourable thermoformed burden with the upper bound of each direct-print distribution lowers these to 63, 74, 35 and 142, respectively. Clinical series run to 14–30 appliances, so even the least favourable workflow under the least favourable assumptions would require a series roughly the length of the longest reported clinical case before thermoforming drew level. The thermoformed burden itself would have to fall to approximately 2.7 kg CO2e per 30-aligner series—about a third below the published figure of 4 kg, and outside the 3.5–4.5 kg range reported in the literature—before the ordering changed for Group C, and to 1.8 kg for a 20-aligner series. The other three workflows would require reductions that are larger still.
Figure 3.
Series length at which a thermoformed series would carry the same total footprint as the same number of directly printed appliances. Error bars give the worst-case combination of the thermoformed lower bound with each workflow’s upper bound. The shaded band is the clinical range of 14–30 appliances.
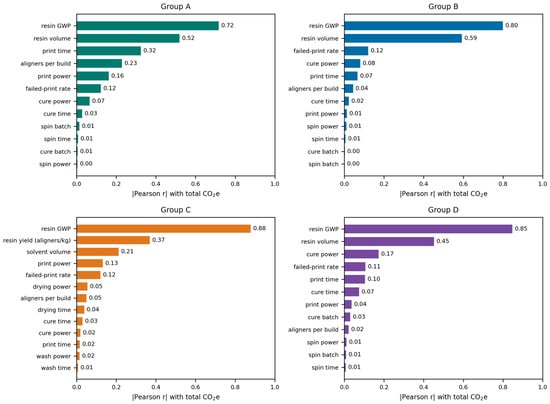
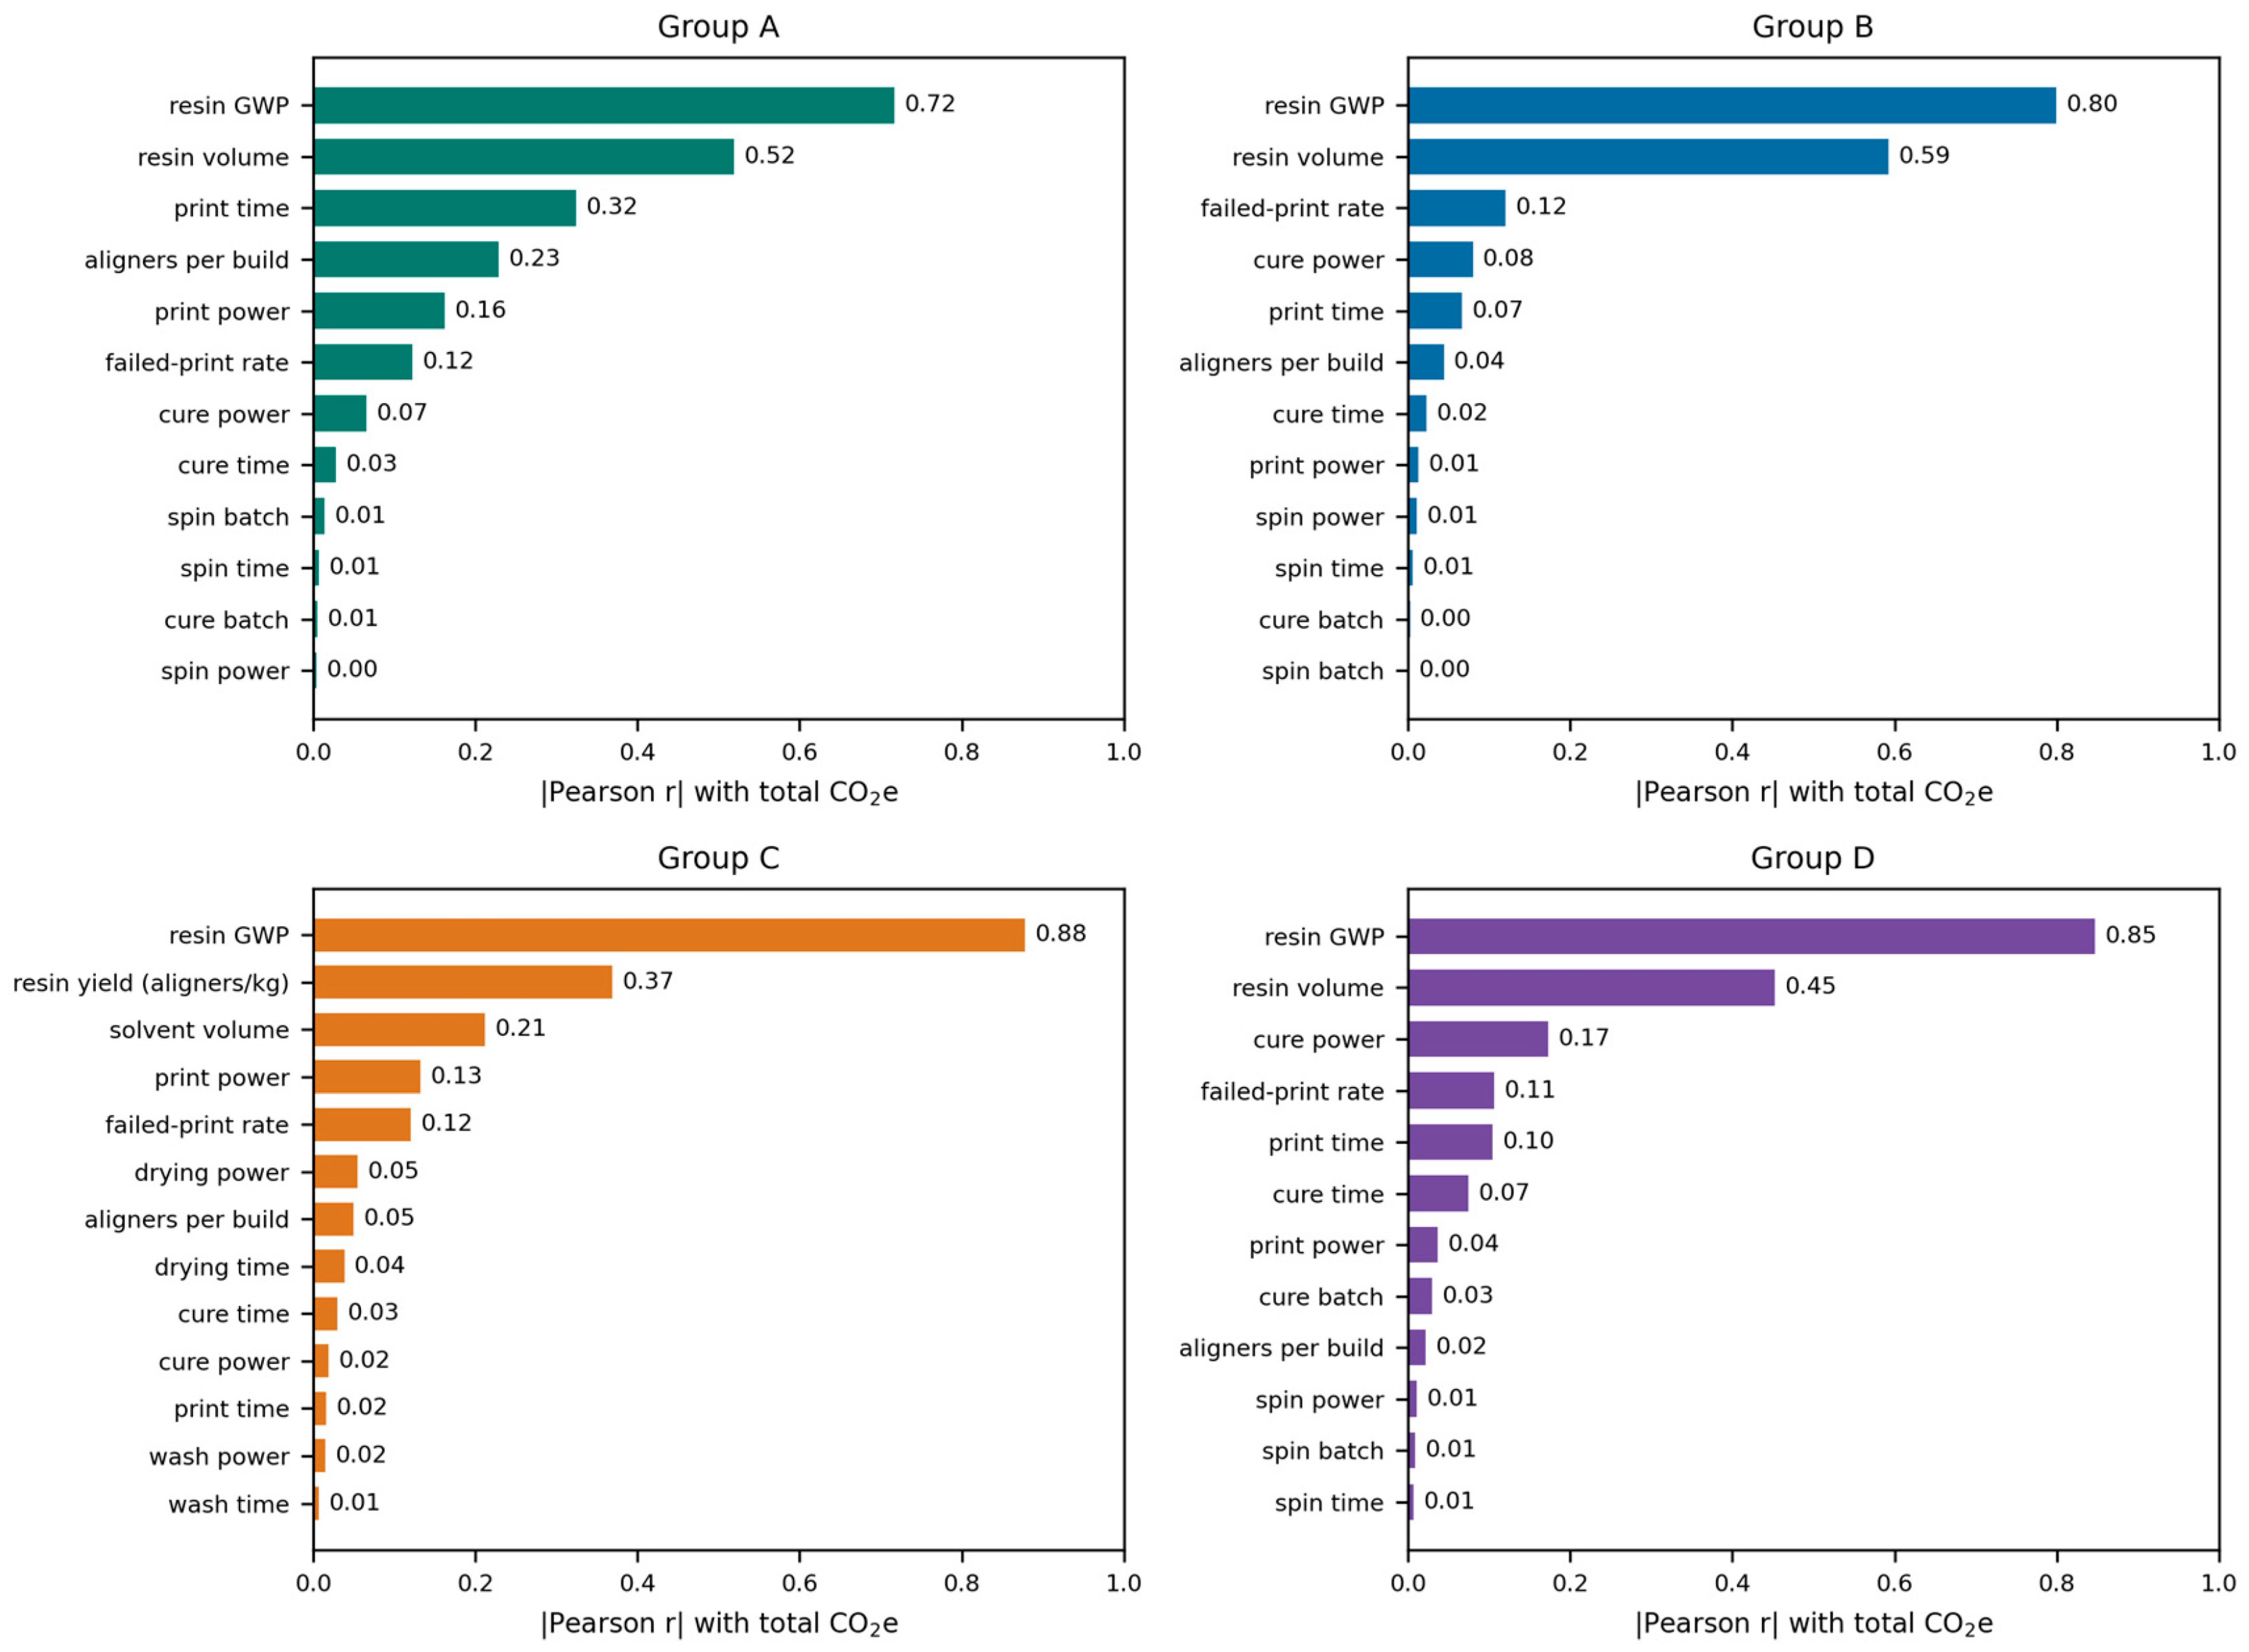
3.4. What Drives the Footprint
Sensitivity was computed separately for each workflow over every sampled input (Figure 4). The ordering is the same in all four. The resin emission factor ranks first (|r| = 0.72, 0.80, 0.88 and 0.85 for Groups A–D), followed by the quantity of resin consumed per aligner (0.52, 0.59, 0.37 and 0.45). No other input reaches 0.35 in any workflow. Print time and the number of aligners per build matter in Group A (0.32 and 0.23), where printing power is highest; solvent volume ranks third in Group C (0.21); and cure power ranks third in Group D (0.17), where the printing term is small enough for post-processing to become visible. The failed-print rate sits between 0.11 and 0.12 throughout, and the remaining post-processing parameters—spin power and time, cure batch size, wash power and time—fall below 0.10 everywhere. Spearman coefficients agreed with the Pearson values to within 0.02 for every input in every workflow.
Figure 4.
Sensitivity of the production-phase footprint to every sampled input, computed separately for each workflow (absolute Pearson correlation with the workflow total; N = 10,000).
3.5. Contribution Analysis
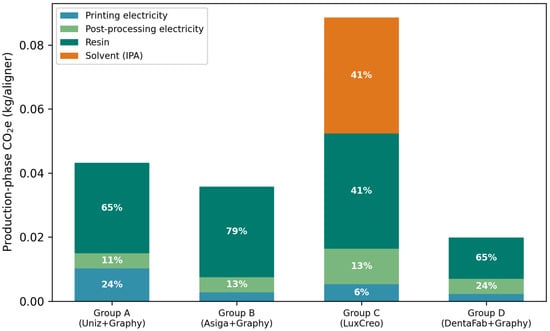
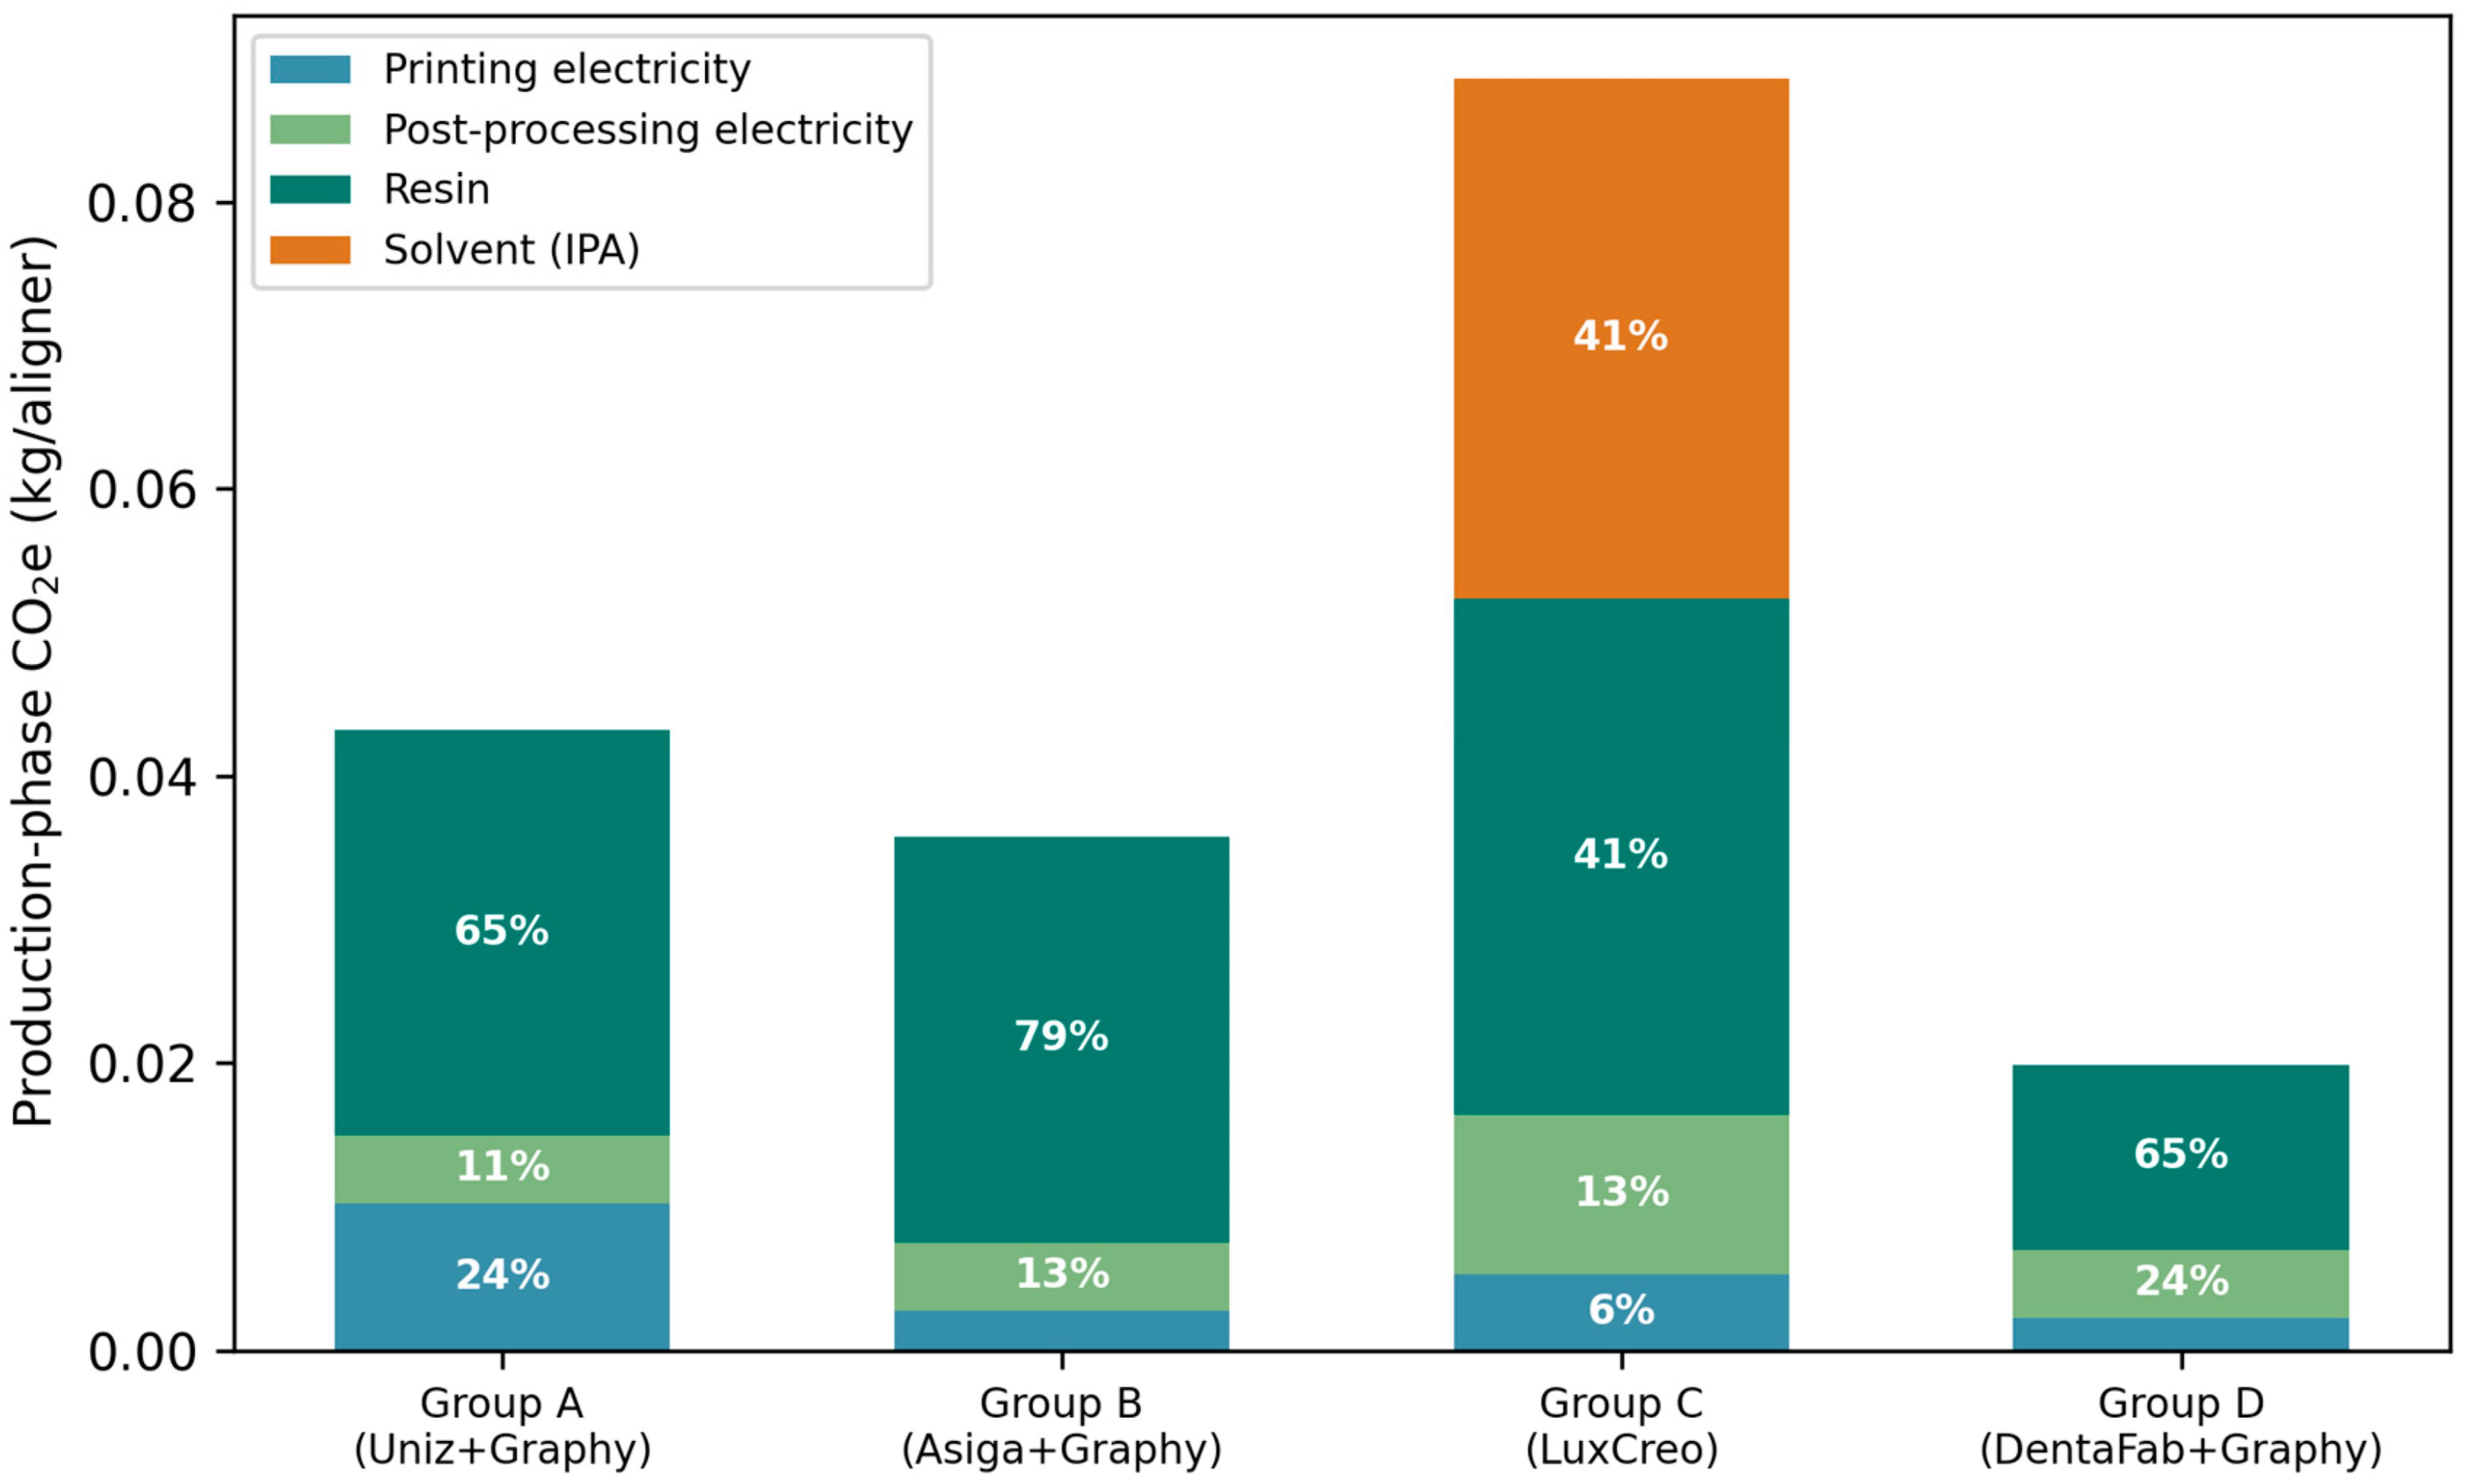
Decomposing each total into printing electricity, post-processing electricity, resin and solvent (Figure 5) shows where the sensitivity ranking comes from. Resin is the largest single term in three of the four workflows, at 65% of the total in Group A, 79% in Group B and 65% in Group D. In Group C, resin accounts for 41% and solvent accounts for a further 41%, the two together carrying more than four-fifths of that workflow’s footprint. Post-processing electricity contributes 11% (A), 13% (B), 13% (C) and 24% (D); printing electricity 24%, 8%, 6% and 12%, respectively. Electricity of all kinds therefore accounts for between 19% and 36% of the production-phase footprint, and materials for the remainder (Table 3).
Figure 5.
Contribution of printing electricity, post-processing electricity, resin and solvent to the mean production-phase footprint of each workflow.
Table 3.
Contribution of each production term to the mean total, by workflow.
3.6. Scenario Analysis
Because the resin emission factor dominates the model, the two bounds of its published range were also run as fixed scenarios. At 3.0 kg CO2e/kg the means fall to 0.033, 0.026, 0.076 and 0.015 kg CO2e per aligner for Groups A–D; at 6.5 kg CO2e/kg they rise to 0.054, 0.047, 0.103 and 0.025. Under the least favourable case—the highest resin factor combined with the upper bound of the direct-print distribution and the lower bound of the thermoformed distribution—the largest direct-print footprint, Group C at 0.110 kg CO2e, remains below the thermoformed 2.5th percentile of 0.139 kg CO2e. The margin narrows from a factor of roughly two to about 21%, but it does not close, and direct printing remained the lower of the two in every paired iteration under both scenarios. Applying the failed-print factor to post-processing as well as to printing and resin changes the means by less than 1% (Groups A–D: 0.043, 0.036, 0.089, 0.020). The failed-print rate itself was bounded in the same way. With no failures at all the means are 0.042, 0.035, 0.087 and 0.019 kg CO2e per aligner; at a uniform 8% failure rate they are 0.045, 0.037, 0.091 and 0.021, an increase of 4% to 8% over the failure-free case. Both bounds leave every workflow below thermoforming in every paired iteration, so the assumed rate does not carry any conclusion.
3.7. Comparing the Workflows
The smallest footprint of the four belonged to Group D, for two reasons: it had the least resin per aligner (2.12–3.18 g) and the lowest power draw during printing (28.75 W). The largest belonged to Group C, notwithstanding that it is the one fully integrated single-vendor chain. Its position is driven jointly by the highest resin consumption of the four (6.67–8.33 g per aligner) and by its solvent step: the 25 mL of isopropanol consumed per aligner contributes 41% of that workflow’s total, more than its entire electricity demand. The drying oven, although it is the single largest electrical load in the study at 945 W, contributes through post-processing electricity that amounts to 13% of the Group C total. As A, B and D run the same resin, what separates them traces back to the machine and the amount of material deposited rather than to resin chemistry.
4. Discussion
Four workflows, configured independently of one another, converge on the same conclusion. Materials rather than electricity governed the production-phase footprint, resin was the dominant term in every workflow, and each remained under thermoforming across the grid intensities examined. The fourth deserves particular note. It rests on a different printing technology (DLP) and comes from a different manufacturer, yet it arrives at the same place. Such convergence indicates a systematic pattern rather than a peculiarity of one device.
Crossover intensities of 3.45 to 12.09 kg CO2e/kWh lie above the range of grid intensities encountered in practice, and the break-even series lengths of 45 to 202 appliances lie far above clinical series lengths of 14–30. Decarbonising electricity is worthwhile on its own terms, but the aligner-specific gains are not to be found there. The contribution analysis locates them precisely: materials account for 65% to 82% of the production-phase footprint across the four workflows. The first lever is therefore resin efficiency—material per aligner, support strategy, and fewer failed prints. The second is solvent avoidance, which the present results show to be a materials question rather than an energy one. Group D illustrates the first positively: its advantage rests on the lowest resin consumption of the four, not on any grid effect and not on vendor integration. Group C illustrates the second: its 25 mL of isopropanol per aligner contributes 41% of that workflow’s total, more than its entire electricity demand of all kinds, so the penalty attaches to the solvent consumed rather than to the energy of the bath. This refines rather than repeats the earlier stereolithography finding, in which the solvent step was reported as the dominant contributor [32]. Post-processing electricity, by contrast, is a secondary term at 11–24% of the total, and single-vendor integration in itself confers no environmental advantage. The DLP engine of Group D cures a whole layer in a single exposure, which shortens the print, but printing electricity accounts for only 12% of that workflow’s footprint and the DLP effect is accordingly modest. That resin efficiency should be central is consistent with recent work on material-sparing printing strategies for orthodontic aligners [39].
Practical implications. For a practice or laboratory that prints its own appliances, the effort belongs elsewhere than is often assumed. Material, not energy, is where the ground is gained: nest the appliances more tightly and support them more sparingly so that less resin goes into each one, reduce the number of prints that fail, and prefer a post-processing route that removes surplus resin mechanically rather than with a solvent bath. On the figures reported here, replacing a 25 mL isopropanol wash per aligner would remove a larger share of the footprint than any plausible reduction in post-processing electricity. Selecting a printer on resin economy achieves more than selecting on rated wattage or on an “integrated” single-vendor badge. Because these levers concern material and workflow, they are unaffected by the carbon intensity of the electricity supply within the range examined here.
Limitations. The claim this study supports is comparative rather than absolute. The per-aligner values carry the uncertainty of an inventory that is manufacturer-confirmed rather than metered, and of a resin emission factor taken from the literature rather than measured; they should be read as screening estimates for ranking production routes, not as certified footprints for a particular clinic. What survives that uncertainty is the ordering. Every workflow stayed below thermoforming at both bounds of the resin factor and at both bounds of the failed-print rate, resin was the largest single term in each, and the break-even series lengths remained far outside clinical range throughout. It is the ranking and the location of the levers, not the absolute figures, that the model is built to support. What is presented here is a production-stage picture; transport, service life and end-of-life do not enter the totals, and the absolute values should be read accordingly. Global warming potential was the only impact category quantified, so the results describe the carbon dimension of these workflows and not their environmental performance as a whole; categories such as water use, human and ecosystem toxicity and resource depletion may rank the workflows differently and remain to be assessed. The inputs are manufacturer-confirmed values and ranges rather than independent repeated measurements, and were therefore represented as distributions derived from those ranges and from uncertainty calibrated to the literature. The power figures are rated or nameplate values, or manufacturer-quoted ranges spanning light-on and light-off operation, rather than metered consumption under clinical duty cycles; standby and idle draw are excluded. Metered measurement would refine the electricity terms, although these account for a minority of the total in every workflow. Four parameters are working estimates rather than manufacturer-confirmed measurements—the mode and upper bound of the cure-power range, the duration of the spin-off cycle, a representative print time for the Asiga workflow, and the failed-print rate—and all four rank below 0.20 in the sensitivity analysis of every workflow. The DentaFab workflow builds only five aligners at a time, which raises the per-aligner overhead, yet its modest resin use and power draw still leave it in the lowest position. A final reservation concerns the resin. No resin-specific emission factor is available, and the published range of 3.0 to 6.5 kg CO2e/kg is wide relative to the quantity it multiplies. This uncertainty is carried explicitly in the model rather than suppressed, and the scenario analysis shows the conclusion to survive both bounds, but a measured cradle-to-gate factor for dental photopolymer resin is the single input that would most improve the precision of any assessment of this kind, including this one.
5. Conclusions
Over four distinct printer–resin workflows, and on production data confirmed by the manufacturers, direct printing of aligners fell below thermoforming in every paired iteration, by 53% to 90% on the means, and did so at every grid intensity encountered in practice and at both bounds of the published resin emission factor. Thermoforming would draw level only at series lengths of 45 to 202 appliances, against the 14–30 of clinical practice. The footprint was settled by materials rather than energy: resin accounted for 41–79% of the total and solvent for a further 41% in the one workflow that uses it, while electricity of all kinds contributed between 19% and 36%. Efforts to reduce the carbon cost of aligner production should therefore begin with the resin consumed per appliance and with avoiding solvent-based post-processing, rather than with the sourcing of electricity or the choice of a single-vendor equipment chain.
Supplementary Materials
The following supporting information can be downloaded at https://www.mdpi.com/article/10.3390/pr14182896/s1, Table S1, The complete list of Monte Carlo input distributions with their bounds and sources; File S2, The model code (carbon_model_v3.py), which reproduces every value reported here under the fixed seed.
Author Contributions
Conceptualization, M.Ö. and F.A.; methodology, M.Ö. and F.A.; software, M.Ö.; validation, M.Ö. and F.A.; formal analysis, M.Ö. and F.A.; investigation, M.Ö. and F.A.; data curation, M.Ö. and F.A.; writing—original draft preparation, M.Ö. and F.A.; writing—review and editing, M.Ö. and F.A.; visualization, M.Ö.; supervision, M.Ö. All authors have read and agreed to the published version of the manuscript.
Funding
This research received no external funding.
Institutional Review Board Statement
Not applicable. The assessment is simulation-based and environmental in nature; it involves no human participants, no animals and no patient-derived material. The Scientific Board of the Faculty of Dentistry, Istanbul Health and Technology University, determined that ethical approval was not required.
Informed Consent Statement
Not applicable.
Data Availability Statement
All data underlying the findings are contained within the article and its Supplementary Materials. The model code is provided as Supplementary File S2 and reproduces every reported value under the fixed seed.
Acknowledgments
The authors used Claude (Anthropic, San Francisco, CA, USA) for literature retrieval, for assistance in writing the Python code described in Section 2.4, and for language editing. The authors reviewed and edited all content and take full responsibility for the content of the publication.
Conflicts of Interest
The authors declare no conflicts of interest. Technical specifications were sought from the manufacturers (Uniz, Asiga, LuxCreo, Graphy, DentaFab) purely to ensure the accuracy of the data; none of them funded the study or took any part in it.
References
- Kesling, H.D. The philosophy of the tooth positioning appliance. Am. J. Orthod. Oral Surg. 1945, 31, 297–304. [Google Scholar] [CrossRef] [Scilit]
- Grünheid, T.; Loh, C.; Larson, B.E. How accurate is Invisalign in nonextraction cases? Are predicted tooth positions achieved? Angle Orthod. 2017, 87, 809–815. [Google Scholar] [CrossRef] [Scilit] [PubMed]
- Rossini, G.; Parrini, S.; Castroflorio, T.; Deregibus, A.; Debernardi, C.L. Efficacy of clear aligners in controlling orthodontic tooth movement: A systematic review. Angle Orthod. 2015, 85, 881–889. [Google Scholar] [CrossRef] [Scilit] [PubMed]
- Lombardo, L.; Arreghini, A.; Ramina, F.; Huanca Ghislanzoni, L.T.; Siciliani, G. Predictability of orthodontic movement with orthodontic aligners: A retrospective study. Prog. Orthod. 2017, 18, 35. [Google Scholar] [CrossRef] [Scilit] [PubMed]
- Elkholy, F.; Schmidt, F.; Jäger, R.; Lapatki, B.G. Forces and moments delivered by novel, thinner PET-G aligners during labiopalatal bodily movement of a maxillary central incisor: An in vitro study. Angle Orthod. 2016, 86, 883–890. [Google Scholar] [CrossRef] [Scilit] [PubMed]
- Sheridan, J.J.; LeDoux, W.; McMinn, R. Essix retainers: Fabrication and supervision for permanent retention. J. Clin. Orthod. 1993, 27, 37–45. [Google Scholar] [PubMed]
- Eckelman, M.J.; Sherman, J. Environmental impacts of the U.S. health care system and effects on public health. PLoS ONE 2016, 11, e0157014. [Google Scholar] [CrossRef] [Scilit] [PubMed]
- Duane, B.; Ramasubbu, D.; Harford, S.; Steinbach, I.; Stancliffe, R.; Croasdale, K.; Pasdeki-Clewer, E. Environmental sustainability and procurement: Purchasing products for the dental setting. Br. Dent. J. 2019, 226, 453–458. [Google Scholar] [CrossRef] [Scilit] [PubMed]
- Rizan, C.; Bhutta, M.F.; Reed, M.; Lillywhite, R. The carbon footprint of waste streams in a UK hospital. J. Clean. Prod. 2021, 286, 125446. [Google Scholar] [CrossRef] [Scilit]
- Campion, N.; Thiel, C.L.; Woods, N.C.; Swanzy, L.; Landis, A.E.; Bilec, M.M. Sustainable healthcare and environmental life-cycle impacts of disposable supplies: A focus on disposable custom packs. J. Clean. Prod. 2015, 94, 46–55. [Google Scholar] [CrossRef] [Scilit]
- Duane, B. Sustainability in dentistry gathers momentum. Br. Dent. J. 2022, 233, 241. [Google Scholar] [CrossRef] [Scilit] [PubMed]
- Caelli, C.; Tamburrino, F.; Brondi, C.; Razionale, A.V.; Ballarino, A.; Barone, S. Sustainability in healthcare sector: The dental aligners case. Sustainability 2023, 15, 16757. [Google Scholar] [CrossRef] [Scilit]
- Boonchanachai, C.; Kanpittaya, P.; Fakhruddin, K.S.; Chengprapakorn, S.; Rerksanan, N.; Laoamata, V.; Jirawattanakul, Y. A scoping review of sustainable orthodontic supply chains: Innovations and waste management in clear aligner therapy. Eur. J. Orthod. 2025, 47, cjaf080. [Google Scholar] [CrossRef] [Scilit] [PubMed]
- Veseli, E.; Veseli, K.; Behluli, E.I. The carbon emissions of clear aligner therapy: A critical review. APOS Trends Orthod. 2024, 14, 70–71. [Google Scholar] [CrossRef] [Scilit]
- Tartaglia, G.M.; Mapelli, A.; Maspero, C.; Santaniello, T.; Serafin, M.; Farronato, M.; Caprioglio, A. Direct 3D printing of clear orthodontic aligners: Current state and future possibilities. Materials 2021, 14, 1799. [Google Scholar] [CrossRef] [Scilit] [PubMed]
- Al Mortadi, N.; Jones, Q.; Eggbeer, D.; Lewis, J.; Williams, R.J. Fabrication of a resin appliance with alloy components using digital technology without an analog impression. Am. J. Orthod. Dentofac. Orthop. 2015, 148, 862–867. [Google Scholar] [CrossRef] [Scilit] [PubMed]
- Narongdej, P.; Hassanpour, M.; Alterman, N.; Rawlins-Buchanan, F.; Barjasteh, E. Advancements in clear aligner fabrication: A comprehensive review of direct 3D printing technologies. Polymers 2024, 16, 371. [Google Scholar] [CrossRef] [Scilit] [PubMed]
- Jindal, P.; Juneja, M.; Bajaj, D.; Siena, F.L.; Breedon, P. Effects of post-curing conditions on mechanical properties of 3D printed clear dental aligners. Rapid Prototyp. J. 2020, 26, 1337–1344. [Google Scholar] [CrossRef] [Scilit]
- Cole, D.; Bencharit, S.; Carrico, C.K.; Arias, A.; Tüfekçi, E. Evaluation of fit for 3D-printed retainers compared with thermoform retainers. Am. J. Orthod. Dentofac. Orthop. 2019, 155, 592–599. [Google Scholar] [CrossRef] [Scilit] [PubMed]
- Tahayeri, A.; Morgan, M.C.; Fugolin, A.P.; Bompolaki, D.; Athirasala, A.; Pfeifer, C.S.; Ferracane, J.L.; Bertassoni, L.E. 3D printed versus conventionally cured provisional crown and bridge dental materials. Dent. Mater. 2018, 34, 192–200. [Google Scholar] [CrossRef] [Scilit] [PubMed]
- Javaid, M.; Haleem, A. Current status and applications of additive manufacturing in dentistry: A literature-based review. J. Oral Biol. Craniofacial Res. 2019, 9, 179–185. [Google Scholar] [CrossRef] [Scilit] [PubMed]
- Revilla-León, M.; Özcan, M. Additive manufacturing technologies used for processing polymers: Current status and potential application in prosthetic dentistry. J. Prosthodont. 2019, 28, 146–158. [Google Scholar] [CrossRef] [Scilit] [PubMed]
- Alharbi, N.; Wismeijer, D.; Osman, R.B. Additive manufacturing techniques in prosthodontics: Where do we currently stand? A critical review. Int. J. Prosthodont. 2017, 30, 474–484. [Google Scholar] [CrossRef] [Scilit] [PubMed]
- Stansbury, J.W.; Idacavage, M.J. 3D printing with polymers: Challenges among expanding options and opportunities. Dent. Mater. 2016, 32, 54–64. [Google Scholar] [CrossRef] [Scilit] [PubMed]
- Unkovskiy, A.; Spintzyk, S.; Brom, J.; Huettig, F.; Keutel, C. Direct 3D printing of silicone facial prostheses: A preliminary experience in digital workflow. J. Prosthet. Dent. 2018, 120, 303–308. [Google Scholar] [CrossRef] [Scilit] [PubMed]
- Osman, R.B.; Alharbi, N.; Wismeijer, D. Build angle: Does it influence the accuracy of 3D-printed dental restorations using digital light-processing technology? Int. J. Prosthodont. 2017, 30, 182–188. [Google Scholar] [CrossRef] [Scilit] [PubMed]
- Faludi, J.; Bayley, C.; Bhogal, S.; Iribarne, M. Comparing environmental impacts of additive manufacturing vs traditional machining via life-cycle assessment. Rapid Prototyp. J. 2015, 21, 14–33. [Google Scholar] [CrossRef] [Scilit]
- Kellens, K.; Mertens, R.; Paraskevas, D.; Dewulf, W.; Duflou, J.R. Environmental impact of additive manufacturing processes: Does AM contribute to a more sustainable way of part manufacturing? Procedia CIRP 2017, 61, 582–587. [Google Scholar] [CrossRef] [Scilit]
- Gebler, M.; Schoot Uiterkamp, A.J.M.; Visser, C. A global sustainability perspective on 3D printing technologies. Energy Policy 2014, 74, 158–167. [Google Scholar] [CrossRef] [Scilit]
- Peng, T.; Kellens, K.; Tang, R.; Chen, C.; Chen, G. Sustainability of additive manufacturing: An overview on its energy demand and environmental impact. Addit. Manuf. 2018, 21, 694–704. [Google Scholar] [CrossRef] [Scilit]
- Ford, S.; Despeisse, M. Additive manufacturing and sustainability: An exploratory study of the advantages and challenges. J. Clean. Prod. 2016, 137, 1573–1587. [Google Scholar] [CrossRef] [Scilit]
- Panagiotopoulou, V.C.; Paraskevopoulou, A.; Stavropoulos, P. A modelling-based framework for carbon emissions calculation in additive manufacturing: A stereolithography case study. Processes 2023, 11, 2574. [Google Scholar] [CrossRef] [Scilit]
- ISO 14040:2006; Environmental Management—Life Cycle Assessment—Principles and Framework. International Organization for Standardization: Geneva, Switzerland, 2006.
- ISO 14044:2006; Environmental Management—Life Cycle Assessment—Requirements and Guidelines. International Organization for Standardization: Geneva, Switzerland, 2006.
- Huijbregts, M.A.J.; Steinmann, Z.J.N.; Elshout, P.M.F.; Stam, G.; Verones, F.; Vieira, M.; Zijp, M.; Hollander, A.; van Zelm, R. ReCiPe2016: A harmonised life cycle impact assessment method at midpoint and endpoint level. Int. J. Life Cycle Assess. 2017, 22, 138–147. [Google Scholar] [CrossRef] [Scilit]
- Ember. Global Electricity Review 2024; Ember: London, UK, 2024; Available online: https://ember-energy.org/latest-insights/global-electricity-review-2024/ (accessed on 3 September 2026).
- Sonnemann, G.W.; Schuhmacher, M.; Castells, F. Uncertainty assessment by a Monte Carlo simulation in a life cycle inventory of electricity produced by a waste incinerator. J. Clean. Prod. 2003, 11, 279–292. [Google Scholar] [CrossRef] [Scilit]
- Saltelli, A.; Ratto, M.; Andres, T.; Campolongo, F.; Cariboni, J.; Gatelli, D.; Saisana, M.; Tarantola, S. Global Sensitivity Analysis: The Primer; John Wiley & Sons: Chichester, UK, 2008. [Google Scholar] [CrossRef] [Scilit]
- Palmieri, E.; Montaina, L.; Bellisario, D.; Lucarini, I.; Maita, F.; Ielmini, M.; Cataldi, M.E.; Cerroni, L.; Condò, R.; Maiolo, L. Towards green dentistry: Evaluating the potential of 4D printing for sustainable orthodontic aligners with a reduced carbon footprint. Polymers 2024, 16, 3566. [Google Scholar] [CrossRef] [Scilit] [PubMed]

Disclaimer/Publisher’s Note: The statements, opinions and data contained in all publications are solely those of the individual author(s) and contributor(s) and not of MDPI and/or the editor(s). MDPI and/or the editor(s) disclaim responsibility for any injury to people or property resulting from any ideas, methods, instructions or products referred to in the content. |
© 2026 by the authors. Licensee MDPI, Basel, Switzerland. This article is an open access article distributed under the terms and conditions of the Creative Commons Attribution (CC BY) license.