


Abstract
As urban mining plays an increasingly important role in resource security and sustainable development, insufficient coordination among reverse supply chain participants has become a major constraint on the efficient recovery of urban mineral resources. From the perspective of interfirm cooperative innovation, this study takes waste mobile phones as an application context and develops a four-party evolutionary game model involving the government, recyclers, remanufacturers, and consumers. The model incorporates opportunistic behavior in cooperative innovation, government subsidy intensity, and product pricing into a unified analytical framework. Replicator dynamics, Jacobian-based stability analysis, and numerical simulations are employed to examine the evolutionary mechanisms and stability conditions of multi-actor collaborative governance. The results identify four stable equilibrium configurations and show that: (1) excessive innovation spillovers and asymmetric interdependence between recyclers and remanufacturers may weaken incentive compatibility and induce opportunistic behavior; (2) the effects of government subsidies vary across evolutionary stages and depend on the strategic responses of other actors; and (3) interfirm transfer prices and final market prices promote stable cooperation only within specific ranges. These findings provide a theoretical basis and policy implications for improving collaborative governance in reverse supply chains for urban mineral resource recovery and supporting sustainable urban mining.
1. Introduction
Urban mineral resources have attracted increasing attention in the fields of resource security and the circular economy because of their substantial recovery potential [1]. Driven by rapid advancements in mobile communication technologies and sustained growth in consumer demand, the potential for refurbishment and reuse of discarded electronic products has become increasingly significant [2,3,4]. According to statistics, global e-waste generation reached 62 million tonnes in 2022, containing metal resources with an estimated value of approximately USD 91 billion. The recovery and secondary utilization of these resources could indirectly reduce the need for approximately 900 million tonnes of primary ore extraction [5]. Waste mobile phones, as a representative form of electronic urban minerals, contain a variety of high-value metals, including gold, silver, copper, and palladium [6]. Laboratory-based characterization studies have shown that one tonne of end-of-life mobile phones can contain approximately 141 g of gold and 270 g of silver, with precious-metal concentrations often exceeding those found in natural ores [7]. As of 2025, approximately 82% of the global population aged 10 years and older owned a mobile phone, and this vast installed base is expected to create mounting pressure on future collection and recycling systems [8]. As the volume of discarded mobile phones continues to increase, establishing sustainable circular reverse supply chains is essential for extending product lifecycles and reducing dependence on primary resource consumption.
Reverse supply chains constitute the organizational and operational foundation for the efficient functioning of urban mineral recovery systems. The level of coordination and optimization within these supply chains directly affects both resource recovery efficiency and overall system performance [9]. However, in most countries, recycling systems remain constrained by structural impediments, including limited coverage by formal recycling networks [10], insufficient incorporation of life-cycle-oriented eco-design principles [11], limited environmental awareness and willingness to participate among consumers [12], and policy incentives that are often fragmented and short-lived [13]. In China, for example, the cumulative number of discarded and idle mobile phones between 2021 and 2025 is estimated to have exceeded 6 billion units, yet only approximately 10% of these devices were recycled through formal channels [14]. Consequently, a substantial proportion of waste mobile phones remains outside standardized recycling systems, further underscoring the need to enhance the attractiveness and competitiveness of formal reverse supply chains.
On the producer side, firms face substantial cost pressures associated with equipment investment, technological upgrading, and long capital recovery periods [15]. As extended producer responsibility (EPR) schemes have been progressively implemented, firms are required to bear additional research and development (R&D) and equipment investment costs [16]. These cost burdens have slowed the implementation of related practices. Guided by rational cost–benefit considerations, most manufacturers tend to meet only the minimum regulatory requirements, thereby increasing the risk of fragmentation across the design–recycling–remanufacturing industrial chain [17]. At the policy level, regulatory instruments such as the Waste Framework Directive of the European Union and the U.S. Resource Conservation and Recovery Act have incorporated electronic waste, including waste mobile phones, into formal regulatory frameworks. However, existing incentive instruments rely primarily on fiscal subsidies and are therefore characterized by a strong dependence on public funding and limited market orientation [2]. When revenue and expenditure imbalances arise in relevant funds, or when subsidies are gradually reduced, the sustainability and market adaptability of these policy instruments are likely to be further constrained [13].
The fundamental source of the challenges lies in insufficient coordination among participants in the reverse supply chain, which constrains efforts to enhance the market competitiveness of remanufactured products through technological upgrading, quality improvement, and value reconstruction [18]. Against the backdrop of increasingly dynamic market conditions and growing technological complexity, individual firms often struggle to address effectively the multifaceted innovation challenges associated with green technology development, product quality enhancement, process optimization, and alignment with evolving market demand [19]. Consequently, a growing number of firms have moved beyond organizational boundaries and pursued cooperative innovation through joint research and development, knowledge sharing, and resource complementarity [20]. Existing studies have shown that cooperative innovation can integrate heterogeneous knowledge and resources, distribute substantial investments in research and development, reduce the risk of innovation failure, and further improve corporate innovation quality and business performance [21,22,23]. For instance, leading firms such as Apple and Huawei have pursued cooperative innovation with upstream and downstream suppliers, technology partners, and research institutions to access external innovation resources and improve the efficiency of technology commercialization. However, under conditions of market demand uncertainty, divergent interest objectives, and information asymmetry, cooperative innovation is prone to risks such as cost–benefit misalignment [24], opportunistic behavior [25], spillover effects [26], and asymmetric dependence [27]. These risks may weaken the stability of cooperation and undermine the performance of collaborative governance in reverse supply chains.
Therefore, the primary objective of this study is to construct a four-party evolutionary game model comprising waste mobile phone recyclers, remanufacturers, the government, and consumers. From the perspective of interfirm cooperative innovation between recyclers and remanufacturers, this study examines the evolutionary pathways, stability conditions, and interactions between policy instruments and market forces within multi-actor collaborative governance, thereby providing a theoretical foundation and decision support for optimizing circular reverse supply chains. To achieve this objective, this study addresses the following questions:
(1) How can the payoff matrix for collaborative governance among the four participating agents be constructed?
(2) What are the evolutionary pathways, formation conditions, and key influencing factors of the evolutionary stable strategies (ESSs) of multiple actors from the perspective of enterprise cooperative innovation?
(3) How do core parameters, such as spillover effects, subsidy intensity, and product pricing, affect the strategic evolutionary trajectories of multiple agents and the steady-state outcomes of the system?
2. Literature Review
Within reverse supply chains for urban mineral resource recovery, the dynamic interaction between government policy support and firm strategic choices constitutes a central mechanism shaping both the effectiveness of multi-actor collaborative governance and the evolutionary trajectory of the system. He et al. [28] found that both external institutional pressures and firm-specific characteristics influenced the fulfillment of environmental responsibilities by firms, with government intervention exerting the most pronounced effect. Esenduran et al. [29] developed a model of remanufacturing competition between recyclers and original manufacturers and analyzed the effects of mandatory government recycling targets on the recycling industry. Drawing on the e-waste treatment fund policy in China, Liu et al. [30] found that excessively high levels of subsidies and taxation could lead to resource misallocation and policy dependence. Meanwhile, the alignment between government incentive–penalty mechanisms and corporate strategic choices significantly affects the stability of the recycling system [31]. Zhang et al. [32] further showed that differentiated reward-and-penalty mechanisms not only strengthened the willingness of manufacturers to invest in technology but also enhanced the incentives of firms to sustain cooperative relationships. Nevertheless, existing research has paid insufficient attention to the dynamic adjustment of government policies under the combined influence of fiscal constraints, market feedback, and environmental performance.
As demand-side participants in reverse supply chains, consumers shape market demand for remanufactured products through green preferences, product trust, and price perceptions, thereby affecting both the returns from interfirm cooperation and the effectiveness of government policies [33]. Li et al. [34] incorporated consumer preferences into a recycling supply chain and developed a two-stage game model involving the government and recyclers to examine how recycler operating decisions influenced potential market demand. Chen et al. [35] found that green product premiums could signal corporate environmental commitment and investment in green practices, thereby strengthening consumer recognition of and preference for green products. Pretner et al. [36] further found that the willingness of consumers to purchase green products increases significantly as the transparency and completeness of relevant product information improve. Zhao et al. [37] demonstrated that sharing a portion of subsidy benefits between remanufacturers and consumers could expand the market for green products and strengthen incentives to purchase remanufactured products. However, existing studies have often reduced the behavioral role of consumers to passive responses or fixed preferences, thereby failing to capture adequately the dynamic evolution of willingness to pay, green awareness, and strategic choice.
To more accurately characterize multi-stakeholder interactions in reverse supply chains for urban mineral resource recovery, evolutionary game frameworks have been progressively extended to incorporate a broader range of actors. Wang et al. [12] developed a tripartite evolutionary game model involving the government, recycling enterprises, and consumers to examine the interplay between policy regulation and corporate behavior. Zhao and Bai [17] constructed a multi-agent coordination model of e-waste recycling that included recycling enterprises, manufacturing firms, and the government. Their results showed that policy support could effectively stimulate green innovation by both manufacturers and recyclers. Wang et al. [38] further incorporated consumers into the analytical framework and developed a four-party evolutionary game model comprising the government, consumers, recyclers, and resource recovery enterprises to investigate the strategic evolution of stakeholder participation in WEEE recycling under government intervention. Ge and Wu [39] likewise constructed a four-party evolutionary game model involving the government, consumers, formal recycling enterprises, and informal recyclers, revealing how the strategic choices of different actors shaped the evolutionary outcomes of the recycling system. Although multi-agent studies have broadened the analytical scope of e-waste governance, they have paid insufficient attention to cooperative innovation within reverse supply chains and to the endogenous risks arising from such cooperation.
Given that external policy incentives alone are insufficient to fully eliminate coordination impediments within the supply chain, scholarly attention has increasingly shifted from external governance to coordination among supply-side firms. When recycling and remanufacturing remain persistently disconnected, the overall performance of the reverse supply chain may continue to be constrained even as consumer preferences move toward greener consumption [40,41]. Zhao and Bai [17] found that interfirm cooperation often remained superficial and was strongly shaped by policy dependence and short-term profit motives. Cooperative innovation between upstream and downstream firms has therefore emerged as a central mechanism for deepening industrial-chain coordination [42]. Ma et al. [43] developed a bilateral evolutionary game model involving e-waste remanufacturers and e-commerce platforms and found that input costs played a critical role in sustaining innovation-oriented cooperation. Yet technological collaboration inevitably generates spillover effects alongside the sharing of knowledge and technology [44]. Ge et al. [45] treated spillovers as an endogenous variable and examined how variation in spillover intensity affected innovation cooperation among firms. Xu et al. [46] showed that excessive technological spillovers could weaken incentives for research and development and undermine cooperative decision-making. Ishikawa and Shibata (2021) [47] further demonstrated that research and development decisions were influenced by spillovers from other firms and that greater asymmetry in spillover levels tended to widen disparities in research and development investment. Yang et al. [48] found that asymmetries in resources and information intensified opportunistic behavior among partners, whereas explicit contracts could mitigate such risks to some extent. To address these endogenous risks, Zhang et al. [49] developed a differential game model involving a green-innovating manufacturer and a free-riding manufacturer to examine the dynamic evolution of green innovation cooperation. Wang et al. [50], using a two-stage game model, investigated how potential spillovers affected incentives for reliability investment within manufacturer–supplier relationships. Nevertheless, existing studies have largely concentrated on internal cooperation and incentive arrangements among firms, thereby providing limited insight into how external governance and market feedback jointly shape the evolution of cooperative innovation.
In summary, existing research has established an important theoretical foundation for the governance of e-waste reverse supply chains, yet several limitations remain. Most multi-actor governance studies are confined to tripartite game frameworks and devote limited attention to the joint effects of differentiated government policies and dynamic adjustments in consumer strategies. Meanwhile, research on cooperative innovation has rarely examined endogenous risks arising from asymmetric interdependence, technological spillovers, and opportunistic behavior between firms. Against this background, this study makes three principal contributions:
(1) This study treats recyclers and remanufacturers as interdependent innovation partners and incorporates the government and consumers as policy-regulation and market-feedback actors, respectively. The resulting evolutionary game framework integrates interfirm cooperation with external governance mechanisms.
(2) From the perspective of cooperative innovation, the model incorporates asymmetric interdependence, opportunistic gains, penalties for breach of contract, and coordination costs into firm strategic decision-making, thereby revealing the effects of endogenous cooperation risks.
(3) The findings identify the stability conditions and effective parameter ranges of multi-actor collaborative governance, thereby providing theoretical foundations and policy implications for designing stage-contingent interventions and strengthening contractual constraints on interfirm cooperation.
3. Construction of Evolutionary Game Model
3.1. Problem Description
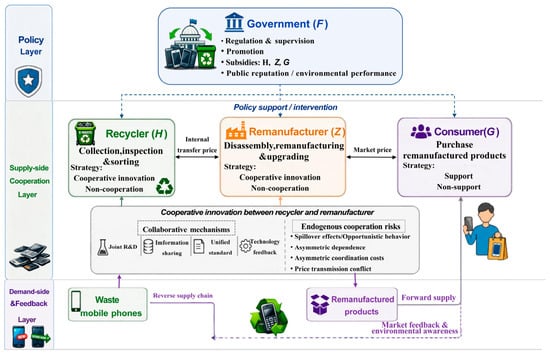
The reverse supply chain of waste mobile phones primarily focuses on a refurbishment-oriented recycling pathway aimed at product reuse. Specifically, consumers transfer discarded mobile phones to formal recycling channels, where recyclers are responsible for collection, inspection, and preliminary sorting. Based on the condition of recovered devices, remanufacturers convert waste mobile phones into refurbished products through repair, component replacement, and other remanufacturing activities. These refurbished products are subsequently introduced into the second-hand market, thereby extending product life cycles and promoting the circular utilization of urban mineral resources [51]. Cooperative innovation between recyclers and remanufacturers is reflected in joint research and development and coordinated optimization concerning quality grading, component identification, disassembly processes, remanufacturing standards, and improvements in product performance. Recyclers provide front-end information on the sources of waste mobile phones, quality sorting, and market feedback, whereas remanufacturers put forward demands related to process improvement, quality control, and product innovation. Through information sharing, joint standard setting, and technological feedback, the two parties jointly promote the upgrading of remanufacturing technologies, quality improvement, and innovation in remanufactured products [52].
In actual cooperative innovation, the two parties often exhibit heterogeneity in investment intensity, risk sharing, and resource endowments, which may readily lead to an imbalance in the distribution of cooperative benefits [24]. Moreover, the two parties form a complex relationship of asymmetric interdependence. Recyclers depend on remanufacturers in terms of product flows, technological support, and sales conversion, whereas remanufacturers depend on recyclers for raw material sources, quality sorting, and stable supply. This mismatch in the degree of dependence directly gives rise to disparities in bargaining power and divergences in interest claims, thereby exposing cooperative contracts to endogenous risks of instability [27]. In addition, information asymmetry and bounded rationality make it difficult for recyclers and remanufacturers to fully identify the true level of investment, contract performance, and technological contribution of the other party, thereby potentially inducing risks of innovation spillover and opportunistic behavior [44]. During the stage of deep cooperation in which rigid contractual constraints are absent, one party may continue to appropriate and exploit previously shared outcomes after deviating from the cooperation agreement or after the breakdown of the cooperative relationship, thereby transforming innovation spillovers into opportunistic gains. Correspondingly, the compliant party not only loses the original collaborative benefits but also bears coordination costs associated with reconstructing the cooperative relationship, searching for alternative partners, rematching operational processes, and adjusting production plans [53].
At the regulatory level, the government acts as an external regulator and intervenes in the market through policy instruments such as fiscal subsidies and environmental publicity campaigns, with the aim of guiding the green transformation of enterprises and cultivating environmentally oriented consumer preferences. However, the government needs to strike a balance between fiscal constraints and environmental governance objectives. The environmental benefits of the government encompass comprehensive utility maximization, including social reputation gains and green performance outputs [54]. On the demand side, consumers make purchasing decisions based on an integrated utility assessment that incorporates cost performance, functional attributes, and green preferences [55]. The perceived value gap relative to virgin products and the opportunity loss associated with green consumption are reflected in substitution choices across distinct mental accounts. As the terminal feedback mechanism of the market, consumer demand directly moderates the innovation incentives of firms: demand expansion generates positive feedback for capacity development and R&D investment, whereas insufficient trust or weak environmental awareness may give rise to market-friction effects [56].
In summary, under the assumption of bounded rationality, the government, recyclers, remanufacturers, and consumers continuously revise their strategies based on their respective cost–benefit considerations, environmental performance, and social utility. The dynamic game among these actors, characterized by replicator dynamic equations, jointly shapes the collaborative evolutionary trajectory and operational efficiency of the system. The specific game-theoretic relationships among the four parties are illustrated in Figure 1.
Figure 1.
Game relationships among the four parties in reverse supply chains.
3.2. Basic Assumptions and Parameter Definitions
Based on the preceding theoretical reasoning and review of the relevant literature, this study proposes the following research hypotheses. The corresponding variables and their definitions are reported in Table 1.
Table 1.
Model variables and definitions.
Assumption 1.
When recyclers and remanufacturers engage in cooperative innovation, the two parties jointly bear the cooperative investment cost CA, with recyclers assuming a proportion and remanufacturers assuming the remaining proportion (1 − ). The value co-creation benefit generated through cooperative R&D is denoted by and allocated between the two parties according to the agreed distribution ratio . The degrees of dependence between recyclers and remanufacturers, denoted by or , reflects the extent to which one party depends on the other in terms of raw-material supply, sales conversion, and related operational linkages. During the cooperative process, if either party deviates from the cooperative agreement or causes the cooperation to break down, the defaulting party no longer fulfills its cooperative obligations but may still appropriate opportunistic gains, denoted by or , by exploiting technological knowledge, customer resources, and other assets acquired during the earlier stage of cooperation. Meanwhile, the defaulting party is required to pay a penalty . Correspondingly, the compliant party bears coordination costs, denoted by or , such as those associated with adjustments to production plans. In addition, to ensure that the penalty can effectively deter opportunistic behavior, M is assumed to exceed the potential opportunistic gains from unilateral defection.
Assumption 2.
When the government adopts a supportive strategy, it incurs publicity cost CF and provides subsidies to recyclers, remanufacturers, and consumers, denoted by SH, SZ, and SC, respectively. In this case, government utility consists of environmental performance gains, denoted by PF, and social reputation or public credibility gains, denoted by HF. When the government adopts a non-supportive strategy, it incurs no fiscal expenditure. However, if enterprises still engage voluntarily in cooperative innovation, the government, as a representative of the public interest, continues to obtain environmental performance gains PF generated by positive externalities.
Assumption 3.
When consumers adopt a supportive strategy, reflecting their overall support for remanufactured products and circular consumption patterns, they pay the price (Vm) and obtain product functional utility (HC). If enterprises implement cooperative innovation under this condition, consumers will further obtain additional environmental benefits (PC). In addition, the supportive behavior of consumers generates a market expansion effect, increasing the demand for recycled and remanufactured products by and , respectively, relative to their baseline levels. If consumers adopt a non-supportive strategy, they forgo the purchase, and the market size of enterprises remains at the baseline level (, ). In this case, VC denotes the negative psychological utility experienced by consumers after abandoning purchases and enters the utility function of the non-supportive strategy as a negative term.
4. Solution and Stability Analysis of Evolutionary Game Models
Based on the study hypotheses, the logic of strategic choice, and the core benefit claims of the four stakeholders in the waste mobile phones reverse supply chains, the payoff matrix of the four-party game is constructed, as shown in Table 2.
Table 2.
Payoff matrix of the four-party evolutionary game.
4.1. Stability Analysis of Recycler Strategy Selection
Let denote the expected payoff of a waste mobile phone recycler that engages in cooperative innovation, and let denote the expected payoff of a recycler that does not engage in cooperative innovation. The corresponding expressions are given in Equations (1) and (2).
The replicator dynamic equation for the strategy selection of recyclers is Equation (3):
According to the stability criterion for differential equations, an equilibrium point of the recycler replicator dynamic is locally stable only if the following conditions are satisfied: F(i) = 0 and F′(i) < 0.
Theorem 1.
When j > j*, g > g*, and f > f*, the stable strategy for recyclers is to engage in cooperative innovation. When j < j*, g < g*, and f < f* the stable strategy is not to engage in cooperative innovation. When j = j*, g = g*, and f = f*, the stable strategy cannot be determined. Equations (4), (5), and (6) give the threshold probabilities for remanufacturers, government support, and consumer support, respectively.
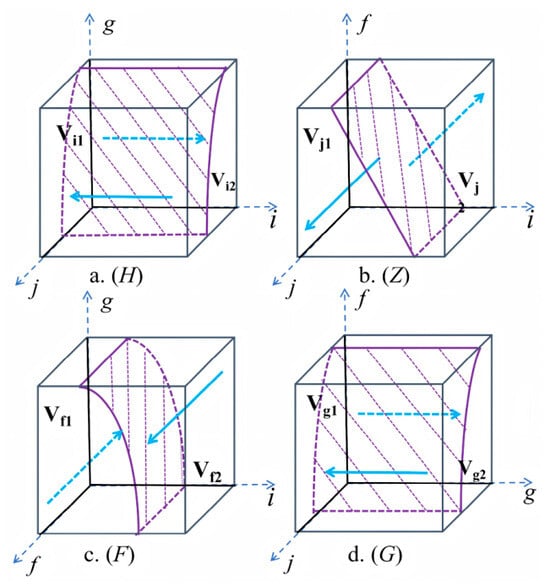
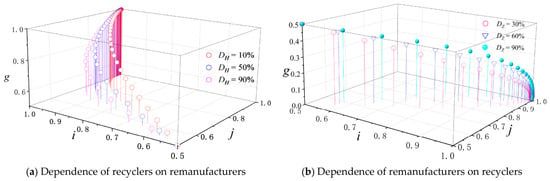
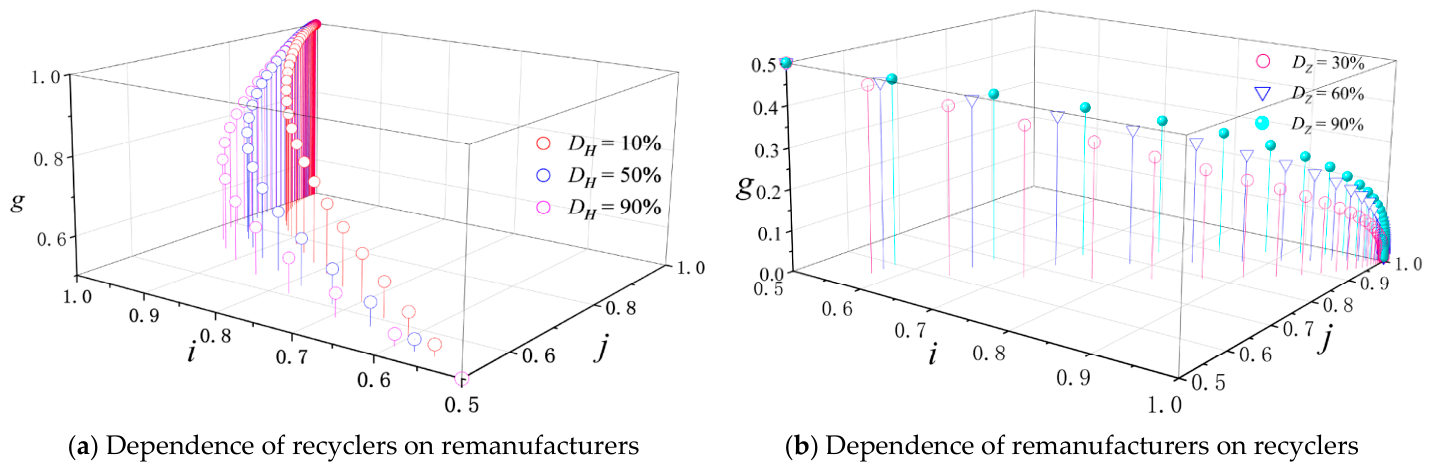
Let g1 and g2 denote the boundary values obtained satisfying j*(g1) = 1 and j*(g2) = 0, respectively. According to Theorem 1, the phase diagram for recycler strategy selection is determined by the relevant parameters, where . When j* = 1, ; When j* = 0, . Considering the relative magnitudes of g1 and g2 and the feasible range of the decision probabilities, this study focuses on the case 1 > g1 > g2 > 0. Based on the preceding stability analysis, the phase diagram for recycler strategy selection is constructed, as shown in Figure 2a.
Figure 2.
Phase diagrams of strategy evolution for the four stakeholders.
The strategy regions in which recyclers engage in cooperative innovation and do not engage in cooperative innovation are denoted by i1 and i2, respectively, and their corresponding volumes are Vi1 and Vi2, as given in Equations (7) and (8).
Corollary 1.
Holding other parameters constant, provided that the government subsidy to recyclers remains within an effective incentive range, the probability that recyclers engage in cooperative innovation increases with the government subsidy () and the penalty for breach of contract (), but decreases with the coordination cost(KH).
4.2. Stability Analysis of Remanufacturer Strategy Selection
Let denote the expected payoff of a remanufacturer that engages in cooperative innovation, and let denote the expected payoff of a remanufacturer that does not engage in cooperative innovation. The corresponding expressions are given in Equations (9) and (10).
The replicator dynamic equation for strategy selection in remanufacturers is Equation (11):
Theorem 2.
When i > i*, g > g*, and f > f*, the stable strategy for remanufacturers is to engage in cooperation innovation. When i < i*, g < g*, and f < f*, the stable strategy is not to engage in cooperative innovation. When i = i*, g = g*, and f = f*, the stable cannot be determined. Let. Equations (12), (13), and (14) give the threshold probabilities for recycler cooperation, government support, and consumer support, respectively.
According to Theorem 2, when the recycler threshold is i* = 1, ; When i* = 0, . Considering the feasible range of the decision probabilities, this study focuses on the case 1 > f2 > f1 > 0. Based on the preceding stability analysis, the phase diagram for remanufacturer strategy selection is constructed, as shown in Figure 2b.
The strategy regions in which remanufacturers engage in cooperative innovation and do not engage in cooperative innovation are denoted by j1 and j2, respectively. Their corresponding volumes, Vj1 and Vj2, are given in Equations (15) and (16).
Corollary 2.
Holding other parameters constant, provided that the probability of recyclers engaging in cooperative innovation is less than one, the probability that remanufacturers engage in cooperative innovation increases with the government subsidy to remanufacturers (SZ) and the penalty for breach of contract (M), but decreases with the coordination cost (KZ).
4.3. Stability Analysis of Government Strategy Selection
Let denote the expected payoff when the government adopts the support strategy, and let denote the expected payoff when the government adopts the non-support strategy. The corresponding expressions are given in Equations (17) and (18).
The replicator dynamic equation for government strategy selection is Equation (19):
Theorem 3.
When i < i*, j < j*, and g < g*, the stable strategy for the government is to support cooperative innovation. When i > i*, j > j*, and g > g*, the stable strategy is not to support cooperative innovation. When i = i*, j = j*, g = g*, the stable strategy cannot be determined. Equations (20), (21), and (22) give the threshold probabilities for recycler cooperation, remanufacturer cooperation, and consumer support, respectively.
According to Theorem 3, the phase diagram of government strategy selection is determined by relevant parameters. When the recycler strategy threshold is i* = 0, ; When i* = 1, . Considering the feasible range of the decision probabilities, this study focuses on the case 1 > g1 > g2 > 0. Based on the preceding stability analysis, the phase diagram for government strategy selection is constructed, as shown in Figure 2c.
The strategy regions in which the government adopts the support and non-support strategies are denoted by f1 and f2, respectively. Their corresponding volumes, Vf1 and Vf2, are given in Equations (23) and (24).
Corollary 3.
Holding other parameters constant, the relative payoff of the government from supporting cooperative innovation increases with government reputation and social benefits (HF), but decreases with the government promotion cost (CF) and the expected subsidy expenditures for recyclers, remanufacturers, and consumers (SH, SZ and SC).
4.4. Stability Analysis of Consumer Strategy
Let πg denote the expected payoff of a consumer who supports and purchases remanufactured products, and let π1−g denote the expected payoff of a consumer who does not support or purchase remanufactured products. The corresponding expressions are given in Equations (25) and (26).
The replicator dynamic equation for consumer strategy selection is Equation (27):
Theorem 4.
When i > i*, j > j*, and f > f*, the stable strategy for consumers is to support and purchase remanufactured products. When i < i*, j < j*, and f < f*, the stable strategy is not to purchase remanufactured products. When i = i*, j = j*, and f = f*, the stable strategy is uncertain. Equations (28), (29), and (30) represent the decision probability thresholds for recyclers, remanufacturers, and the government, respectively.
According to Theorem 4, the phase diagram for consumer strategy selection is determined by relevant parameters. When j* = 1, ; When j* = 0, . Considering the feasible range of the decision probabilities, this study focuses on the case 1 > f2 > f1 > 0. Based on the preceding stability analysis, the phase diagram for consumer strategy selection is constructed, as shown in Figure 2d.
The strategy regions in which consumers support and purchase remanufactured products and do not support or purchase such products are denoted by g1 and g2, respectively. Their corresponding volumes, Vg1 and Vg2, are given in Equations (31) and (32).
Corollary 4.
Holding other parameters constant, the probability that consumers support and purchase remanufactured products increases with the practical value obtained from remanufactured products (HC), the perceived environmental benefit (PC), the consumer subsidy (SC), and the environmental opportunity loss associated with not purchasing remanufactured products (VC), but decreases with the market price of remanufactured products (Vm).
4.5. Stability Analysis of Strategy Combination
Within the multi-agent collaborative governance framework, Lyapunov’s first method is employed to examine the local stability of the candidate equilibrium strategy profiles of the four game participants [57]. Accordingly, the Jacobian matrix of the four-party evolutionary game system is derived, as shown in Equation (33). Each candidate equilibrium point is then substituted into the Jacobian matrix, and the resulting expressions for the matrix entries are reported in Table 3.
Table 3.
Jacobian matrix expressions.
According to this stability criterion, an equilibrium is considered asymptotically stable and qualifies as an ESS if all eigenvalues of the corresponding Jacobian matrix possess negative real parts. Conversely, if at least one eigenvalue (λ) exhibits a positive real part, the equilibrium is unstable and cannot be classified as an ESS. In cases where all nonzero eigenvalues (λ) have negative real parts but one or more eigenvalues equal zero, the stability of the equilibrium cannot be determined directly by this criterion. The pure-strategy equilibrium points of the four-party evolutionary game are presented in Table 4.
Table 4.
Stability analysis of the pure strategy solution of the four-party evolutionary game.
Since Conditions ①–④ are rarely satisfied simultaneously, the system converges to exactly one of the four candidate ESSs from the given initial conditions under each baseline parameter setting in the numerical simulations. This finding lays a theoretical foundation for the subsequent localized analysis of individual equilibrium states and confirms the existence of four distinct ESS patterns.
5. Numerical Application and Simulation Analysis
5.1. Data Sources
Given the characteristics of the waste mobile phone recycling governance process, including multistage investment, substantial uncertainty, and delayed returns, the initial probabilities that recyclers, remanufacturers, the government, and consumers adopt their respective positive strategies are set as (i, j, f, g) = (0.5, 0.5, 0.5, 0.5).
To ensure consistent and traceable parameter calibration, a single waste mobile phone is adopted as the baseline analytical unit, and industry-level data are converted into unit-level values where applicable. Table 5 presents the data sources and calibration rationales for all model parameters.
Table 5.
Basis for setting model parameter values.
5.2. Possible ESS Point Evolution Path Analysis
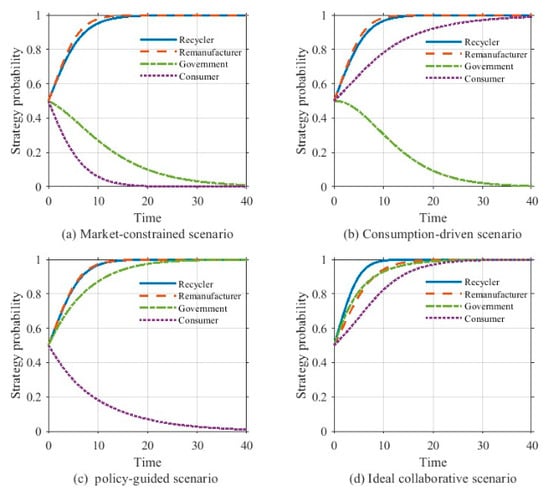
The ESS (1, 1, 0, 0) represents a market-constrained scenario in which recyclers and remanufacturers engage in cooperative innovation, whereas the government adopts a non-support strategy and consumers have no intention of purchasing remanufactured products [43]. The corresponding evolutionary trajectories are shown in Figure 3a. Under this scenario, the probability of cooperative innovation among recyclers and remanufacturers increases rapidly during the initial stage of the simulation and subsequently converges to a high level. Nevertheless, the prolonged absence of government support and consumer participation results in insufficient external incentives and stagnant market demand, ultimately causing the system to converge to a self-organized partial equilibrium sustained solely by interfirm cooperation. Such a scenario may arise during the early stages of formal recycling-system development or in regions with limited institutional support. Under these conditions, although interfirm cooperation remains stable, the overall collaborative governance system may become locked in a low-performance equilibrium and remain vulnerable to shocks arising from technological spillovers and imbalances in benefit distribution.
Figure 3.
Evolution path at different equilibrium points.
The ESS (1, 1, 0, 1) corresponds to a state in which recyclers and remanufacturers engage in cooperative innovation and consumers actively support remanufactured products, whereas the government adopts a non-support strategy. Under these conditions, firms receive positive demand-side incentives but lack sustained policy and institutional support for maintaining long-term cooperation. This state represents a consumption-driven scenario [58], and the corresponding evolutionary trajectories are illustrated in Figure 3b. The continued increase in consumer participation sends a positive market signal and improves the expected payoffs from cooperative innovation, thereby encouraging recyclers and remanufacturers to sustain their cooperative strategies. Such a scenario may arise during the market expansion of remanufactured products, particularly in first- and second-tier cities, and can be regarded as a market-demand-driven stage of system evolution. Further evolution toward a more comprehensive collaborative equilibrium requires the introduction and strengthening of policy support and institutional safeguards.
The ESS (1, 1, 1, 0) corresponds to a state in which recyclers and remanufacturers engage in cooperative innovation under government subsidies and regulatory support, whereas consumer acceptance of remanufactured products remains limited. This state represents a policy-guided scenario [59], and the corresponding evolutionary trajectories are illustrated in Figure 3c. During the initial stage of evolution, intensive government subsidies provide strong incentives for cooperative innovation, leading to rapid increases in the probabilities that recyclers and remanufacturers adopt cooperative strategies. The system subsequently converges to a stable state. However, this equilibrium is sustained primarily by policy incentives rather than by market demand. As the marginal incentive effect of subsidies weakens, the stability of interfirm cooperation increasingly depends on internal cooperation mechanisms, including effective constraints on opportunistic behavior and a balanced distribution of cooperative benefits. Nevertheless, limited consumer adoption continues to restrict market demand, thereby creating a significant demand-side bottleneck. Such a scenario may arise during the early development of formal reverse supply chains and may constitute an intermediate stage in the evolution toward a more comprehensive collaborative equilibrium. Once interfirm cooperation becomes sufficiently stable, the government can gradually redirect policy resources from supply-side incentives toward demand-side support and promote the transition to a higher-level system equilibrium by cultivating end-market demand.
The ESS (1, 1, 1, 1) corresponds to a state in which the government, recyclers, remanufacturers, and consumers jointly promote system development through the alignment of policy incentives and market responses. This configuration represents an ideal collaborative scenario [54], and the corresponding evolutionary trajectories are illustrated in Figure 3d. Within this framework, policy support, interfirm coordination, and consumer participation generate mutually reinforcing effects. During the initial stage of evolution, all actors increasingly adopt their respective active strategies. Their strategy probabilities subsequently become highly synchronized and ultimately converge to a stable equilibrium. Such a scenario may arise at a mature stage of collaborative governance, characterized by the coordinated development of institutional support, technological capacity, and market acceptance. Policy instruments and market mechanisms reinforce each other: government measures reduce barriers to cooperative innovation, while market demand absorbs remanufactured products and recognizes the environmental value associated with them. Consequently, the system exhibits strong resilience and a substantial capacity for self-sustained operation.
5.3. Sensitivity Analysis of Key Parameters
5.3.1. Spillover Effects on Cooperation Stability
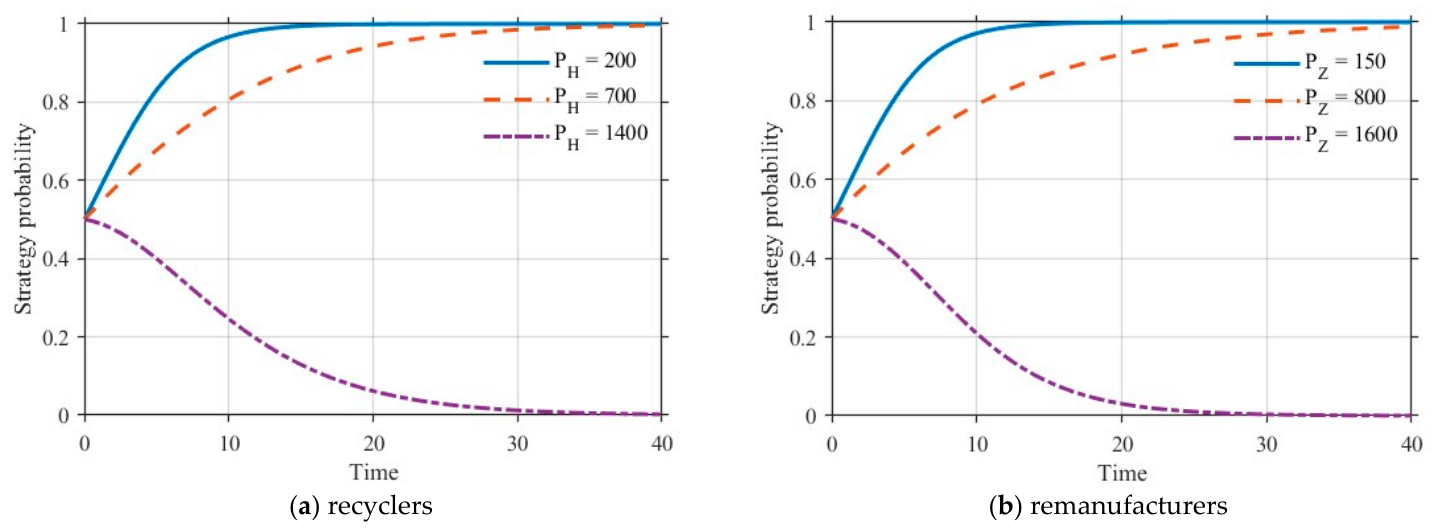
Under the market-constrained scenario, a sensitivity analysis was conducted to examine the effects of the opportunistic gains of recyclers (PH) and remanufacturers (PZ), and the results are presented in Figure 4. To examine the evolutionary response of the system under high opportunistic pressure, extreme-scenario simulations were conducted using parameter values above the critical threshold range identified through preliminary parameter scanning, namely PH = 1400 yuan/unit and PZ = 1600 yuan/unit.
Figure 4.
The impact of opportunism on cooperative innovation.
When opportunistic gains remain relatively low (e.g., PH = 200 and PZ = 150), the benefits derived from opportunistic behavior are insufficient to outweigh the synergistic behavior generated by sustained cooperation, and the system ultimately converges to a cooperative innovation equilibrium. However, as opportunistic gains increase beyond these levels, the stability of cooperation deteriorates markedly. When the opportunistic gain for recyclers reaches PH = 700, the cooperative strategy can still converge to a stable state, although at a noticeably slower rate. By contrast, when PH = 1400, the probability that recyclers engage in cooperative innovation declines rapidly and approaches zero, as shown in Figure 4a. Similarly, when the opportunistic gain for remanufacturers reaches PZ = 800, the system remains capable of sustaining a cooperative equilibrium, although convergence becomes noticeably slower. However, when PZ = 1600, the probability that remanufacturers engage in cooperative innovation declines sharply, ultimately undermining the stability of the interfirm cooperative relationship, as shown in Figure 4b. The substantial short-term gains associated with opportunistic defection undermine incentive compatibility between firms and thereby significantly weaken the stability of cooperative arrangements.
This phenomenon is more likely to occur in cooperative innovation networks characterized by inadequate intellectual property protection, weak contract enforcement, and unclear rules for allocating innovation outcomes. Once cooperative achievements can be imitated or appropriated at relatively low cost, incentives for contractual compliance may rapidly weaken, causing cooperative relationships to shift from fragile stability toward rapid breakdown. For example, during the early implementation of the Waste Electrical and Electronic Equipment (WEEE) Directive, inadequate intellectual property protection reportedly allowed some small and medium-sized enterprises to imitate technologies developed by their partners, thereby undermining technological alliances and collaborative arrangements [59].
5.3.2. Effects of the Default Penalty and Coordination Costs on Cooperation Stability
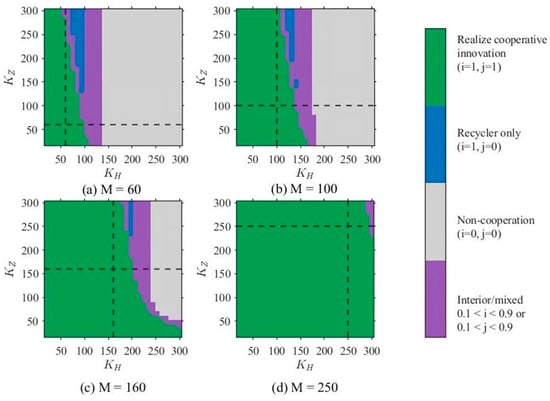
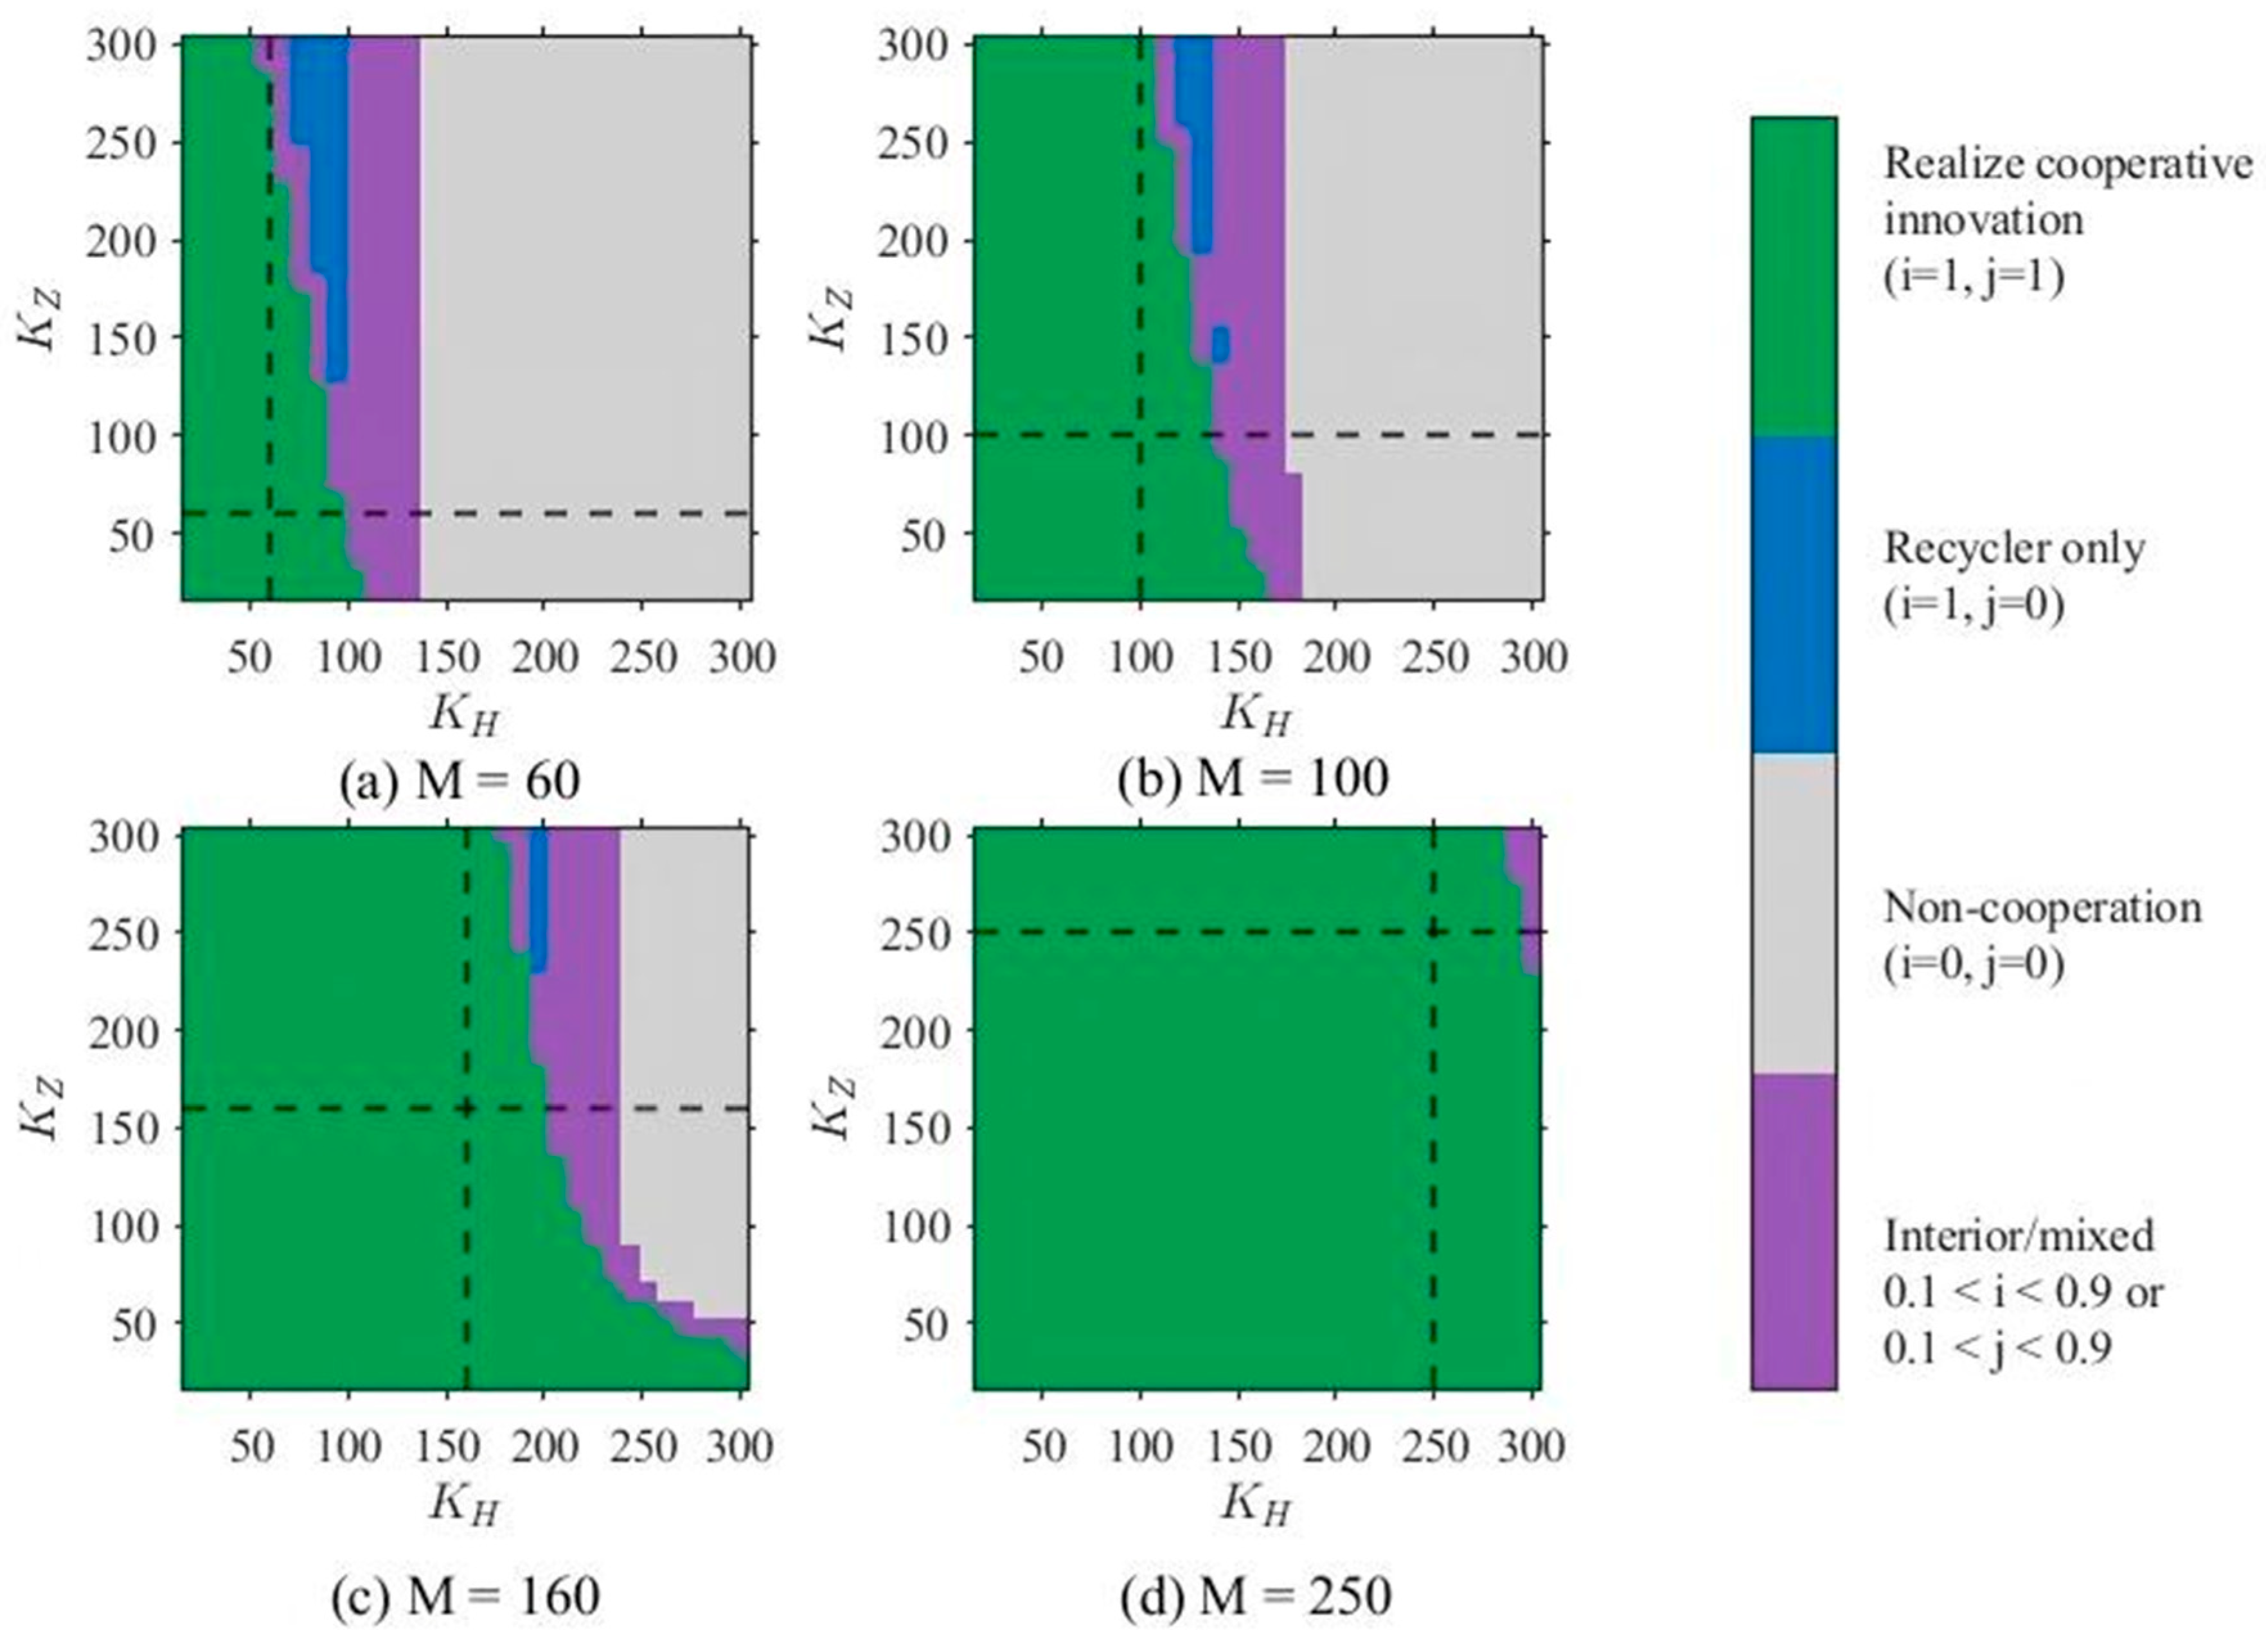
Figure 5 illustrates how different combinations of the coordination costs borne by the recycler and the remanufacturer affect the equilibrium outcomes of the system at varying levels of the penalty for breach of contract. The two dashed lines indicate KH = M and KZ = M, respectively.
Figure 5.
Cooperation stability under different default penalties and coordination costs.
When M = 60, the relatively low penalty for breach of contract sustains the full cooperative innovation equilibrium only within a narrow region where KH < 50. As KH and KZ increase, the system gradually shifts from full cooperation toward mixed-strategy outcomes. Once KH exceeds 135, the deterrent effect of the penalty becomes largely ineffective, and the system ultimately converges to the complete non-cooperation equilibrium, as shown in Figure 5a. When M = 100, the region corresponding to full cooperation expands modestly but remains concentrated primarily within the range KH < 100. Further increases in coordination costs continue to shift the system toward mixed-strategy or non-cooperative outcomes, as shown in Figure 5b. When M = 160, the region of full cooperative innovation expands substantially, indicating that the system becomes more capable of withstanding increases in coordination costs. Mixed-strategy and non-cooperative outcomes occur primarily in the high-cost region where KZ > 160, as shown in Figure 5c. When M = 250, the full cooperative innovation equilibrium encompasses almost the entire parameter space, as shown in Figure 5d. Notably, the recycler is in a relatively disadvantaged position in terms of both benefit appropriation and bargaining power and depends more heavily on the remanufacturer than the remanufacturer depends on the recycler. This asymmetric dependence strengthens the incentive of the recycler to maintain the existing cooperative relationship, thereby giving rise, within certain parameter ranges, to an equilibrium in which only the recycler continues to engage in cooperative innovation.
Overall, when the default penalty falls below the coordination costs, the stability of cooperative innovation is severely undermined. A cooperative contract generates a sufficiently strong deterrent effect only when the default penalty exceeds the coordination costs borne by both participating firms.
5.3.3. Effects of Interfirm Dependence on Cooperation Stability
Figure 6 illustrates the effects of interdependence between recyclers and remanufacturers on the evolutionary trajectories of the system. Based on the structure of business dependence in cooperative relationships within the waste mobile phone industry and an analysis of representative cases, three sets of dependence parameters are specified to represent distinct cooperation scenarios. Specifically, DH = 10% and DZ = 30% represent a low-interdependence scenario in which both parties have relatively diversified sources of resources and business partners; DH = DZ = 50% represents a balanced-interdependence scenario in which the two parties exhibit comparable levels of dependence on each other; and DH = DZ = 90% represents an extremely high-interdependence scenario characterized by strong business linkages and highly integrated resource relationships.
Figure 6.
Effects of enterprise dependence intensity on the four stakeholders.
A low degree of recycler dependence on remanufacturers allows recyclers to maintain their operations through alternative channels, thereby weakening the relational constraints that encourage interfirm cooperation. Under these conditions, the system relies more heavily on government support to compensate for insufficient internal coordination, causing the government support strategy to converge more rapidly toward full adoption, as shown in Figure 6a. In contrast, as the dependence of remanufacturers on recyclers increases, the need to ensure a stable supply of raw materials and effective quality sorting becomes more pronounced, thereby slowing the withdrawal of government support, as shown in Figure 6b.
When the interdependence between recyclers and remanufacturers becomes highly asymmetric, as in the case where recyclers depend heavily on remanufacturers while remanufacturers remain relatively less dependent on recyclers (DH = 90% and DZ = 30%), the cooperative relationship shifts from mutual complementarity to asymmetric dependence. Under this configuration, recyclers occupy a relatively disadvantaged position in bargaining and benefit distribution and consequently bear a greater share of the risks associated with cooperation. By contrast, remanufacturers may exploit their dominant position to obtain greater benefits, thereby exacerbating asymmetries in benefit distribution and strengthening incentives for opportunistic behavior. Consequently, although the cooperative relationship may persist in the short term, it becomes less stable over time, the convergence of the system slows, and the willingness of firms to cooperate may eventually decline.
5.3.4. Effects of Government Subsidy Intensity on Strategic Evolution
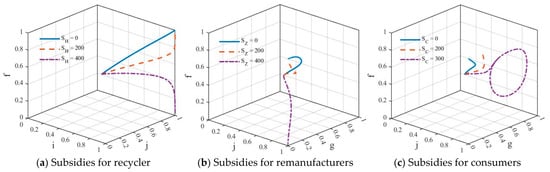
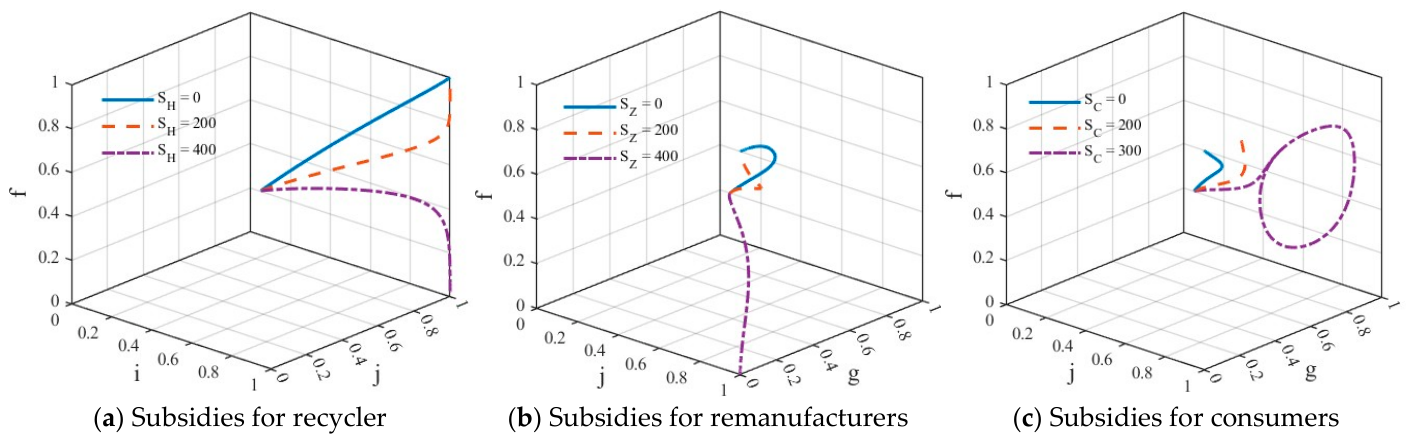
A sensitivity simulation was conducted on government subsidies targeting the supply side (SH, SZ) and the demand side (SC), with the resulting evolutionary trajectories presented in Figure 7. Compared with the no-subsidy benchmark scenario, a subsidy of 200 allocated to cooperative innovation by recyclers significantly accelerates the convergence of the recycler strategy toward cooperative innovation and, through interfirm strategic interactions, promotes the adoption of cooperative strategies by remanufacturers. However, when the expected total subsidy expenditure exceeds the net benefits after deducting government implementation costs (e.g., SH = 400), the evolutionary probability of government support gradually declines and approaches zero, which may weaken the marginal incentive effect of subsidies to some extent (Figure 7a). When SZ = 0, the government support probability initially increases but subsequently declines, shifting toward the non-support strategy in the middle and later evolutionary stages. As SZ increases, the relative payoff of the government support strategy decreases further; at SZ = 400, the support probability rapidly converges to zero. Meanwhile, a higher SZ directly increases the relative payoff of cooperative innovation for remanufacturers, thereby accelerating their convergence toward the cooperative innovation strategy (Figure 7b).
Figure 7.
Effects of government subsidy strategies on decisions of the four participants.
The consumer subsidy (SC) directly increases the relative payoff from purchasing remanufactured products, as represented by the term fSC. When the government maintains the support strategy, the resulting increase in market demand further encourages remanufacturers to engage in cooperative innovation. However, when SC = 300, the strategy probabilities of all participants exhibit persistent oscillations, preventing the system from converging to a stable equilibrium (Figure 7c). This instability arises from the dynamic feedback mechanism between the government and consumers. An increase in consumer support willingness raises the government’s expected subsidy expenditure, represented by the gSC term, thereby reducing the relative payoff of the government support strategy. As a result, the evolutionary probability of government support declines, potentially leading to an incentive distortion effect.
5.4. Pricing Mechanisms and System Equilibrium
5.4.1. Analysis of the Impact of Internal Transfer Prices
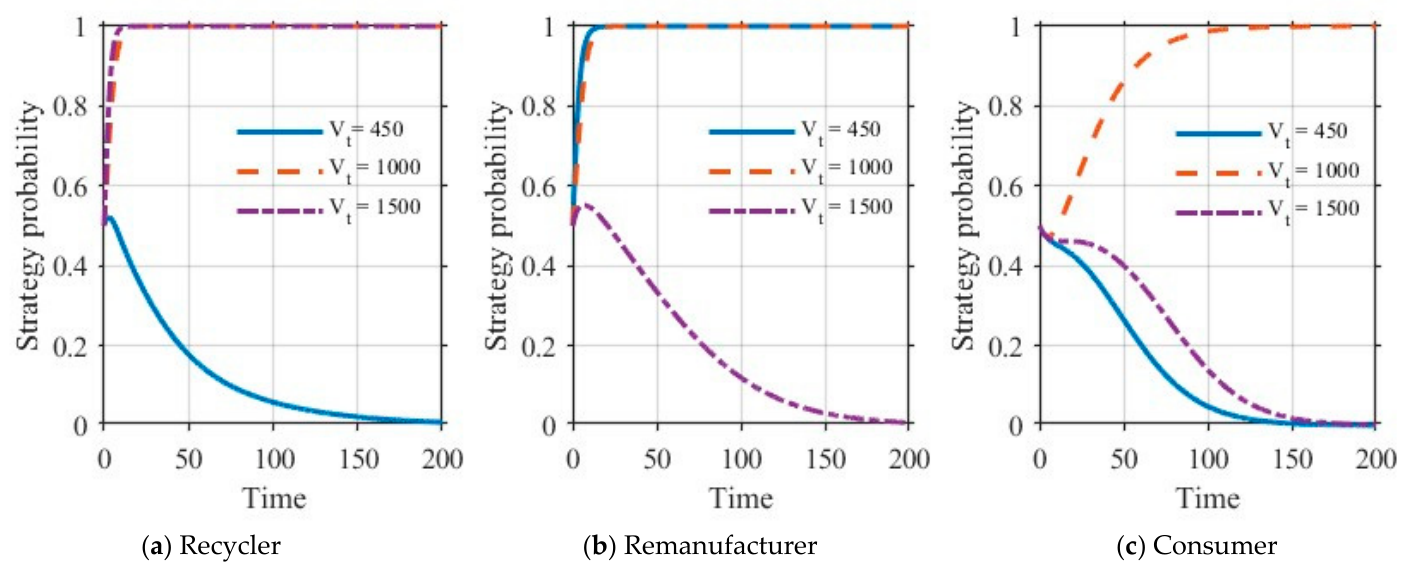
The internal transfer price in the reverse supply chain (Vt) is a critical determinant of benefit distribution between recyclers and remanufacturers and plays an important role in achieving a system-wide collaborative equilibrium [60]. To ensure analytical tractability and facilitate comparisons across different transfer-price scenarios, this study assigns Vt a fixed value within each simulation scenario while varying it across scenarios. The simulation results are presented in Figure 8.
Figure 8.
Impacts of internal transfer pricing on decisions of stakeholders.
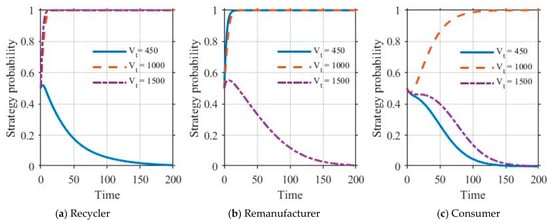
When the transfer price is set at a low level, such as Vt = 450, the unit revenue received by recyclers is insufficient to cover the costs of collection, sorting, and upstream coordination. Consequently, their incentives to engage in cooperative innovation weaken, and the system tends to converge toward a non-cooperative equilibrium. By contrast, remanufacturers benefit from access to waste mobile phones at a relatively low cost and therefore initially converge rapidly toward the cooperative innovation strategy. However, weak cooperation at the recycling stage reduces consumer confidence in the quality and environmental value of remanufactured products, thereby weakening market acceptance and ultimately limiting demand-side support. When the transfer price falls within the incentive-compatible range (e.g., Vt = 1000), an effective balance is achieved between the revenue requirements of recyclers and the cost-bearing capacity of remanufacturers. Under these conditions, the incentive-compatibility requirements of both parties are satisfied simultaneously, thereby promoting technological innovation and enhancing the value of remanufactured products. This process strengthens consumer support and drives the system toward a stable collaborative equilibrium. When the internal transfer price rises to a high level, such as Vt = 1500, the raw-material acquisition costs of remanufacturers increase sharply, and the resulting profits become insufficient to cover the investment costs and market risks associated with cooperative innovation. Consequently, remanufacturers withdraw from cooperative innovation before recyclers do. The resulting decline in product-quality improvement and innovation capacity subsequently reduces the expected utility of consumers, ultimately driving the system toward a non-cooperative or less collaborative equilibrium.
5.4.2. Analysis of the Impact of Market Transaction Prices
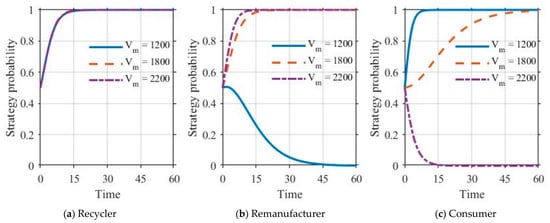
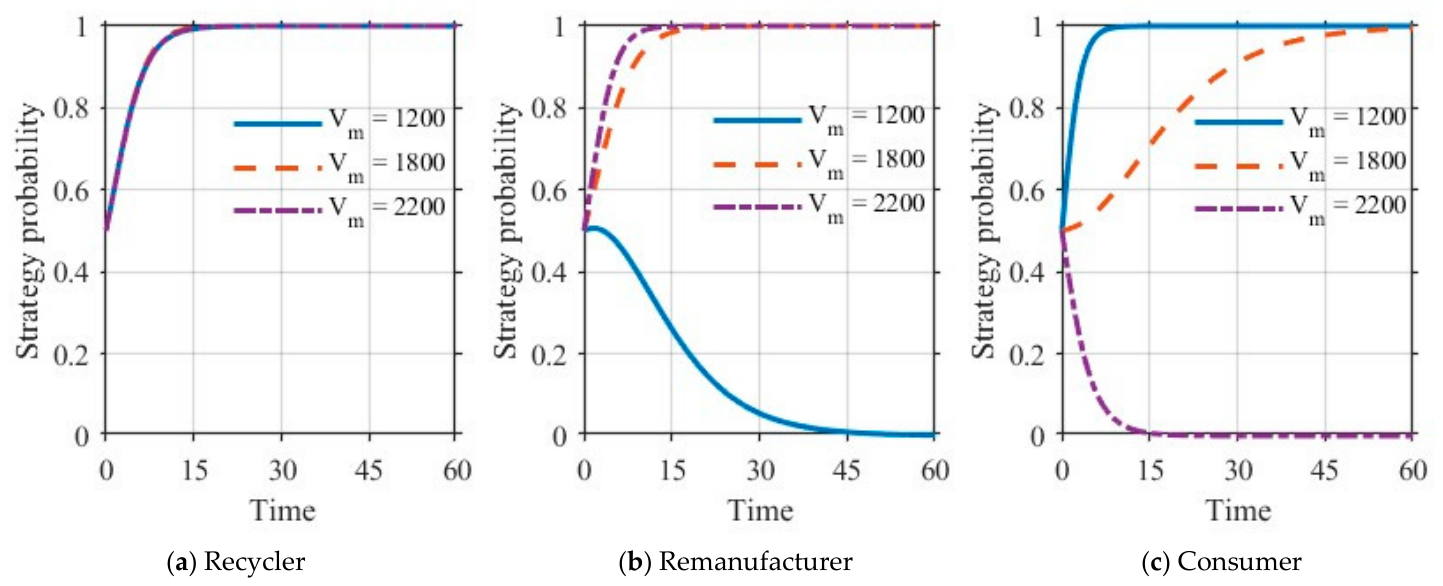
The end-market price of remanufactured products (Vm) serves as a key market signal linking the supply of remanufactured products with consumer demand. Variations in Vm directly affect market penetration and profit distribution along the reverse supply chain [61]. The corresponding simulation results are presented in Figure 9. The market price of remanufactured products has no significant effect on the strategic choices of recyclers. Once their profit requirements are satisfied, recyclers consistently converge toward the cooperative innovation strategy, as shown in Figure 9a. Within the low-price range, such as Vm = 1200, remanufacturers tend to converge toward the non-cooperation strategy, whereas consumers rapidly converge toward the strategy of supporting and purchasing remanufactured products, as shown in Figure 9b,c.
Figure 9.
Impacts of market pricing of remanufactured products on decisions of stakeholders.
The favorable price–performance ratio of remanufactured products facilitates rapid market penetration, while the resulting increase in demand strengthens the incentives of firms to cooperate by increasing sales revenue, thereby generating a market-pull effect. Nevertheless, excessively low prices substantially reduce the profitability of remanufacturers, constrain their capacity to finance ongoing research and development, and ultimately weaken their incentives to engage in cooperative innovation. When the market price is sufficient to cover the associated costs (e.g., Vm = 1800), consumers exhibit a slower convergence toward the supporting-purchase strategy, whereas the proportion of remanufacturers adopting cooperative innovation continues to increase. At this price level, remanufactured products maintain a relatively high level of market acceptance and generate sufficient market demand. Meanwhile, adequate profit margins provide remanufacturers with stable incentives for innovation, thereby facilitating technological upgrading on the supply side. By contrast, once the price exceeds the upper bound of the value perceived by consumers, such as Vm = 2200, market demand contracts rapidly and consumer hesitation intensifies. As the gap between perceived value and the actual price widens, the probability that consumers will support and purchase remanufactured products declines markedly.
6. Conclusions and Discussion
6.1. Conclusions
Taking waste mobile phones as the research object, this study develops a four-party evolutionary game model involving recyclers, remanufacturers, the government, and consumers to investigate the evolutionary dynamics of cooperative innovation. The model captures the strategic interactions and collaborative evolution of multiple stakeholders under bounded rationality and conflicting interests. Using replicator dynamics and eigenvalue analysis of the Jacobian matrix, four types of ESSs are identified. Numerical simulations and sensitivity analyses are then conducted to examine how key factors, including technological spillovers, government subsidies, and pricing mechanisms, affect the evolutionary trajectories and equilibrium stability of the system. The principal findings are summarized as follows:
(1) The evolutionary dynamics of the system can be classified into four typical ESS scenarios: market-constrained, consumption-driven, policy-guided, and ideal collaborative. The first three correspond to transitional equilibrium states arising from demand-side stagnation, inadequate institutional and policy support, and delayed consumer responsiveness, respectively. By contrast, the ideal collaborative scenario emerges only when government incentives, enterprise engagement in cooperative innovation, and consumer support are simultaneously reinforced, enabling the system to converge to a high-level collaborative equilibrium. (2) Opportunistic gains and dependence structures exert significant threshold effects on cooperation stability. Imbalanced dependence relationships weaken collaborative stability and induce opportunistic behavior, whereas opportunistic gains exceeding critical thresholds drive the cooperative system toward instability. (3) The incentive effectiveness of government subsidies follows a stage-dependent evolutionary pattern. Government subsidies play a pronounced facilitating role during the initial stage of cooperation; however, their marginal utility gradually diminishes as cooperative behavior becomes increasingly endogenous. (4) Both internal transfer prices and terminal market prices have clearly bounded effective ranges. Consumer trust and environmental preferences exhibit system-dynamic feedback effects and path-dependent characteristics, thereby constituting critical conditions for driving the system toward a high-quality stable equilibrium.
6.2. Discussion
In real-world contexts, collaborative innovation among firms cannot rely solely on short-term economic incentives. Instead, it requires long-term cooperation agreements, benefit-sharing mechanisms, and contractual penalty constraints to mitigate opportunistic behavior through institutional arrangements. Based on the stage-dependent effects identified in the simulation results, government intervention should be dynamically adjusted according to the evolutionary stage of the industry. During the initial stage of industrial development, supply-side subsidies and incentive policies should be appropriately strengthened to reduce the cost barriers associated with cooperative innovation and encourage firms to establish collaborative relationships. As cooperation between recyclers and remanufacturers gradually matures, policy priorities should shift from direct financial subsidies toward institutional development and market environment optimization. Meanwhile, enhancing consumer trust, establishing comprehensive third-party certification systems for remanufactured products, and continuously promoting green consumption awareness can strengthen demand-side market feedback, thereby providing essential support for the long-term stability of circular reverse supply chains.
6.3. Limitations
This study has several limitations. As a numerical application study rather than an empirical case study, the model parameters are specified based on publicly available industry information, relevant literature, and reasonable scenario assumptions. Further validation using firm-level survey data is required in future research. In addition, the price variables were treated as exogenous parameters. Future research could extend the evolutionary game framework by incorporating endogenous pricing mechanisms.
Author Contributions
Conceptualization, Y.C. and X.L.; Methodology, S.L. and Z.L.; Formal analysis, Y.C., S.L. and X.L.; Investigation, X.L.; Resources, Y.C.; Data curation, S.L.; Writing—original draft, S.L. and Z.L.; Writing—review and editing, Y.C., S.L., X.L. and Z.L.; Visualization, Y.C. and S.L.; Supervision, Y.C. and S.L.; Project administration, Y.C.; Funding acquisition, S.L. and X.L. All authors have read and agreed to the published version of the manuscript.
Funding
This work was supported by the Construction Project of the Philosophy and Social Sciences Innovation Team of Yancheng Polytechnic College (YGSK202502), the General Project for Philosophy and Social Sciences Research of Jiangsu Higher Education Institutions (2026SJYB797), and the Innovation Project of Guangxi Graduate Education (YCSW2026630).
Data Availability Statement
The data sets generated and analyzed during the current research period can be obtained from the corresponding authors upon reasonable request.
Conflicts of Interest
The authors declare no conflicts of interest.
References
- Chang, W.; Hongjun, G.; Lyushui, Z.; Hailin, Y. China’s urban minerals policies: Evolution, problems and countermeasures—A quantitative research. J. Clean. Prod. 2018, 197, 114–123. [Google Scholar] [CrossRef] [Scilit]
- Liu, G.; Xu, Y.; Tian, T.; Wang, T.; Liu, Y. The impacts of China’s fund policy on waste electrical and electronic equipment utilization. J. Clean. Prod. 2020, 251, 119582. [Google Scholar] [CrossRef] [Scilit]
- Mu, X.; Zhang, M.; Chu, X.; Li, L.; Yin, F. Exploration of driving factors for smartphone abandonment and recycling in China. J. Mater. Cycles Waste Manag. 2025, 27, 4499–4515. [Google Scholar] [CrossRef] [Scilit]
- Zheng, Y.; Zhang, L.; Chen, X.; Ying, H.; Wang, B. A feasibility analysis of damage-oriented waste mobile phone liquid crystal display repair industrialization based on potential retirement predict model. Environ. Impact Assess. Rev. 2026, 116, 108107. [Google Scholar] [CrossRef] [Scilit]
- Baldé, C.P.; Kuehr, R.; Yamamoto, T.; McDonald, R.; D’Angelo, E.; Althaf, S.; Bel, G.; Deubzer, O.; Fernandez-Cubillo, E.; Forti, V. Global e-Waste Monitor 2024. Available online: https://ewastemonitor.info/the-global-e-waste-monitor-2024/ (accessed on 3 August 2026).
- Teng, D.; Wu, J.; Ma, Q.; Wang, W.; Zhou, G.; Fan, G.; Cao, Y.; Li, P. Advances in the Recovery of Critical Rare Dispersed Metals (Gallium, Germanium, Indium) from Urban Mineral Resources. ACS Omega 2025, 10, 76–92. [Google Scholar] [CrossRef] [Scilit] [PubMed]
- Gómez, M.; Grimes, S.; Qian, Y.; Feng, Y.; Fowler, G. Critical and strategic metals in mobile phones: A detailed characterisation of multigenerational waste mobile phones and the economic drivers for recovery of metal value. J. Clean. Prod. 2023, 419, 138099. [Google Scholar] [CrossRef] [Scilit]
- ITU (International Telecommunication Union). Mobile Phone Ownership; International Telecommunication Union: Geneva, Switzerland, 2025; Available online: https://www.itu.int/itu-d/reports/statistics/2025/10/15/ff25-mobile-phone-ownership/ (accessed on 3 August 2026).
- Singh, A.; Goel, A.; Chauhan, A.; Singh, S.K. Sustainability of Electronic Product Manufacturing through E-Waste Management and Reverse Logistics. Sustain. Futures 2025, 9, 100490. [Google Scholar] [CrossRef] [Scilit]
- Giglio, E.; Pedro, F.; Carvalho, L.C.; Xara-Brasil, D. The governance of E-waste recycling networks: Insights from São Paulo City. Waste Manag. 2023, 161, 10–16. [Google Scholar] [CrossRef] [Scilit] [PubMed]
- Maitre-Ekern, E. Re-thinking producer responsibility for a sustainable circular economy from extended producer responsibility to pre-market producer responsibility. J. Clean. Prod. 2021, 286, 125454. [Google Scholar] [CrossRef] [Scilit]
- Wang, Z.; Wang, Q.; Chen, B.; Wang, Y. Evolutionary game analysis on behavioral strategies of multiple stakeholders in E-waste recycling industry. Resour. Conserv. Recycl. 2020, 155, 104618. [Google Scholar] [CrossRef] [Scilit]
- Wang, L.; Cai, K.; Song, Q.; Zeng, X.; Yuan, W.; Li, J. How effective are WEEE policies in China? A strategy evaluation through a PMC-index model with content analysis. Environ. Impact Assess. Rev. 2025, 110, 107672. [Google Scholar] [CrossRef] [Scilit]
- China Resources Recycling Association. Report on the Development of China’s Renewable Resource Recycling Industry(2025); China Resources Recycling Association: Beijing, China, 2025; Available online: https://www.crra.org.cn (accessed on 3 August 2026).
- Rizos, V.; Bryhn, J. Implementation of circular economy approaches in the electrical and electronic equipment (EEE) sector: Barriers, enablers and policy insights. J. Clean. Prod. 2022, 338, 130617. [Google Scholar] [CrossRef] [Scilit]
- Abhyankar, A.; Sudarsan, J.; Prakash, A.; Subramani, A.K.; G, M.; Bhalla, V.; Gupta, K.K. Extended Producer Responsibility in Mitigating E-waste: A Study of Mobile Phone Users in India. Circ. Econ. Sustain. 2026, 6, 260. [Google Scholar] [CrossRef] [Scilit]
- Zhao, X.; Bai, X. How to motivate the producers’ green innovation in WEEE recycling in China?–An analysis based on evolutionary game theory. Waste Manag. 2021, 122, 26–35. [Google Scholar] [CrossRef] [Scilit] [PubMed]
- Agrawal, S.; Kumar, D.; Singh, R.K.; Singh, R.K. Coordination issues in managing the reverse supply chain: A systematic literature review and future research directions. Benchmarking Int. J. 2023, 30, 1259–1299. [Google Scholar] [CrossRef] [Scilit]
- Choi, J. Mitigating the challenges of partner knowledge diversity while enhancing research & development (R&D) alliance performance: The role of alliance governance mechanisms. J. Prod. Innov. Manag. 2020, 37, 26–47. [Google Scholar] [CrossRef] [Scilit]
- Wang, X.; Sun, J.; Tian, L.; Guo, W.; Gu, T. Environmental dynamism and cooperative innovation: The moderating role of state ownership and institutional development. J. Technol. Transf. 2021, 46, 1344–1375. [Google Scholar] [CrossRef] [Scilit]
- Pérez, J.A.H.; Geldes, C.; Kunc, M.H.; Flores, A. New approach to the innovation process in emerging economies: The manufacturing sector case in Chile and Peru. Technovation 2019, 79, 35–55. [Google Scholar] [CrossRef] [Scilit]
- Su, T.; Yu, Y.; Chen, Y.; Hou, W. On or off: The triggering effect of underperformance duration on cooperative innovation. Technovation 2023, 126, 102817. [Google Scholar] [CrossRef] [Scilit]
- Wang, M.-C.; Chen, P.-C.; Fang, S.-C. A critical view of knowledge networks and innovation performance: The mediation role of firms’ knowledge integration capability. J. Bus. Res. 2018, 88, 222–233. [Google Scholar] [CrossRef] [Scilit]
- Zou, Y.; He, D.; Sun, R. Research on the mechanism of collaborative innovation in green technology among supply chain enterprises based on cost sharing and market competition. Sustainability 2024, 16, 6295. [Google Scholar] [CrossRef] [Scilit]
- Telg, N.; Lokshin, B.; Letterie, W. How formal and informal intellectual property protection matters for firms’ decision to engage in coopetition: The role of environmental dynamism and competition intensity. Technovation 2023, 124, 102751. [Google Scholar] [CrossRef] [Scilit]
- Ferreira, J.J.; Fernandes, C.I.; Veiga, P.M. The effects of knowledge spillovers, digital capabilities, and innovation on firm performance: A moderated mediation model. Technol. Forecast. Soc. Change 2024, 200, 123086. [Google Scholar] [CrossRef] [Scilit]
- Yang, Z.; Zhang, H.; Xie, E. Relative buyer-supplier relational strength and supplier’s information sharing with the buyer. J. Bus. Res. 2017, 78, 303–313. [Google Scholar] [CrossRef] [Scilit]
- He, Z.X.; Xu, S.C.; Shen, W.X.; Long, R.Y.; Chen, H. Factors that influence corporate environmental behavior: Empirical analysis based on panel data in China. J. Clean. Prod. 2016, 133, 531–543. [Google Scholar] [CrossRef] [Scilit]
- Esenduran, G.; Kemahlıoğlu-Ziya, E.; Swaminathan, J.M. Impact of take-back regulation on the remanufacturing industry. Prod. Oper. Manag. 2017, 26, 924–944. [Google Scholar] [CrossRef] [Scilit]
- Liu, Z.; Tang, J.; Li, B.-y.; Wang, Z. Trade-off between remanufacturing and recycling of WEEE and the environmental implication under the Chinese Fund Policy. J. Clean. Prod. 2017, 167, 97–109. [Google Scholar] [CrossRef] [Scilit]
- Tian, G.; Xia, Z.; Tian, R.; Sun, H.; Yu, L.; Sun, D. Online and offline cooperation promotion mechanism in the E-waste recycling industry. Environ. Impact Assess. Rev. 2024, 104, 107337. [Google Scholar] [CrossRef] [Scilit]
- Zhang, X.-m.; Li, Q.-w.; Liu, Z.; Chang, C.-T. Optimal pricing and remanufacturing mode in a closed-loop supply chain of WEEE under government fund policy. Comput. Ind. Eng. 2021, 151, 106951. [Google Scholar] [CrossRef] [Scilit]
- Chen, Y.; Wang, J.; Yu, Y. A study on consumers’ willingness to pay for remanufactured products: A study based on hierarchical regression method. Front. Psychol. 2019, 10, 2044. [Google Scholar] [CrossRef] [Scilit] [PubMed]
- Li, Y.; Xu, F.; Zhao, X. Governance mechanisms of dual-channel reverse supply chains with informal collection channel. J. Clean. Prod. 2016, 155, 125–140. [Google Scholar] [CrossRef] [Scilit]
- Chen, C.; Zhang, D.; Zhu, L.; Zhang, F. Promoting green choices: How price premium displays influence consumer preference for green products. Resour. Conserv. Recycl. 2024, 207, 11. [Google Scholar] [CrossRef] [Scilit]
- Pretner, G.; Darnall, N.; Testa, F.; Iraldo, F. Are consumers willing to pay for circular products? The role of recycled and second-hand attributes, messaging, and third-party certification. Resour. Conserv. Recycl. 2021, 175, 105888. [Google Scholar] [CrossRef] [Scilit]
- Zhao, S.; Zhu, Q.; Cui, L. A decision-making model for remanufacturers: Considering both consumers’ environmental preference and the government subsidy policy. Resour. Conserv. Recycl. 2018, 128, 176–186. [Google Scholar] [CrossRef] [Scilit]
- Wang, Z.; Duan, Y.; Huo, J. The impact of government intervention measures on recycling of waste electrical and electronic equipment in China considering consumer decision. Energy Policy 2022, 160, 112697. [Google Scholar] [CrossRef] [Scilit]
- Ge, M.; Wu, C. Recycling of retired power batteries: A four-party evolutionary game considering consumer behavior preferences and informal recyclers’ participation. Energy Strategy Rev. 2026, 64, 102136. [Google Scholar] [CrossRef] [Scilit]
- Jiang, X.; Wang, L.; Cao, B.; Fan, X. Benefit distribution and stability analysis of enterprises’ technological innovation cooperation alliance. Comput. Ind. Eng. 2021, 161, 107637. [Google Scholar] [CrossRef] [Scilit]
- Schøtt, T.; Jensen, K.W. Firms’ innovation benefiting from networking and institutional support: A global analysis of national and firm effects. Res. Policy 2016, 45, 1233–1246. [Google Scholar] [CrossRef] [Scilit]
- Yenipazarli, A. To collaborate or not to collaborate: Prompting upstream eco-efficient innovation in a supply chain. Eur. J. Oper. Res. 2017, 260, 571–587. [Google Scholar] [CrossRef] [Scilit]
- Ma, R.; Lin, B. Internet development, information availability, and Chinese enterprises’ cooperative green technology innovation. J. Environ. Manag. 2024, 367, 121972. [Google Scholar] [CrossRef] [Scilit] [PubMed]
- de Sousa, A.G.; Braga, M.J.; Meyer, L.F. Impact of cooperation on the R&D activities of Brazilian firms. Procedia Econ. Finance 2015, 24, 172–181. [Google Scholar] [CrossRef] [Scilit]
- Ge, Z.; Hu, Q.; Xia, Y. Firms’ R&D Cooperation Behavior in a Supply Chain. Prod. Oper. Manag. 2014, 23, 599–609. [Google Scholar] [CrossRef] [Scilit]
- Xu, L.; Wang, C.; Li, H. Decision and coordination of low-carbon supply chain considering technological spillover and environmental awareness. Sci. Rep. 2017, 7, 3107. [Google Scholar] [CrossRef] [Scilit] [PubMed]
- Ishikawa, N.; Shibata, T. R&D competition and cooperation with asymmetric spillovers in an oligopoly market. Int. Rev. Econ. Finance 2020, 72, 624–642. [Google Scholar] [CrossRef] [Scilit]
- Yang, N.; Song, Y.; Zhang, Y.; Wang, J. Dark side of joint R&D collaborations: Dependence asymmetry and opportunism. J. Bus. Ind. Mark. 2020, 35, 741–755. [Google Scholar] [CrossRef] [Scilit]
- Zhang, F.; Zhang, Z.; Xue, Y.; Zhang, J.; Che, Y. Dynamic Green Innovation Decision of the Supply Chain with Innovating and Free-Riding Manufacturers: Cooperation and Spillover. Complexity 2020, 2020, 8937847. [Google Scholar] [CrossRef] [Scilit]
- Wang, Y.; Xiao, Y.; Yang, N. Improving reliability of a shared supplier with competition and spillovers. Eur. J. Oper. Res. 2014, 236, 499–510. [Google Scholar] [CrossRef] [Scilit]
- Santana, J.C.C.; Guerhardt, F.; Franzini, C.E.; Ho, L.L.; Júnior, S.E.R.R.; Cânovas, G.; Yamamura, C.L.K.; Vanalle, R.M.; Berssaneti, F.T. Refurbishing and recycling of cell phones as a sustainable process of reverse logistics: A case study in Brazil. J. Clean. Prod. 2021, 283, 124585. [Google Scholar] [CrossRef] [Scilit]
- Reficco, E.; Gutiérrez, R.; Jaén, M.H.; Auletta, N. Collaboration mechanisms for sustainable innovation. J. Clean. Prod. 2018, 203, 1170–1186. [Google Scholar] [CrossRef] [Scilit]
- Liu, S.; Papageorgiou, L.G. Fair profit distribution in multi-echelon supply chains via transfer prices. Omega 2018, 80, 77–94. [Google Scholar] [CrossRef] [Scilit]
- Wei, S.; Zhang, Z.; Ke, G.Y.; Chen, X. The more cooperation, the better? Optimizing enterprise cooperative strategy in collaborative innovation networks. Phys. A Stat. Mech. Its Appl. 2019, 534, 120810. [Google Scholar] [CrossRef] [Scilit]
- Hong, X.; Govindan, K.; Xu, L.; Du, P. Quantity and collection decisions in a closed-loop supply chain with technology licensing. Eur. J. Oper. Res. 2017, 256, 820–829. [Google Scholar] [CrossRef] [Scilit]
- Tojeiro-Rivero, D.; Moreno, R. Technological cooperation, R&D outsourcing, and innovation performance at the firm level: The role of the regional context. Res. Policy 2019, 48, 1798–1808. [Google Scholar] [CrossRef] [Scilit]
- Goldhirsch, I.; Sulem, P.-L.; Orszag, S.A. Stability and Lyapunov stability of dynamical systems: A differential approach and a numerical method. Phys. D Nonlinear Phenom. 1987, 27, 311–337. [Google Scholar] [CrossRef] [Scilit]
- Shevchenko, T.; Laitala, K.; Danko, Y. Understanding consumer E-waste recycling behavior: Introducing a new economic incentive to increase the collection rates. Sustainability 2019, 11, 2656. [Google Scholar] [CrossRef] [Scilit]
- Ma, L.; Ali, A.; Shahzad, M.; Khan, A. Factors of green innovation: The role of dynamic capabilities and knowledge sharing through green creativity. Kybernetes 2025, 54, 54–70. [Google Scholar] [CrossRef] [Scilit]
- Guo, L.; Qu, Y.; Tseng, M.-L.; Wu, C.; Wang, X. Two-echelon reverse supply chain in collecting waste electrical and electronic equipment: A game theory model. Comput. Ind. Eng. 2018, 126, 187–195. [Google Scholar] [CrossRef] [Scilit]
- Liu, Y.; Xia, Z.-j.; Shi, Q.-q.; Xu, Q. Pricing and coordination of waste electrical and electronic equipment under third-party recycling in a closed-loop supply chain. Environ. Dev. Sustain. 2021, 23, 12077–12094. [Google Scholar] [CrossRef] [Scilit]

Disclaimer/Publisher’s Note: The statements, opinions and data contained in all publications are solely those of the individual author(s) and contributor(s) and not of MDPI and/or the editor(s). MDPI and/or the editor(s) disclaim responsibility for any injury to people or property resulting from any ideas, methods, instructions or products referred to in the content. |
© 2026 by the authors. Licensee MDPI, Basel, Switzerland. This article is an open access article distributed under the terms and conditions of the Creative Commons Attribution (CC BY) license.