1. Introduction
With the increasing energy demand and worsening environmental concerns, fuel cells have attracted considerable attention as efficient and clean energy conversion technologies due to their high efficiency, low emissions, and modular design. In fuel cell stacks, uniform reactant distribution is essential for stable operation and high performance, and previous studies have shown that flow uniformity is extremely sensitive to manifold pressure variation, channel resistance, manifold geometry, and feed conditions [
1,
2,
3]. In multi-stack SOFC systems, non-uniform flow distribution may cause insufficient local reactant supply, uneven pressure drops, and reduced system stability. In particular, the external manifold structure, connection position, and geometric parameters can significantly influence flow allocation among stacks, highlighting the importance of comparative analysis and structural optimization in manifold design [
2,
3,
4,
5].
Recent studies have further confirmed that, beyond the basic manifold dimensions, detailed structural optimization of the gas supply system is essential for improving flow uniformity and reducing pressure loss in SOFC stacks. Numerical investigations have shown that external-manifold design, including manifold type, guide plates, buffer chambers, inlet–outlet tube size, and manifold depth, can significantly influence local resistance matching, vortex formation, and cell-to-cell flow allocation, while integrated optimization of manifolds and interconnect flow fields can further enhance reactant pre-distribution and overall flow stability within the stack [
6,
7,
8,
9]. Meanwhile, the effects of connection configuration are not limited to geometric differences alone, but also depend strongly on stack scale, fuel and air utilization, fuel type, and operating conditions. Comparative studies of U-type and Z-type SOFC stacks have shown that these configurations can produce distinct flow, thermal, and electrochemical distributions, and that their relative advantages may vary with stack height and operating environment, indicating that both structural optimization and configuration-dependent analysis are necessary for the design of multi-stack SOFC interconnection systems [
3,
10,
11].
From the perspective of gas flow behavior, non-uniformity in SOFC stacks should be interpreted not only by the overall connection pattern, but also by how the total flow resistance is distributed among manifolds, pipes, and repeating-unit channels. Studies on internal-manifold stacks have shown that variations in manifold size, stack capacity, and stack height directly modify outlet-manifold pressure distributions, and that the deterioration of inter-cell flowrate and pressure-drop uniformity becomes more pronounced as the stack scale increases [
4,
5,
12]. In parallel, external-manifold and modular-stack studies have indicated that inlet-conditioning structures, such as flared tubes, perforated or sieve plates, guide components, and simplified single-row modular layouts, can effectively pre-distribute the incoming gas, suppress local maldistribution, and improve flow uniformity before the gas enters individual units [
13,
14]. These results suggest that, for multi-stack SOFC systems, gas-flow resistance management and inlet-flow conditioning are as important as the selection of the U-type or Z-type connection itself.
Recent studies on fuel cell flow-field optimization have further demonstrated that the design of gas-flow channels and manifold-related structures plays a decisive role in regulating reactant distribution, mass transfer, water management, and overall cell performance. For example, mixed flow-field configurations that combine the advantages of parallel and interdigitated channels have been shown to improve oxygen transport and water removal while maintaining relatively low-pressure losses. In addition, the introduction of baffles or bluff-body structures into flow channels can enhance local flow disturbance and convective mass transfer, thereby improving reactant supply to the active reaction region. However, these structural modifications may also increase flow resistance and pumping power, indicating that fuel cell flow-field design requires a careful balance between mass-transfer enhancement and pressure-drop penalty. These findings highlight the importance of optimizing flow paths, local resistance distribution, and reactant allocation strategies, which is also highly relevant to the design of manifold and pipeline connection configurations in multi-stack SOFC systems [
15,
16].
In addition to manifold geometry, the connection configuration is also a key factor affecting flow uniformity, because the different inlet–outlet arrangements and flow paths in U-type and Z-type configurations lead to different pressure-drop distributions and flow allocation characteristics. Previous studies have shown that the relative advantages of these two configurations depend on stack scale, operating conditions, and structural arrangement, and that they can produce different flow, thermal, and electrochemical behaviors in SOFC stacks [
17,
18]. In the authors’ previous study on a 4 × 1 kW planar SOFC interconnection structure, the preferred configuration was found to differ between the fuel side and the air side, with the Z-type being more favorable for the fuel side and the U-type showing better stability on the air side [
19]. However, in the present 4 × 1 kW columnar stack structure, the vertically arranged four-stack configuration introduces a more complex three-dimensional flow path, which may alter the local resistance distribution, pressure gradient, and gravity-related flow behavior. Therefore, it is necessary to re-evaluate the applicability of the previous planar results to the columnar structure. Based on this, the present study comparatively investigates flow uniformity associated with U/Z-type layouts in a 4 kW columnar SOFC stack structure to clarify their effects on flow allocation and to provide guidance for interconnection design in multi-stack SOFC systems [
2,
4,
17,
19].
Although the flow characteristics of U-type and Z-type manifold or pipeline connections have been widely investigated in fuel cell systems, most existing studies have mainly focused on single-stack configurations or horizontally arranged multi-stack systems. In such horizontal layouts, the stacks are generally placed on the same elevation, and the influence of gravity on flow distribution among different stacks is relatively limited. However, in practical large-scale SOFC systems, multiple stacks are often assembled in a vertically stacked or columnar configuration to improve system compactness and power density. Compared with the horizontal arrangement, the vertically stacked structure introduces additional height differences among stacks, which may cause non-uniform pressure distribution, gravity-induced flow imbalance, and different matching characteristics between the main pipeline pressure loss and the branch flow resistance. Therefore, the flow behavior in a vertically stacked multi-stack SOFC system cannot be fully explained by the results obtained from horizontal configurations [
19].
To address this gap, the present study focuses on a vertically stacked 4 × 1 kW SOFC multi-stack system and systematically compares the effects of U-type and Z-type external pipeline connections on cathode and anode flow uniformity. In contrast to previous horizontal-stack studies, this work considers the influence of the vertical arrangement and gravitational effects on the flow distribution among four stacked SOFC modules. By analyzing the mass flow distribution, flow uniformity, and local reactant utilization under different connection configurations, this study aims to clarify the flow characteristics of columnar SOFC systems and provide practical guidance for the pipeline design and scale-up of multi-stack SOFC systems.
To overcome these limitations, this work developed a high-accuracy 3D CFD numerical framework for a vertically arranged 4 kW SOFC multi-stack system. The system consists of four planar SOFC stack modules rated at 1 kW each, with every stack comprising 40 individual cells. Since stacked systems are commonly implemented in practical fuel-cell applications, a systematic assessment was conducted to determine how U/Z-type piping arrangements affect mass-flow allocation, flow consistency, and local reactant-gas utilization under different operating conditions. It should be clarified that the present study adopts a steady-state CFD simulation approach, which assumes that the SOFC system has reached stable operating conditions and that boundary conditions such as inlet mass flow rate remain constant. Therefore, the results mainly reflect the influence of different pipeline connection configurations on flow distribution characteristics under stable operating conditions. The key contributions presented in this work are outlined below:
A comprehensive three-dimensional model of a vertically stacked SOFC multi-stack system was developed. In addition, grid convergence was evaluated through the Grid Convergence Index approach to confirm the robustness of the numerical results.
Unlike the previously studied horizontally connected planar configuration, this study focuses on a vertically stacked multi-stack arrangement and clarifies how different pipeline connection configurations influence flow distribution in this structure.
In addition to mass flow uniformity, local reaction gas utilization was introduced as an additional evaluation parameter to assess the influence of non-uniform flow distribution on reactant supply and utilization efficiency in each stack.
Gravity was considered in the present model to better represent the flow behavior of the vertically stacked SOFC system under practical operating conditions.
The model does not consider electrochemical reactions, multi-component species transport, or heat transfer processes. In actual SOFC operation, reactant consumption caused by electrochemical reactions changes the local gas composition, density, and transport properties, while temperature gradients may induce buoyancy-driven natural convection. These coupled electrochemical, thermal, and mass transport effects can further influence the flow distribution among individual stacks.
2. Materials and Methods
2.1. Numerical Framework for the SOFC Stack Assembly
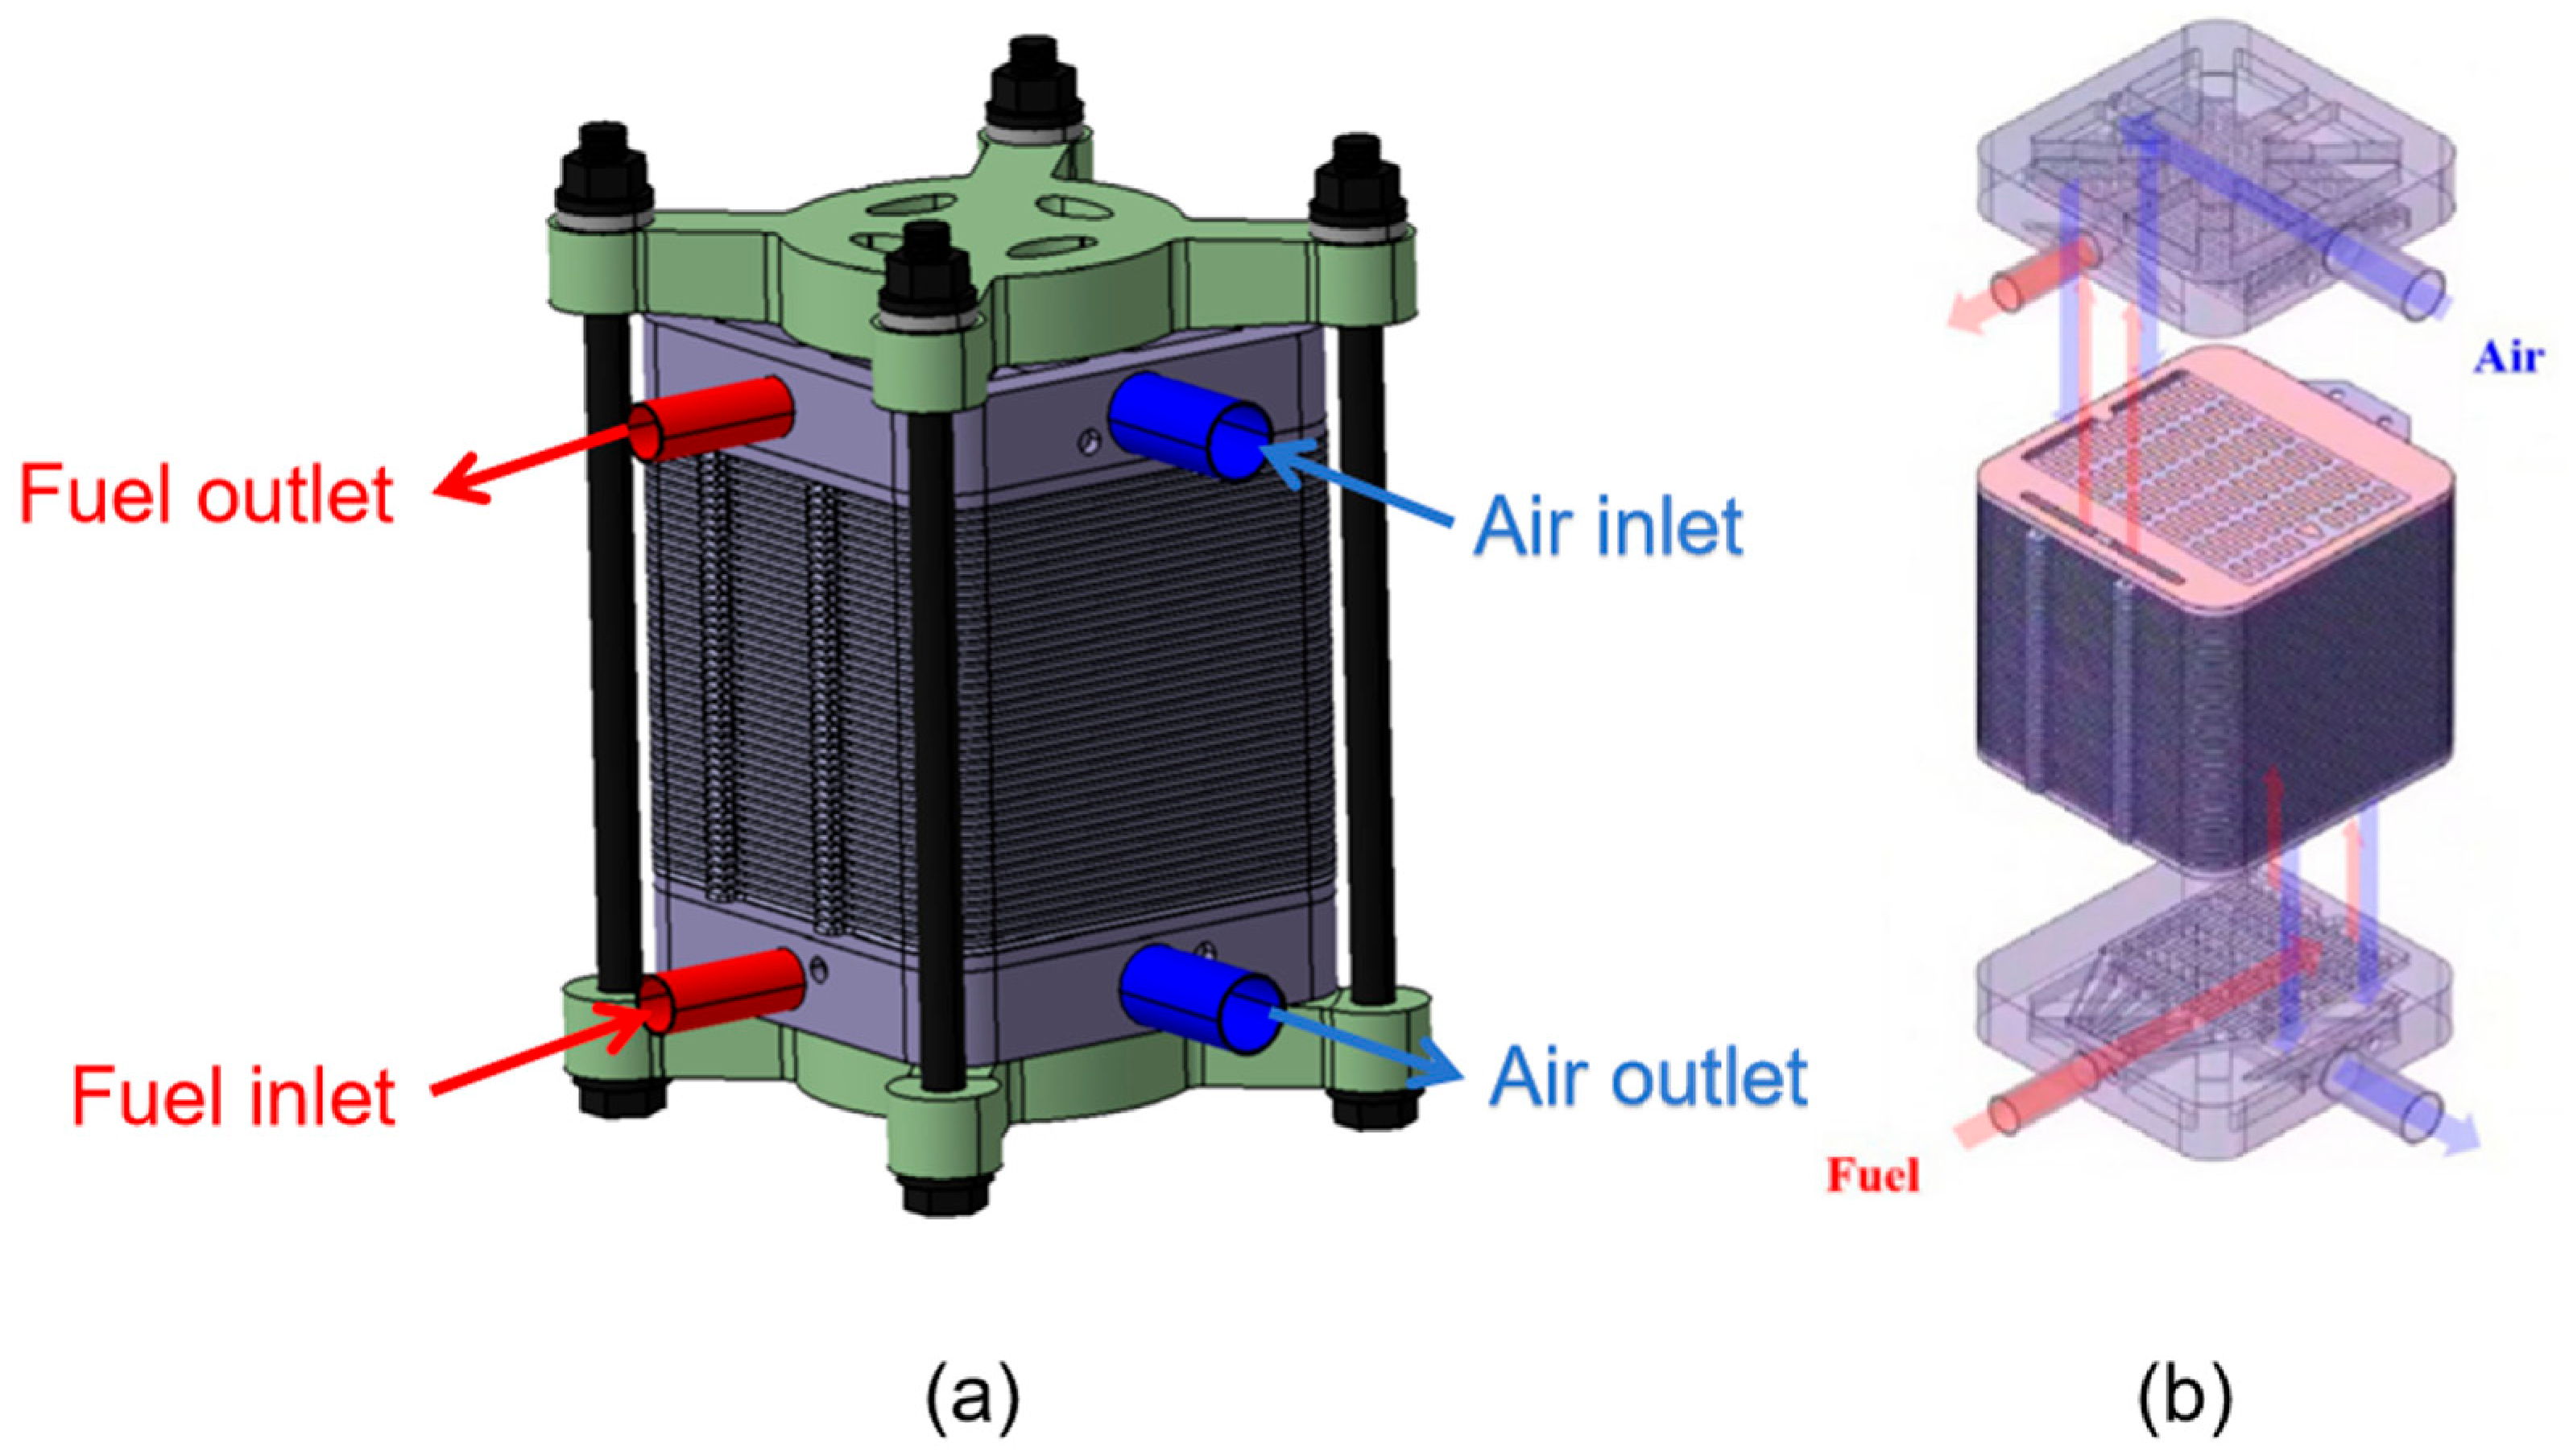
Figure 1 presents the 3D structural configuration of a 1 kW-level SOFC stack with an internal manifold, which is under development by the Korea Institute of Energy Research. This stack employs a Z-type flow layout, in which the fuel and air supply and exhaust ports are arranged at separate positions, thereby generating crossflow over the electrochemically active region. The reactant gases enter through the inlet manifold and are delivered to the individual cells via internal manifold passages. After reaction, the outlet gases are collected by the exhaust manifold and released through the external pipework. The principal design specifications and operating conditions of the solid oxide fuel cell stack are provided in
Table 1.
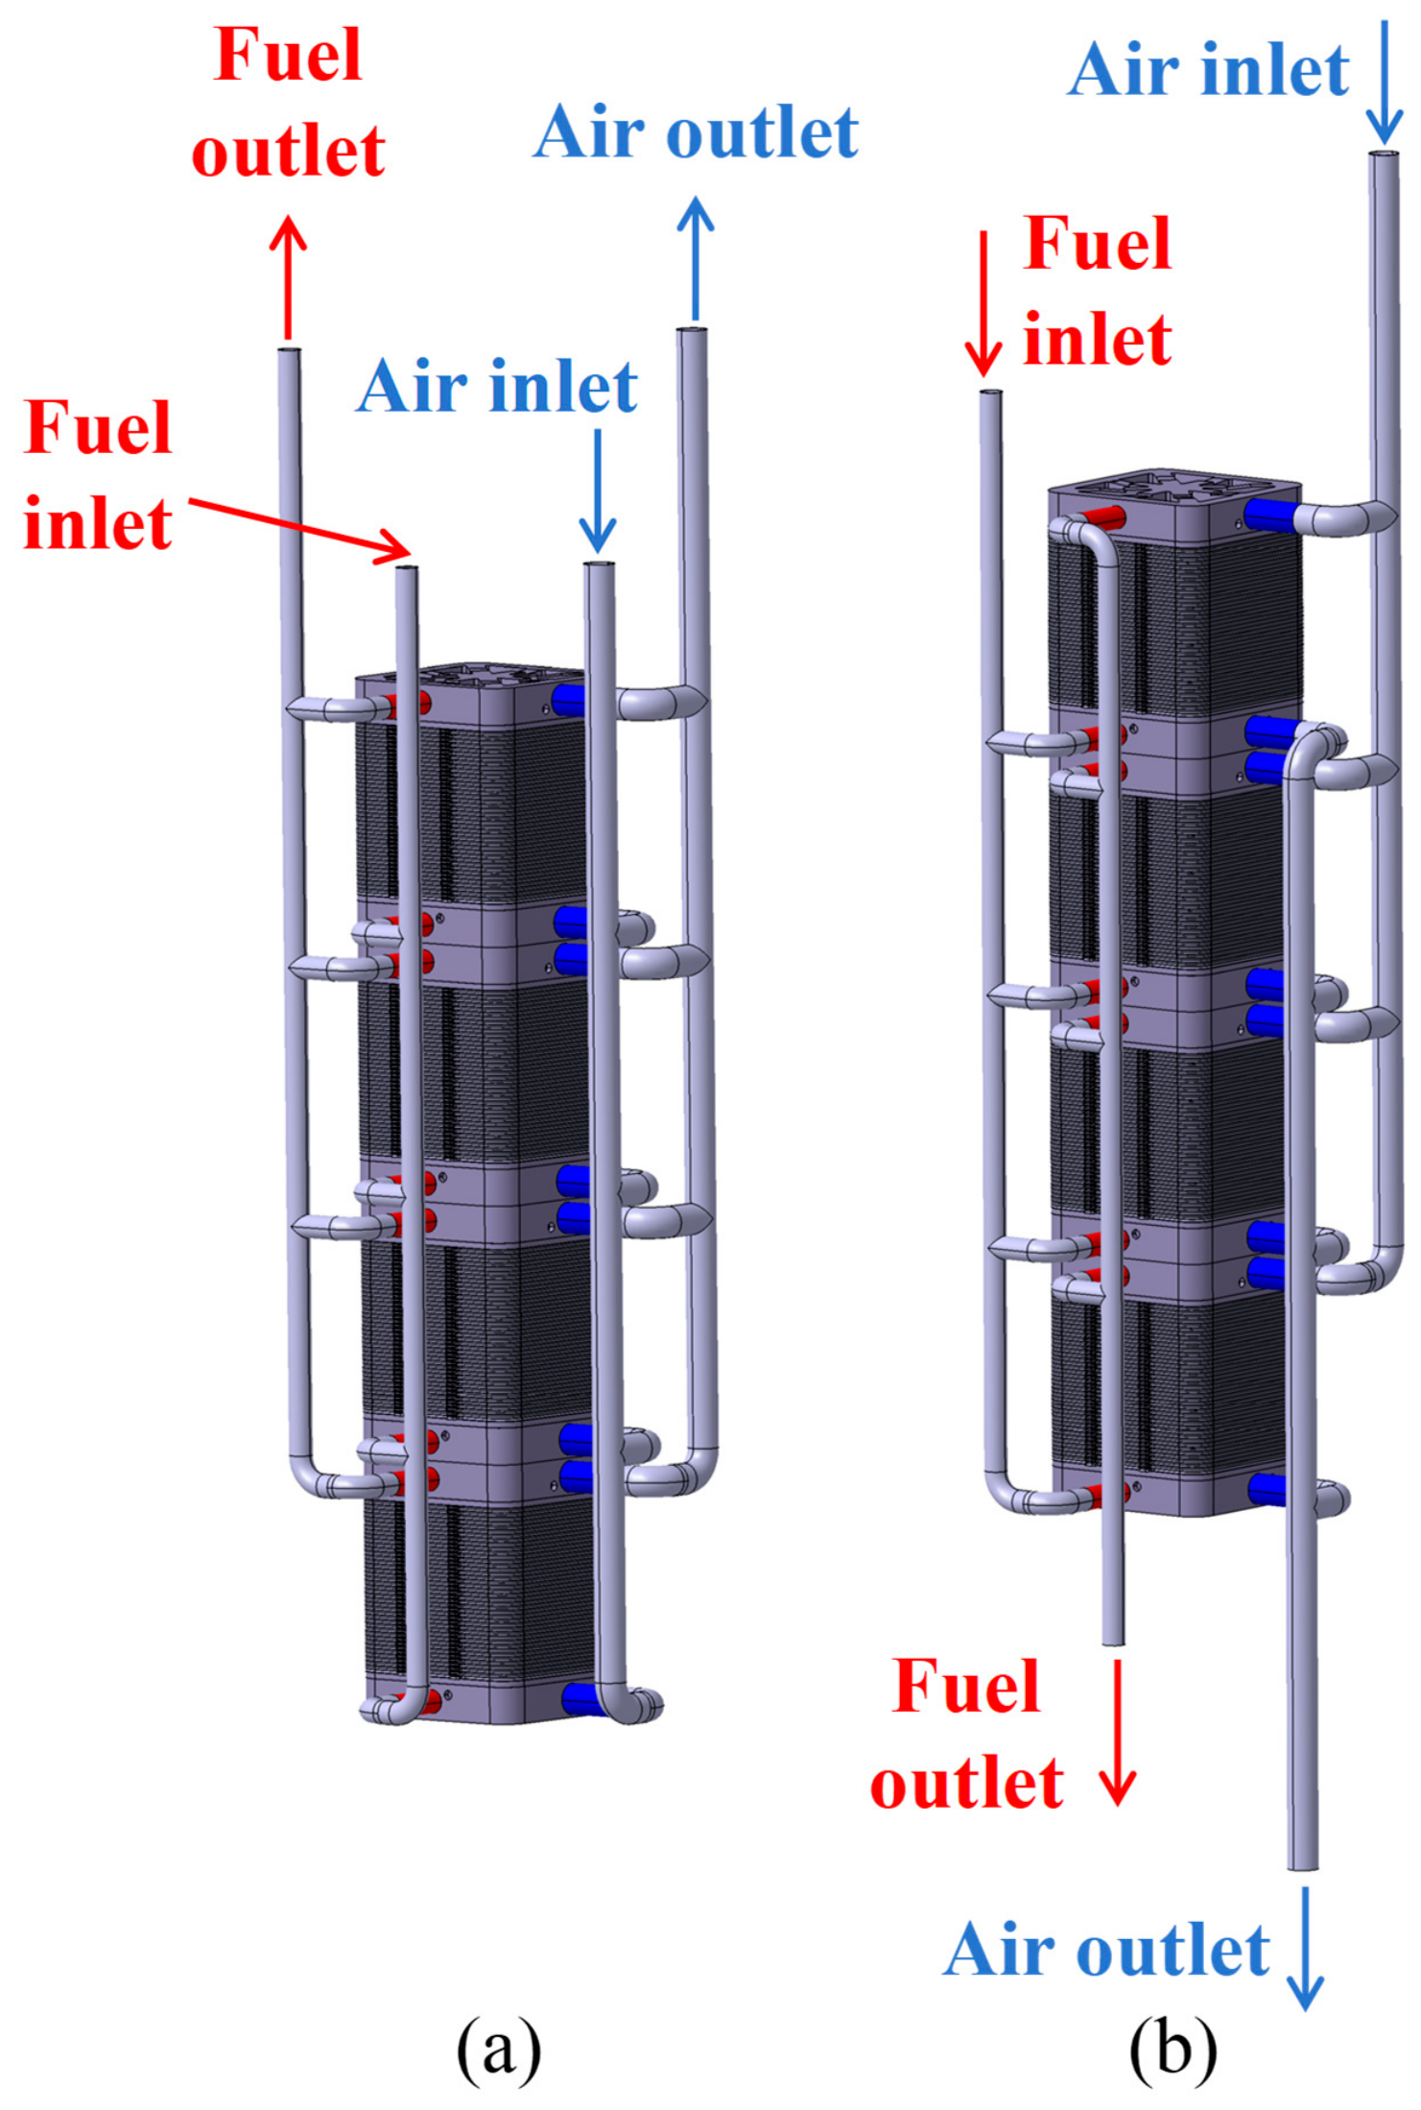
Based on the 1 kW-level solid oxide fuel cell stack module, two 3D stacked-system models with different pipe-connection layouts were developed in this study, corresponding to the U- and Z-type arrangements illustrated in
Figure 2. For the U-type layout, the supply and discharge lines for both fuel and air are installed on the same side, thereby creating a co-flow connection pattern. For the Z-type layout, the fuel and air supply lines are located across from their respective discharge lines, leading to an opposing-flow connection pattern.
Apart from the pipe-connection layout, both numerical models adopted identical key settings, such as the cell count, flow-channel dimensions, and boundary conditions. This setup allows the influence of the connection configuration to be isolated and compared under consistent conditions. Therefore, the present modeling approach provides a reliable basis for evaluating how different pipeline connections affect the internal flow behavior and fuel distribution uniformity in the fuel cell stack system. The symbols, abbreviations, and relevant terms used in this study are provided in
Appendix A.
Overall, the manifold configuration was refined by considering geometric parameters, flow-path design, and the overall structural arrangement, so that equal spacing was preserved from each stack supply/discharge port to the system-level manifolds for the two piping layouts. The resulting balanced layout with uniform spacing effectively minimizes uneven flow distribution arising from geometric variations, thus enhancing flow consistency and offering a dependable basis for the subsequent numerical simulations and performance analyses.
2.2. Computational Mesh Construction
The computational analysis in this work was performed with the commercial CFD software Star-CCM+ 2602, provided by Siemens Digital Industries Software (Plano, TX, USA). The flow region required for the analysis was obtained from the designed geometry using ANSYS Space Claim 2025R2 developed by Ansys Inc., (Canonsburg, PA, USA). This extracted fluid domain served as the geometric basis for the following flow-field simulations and analyses.
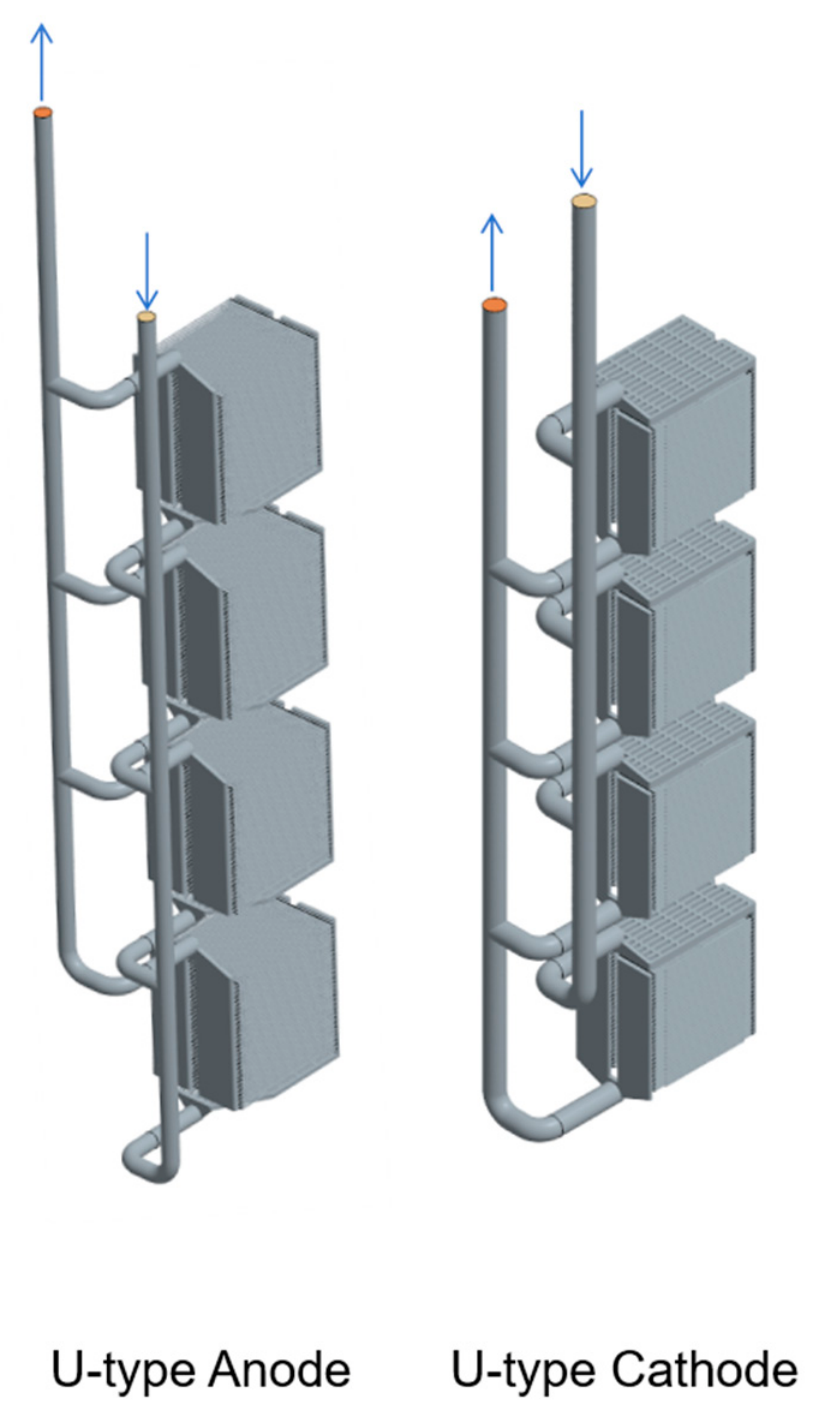
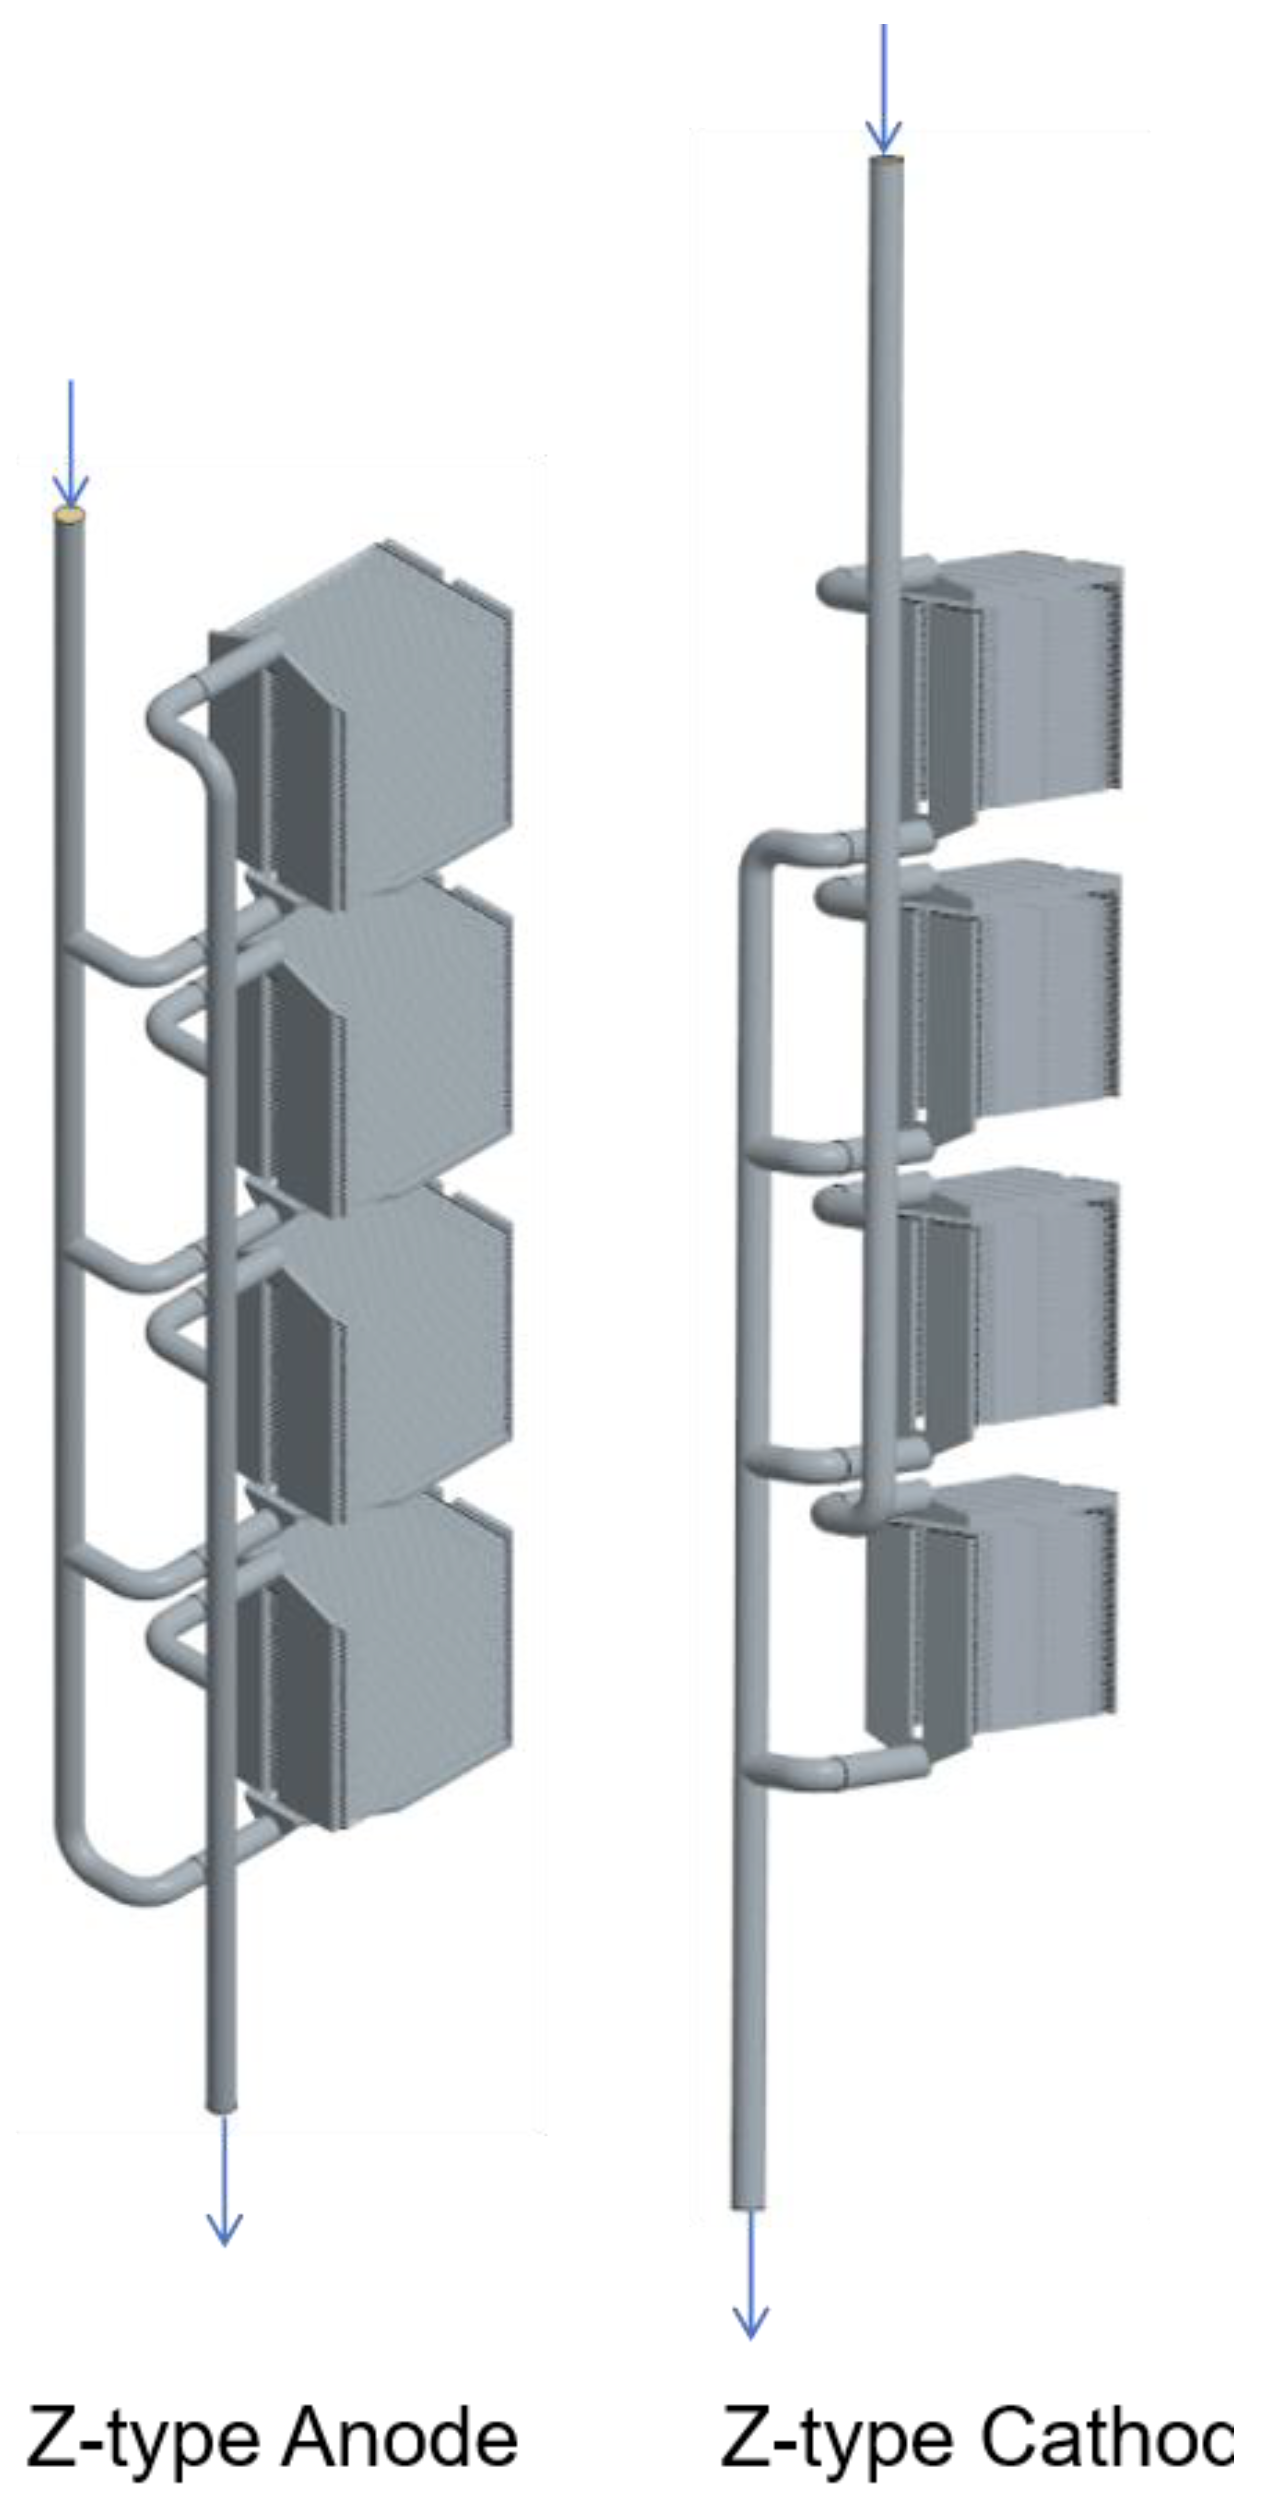
The mesh used for the CFD calculation was constructed from the fluid-domain geometries presented in
Figure 3 and
Figure 4. For the pipeline and manifold sections, a polyhedral mesh was employed to enhance mesh adaptability and reduce computational cost in complex flow passages. Meanwhile, the primary electrochemical reaction domains were discretized with a cut-cell tetrahedral meshing strategy, allowing the local geometric characteristics and detailed flow behavior to be captured more effectively.
For the 4 × 1 kW-level fuel cell stack model, the cathode-side and anode-side computational domains contained nearly 25 and 20 million control volumes, in that order. Moreover, a mesh-convergence assessment was carried out to examine the suitability of the selected discretization strategy and the credibility of the computed results. The results confirmed that the adopted mesh resolution was sufficient to ensure acceptable accuracy and numerical confidence.
The inlet flow quantities on the cathode and anode sides were subsequently determined based on the theoretical formulations reported in Ref. [
20]. These calculated values were then assigned as the corresponding inlet boundary conditions in the numerical model. Since the boundary inputs were derived from theoretical operating requirements, the simulation setup could better reflect the actual working conditions of the SOFC stack. This approach also provided a more dependable foundation for the later evaluation of flow distribution behavior and overall stack performance.
2.3. Grid Generation
The inlet Reynolds number was evaluated using Equation (3), and the obtained values are listed in
Table 2 and
Table 3.
Based on the inlet Reynolds numbers presented in
Table 2 and
Table 3, The cathode-side flow region exhibits comparatively large Reynolds number values, indicating a higher possibility of turbulent behavior within the cathode passage. Conversely, the Reynolds number values along the anode side are noticeably smaller, indicating that the anode-side flow is generally maintained within the laminar-flow range. Therefore, the Realizable k–ε turbulence formulation was adopted for the cathode-side calculation [
3,
21,
22], whereas a laminar-flow formulation was employed in the anode-side evaluation.
Key simplifications employed in the present work are outlined below:
The working fluid was treated as incompressible, and the flow domain was considered to operate under steady-state conditions.
Electrochemical conversion, species transport, and thermal exchange were excluded from the present analysis.
The thermal and physical properties of the gas species were considered temperature-invariant at 750 °C, and atmospheric-pressure conditions were applied to the stack operation.
Gravitational effects on flow distribution were incorporated into the present model.
Unlike the authors’ previous study [
19], in which gravitational effects were not considered, the present work focuses on a stacked SOFC structure. Owing to the more pronounced vertical arrangement of the stacked configuration, gravity may influence the internal flow distribution through buoyancy effects. Therefore, gravity was incorporated into the present numerical model.
Although electrochemical reactions and heat transfer were not included in the present model, this simplification should be regarded as a possible source of uncertainty when estimating flow-distribution uniformity. Under actual SOFC operating conditions, electrochemical processes may alter the gas mixture composition and transport properties, while thermal gradients can further induce density variations within the flow field. In addition, gravity-driven buoyancy effects can interact with these variations, resulting in channel-to-channel flow nonuniformity that is greater than that predicted using simplified modeling assumptions.
For the anode-side calculation, a laminar-flow formulation was employed. Therefore, the flow behavior was described using the Navier–Stokes equations, which account for the conservation of mass and momentum. The governing expressions for continuity and momentum balance are presented below:
Since the working medium was treated as incompressible, the transient density-dependent component on the left side of Equation (4) can be omitted. The momentum balance equation, given as Equation (5), was then applied to describe changes in gas momentum within the solid oxide fuel cell anode. This formulation accounts for the combined contributions of pressure, viscous effects, and inertial effects to gas transport. Through the solution of the momentum balance equation, the velocity and pressure distributions in the anode-side region are obtained, allowing the associated flow characteristics and distribution patterns to be evaluated. Similarly, because the initial term on the left side of Equation (5) vanishes under steady-state conditions, the use of a laminar-flow formulation is suitable when analyzing low-Reynolds-number anode flow.
However, as indicated by the Reynolds numbers listed in
Table 3, the cathode flow region exhibits relatively high Reynolds numbers, suggesting that turbulent flow characteristics are more likely to appear. Therefore, to better represent the turbulent behavior in the cathode-side flow field, the Realizable k–ε turbulence formulation was adopted in the present work. The governing equations for this turbulence model are presented as follows [
23]:
Here, represents fluid density; represents the averaged turbulent kinetic energy; denotes time; represents the velocity component; indicates the coordinate component; is the turbulent kinetic energy dissipation rate; denotes the dynamic viscosity of the working fluid; represents the eddy viscosity; represents the turbulent Prandtl number corresponding to k; σe is the turbulent Prandtl number for ; and indicates the generation of turbulent kinetic energy induced by the mean velocity gradient.
3. Mesh Convergence Assessment
To verify the numerical credibility of the computational fluid dynamics analysis, the grid independence assessment was performed using the Grid Convergence Index (GCI) approach. This method was originally introduced by Roache (1994) [
24] and was later recommended in the ASME V&V Standards (2009) [
25]. The GCI approach is commonly adopted to examine grid convergence behavior and to estimate the error introduced by spatial discretization. One benefit of this approach is its applicability even under non-integer mesh refinement ratios. Through percentage-based representation of the numerical deviation, the GCI value offers an estimated error band corresponding to a coverage factor of 2 in a standard normal distribution. In the present work, three different mesh resolutions were compared to assessing the numerical consistency of the proposed model. It is important to note that the target tolerance for numerical error can be satisfied only if the solutions exhibit a monotonic convergence trend during mesh refinement [
26]. The evaluation process was conducted through several steps. First, the characteristic mesh spacing for every grid resolution and the refinement factors (h1 < h2 < h3) were calculated using Equations (8) and (9).
Computational inaccuracies: Equations (11) and (12) are then applied to estimate (
) through a fixed-point iteration scheme, in which the leading term (
) is used as the initial estimate. In this formulation, (ε) represents the estimated error, with (
,
). Here, (
) indicates the computed solution, whereas (
) serves as the indicator function for standard uncertainty. Furthermore, to evaluate the convergence characteristics of the mesh system, Roache (2009) [
27] introduced the convergence ratio (
), which is expressed as (
). When (
<
< 1), the solution exhibits monotonic convergence, whereas (
< 0) or (
> 1) indicates alternating convergence.
Equation (13) defines the extrapolated solution (
). Based on this value, the approximate relative error (
), the extrapolated relative error (
), and the Grid Convergence Index (GCI) can be calculated using Equations (14)–(16), respectively, with the safety factor (
) included in the GCI evaluation. For numerical models using three or more grid levels, a safety factor of 1.25 is generally recommended.
To assess the credibility of the CFD results in terms of convergence characteristics, multiple evaluation conditions need to be considered. The convergence ratio () is required to lie within 0 < < 1 to verify stable monotonic behavior. If R exceeds 1, the solution is likely to become divergent, whereas R values approaching unity imply an alternating convergence trend accompanied by result fluctuations. Therefore, a structured mesh-refinement process, combined with the GCI method based on generalized Richardson extrapolation, was employed to quantify the discretization error. A smaller predicted error reflects higher computational accuracy and reduced numerical uncertainty.
Table 4 presents the numerical uncertainty evaluation for the entire computational grid. The mesh refinement factor was maintained below 1.2, and mesh convergence evaluations were conducted for the anode-side and cathode-side domains. For the anode-side domain, the course, medium, and fine grid systems consisted of 12,441,348, 15,184,576, and 20,318,529 cells, respectively. The pressure difference from the inlet to the outlet was chosen as the comparison variable, with corresponding values of 104.91, 77.48, and 76.63 Pa. The final GCI was calculated as 0.032%. For the cathode-side domain, the cell counts of the course, medium, and fine grid systems were 19,311,638, 45,749,407, and 66,518,188, respectively. The pressure difference was likewise adopted as the evaluation variable, yielding values of 3177.88, 3233.96, and 3244.24 Pa and a final GCI of 0.540%. These validation results indicate that the discrepancy between the medium and fine grids was sufficiently limited. Thus, considering numerical accuracy together with computational cost, the medium grid was adopted in the subsequent simulations. At present, this study mainly conducts internal numerical verification through GCI-based grid independence analysis, while experimental validation has not yet been performed.
4. Results and Discussion
4.1. Cathode-Side Inlet Manifold Velocity Field
In the present work, the four stacks were assigned numbers according to the gas-flow path. The stack located nearest the hydrogen and air supply ports was designated Stack 1, and the remaining stacks were labeled Stack 2, Stack 3, and Stack 4 in the downstream direction.
For a multi-stack solid oxide fuel cell system, the inlet manifold delivers the reactant gases to the individual stacks. Therefore, the velocity distribution at the inlet sections corresponding to each stack can be used to evaluate the gas distribution characteristics among the stacks. Smaller velocity differences between the regions corresponding to Stack 1–Stack 4 indicate a more uniform reactant supply to each stack. In contrast, larger velocity differences imply that the gas flow may be preferentially supplied to certain stacks, which may result in non-uniform reactant distribution and reduced stack-to-stack consistency.
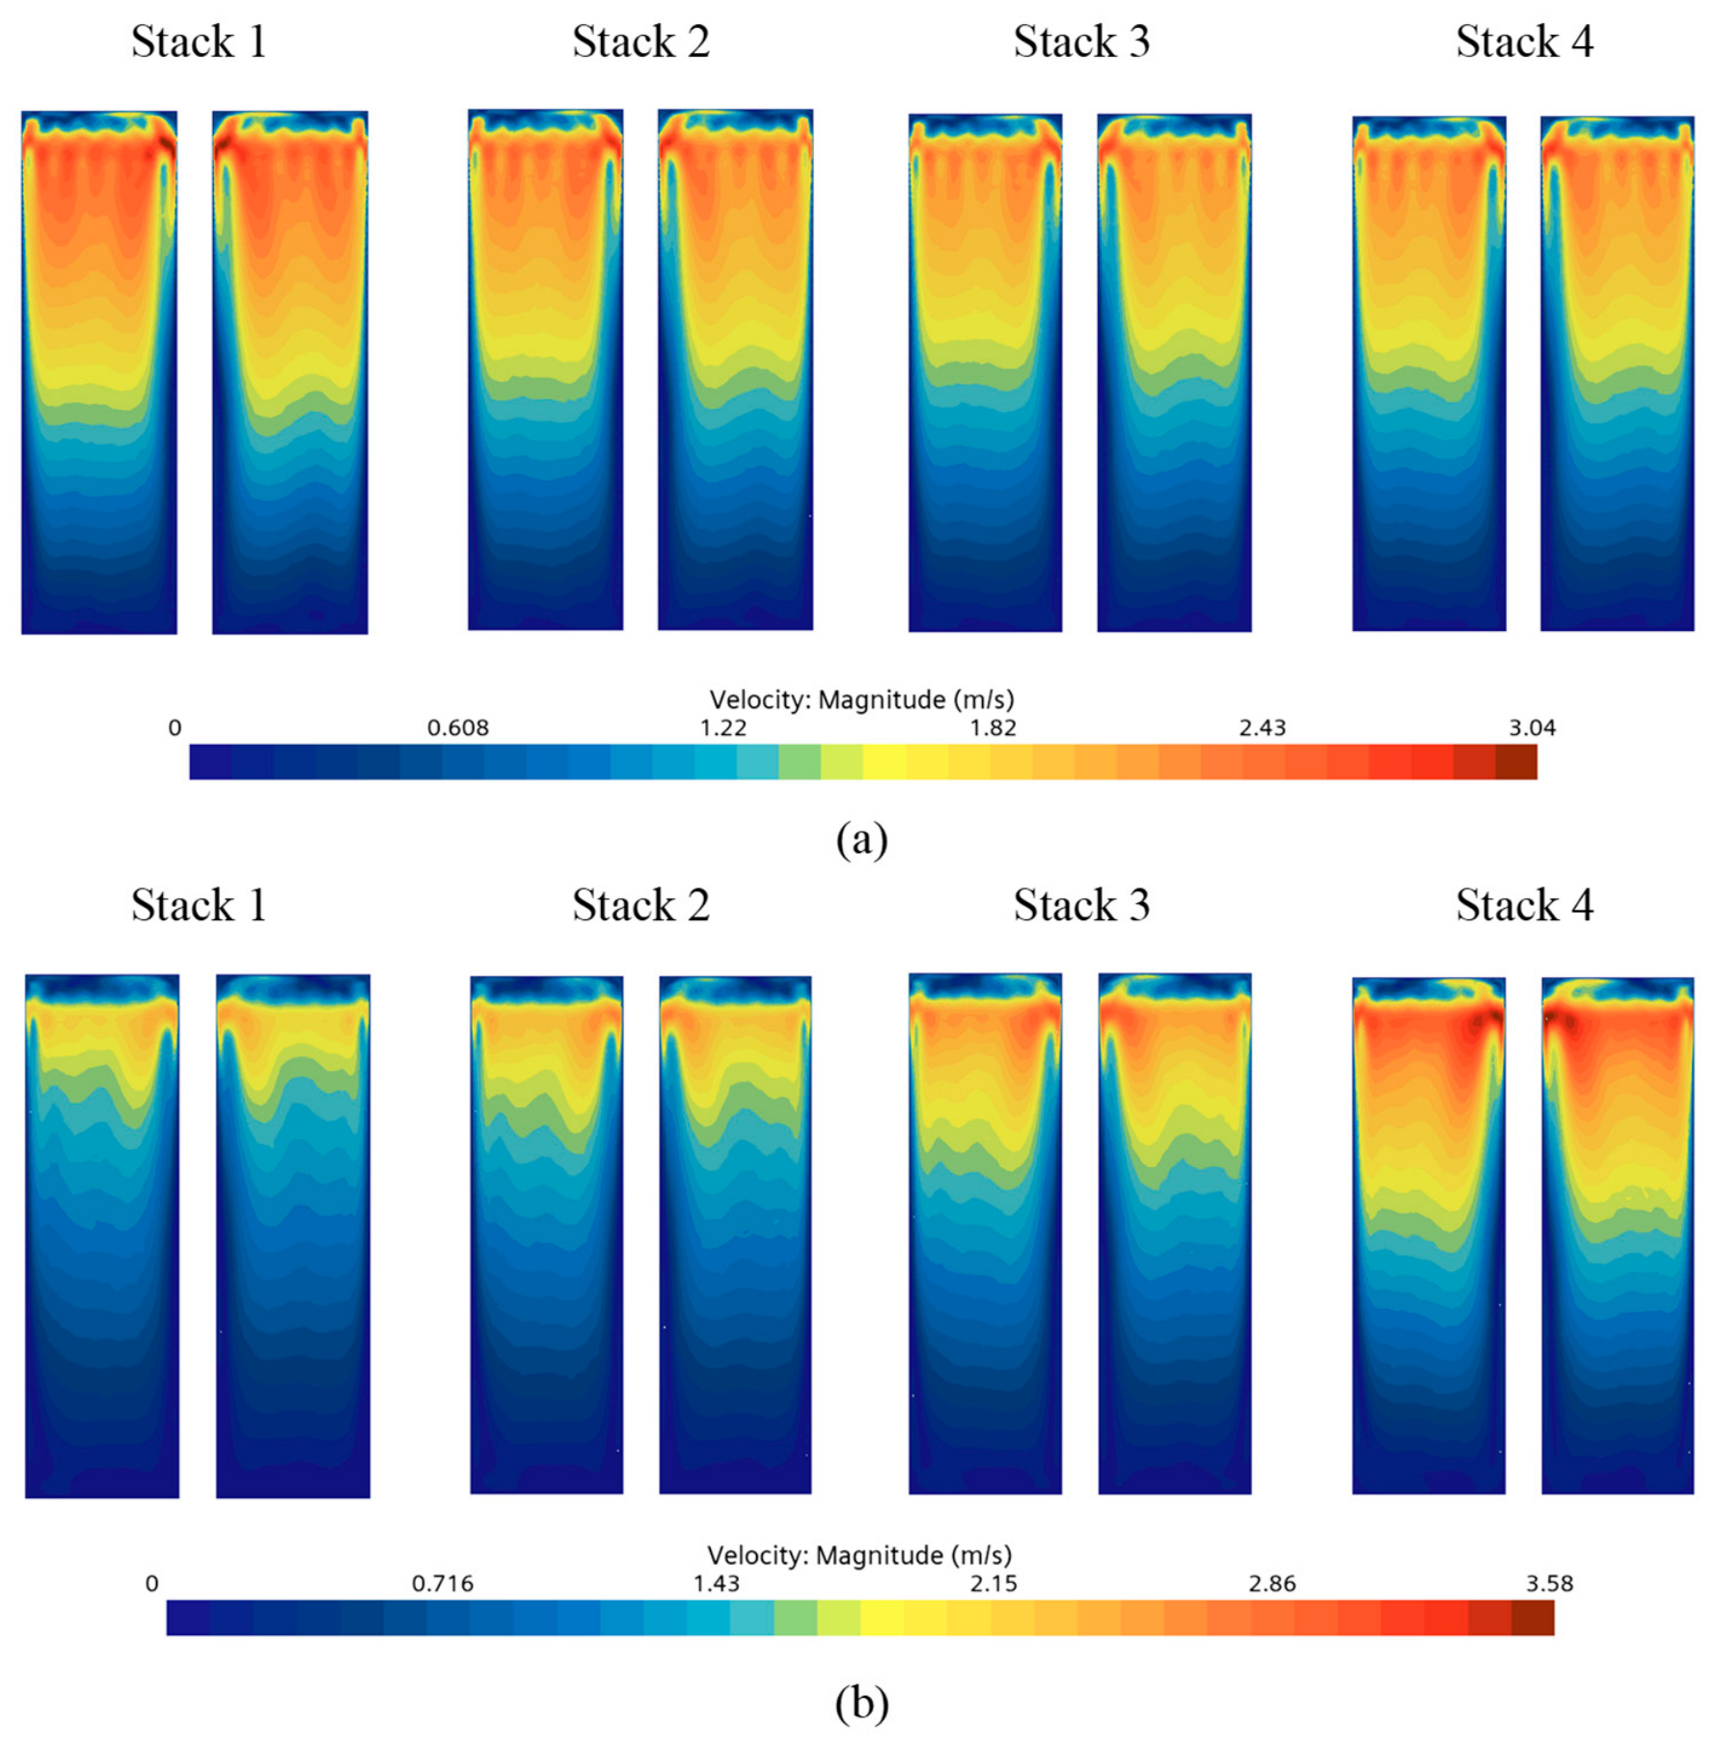
Therefore, in the present work, the U- and Z-type piping layouts were examined at 30% cathode air utilization. Velocity distributions at the inlet planes associated with individual stacks were analyzed to assess inter-stack velocity differences and flow uniformity under different piping layouts, as illustrated in
Figure 5. For the U-type layout, the velocity in the areas associated with Stack 1 to Stack 4 progressively declines. Conversely, for the Z-type layout, the velocity shows a gradual rise along the sequence from Stack 1 toward Stack 4. This opposite tendency is mainly attributed to the different flow directions and inlet/outlet arrangements of the two connection configurations.
Although velocity differences are observed among the stacks in the U-type layout, the overall variation is smaller than that observed for the Z-type arrangement, indicating that the U-type layout exhibits a comparatively more even velocity distribution. Therefore, it can be inferred that, under 30% air utilization, the U-type arrangement offers superior flow-distribution uniformity compared with the Z-type arrangement.
However, the velocity distribution only reflects the flow characteristics within the manifold and is insufficient to fully determine the actual flow distribution uniformity among the stacks. Therefore, the mass flow rate uniformity among the stacks under different connection configurations is further quantitatively analyzed in the following section.
4.2. Mass Flow Uniformity in Cathode U/Z-Type Connection Configurations
In this study, the cathode-side mass flow distribution among the four stacks was examined, and the mass flow ratio and overall mass flow uniformity were calculated using Equations (17) and (18), respectively. Based on the cathode-side mass flow results summarized in
Table 5, noticeable differences in flow allocation can be observed among the four stacks for the two connection configurations. For the U-type configuration, the mass flow ratios from Stack 1–Stack 4 are 27.07%, 25.02%, 23.66%, and 24.25%, in the same order, with an overall flow-consistency index of 0.9485. By comparison, for the Z-type configuration, the corresponding mass flow ratios from Stack 1 to Stack 4 are 20.87%, 22.67%, 25.72%, and 30.74%, in the same order, and the calculated global flow-consistency index was 0.8503.
The comparison demonstrates that the U-type connection enables a relatively even distribution of air flow across the four stacks. By contrast, in the Z-type connection, the flow rate gradually rises from Stack 1 toward Stack 4, producing a more pronounced imbalance among the stacks. Based on the 30% air utilization case, the cathode-side flow allocation achieved with the U-type connection is therefore more even than the distribution obtained with the Z-type connection. To examine this improvement in greater detail, the next section discusses the mass flow distribution behavior of the 160 individual cells.
4.3. Comparison of Mass Flow Rate and Mass Flow Rate Uniformity of 160 Single Cells on the Cathode
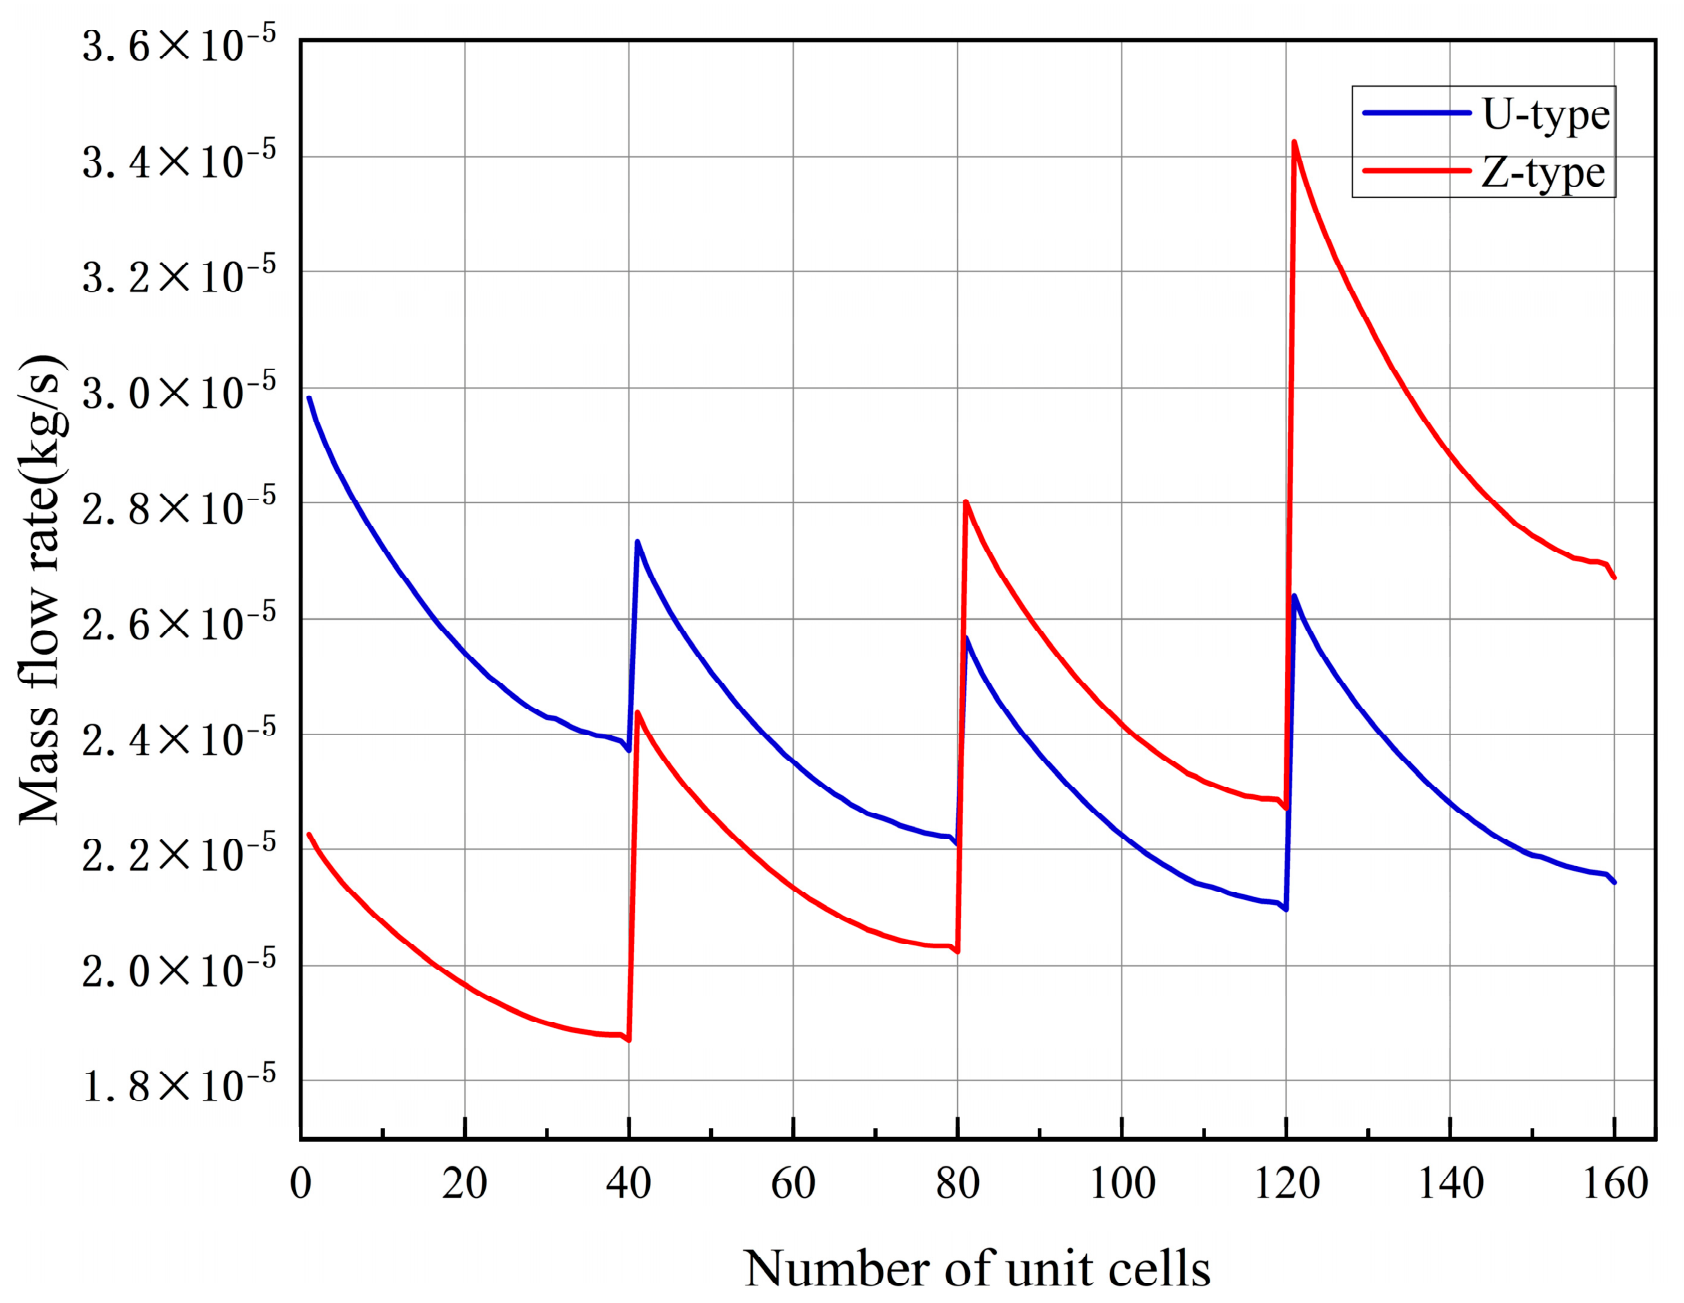
To investigate cell-level mass-flow allocation within each stack, a detailed comparison was conducted for all unit cells. As shown in
Figure 6, cells 1–40, 41–80, 81–120, and 121–160 correspond to the first, second, third, and fourth stacks, in the same order. In this study, the stack located nearest to the airside and hydrogen-side inlets was designated as Stack 1, while the remaining stacks were numbered sequentially as Stack 2, Stack 3, and Stack 4 along the gas flow direction. The mass flow uniformity was then evaluated using Equation (18).
Based on the mass-flow allocation among the 160 individual cells shown in the figure, under 30% air utilization, the flow-consistency index for the U-type arrangement is 0.91842, whereas the corresponding value for the Z-type arrangement is 0.83688. This result demonstrates that the U-type arrangement provides a more even air-side flow pattern compared with the Z-type arrangement.
It should be noted that the sudden variations observed near cells 40, 80, and 120 do not represent abrupt changes within the same stack. Rather, these changes appear because cells 1–40, 41–80, 81–120, and 121–160 belong to Stack 1, Stack 2, Stack 3, and Stack 4, respectively. Therefore, the transition points indicate the boundaries between neighboring stacks, and the observed jumps mainly arise from differences in the average air supply among the four stacks.
From the overall trend, the mass flow rate difference among the stacks is relatively smaller in the U-type configuration, resulting in a smoother flow distribution and a higher uniformity index. In contrast, the Z-type configuration shows more pronounced flow differences among the stacks, especially with the downstream stacks receiving significantly higher mass flow rates than the upstream stacks. This leads to a larger deviation in the overall flow distribution and ultimately results in a lower uniformity index than that of the U-type configuration.
4.4. Comparison of Reaction Gas Utilization Rates Among Stacks for U/Z-Type Connections at 30% Cathode Utilization
To further examine how uneven reactant-gas distribution inside each stack affects local utilization under different connection layouts, Equations (1) and (2) were applied in two ways. First, they were used to determine the required inlet mass flow rate. Second, they were also applied to estimate the local reactant gas utilization of each stack by substituting the actual mass flow rates derived from the numerical results.
In particular, the minimum mass flow rate in each stack was selected as the evaluation basis, and its corresponding actual mass flow rate was inserted into the equations for inverse calculation. Since the position with the lowest mass flow rate represents the region receiving the least reactant supply, the calculated reactant gas utilization can indicate the local reaction consumption level under the most unfavorable operating condition in each stack. The calculated values are summarized in
Table 6. Based on these results,
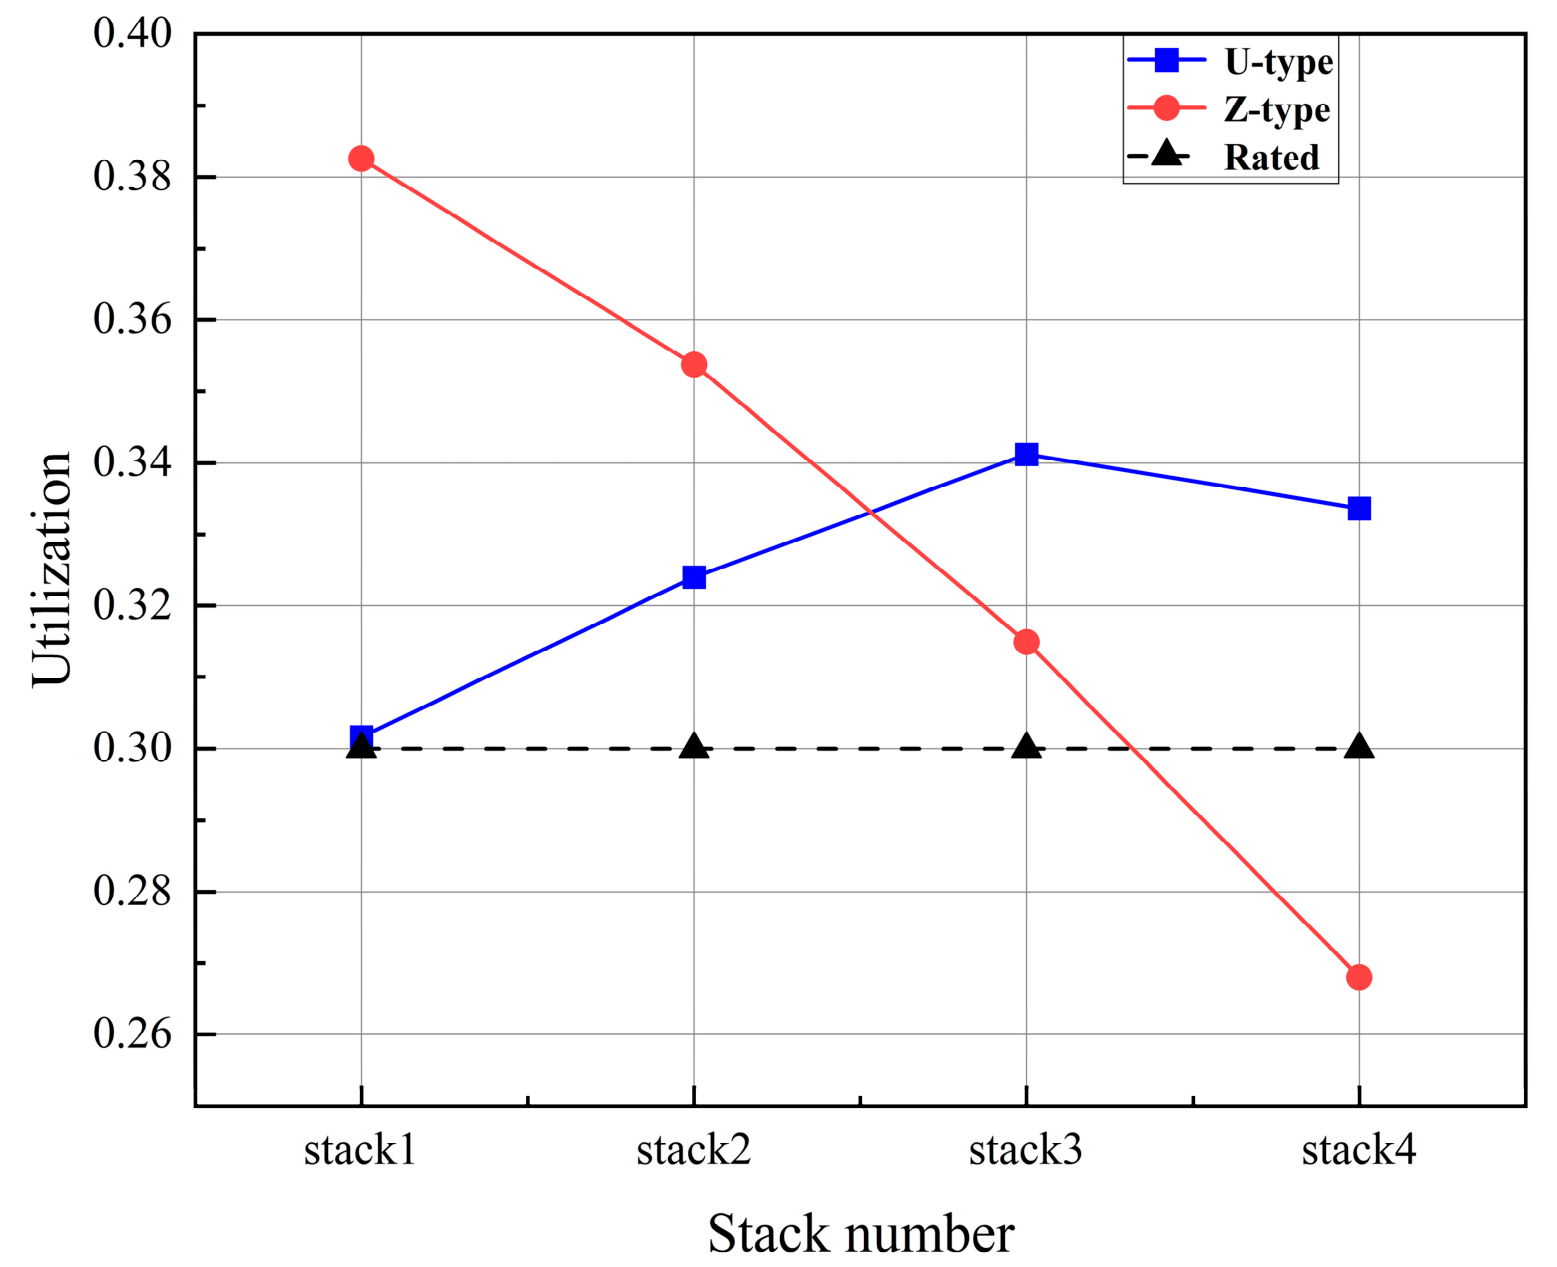
Figure 7 was generated to provide a more direct comparison of the reactant gas utilization trends among the stacks under different connection configurations.
As shown in
Table 6 and
Figure 7, under the prescribed cathode utilization of 30%, the reaction gas utilization rates of the four stacks in the U-type connection are 0.30169, 0.32400, 0.34121, and 0.33366, respectively, showing a relatively moderate variation. Among them, Stack 3 has the highest reaction gas utilization rate, indicating that the reaction gas consumption ratio of the unit cell showing the lowest mass flow rate in this stack is relatively high. However, this value is still close to the prescribed utilization of 0.30, indicating that the cathode-side reaction gas distribution is relatively stable under the U-type connection.
In contrast, the reaction gas utilization rates of the four stacks in the Z-type connection are 0.38259, 0.35377, 0.31495, and 0.26804, respectively, showing a clear decreasing trend from Stack 1 to Stack 4. Among them, Stack 1 has the highest reaction gas utilization rate of 0.38259, which is significantly higher than the prescribed utilization of 0.30. This indicates that the lowest-flow unit cell within this stack has a higher risk of local reactant gas consumption. In contrast, Stack 4 has the lowest reaction gas utilization rate of 0.26804, suggesting that its reaction gas supply is relatively sufficient. These results indicate that, under the prescribed cathode utilization of 30%, the Z-type connection causes larger differences in local reaction gas utilization among different stacks, reflecting relatively poorer flow distribution uniformity.
In general, when the local reactant gas utilization approaches the target utilization value, the flow distribution inside the stack can be regarded as more uniform. If the local utilization is much higher than the target value, it implies that the reactant supply in that region is not sufficient, which may intensify concentration polarization. As presented in
Table 6 and
Figure 7, at the prescribed cathode utilization of 30%, the reactant gas utilization values of the stacks in the U-type connection are closer to the target value and exhibit a narrower variation range. By comparison, the Z-type connection shows larger stack-to-stack differences in reactant gas utilization, indicating relatively weaker flow distribution uniformity. These findings agree well with the previous analysis based on mass flow distribution and flow uniformity.
4.5. Anode Inlet Manifold Velocity Distribution
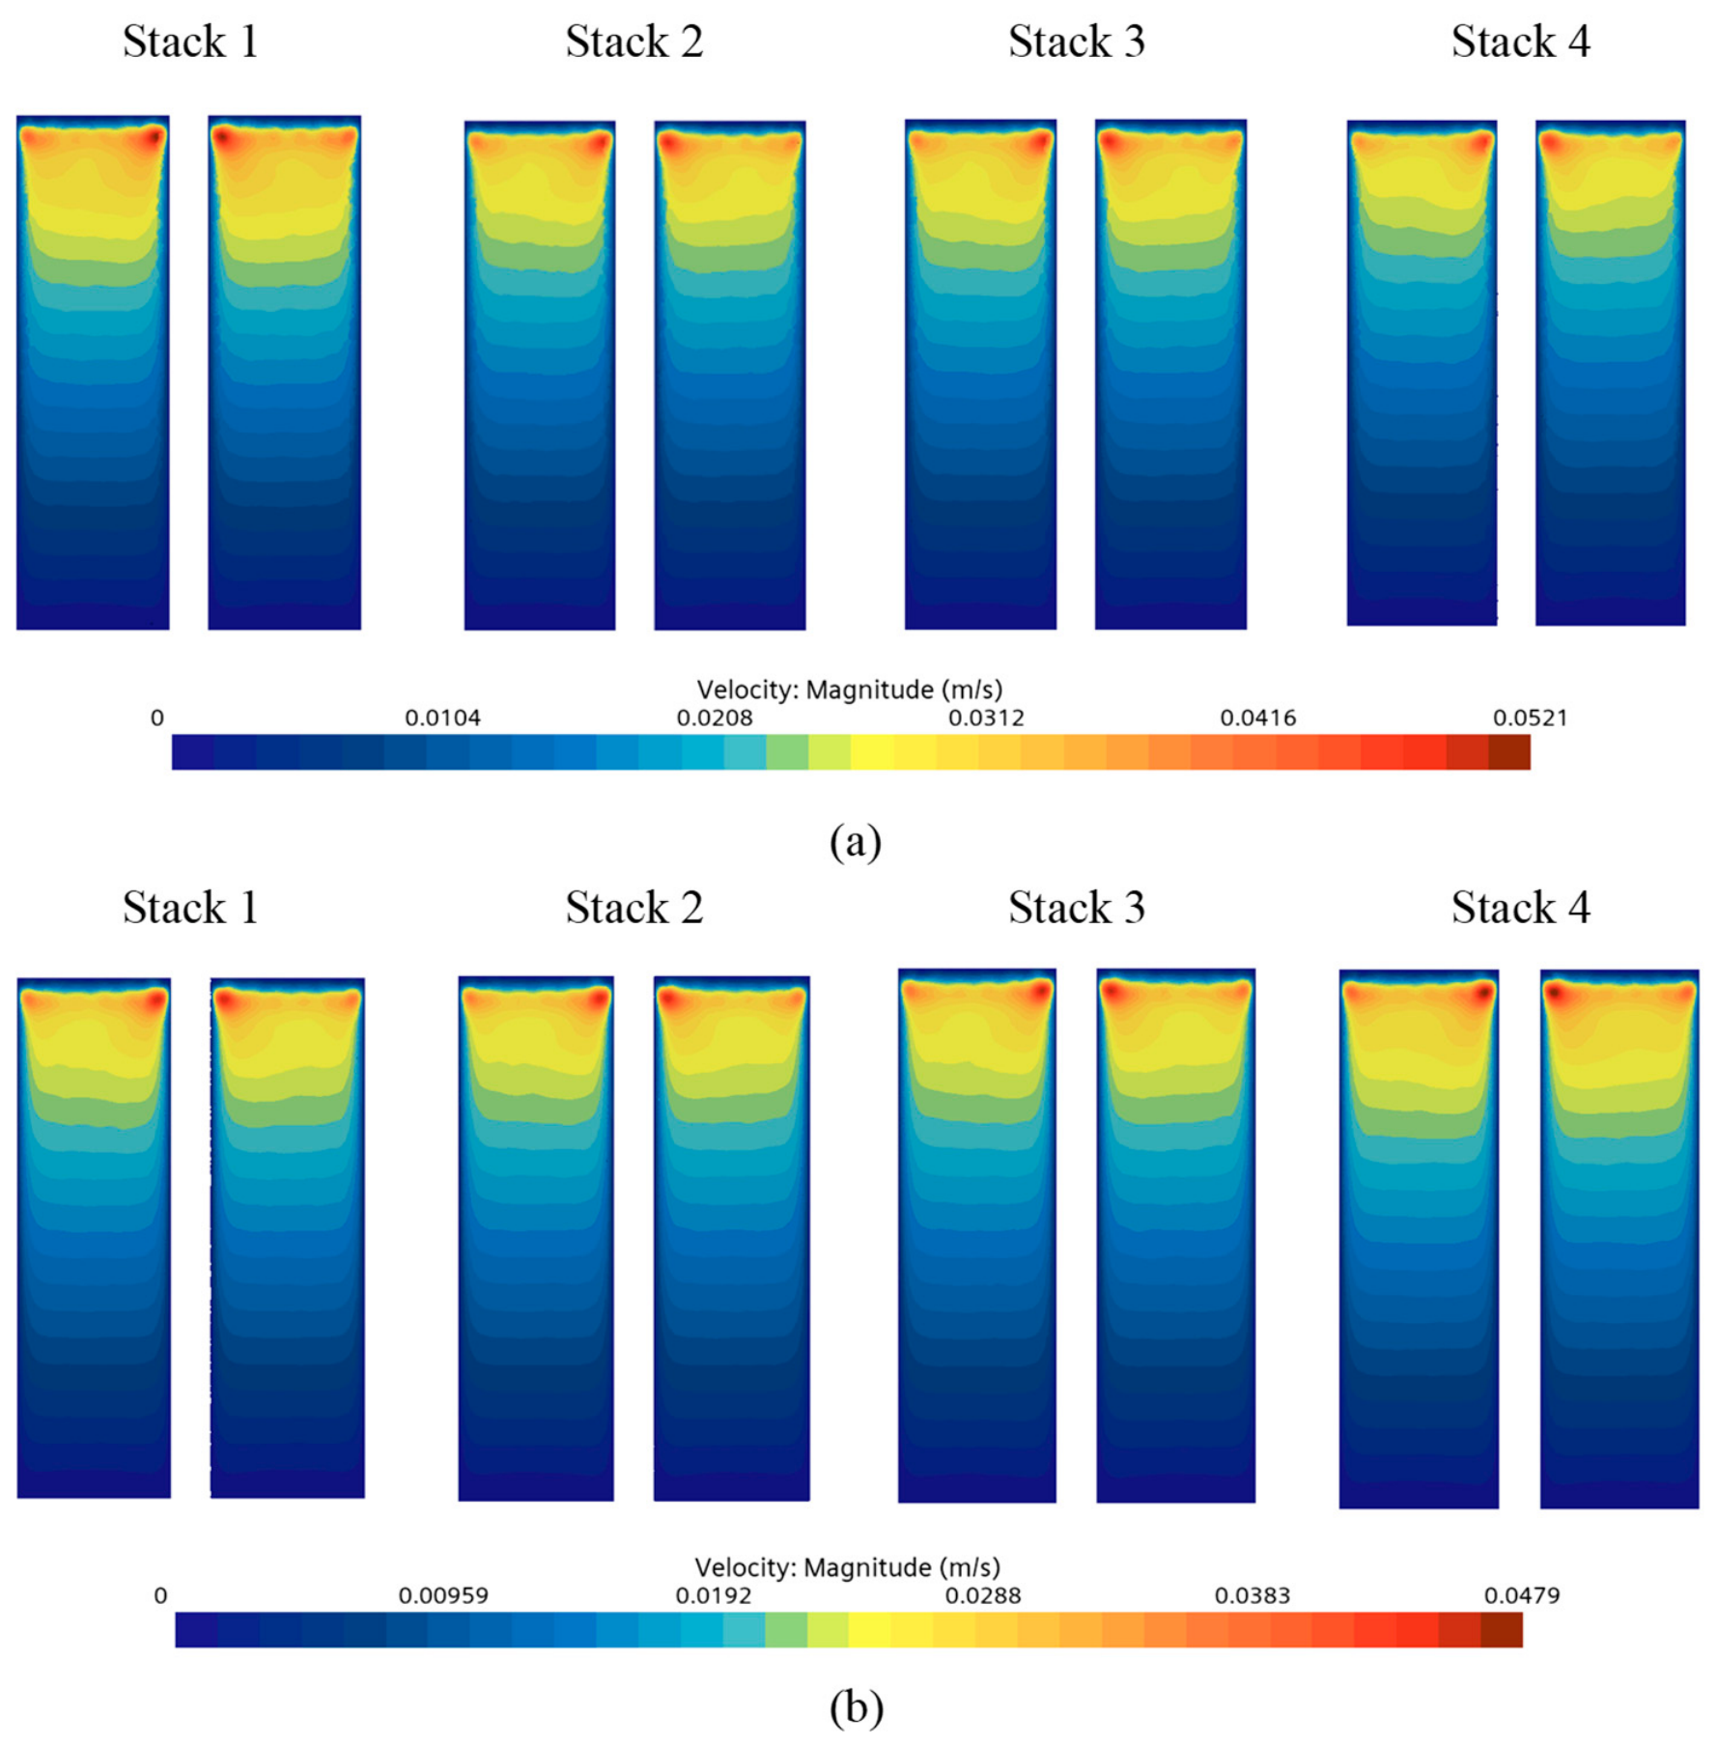
Like the previous analysis on the cathode side, the velocity distributions under different fuel utilization conditions on the anode side were compared in this study. Since the velocity distribution trends under different fuel utilization conditions were generally similar, the representative operating condition of 50% fuel utilization was selected to compare the velocity distributions at the inlet manifold section of the two connection configurations, as shown in
Figure 8. Through this comparison, the effect of varying connection layouts on fuel-gas distribution behavior across the four anode-side stacks can be preliminarily observed.
As illustrated in
Figure 8, under 50% fuel utilization, the overall velocity level in the U-type configuration exceeds the value observed for the Z-type configuration. This demonstrates that the two piping layouts lead to distinct local flow characteristics in the anode inlet manifold. In the U-type configuration, the velocity in the regions corresponding to Stack 1–Stack 4 shows a slight decreasing tendency, although the overall variation remains relatively small. This means that a certain degree of velocity difference still exists among the stacks. In contrast, the velocity distributions in the regions corresponding to the four stacks in the Z-type configuration are more similar, without obvious local variation. These findings imply that the Z-type arrangement can reduce the inter-stack velocity difference to some extent, thereby potentially improving the fuel-gas distribution uniformity on the anode side. Therefore, based on the velocity distribution results, it can be preliminarily inferred that, under 50% fuel utilization, the Z-type arrangement offers superior anode-side flow consistency.
However, the velocity distribution mainly reflects the local flow behavior at the inlet manifold section and can only be used as an initial indicator for evaluating the gas distribution trend. The actual fuel-gas supply to each single cell is also influenced by several factors, such as pressure distribution, branch-flow resistance, and local flow-field variations. Therefore, the velocity distribution alone is not sufficient to fully evaluate the actual flow allocation among the single cells. To obtain a more comprehensive conclusion, the mass flow distribution of all 160 anode-side single cells will be quantitatively examined in the following section.
4.6. Comparison of Mass Flow Rate and Mass Flow Rate Uniformity of 160 Single Cells on the Anode
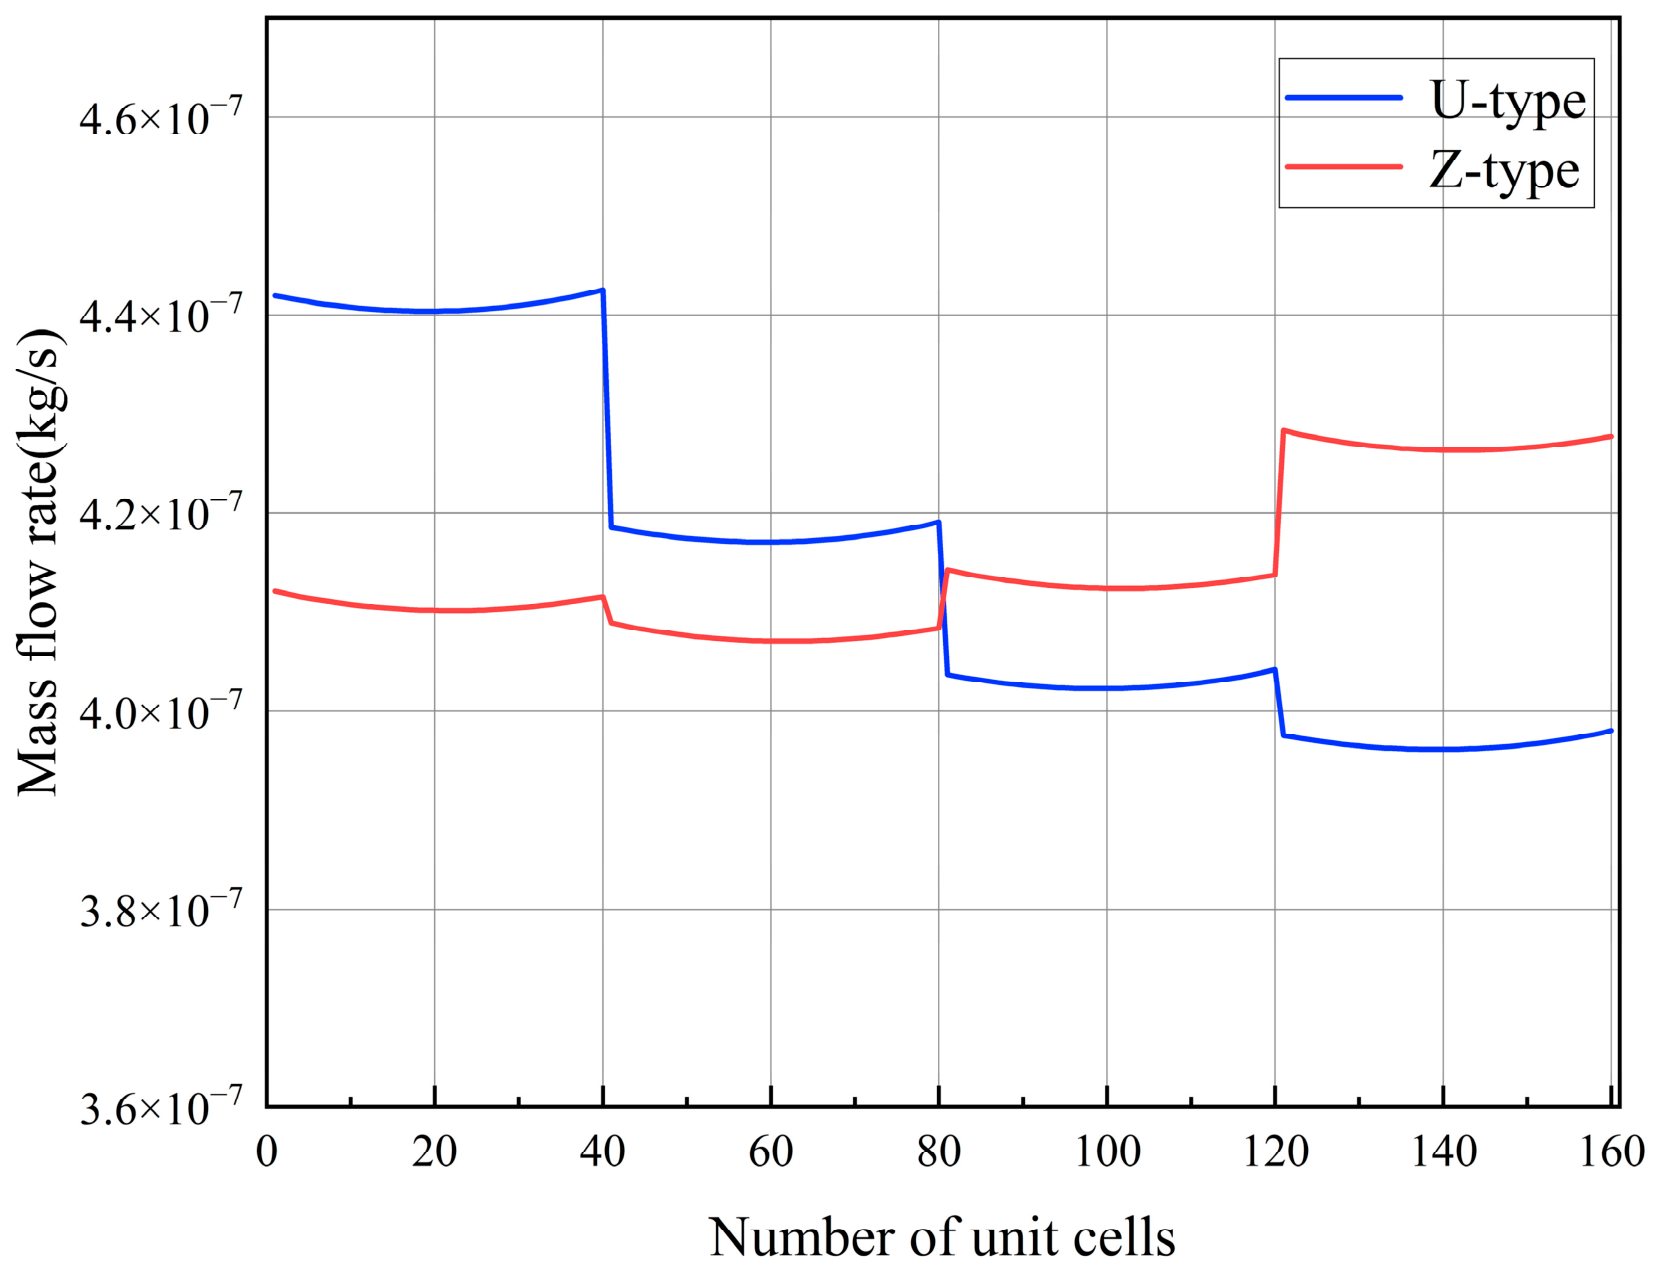
To further verify the anode-side flow-consistency benefit associated with the Z-type arrangement, the mass flow distributions of all 160 single cells in the U/Z-type configurations were compared at 50% fuel utilization. The extracted data are presented in
Figure 9. In this figure, cells 1–40, 41–80, 81–120, and 121–160 represent Stack 1, Stack 2, Stack 3, and Stack 4, respectively.
As shown in
Figure 9, under 50% fuel utilization, the mass flow rates of the individual cells under the Z-type arrangement are mainly distributed within the range of 4.1 × 10
−7 to 4.3 × 10
−7 kg/s. By contrast, those in the U-type configuration vary from approximately 3.95 × 10
−7 to 4.42 × 10
−7 kg/s. Compared with the U-type configuration, the Z-type arrangement exhibits a more limited mass-flow variation range and smaller inter-stack differences, indicating better anode-side flow uniformity.
In addition, owing to the different inlet and outlet arrangements of the two connection configurations, the mass flow variation along the sequence from Stack 1 toward Stack 4 shows opposite tendencies. For the U-type arrangement, the single-cell mass flow rate generally declines across Stack 1–Stack 4. Conversely, for the Z-type arrangement, the single-cell mass flow rate progressively rises in the downstream direction from Stack 1 toward Stack 4. This behavior is consistent with the previous inlet-manifold velocity analysis, further confirming that the connection layout strongly affects the fuel-gas distribution behavior across the anode-side stacks.
To quantitatively evaluate the flow-allocation performance of the two configurations, the cell-level flow consistency of the 160 single cells was calculated according to Equation (18). The results show that the flow-consistency index for the Z-type arrangement is 0.9821, whereas the corresponding value for the U-type arrangement is 0.9588. Therefore, under 50% fuel utilization, the Z-type arrangement exhibits a higher flow-consistency level, demonstrating that it can provide a more even anode-side fuel-gas distribution.
However, the preceding results were obtained from only one fuel utilization condition. Considering that fuel utilization may vary under practical operating conditions, the case of 50% fuel utilization alone cannot fully represent the flow distribution performance of the two connection configurations. Therefore, in the next section, the mass flow uniformity under different fuel utilization conditions will be further calculated and compared to more comprehensively examine the anode-side flow-consistency difference between the U- and Z-type arrangements.
4.7. Anode Flow Consistency Under U/Z-Type Connection Configurations
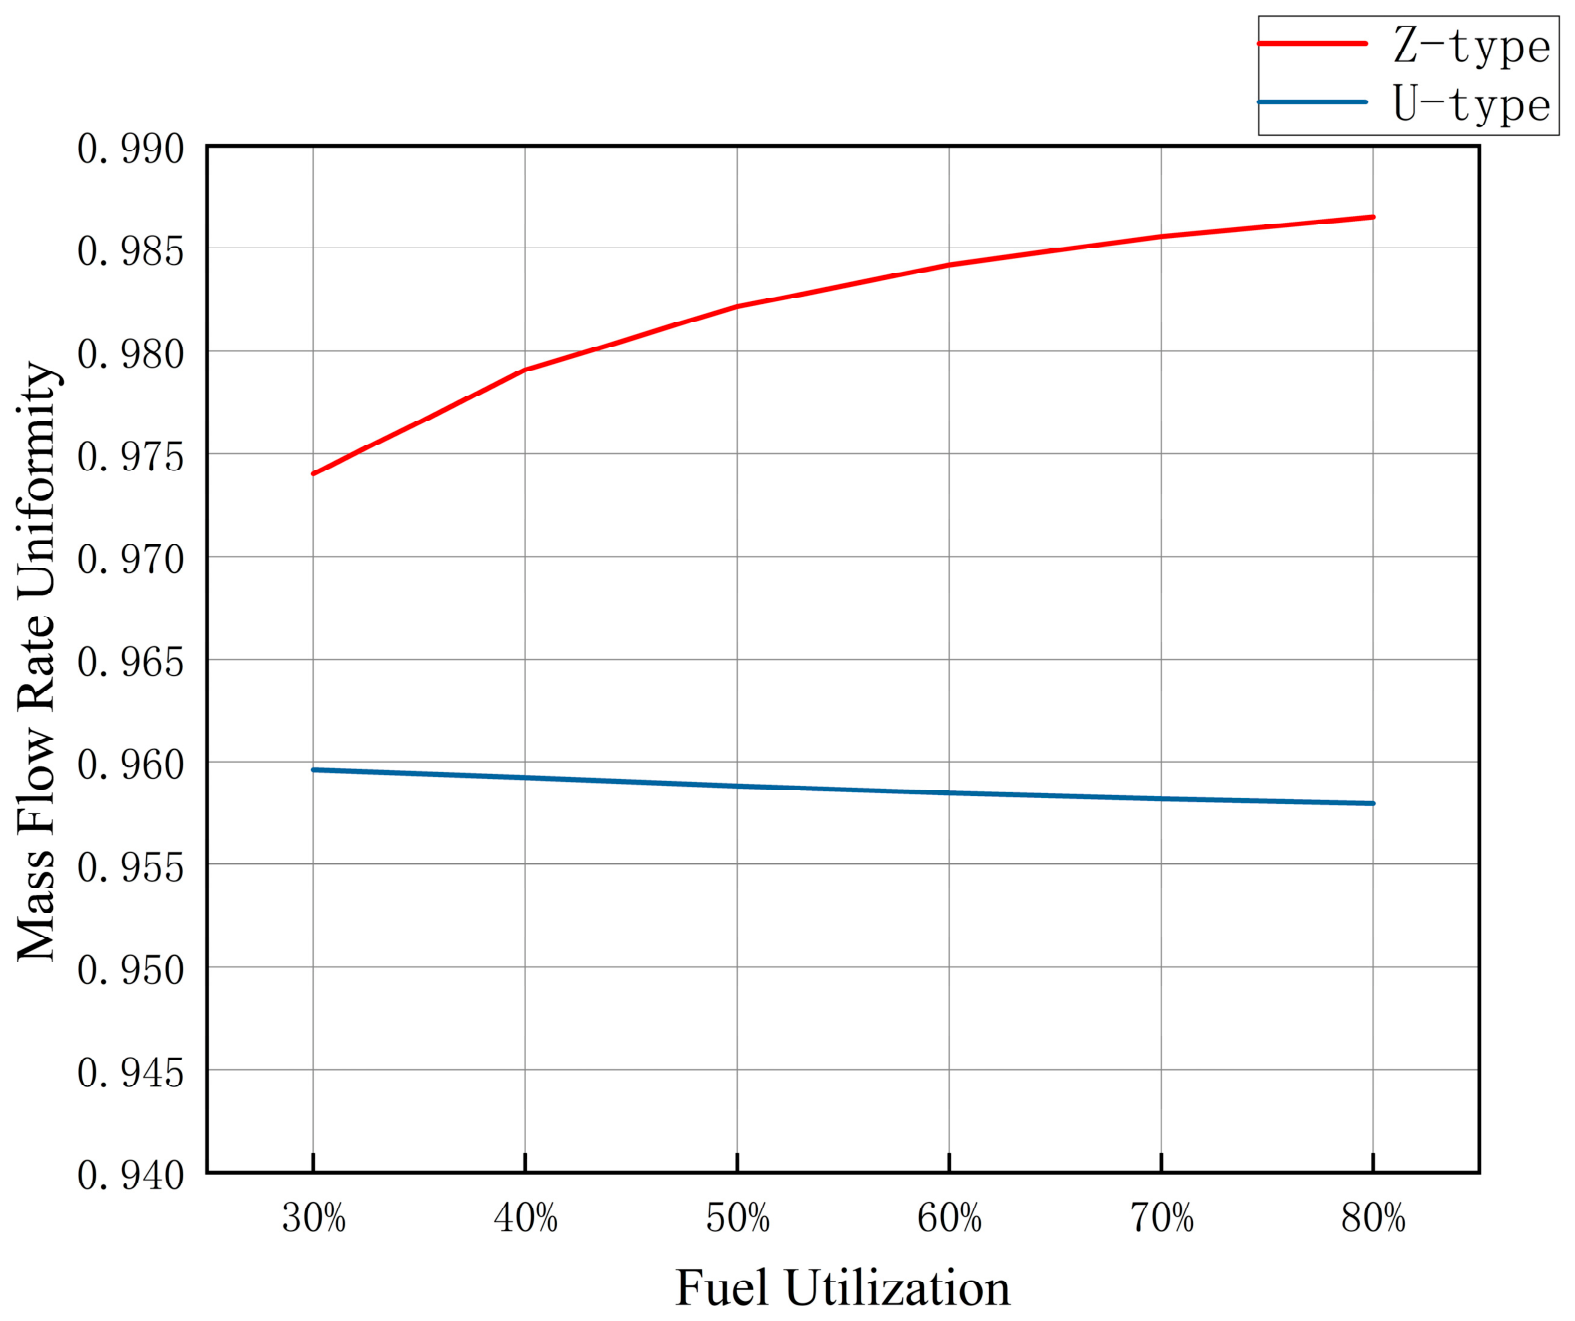
In this study, further numerical analyses were performed for the U/Z-type connection configurations across various fuel utilization cases. Flow-consistency was evaluated using Equation (18), and the obtained values are listed in
Table 7.
As summarized in
Table 7, when the fuel utilization level was set to 30–80%, the mass flow uniformity indices of the U-type connection were 0.9596, 0.9592, 0.9588, 0.9584, 0.9582, and 0.9579, respectively. These values show that the U-type connection generally provides a high level of flow uniformity. However, its uniformity index decreases slightly as fuel utilization increases.
For the Z-type connection, under identical fuel utilization cases, the flow-consistency indices were 0.9740, 0.9791, 0.9821, 0.9841, 0.9855, and 0.9865, in the same order. Relative to the U-type connection, the Z-type arrangement produced higher flow-consistency values across all examined fuel utilization cases. In addition, as shown in
Figure 10, the flow-consistency index of the Z-type arrangement gradually increases with increasing fuel utilization, whereas the corresponding value for the U-type connection shows a slight downward trend. This indicates that the two connection configurations exhibit clearly different variation patterns.
Overall, across the full range of fuel utilization conditions, the Z-type arrangement provides greater mass-flow distribution consistency compared with the U-type arrangement. This suggests that the superior flow distribution behavior of the Z-type configuration is not accidental but is strongly associated with its structural arrangement. Owing to this configuration, the manifold pressure field can be more effectively balanced, and the flow differences among the stacks and individual cells can be reduced. As a result, the overall flow uniformity is improved.
4.8. Mass Flow Uniformity of 160 Individual Cells in Anode U/Z-Type Connection Configurations
According to the results in
Table 8, the variation trend of the mass flow uniformity among the 160 anode-side single cells under different fuel utilization rates is highly consistent with the previous results obtained among the four stacks, showing almost the same tendency.
As the fuel utilization rate increases from 30% to 80%, the uniformity index obtained for the U-type layout decreases slightly from 0.9596 to 0.9579. Since this change is very small, only a mild downward tendency is observed. By contrast, the uniformity index calculated for the Z-type arrangement rises steadily from 0.9739 to 0.9865 with increasing fuel utilization, showing a continuous improvement trend. Across all the fuel utilization conditions examined, the Z-type arrangement achieves a more even mass-flow allocation compared with the U-type arrangement, indicating that it can provide a more uniform fuel-gas supply among the 160 anode-side single cells.
These results should also be emphasized because they agree closely with the previously discussed mass-flow distribution behavior among the four stacks. This suggests that the connection layout affects flow allocation not only at the stack scale but also at the individual-cell scale. In other words, the more balanced gas supply formed among the stacks by the Z-type layout is further reflected in the mass-flow distribution of the 160 single cells. Therefore, the agreement between the stack-level and cell-level results further supports the effectiveness of the Z-type layout for enhancing anode-side flow allocation.
4.9. Comparison of Stack-Level Reaction Gas Utilization Rates Between U- and Z-Type Connections at 50% Anode Utilization
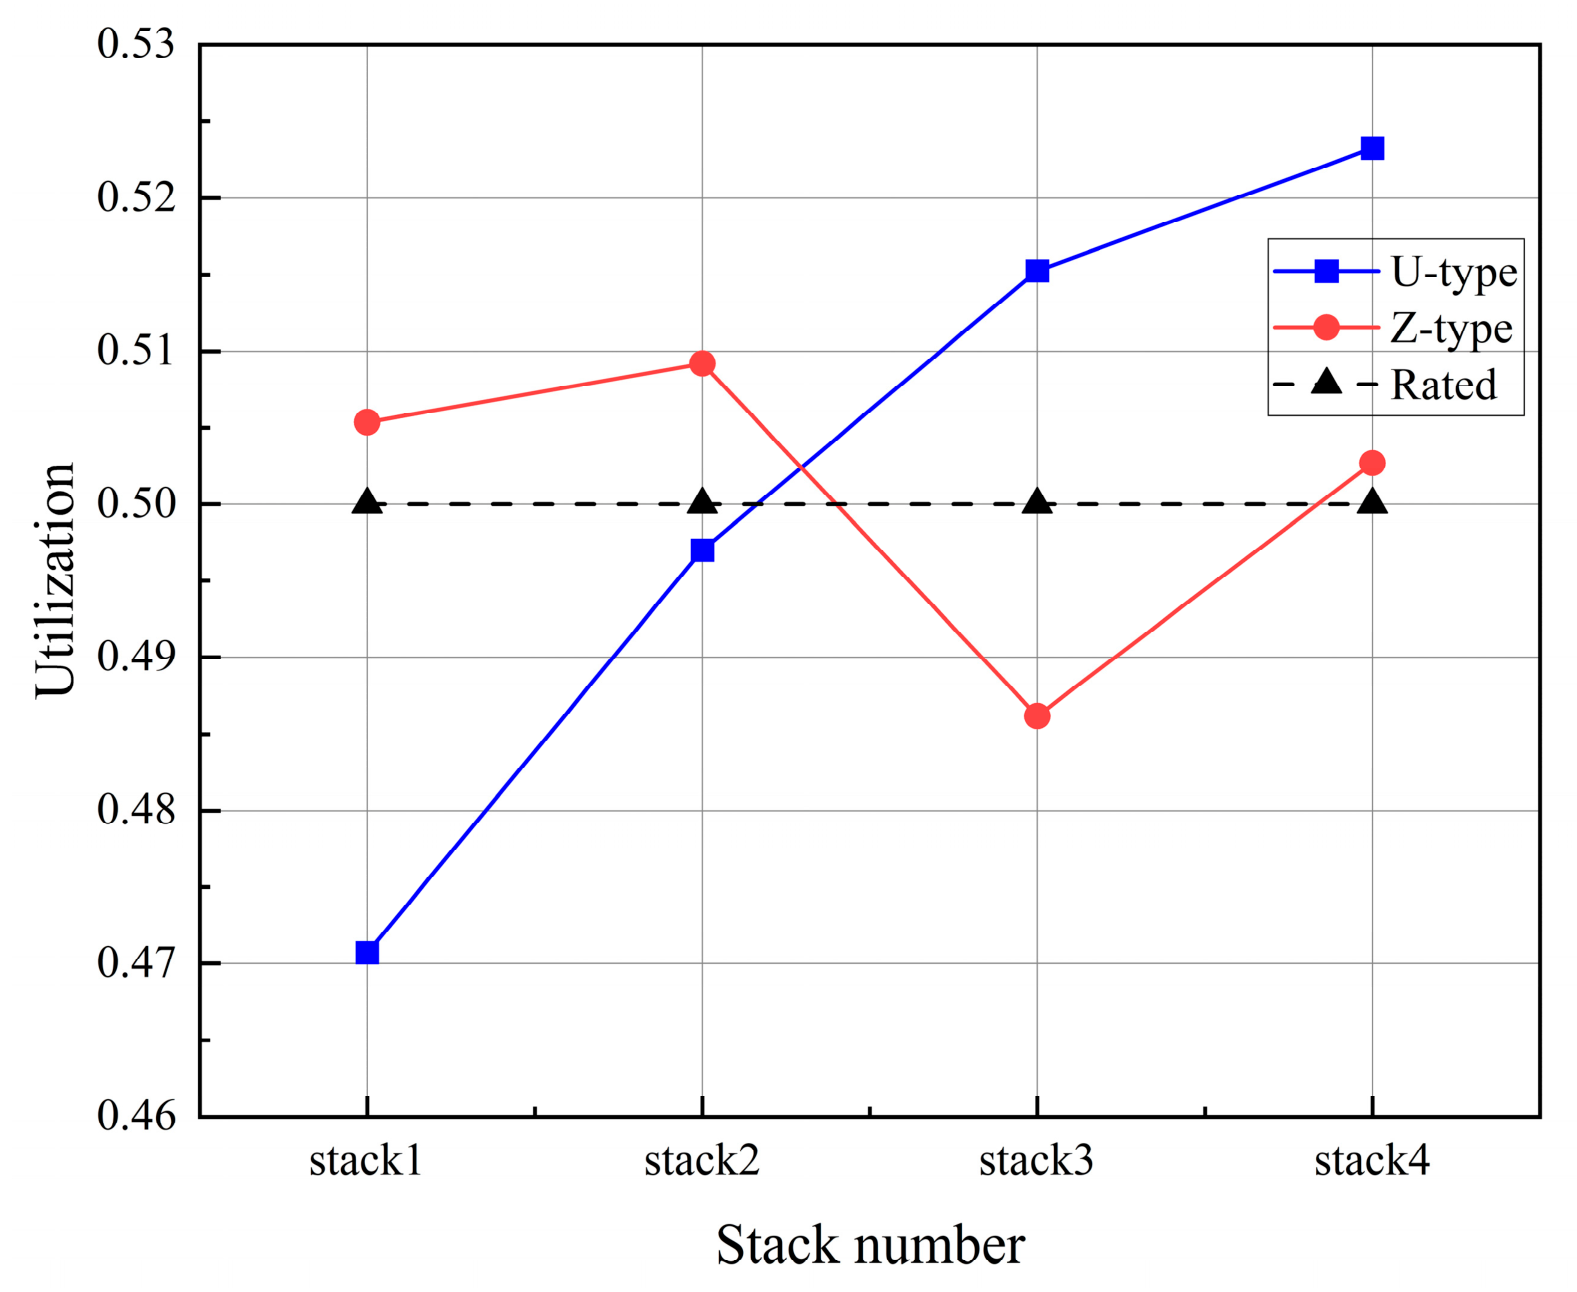
To further evaluate the effect of non-uniform reaction gas distribution on the local utilization on the anode side under different connection configurations, the reaction gas utilization rates of each stack were inversely calculated based on the actual mass flow rates obtained from the simulation results. Since the reaction gas utilization trends of U-type and Z-type connection layouts were generally similar under the prescribed anode utilization range of 30–80%, the intermediate condition, namely the prescribed anode utilization of 50%, was selected as a representative case for analysis.
Table 9 and
Figure 11 present the comparison results of the reaction gas utilization rates among the stacks under different connection configurations at 50% anode utilization.
As shown in
Table 9 and
Figure 11, under the prescribed anode utilization of 50%, the reaction gas utilization rates of the four stacks in the U-type connection are 0.47071, 0.49702, 0.51527, and 0.52327, respectively, showing a gradually increasing trend. Among them, Stack 1 has the lowest utilization rate, indicating that its reaction gas supply is relatively sufficient. In contrast, Stack 4 has the highest utilization rate, suggesting that the cell receiving the lowest mass flow rate at this location has a relatively higher local reaction gas consumption ratio.
For the Z-type connection, the reaction gas utilization rates of the four stacks are 0.50536, 0.50920, 0.48619, and 0.50270, respectively. The overall fluctuation is relatively small, and the values of all stacks are close to the prescribed utilization of 0.50. In particular, the utilization rate of Stack 3 is slightly lower than the prescribed value, indicating a relatively sufficient reaction gas supply. These results show that, under the prescribed anode utilization of 50%, the Z-type connection enables the local reaction gas utilization rates of each stack to remain closer to the prescribed value, thereby demonstrating better anode-side flow distribution uniformity.
In general, the variation patterns of reaction gas utilization remain relatively consistent within the prescribed anode utilization range of 30–80%. Therefore, using the 50% condition as a representative case is considered reasonable. Under this condition, the reaction gas utilization values of the four stacks in the Z-type layout are more evenly distributed, whereas the corresponding values for the U-type layout rise progressively along the sequence from Stack 1–Stack 4. This suggests that the U-type layout shows more pronounced local differences in anode-side flow distribution. This finding is also consistent with the previous evaluation of anode-side mass-flow allocation and flow consistency.
5. Conclusions
In the present work, a 3D computational model for a 4 × 1 kW solid oxide fuel cell stack system was established to investigate how U-type and Z-type piping layouts affect mass-flow allocation and distribution consistency. Flow characteristics on both the cathode and anode sides were systematically evaluated at the stack scale and the individual-cell scale. The major findings are summarized as follows:
On the cathode side, under an air utilization rate of 30%, the U-type arrangement provided a more balanced flow allocation compared with the Z-type arrangement. The flow-consistency indices for the U-type arrangement were 0.9485 among the four stacks and 0.91842 among the 160 single cells, both of which were higher than the values obtained for the Z-type layout. This means that the U-type layout can deliver air more evenly to the cathode region.
For the 160 cathode-side single cells, the abrupt variations in mass flow rate near cell numbers 40, 80, and 120 were mainly caused by the transition between adjacent stacks, rather than by sudden flow changes within a single stack. The results further confirmed that the U-type layout produced smaller flow deviations among the stacks and individual cells, thereby improving cathode-side flow distribution.
Under a cathode-side air utilization rate of 30%, the U-type arrangement also exhibited superior local reactant-gas utilization uniformity compared with the Z-type arrangement. The reaction gas utilization values of the U-type layout remained closer to the prescribed value of 0.30 and showed a narrower variation range among the four stacks. By comparison, the Z-type layout showed larger local-utilization differences, with Stack 1 reaching the highest value of 0.38259. This indicates that gas supply was insufficient in the region with the highest local utilization. These results suggest that the U-type layout achieves a more balanced cathode-side reaction gas distribution, which agrees well with the previous mass flow distribution and flow uniformity analyses.
On the anode side, the Z-type layout exhibited superior mass-flow consistency compared with the U-type layout across all examined fuel utilization cases. As the fuel utilization increased from 30% to 80%, the uniformity index of the Z-type layout increased from 0.9740 to 0.9865, whereas that of the U-type layout slightly decreased from 0.9596 to 0.9579. This demonstrates that the Z-type layout is more effective in enhancing fuel-gas distribution uniformity.
The mass flow uniformity results for the 160 anode-side single cells were highly consistent with those obtained for the four stacks, showing nearly the same variation tendency. This indicates that the effect of the connection layout on flow allocation appears not only at the stack scale but also at the individual-cell scale.
On the anode side, under the representative fuel utilization condition of 50%, the Z-type layout provided better local reaction gas utilization uniformity than the U-type layout. The reaction gas utilization values of the Z-type layout remained close to the prescribed value of 0.50, with only small fluctuations among the four stacks. In contrast, the U-type layout showed a gradual increase from Stack 1 to Stack 4, with Stack 4 reaching the highest value of 0.52327, indicating a relatively higher local reaction gas consumption ratio. These results suggest that the Z-type layout enables a more uniform anode-side reaction gas distribution, which is consistent with the previous mass flow distribution and flow uniformity results.
Overall, the U-type layout is more suitable for improving cathode-side air distribution uniformity, while the Z-type layout is more effective for achieving balanced anode-side fuel distribution. Therefore, the optimal connection layout should be selected according to the specific gas-side flow characteristics and design requirements of the SOFC stack system.
For the practical application of vertically stacked SOFC systems, the results of this study indicate that the pipeline connection configuration should be separately optimized according to the different flow characteristics of the anode and cathode sides. Since many commercial SOFC modules are currently constructed in stacked configurations, the gas distribution strategy directly affects system stability, local reactant utilization, and long-term durability. In particular, the results of this study show that a single pipeline connection configuration may not be suitable for both the fuel side and the air side. The Z-type connection is more suitable for the anode side because it provides more uniform fuel distribution and local fuel utilization closer to the target value under different fuel utilization conditions. In contrast, the U-type connection is more suitable for the cathode side because it achieves more balanced air distribution under the investigated air utilization condition. Therefore, in the design of practical vertically stacked SOFC modules, a hybrid pipeline connection strategy may be considered, in which the anode side adopts a Z-type connection and the cathode side adopts a U-type connection, to improve the overall flow uniformity of the system.




 ,
,