


Abstract
The development of electric bus superstructures requires an integrated engineering approach combining structural design, numerical simulation, experimental validation and durability assessment. This need is particularly important for electric buses, where heavy roof-mounted battery systems and auxiliary components influence structural load paths, fatigue durability and rollover crashworthiness. This paper presents a measurement-supported workflow for the development of a virtual electric bus superstructure model, including finite element analysis, multibody dynamics simulations, operational load assessment, fatigue-oriented evaluation and rollover crashworthiness analysis. The finite element model is used to assess static load cases, modal properties and structural response under selected design conditions. A multibody vehicle model with nonlinear suspension characteristics is applied to simulate representative operating scenarios and to support the definition of dynamic load cases. Operational measurement data from previous work are used as a basis for realistic load characterization. Experimental torsional stiffness and modal tests are used to validate the numerical model. The main contribution of the study is the integration of these numerical, experimental and operational-data-based activities into a consistent early-stage verification process. The proposed workflow supports early identification of critical structural regions, assessment of design modifications and reduction in prototype-based design iterations.
1. Introduction
The electrification of urban bus fleets has introduced new structural design challenges for vehicle manufacturers. In comparison with diesel-powered buses, electric buses require the installation of traction batteries and auxiliary high-voltage components, whose total mass may reach several tonnes. In many vehicle configurations, a significant part of this mass is located in the roof area, which changes the load distribution in the superstructure and increases the structural demand on the roof frame, side walls and suspension attachment regions.
The design of an electric bus superstructure is constrained by several mutually dependent requirements. Passenger capacity is limited by general construction and approval requirements [1], maximum permissible vehicle mass, axle load limits [2] and the load-carrying capacity of suspension and tyre components. At the same time, passenger capacity is often one of the key requirements in public transport tenders. Therefore, manufacturers must search for a component layout that provides sufficient energy storage and range while maintaining acceptable axle loads, passenger capacity, structural safety and durability.
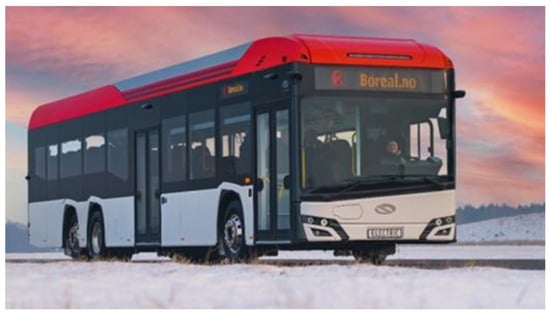
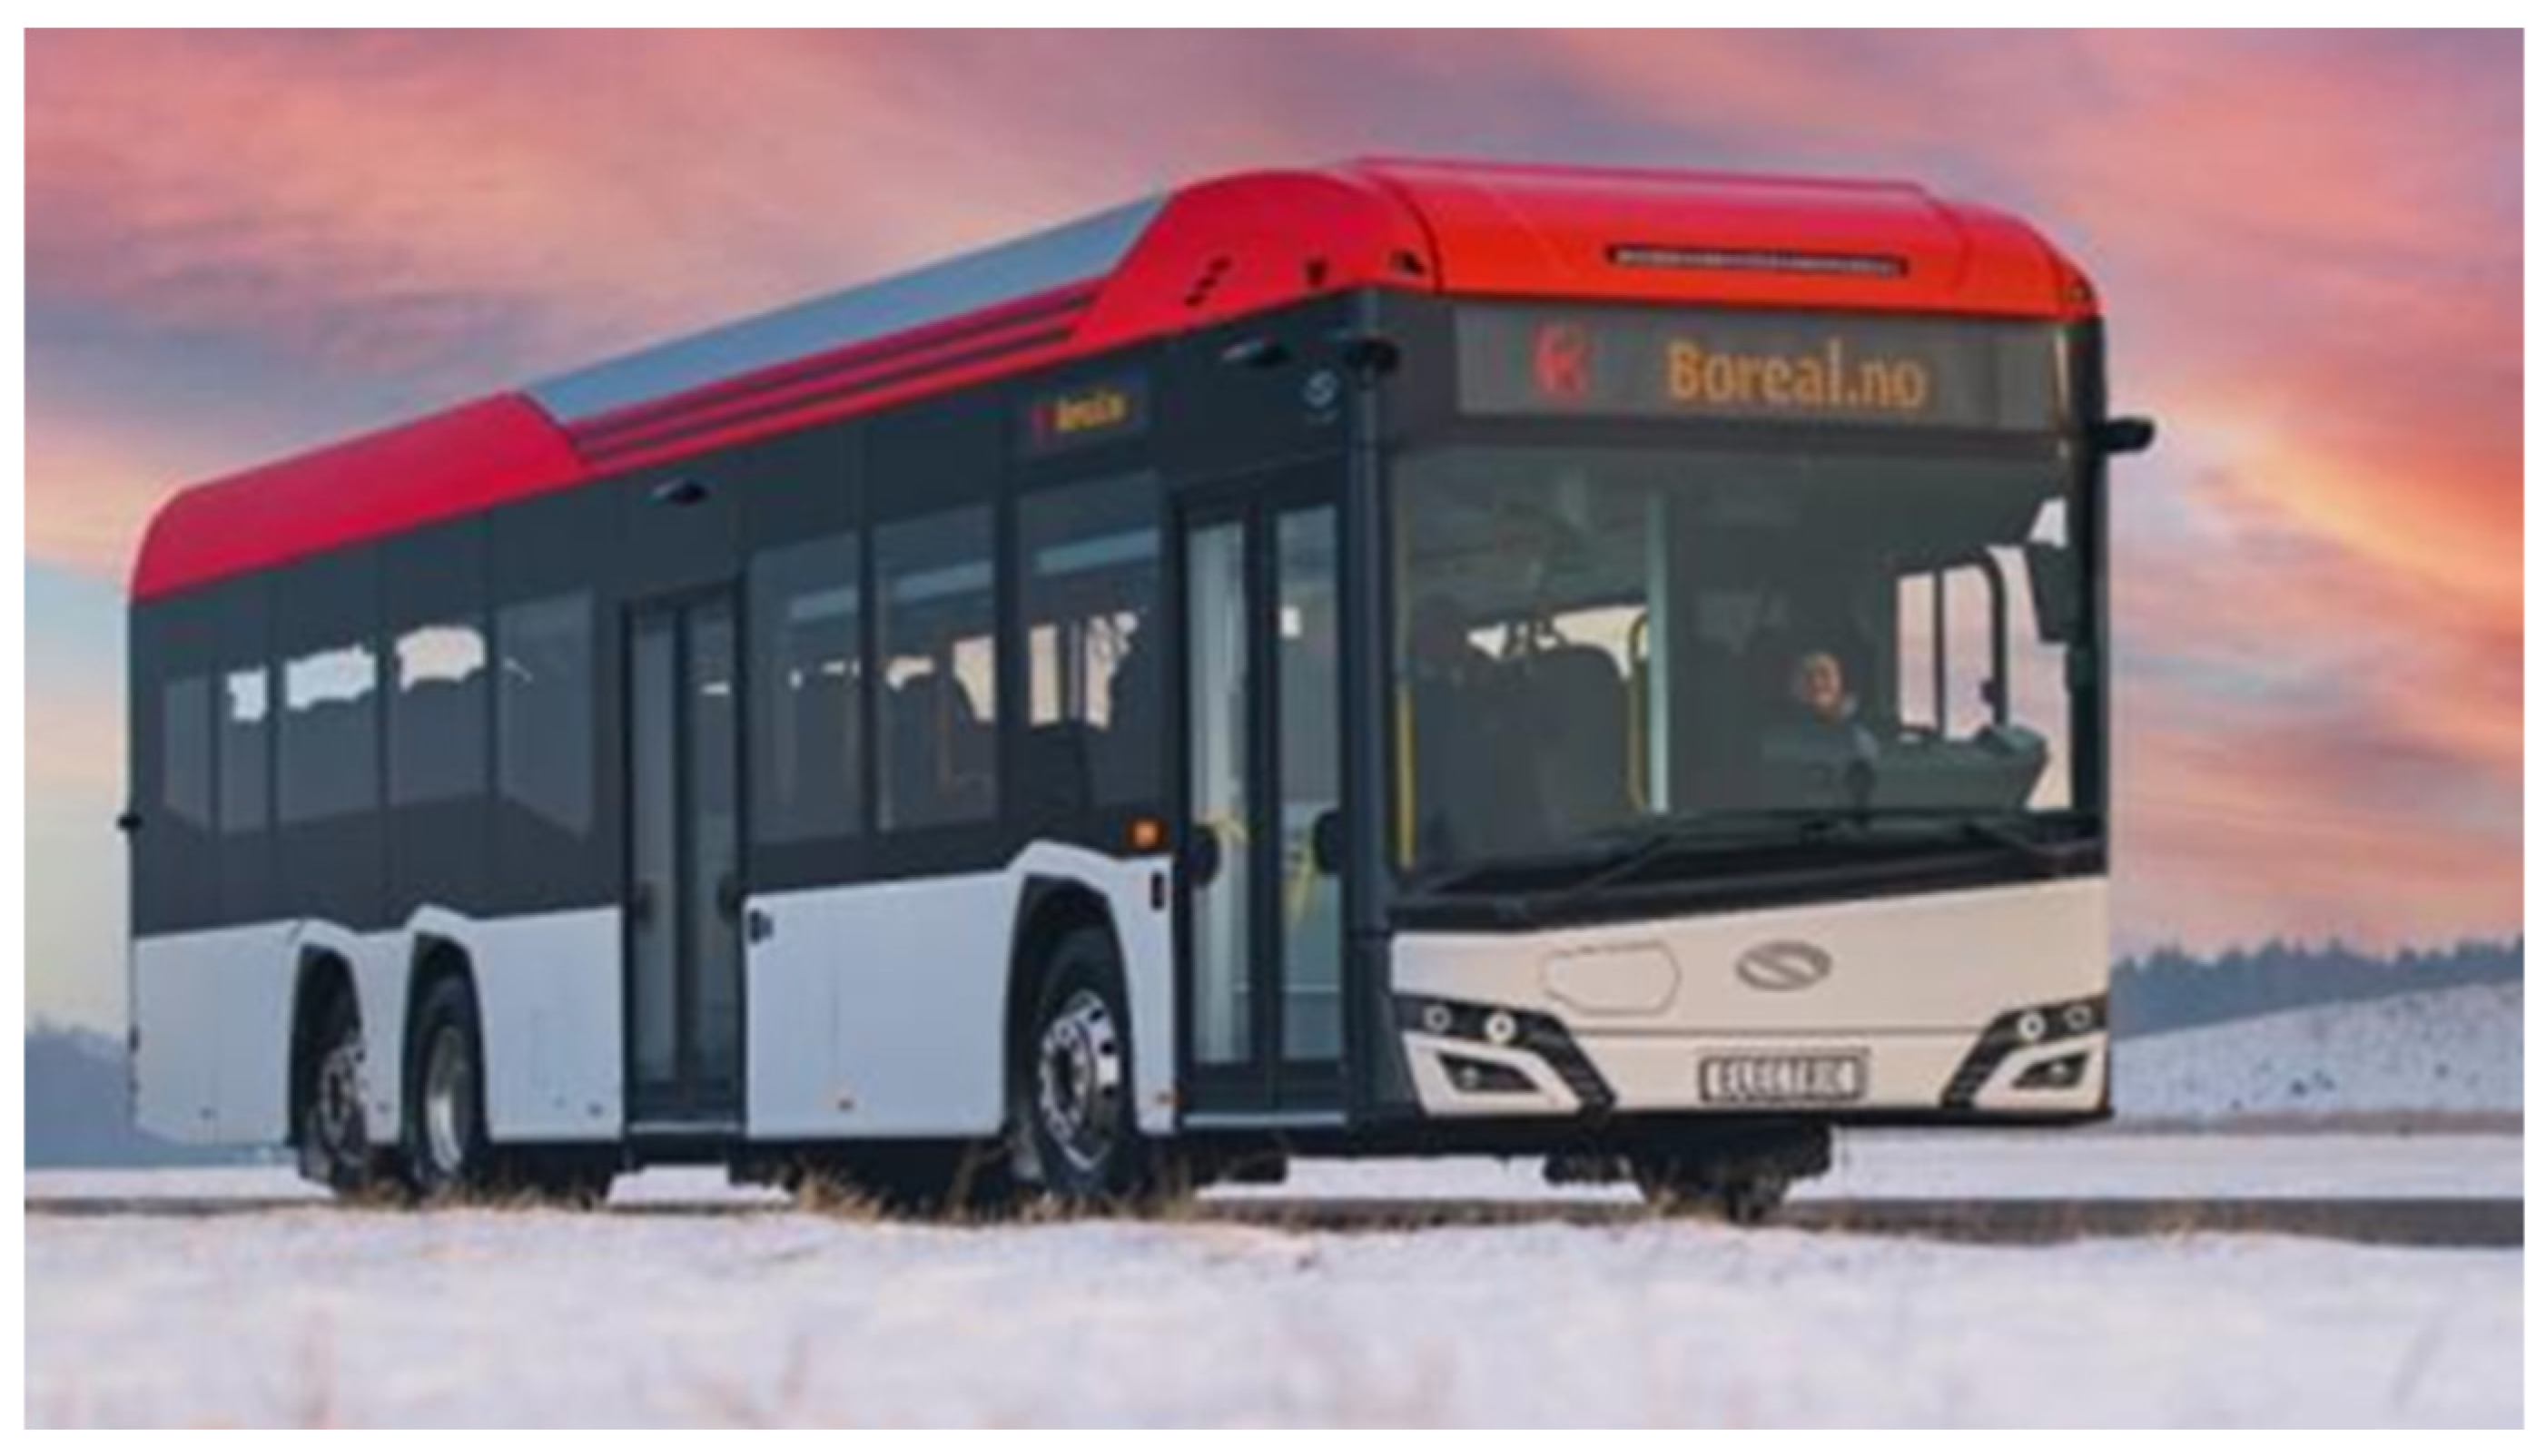
The vehicle considered in this study is a low-entry urban electric bus presented in Figure 1 and its main technical parameters are summarized in Table 1.
Figure 1.
Fully electric city bus used as a reference vehicle. Source: Solaris Bus & Coach sp. z o.o., marketing materials; used with permission.
Table 1.
Technical data of the reference electric bus.
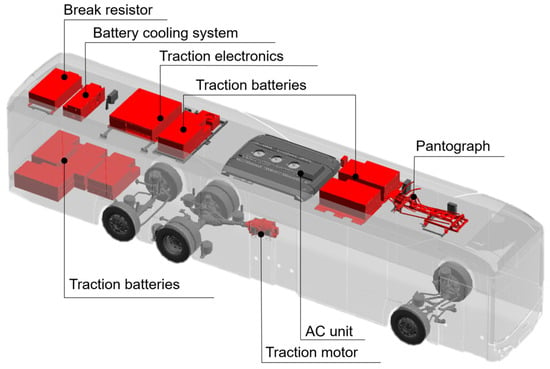
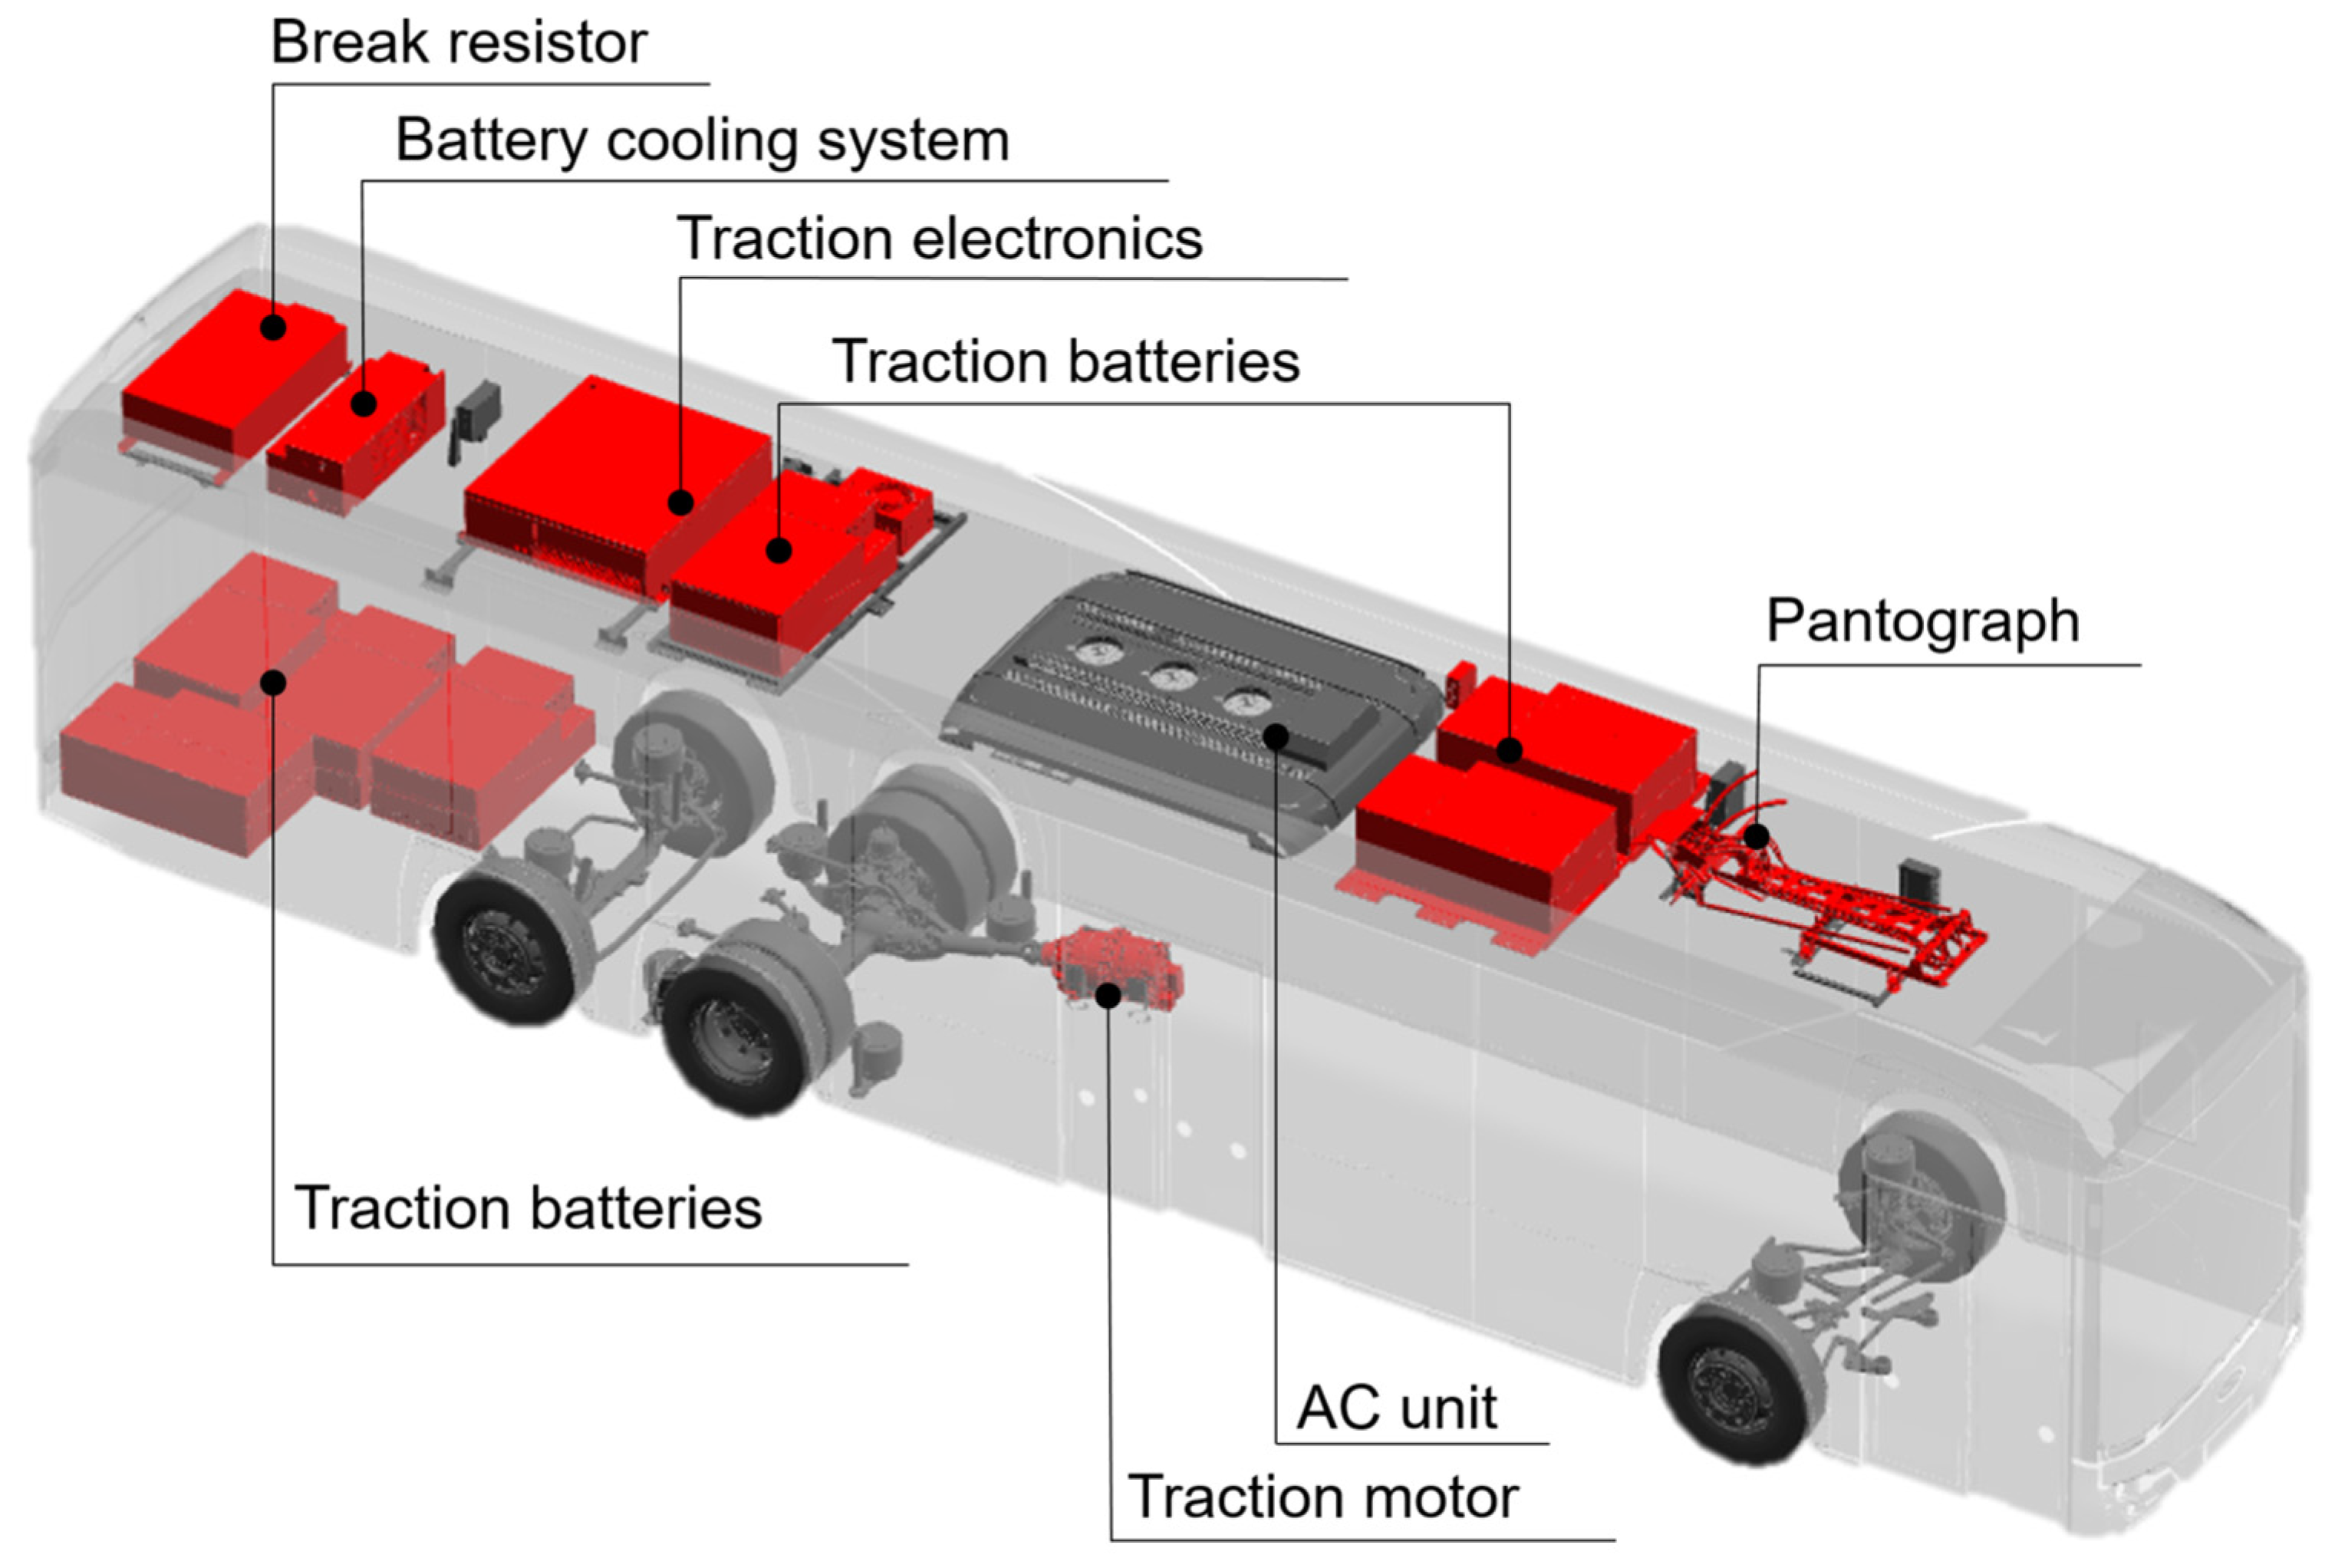
The arrangement and masses of the principal electric powertrain components are presented in Figure 2 and Table 2. In the investigated configuration, the traction batteries and selected auxiliary systems introduce a substantial additional load into the upper part of the vehicle. Consequently, the superstructure must transfer higher local and global loads than conventional diesel bus structures, particularly in the roof and side-wall regions.
Figure 2.
Arrangement of main electric powertrain components.
Table 2.
Masses of selected electric powertrain components.
The increased vertical position of heavy components also affects rollover crashworthiness assessment. For vehicle configurations for which rollover verification is required or adopted as an internal safety criterion, the superstructure must preserve the residual space during the rollover assessment according to UN Regulation No. 66 [3]. This requirement is particularly important for electric buses with heavy roof-mounted equipment, because the position of the centre of gravity influences the energy level considered in the rollover analysis.
In addition to crashworthiness, the superstructure must ensure adequate durability throughout the vehicle service life. Existing regulatory documents define general construction and safety requirements; however, they do not provide a complete publicly available methodology for fatigue-oriented structural design based on operational load spectra. This creates a need for engineering workflows that combine numerical simulations, experimental validation and operational load data.
The values summarized in Table 1 and Table 2 were used to define the reference vehicle configuration, including main dimensions, mass distribution and the lumped or non-structural masses introduced into the finite element and multibody models.
Conventional prototype-based structural verification is usually prepared and performed at a relatively late stage of vehicle development, when the main vehicle layout, superstructure geometry and distribution of major components are already largely defined. This approach is time-consuming and costly, and it limits the number of design variants that can be assessed experimentally. It may also complicate subsequent design iterations, because physical durability tests and rollover verification according to UN Regulation No. 66 are difficult to implement as part of a fast iterative design loop. In addition, such tests require dedicated infrastructure, additional instrumentation and, in the case of a complete bus, a costly prototype. For this reason, virtual verification supported by experimental validation is particularly valuable, as it enables critical structural regions to be identified before final prototype testing and can shorten the overall time-to-market of the vehicle.
Existing numerical and experimental approaches for bus structural verification are often focused on selected aspects of the development process, such as static strength assessment, modal behaviour, durability testing or rollover crashworthiness. Although these methods are well established, they are frequently applied as separate verification activities and do not always provide a unified framework linking operational load data, structural response, fatigue damage and crashworthiness requirements at an early design stage. This represents an important research and engineering gap for electric bus superstructures, because heavy roof-mounted traction batteries and auxiliary equipment affect both durability-critical load paths and rollover behaviour. The proposed workflow addresses this gap by integrating finite element modelling, multibody dynamics simulations, operational load data, fatigue-oriented assessment, rollover analysis and experimental validation into one consistent virtual verification process supporting early design decisions before final prototype testing.
This paper presents a workflow for the development of a virtual electric bus superstructure model including fatigue load spectra and crashworthiness assessment. The proposed approach combines finite element analysis, multibody dynamics simulations, torsional stiffness and modal validation, operational load data from previous work and rollover analysis. The objective of the study is to show how these methods can be integrated into a consistent structural verification process supporting the development of lightweight, safe and durable electric bus superstructures.
2. Materials and Methods
The methodological framework adopted in this study combines virtual structural modelling, experimental validation, dynamic load assessment and regulatory crashworthiness verification. The workflow was developed to support the structural design of an electric bus superstructure at the early stages of vehicle development and to reduce the number of physical prototype iterations.
Due to industrial confidentiality restrictions, detailed numerical values of loads, stresses, structural dimensions and selected material parameters are not disclosed. Therefore, the paper presents the methodology, model architecture, validation strategy and representative qualitative or normalized results. This approach allows the engineering workflow to be discussed without revealing proprietary design data.
Except for the UN Regulation No. 66 rollover simulation, all finite element modelling and numerical analyses were performed using Siemens NX/Simcenter 3D, version 2312.5000. The analyses included linear static analysis using Simcenter Nastran SOL 101, modal analysis using Simcenter Nastran SOL 103, fatigue and durability assessment using Specialist Durability, multibody dynamics simulation using Motion, and model correlation using the Correlation module. The UN Regulation No. 66 rollover simulation was performed separately using ESI Virtual Performance Solution (VPS), version 2016.06.
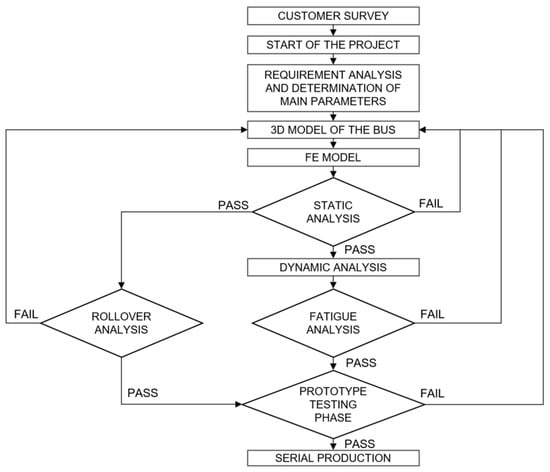
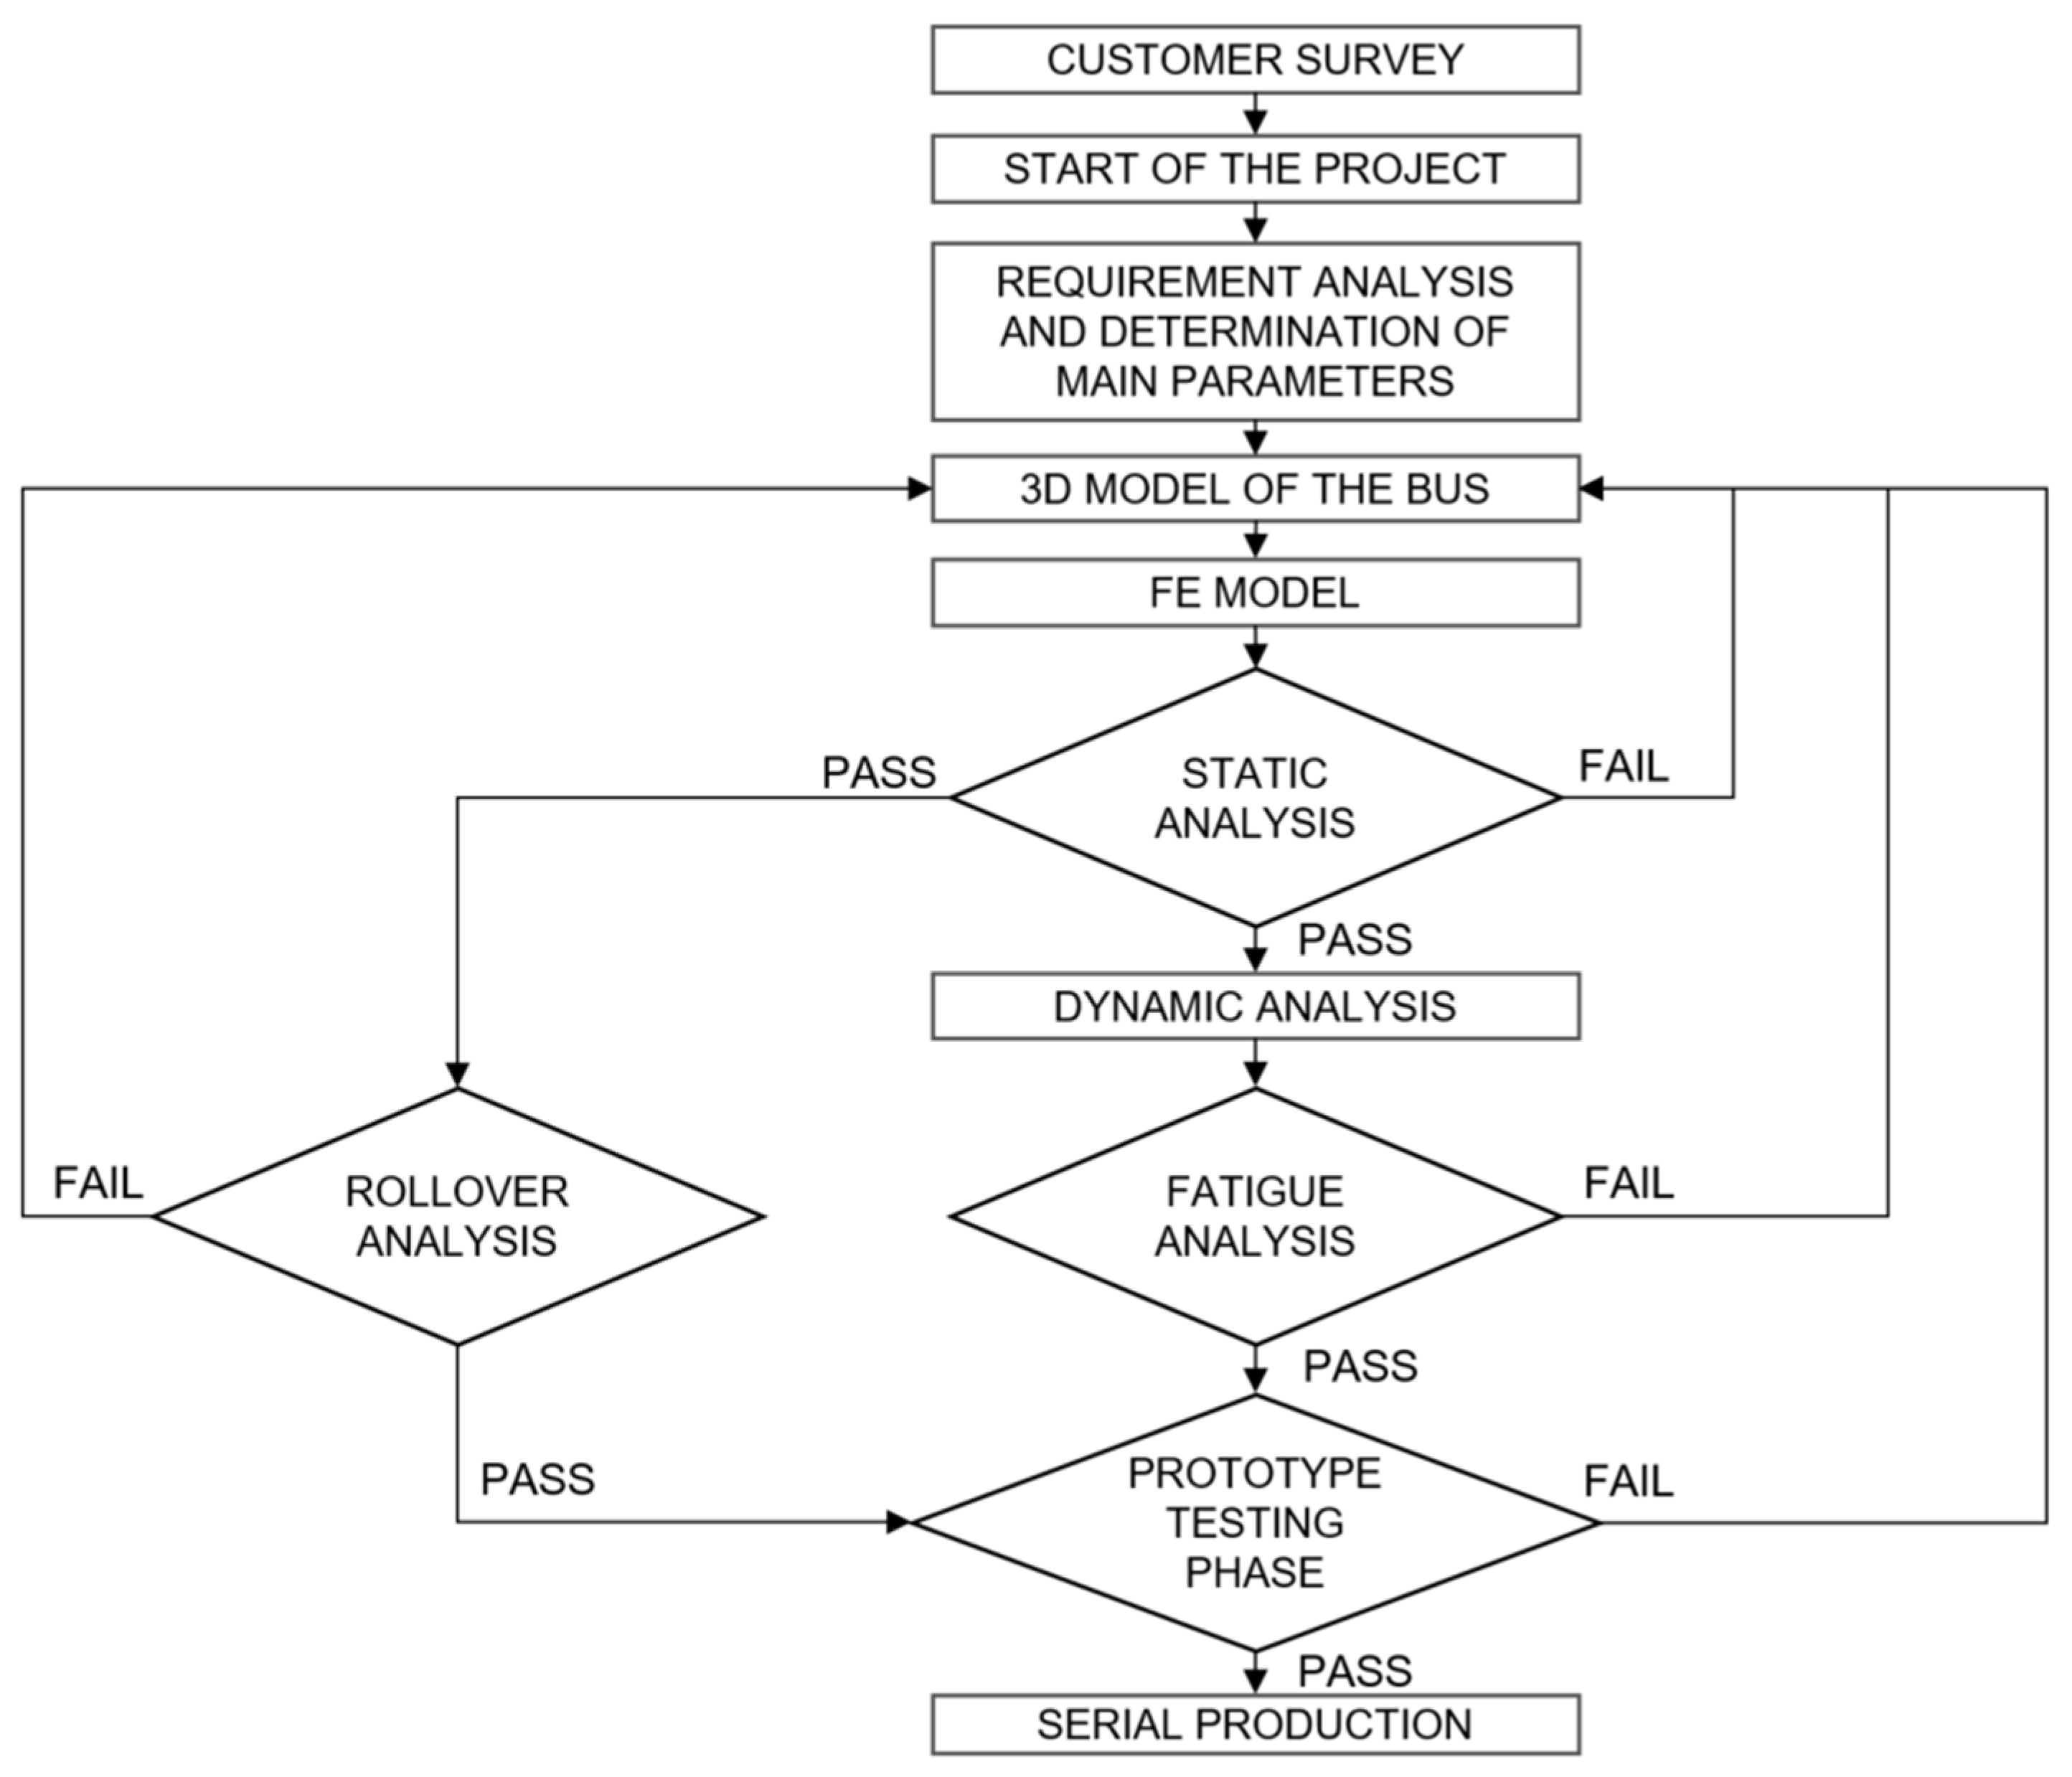
The overall workflow used for the development and verification of the electric bus superstructure is shown in Figure 3. The process starts with the definition of operational, market and regulatory requirements, which are translated into technical assumptions for the vehicle architecture. These assumptions include vehicle dimensions, passenger capacity, required driving range, battery capacity, axle load distribution, service accessibility and production constraints.
Figure 3.
Integrated design and verification workflow for an electric bus superstructure.
After the preliminary vehicle architecture is defined, the first superstructure concept is prepared and transformed into a finite element model. The model is then used for static strength assessment, modal analysis and torsional stiffness evaluation. In parallel, multibody simulations are used to define dynamic load cases, while rollover analysis is performed to assess crashworthiness requirements. If the verification criteria are not satisfied, the design is modified and the analysis loop is repeated. The workflow supports early identification of critical structural regions and enables design modifications before physical vehicle testing.
2.1. Bus Superstructure and Design Requirements
The electric bus superstructure is a load-carrying welded structure that must satisfy several functional, structural and manufacturing requirements. In addition to carrying static and dynamic loads, the structure must provide sufficient space for passengers, traction batteries, auxiliary systems, interior components and service access. The design must also be compatible with the production process and allow for efficient manufacturing of different vehicle variants.
The main vehicle-level requirements include safety, compliance with approval regulations, passenger capacity, energy efficiency, comfort, ergonomics, service accessibility, manufacturability and production cost. From the structural point of view, the most important requirements are low mass, sufficient stiffness, crashworthiness, fatigue durability, reliability and cost-effective manufacturing. These requirements are often conflicting, because reducing the mass of the superstructure may improve passenger capacity and energy efficiency, but may also reduce stiffness, fatigue strength or local load-carrying capacity. Therefore, structural optimization must be supported by numerical simulations and experimental validation.
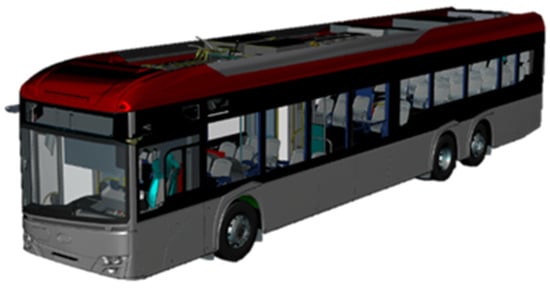
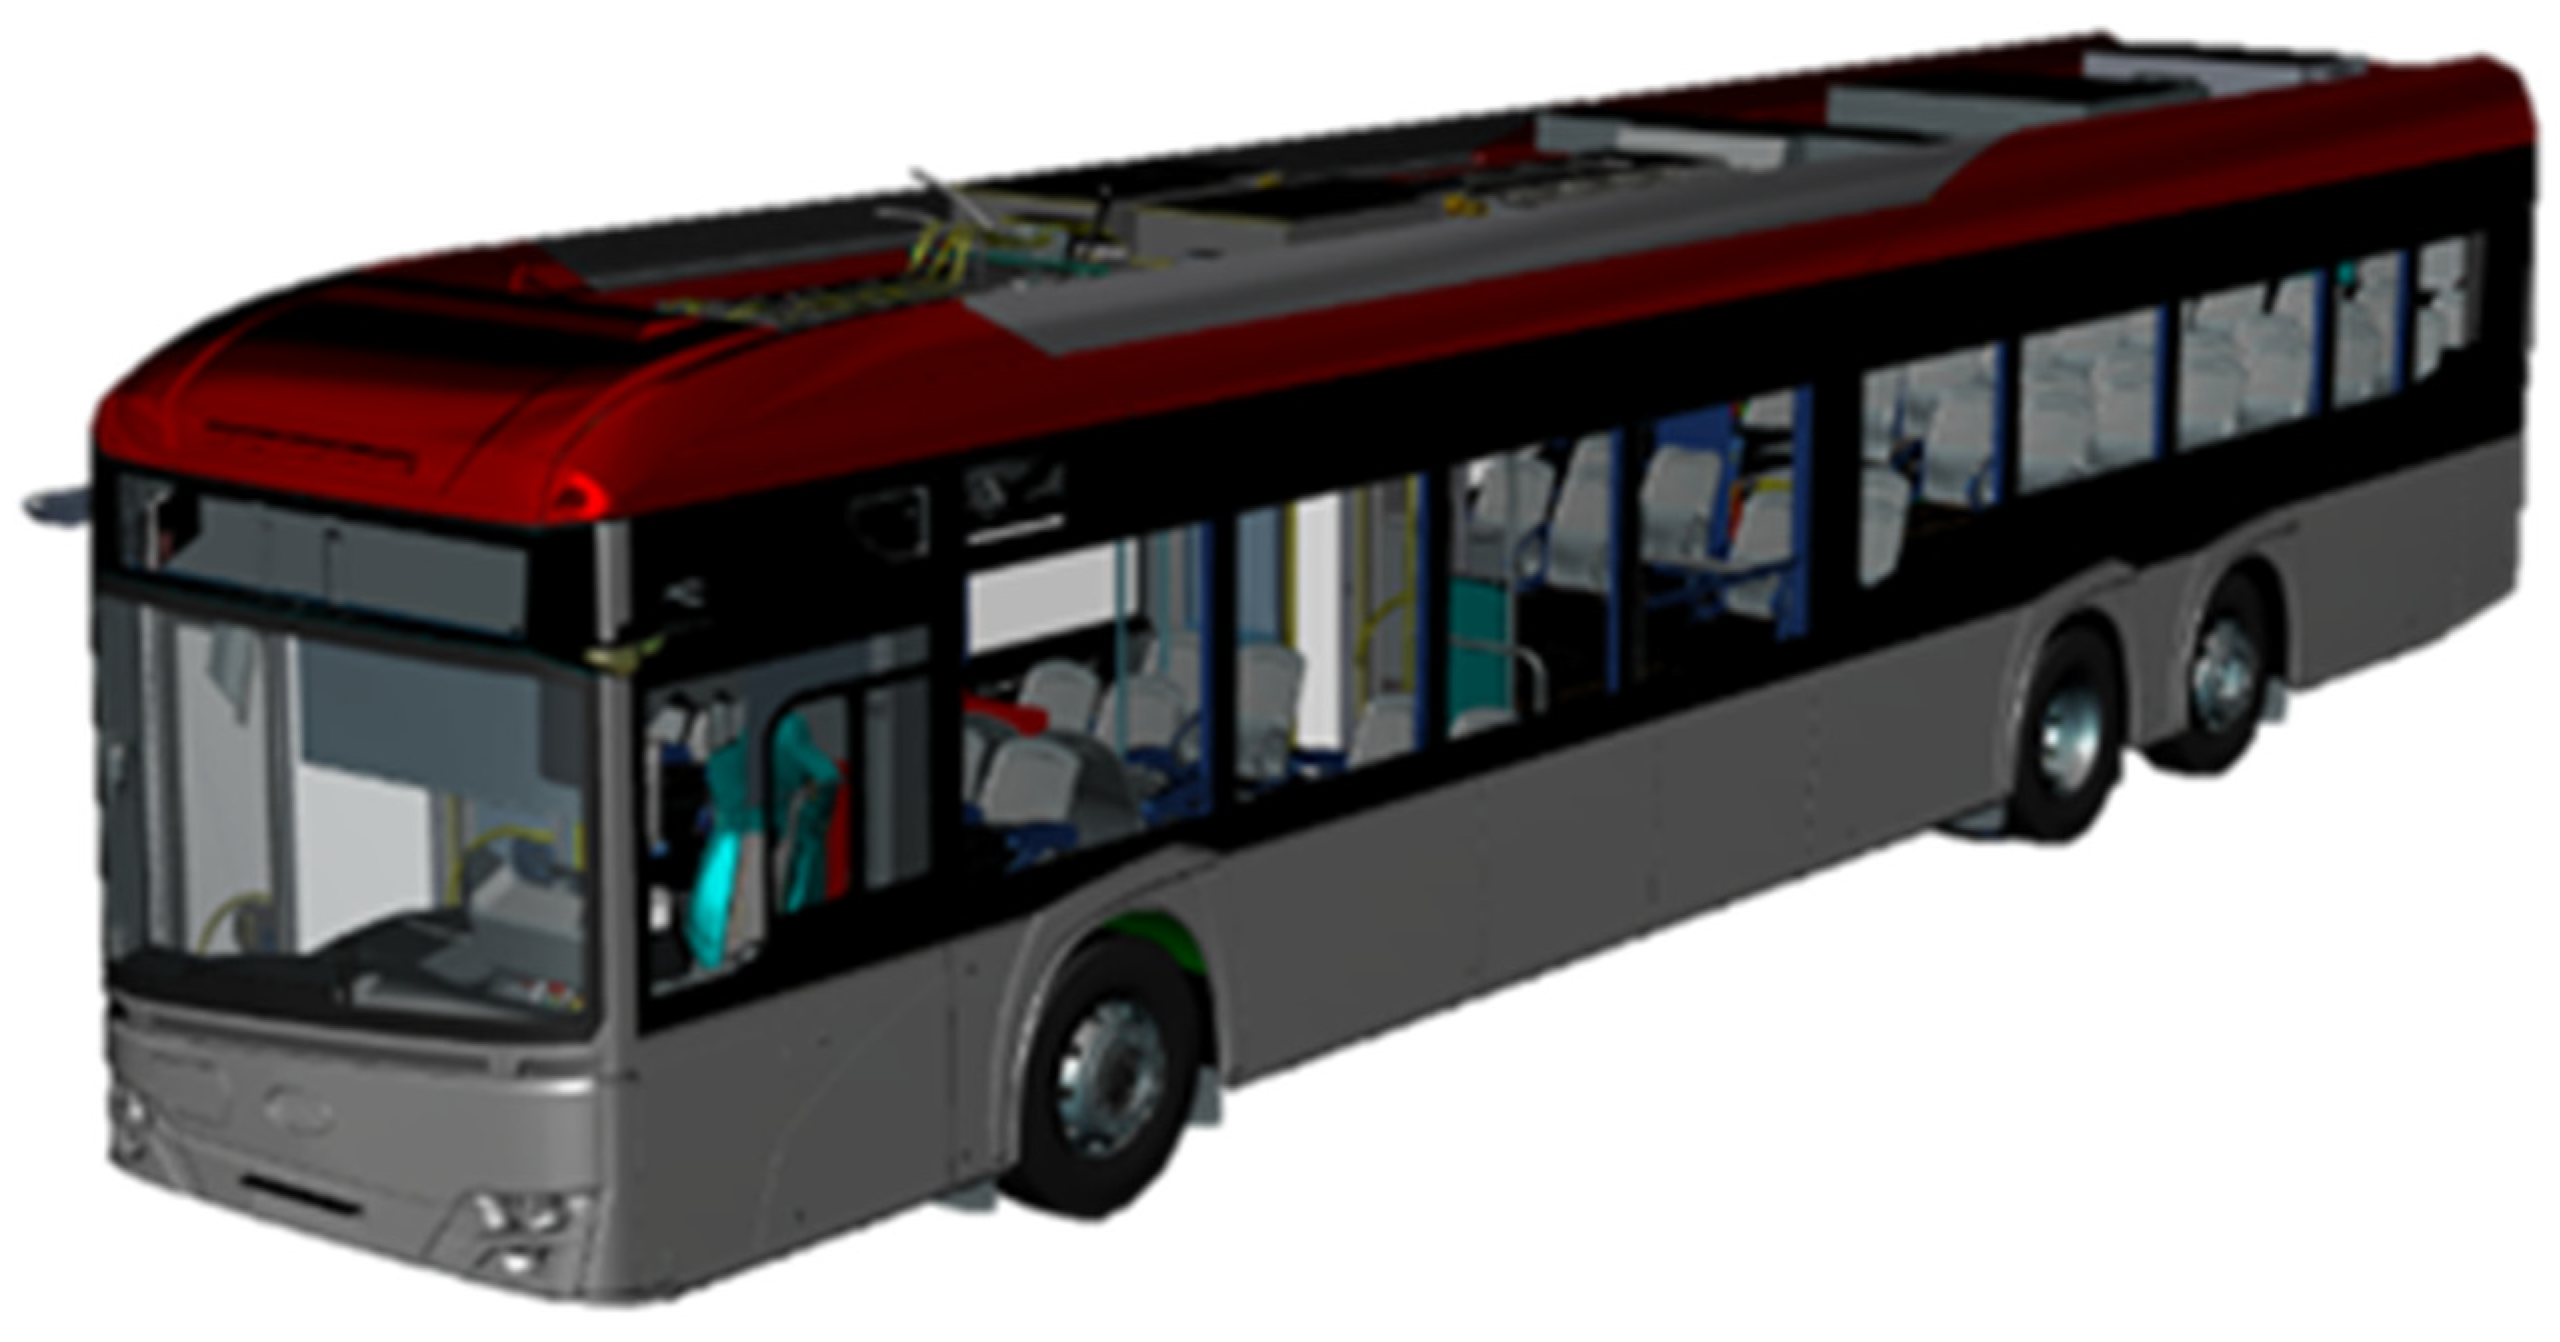
A digital mock-up of the fully equipped vehicle, shown in Figure 4, is used as a reference model during the development process. It provides a common working basis for design, simulation, manufacturing and service-related activities. The digital mock-up allows the positions of the main components, structural interfaces, passenger compartment, service areas and equipment installation zones to be verified before detailed structural analyses are performed.
Figure 4.
Digital mock-up of the fully equipped reference bus.
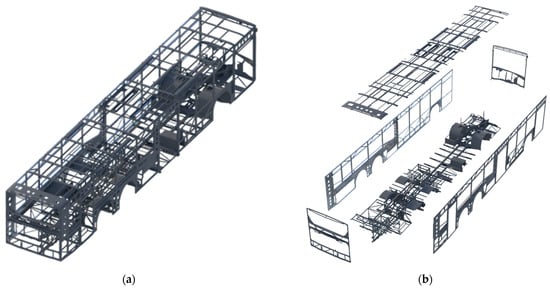
The welded superstructure frame of the reference bus is shown in Figure 5a, while the main modular regions of the structure are presented in Figure 5b. The frame is made of thin-walled steel profiles and sheet components joined into a welded load-carrying structure. The use of thin-walled members enables the required stiffness and strength to be achieved while limiting the mass of the superstructure.
Figure 5.
Welded superstructure frame of the reference bus: (a) complete welded frame; (b) main modular regions of the superstructure.
The superstructure has a modular architecture. A common structural base is maintained for different vehicle variants, while selected regions can be adapted depending on the vehicle configuration and installed equipment. This approach supports partial standardization of the production process and allows different variants, such as electric buses and trolleybuses, to be developed using similar structural principles.
The structure is manufactured from ferritic stainless steel, which provides a compromise between corrosion resistance, mechanical properties and production cost. In the case of electric buses, the mass of traction batteries and auxiliary roof-mounted equipment increases the structural demand in the roof and side-wall regions. Therefore, reliable identification of operational loads is required before mass reduction or structural optimization can be performed safely.
2.2. Finite Element Model
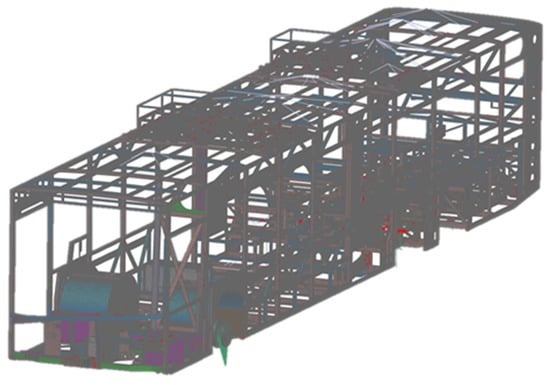
The numerical assessment of the bus superstructure starts with the preparation of a finite element model. Since the load-carrying structure of the bus is mainly composed of thin-walled closed profiles and sheet components, the superstructure was modelled primarily using shell elements. This modelling approach provides an efficient representation of the global stiffness and stress distribution while keeping the computational cost acceptable for iterative design analyses.
Depending on the complexity of the vehicle variant and the level of modelling detail, the preparation of a full-vehicle superstructure mesh typically requires several weeks. The model used in this study contained more than 1.5 million finite elements, with more than 90% of the mesh represented by four-node quadrilateral shell elements.
Non-load-carrying interior components were represented as non-structural parts or simplified mass contributions. Major aggregates and passenger mass were introduced as lumped masses and connected to the structure using rigid elements. Axles and suspension interfaces were represented using a combination of three-dimensional, one-dimensional and connector elements. Air spring interfaces were modelled using bushing elements, which allowed equivalent stiffness properties to be introduced at the suspension attachment points.
The resulting finite element model, shown in Figure 6, was used as the basis for static load case analysis, modal analysis, torsional stiffness assessment and further dynamic and fatigue-oriented calculations. Due to industrial confidentiality restrictions, detailed structural dimensions, material parameters and local stress values are not disclosed; however, the model architecture and validation strategy are described in the following sections.
Figure 6.
Finite element model of the electric bus superstructure.
2.3. Load Case Definition for Numerical Analyses
The definition of representative load cases is a key step in the structural assessment of a bus superstructure. In contrast to selected approval or safety requirements, operational load cases for fatigue-oriented structural design are not prescribed in detail by generally available homologation procedures. Therefore, the load cases used in industrial vehicle development may be derived from measurements performed on similar vehicles, measurements conducted on prototypes, internal engineering procedures or a combination of these approaches.
At the early stage of numerical assessment, extreme operational cases are typically considered. These include gravitational loading of the fully loaded vehicle, vertical overload, emergency braking, cornering, frame twisting, road irregularities, powertrain-related loads and service cases such as lifting or towing. For low-frequency maneuvers, such as braking or cornering, measured peak accelerations or forces can be converted into quasi-static load cases and applied to the finite element model.
For dynamic and fatigue-oriented assessment, operational measurements provide an important source of realistic loading information. In the present workflow, measurement data obtained from prototype or similar vehicle testing are used to support the definition of representative dynamic load cases. The measurement procedure and load characterization are described in previous work [4].
Road-induced loads may be represented using different approaches depending on the objective of the analysis. One possibility is to use measured suspension or body response signals and derive equivalent model inputs that reproduce the recorded vehicle response. Another approach is to use a virtual proving ground, in which the vehicle model is simulated on deterministic obstacles, test tracks or road profiles described statistically, for example according to ISO 8608 [5]. For fatigue assessment, both stochastic road descriptions and deterministic events should be considered, because local road irregularities and repeated obstacles may have a significant influence on fatigue damage accumulation.
The load case definition process used in this study combines internal engineering experience, previous operational measurements and numerical simulation. This approach allows the structural response of the superstructure to be evaluated under representative operating conditions while maintaining confidentiality of the detailed industrial data.
2.4. Static Load Cases
The first stage of numerical verification is based on linear static analyses performed using the Simcenter Nastran SOL 101 solver. These analyses are used to evaluate the structural response of the superstructure under selected representative load cases and to identify critical regions at an early stage of the design process.
The static load cases are defined based on typical and extreme operating conditions, internal engineering procedures and operational measurements obtained from previous vehicle tests. The considered load cases include gravitational loading of the fully loaded vehicle, vertical overload, emergency braking, cornering, frame twisting, equivalent road irregularity cases, powertrain-related loads and service load cases such as lifting and towing. Selected static load cases used in the structural assessment, together with their intended purpose, are summarized in Table 3.
Table 3.
The main groups of static load cases used in the structural assessment.
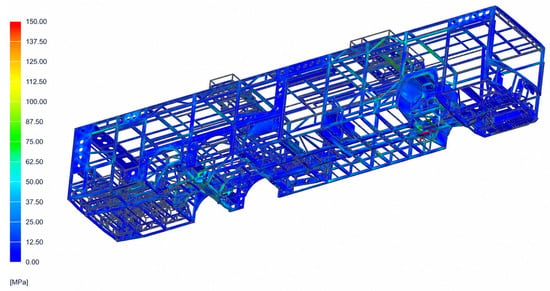
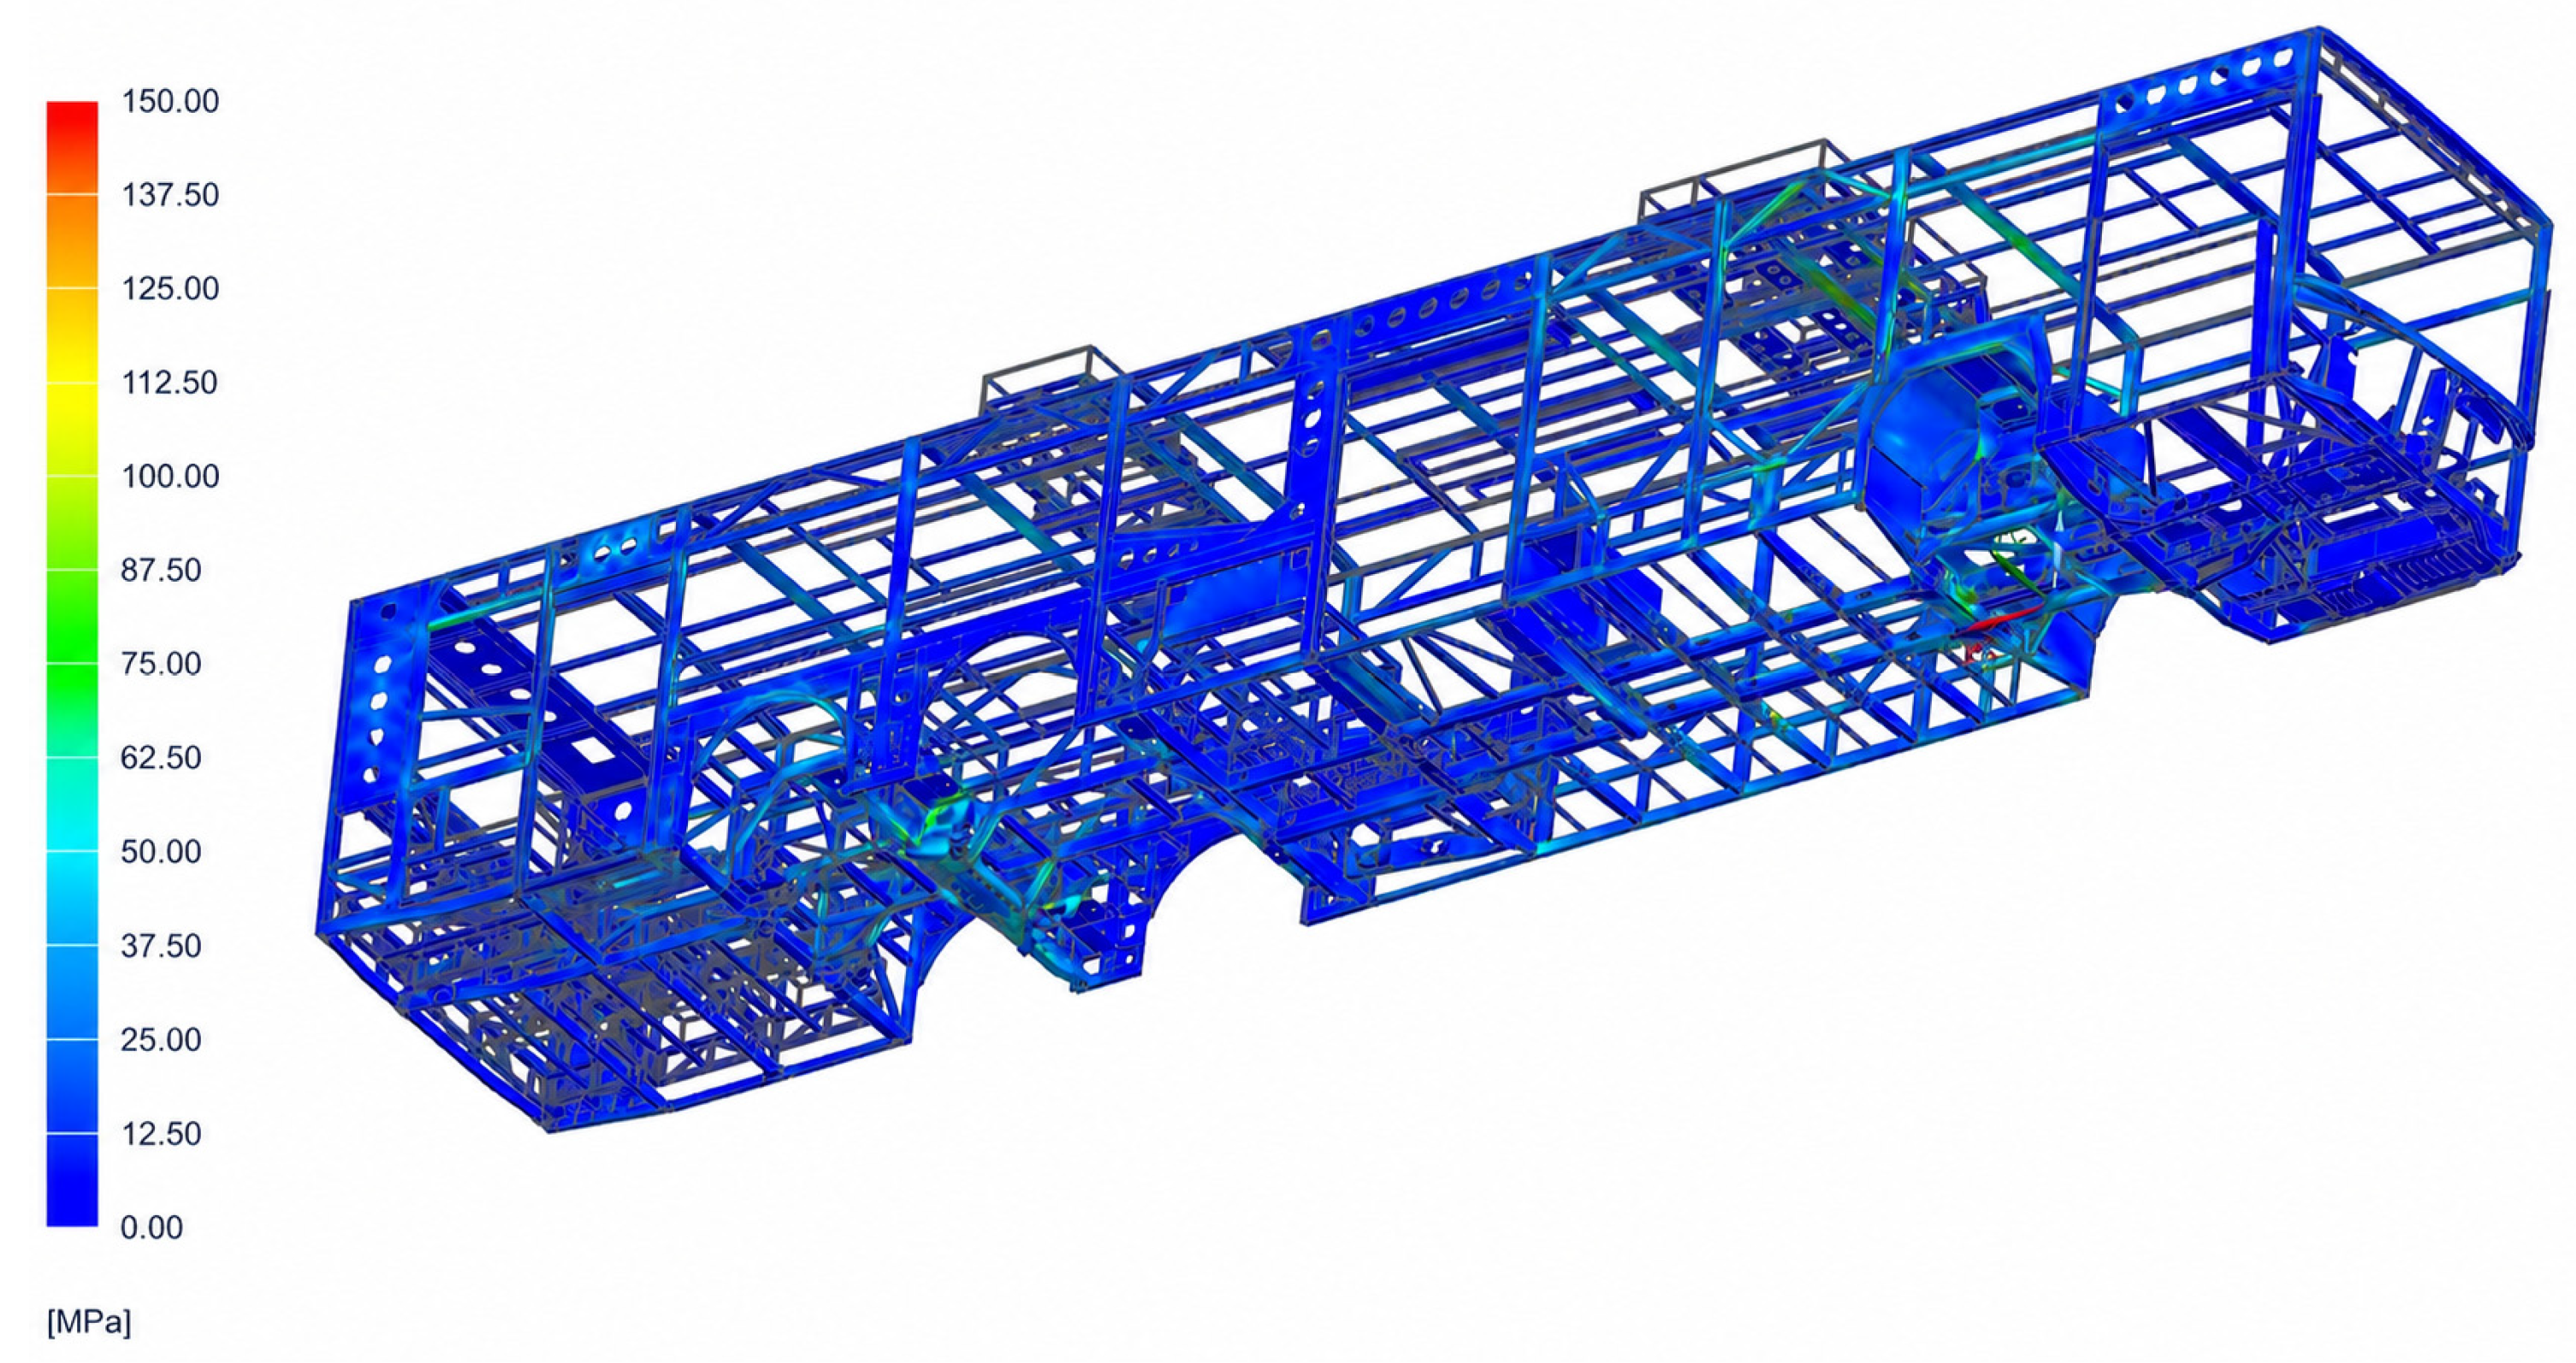
For low-frequency maneuvers, such as braking or cornering, dynamic effects are assumed to be limited and the measured or assumed peak values can be represented by equivalent quasi-static loads. Frame twisting cases are introduced by applying different vertical wheel displacement configurations, which enables the global stiffness and load transfer paths of the superstructure to be assessed. Powertrain-related cases include loads resulting from the maximum traction motor torque and the installation of heavy electric drive components. A representative stress distribution obtained for the emergency braking load case with an assumed deceleration of 0.7 g is shown in Figure 7. In this load case, increased stress levels were observed mainly in the floor structure near the vehicle suspension attachment areas.
Figure 7.
Equivalent von Mises stress distribution for the emergency braking load case. The quasi-static case represents longitudinal braking at 0.7 g. The highest stress levels were observed mainly in the floor structure near the suspension attachment areas.
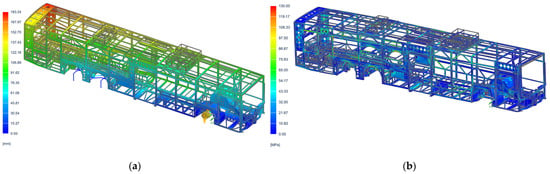
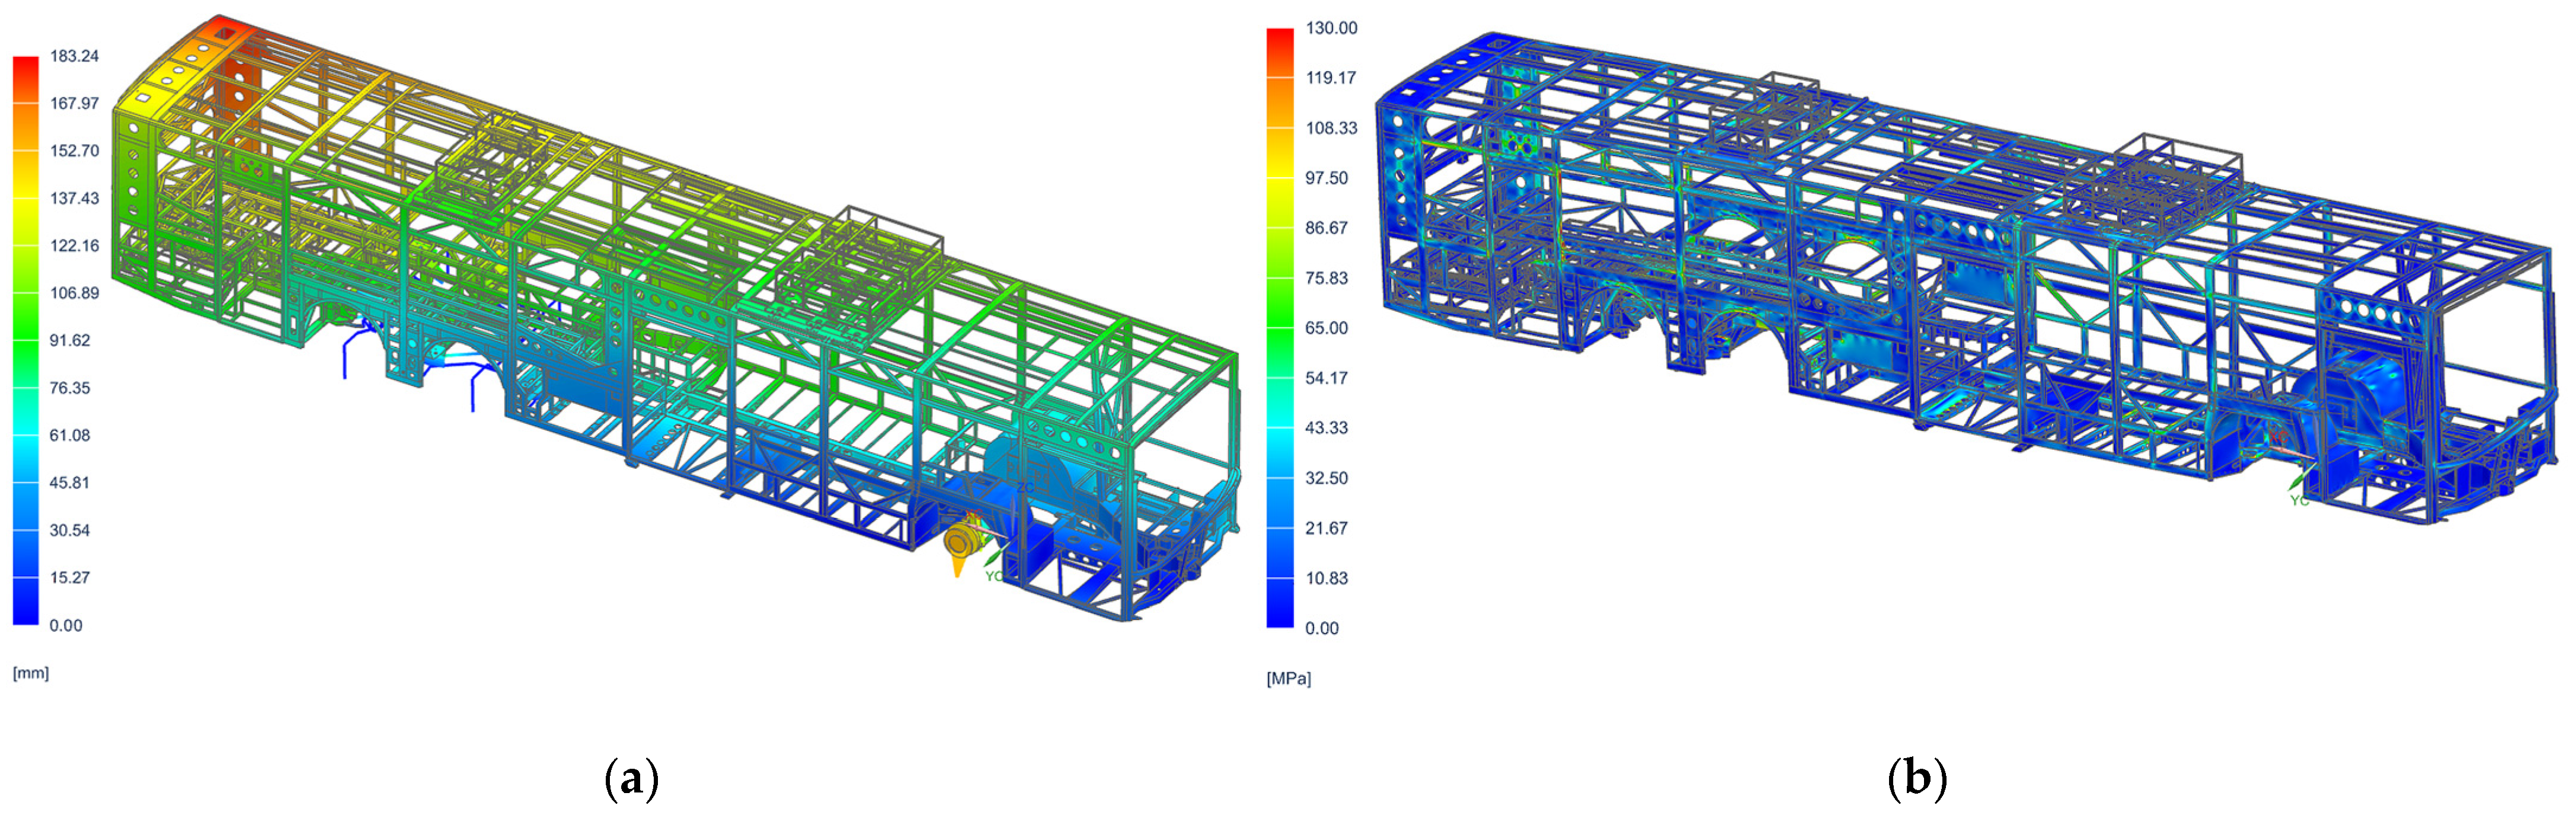
An example of the frame twisting analysis, including deformation and stress distribution, is shown in Figure 8. In the presented case, the frame twist was introduced by imposing a vertical displacement of 150 mm on the right-side wheels of the first axle. Similar load cases are defined for the remaining wheel positions and for alternating wheel-lift and wheel-drop configurations applied to different axles in order to assess global stiffness and load transfer paths. For the presented configuration, increased stress levels were observed mainly in the side-wall regions of the superstructure, which participate significantly in the global torsional load transfer.
Figure 8.
Results of the frame-twist load case: (a) deformation pattern of the superstructure caused by a 150 mm vertical displacement imposed on the right-side wheels of the first axle; (b) corresponding equivalent von Mises stress distribution. For the presented load case, the highest stress levels were observed mainly in the side-wall regions of the superstructure.
The static strength criterion is based on the allowable stress limit. At this stage of the design process, the allowable stress is defined as the yield stress of the material divided by a safety factor:
where is the allowable stress limit, is the yield stress of the material and is the safety factor. The value of the safety factor may differ depending on the load case, probability of occurrence and structural criticality of the analyzed region. Higher safety margins are typically required in highly loaded areas, such as suspension attachment points and other regions where loads are introduced into the superstructure.
Regions exceeding the allowable stress criterion are modified and reanalysed in the next design iteration. The final structural evaluation is supported by experimental validation, dynamic simulations and fatigue assessment described in the following sections.
2.5. Torsional Stiffness and Experimental Validation
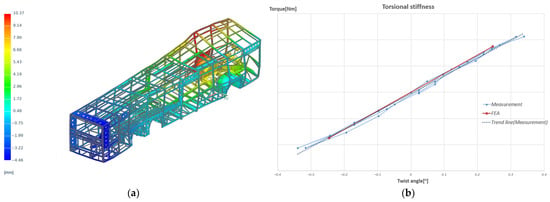
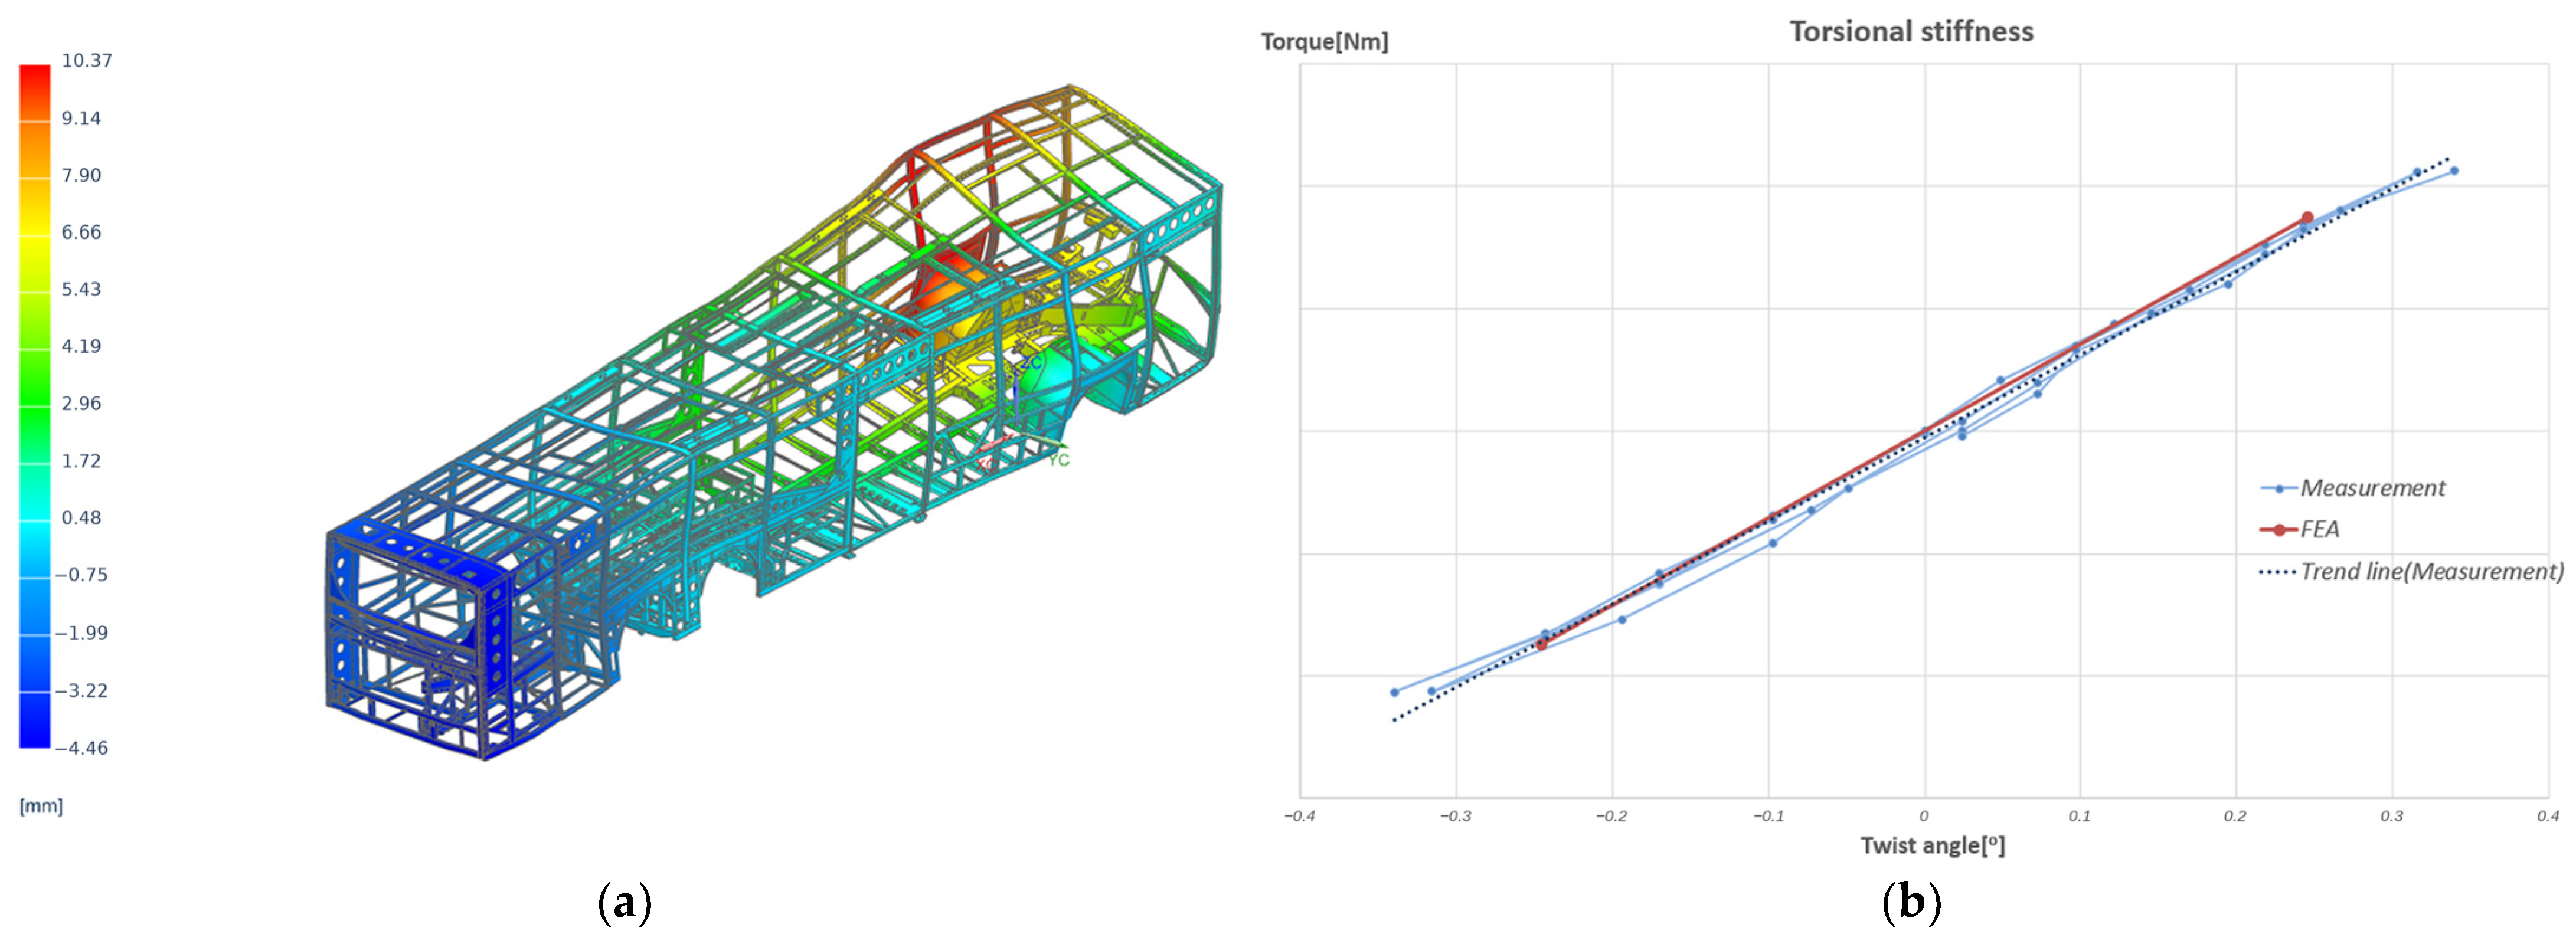
Torsional stiffness was selected as one of the main global parameters for validation of the finite element model. It is defined as the ratio between the applied twisting moment and the resulting twist angle of the structure. This parameter is particularly useful for bus superstructures, because it represents the global load-carrying behaviour of the roof, side walls and underframe and allows different design variants to be compared.
The torsional stiffness test was performed on the welded bus superstructure. During the test, the structure was supported at three points located close to the axle positions, while the fourth support point was vertically displaced in order to introduce torsional deformation. The frame was placed on scales, which allowed the vertical reactions at the support points to be monitored. The lifting process was continued until one of the support reactions approached zero. The same boundary conditions were reproduced in the finite element model in order to compare the numerical and experimental results.
The torsional stiffness coefficient was calculated according to
where is the torsional stiffness coefficient in [N∙m/°], is the applied twisting moment in [N∙m], is the twist angle in [°], is the vertical reaction force at the lifting point [N], and l is the distance between the support points used in the test configuration [m].
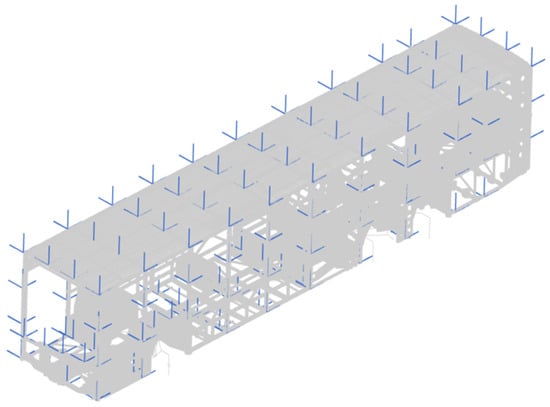
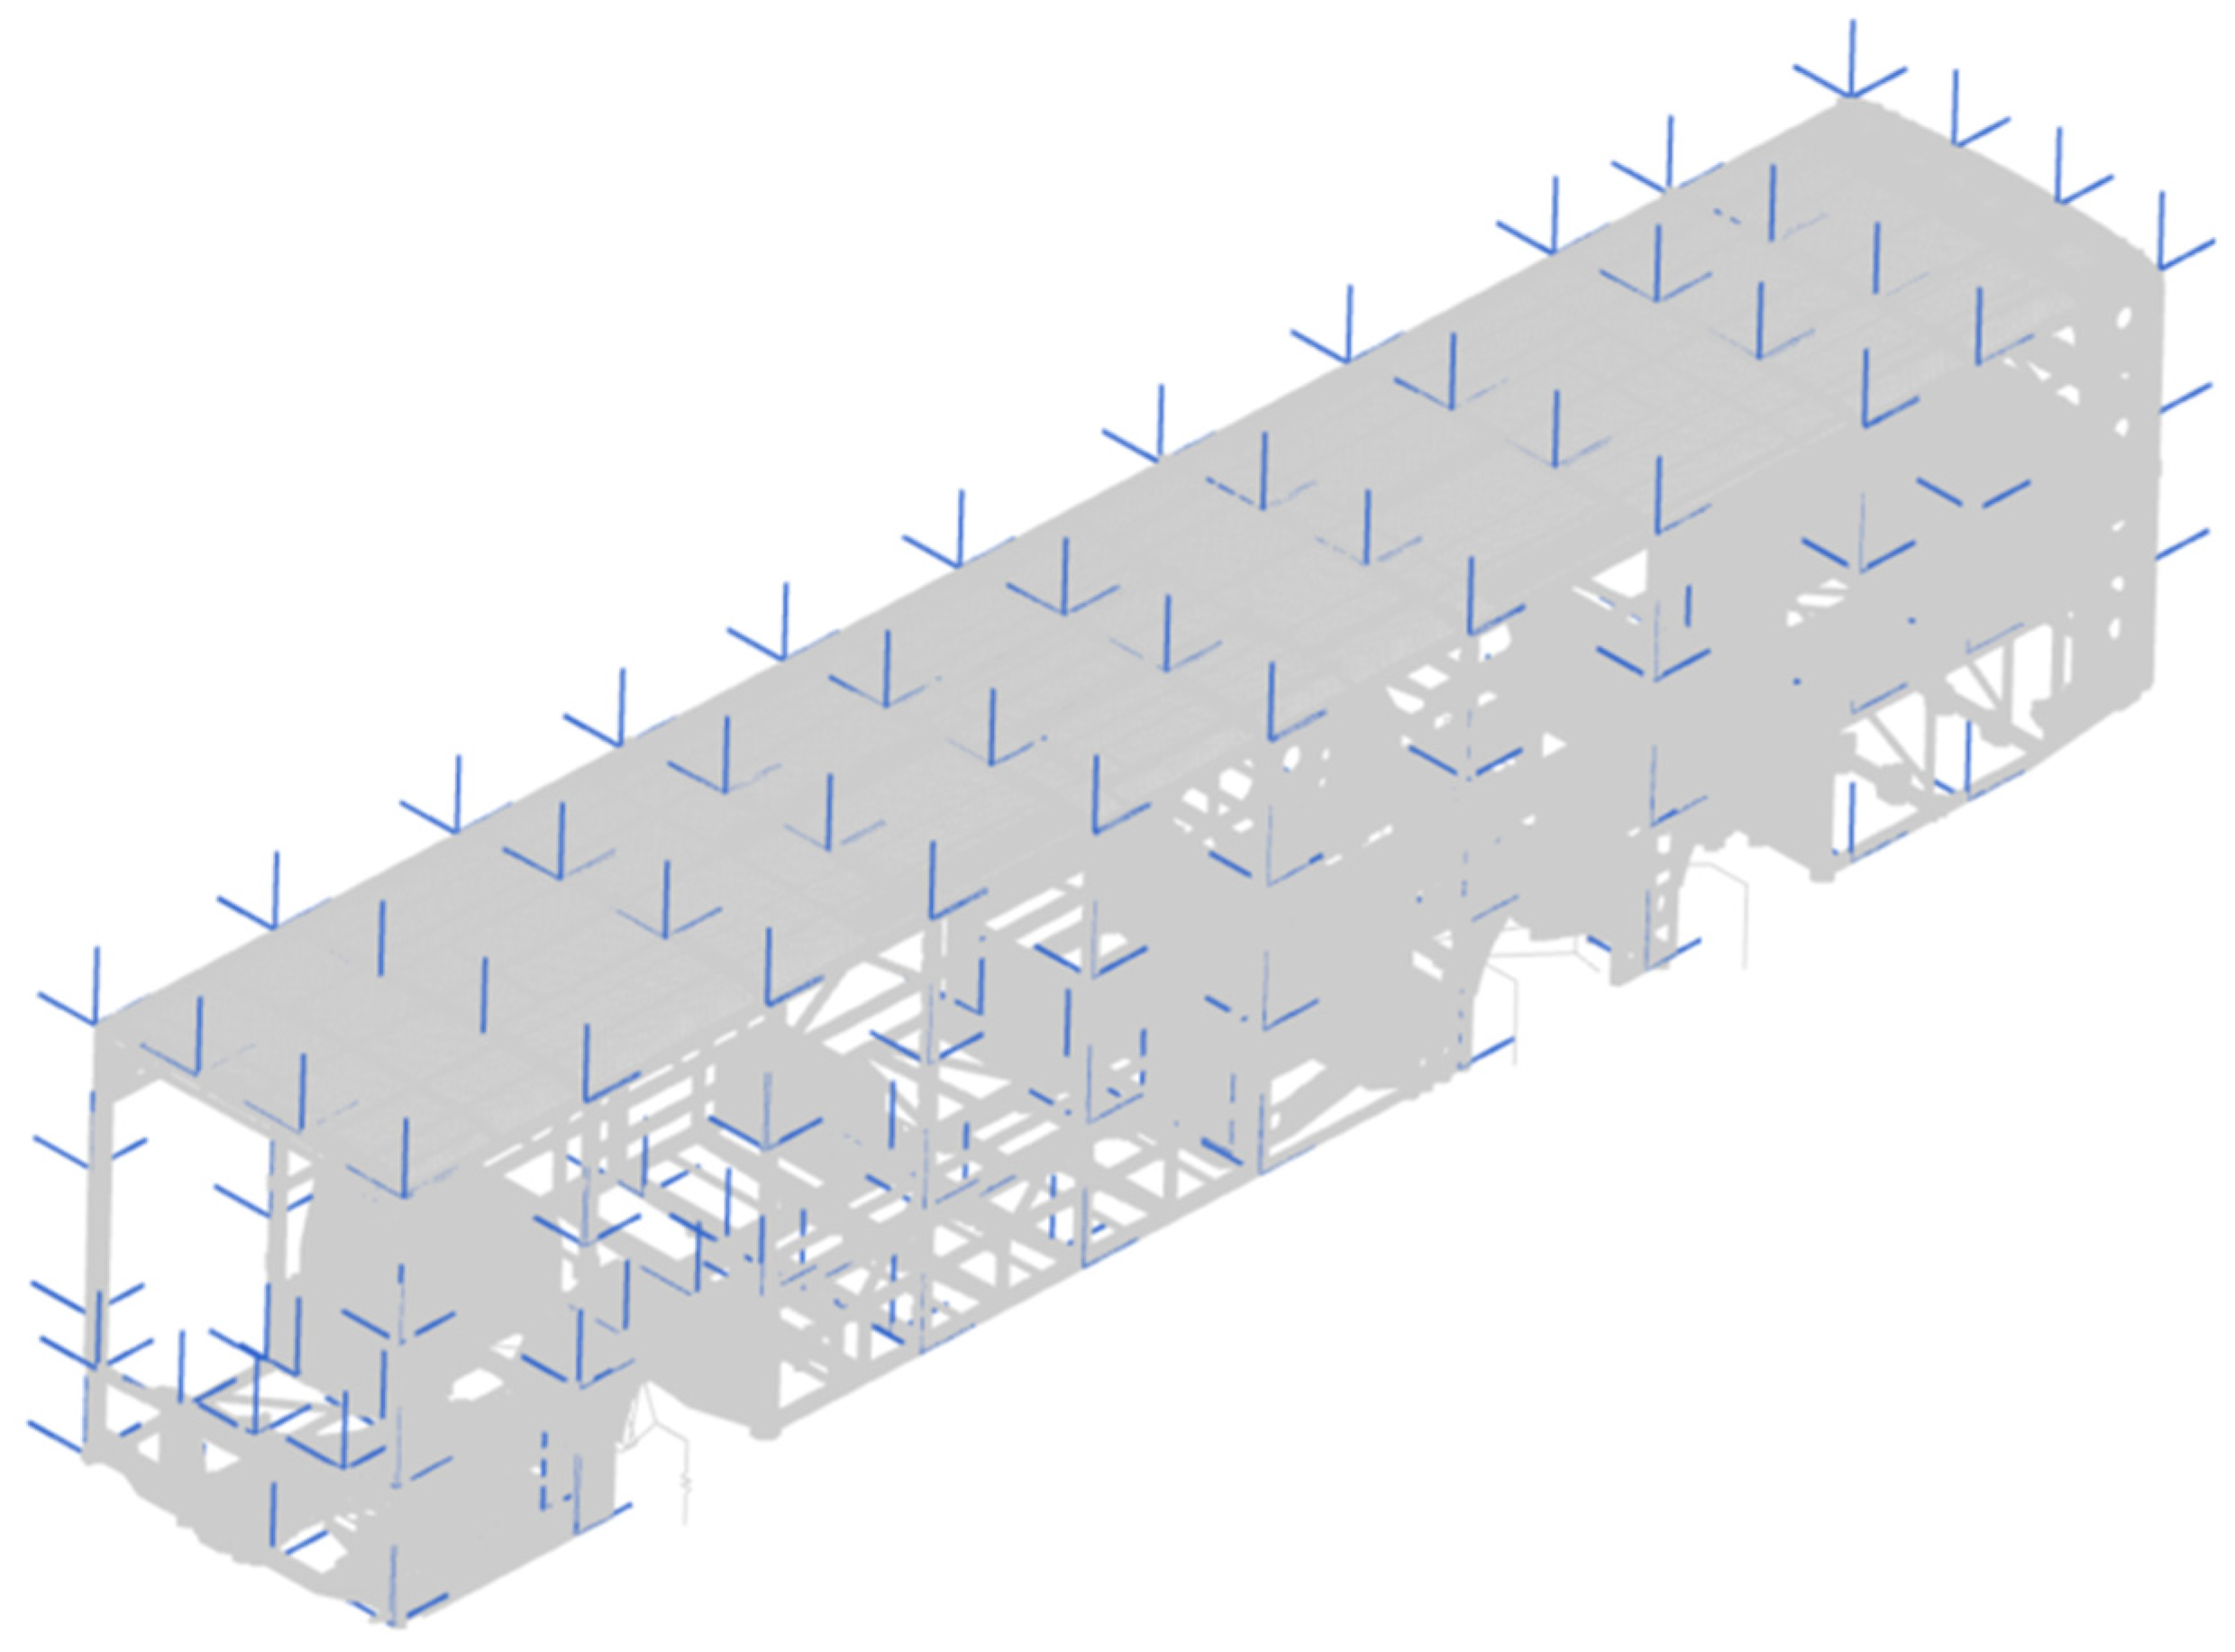
A numerical representation of the torsional stiffness test is shown in Figure 9a. The comparison between the experimental test and the finite element model is presented in Figure 9b. For the considered support configuration, the initial numerical model differed from the test result by approximately 9%. After correlation of the model assumptions and boundary conditions, the discrepancy was reduced to approximately 4%.
Figure 9.
Torsional stiffness test and model correlation: (a) numerical representation of the torsional stiffness test; (b) comparison between the experimental test result and the finite element model.
The obtained agreement was considered sufficient for further structural assessment. In the subsequent stages of the design process, torsional stiffness was used as a reference parameter for comparing design variants and estimating the influence of structural modifications, including mass reduction, on the global stiffness of the superstructure.
2.6. Modal Analysis and Validation
Modal analysis was performed to evaluate the dynamic characteristics of the bus superstructure and to support correlation of the finite element model. The numerical modal analysis was carried out using the Simcenter Nastran SOL 103 normal modes solver. The obtained natural frequencies and mode shapes were used to identify the global dynamic behaviour of the structure and to check whether the model assumptions were suitable for further dynamic simulations.
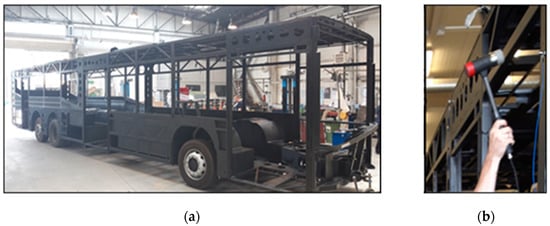
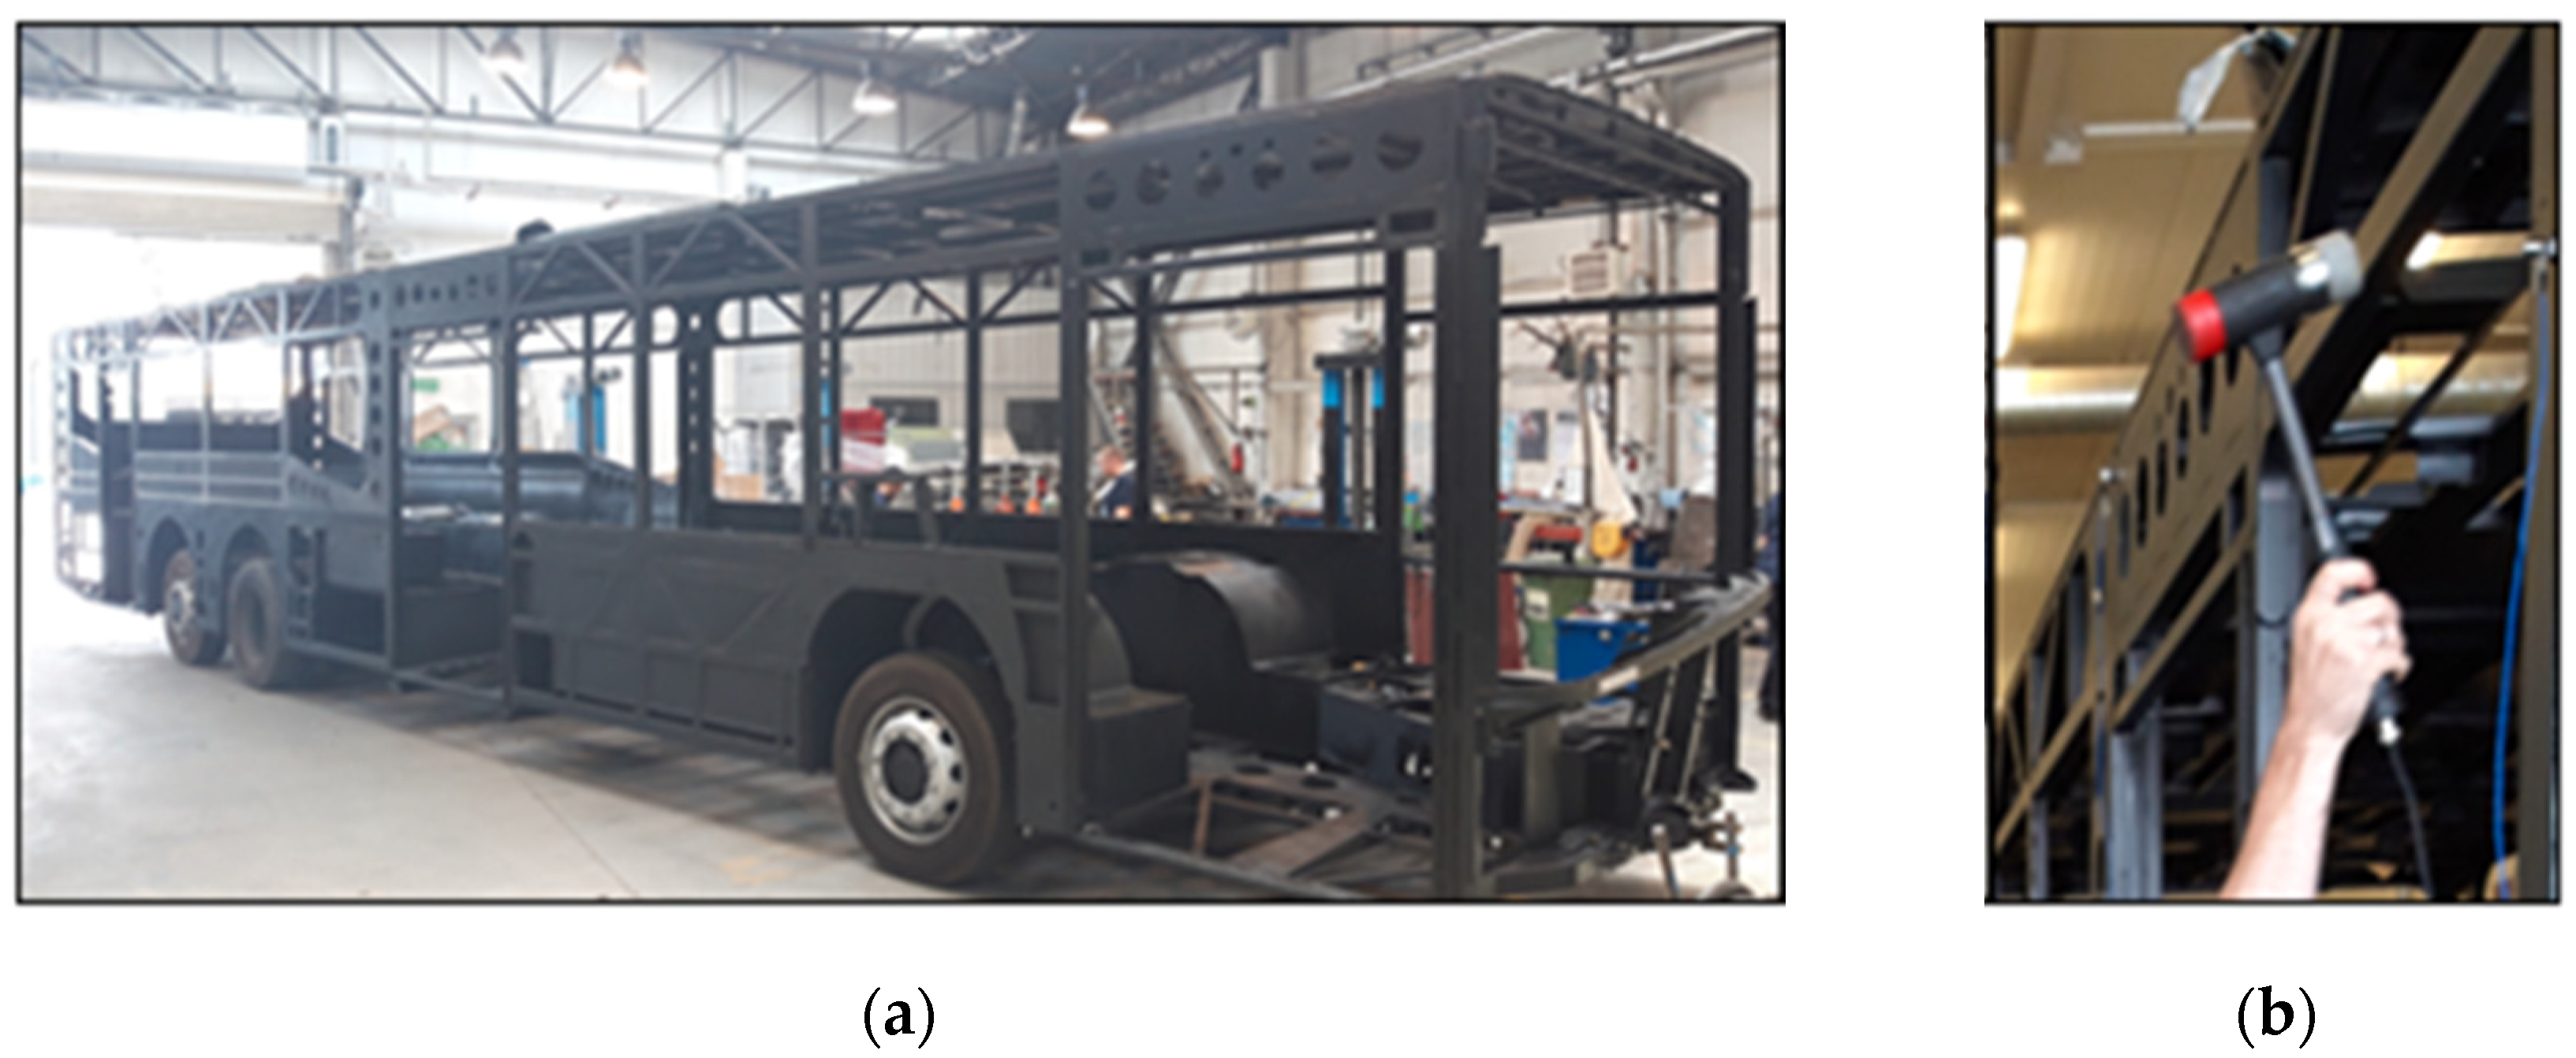
Experimental modal testing was performed on the bus superstructure using modal hammer excitation. The structure was divided into measurement sections, and accelerometers were placed at selected points of the superstructure, as shown in Figure 10.
Figure 10.
Arrangement of accelerometers on the bus superstructure during the experimental modal tests.
The measurements were carried out in the frequency range up to 50 Hz. Due to the size of the structure and the difficulty of suspending the complete superstructure, the test object was supported in conditions close to the operating configuration. Although free–free boundary conditions are often preferred in modal testing, constrained or operationally representative support conditions may be used for large structures when the same boundary conditions are consistently reproduced in the finite element model [6,7]. Therefore, the superstructure was mounted on the axles during the test, while the support reactions and air spring pressures were monitored. The same support and boundary conditions were reproduced in the finite element model as closely as possible. The experimental test setup is presented in Figure 11.
Figure 11.
Experimental modal test setup: (a) bus superstructure mounted on the axles during the test; (b) structure excitation using a modal hammer.
The correlation between numerical and experimental mode shapes was evaluated using the Modal Assurance Criterion (MAC). For two mode shape vectors, ΨA and ΨX, the MAC value is defined as [8]
where ΨA and ΨX are the compared mode shape vectors. The MAC value ranges from 0 to 1. A value close to 1 indicates high similarity between the compared mode shapes, whereas a value close to 0 indicates poor correlation.
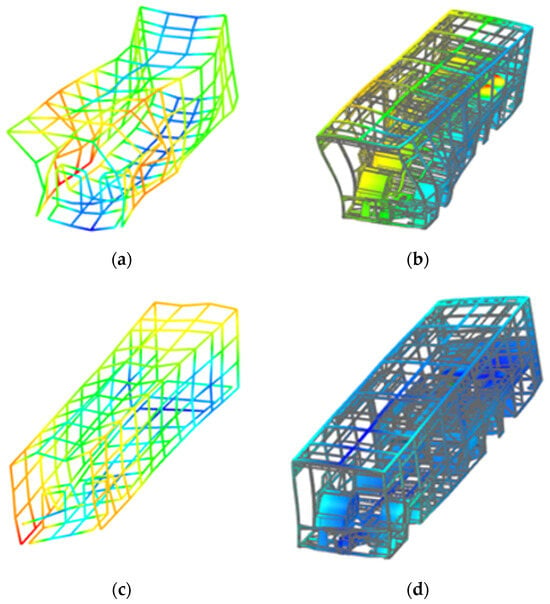
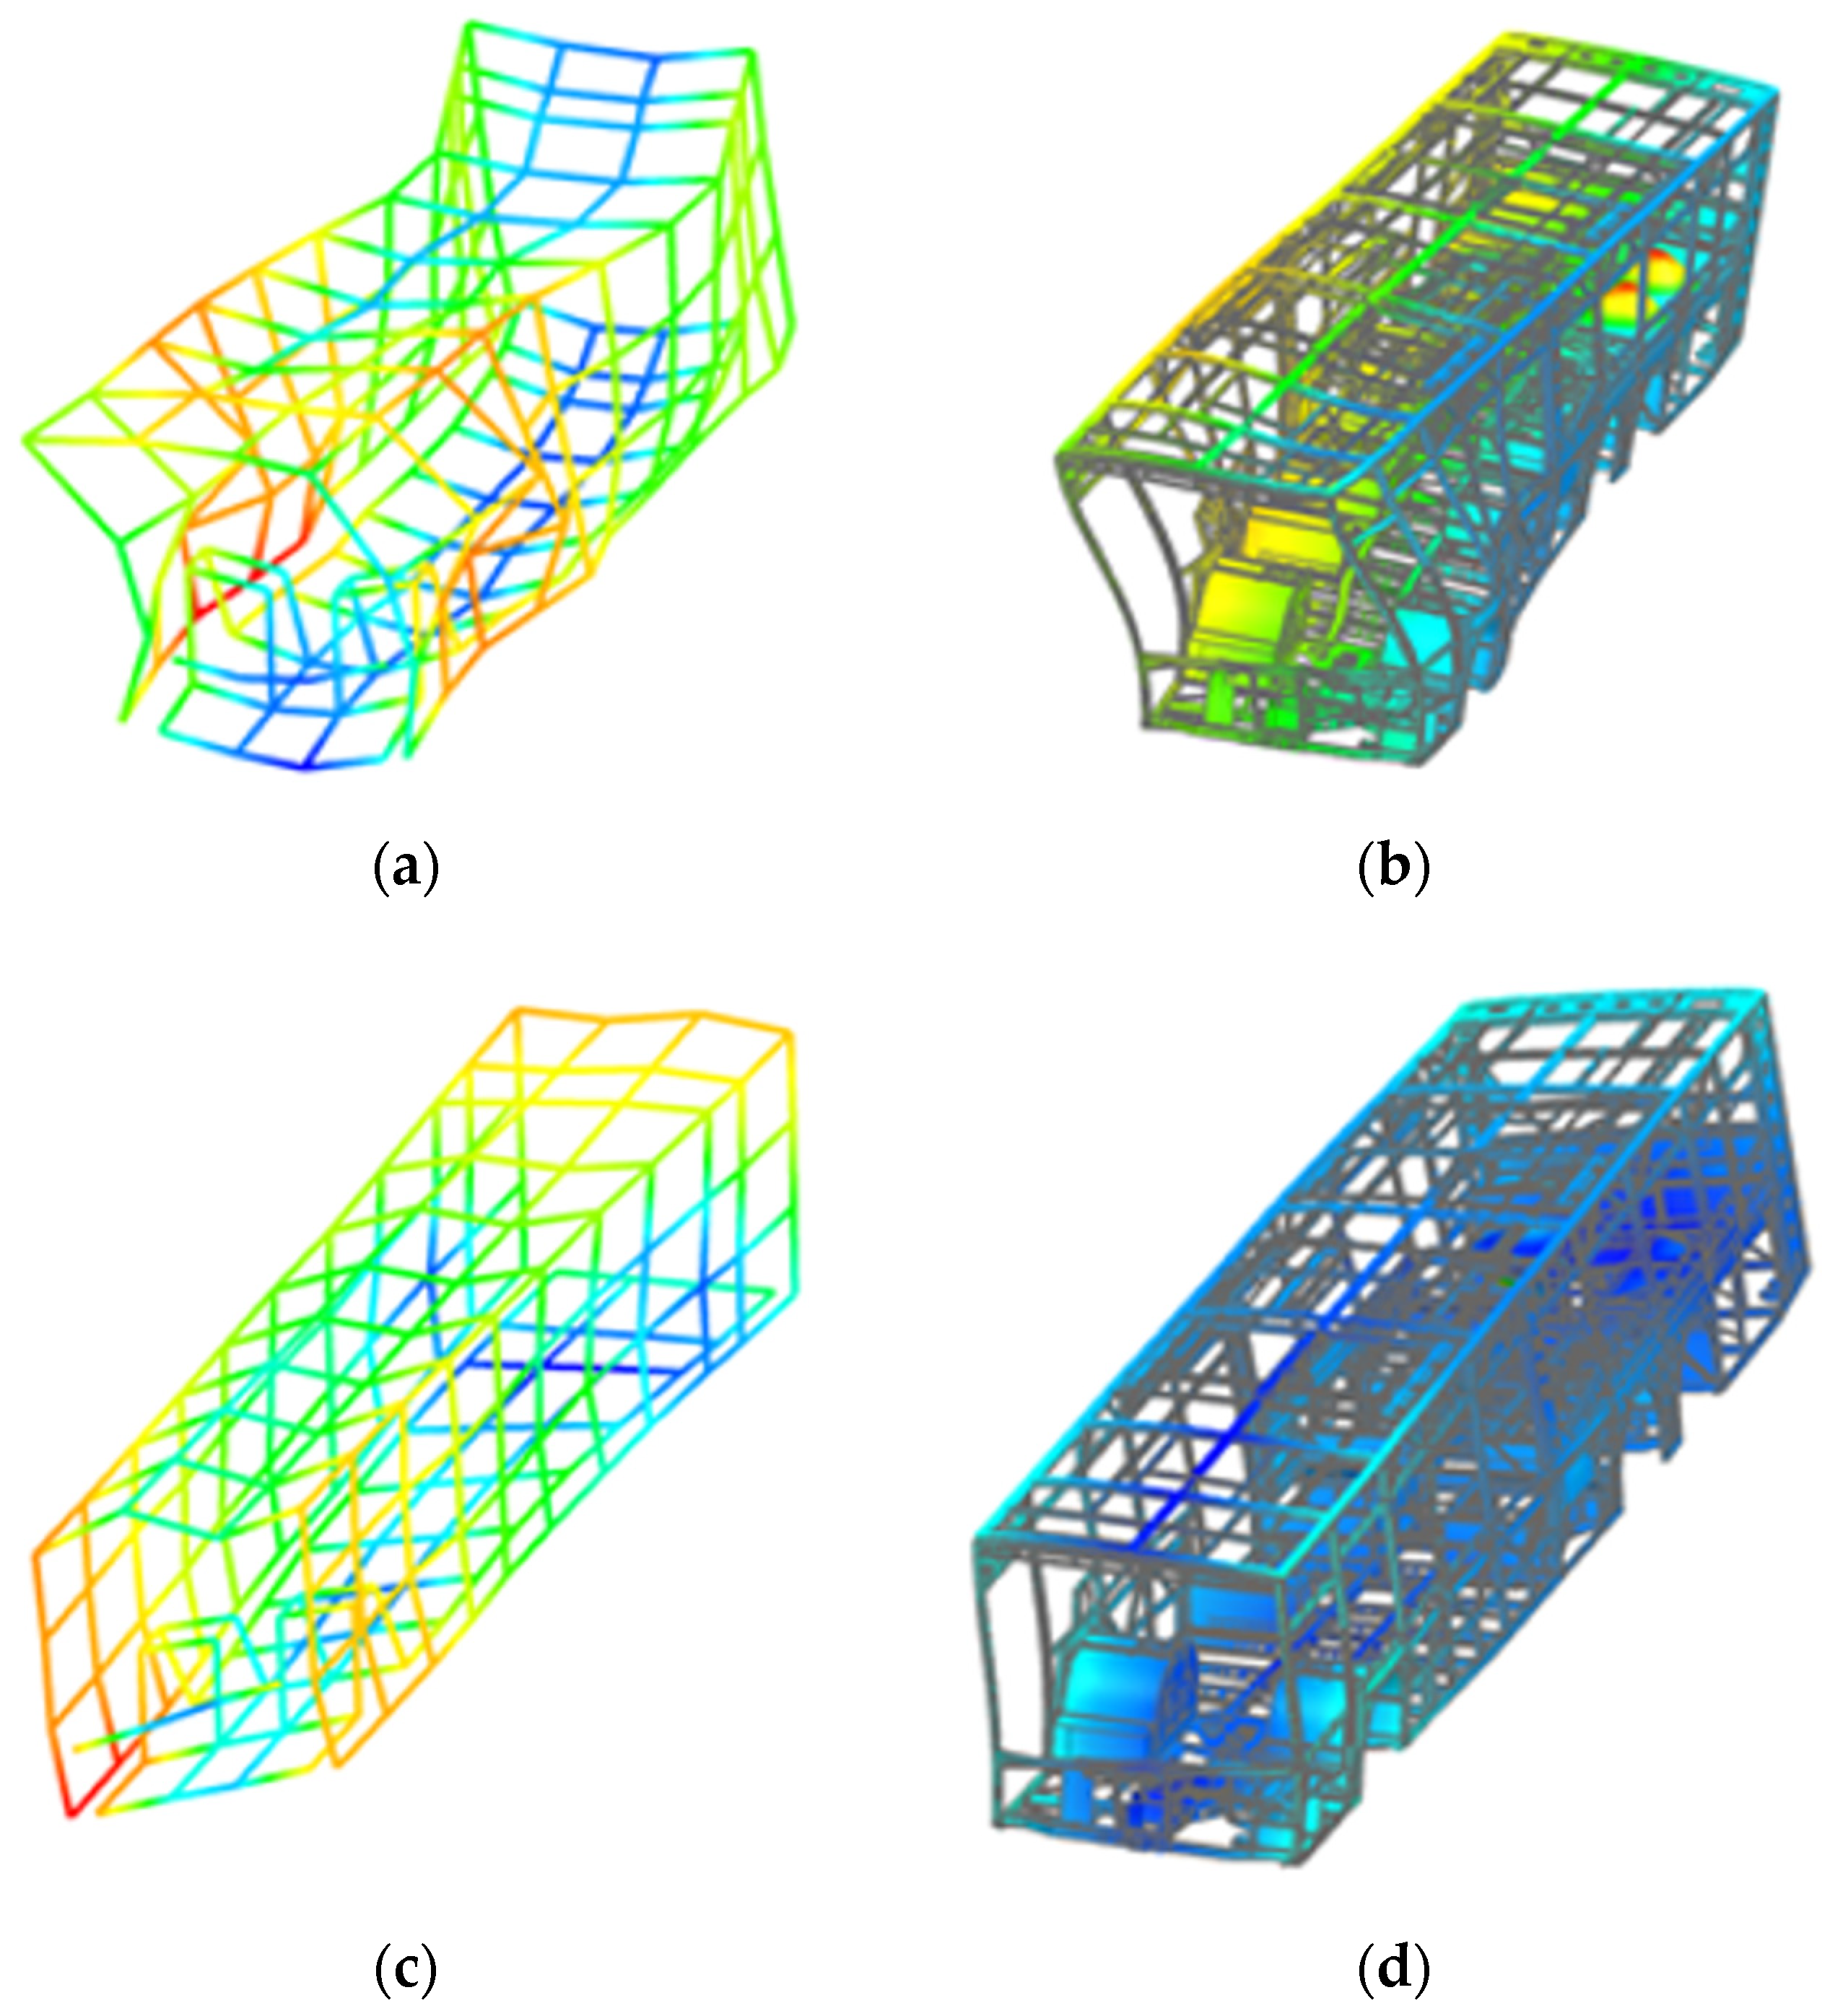
The modal test provided a basis for the correlation of selected global modes of the superstructure. The comparison between the experimental and numerical mode shapes was carried out using the Correlation module in the Siemens NX/Simcenter 3D environment described above. The resulting MAC values and frequency differences for selected correlated modes are presented in Figure 12. For the correlated modes, MAC values higher than 0.7 were obtained, while the corresponding frequency differences were below 10%. Therefore, the modal test results were used as a supplementary dynamic correlation step. Since modal hammer excitation of a large bus superstructure has practical limitations, the modal test was not treated as the sole validation criterion. The global validation of the numerical model was primarily supported by the torsional stiffness test, while the modal test was used to verify selected dynamic properties of the model.
Figure 12.
Modal correlation results for selected global modes of the bus superstructure: (a,b) first correlated mode, MAC = 0.862 and frequency error = −6.8%; (c,d) second correlated mode, MAC = 0.731 and frequency error = −9.5%. Panels (a,c) show the reference mode shapes, while panels (b,d) show the corresponding numerical mode shapes.
2.7. Multibody Simulations
Multibody dynamics simulations were used to reproduce the dynamic response of the vehicle under representative operating and test-track conditions. The main objective of the multibody model was to determine the loads transferred from the suspension system to the bus superstructure and to provide time histories required for further dynamic and fatigue-oriented analyses.
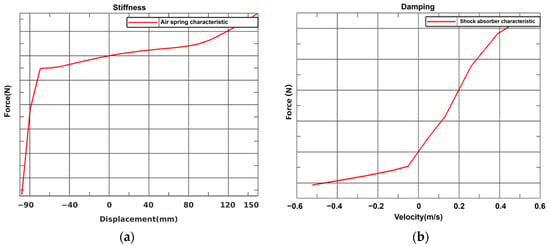
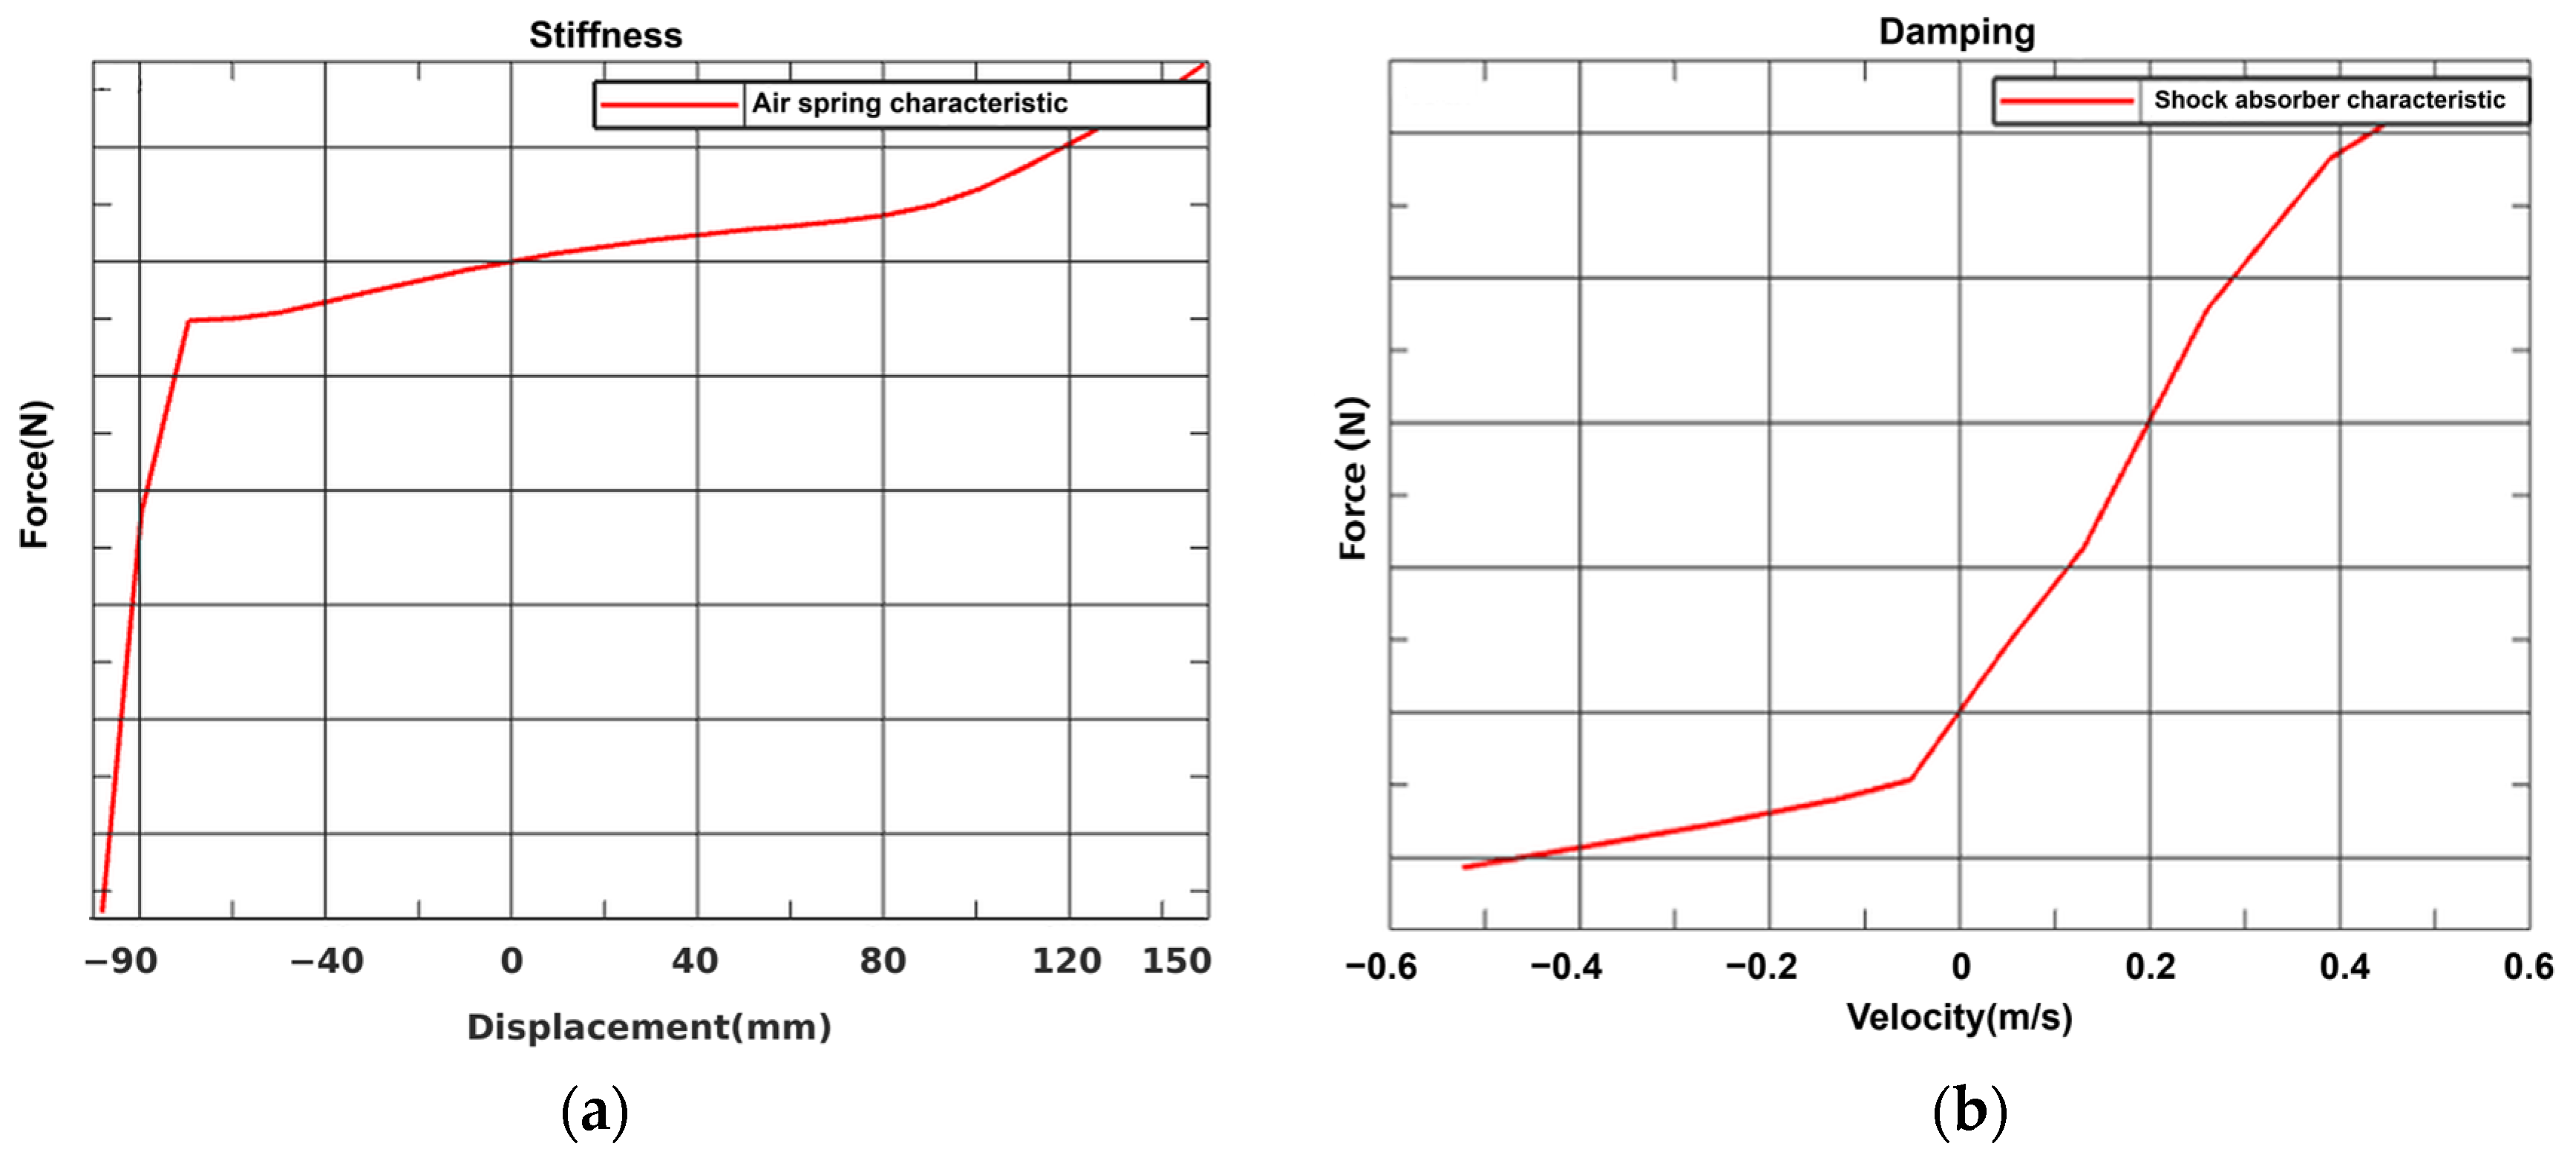
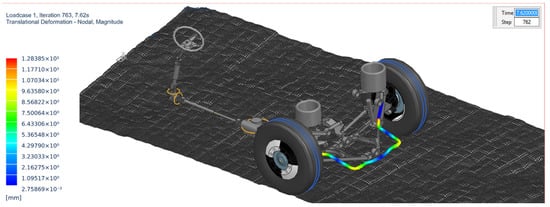
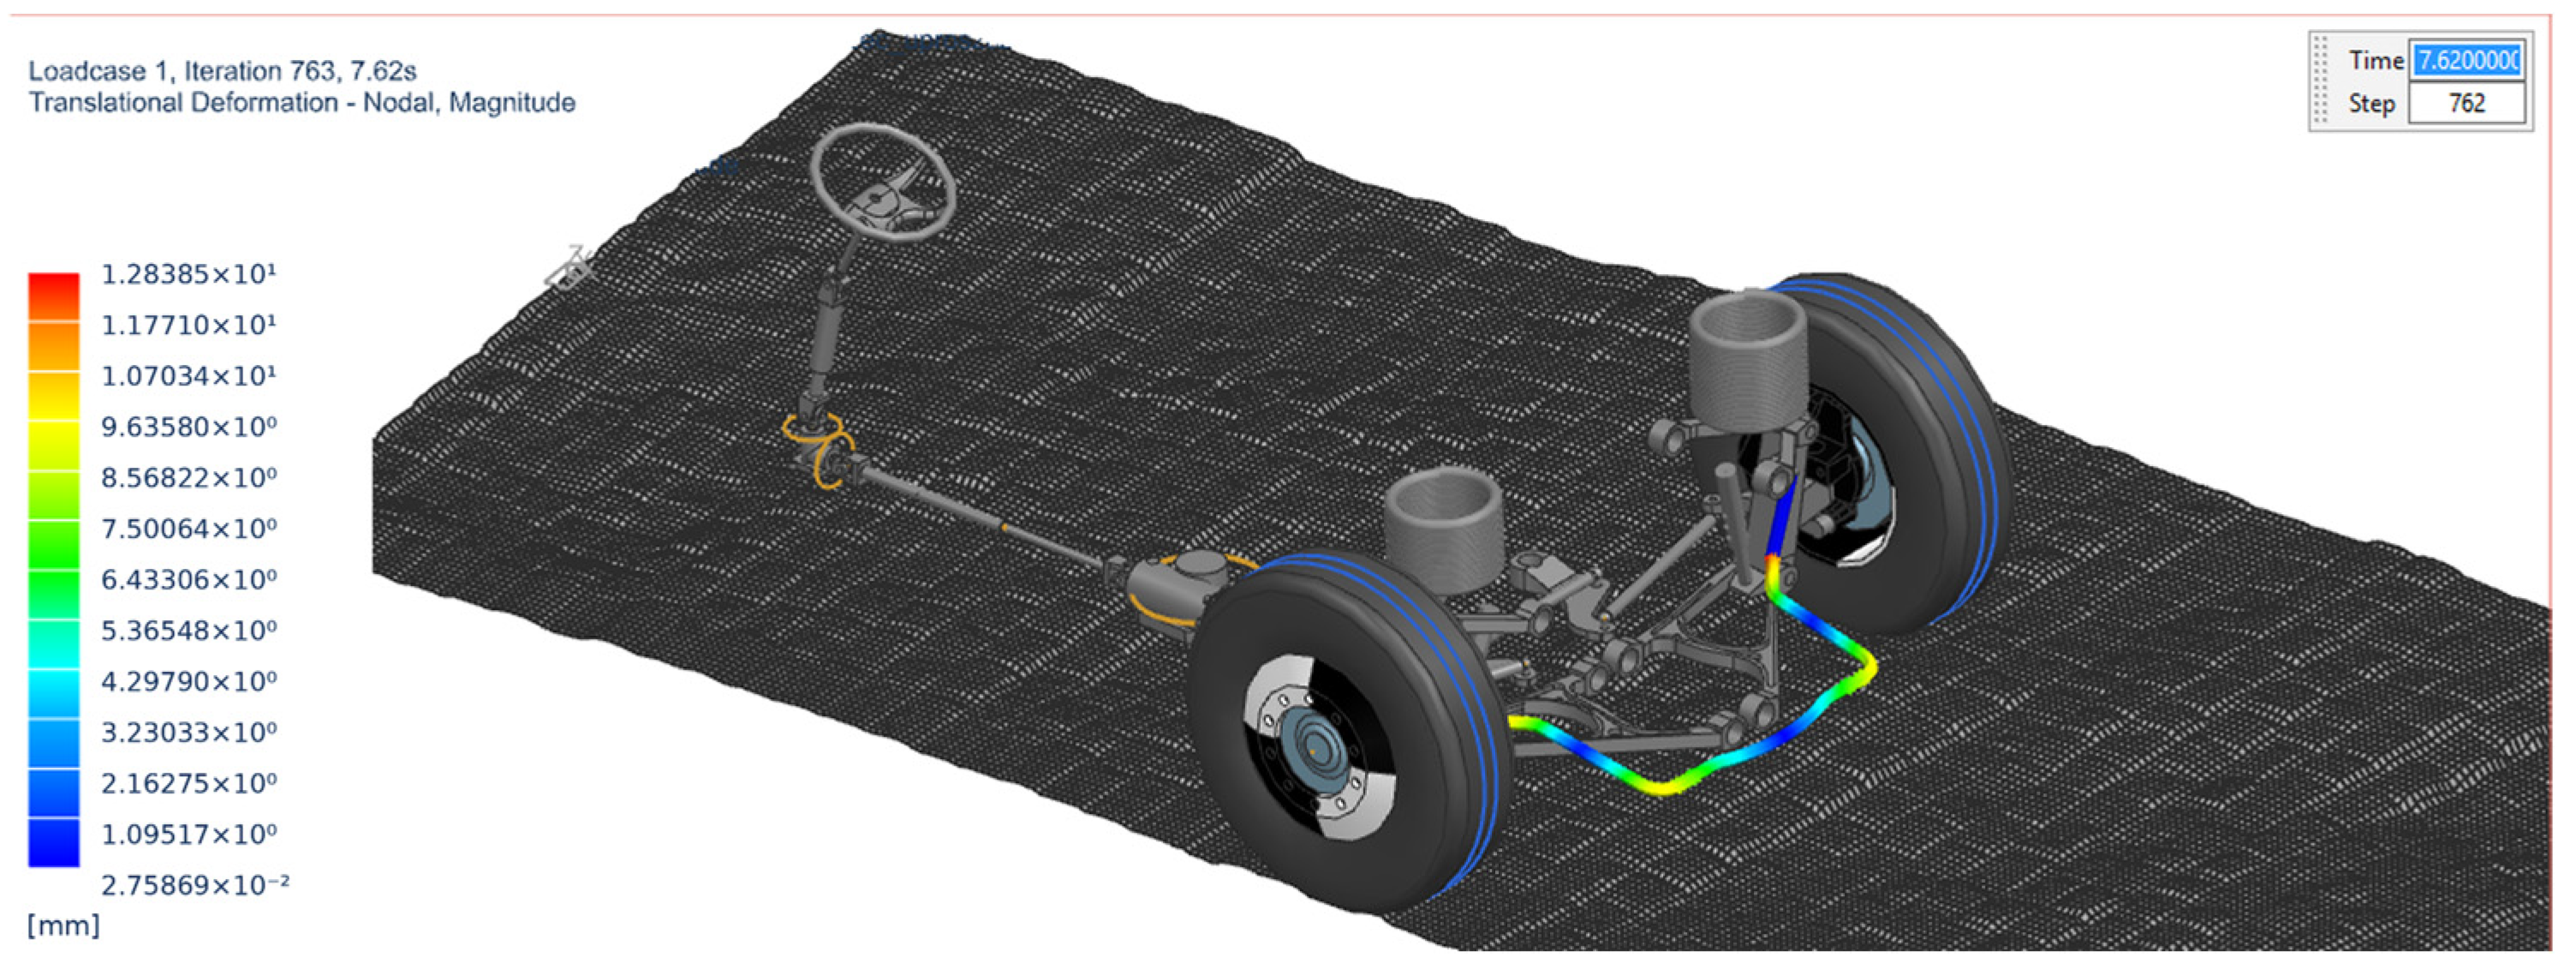
The multibody model was composed mainly of rigid bodies representing the main vehicle assemblies. The suspension system was modelled with nonlinear characteristics of selected components, including air springs and dampers. Representative nonlinear characteristics used in the model are shown in Figure 13, while an example of the front suspension model is presented in Figure 14. The use of nonlinear suspension characteristics is important because the load transfer between the road, axles and superstructure depends strongly on the operating point of the suspension system.
Figure 13.
Nonlinear characteristics of selected suspension components: (a) air spring characteristic; (b) shock absorber characteristic. The ordinate values are omitted due to proprietary confidentiality.
Figure 14.
Front suspension multibody model used to determine loads transferred from the suspension system to the bus superstructure. The model includes nonlinear air spring and damper characteristics, an advanced FTire tyre model for road-load prediction and selected suspension components represented as flexible bodies, including the stabilizer.
Selected suspension components were introduced as flexible bodies in order to account for their elastic deformation during dynamic simulations. The flexible-body representation was generated from finite element models using a component mode synthesis approach. In this approach, the dynamic behaviour of the component is represented by a reduced set of modal coordinates and interface degrees of freedom [9]. This enables the elastic behaviour of selected components to be included in the multibody model without using the full finite element model during the time-domain simulation.
The reduced flexible-body representation significantly decreases computational cost while preserving the global dynamic behaviour and the stiffness contribution of the selected components at their connection points. This is particularly useful in vehicle multibody simulations, where several flexible components may be connected to the same mechanical system.
The tyre model is another important part of the multibody simulation, because it determines how road irregularities are transferred to the suspension system and, consequently, to the superstructure. In the presented workflow, an advanced tyre model was used to represent tyre dynamics during simulations of road irregularities and test-track maneuvers. Such tyre models are particularly useful when the analysis involves road-induced loads, short road disturbances and dynamic load transfer between the road and the vehicle structure. In the presented simulations, the FTire model was used. FTire is a nonlinear dynamic tyre model intended for vehicle dynamics and road-load prediction on road irregularities, including short-wavelength road excitations [10]. Its use enables more realistic representation of the interaction between the tyre and the road surface than simplified steady-state tyre models.
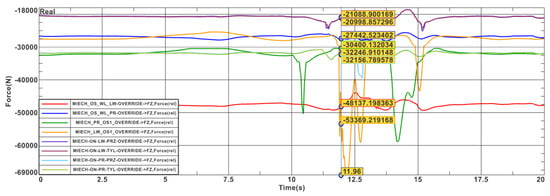
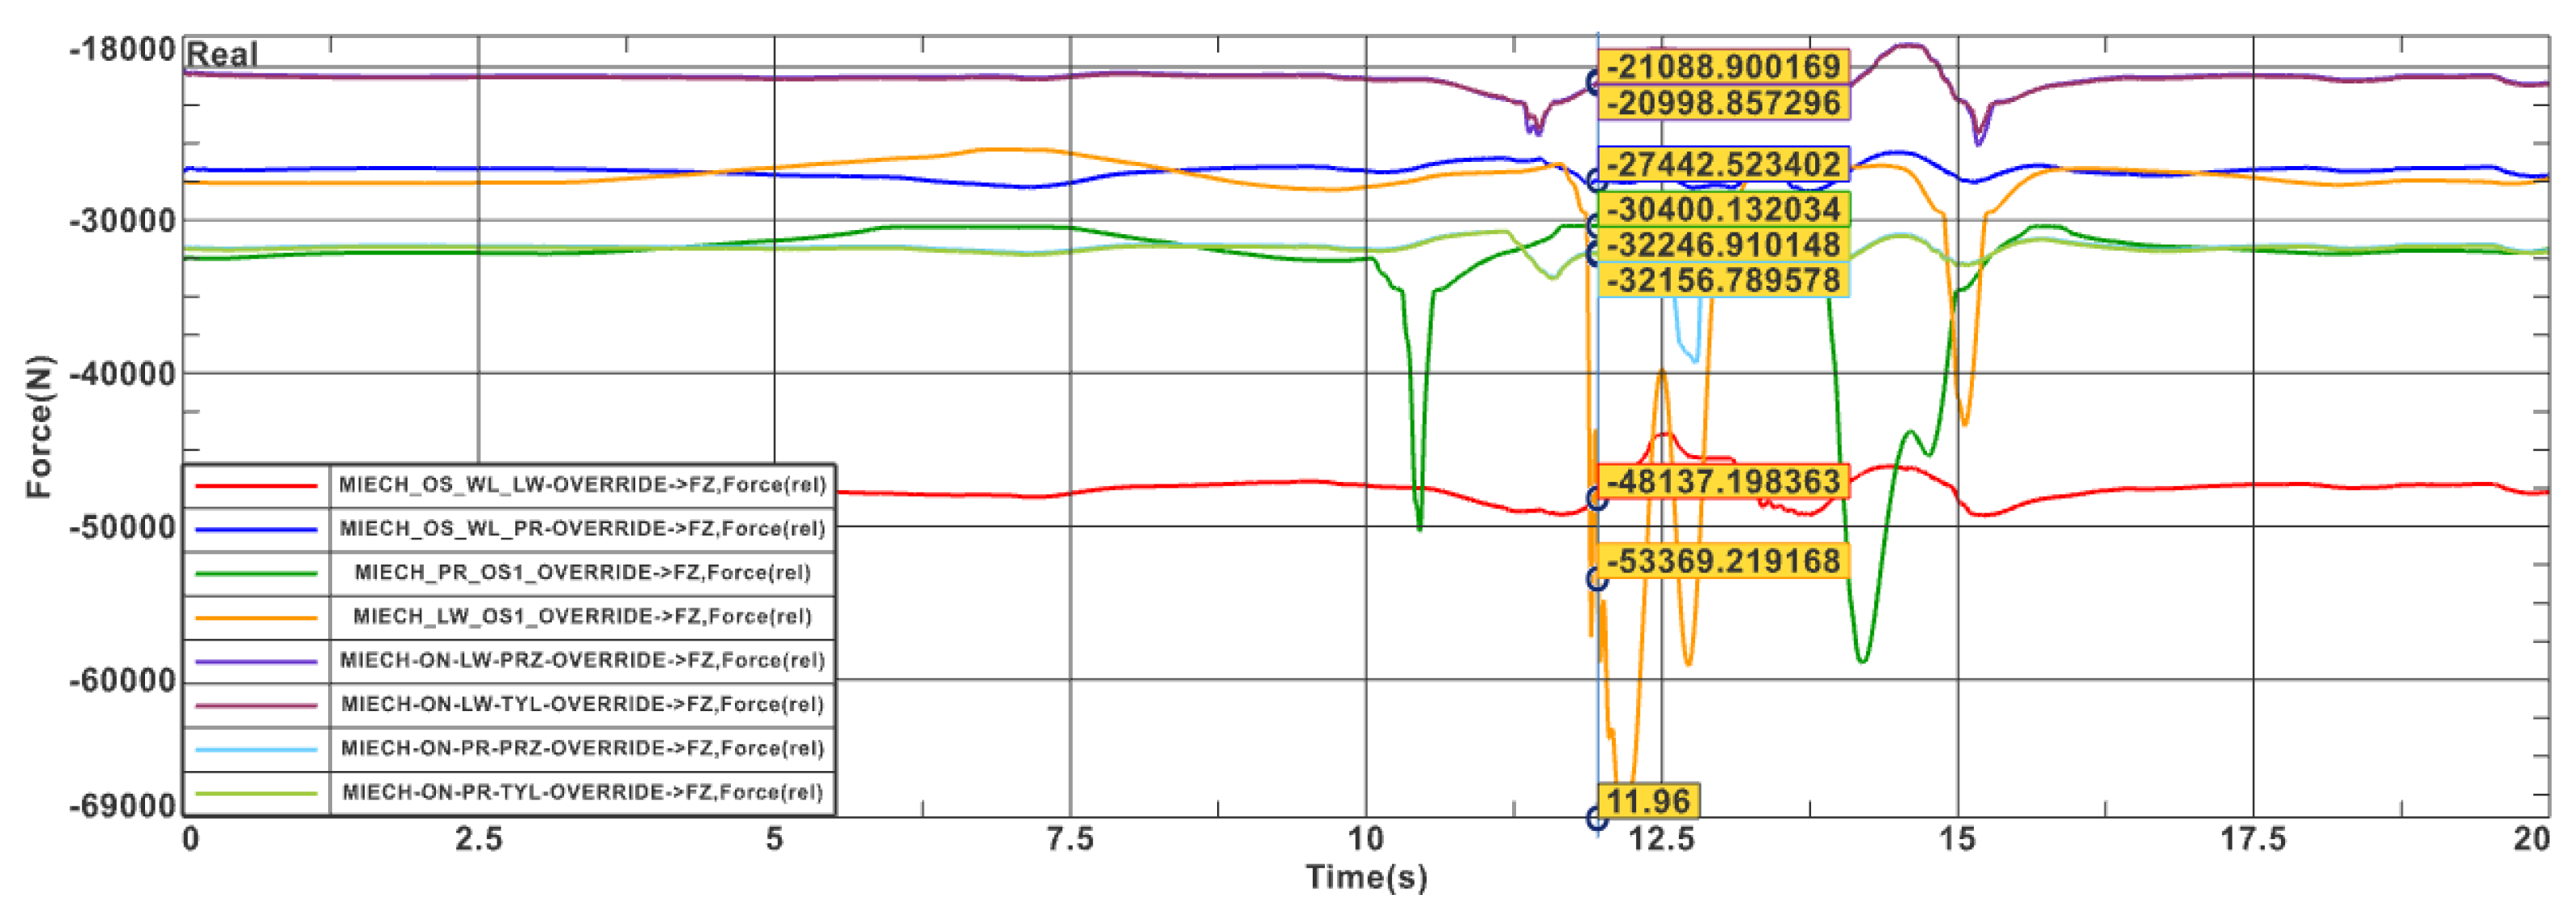
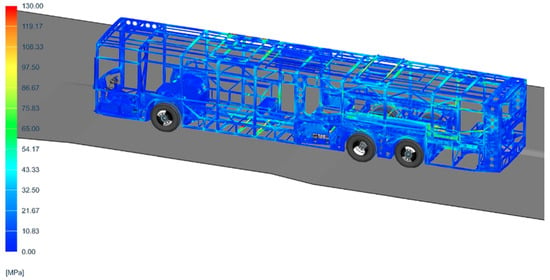
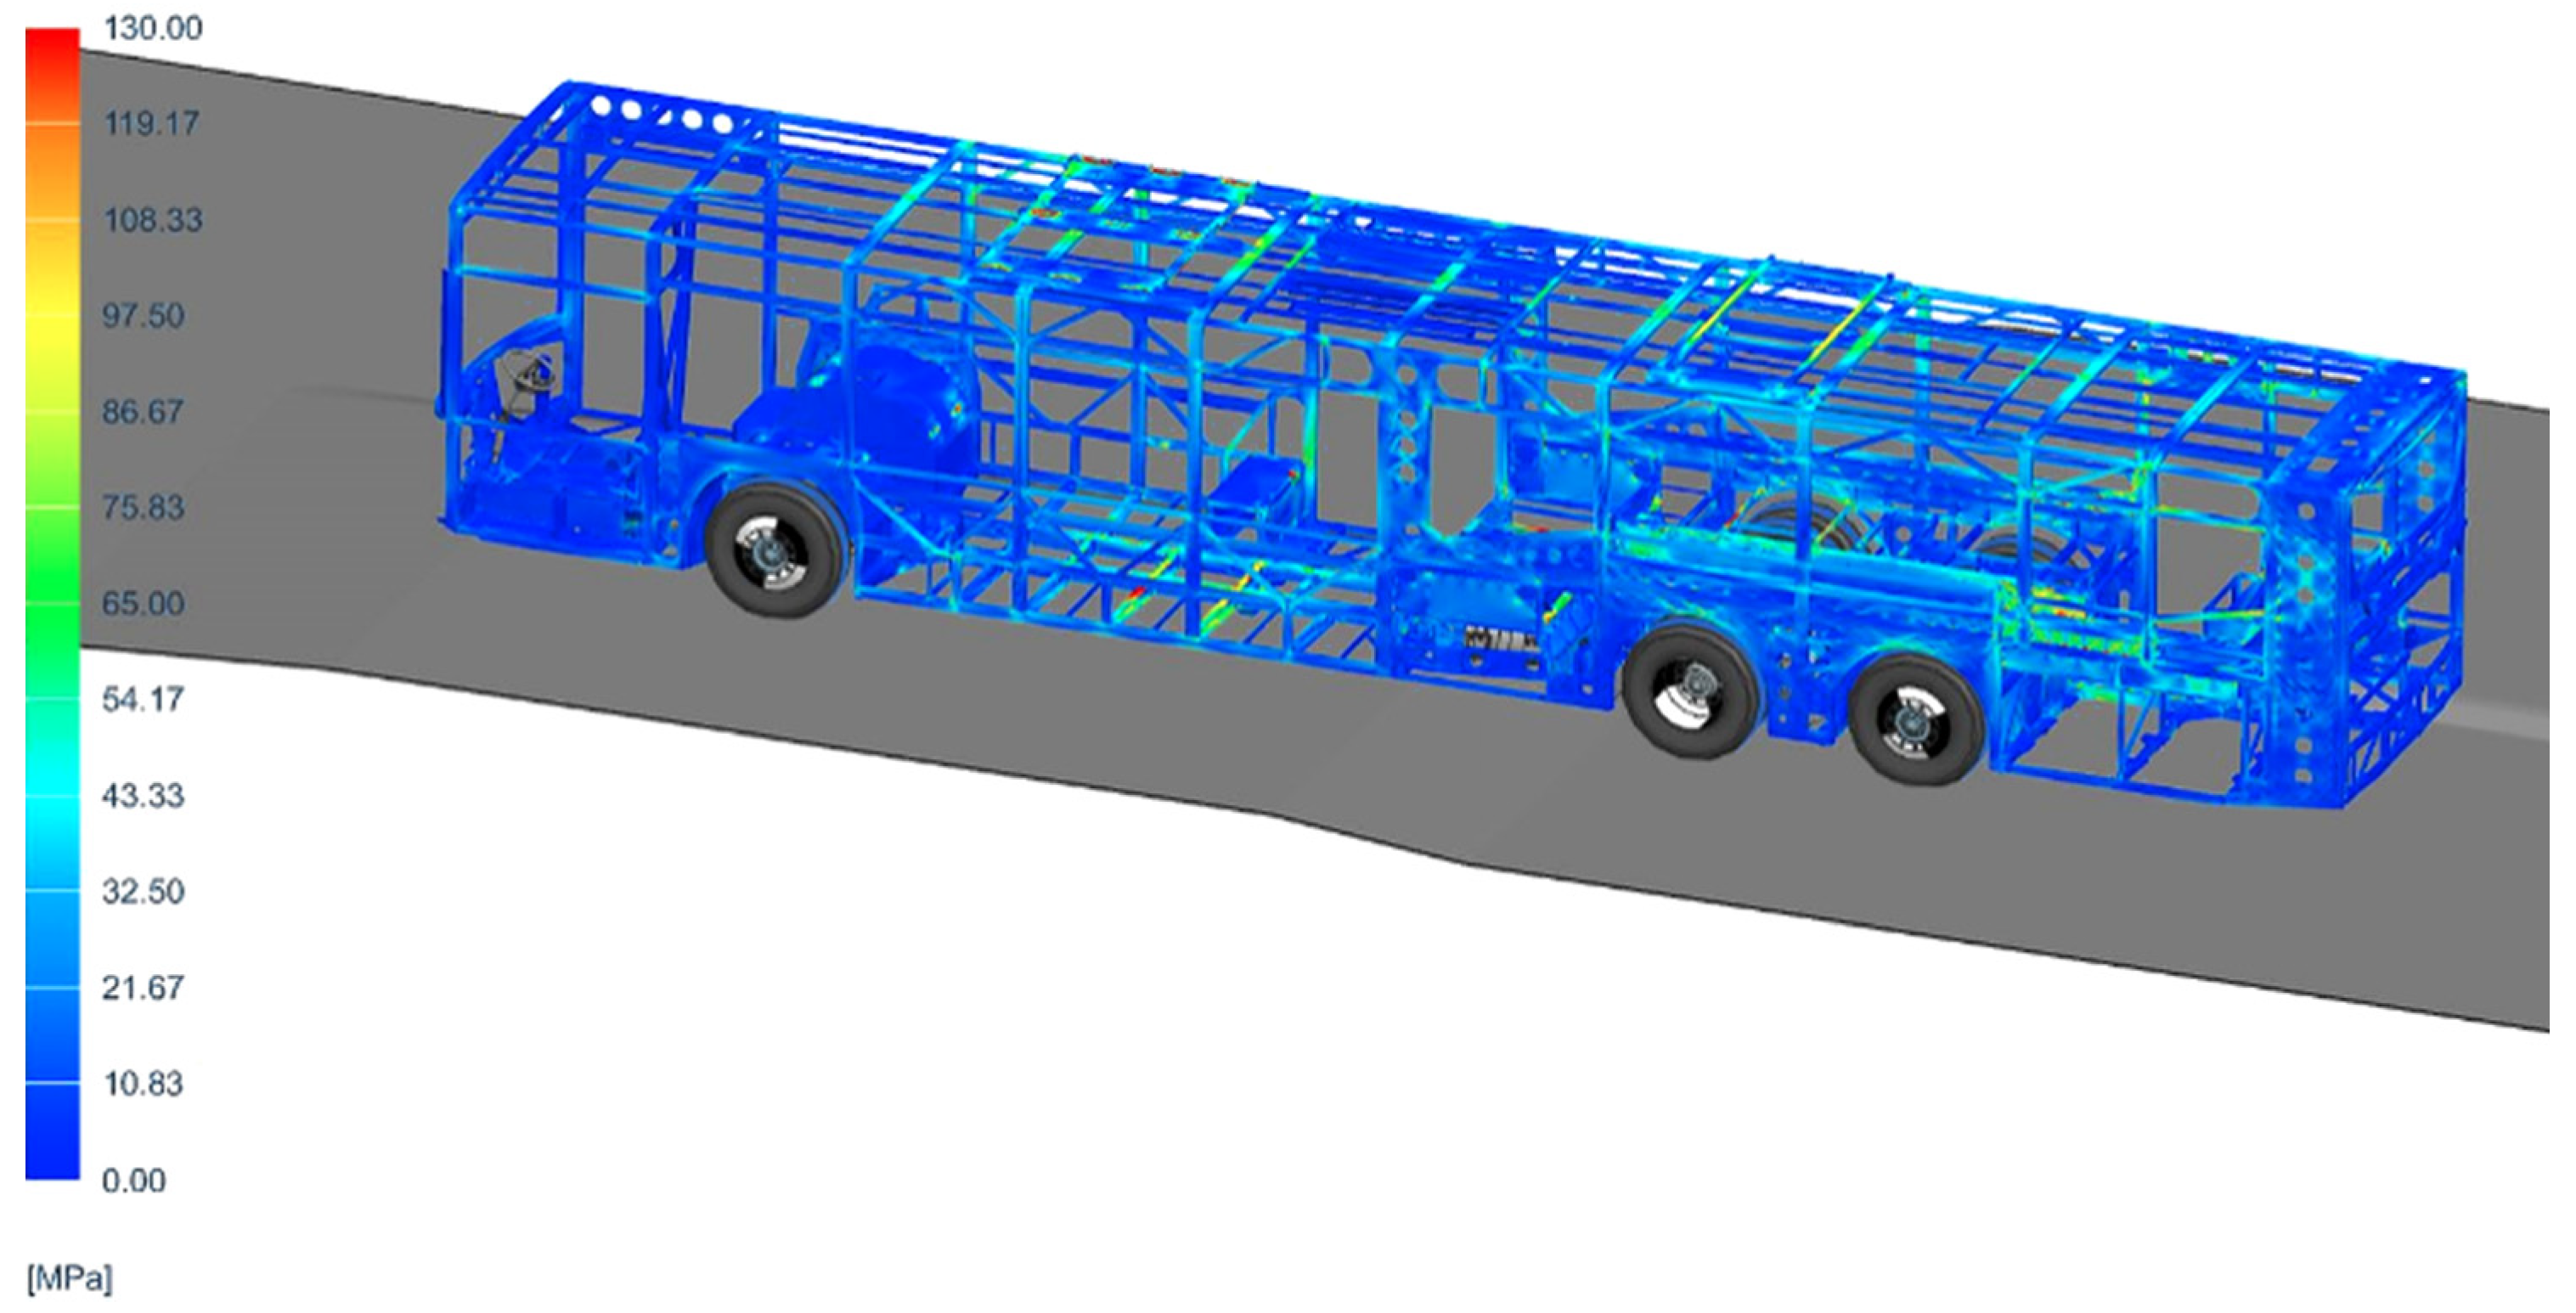
Depending on the objective of the analysis, different types of road inputs may be used in the multibody simulation. These include deterministic obstacles, test-track profiles, measured road profiles and statistically described road surfaces. In the present workflow, representative test-track maneuvers and road events were used to obtain suspension forces and structural response histories. These results were then transferred to further structural and fatigue analyses. Representative time histories of suspension forces obtained during the full-vehicle multibody simulation of a frame-twist-type maneuver based on a test-track geometry [11] are shown in Figure 15. The extracted suspension force histories, together with selected structural responses from the flexible-body multibody simulation (Figure 16), were subsequently used as input data for the fatigue-oriented assessment.
Figure 15.
Representative time histories of forces in the air springs obtained during the full-vehicle multibody simulation of a frame-twist-type maneuver.
Figure 16.
Structural response of the bus superstructure represented as a flexible body during the full-vehicle multibody simulation of the frame-twist-type maneuver. The figure shows the von Mises equivalent stress distribution resulting from the vehicle passage over the frame-twist obstacle. The stress scale is expressed in MPa.
In addition to idealized proving-ground maneuvers, multibody simulations were also performed using measured road profiles from previously scanned road sections. These road sections had been identified in earlier measurement campaigns as particularly relevant for fatigue loading of the bus structure [4]. In the present study, the corresponding road profiles were used as representative excitation inputs for the virtual vehicle model. This enabled road-induced loads associated with fatigue-critical operating conditions to be introduced into the structural assessment workflow.
2.8. Fatigue Assessment Methodology
Fatigue assessment was included in the workflow in order to evaluate the durability of the bus superstructure under representative service conditions. Since the superstructure is composed mainly of welded thin-walled members, fatigue assessment is particularly important in regions with stress concentrations, such as welded joints, door and window openings, suspension attachment areas and local load introduction points.
The fatigue strength evaluation is based on S–N curves. Whenever possible, the S–N curves should be obtained from tests performed on representative components manufactured under production-relevant conditions. Such an approach allows the influence of material properties, manufacturing technology, weld quality and local geometry to be included in the fatigue assessment. If component test data are not available, fatigue classes or design curves from standards and recommendations for welded steel structures, such as BS 7608 [12], Eurocode [13]-based fatigue recommendations or IIW guidelines [14], may be used.
In welded thin-walled structures, fatigue damage is often initiated at weld toes, geometrical discontinuities or local notches caused by manufacturing imperfections. Therefore, fatigue evaluation should not only be based on the nominal material strength, but should also consider the local stress level, weld detail category, structural detail geometry and quality control of welded joints. This is particularly important in highly loaded regions of the bus superstructure, where loads are introduced from the suspension system or where large openings reduce the local stiffness of the structure.
The variable-amplitude stress histories obtained from dynamic simulations were processed using rainflow cycle counting. This procedure transforms the stress history into a set of stress cycles characterized by stress range and number of occurrences. The resulting cycle matrix can then be compared with the selected S–N curve in order to estimate fatigue damage. The fatigue damage was calculated using the Palmgren–Miner linear damage accumulation rule [15]:
where D is the accumulated fatigue damage, is the number of cycles at the i-th stress range obtained from rainflow counting, and is the number of cycles to failure for the same stress range determined from the selected S–N curve. According to this approach, fatigue damage is accumulated linearly for all stress ranges included in the load history. A value of D = 1 corresponds to the theoretical exhaustion of fatigue life for the assumed S–N curve and load spectrum. In engineering practice, the acceptable damage level may be lower than one and depends on the safety requirements, component criticality, uncertainty of input data, scatter of fatigue strength and manufacturer experience.
The fatigue assessment was performed using the Simcenter Specialist Durability module in the Siemens NX/Simcenter 3D environment described above. Stress histories obtained from dynamic simulations were first processed using rainflow cycle counting [16] in order to extract stress cycles and their corresponding ranges. The resulting cycle counts were then combined with selected S–N curves and evaluated using the Palmgren–Miner damage accumulation rule. Representative fatigue damage distributions were used to identify critical regions of the superstructure and to support design modifications.
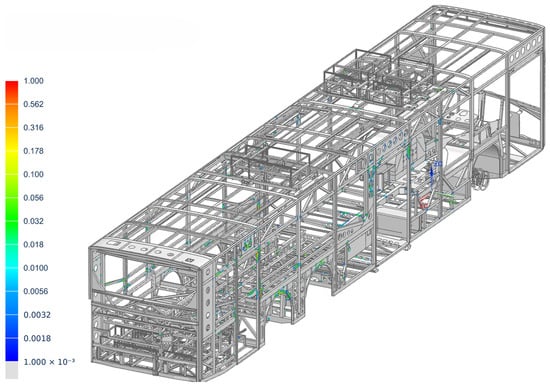
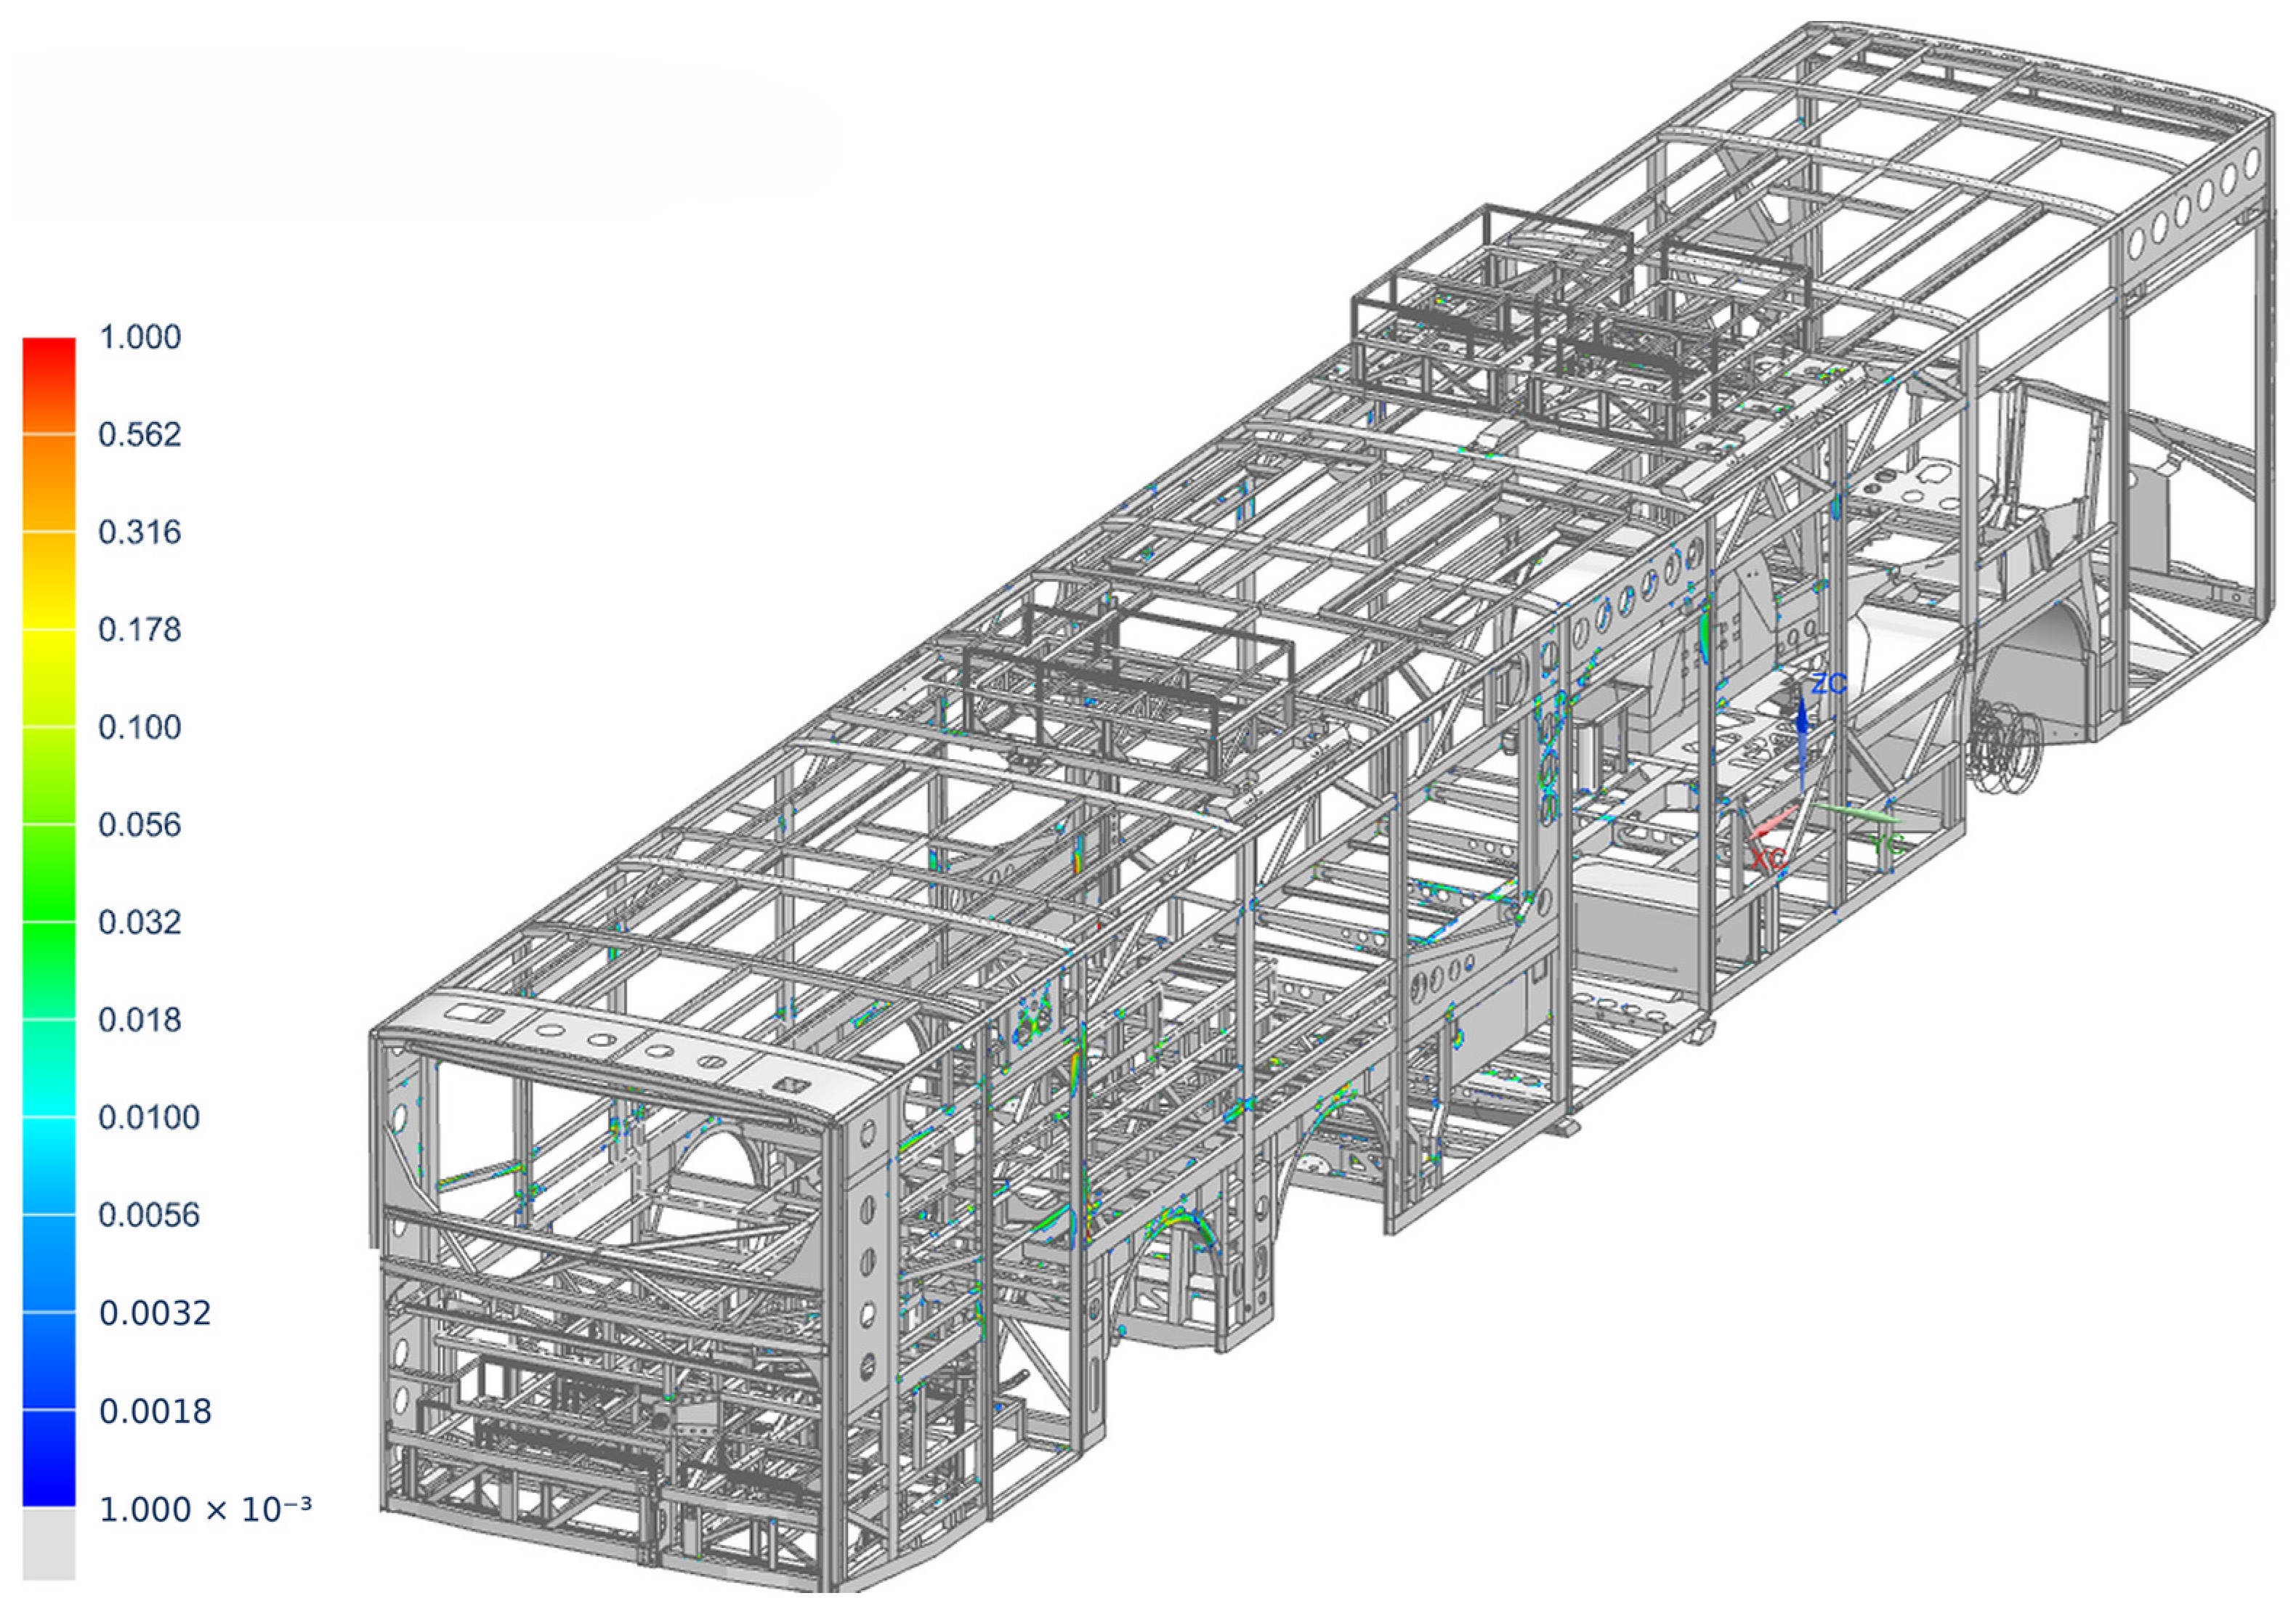
An example of fatigue analysis results for the superstructure is shown in Figure 17. The presented map illustrates the fatigue damage distribution accumulated from the considered calculation cases. Increased damage values are observed mainly in the side-wall regions, near door and window openings, and in selected floor areas, which are typical locations of stress concentration in welded thin-walled bus structures.
Figure 17.
Fatigue damage distribution accumulated from the considered calculation cases for the bus superstructure. Increased damage values are visible mainly in the side-wall regions, near door and window openings, and in selected floor areas.
2.9. Rollover Analysis According to UN Regulation No. 66
Rollover crashworthiness assessment is an important stage in the verification of bus superstructures. In electric buses, this assessment may be particularly demanding because traction batteries and auxiliary roof-mounted equipment increase the mass located in the upper part of the vehicle. As a result, the vertical position of the centre of gravity may be higher than in conventional vehicle configurations, which increases the potential energy considered in rollover-related analyses.
The rollover assessment was performed according to the principles of UN Regulation No. 66. The regulation is focused on the strength of the bus superstructure and on the preservation of a protected occupant volume during and after the rollover event. In engineering terms, the superstructure must deform in a controlled manner so that structural members located outside this protected volume do not intrude into it during the simulated rollover event. The residual space is treated as a geometrical acceptance criterion used to evaluate structural deformation.
For official approval purposes, rollover verification must be performed according to an approved procedure and by authorized technical services. In the present workflow, the rollover analysis is used as an engineering design and verification tool during the development stage. The aim of the simulation is to assess whether the proposed superstructure concept has sufficient load-carrying capacity and energy absorption capability before physical testing or final approval activities are performed.
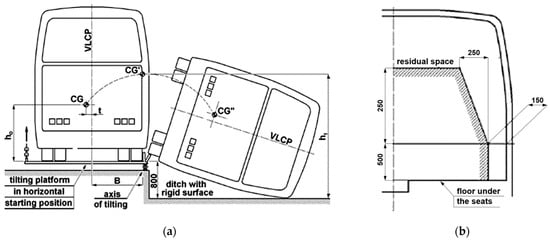
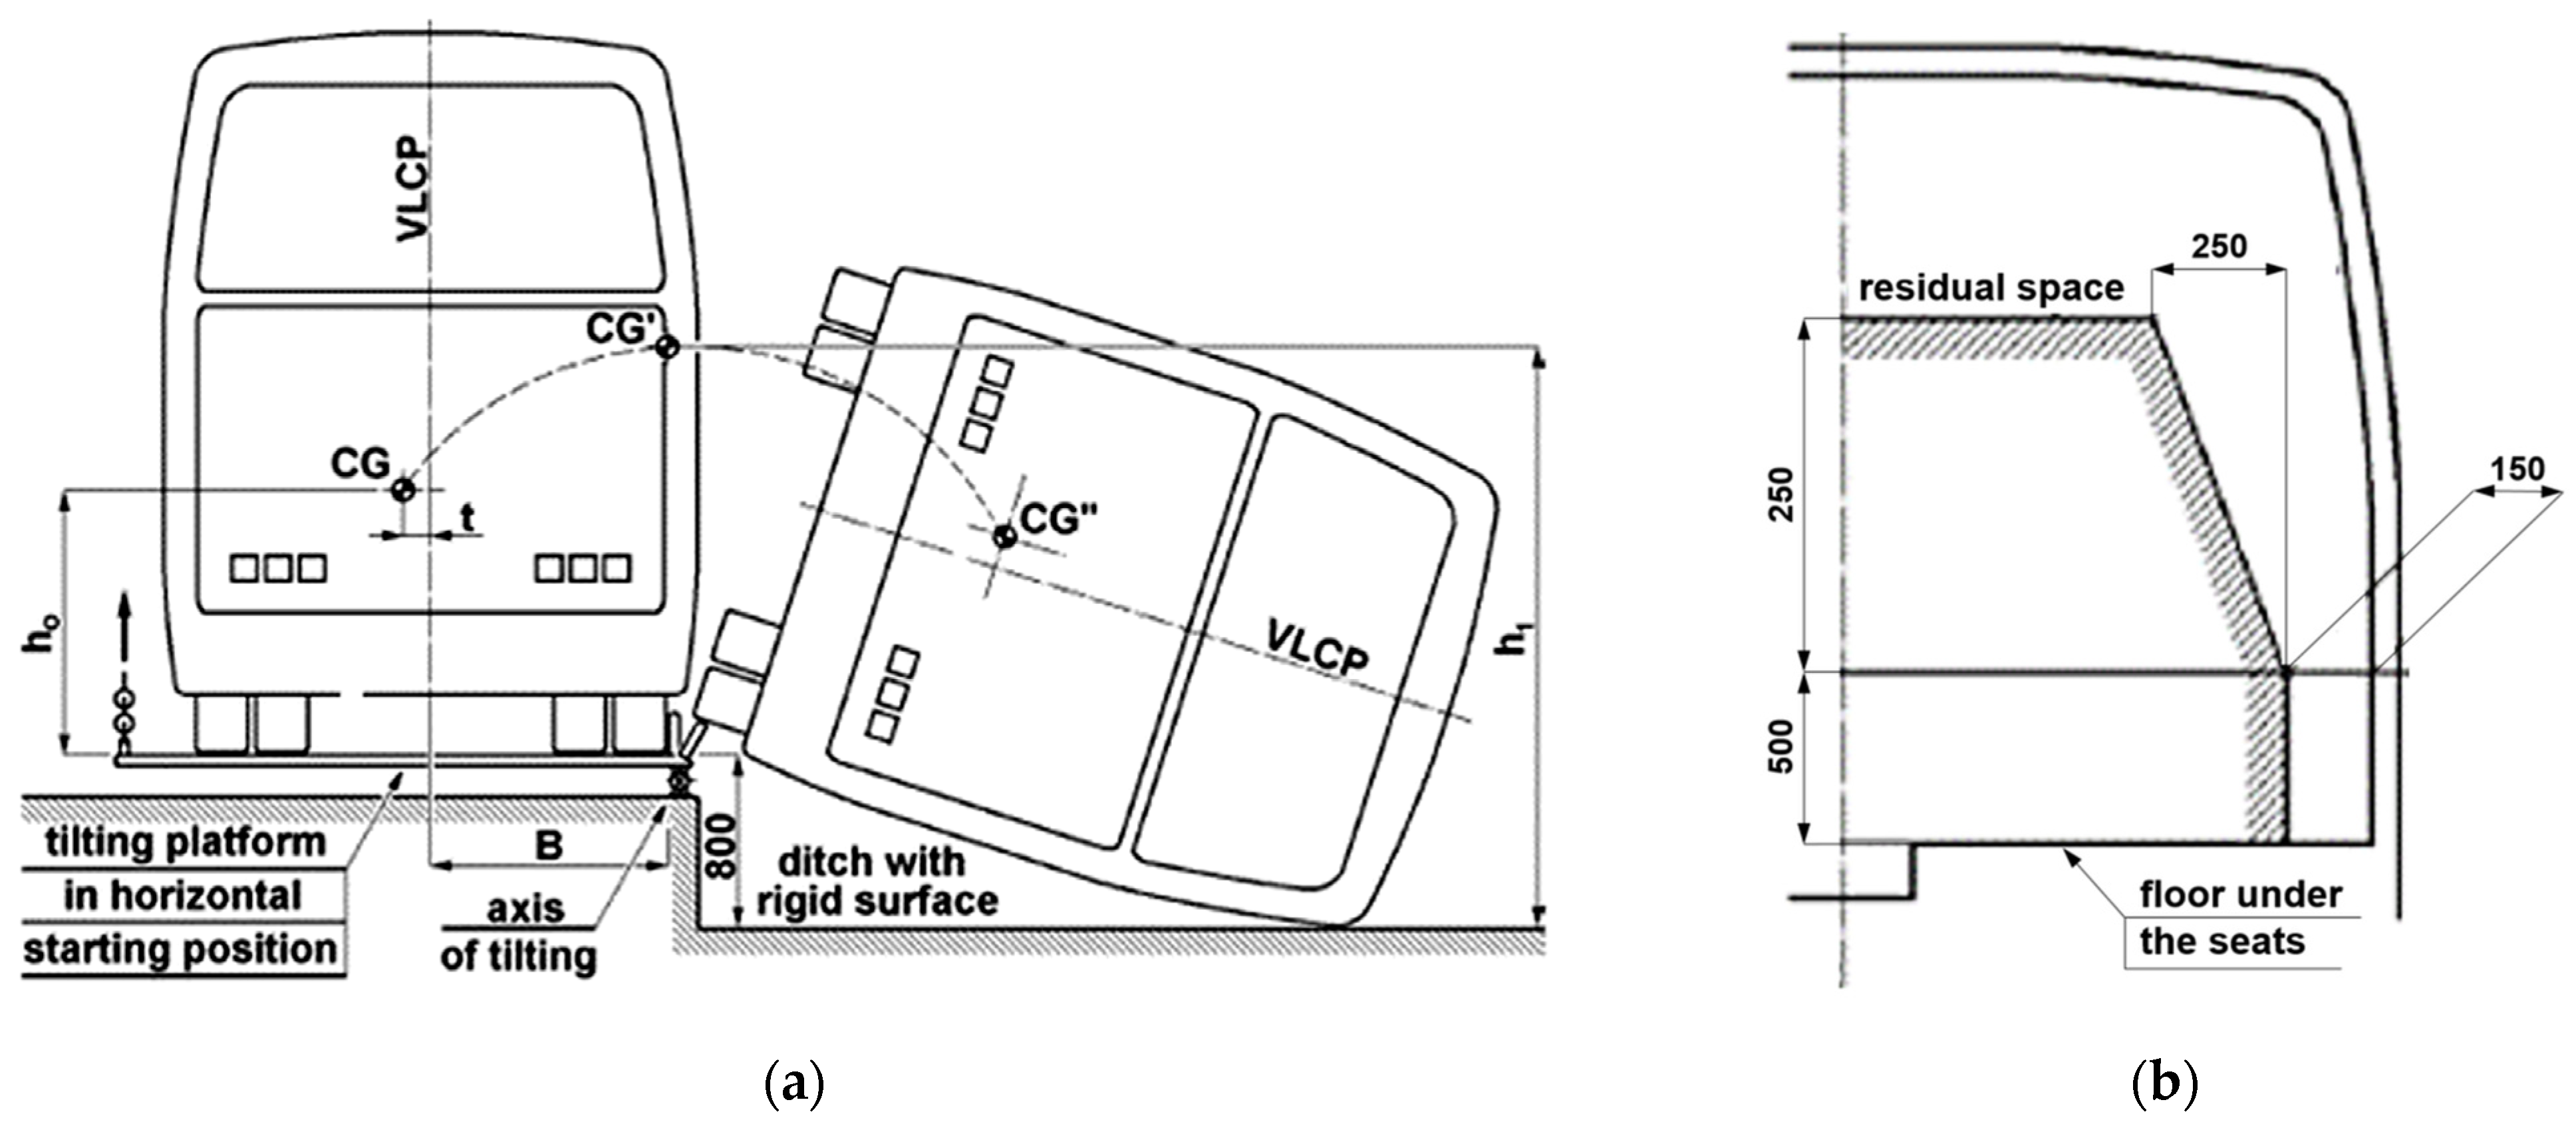
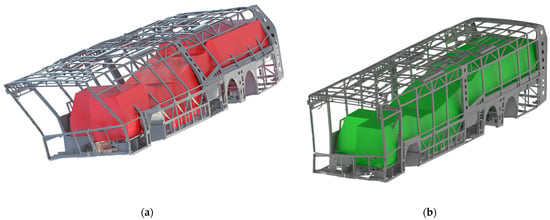
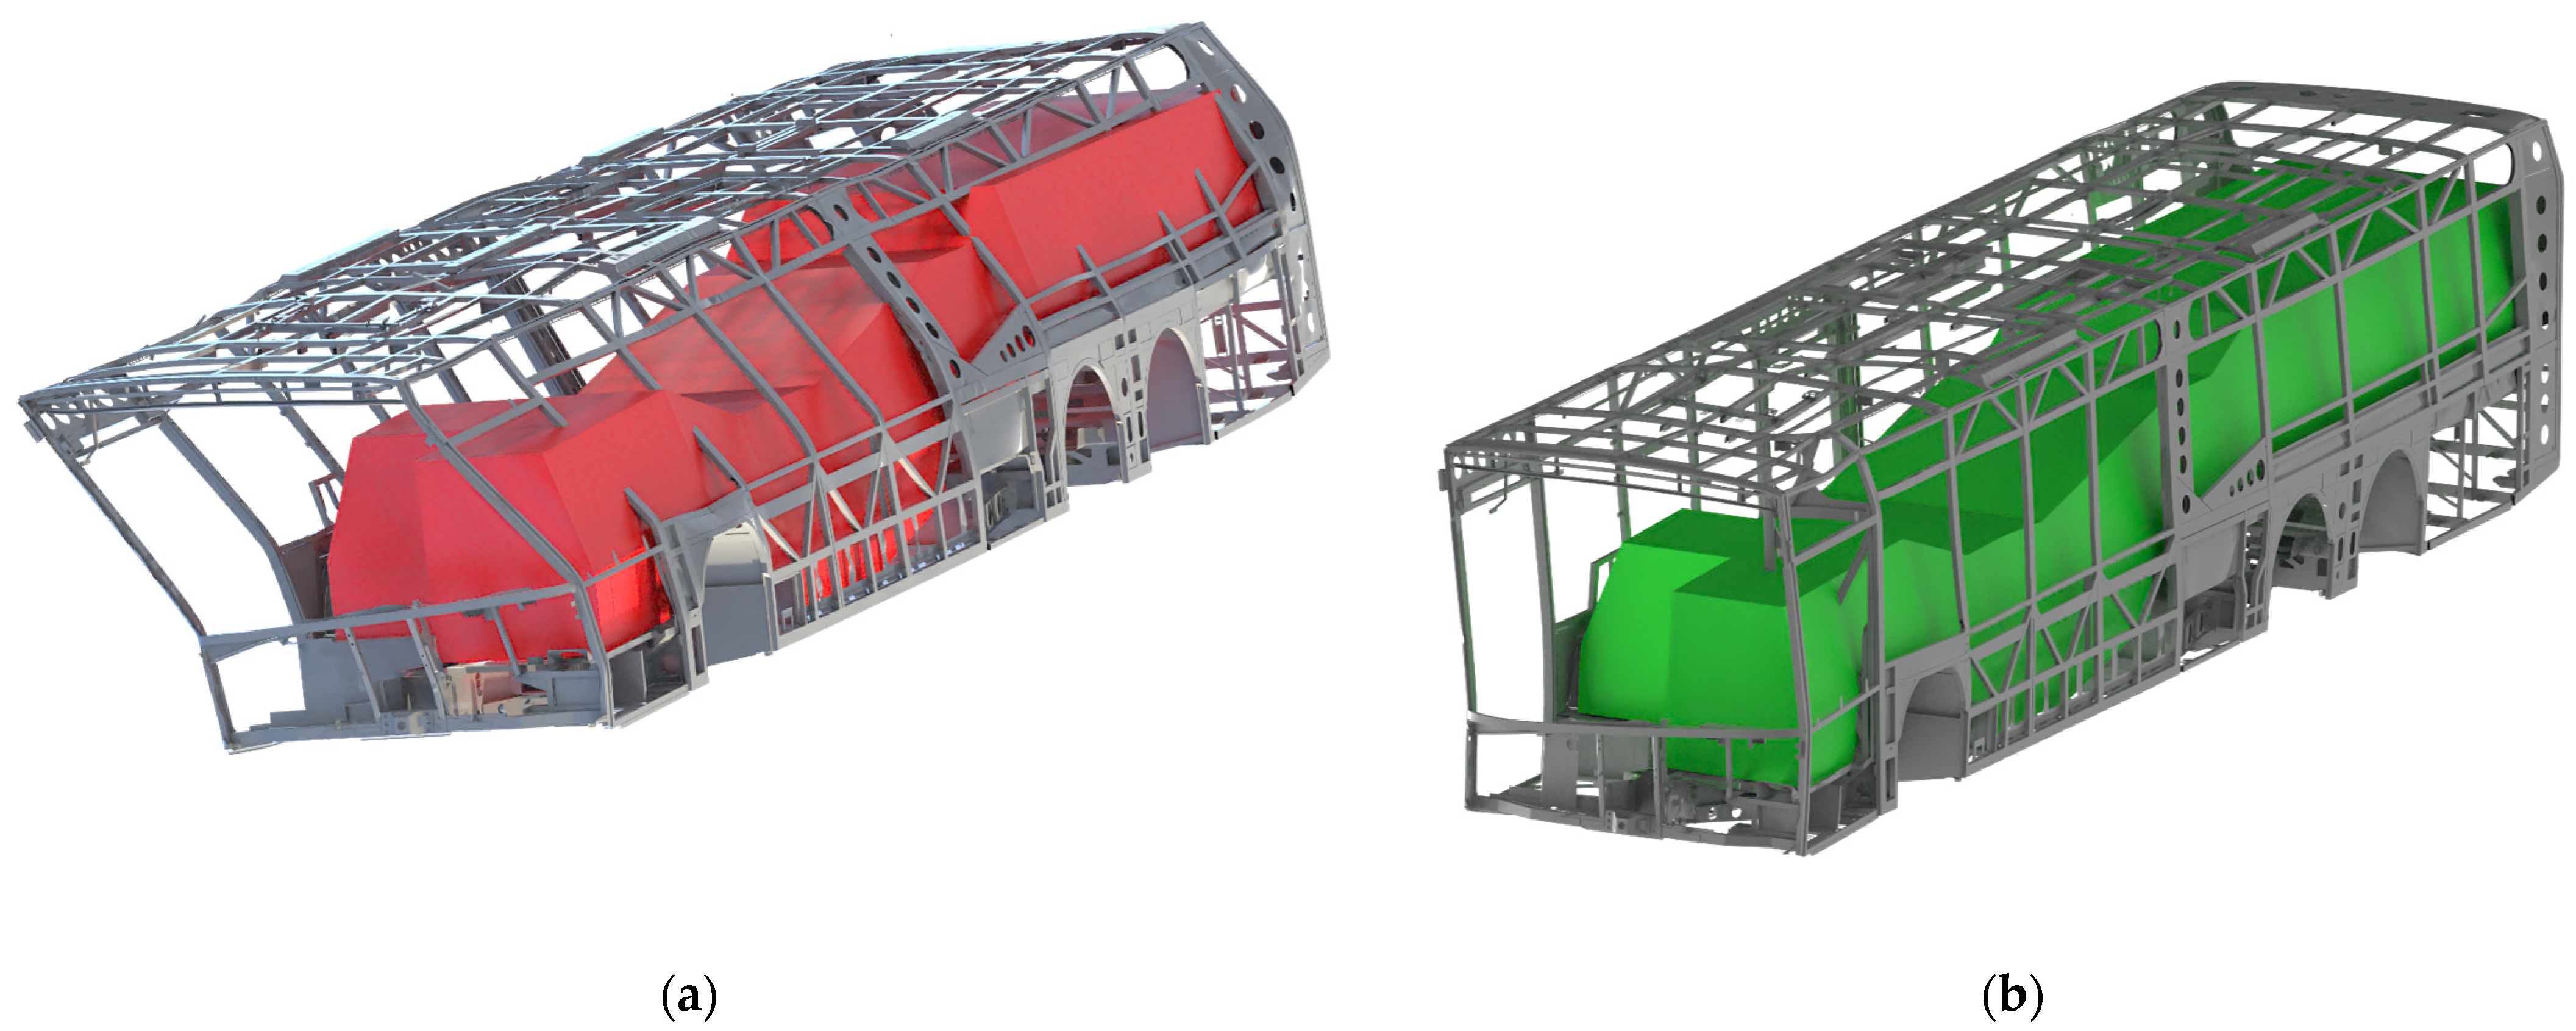
The most demanding vehicle configuration should be considered in the assessment. In the case of electric buses, this is typically the configuration with the highest mass, most unfavourable centre of gravity location and maximum roof-mounted equipment. The lateral rollover configuration used in the analysis is shown in Figure 18a, while the residual space used as the deformation criterion is presented schematically in Figure 18b.
Figure 18.
Rollover assessment configuration and residual-space definition: (a) lateral rollover configuration used for crashworthiness assessment; (b) schematic representation of the residual space [3].
Large plastic deformations may occur during rollover, and therefore the analysis is often challenging for vehicle manufacturers. The structural response depends on the geometry of the side walls and roof frame, material properties, joint strength, local reinforcements and energy absorption mechanisms. Previous studies have investigated both structural modifications and material-based solutions intended to improve rollover resistance [17]. Similar development efforts are also required in fatigue design, because the same regions of the superstructure may be subjected to durability requirements during normal operation and to high deformation demands during crashworthiness assessment [18].
The rollover analysis was used to compare the early-stage and final design configurations of the superstructure. In the early-stage configuration, significant intrusion of selected side-wall structural members into the residual space was observed, as shown in Figure 19a. After the introduction of structural reinforcements, no intrusion into the residual space was observed in the final design configuration. For the assessed configuration, the vehicle mass prepared according to the adopted regulatory assumptions was above 21 t, and the vertical position of the centre of gravity was approximately 1.5 m. The corresponding reference rollover energy was 270.7 kJ. In the final design configuration, the average distance between the side-wall structural members and the residual space was 183 mm, while the minimum distance in the most critical region was 65.8 mm. These values were used as quantitative indicators supporting the residual-space assessment according to the adopted UN Regulation No. 66-based procedure.
Figure 19.
Rollover deformation comparison according to the adopted UN Regulation No. 66-based assessment procedure: (a) early-stage design showing intrusion into the residual space; (b) final design configuration without residual-space intrusion.
In addition to the geometrical residual-space criterion, the evaluation of rollover simulation results should also consider the mechanical response of the structure. In particular, regions of high plastic deformation should be checked to verify that the material failure or tearing limit is not exceeded. The assessment of welded joints is also important, because welded connections should preferably be located outside regions subjected to large plastic deformation during rollover. In the present workflow, these aspects were considered during the engineering evaluation of the design; however, detailed local plastic strain fields, peak stress values, weld-level assessment data and reinforcement details are not disclosed due to industrial confidentiality restrictions. A qualitative comparison of the deformation patterns for the early-stage and final design configurations is shown in Figure 19.
3. Results and Discussion
The proposed workflow was applied to the virtual development and verification of an electric bus superstructure. The finite element model was used to evaluate static load cases, torsional stiffness, modal properties, fatigue-oriented response and rollover-related structural deformation. The obtained results were used to identify critical regions of the superstructure and to support design modifications during the development process.
The static analyses allowed the main load paths and highly loaded regions of the superstructure to be identified at an early stage of the design process. Representative stress distributions obtained for emergency braking, frame twisting and service load cases confirmed that the roof frame, side-wall regions and suspension attachment areas are among the most important regions for structural verification. Due to industrial confidentiality restrictions, detailed stress values are not disclosed; therefore, the presented stress maps are used to illustrate the structural response and the methodology rather than to provide full numerical data.
The torsional stiffness test was used as the main global validation criterion for the finite element model. For the considered support configuration, the initial numerical model differed from the experimental result by approximately 9%. After correlation of the model assumptions and boundary conditions, the discrepancy was reduced to approximately 4%. This level of agreement was considered sufficient for further structural assessment and for comparison of design variants.
The modal test provided additional information about the dynamic behaviour of the superstructure. For selected correlated modes, MAC values higher than 0.7 were obtained, while the corresponding frequency differences were below 10%. Due to the size and complexity of the bus superstructure, the modal hammer test was treated as a supplementary dynamic correlation step rather than as the only validation criterion. The results confirmed that the adopted numerical model can be used for further global dynamic analyses, provided that the boundary conditions are consistently represented.
The numerical–experimental comparison presented in this study is focused on global validation of the bus superstructure model. The torsional stiffness test and experimental modal test were used to correlate the finite element model under controlled structural test conditions. The proposed workflow is intended to support early-stage structural development, when a prototype of the specific bus configuration may not yet be available. Therefore, operational measurement data from previous or similar vehicle tests were used as input information for load characterization and for the definition of representative dynamic load cases. A detailed comparison between simulated time histories and real-time measurements from urban driving or proving-ground tests of the final vehicle prototype is outside the scope of the present workflow-oriented paper and may be addressed in future work.
The multibody simulations enabled the transfer of road-induced and test-track-related excitations into the structural assessment workflow. The use of nonlinear suspension characteristics, advanced tyre modelling and representative road inputs allowed the loads transmitted from the suspension system to the superstructure to be estimated more realistically than in purely static assumptions. The resulting force and response histories were then used as input for fatigue-oriented assessment.
The fatigue assessment procedure was used to identify regions of the welded thin-walled structure that may be sensitive to durability problems. Typical critical locations include welded joints, door and window openings, local geometric discontinuities and suspension attachment areas. The calculated fatigue damage distributions were used qualitatively to support design decisions. Detailed stress histories, load spectra, S–N curve parameters and absolute damage values are not disclosed due to industrial confidentiality restrictions.
The rollover analysis was used to compare the early-stage and final design configurations of the superstructure. The initial configuration showed a risk of excessive deformation towards the protected occupant volume, whereas the final design satisfied the adopted rollover assessment criterion. A qualitative comparison of the deformation patterns is shown in Figure 19. Selected quantitative rollover indicators, including reference rollover energy and residual-space clearance values, are reported in Section 2.9. Detailed material parameters and reinforcement details are not disclosed due to industrial confidentiality restrictions.
Overall, compared with a conventional prototype-oriented structural design process, the proposed workflow enables several verification activities to be performed earlier and in a more integrated manner. In a conventional approach, structural decisions are typically supported by engineering assumptions, selected numerical checks and prototype-based verification performed when the vehicle layout and main structural concept are already largely defined. In the proposed workflow, static structural assessment, multibody-derived load histories, operational measurement data, fatigue-oriented evaluation and rollover analysis are linked within one consistent process. This does not eliminate the need for prototype testing or experimental validation, but supports earlier virtual screening of design variants and a more balanced assessment of stiffness, durability, crashworthiness and mass-related constraints. The workflow is particularly useful when the vehicle configuration is modified, for example when the arrangement or mass of roof-mounted components, battery systems or auxiliary equipment changes, because the influence of such modifications on load paths, fatigue-critical regions and rollover behaviour can be assessed before final prototype verification. This is especially important when rollover requirements are not considered in the early design phase, because later structural modifications required to satisfy UN Regulation No. 66 may lead to additional structural mass. Subsequent mass optimization in regions that have already been validated for durability may then require further durability reassessment or additional testing. The validation results reported above provide quantitative evidence of the model correlation quality and support the simulation accuracy required for early-stage structural assessment, while detailed stress values, fatigue damage values, deformation values and proprietary design modifications are not disclosed due to industrial confidentiality restrictions.
4. Conclusions
The development of an electric bus superstructure is a complex and iterative process involving several conflicting requirements, including low mass, structural safety, fatigue durability, passenger capacity, manufacturability and cost efficiency. The increasing mass of roof-mounted components in electric buses makes the structural verification process particularly important, because both operational durability and rollover crashworthiness must be considered at an early design stage.
The presented workflow shows how finite element analysis, multibody dynamics simulations, experimental validation and operational load data can be integrated into a consistent virtual verification process. The approach supports the identification of critical structural regions before prototype testing and enables design modifications to be introduced earlier in the development cycle. Torsional stiffness testing and modal correlation provide useful experimental support for validating the numerical model before it is used for dynamic and fatigue-oriented analyses.
The fatigue assessment procedure based on stress histories, S–N curves, rainflow cycle counting and Palmgren–Miner damage accumulation provides a practical method for evaluating welded thin-walled bus structures under service conditions. The use of operational load data and representative road excitation inputs improves the realism of numerical load cases compared with purely assumed design loads.
The rollover analysis according to the principles of UN Regulation No. 66 enables early assessment of crashworthiness requirements and supports structural modifications aimed at preserving the protected occupant volume. Existing approval regulations define safety and construction requirements, but they do not provide a complete publicly available methodology for fatigue-oriented structural design based on operational load spectra. Therefore, the proposed workflow can support the development of lightweight, safe and durable electric bus superstructures while reducing the number of physical prototype iterations.
Author Contributions
Conceptualization, B.W. and W.J.S.; methodology, B.W.; software, B.W.; validation, B.W., P.B.D., P.M. and D.M.; formal analysis, B.W. and P.B.D.; investigation, B.W.; resources, B.W. and D.M.; data curation, B.W.; writing—original draft preparation, B.W.; writing—review and editing, B.W., P.B.D., P.M., D.M. and W.J.S.; visualization, B.W.; supervision, W.J.S., P.B.D. and D.M.; project administration, B.W.; funding acquisition, B.W. All authors have read and agreed to the published version of the manuscript.
Funding
This research was carried out within the Implementation Doctorate Programme funded by the Polish Ministry of Science and Higher Education under agreement No. DWD/3/34/2019.
Data Availability Statement
Restrictions apply to the datasets presented in this article. The data are not publicly available due to confidentiality restrictions related to proprietary industrial vehicle development. Selected results, representative figures and methodological details are included in the article.
Conflicts of Interest
Authors B.W., P.M. and D.M. were employed by the company Solaris Bus & Coach sp. z o.o. The remaining authors declare that the research was conducted in the absence of any commercial or financial relationships that could be construed as a potential conflict of interest.
References
- United Nations Economic Commission for Europe. UN Regulation No. 107—Uniform Provisions Concerning the Approval of Category M2 or M3 Vehicles with Regard to Their General Construction [2026/139]; Official Journal of the European Union 2026, L Series, 2026/139; United Nations Economic Commission for Europe: Geneva, Switzerland, 2026. [Google Scholar]
- Council of the European Union. Council Directive 96/53/EC of 25 July 1996 Laying Down for Certain Road Vehicles Circulating Within the Community the Maximum Authorized Dimensions in National and International Traffic and the Maximum Authorized Weights in International Traffic; Official Journal of the European Communities 1996, L 235, 59–75, Consolidated Version 14 August 2019; Council of the European Union: Brussels, Belgium, 2019.
- United Nations Economic Commission for Europe. Regulation No. 66—Uniform Provisions Concerning the Approval of Large Passenger Vehicles with Regard to the Strength of Their Superstructure; Official Journal of the European Union 2011, L Series 84; United Nations Economic Commission for Europe: Geneva, Switzerland, 2011; pp. 1–45. [Google Scholar]
- Walczak, B.; Malaca, P.; Michalak, D.; Staszewski, W.J. Measurements of loads acting on an electric bus in urban traffic. Procedia Struct. Integr. 2023, 47, 723–731. [Google Scholar] [CrossRef] [Scilit]
- ISO 8608:2016; Mechanical Vibration—Road Surface Profiles—Reporting of Measured Data. ISO (International Organization for Standardization): Geneva, Switzerland, 2016.
- Heylen, W.; Lammens, S.; Sas, P. Modal Analysis Theory and Testing, 2nd ed.; Department of Mechanical Engineering, Faculty of Engineering, Katholieke Universiteit Leuven: Leuven, Belgium, 2007. [Google Scholar]
- Avitabile, P. Modal Testing: A Practitioner’s Guide; John Wiley & Sons: Hoboken, NJ, USA, 2017. [Google Scholar]
- Allemang, R.J. The Modal Assurance Criterion-Twenty Years of Use and Abuse. Sound Vib. 2003, 37, 14–23. [Google Scholar]
- Craig, R.R., Jr.; Bampton, M.C.C. Coupling of Substructures for Dynamic Analyses. AIAA J. 1968, 6, 1313–1319. [Google Scholar] [CrossRef] [Scilit] [PubMed]
- Cosin Scientific Software. FTire-Flexible Structure Tire Model. Available online: https://www.cosin.eu/ (accessed on 9 May 2026).
- Altoona Bus Testing and Research Center. Test Bus Procedure 5.7—Structural Durability Test; The Thomas D. Larson Pennsylvania Transportation Institute, The Pennsylvania State University: University Park, PA, USA, 2016; Available online: https://www.altoonabustest.psu.edu/assets/docs/bus-docs/updated%20procedures/5.7-Structural-Integrity-Structural-Durability.pdf (accessed on 9 May 2026).
- BS 7608:2014+A1:2015; British Standards Institution. Guide to Fatigue Design and Assessment of Steel Products. BSI Standards Limited: London, UK, 2015. [CrossRef] [Scilit]
- EN 1993-1-9:2025; Eurocode 3: Design of Steel Structures—Part 1–9: Fatigue. CEN (European Committee for Standardization): Brussels, Belgium, 2025.
- Hobbacher, A.F.; Baumgartner, J. Recommendations for Fatigue Design of Welded Joints and Components, 3rd ed.; IIW Collection; Springer: Cham, Switzerland, 2024. [Google Scholar] [CrossRef] [Scilit]
- Miner, M.A. Cumulative Damage in Fatigue. J. Appl. Mech. 1945, 12, A159–A164. [Google Scholar] [CrossRef] [Scilit]
- ASTM E1049-85(2023); Standard Practices for Cycle Counting in Fatigue Analysis. ASTM International: West Conshohocken, PA, USA, 2023. [CrossRef] [Scilit]
- Kepka, M.; Volak, J.; Minich, R.; Martinu, M.; Pavlata, P.; Dopierala, L.; Walczak, B. Experiments to Support the Improvement of the Integrity and Resistance of the Bus Bodywork in a Rollover Accident. Procedia Struct. Integr. 2023, 47, 113–118. [Google Scholar] [CrossRef] [Scilit]
- Vaclavik, J.; Musilova, R.; Dopierala, L.; Walczak, B.; Hejman, M. Fatigue Behavior of the Hybrid Beam. Procedia Struct. Integr. 2023, 47, 282–289. [Google Scholar] [CrossRef] [Scilit]

Disclaimer/Publisher’s Note: The statements, opinions and data contained in all publications are solely those of the individual author(s) and contributor(s) and not of MDPI and/or the editor(s). MDPI and/or the editor(s) disclaim responsibility for any injury to people or property resulting from any ideas, methods, instructions or products referred to in the content. |
© 2026 by the authors. Licensee MDPI, Basel, Switzerland. This article is an open access article distributed under the terms and conditions of the Creative Commons Attribution (CC BY) license.