


Abstract
During CO2 pipeline transportation, factors such as third-party interference, pipeline corrosion, and material defects may cause pipeline rupture and CO2 leakage, posing a threat to the safety of surrounding personnel. Therefore, it is of great significance to study the leakage and dispersion characteristics of CO2 pipelines. Based on the similarity theory, this study established an offshore platform experimental system, measured the CO2 concentration variation patterns at different positions on the offshore platform during leakage and dispersion, and identified the influence laws of leakage direction (0°~90°), leakage pressure (1.5~3 MPa), leakage time (1~4 min), and environmental wind speed (0~0.5 m/s) on the leakage and dispersion characteristics of pipeline stations. The results show that when leakage pressure increases, the reading of sensor No. 15 remains unaffected and the maximum concentration is measured at a certain distance from the leakage port; leakage duration has minimal impact; ambient wind speed mainly affects near-field concentration; increasing leakage orifice diameter significantly increases far-field concentration; all sensor readings are zero during vertical leakage; and sensor No. 15 shows the highest reading during 45° upward leakage, while sensor No. 5 shows the highest reading during horizontal leakage. The research results can provide guidance for CO2 transportation and storage on offshore platforms.
1. Introduction
CO2 is a typical greenhouse gas that causes global climate warming. It is mainly produced through industrial production, power generation, and fuel combustion processes. To address the issue of global climate warming, China has set the “dual carbon” target, providing both opportunities and challenges for the development of low-carbon emission technologies in China. Among various emission reduction technologies, carbon capture, utilization, and storage technology (CCUS) holds the greatest potential for development [1,2]. In the CCUS technology, CO2 is usually transported through pipelines to the storage site or resource utilization sites via pipelines. Among them, offshore geological storage serves as a highly preferable option. Meanwhile, the CO2 injection technology has become an important research and application direction widely pursued both domestically and internationally [3,4]. It can enhance the recovery rate of crude oil while achieving CO2 sequestration. However, during the pipeline transportation process, due to factors such as third-party interference, pipeline corrosion, and material defects, there are significant adverse impacts exerted on personnel safety and the ecological environment [5]. Especially in environments with limited space and complex structures such as offshore platforms, this risk becomes even more prominent [6,7,8]. Therefore, the study of CO2 pipeline leakage and dispersion on offshore platforms holds great significance.
According to relevant research, the process of CO2 leakage mainly includes near-field jet and far-field dispersion [9,10]. The CO2PIPETRANS JIP organization has conducted a series of large-scale CO2 leakage experiments to investigate the effects of different initial conditions, leakage orifice size, and leakage direction on the characteristics of CO2 leakage and dispersion [11,12,13]. Xie et al. [14] revealed the correlation between the in-pipe depressurization process of supercritical CO2 leakage and the characteristics of near-field jet through numerical simulation. So far, studies have systematically discussed the leakage dispersion characteristics and concentration change laws of CO2 and compared and analyzed the commonly used CFD models and risk assessment methods, providing a theoretical basis for CO2 pipeline transportation [15].
Gao et al. constructed an experimental system to study the leakage and dispersion behavior of liquid CO2 containers. The research results provided a basis for the division of dangerous areas for far-field dispersion [7]. Liu et al. [16] proposed a model for predicting the emission rate, atmospheric expansion, and dispersion caused by accidental CO2 leakage in high-pressure pipelines, and they also studied the influence of H2S in CO2 mixtures and clarified the dangerous threshold of H2S. Zhang et al. [17] constructed a small-scale CO2 leakage device to explore the variation laws of near-field pressure, temperature and jet structure under different pressure, and temperature and leakage diameter conditions. Hu et al. [18], for the leakage of supercritical and dense-phase CO2 pipelines under high pressure, combined multiple risk assessment methods to calculate and adjust the failure probability of CO2 pipelines. Guo et al. [19] constructed a large-scale pipeline device with a total length of 258 m and an inner diameter of 233 mm to study the near-field characteristics and dispersion behavior of supercritical carbon dioxide in sudden leakage. Shao et al. [20] adopted the Unified Dispersion Model (UDM) to comprehensively examine the influence of various factors on the CO2 leakage dispersion law. Teng et al. [21] investigated the influence of different leakage aperture sizes and leakage hole shapes on the dispersion pattern of supercritical CO2 leakage, and based on this, they also studied the release pattern of CO2. Cao et al. [22] used Space Claim software to conduct three-dimensional modeling of the upper and middle layers of the target offshore platform and carried out a series of pipeline CO2 leakage and dispersion simulations using numerical simulation methods. The study found that in large-scale CO2 release experiments conducted in complex terrain or areas with dense buildings, due to the structural blocking effect, the risk of CO2 accumulation in local areas would be significantly enhanced, and this phenomenon was particularly obvious in offshore platforms and industrial facilities areas [23]. Proposed a CO2 leakage detection and location method using wireless sensor networks, providing technical support for the rapid identification and emergency response of leakage accidents [24]. The above research can provide references and insights for the near-field jet characteristics, far-field dispersion characteristics, and CO2 concentration distribution after an actual CO2 pipeline leakage occurs.
Compared with the studies on CO2 leakage on land, there are fewer studies on CO2 leakage at sea. Cao et al. [22] conducted numerical simulations of CO2 pipeline leakage on an offshore platform and identified the DES area and rear escape channel as high-risk zones, recommending priority evacuation of personnel in the DES area. Hu et al. [25] performed scaled experiments on constant-pressure leakage through elliptical orifices and found that the Mach disk is linearly correlated with ab, and that a pressure drop below 0.3013 MPa/s can be regarded as constant-pressure leakage. Liu et al. [26] proposed a multiphysics-based integrated modeling framework for subsea CO2 leakage, incorporating phase change, dissolution, and chemical reactions. Based on this, this paper builds a scaled-down offshore platform model and uses the similar model experiment method to conduct research on the concentration change characteristics under the condition of gaseous CO2 leakage, in order to provide a reference for the design of insulation for nearby oil and gas facilities and for the protection of workers against low temperatures. The research results of this paper can provide guidance for the design and operation of offshore CO2 platforms.
2. Experimental Design
2.1. Experimental System
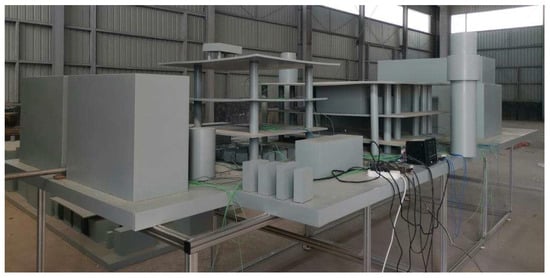
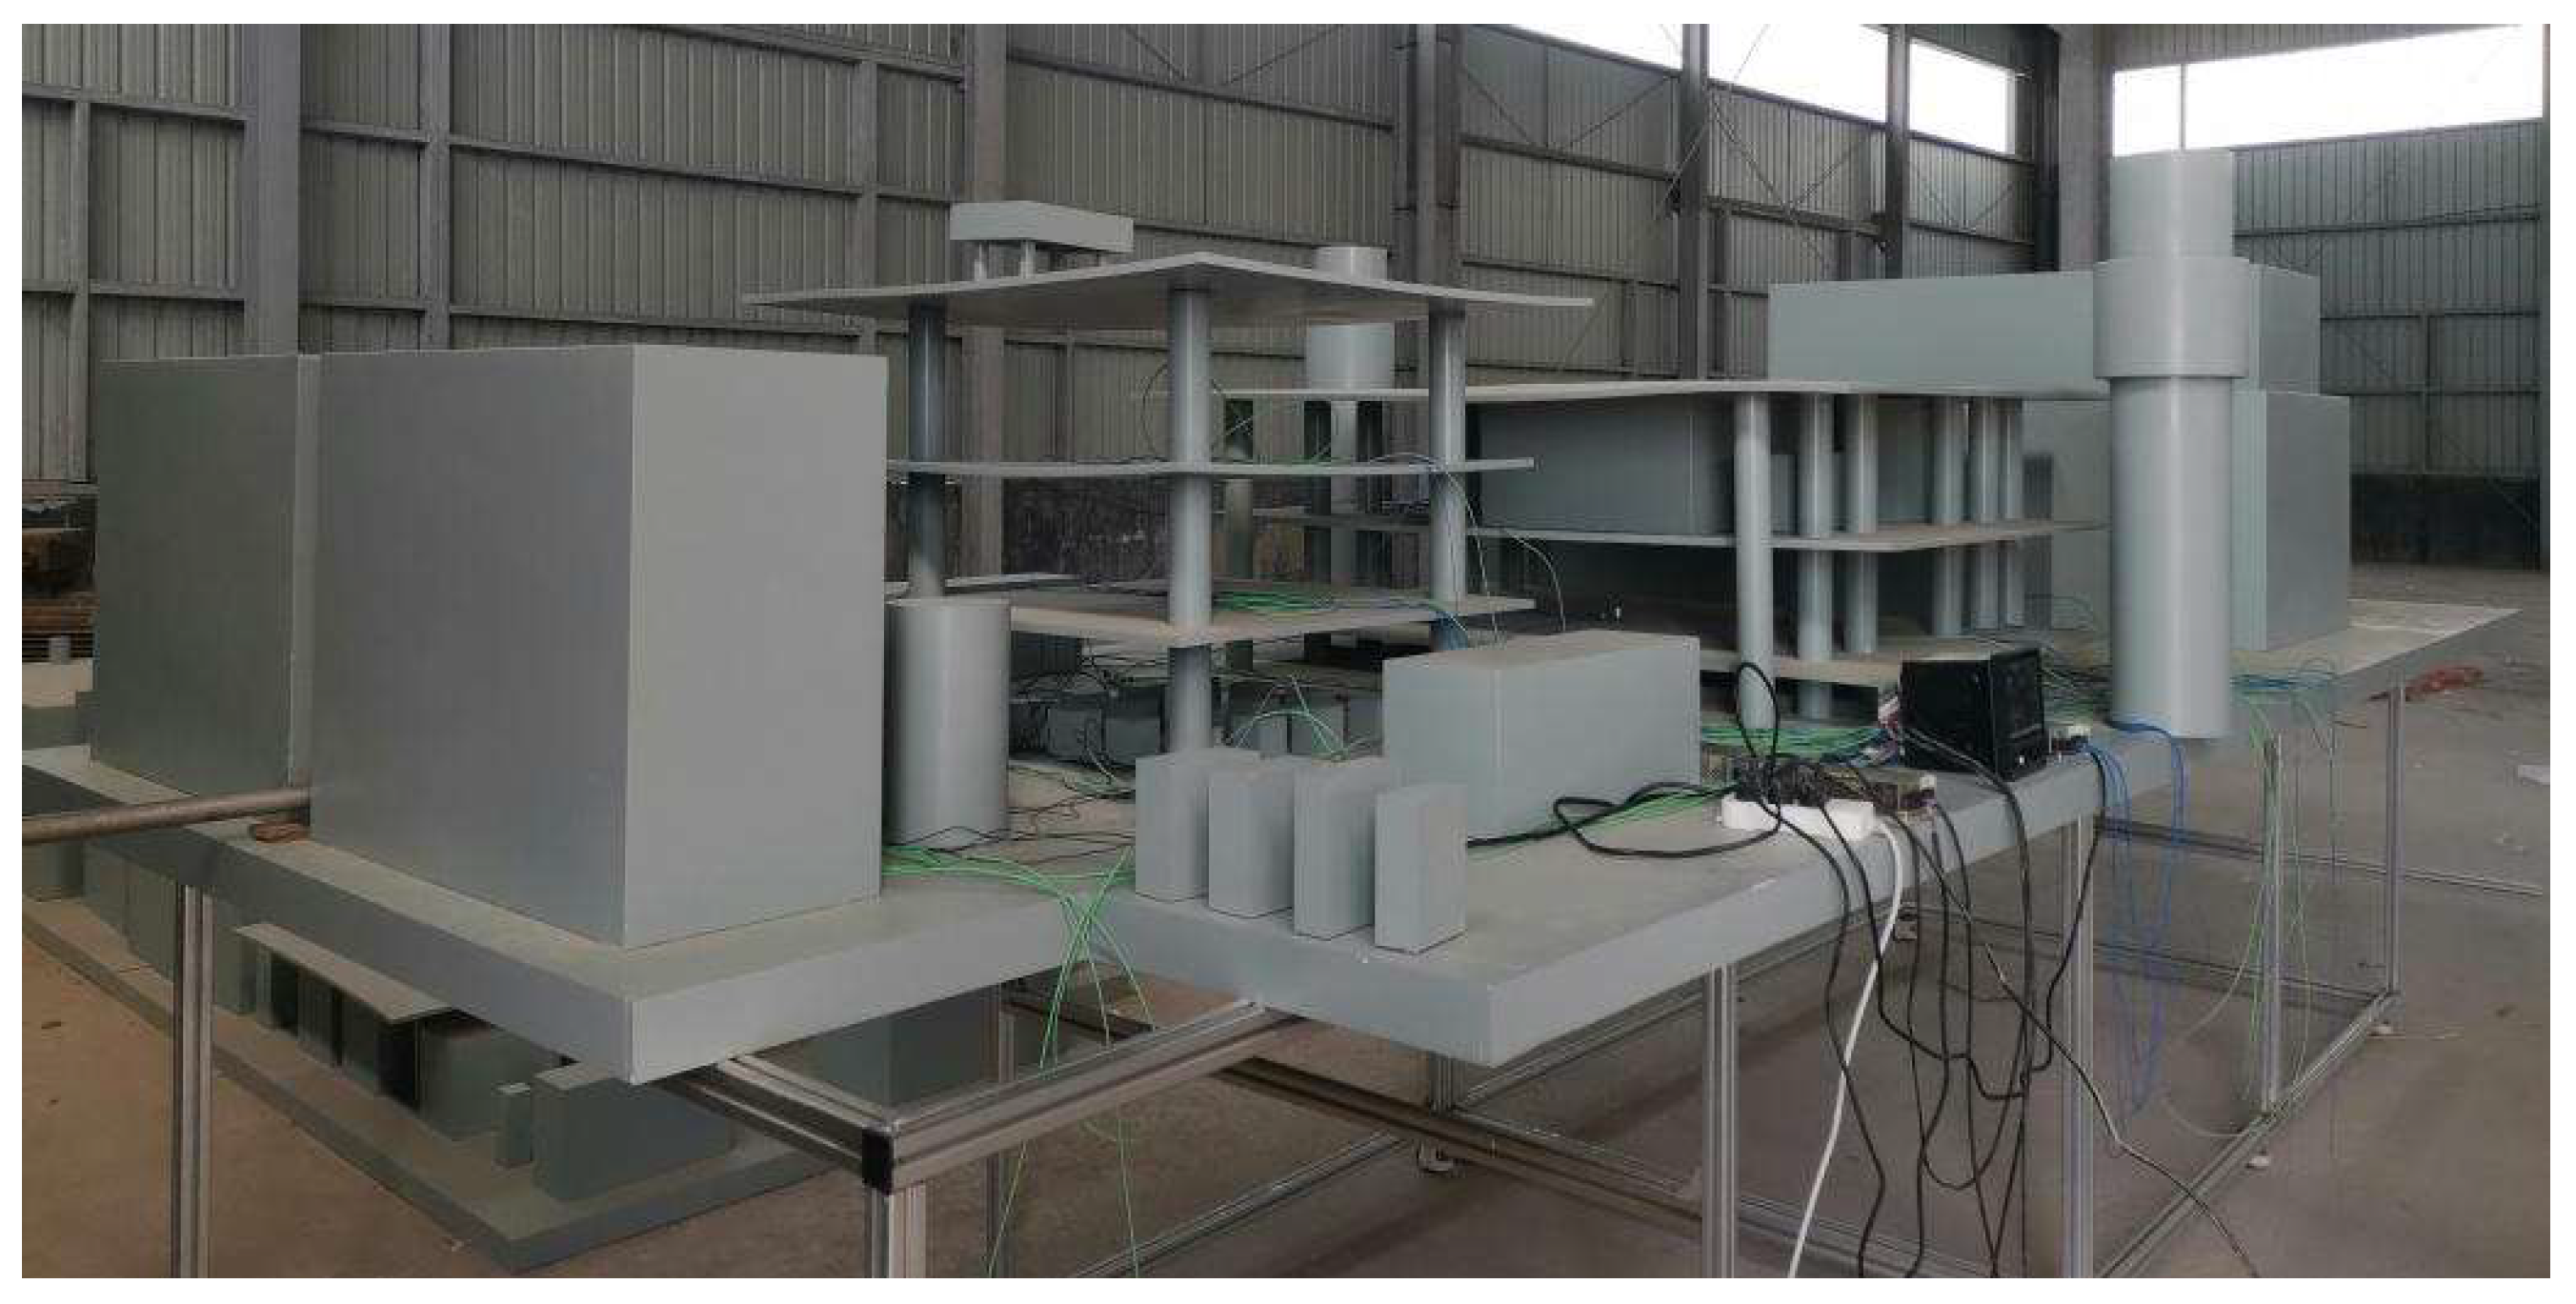
The gaseous CO2 leakage experimental system consists of five subsystems: the gas supply system, the pipeline system, the leakage system, the wind supply system, and the data acquisition system. The actual experimental model is shown in Figure 1.
Figure 1.
Offshore platform experimental model.
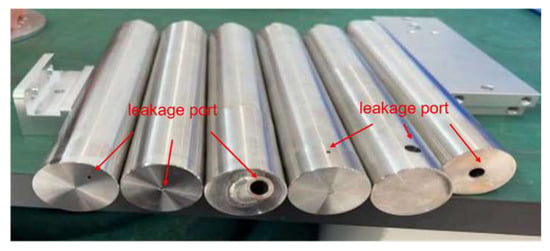
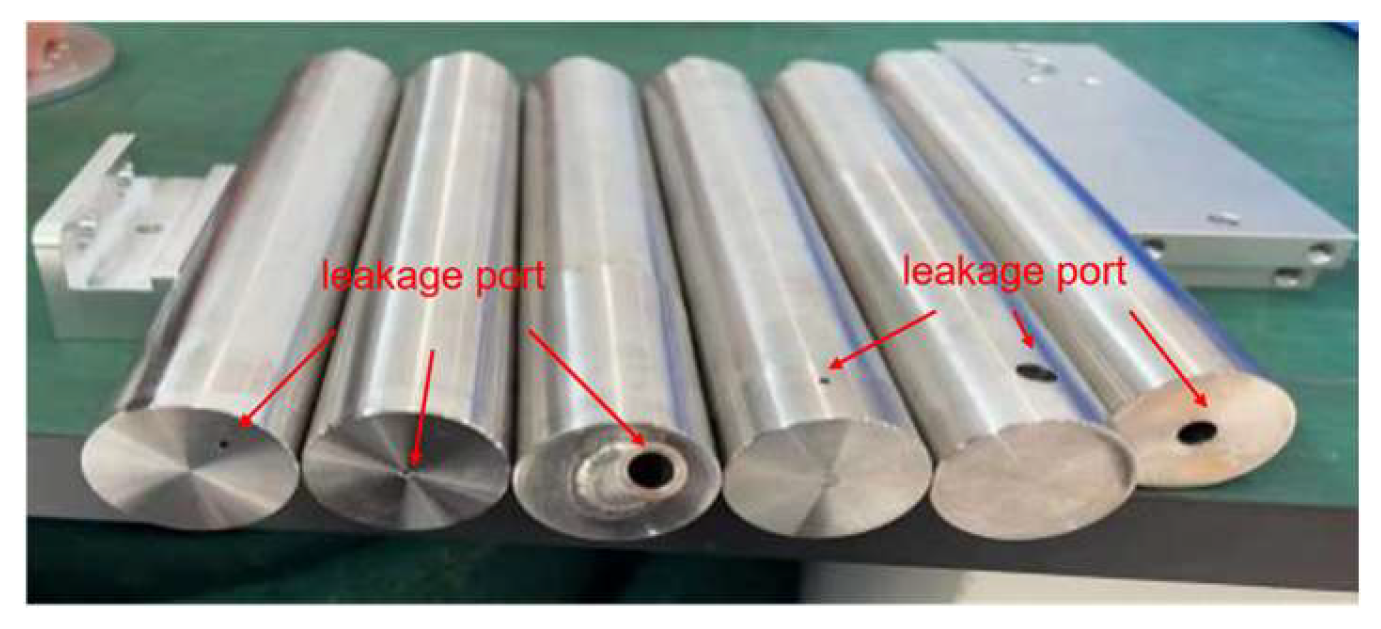
The gas supply system consists of a parallel storage group of three high-pressure and high-purity liquid CO2 storage tanks (Hengan Gas Co., Ltd., Weifang, China), which supplies gas to the experimental system. The pipeline system is composed of a pressure-reducing valve, a ball valve, a flow meter (Dalian Zhongcheng Instrument & Meter Co., Ltd., Dalian, China), and a 25 mm diameter pipeline. The leakage system is connected to the pipeline system through a flange at one end and is connected to the leakage nozzle (see Figure 2) at the other end. The environmental wind speed is provided by an industrial fan; the data acquisition system includes a data collector (MIK-R6000C) and a concentration sensor (BLDM-126).
Figure 2.
Partial leakage nozzle.
First, connect the Dewar flask (Hengan Gas Co., Ltd., Weifang, China), cryogenic liquid pump, and CO2 storage tank. The CO2 storage tank is connected to the main pipeline via a parallel manifold; then, install the pressure-reducing valve, ball valve, and flow meter in sequence, ensuring the flow direction marks are correct. Next, fix the leakage nozzle (Fenghuang Power Equipment Co., Ltd., Qingdao, China) to the end of the pipeline with a flange and place it in the test area, arrange an industrial fan on the side of the nozzle, and connect the signal wires of the concentration sensors to the data acquisition unit. After starting the data acquisition unit and recording software, perform zero and span calibration of the sensors. Then, turn on the industrial fan and adjust it to the preset wind speed so that the airflow stably covers the nozzle area. Slowly open the main valve of the storage tank, adjust the pressure-reducing valve to the desired output pressure, then slowly open the ball valve and adjust to the target leakage flow rate according to the flow meter reading; at this point, CO2 is ejected from the nozzle to simulate leakage. Observe the readings of the concentration sensors; the data acquisition unit automatically records the concentration–time curve. Finally, change the wind speed and nozzle diameter, and repeat the above leakage and recording steps.
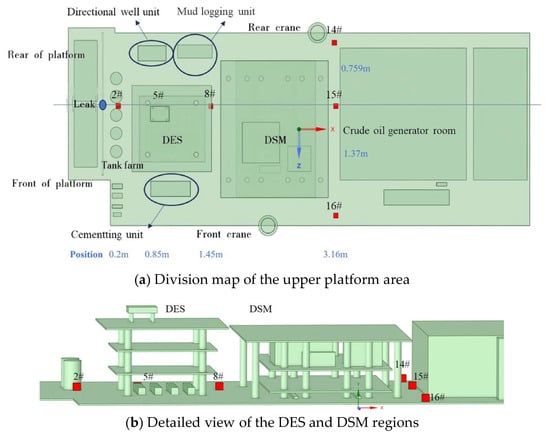
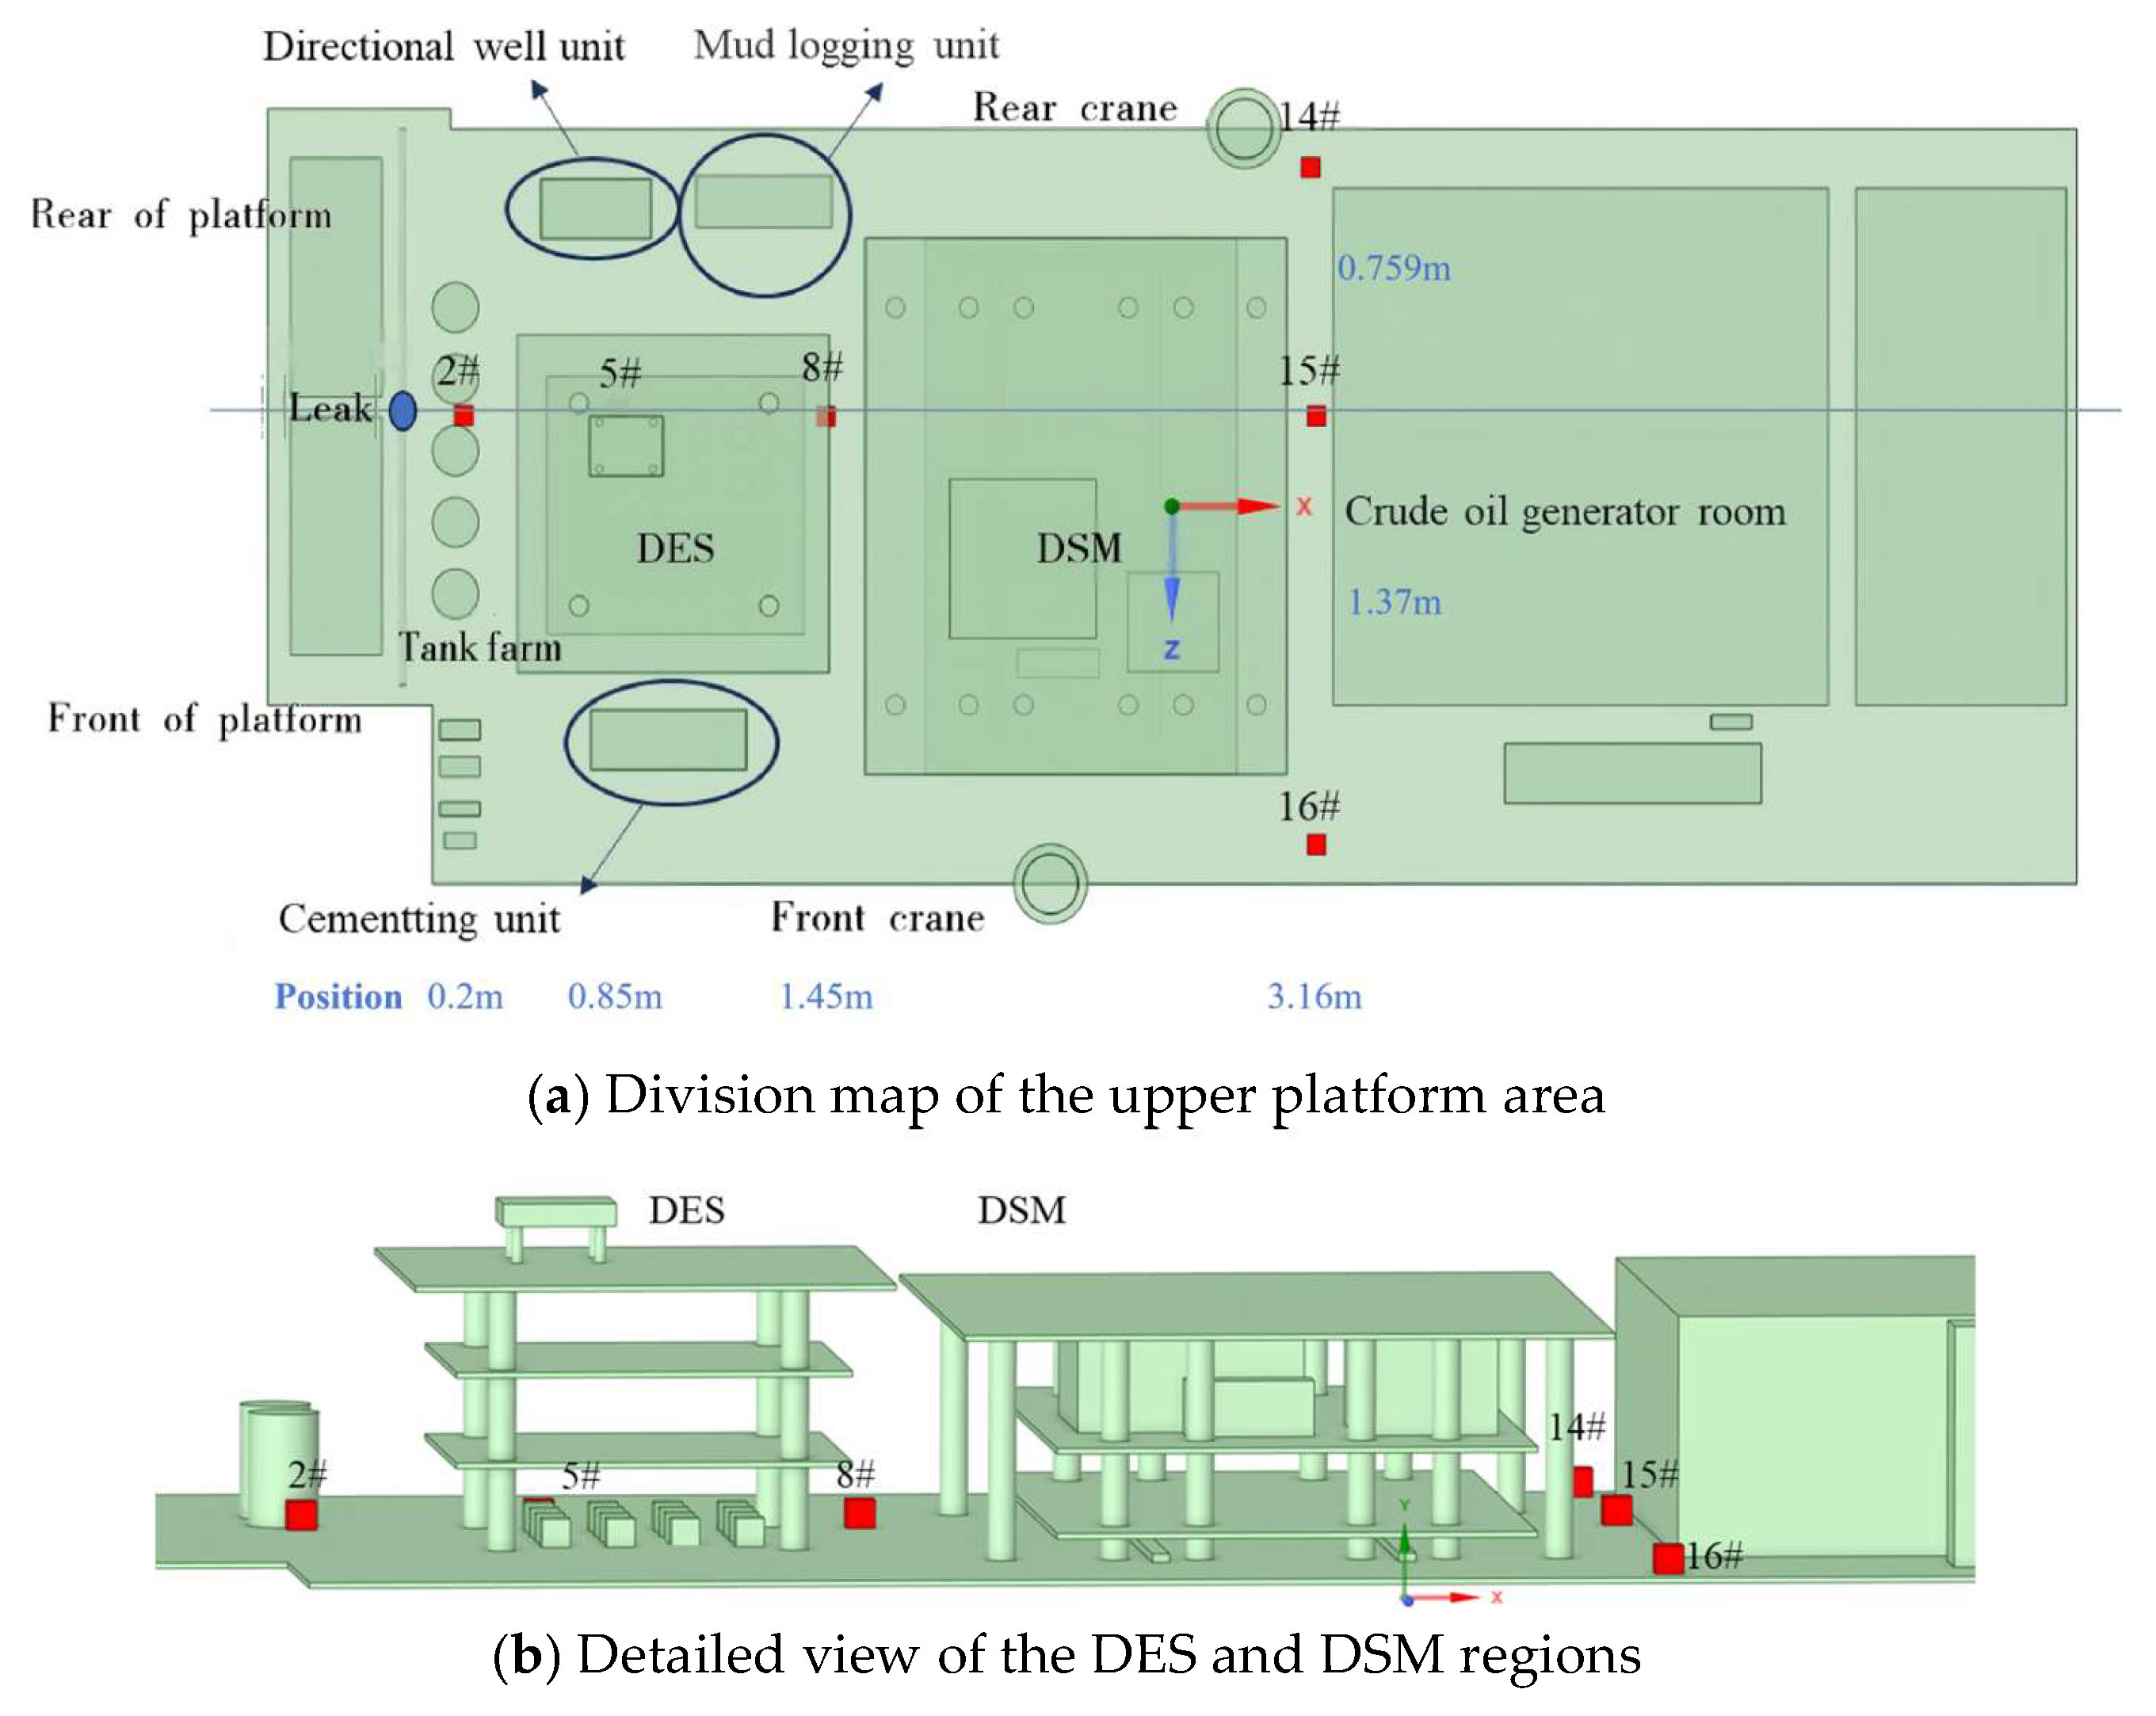
The 3D schematic diagram of the CO2 concentration sensor layout on the top of the offshore platform is shown in Figure 3. A total of six CO2 sensors were installed. Among them, sensors No. 2, No. 5, No. 8, and No. 15 are arranged along the axis of the leakage outlet; sensors No. 14 and No. 16 are located on the upper passageway of the platform; and sensors No. 14, No. 15, and No. 16 lie on the same straight line.
Figure 3.
Layout diagram of upper-level equipment and facilities, as well as building zones on the offshore platform.
2.2. Experimental Method and Test Conditions
The primary objective of this study is to investigate the axial dispersion behavior of gaseous CO2 on offshore platforms, with a particular emphasis on concentration variations along the axis of the leakage outlet. The effects of leakage pressure, leakage duration, ambient wind speed, leakage orifice diameter, and leakage direction on the axial concentration field are systematically analyzed. Based on similarity theory and dimensional analysis, a geometric scaling ratio of 16:1 was adopted to downscale the offshore platform, pipeline system, and leakage orifices. According to the relevant standards, the actual leakage diameters designed are 8 cm, 25 cm, and 100 cm, respectively, which are scaled down to experimental diameters of 0.5 mm, 1.6 mm, and 6.2 mm, respectively. The leakage directions are selected as horizontal, vertical, and 45° upward. The leakage pressure values tested were 1.5 MPa, 2 MPa, 2.6 MPa, and 3 MPa, and the leakage duration values tested were 1 min, 2 min, 3 min, and 4 min.
A total of 16 experimental cases were designed using the control variable method, as summarized in Table 1. Conditions 1–3 investigated the effect of leakage pressure, Conditions 4–7 focused on leakage duration, Conditions 8–10 examined ambient wind speed, Conditions 11–13 analyzed leakage orifice diameter, and Conditions 14–16 studied leakage direction.
Table 1.
Experimental conditions of the offshore platform.
3. Results and Discussion
This experiment employed the control variable method. The influencing factors mainly included the leakage diameter (0.5 mm, 1.6 mm, 6.2 mm), the leakage direction (0°, 45°, 90°), the leakage pressure (1.5 MPa, 2 MPa, 2.6 MPa, 3 MPa), the leakage duration (1 min, 2 min, 3 min, 4 min), and the ambient wind speed. After analyzing the complete dataset, we found that only four sensors (No. 2, No. 5, No. 8, and No. 15) captured significant and representative CO2 concentration variations under different leakage conditions. Firstly, the influence law of leakage pressure on the change in CO2 concentration was analyzed.
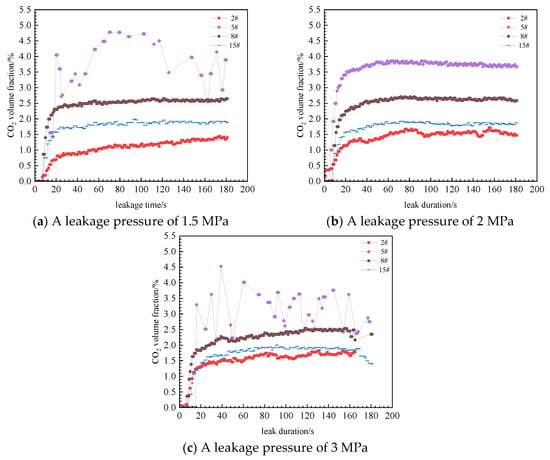
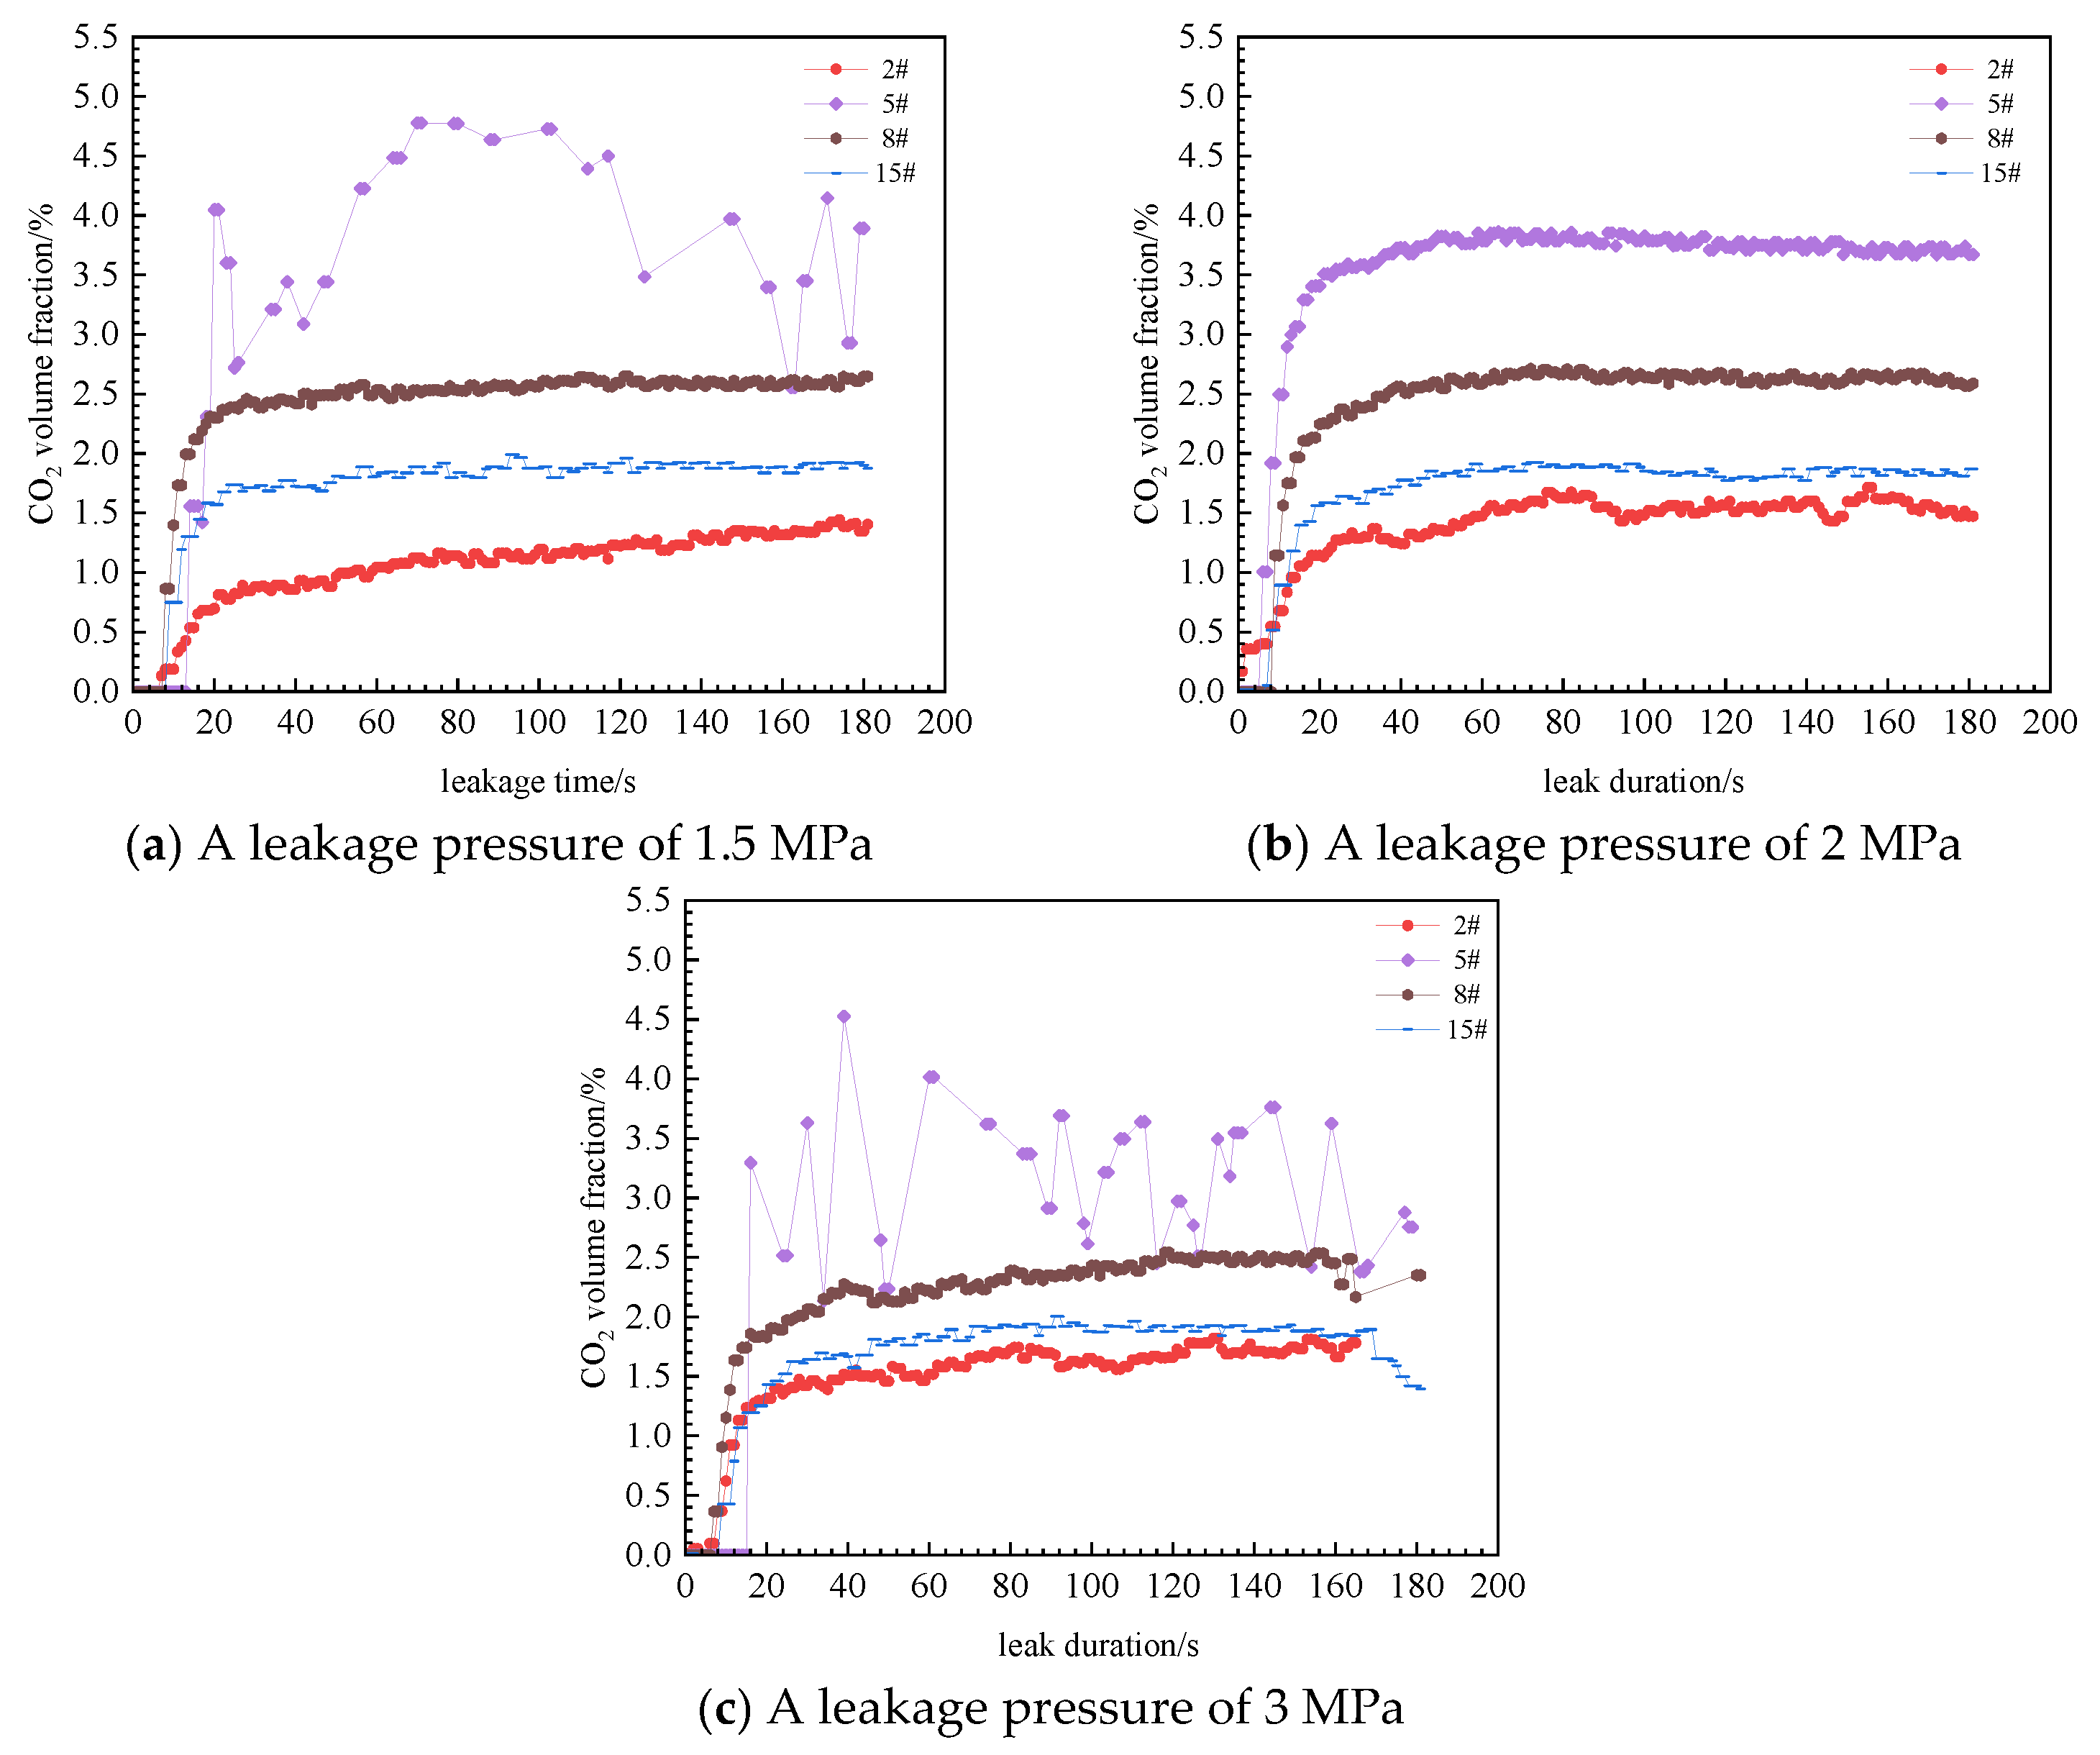
As shown in Figure 4, as the leakage pressure increases, the reading of concentration sensor No. 2 decreases. This behavior can be attributed to the strong influence of the near-field jet. When the leakage pressure is low, the jet intensity after the CO2 leakage is weak, and the near-field CO2 concentration will increase; when the leakage pressure increases, the jet intensity after the CO2 leakage increases, and the near-field CO2 concentration decreases.
Figure 4.
Effect of initial pressure on the change of concentration.
When the leakage pressure increased from 1.5 MPa to 3 MPa, the reading of concentration sensor No. 5 gradually rose. This is mainly because sensor No. 5 is located farther from the leakage orifice, where jet momentum has significantly decayed. The heavy gas nature of CO2 caused it to settle towards the deck surface. Moreover, as the leakage pressure increased, the leakage volume also increased. On the other hand, there were many equipment and buildings near sensor No. 5, which hindered the dispersion of CO2 and led to the accumulation of CO2.
When the leakage pressure increases from 1.5 MPa to 2 MPa, the reading of concentration sensor No. 8 is increasing. When the leakage pressure increases from 2 MPa to 3 MPa, the reading of sensor No. 8 shows a gradually increasing trend overall. As the leakage pressure increases, the reading of concentration sensor No. 15 can be considered unaffected because sensor No. 15 is located behind a large building, and CO2 cannot pass through and disperse backward, but instead accumulates here and spreads to both sides. Under any leakage pressure condition, the highest CO2 concentration point is not near the leakage port but at a certain distance from the leakage port. And the readings of the four concentration sensors follow the pattern: sensor No. 5 > sensor No. 8 > sensor No. 15 > sensor No. 2. The reading of sensor No. 2 closest to the leakage port is the lowest, indicating that the near-field jet of CO2 will affect the CO2 concentration distribution in the near field. As the distance increases, the jet intensity weakens, and the influence of gravity on the dispersion of CO2 begins to gradually increase.
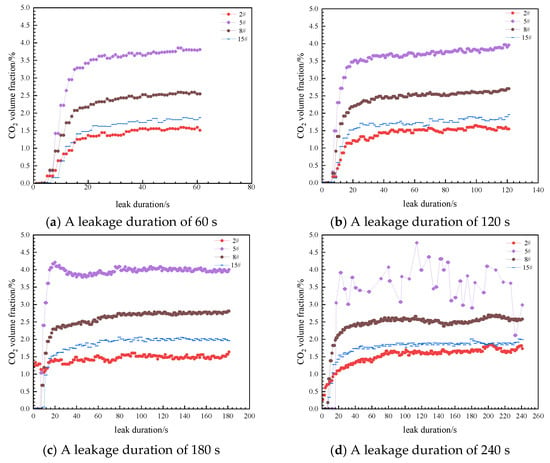
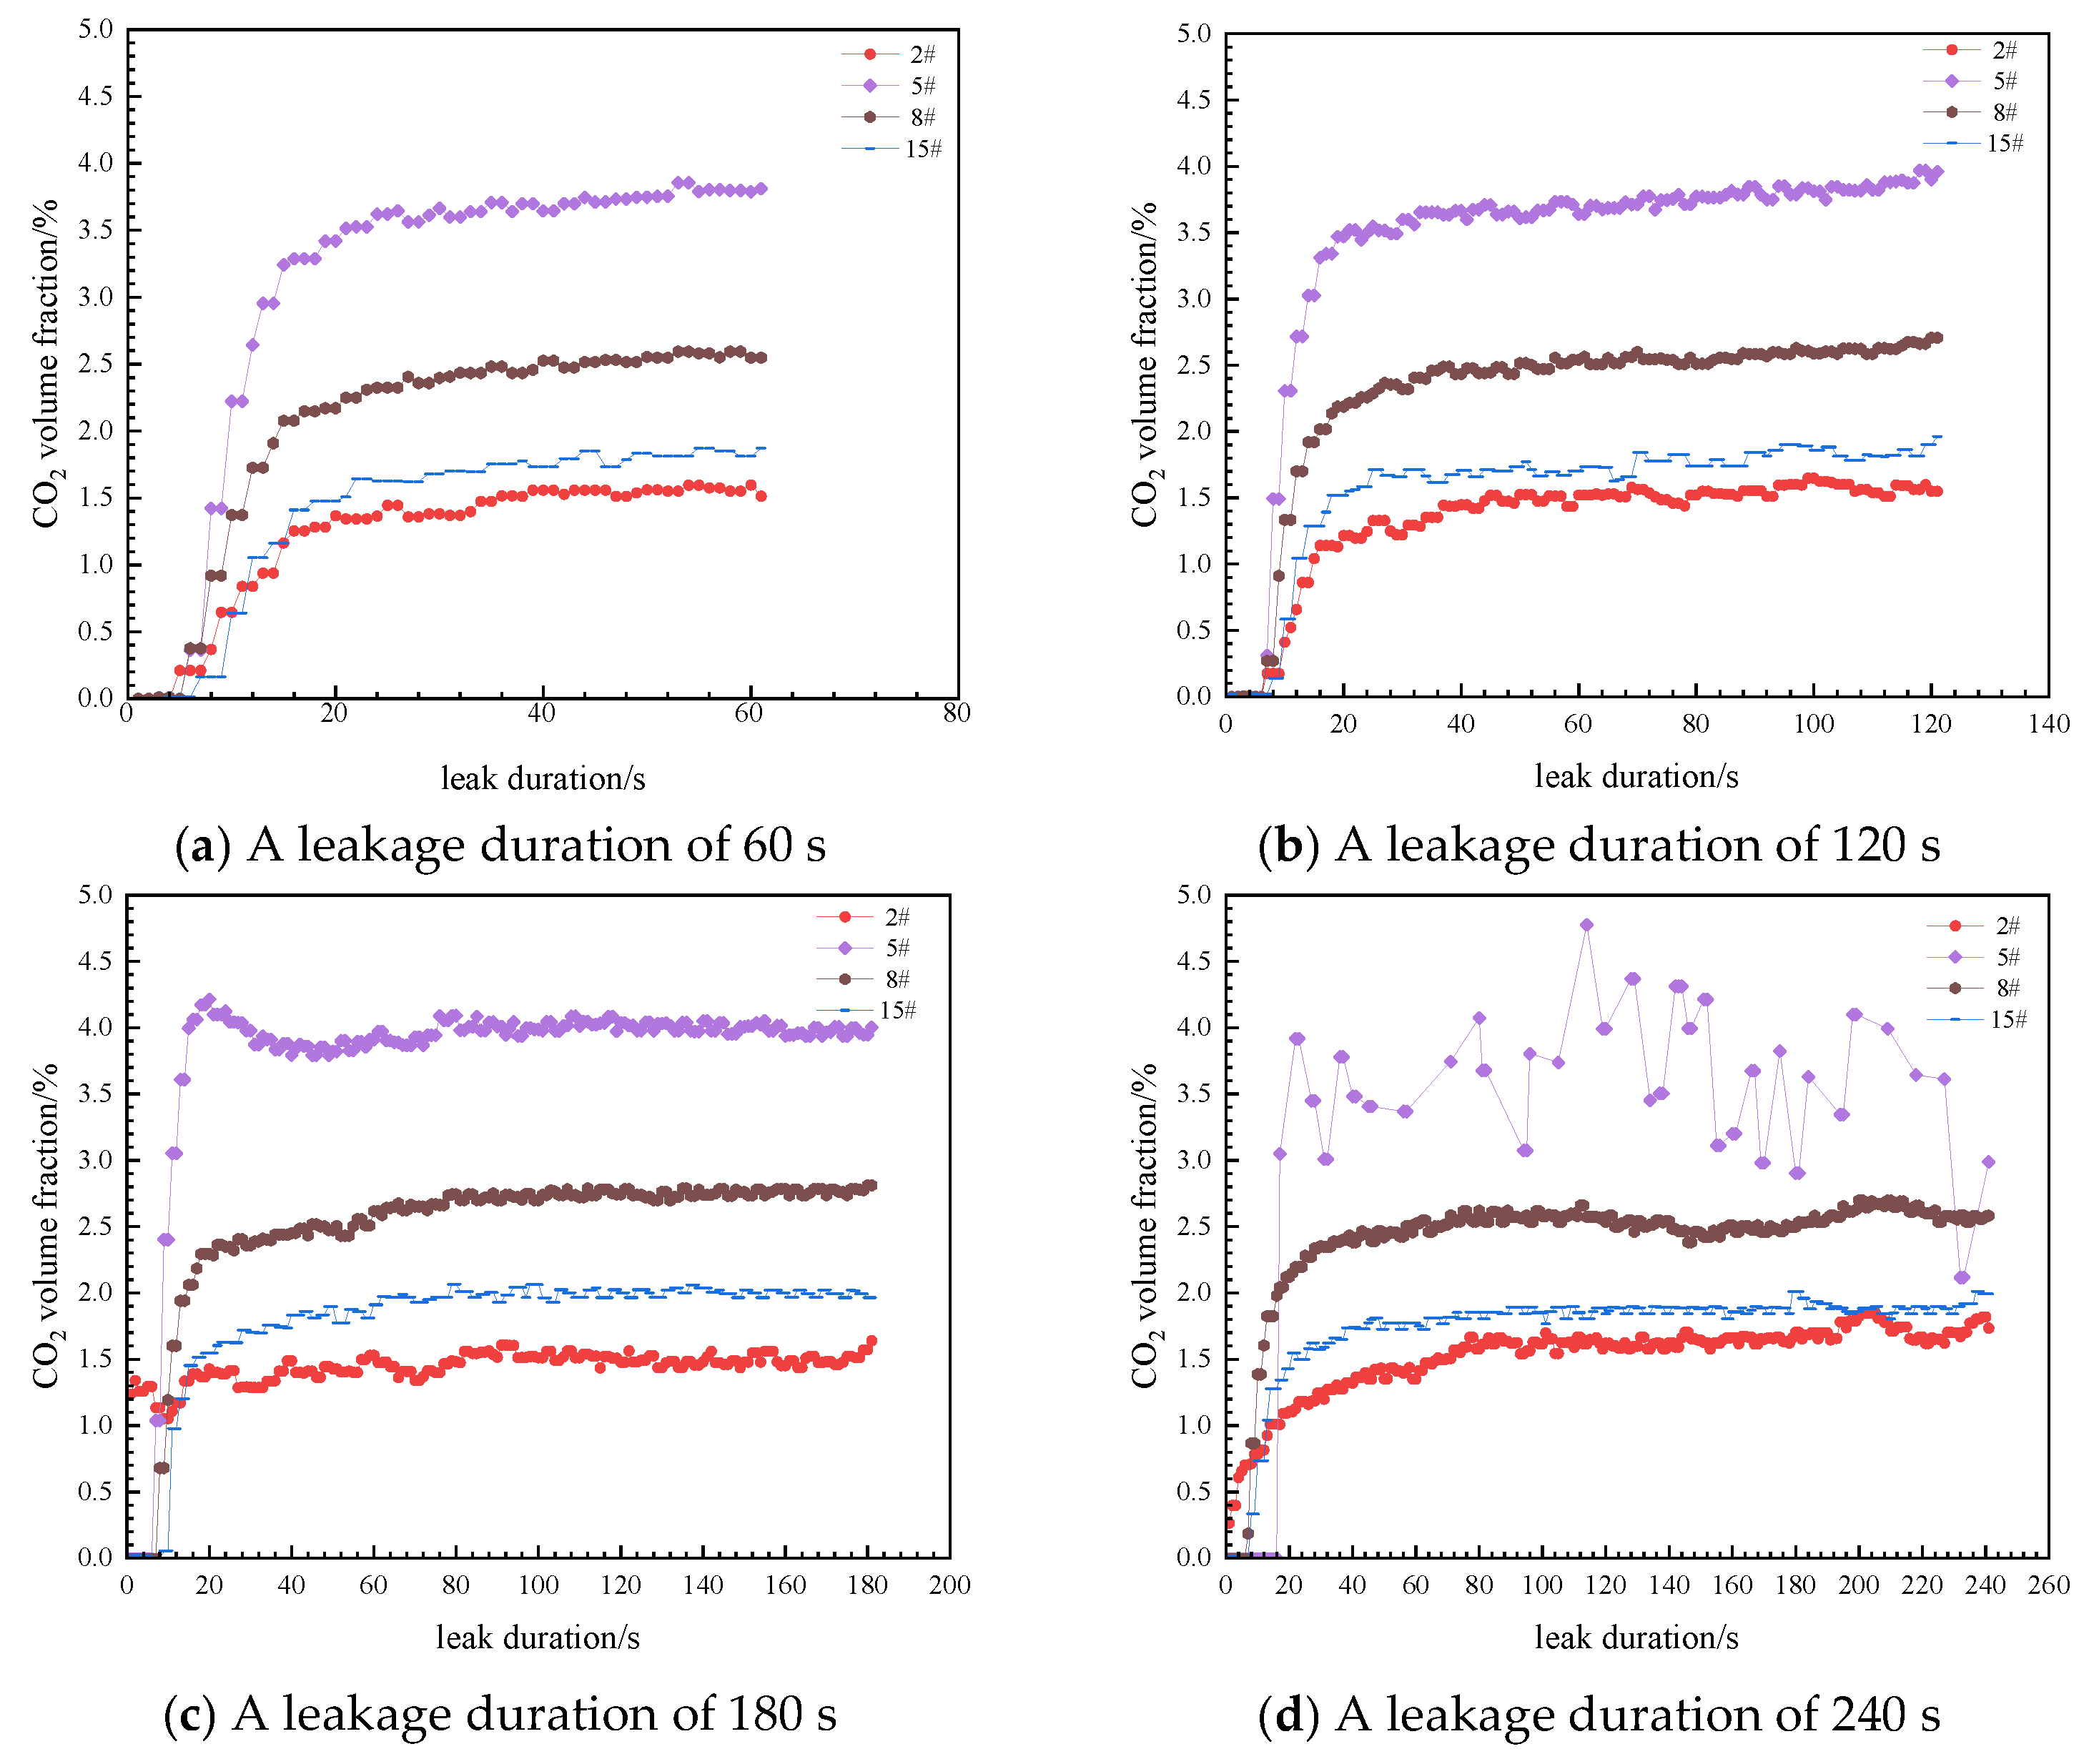
Further analysis was conducted to investigate the influence patterns of different leakage duration on the changes in CO2 concentration. In the experimental process, the leakage durations selected were 1 min, 2 min, 3 min, and 4 min. Other experimental conditions were as follows: the leakage direction was horizontal, the leakage diameter was 6.2 mm, the ambient wind speed was 0 m/s, and the leakage pressure was 2 MPa.
As shown in Figure 5, with the increase in leakage duration, the readings of concentration sensors No. 2, No. 5, No. 8, and No. 15 did not show significant changes. The readings of each concentration sensor remained stable within a certain concentration range. Therefore, under the experimental conditions, the leakage duration had a weak impact on the CO2 concentration at different axial positions of the leakage outlet. Additionally, when the leakage began, the CO2 concentration at different axial positions of the leakage outlet rapidly increased within approximately 20 s, and then the concentration stabilized within a certain concentration range. This concentration range did not change with the increase in leakage time and remained stable all the time.
Figure 5.
Effect of leakage duration on concentration distribution.
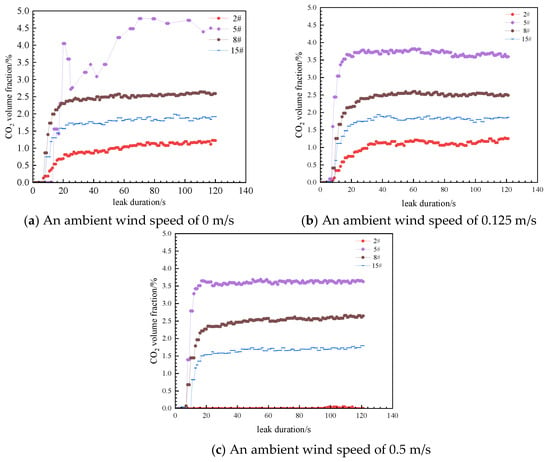
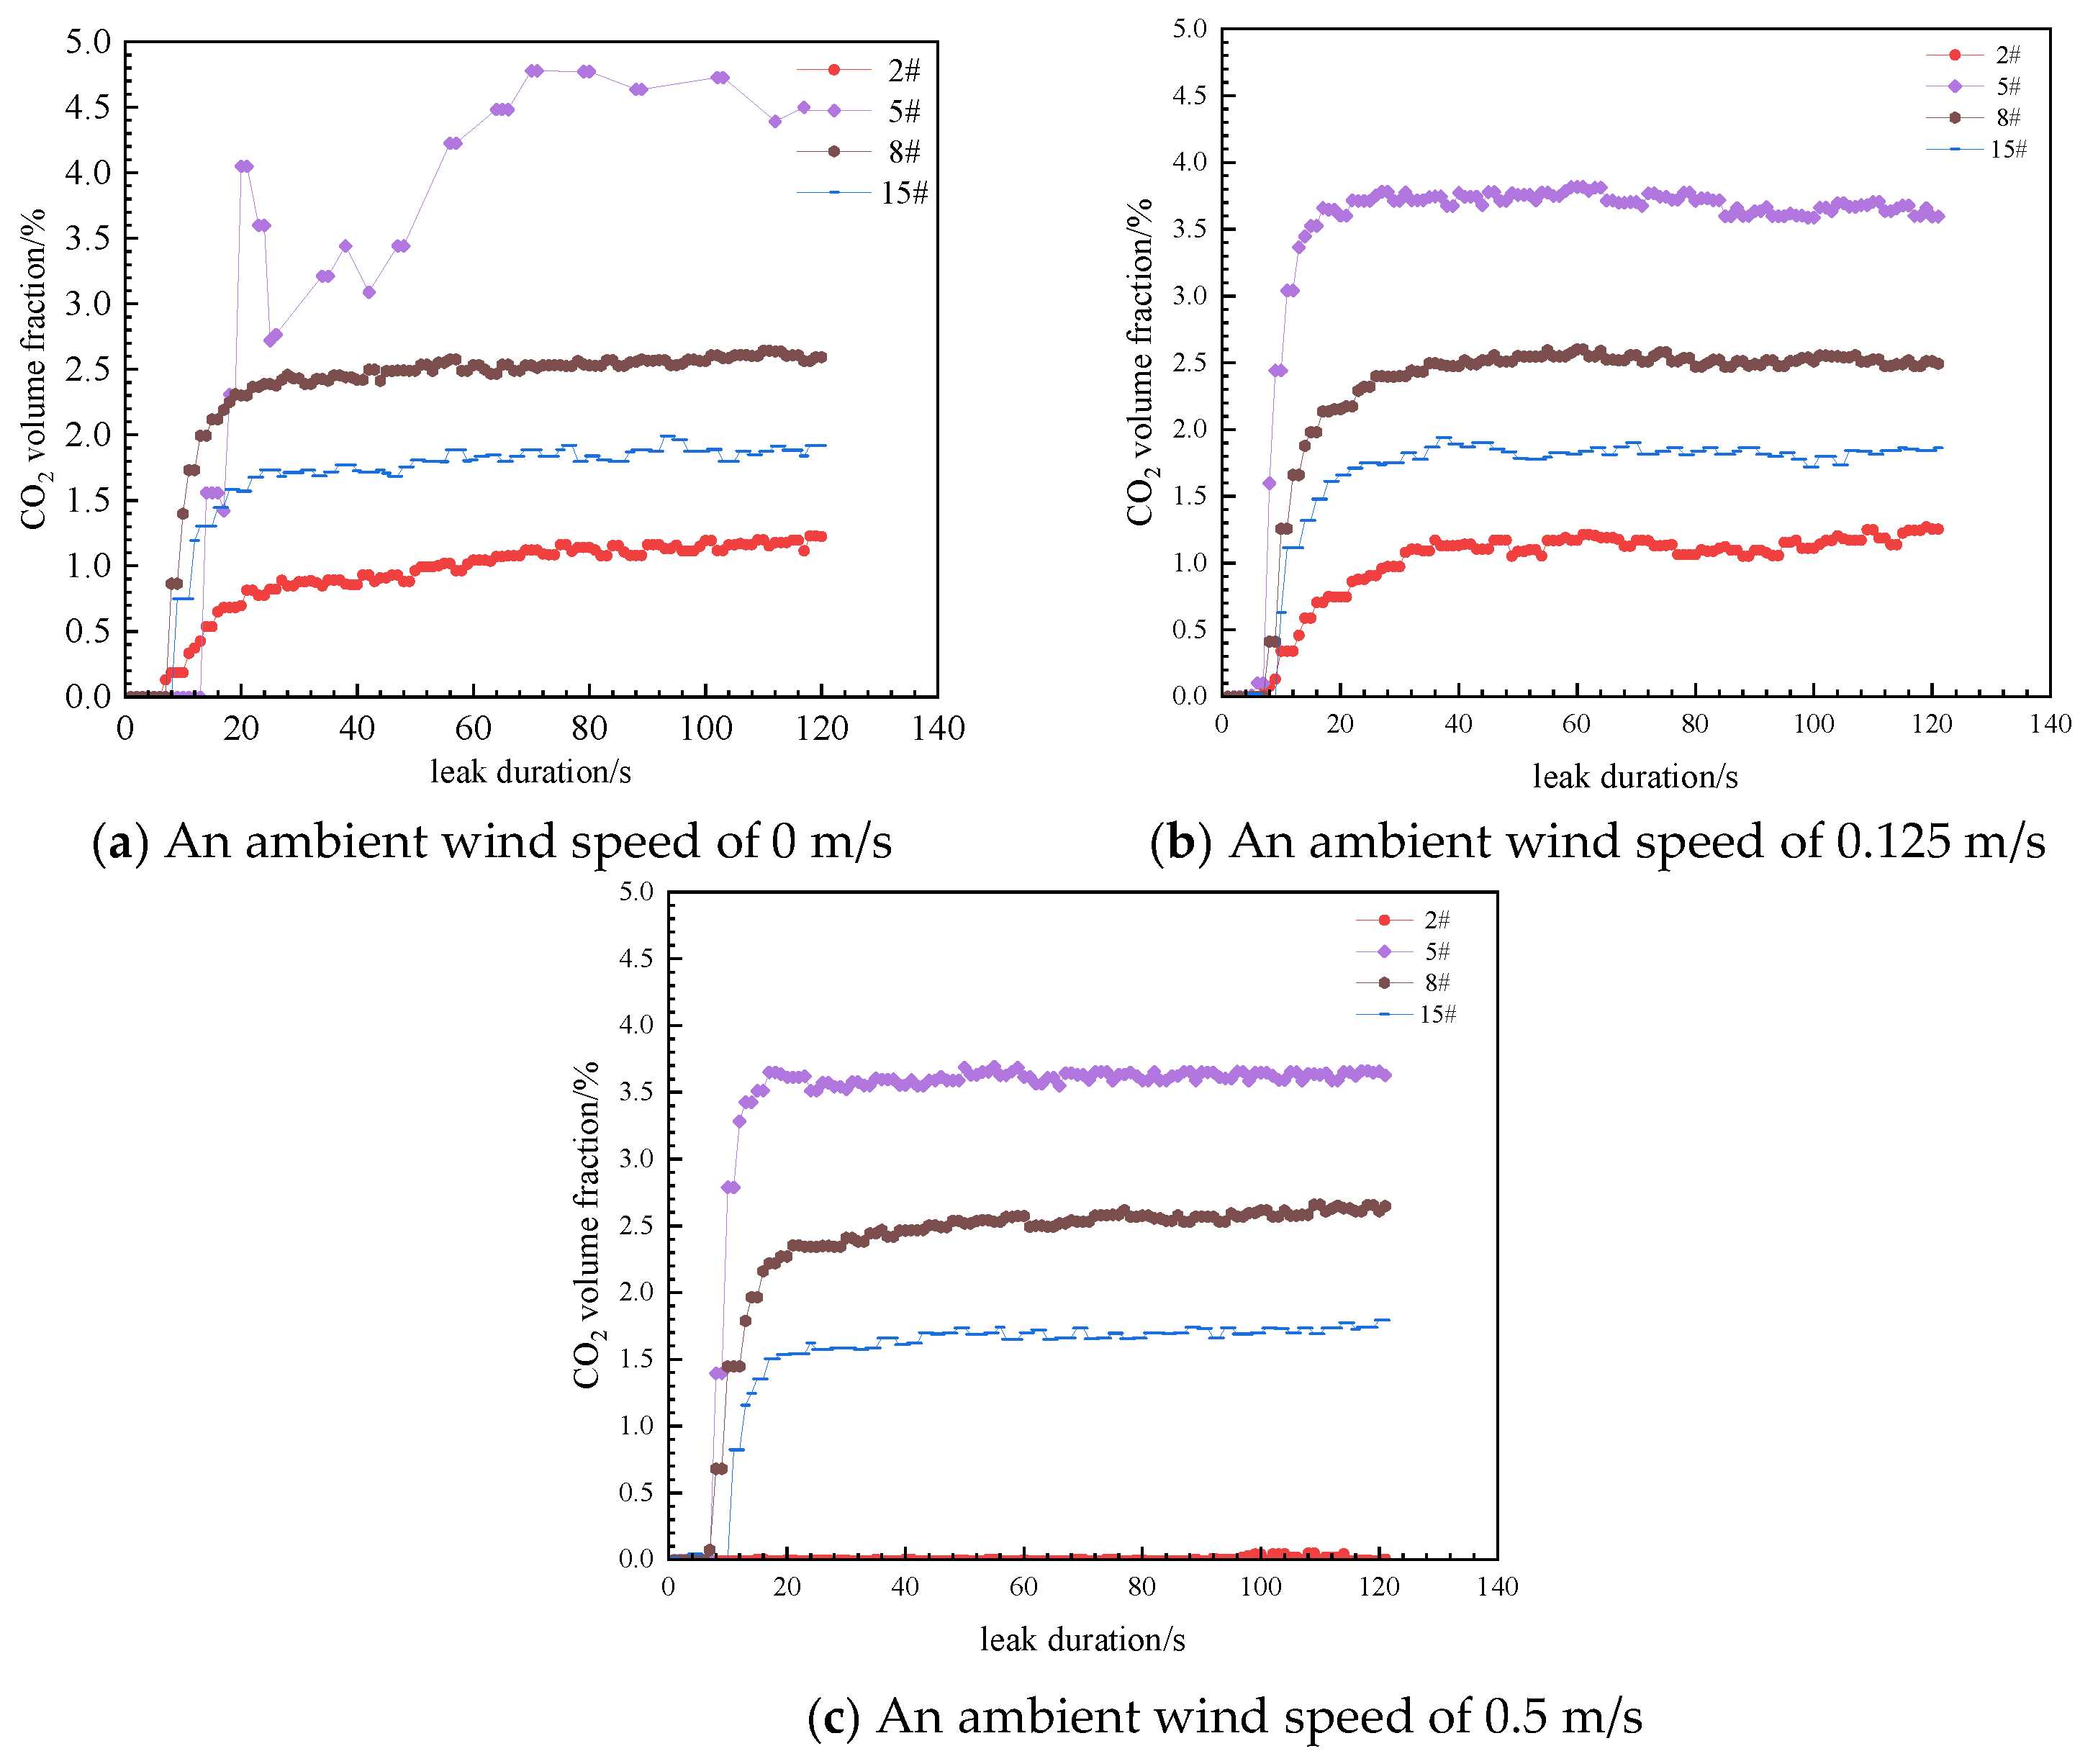
Further analysis was conducted to investigate the influence patterns of different environmental wind speeds on the changes in CO2 concentration. In the experimental process, the ambient wind speeds of 0 m/s, 0.125 m/s, and 0.5 m/s were selected. Other experimental conditions included a horizontal leakage direction, a leakage diameter of 6.2 mm, a leakage duration of 2 min, and a leakage pressure of 3 MPa.
From Figure 6, it can be seen that the reading of concentration sensor No. 2 remains stable at around 1.14%; when the ambient wind speed is 0.125 m/s, the average reading of sensor No. 2 stabilizes at 1.14%; when the ambient wind speed increases to 0.5 m/s, the reading of sensor No. 2 is approximately 0. The analysis suggests that an increase in ambient wind speed significantly affects the near-field CO2 concentration. When the ambient wind speed is 0 m/s, the reading of sensor No. 5 is 3.73%. When the ambient wind speed is 0.125 m/s or 0.5 m/s, the reading of sensor No. 5 is 3.60%. The analysis indicates that wind speed does, to some extent, affect the accumulation of CO2 in buildings. When the ambient wind speed increases from 0 to 0.125 m/s, the reading of sensor No. 8 does not change because the numerical value of the ambient wind speed is small, and the building structure near sensor No. 8 reduces the influence of the small wind speed on the dispersion of CO2. When the ambient wind speed increases to 0.5 m/s, the reading of sensor No. 8 increases, but the change is not significant, only increasing by 0.08%. The analysis suggests that the further increase in wind speed will affect the dispersion of CO2. As the ambient wind speed increases, the reading of sensor No. 15 first increases and then decreases. This is because sensor No. 15 is located behind a large building, and most CO2 molecules cannot cross the building to disperse forward, resulting in accumulation and dispersion to both sides. At a wind speed of 0.125 m/s, it is more conducive to the accumulation of CO2 gas here, and at a wind speed of 0.5 m/s, it is more conducive to the dispersion of CO2 gas to both sides.
Figure 6.
Effect of wind speed on concentration distribution.
The increase in ambient wind speed significantly affects the near-field CO2 concentration but has a minor impact on the far-field CO2 concentration. The analysis suggests that the buildings and equipment facilities on the offshore platform will block the wind, reducing the influence of the ambient wind speed on the distribution of CO2 concentration.
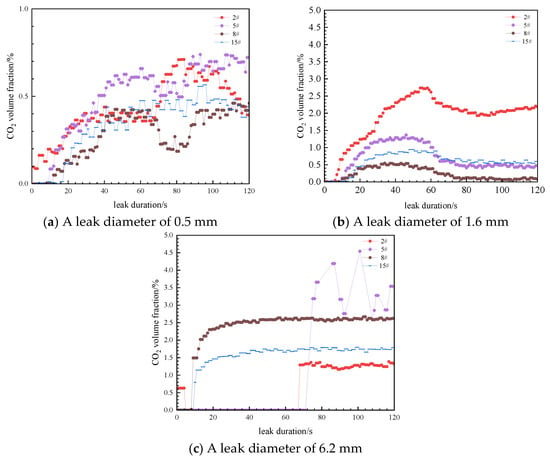
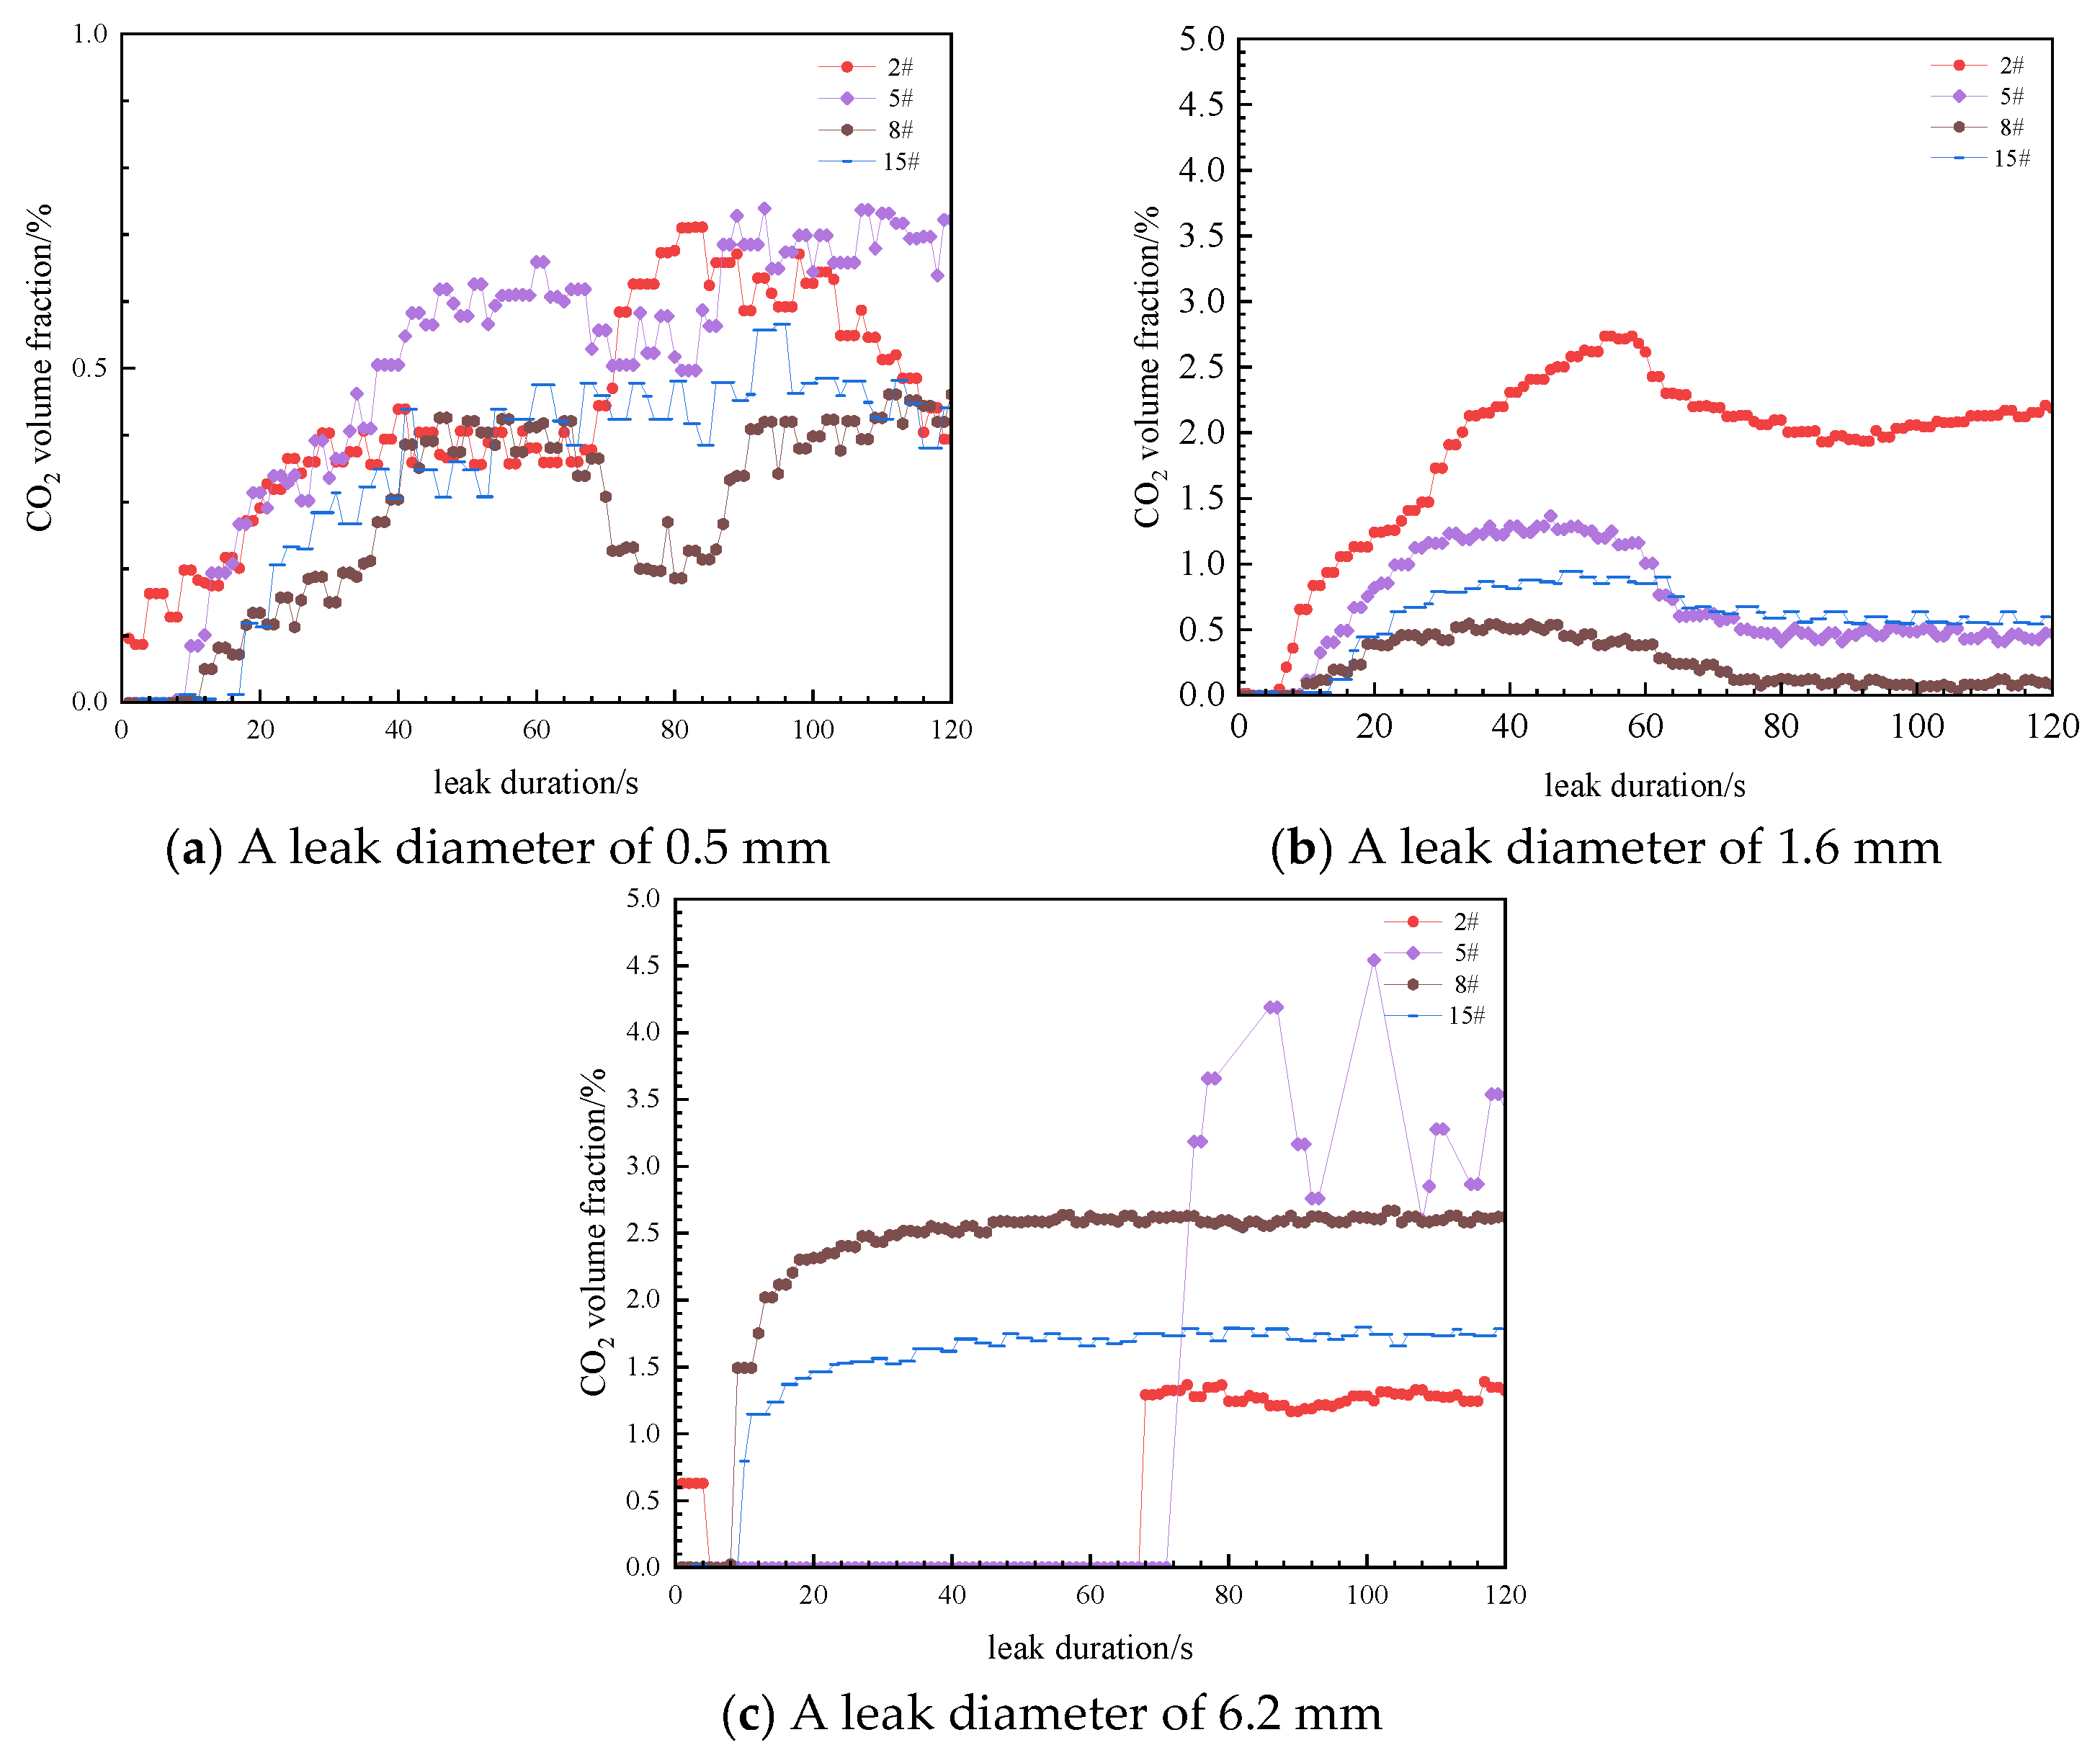
As shown in Figure 7, when the leakage diameter increases from 0.5 mm to 1.6 mm, the reading of sensor No. 2 significantly increases from 0.72% to 2.96%. This is because the increase in the leakage diameter has a negligible effect on the intensity and distance of the near-field CO2 jet, but the increase in leakage volume leads to an increase in the CO2 concentration at sensor No. 2. When the diameter continues to increase to 6.2 mm, the reading significantly decreases to 1.37%. This is because the intensity and distance of the jet increase significantly, causing the CO2 concentration at the closer location near the leakage outlet to decrease. When the leakage diameter is 0.5 mm and 1.6 mm, the readings of sensors No. 5, No. 8, and No. 15 are very low, but when the leakage diameter is 6.2 mm, the readings of No. 5, No. 8, and No. 15 significantly increase. The analysis suggests that when the intensity and distance of the CO2 jet after leakage increase, the far-field CO2 concentration significantly increases.
Figure 7.
Effect of leakage orifice diameter on concentration distribution.
The leakage diameter significantly affects the distribution pattern of the axial CO2 concentration at the leakage outlet. However, when the horizontal leakage occurs and the leakage diameter is 6.2 mm, the readings of the four concentration sensors maintain the following pattern under any experimental condition: sensor No. 5 > No. 8 > No. 15 > No. 2. However, when the leakage diameter is 0.5 mm and 1.6 mm, there is no obvious pattern in the size of the readings of the four concentration sensors.
Finally, the influence of the leakage direction on the concentration change pattern is analyzed.
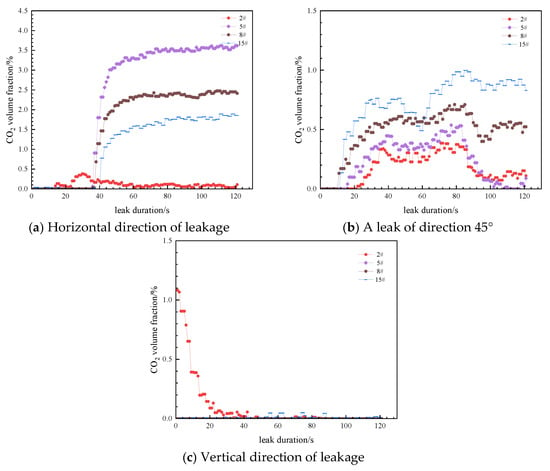
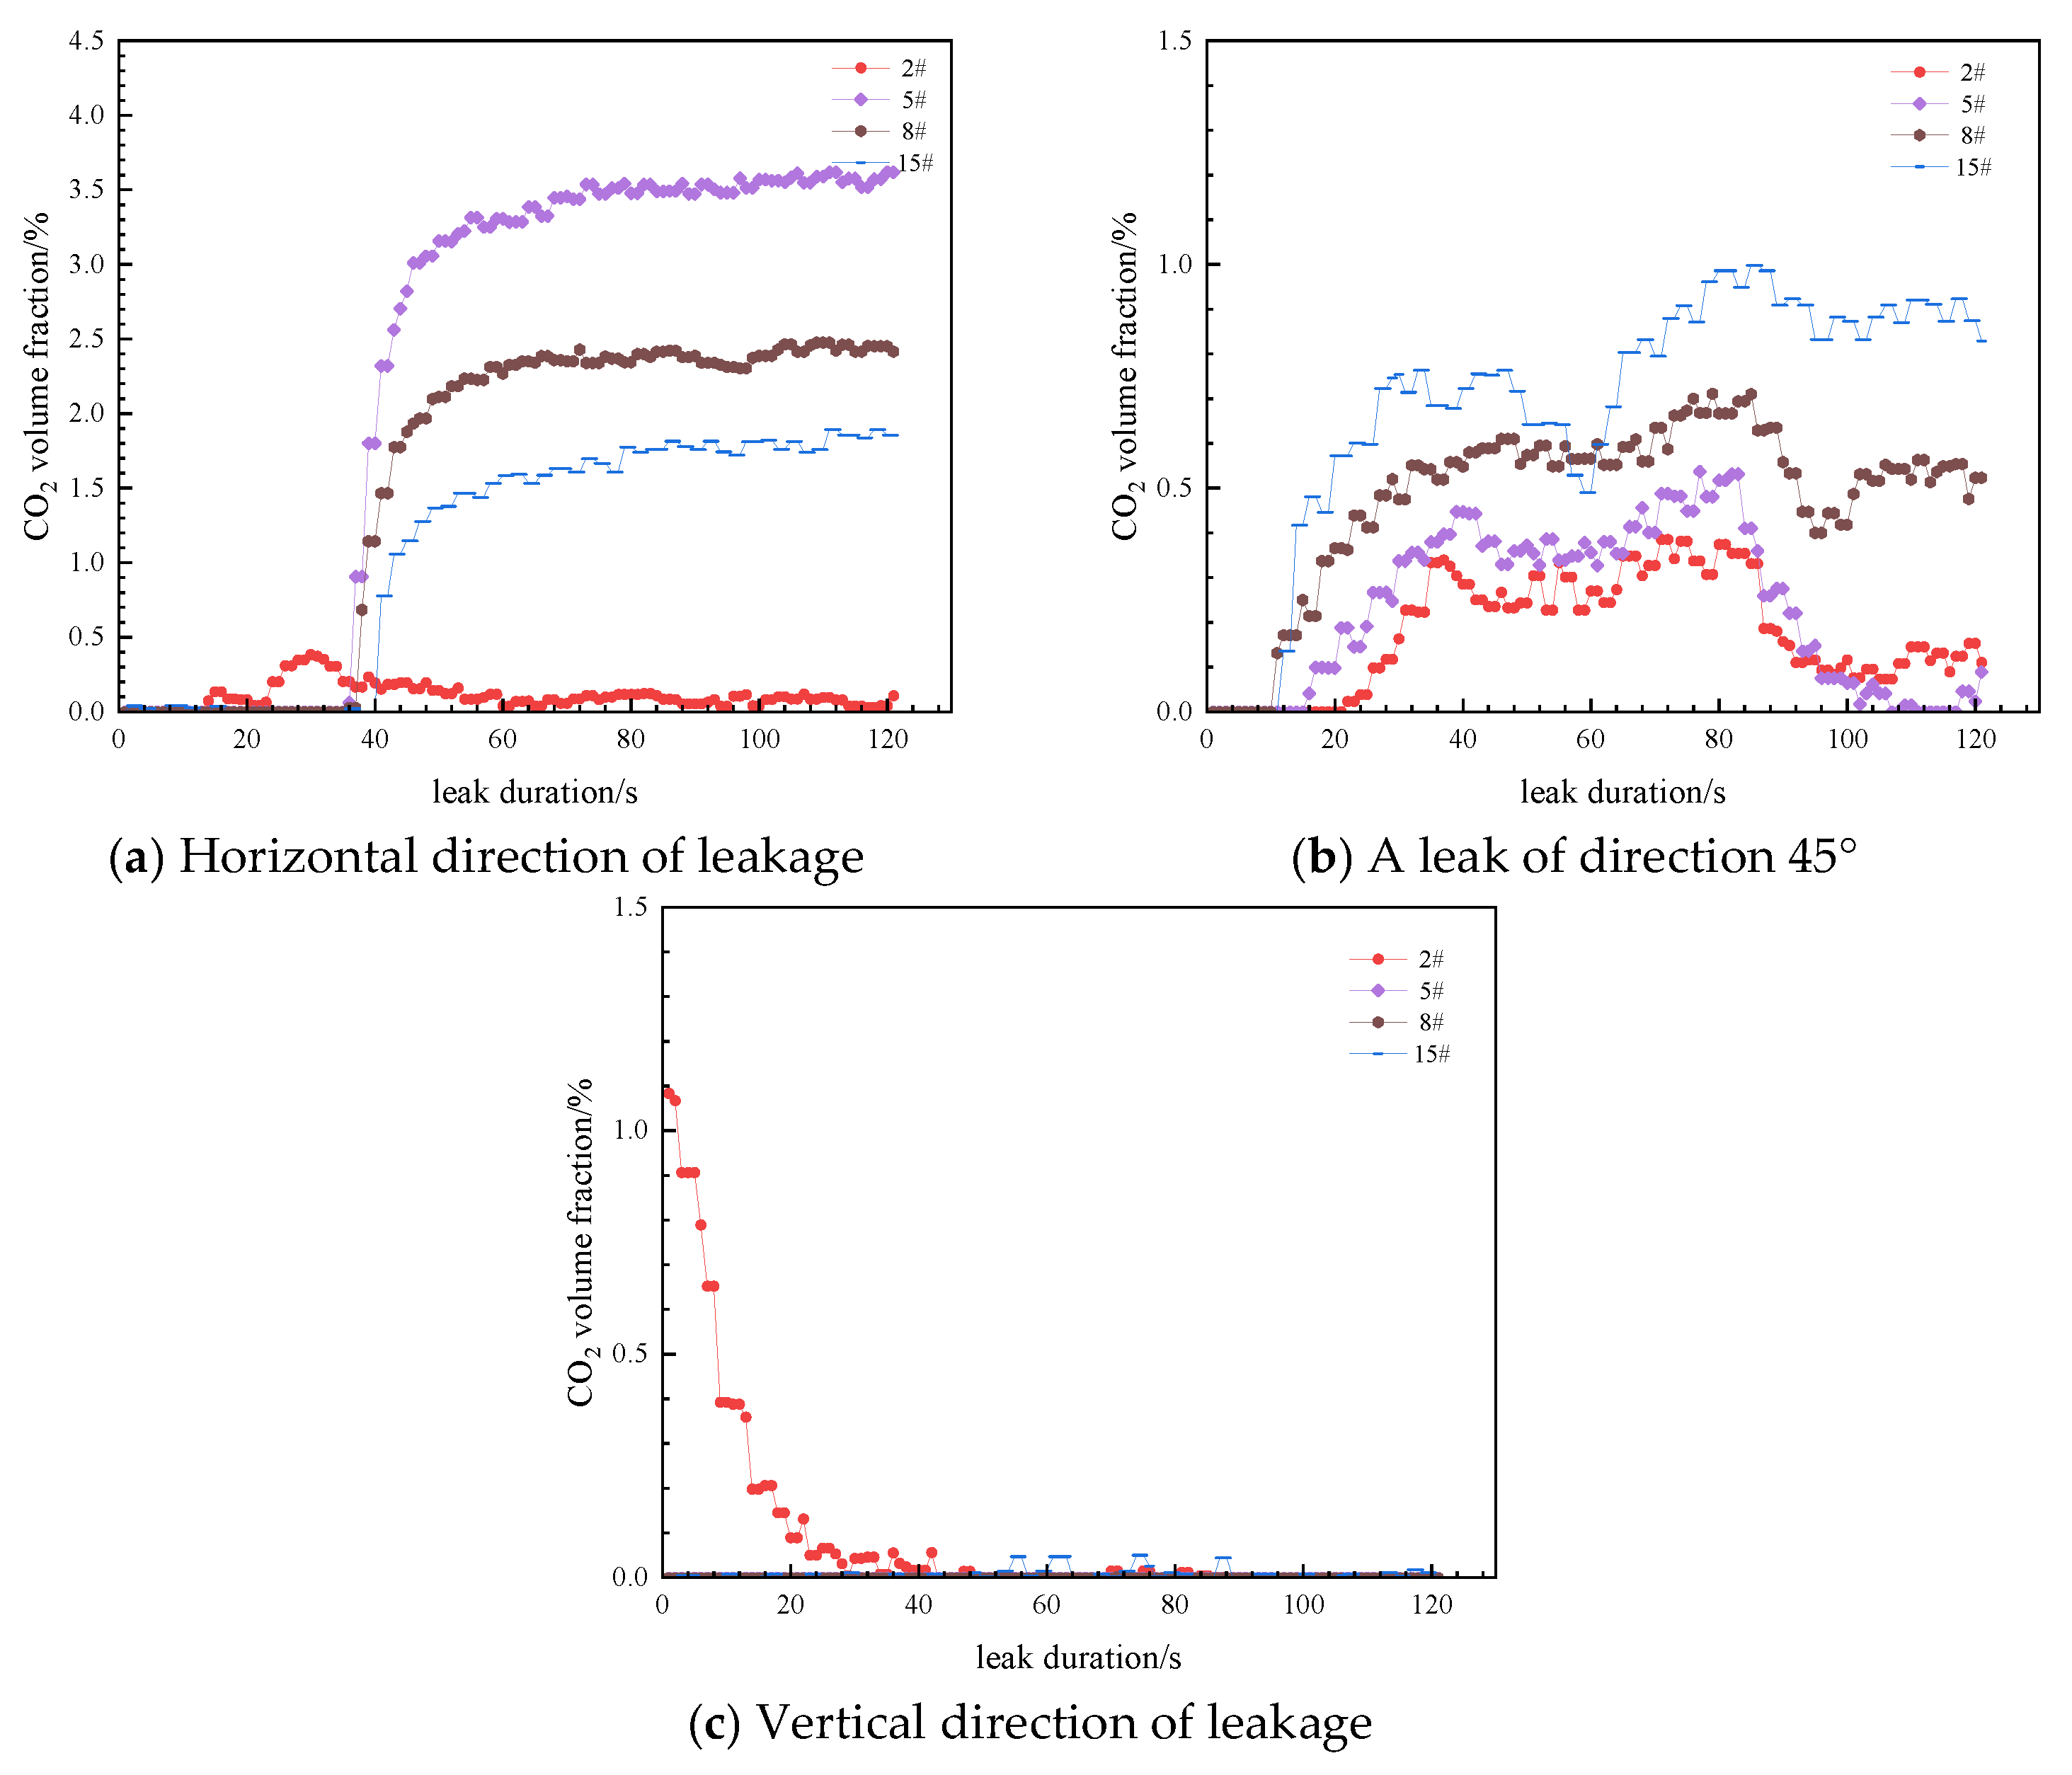
When the leakage direction is vertical, the readings of all concentration sensors stabilize at approximately 0.00%, with CO2 concentration being detectable only at the leakage outlet itself and rapidly decreasing to zero, demonstrating that the change in leakage direction significantly affects the axial CO2 concentration distribution. This is because after CO2 leakage, it shoots upward, is diluted by the air, and then spreads with the air, resulting in less CO2 settling downward. At the same time, the structure of the offshore platform limits the dispersion of CO2. Once CO2 disperses on the roof of the building, it will no longer settle downward onto the deck of the offshore platform.
From the previous analysis, it can be seen that when the leakage diameter is 6.2 mm and the leakage direction is horizontal, the readings of the various concentration sensors follow the pattern as follows: sensor No. 5 > No. 8 > No. 15 > No. 2. This pattern still applies here. However, when the leakage direction is at a 45° upward, the readings of the concentration sensors follow the pattern as follows: sensors No. 15 > No. 8 > No. 5 > No. 2. This is because the end of the jet has an initial velocity in a 45° downward direction, which increases the dispersion distance of CO2 in the horizontal direction. At the same time, sensor No. 15 is located behind a large building, preventing CO2 from dispersing backward over the building and instead causing it to accumulate and sink downward here (see Figure 8).
Figure 8.
Effect of leakage direction on concentration distribution.
4. Limitations
The present study has several limitations: the experiments were conducted using a scaled-down platform model (scale ratio of 16:1) that does not fully replicate the actual marine environment; dynamic factors such as waves and ocean currents were not considered; and the limited number of sensors may compromise the spatial resolution of the concentration data. To address these issues, our future improvement plans include constructing a full-scale experimental platform, introducing a marine environment simulation system that incorporates waves and currents, and deploying a multi-dimensional sensor array with higher measurement density to enhance data accuracy and spatial coverage.
5. Conclusions
Leakage pressure mainly affects near-field jet behavior, with limited impact on far-field dispersion; as pressure increases, the reading of sensor No. 15 (located behind a large building) remains unaffected, and the highest CO2 concentration is not at the orifice but at a certain distance downstream, with sensor readings as follows: sensor No. 5 > No. 8 > No. 15 > No. 2.
Leakage duration has little effect on the stable CO2 concentration, as the concentration quickly reaches a steady state after leakage onset.
Ambient wind speed significantly influences near-field concentration, but due to the shielding effect of buildings, its impact on far-field concentration is limited.
Leakage hole diameter strongly affects both near- and far-field concentration by altering the jet structure and release rate; a larger diameter notably increases far-field concentration.
Leakage direction significantly influences dispersion behavior: vertical leakage results in all sensor readings being near zero; horizontal leakage gives the highest cumulative risk on the platform deck, with sensor readings follow the order of sensor No. 5 > No. 8 > No. 15 > No. 2; for upward 45° leakage, the jet has a downward 45° initial velocity at the end, increasing horizontal dispersion distance, and readings follow the order of sensor No. 15 > No. 8 > No. 5 > No. 2, as sensor No. 15 is behind a large building where CO2 accumulates and sinks downward.
Author Contributions
Conceptualization, T.L.; Methodology, T.L., Y.L. and G.S.; Software, H.H.; Investigation, T.L. and R.J.; Resources, Y.L. and G.S.; Writing—original draft, T.L.; Writing—review & editing, Y.L., Y.W., G.S., H.H., R.J., Z.L., Y.C. and S.A.; Supervision, H.H. and Y.C.; Funding acquisition, Y.L. All authors have read and agreed to the published version of the manuscript.
Funding
This study was supported by the National Science and Technology Major Project in China (No.2024ZD1406604). This study was supported by the CNOOC Major Science and Technology Project New Energy Development and CCUS Key Technologies (KJGG202212CCUS0105).
Data Availability Statement
The original contributions presented in this study are included in the article. Further inquiries can be directed to the corresponding author.
Conflicts of Interest
Authors Tao Liu, Yanzun Li and Yang Cao were employed by the company CNOOC Research Institute Co., Ltd., and Beijing Research Center of CNOOC Co., Ltd. The remaining authors declare that the research was conducted in the absence of any commercial or financial relationships that could be construed as potential conflicts of interest.
References
- Chen, J.; Feng, Y.; Zhang, Z.; Wang, Q.; Ma, F. Exploring the patterns of China’s carbon neutrality policies. J. Environ. Manag. 2024, 371, 123092. [Google Scholar]
- Zou, C.; Zhang, C.; Cheng, J.; Lyu, W.; Jin, X.; Gao, M.; Wu, S.; Yu, H.; Yu, H.; Yang, Z.; et al. Advances, challenges, and prospects of carbon dioxide capture, utilization, and storage technologies for carbon neutrality. Pet. Explor. Dev. 2025, 52, 1664–1684. [Google Scholar] [CrossRef] [Scilit]
- Xu, R.; Wang, S.; Guo, P.; Hukuang, H.; Yuan, N. Multi-Scale Investigation of CO2-WAG Injection Mechanisms in Water-Sensitive Tight Oil Reservoirs. Arab. J. Sci. Eng. 2025, 50, 10327–10344. [Google Scholar]
- Yuan, N.; Wang, S.; Yu, Y.; Chen, C.; Shiau, B.-J.; Harwell, J.H. Expanded Salinity Window of Middle-Phase Microemulsions and Reduced Surfactant Adsorption by Hydrotrope. Langmuir 2023, 39, 17175–17189. [Google Scholar] [CrossRef] [Scilit] [PubMed]
- Shang, Y.; Chen, X.; Yang, M.; Xing, X.; Jiao, J.; An, G.; Li, X.; Xiong, X. Comprehensive Review on Leakage Characteristics and Diffusion Laws of Carbon Dioxide Pipelines. Energy Fuels 2024, 38, 10456–10493. [Google Scholar] [CrossRef] [Scilit]
- Kim, Y.-H.; Park, Y.-G. A Review of CO2 Plume Dispersion Modeling for Application to Offshore Carbon Capture and Storage. J. Mar. Sci. Eng. 2023, 12, 38. [Google Scholar] [CrossRef] [Scilit]
- Gao, L.; Wang, J.; Wu, S.; Liu, X.; Zhu, B.; Fan, Y. Study on Leakage and Diffusion Behavior of Liquid CO2 Vessel in CCES. Energies 2024, 17, 3613. [Google Scholar] [CrossRef] [Scilit]
- Lu, H.; Ma, X.; Huang, K.; Fu, L.; Azimi, M. Carbon dioxide transport via pipelines: A systematic review. J. Clean. Prod. 2020, 266, 121994. [Google Scholar] [CrossRef] [Scilit]
- Guo, X.; Yan, X.; Yu, J.; Zhang, Y.; Chen, S.; Mahgerefteh, H.; Martynov, S.; Collard, A.; Proust, C. Under-expanded jets and dispersion in supercritical CO2 releases from a large-scale pipeline. Appl. Energy 2016, 183, 1279–1291. [Google Scholar]
- Guo, X.; Yan, X.; Zheng, Y.; Yu, J.; Zhang, Y.; Chen, S.; Chen, L.; Mahgerefteh, H.; Martynov, S.; Collard, A.; et al. Under-expanded jets and dispersion in high pressure CO2 releases from an industrial scale pipeline. Energy 2017, 119, 53–66. [Google Scholar] [CrossRef] [Scilit]
- Gant, S.E.; Narasimhamurthy, V.D.; Skjold, T.; Jamois, D.; Proust, C. Evaluation of multi-phase atmospheric dispersion models for application to Carbon Capture and Storage. J. Loss Prev. Process Ind. 2014, 32, 286–298. [Google Scholar] [CrossRef] [Scilit]
- Witlox, H.W.M.; Harper, M.; Oke, A.; Stene, J. Phast validation of discharge and atmospheric dispersion for pressurised carbon dioxide releases. J. Loss Prev. Process Ind. 2014, 30, 243–255. [Google Scholar] [CrossRef] [Scilit]
- Brown, J.; Holt, H.; Helle, K. Large Scale CO2 Releases for Dispersion Model and Safety Study Validation. Energy Procedia 2014, 63, 2542–2546. [Google Scholar] [CrossRef] [Scilit]
- Xie, Q.; Tu, R.; Jiang, X.; Li, K.; Zhou, X. The leakage behavior of supercritical CO2 flow in an experimental pipeline system. Appl. Energy 2014, 130, 574–580. [Google Scholar] [CrossRef] [Scilit]
- Molag, M.; Dam, C. Modelling of accidental releases from a high pressure CO2 pipelines. Energy Procedia 2011, 4, 2301–2307. [Google Scholar] [CrossRef] [Scilit]
- Liu, X.; Godbole, A.; Lu, C.; Michal, G.; Venton, P. Study of the consequences of CO2 released from high-pressure pipelines. Atmos. Environ. 2015, 116, 51–64. [Google Scholar] [CrossRef] [Scilit]
- Zhang, Z.; Lu, Z.; Yan, L.; Wang, J.; Yao, S. Experiment and numerical investigation on flow characteristics and near-field structure of dense phase CO2 pipeline leakage. Process Saf. Environ. Prot. 2024, 182, 327–344. [Google Scholar]
- Hu, Q.; Zhang, H.; Zhao, X.; Meng, L.; Li, Y.; Zhang, L.; Zhu, J.; Wang, W. Carbon dioxide pipeline leakage risk assessment based on pipeline failure probability correction and CO2 concentration dispersion distance prediction. J. Pipeline Sci. Eng. 2026, 6, 100293. [Google Scholar] [CrossRef] [Scilit]
- Guo, X.; Yan, X.; Yu, J.; Zhang, Y.; Chen, S.; Mahgerefteh, H.; Martynov, S.; Collard, A.; Proust, C. Pressure response and phase transition in supercritical CO2 releases from a large-scale pipeline. Appl. Energy 2016, 178, 189–197. [Google Scholar] [CrossRef] [Scilit]
- Shao, Y.; You, W.; Zhao, S.; Cao, X.; Bian, J.; Nan, Z. Far-Field Behavior of Supercritical CO2 Being Dispersed Due to Leakage from Pipelines. Fluid Dyn. Mater. Process. 2024, 20, 2867–2885. [Google Scholar] [CrossRef] [Scilit]
- Teng, L.; Li, Y.; Hu, Q.; Zhang, D.; Ye, X.; Gu, S.; Wang, C. Experimental study of near-field structure and thermo-hydraulics of supercritical CO2 releases. Energy 2018, 157, 806–814. [Google Scholar]
- Cao, Y.; Liu, T.; Song, G.; Zhou, W.; Han, H.; Li, Y.; Hu, Q.; Jing, R. Investigation of Pipeline CO2 Leakage and Diffusion on Offshore Platforms Based on Numerical Simulation. ACS Omega 2024, 9, 27537–27548. [Google Scholar] [CrossRef] [Scilit] [PubMed]
- Joubert, L.; Leroy, G.; Claude, T.; Riahi, O. Experimental Campaign of Massive CO2 Atmospheric Releases in an Urban Area. Atmosphere 2023, 14, 1428. [Google Scholar] [CrossRef] [Scilit]
- Li, X.; Li, F.; Chen, J.; Wang, Z.; Wang, D.; Ran, Y. Research on Carbon Dioxide Pipeline Leakage Localization Based on Gaussian Plume Model. Processes 2025, 13, 2994. [Google Scholar] [CrossRef] [Scilit]
- Hu, Y.; Chen, L.; Cao, Z.; Yu, S.; Yan, X.; Chen, S.; Yu, J. Investigation of scaling-down experiments for accidental CO2 leakage dispersion risks in constant-pressure transportation pipelines within the CCUS process. Process Saf. Environ. Prot. 2024, 190, 746–759. [Google Scholar]
- Liu, Y.; Liu, G.; Khan, F.; Rahmani, N.H.; Pistikopoulos, E.N. A holistic modeling framework to analyze subsea CO2 release. Chem. Eng. J. 2025, 518, 164503. [Google Scholar] [CrossRef] [Scilit]

Disclaimer/Publisher’s Note: The statements, opinions and data contained in all publications are solely those of the individual author(s) and contributor(s) and not of MDPI and/or the editor(s). MDPI and/or the editor(s) disclaim responsibility for any injury to people or property resulting from any ideas, methods, instructions or products referred to in the content. |
© 2026 by the authors. Licensee MDPI, Basel, Switzerland. This article is an open access article distributed under the terms and conditions of the Creative Commons Attribution (CC BY) license.