


Abstract
Consistent laser cutting quality is one of the problems associated with the nonlinearity of relationships between process parameters and output responses. This problem acquires particular importance when it comes to cutting advanced nanocomposites, which requires precise tuning. Despite the wide adoption of intelligent modelling, few studies have investigated the comparative efficiency of various approaches based on the use of the same dataset. In this research, the effectiveness of three models—Artificial Neural Network (ANN), Adaptive Neuro-Fuzzy Inference System (ANFIS), and Fuzzy Logic System (FLS)—was tested on experimental data related to the CO2 laser cutting of ABS/CNT nanocomposites. Input parameters included laser power and cutting speed, whereas HAZ width, kerf width, and surface electrical resistivity were used as output data. Data was split into training, testing, and validation datasets; models were created using supervised machine learning. Model performance was evaluated using Root Mean Square Error (RMSE). Analysis of results showed that ANN demonstrated acceptable predictive capabilities, yielding correlation coefficients (R) close to 1 (≈0.99) and RMSE values of 0.2956 for HAZ, 0.2061 for kerf width, and 2.3655 for surface electrical resistivity. Prediction by means of FLS was able to identify general tendencies; however, it produced RMSE values of 0.4741 for HAZ, 0.6297 for kerf width, and 1.9258 for surface electrical resistivity. Finally, the ANFIS model proved to be the most reliable model, yielding the lowest RMSE values for HAZ (0.2784), kerf width (0.0450), and surface electrical resistivity (0.0905). In conclusion, this research shows that ANFIS can be used effectively for building models predicting laser cutting processes; therefore, it represents an approach worth using in future investigations in this field.
Keywords:
surface electrical resistivity; CO2 laser cutting; machine learning; ANFIS; ANN; FLS; HAZ; kerf width 1. Introduction
Lasers are now widely used across various applications in modern manufacturing industries [1,2]. Laser cutting has been widely used in nontraditional machining operations. However, maintaining machining quality remains a major challenge, because the cutting kerf strongly depends on material properties and process parameters such as laser power and cutting speed [3]. Among different laser cutting techniques, CO2 laser cutting is widely used due to its thermal and non-contact nature. In this process, a focused laser beam interacts with the material and causes melting or vaporization depending on the operating conditions [4,5]. This method provides high precision and is suitable for cutting both metallic and non-metallic materials. Nevertheless, regardless of all the benefits of using laser machining technologies, the quality of the latter still depends heavily on the values of process parameters, while input and output responses have highly complicated relationships [6,7]. There has been much research conducted investigating the impact of process parameters on laser cutting process. In particular, Tamrin et al. [8] concluded that increasing the laser power and reducing the cutting speed results in a greater kerf width and heat affected zone, thus emphasizing the high dependency of the process on the parameters involved. In addition, Genna et al. [9] and Yadvinder Singh et al. [10] underlined that material characteristics, together with process parameters, have an impact on the cutting quality and dimensional accuracy. Process parameters are not the only factors affecting the laser cutting process, as material characteristics also play a key role. The analysis of CNT-based nanocomposites revealed that their presence enhances various characteristics of the laser cutting process. Furthermore, Ghavidel et al. [11,12] noted the negative effect of thermal treatment on HAZ and recorded increased machinability and dimensional accuracy. Thus, it can be seen that all properties of the materials are crucial factors that should be considered while investigating the laser cutting behaviour.
Electrical resistivity and related electrical properties play a critical role in determining the performance, sensitivity, and reliability of smart materials and electronic systems. Magnetically switchable adhesive millirobots were developed to achieve controllable manipulation in air and water through the tuning of functional material behaviours [13]. Zhang et al. [14] proposed a low-noise readout circuit for MEMS gyroscopes using differential pseudo resistors and demonstrated enhanced electrical stability, reduced noise, and improved sensitivity through optimized circuit design. Ghavidel et al. [3] conducted an extensive experiment concerning ABS/CNT nanocomposite materials. They considered the impact of two independent parameters—laser power and cutting velocity—on such key output responses as HAZ, kerf width, and surface characteristics. It was discovered that laser energy density is crucial for defining the surface quality of a part cut with a laser, and thermal conductivity is important when defining HAZ.
Machine learning techniques have been increasingly utilized in advanced manufacturing to enhance process optimization, prediction capability, and intelligent control. Wang et al. [15] combined machine learning with molecular dynamics simulation to optimize multistage femtosecond laser drilling by predicting the relationship between laser parameters and machining performance. Zhang et al. [16] employed a machine learning cycle design strategy integrated with a physical model to accelerate the optimization of ultrashort pulse laser micromachining through iterative parameter refinement. Zhang et al. [17] utilized machine learning together with a high-throughput multi-objective genetic algorithm to optimize low-power femtosecond laser trepan drilling by balancing drilling quality and efficiency. Yang et al. [18] applied feedforward tuning and real-time error compensation algorithms to improve ultrafast beam steering accuracy and tracking performance. Lv et al. [19] developed a multi-physical simulation framework for resistance spot welding to generate synthetic datasets suitable for intelligent modelling and process prediction. Liu et al. [20] proposed a real-time spatiotemporal error compensation framework driven by artificial intelligence techniques to enhance precision in face gear grinding. Wang et al. [21] integrated a numerical simulation with experimental analysis to optimize electrolytic-assisted milling parameters for the improved machining performance of titanium alloys. Artificial Neural Networks (ANNs) are highly applicable for modelling complex manufacturing systems due to their capability to capture nonlinear relationships between input and output variables [22]. Several researchers have successfully applied ANN-based models for laser cutting optimization and prediction. For example, Kechagias et al. [23] used a feedforward backpropagation neural network (FFBP-NN) to predict the kerf angle and demonstrated high prediction accuracy (R = 0.98). More recently, Samura et al. [24] applied ANN modelling to optimize laser cutting parameters and predict cutting quality. Their results demonstrated excellent predictive accuracy, confirming the capability of ANN models to capture complex nonlinear relationships between process parameters and cutting performance. In addition to ANN models, Fuzzy Logic Systems (FLSs) have also been widely used in manufacturing applications, because they can effectively handle uncertainty and linguistic reasoning [25]. Pandey and Dubey [26] employed a grey fuzzy approach to improve laser cutting optimization performance and demonstrated that fuzzy-based modelling can effectively support multi-response optimization under varying process conditions. Adaptive Neuro-Fuzzy Inference Systems (ANFISs) combine the learning capability of ANNs with the interpretability of fuzzy systems, making them highly suitable for modelling complex laser cutting processes [27]. Rajamani [28] applied a GA-ANFIS model for laser cutting optimization and achieved an improved predictive performance. Furthermore, Chaki et al. [29] developed a hybrid ANN-PSO model and reported high prediction accuracy while identifying the cutting speed as the most influential process parameter. Similarly, Ji et al. [30] developed ANFIS and GA-ANFIS models for predicting kerf width and surface roughness in laser machining processes. Their findings showed that the hybrid ANFIS-based approach achieved higher prediction accuracy than conventional predictive methods, highlighting the effectiveness of ANFISs for modelling complex machining responses.
Nevertheless, review of the current literature shows that most studies consider either an experimental analysis of laser cutting processes or the application of only one intelligent method. In addition, very few studies examine multiple intelligent models on their predictive capabilities for one dataset, with the aim of predicting several output responses at once. Therefore, this research seeks to fill this knowledge gap by conducting a thorough comparative analysis of multiple intelligent modelling techniques, such as ANN, FLS, and ANFIS, in relation to the joint prediction of multiple outputs in the CO2 laser cutting process of ABS/CNT nanocomposites. ANN was selected in this research due to its strong capability in modelling nonlinear relationships between process parameters and output responses. FLS was chosen because it can effectively handle uncertainty and approximate reasoning in complex manufacturing environments. In addition, ANFIS was employed because it combines the learning capability of ANNs with the interpretability and reasoning structure of FLSs. Therefore, these techniques were considered suitable for modelling and predicting multiple nonlinear responses in the CO2 laser cutting of ABS/CNT nanocomposites. Unlike many previous studies that focused on a single modelling technique or a single output response, this research compares multiple intelligent models using the same experimental dataset and identical input parameters. By doing so, it becomes easier to compare the different models objectively and reliably. Moreover, this research focuses on predicting multiple output responses, including the heat affected zone (HAZ), kerf width, and surface electrical resistivity. These outputs are strongly correlated and exhibit highly nonlinear relationships. Thus, the innovative aspect of this research is that multiple intelligent methods have been applied at once to conduct a comparative analysis on how effective each method is in dealing with multiple output prediction problems.
2. Methodology and Metaheuristic Approaches
Based on the challenges associated with the nonlinear relationship between laser cutting process parameters and output responses, this section presents the methodology adopted for developing predictive models. The proposed approach is based on the analysis of an existing experimental dataset and the application of intelligent modelling techniques to accurately predict cutting performance.
2.1. Experimental Work
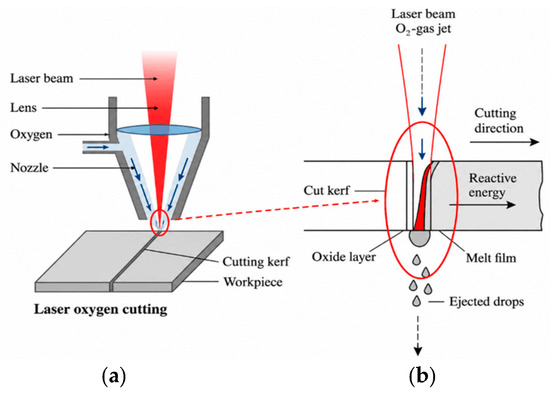
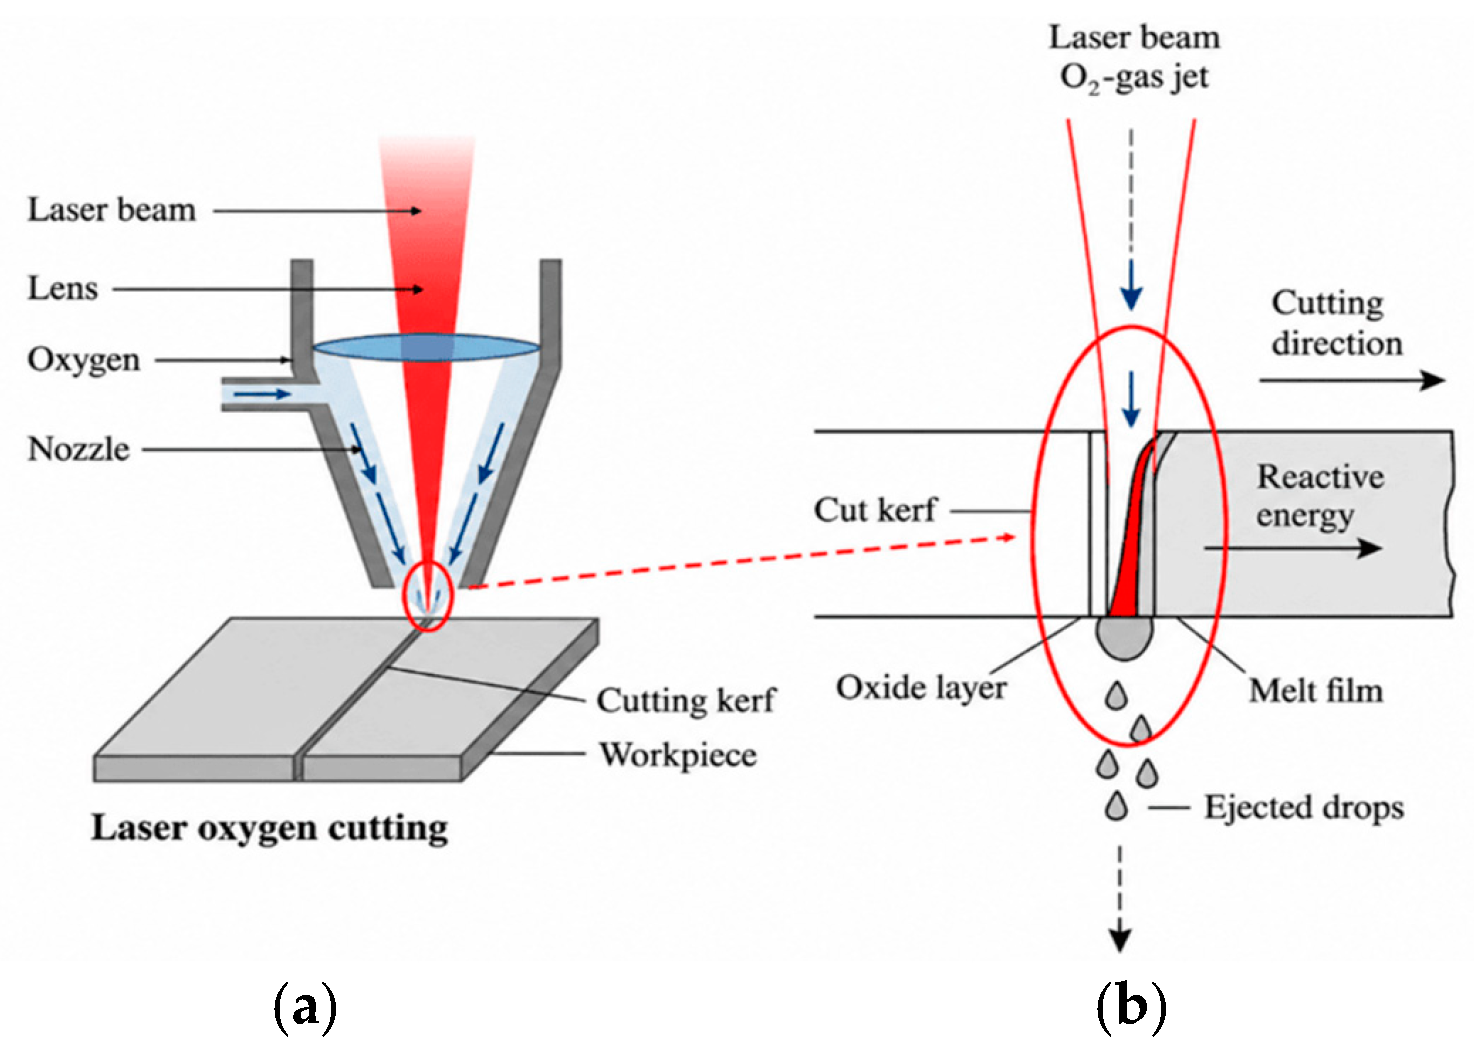
The dataset used in this study was obtained from a previously published experimental investigation by Karimzad Ghavidel et al. [3], in which CO2 laser cutting experiments were conducted on ABS–CNT nanocomposites under various processing conditions. A schematic of the laser cutting process is depicted in Figure 1. In the original study, different injection moulding conditions, including variations in injection temperature and injection pressure, were applied to prepare the material samples. These conditions influence the material properties prior to the laser cutting process and are summarized in Table 1.
Figure 1.
Schematic of laser cutting process: (a) showing the cutting setup; (b) a detailed view of the kerf formation.
Table 1.
Injection moulding conditions used for sample preparation [3].
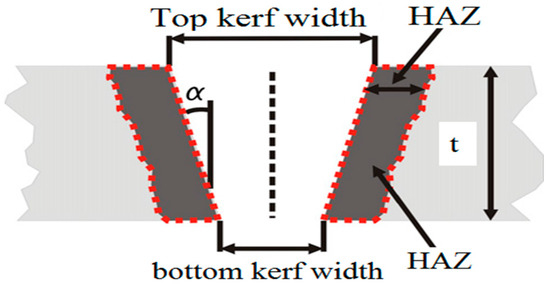
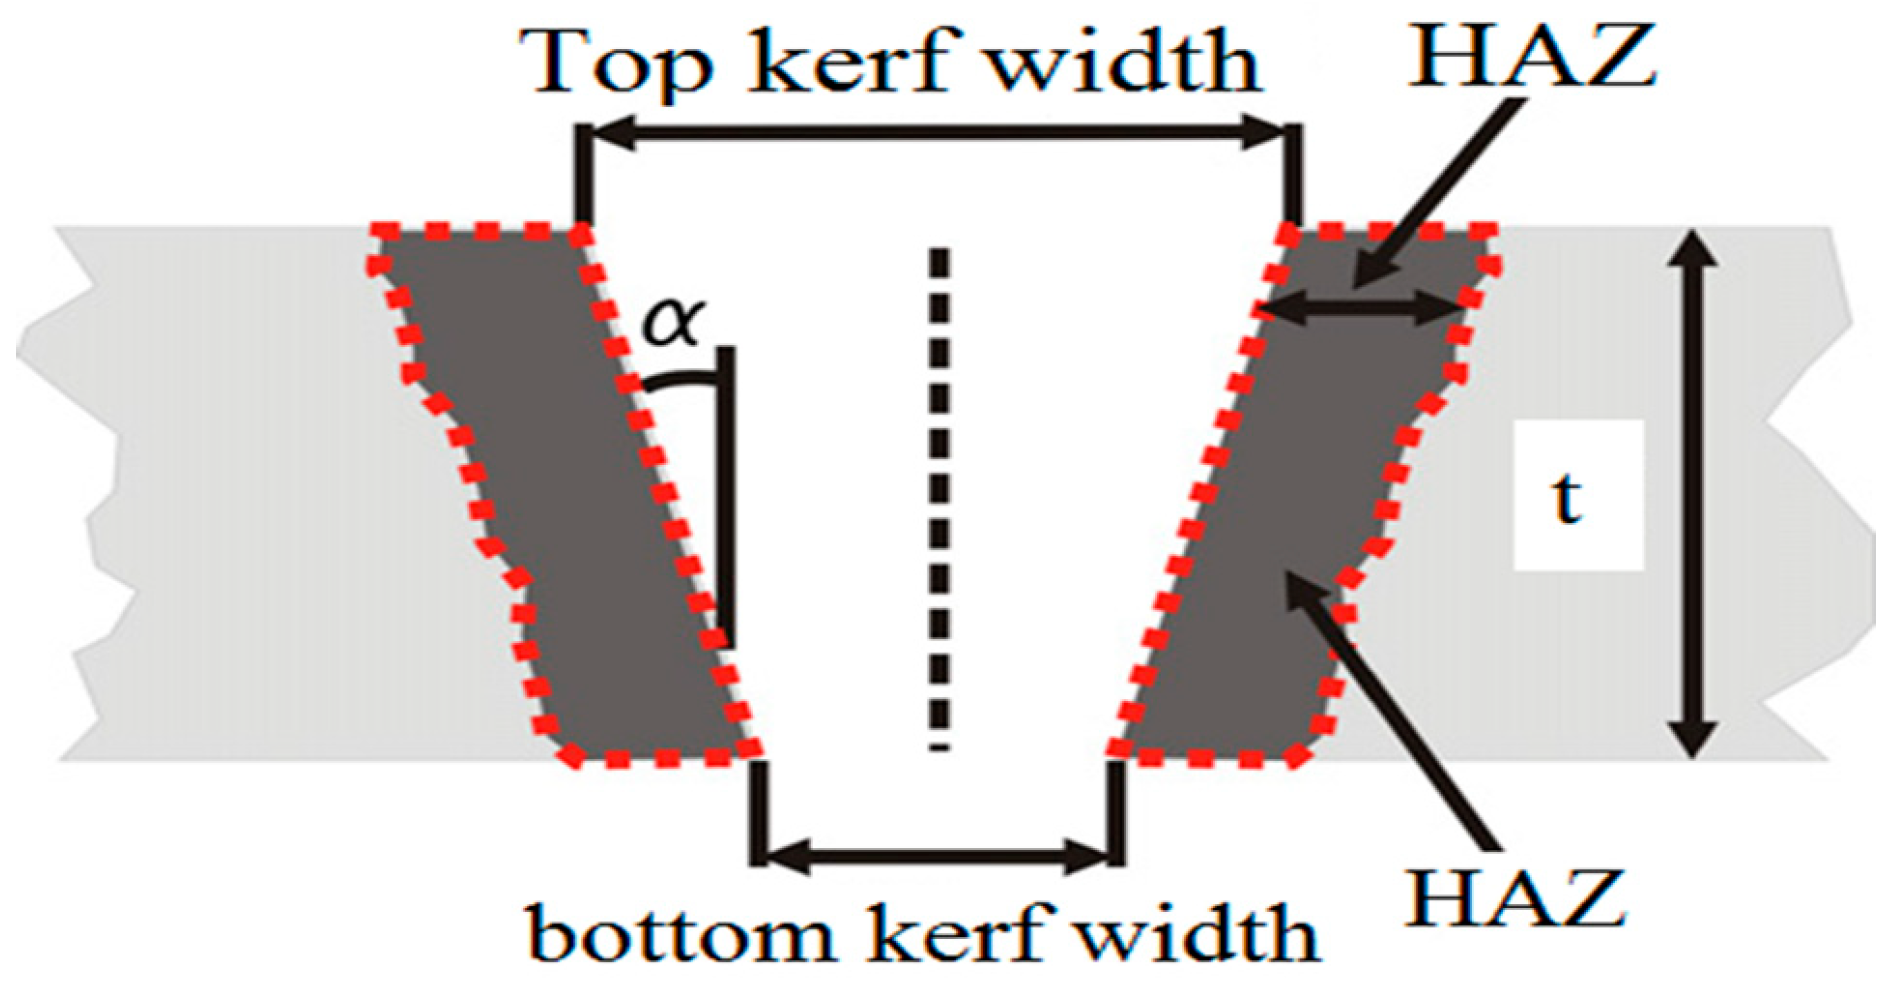
Figure 2 illustrates the geometrical features of the kerf cross-section used to define the output responses. The laser cutting process produces a kerf profile and a surrounding heat affected zone (HAZ), where thermal modification occurs without complete material removal. Kerf width is measured at the cut opening, while HAZ is determined from the kerf boundary to the outer limit of the thermally affected region. Therefore, HAZ, kerf width, and surface electrical resistivity were selected as the primary output responses for modelling and prediction in this study.
Figure 2.
Geometrical characteristics of the kerf cross-section.
These preparation conditions define the material characteristics of each sample category, which are subsequently subjected to the laser cutting process. As mentioned in the earlier sections, laser power and cutting velocity are the most significant input factors, whereas heat affected zone (HAZ), kerf width, and surface electrical resistivity are regarded as important response outputs. Laser power defines the energy imparted to the substrate, whereas cutting speed is concerned with the exposure time of the laser beam to the surface of the substrate. These input factors govern thermal behaviour and cutting performance, which in turn cause changes in the outputs listed above. The dataset contains input parameters and related output parameters, as outlined in Table 2.
Table 2.
Experimental settings: input parameters and responses [3].
In the present study, this dataset is utilized to develop and evaluate predictive models using artificial intelligence techniques. Therefore, this work does not involve new experimental investigations but focuses on the modelling and analysis of existing experimental data.
2.2. Metaheuristic Approaches
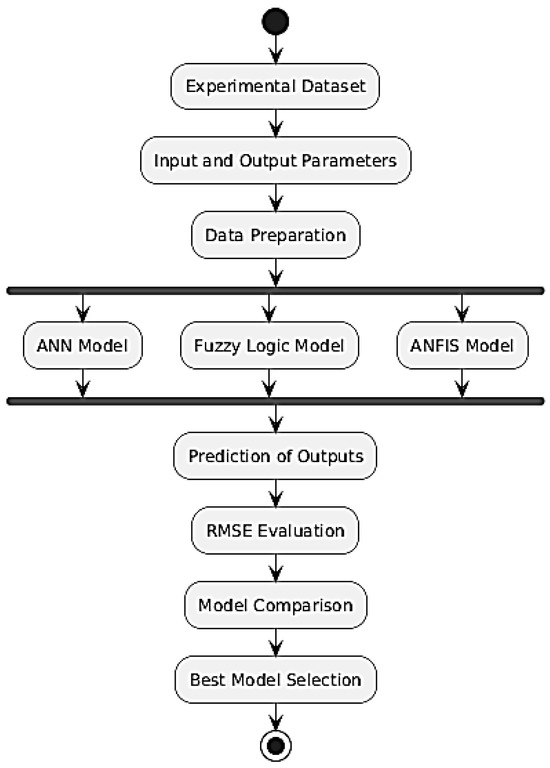
Based on the experimental dataset and the modelling procedure adopted in this study, a comparative intelligent framework was developed to analyze the prediction capability of ANN, FLS, and ANFIS models. As illustrated in Figure 3, the workflow includes data preparation, implementation of the intelligent models, prediction of output responses, RMSE evaluation, and final model comparison for selecting the most effective predictive approach.
Figure 3.
Workflow of the proposed intelligent modelling framework for comparative analysis of ANN, FLS, and ANFIS approaches.
The predictive performance of all models was assessed using the Root Mean Square Error (RMSE), which quantifies the deviation between the predicted and experimental values [31]. RMSE is widely used to evaluate prediction accuracy, because it provides a direct measure of the magnitude of prediction errors. A lower RMSE value indicates better agreement between model predictions and experimental observations. The RMSE was calculated according to Equation (1) [31,32]:
where (Opre) and (Oexp) denote the predicted and experimental output values, respectively, and (n) represents the number of validation samples. In this study, the RMSE values for ANN, FLS, and ANFIS were calculated using the validation dataset, which was not used during the model training stage. This approach ensures a consistent and unbiased comparison of the predictive performance of the three intelligent modelling techniques.
2.2.1. ANN Modelling
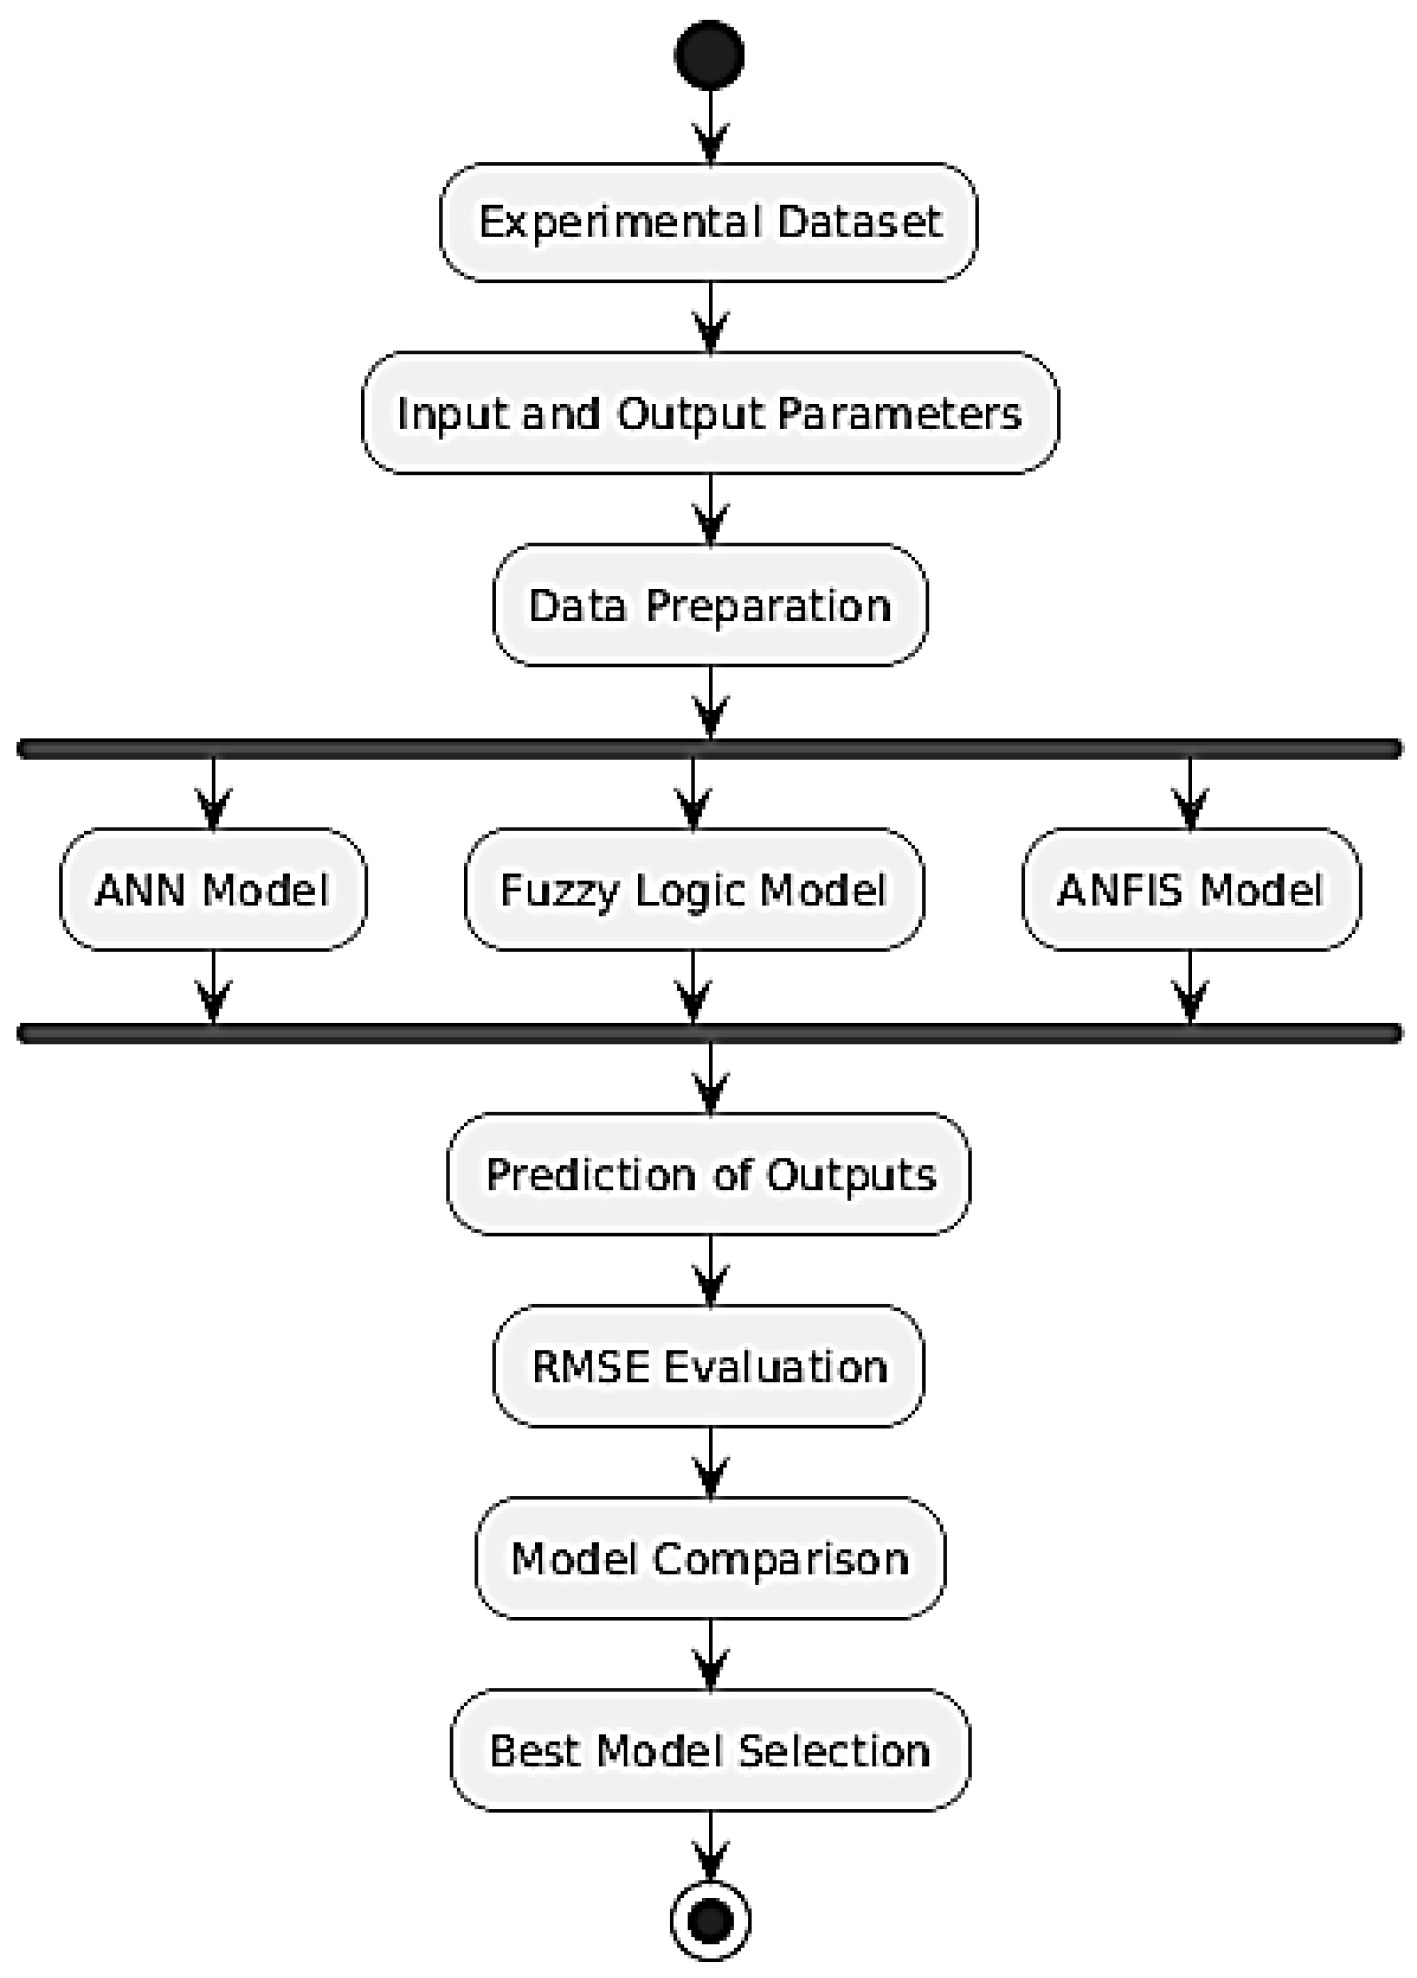
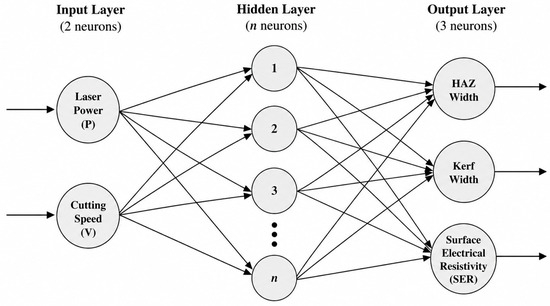
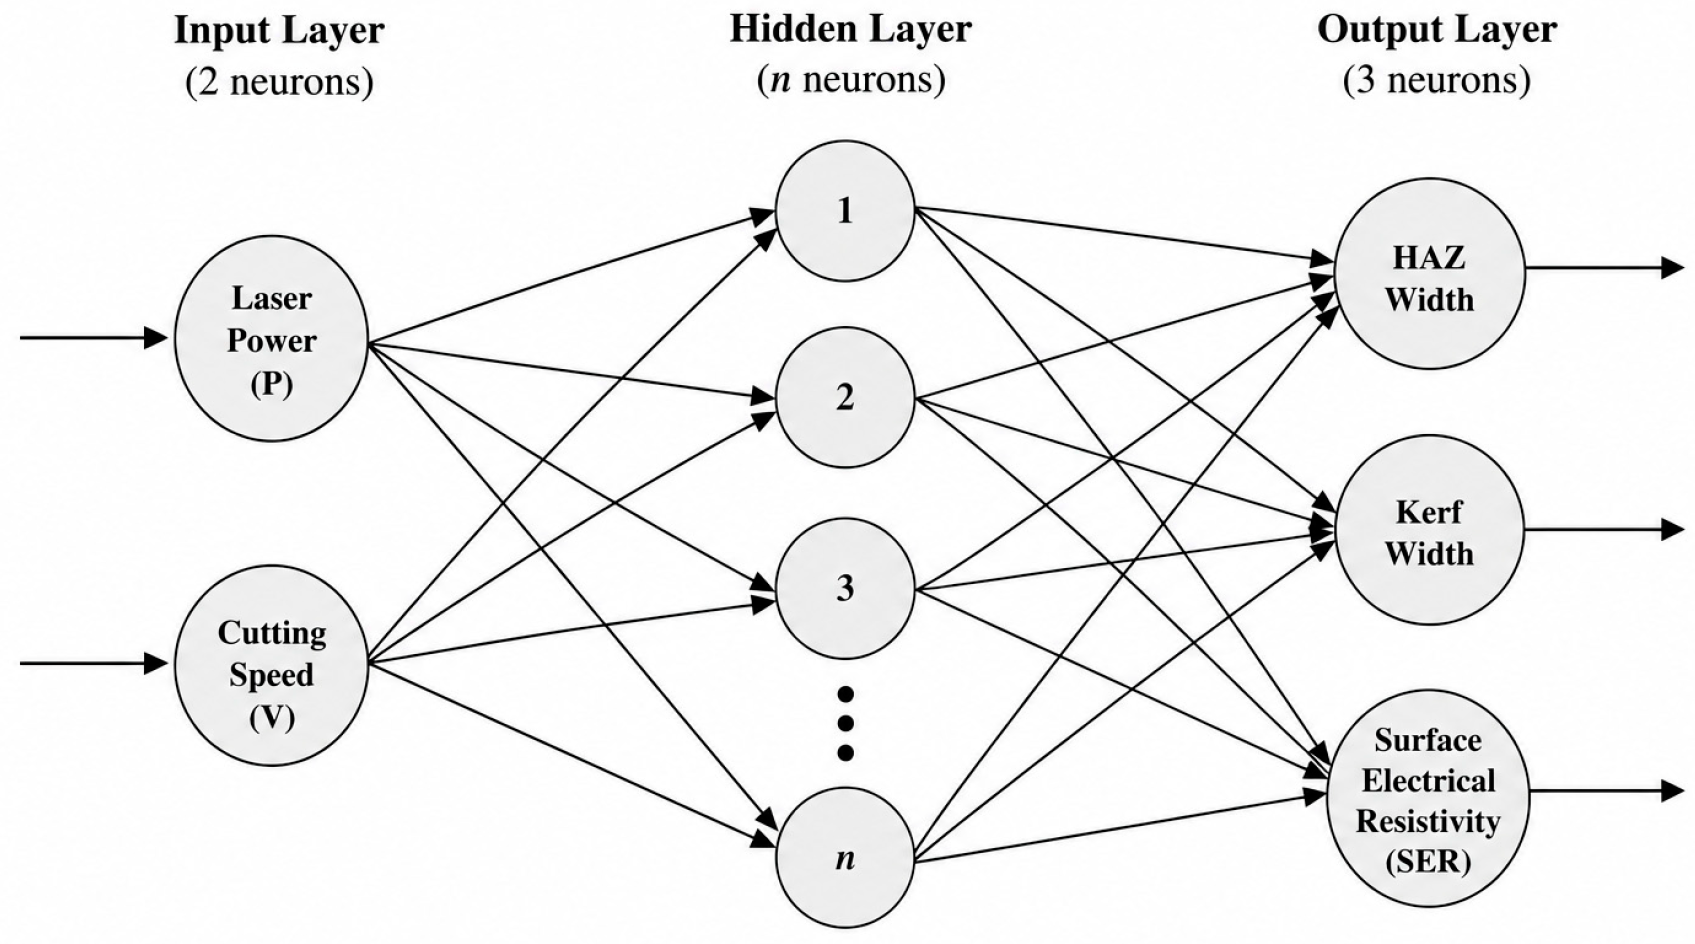
ANNs were employed to model the relationship between input parameters (laser power and cutting velocity) and output responses (HAZ, kerf width, and surface electrical resistivity). Figure 4 illustrates the workflow of the proposed intelligent modelling framework used for the comparative analysis of the ANN, FLS, and ANFIS approaches in this study. The ANN model consists of an input layer, one or more hidden layers, and an output layer. The input layer receives process parameters, while the output layer predicts the corresponding machining responses. The model is trained using a supervised learning approach to capture nonlinear relationships between inputs and outputs [33,34].
Figure 4.
Workflow of the proposed intelligent modelling framework for comparative analysis of ANN, FLS, and ANFIS approaches in predicting CO2 laser cutting responses.
Training of ANN
The ANN model was trained using 70% of the experimental dataset, while 15% and 15% were allocated for testing and validation, respectively. Similar percentages had been used in previous research studies [32,35]. Based on the training results (Table 3), the ANN model demonstrates a strong ability to approximate the experimental outputs. The predicted values of HAZ, kerf width, and surface electrical resistivity closely follow the trend of the experimental data.
Table 3.
Training output parameters vs. ANN-trained output parameters.
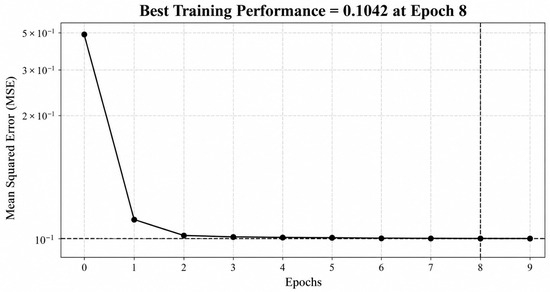
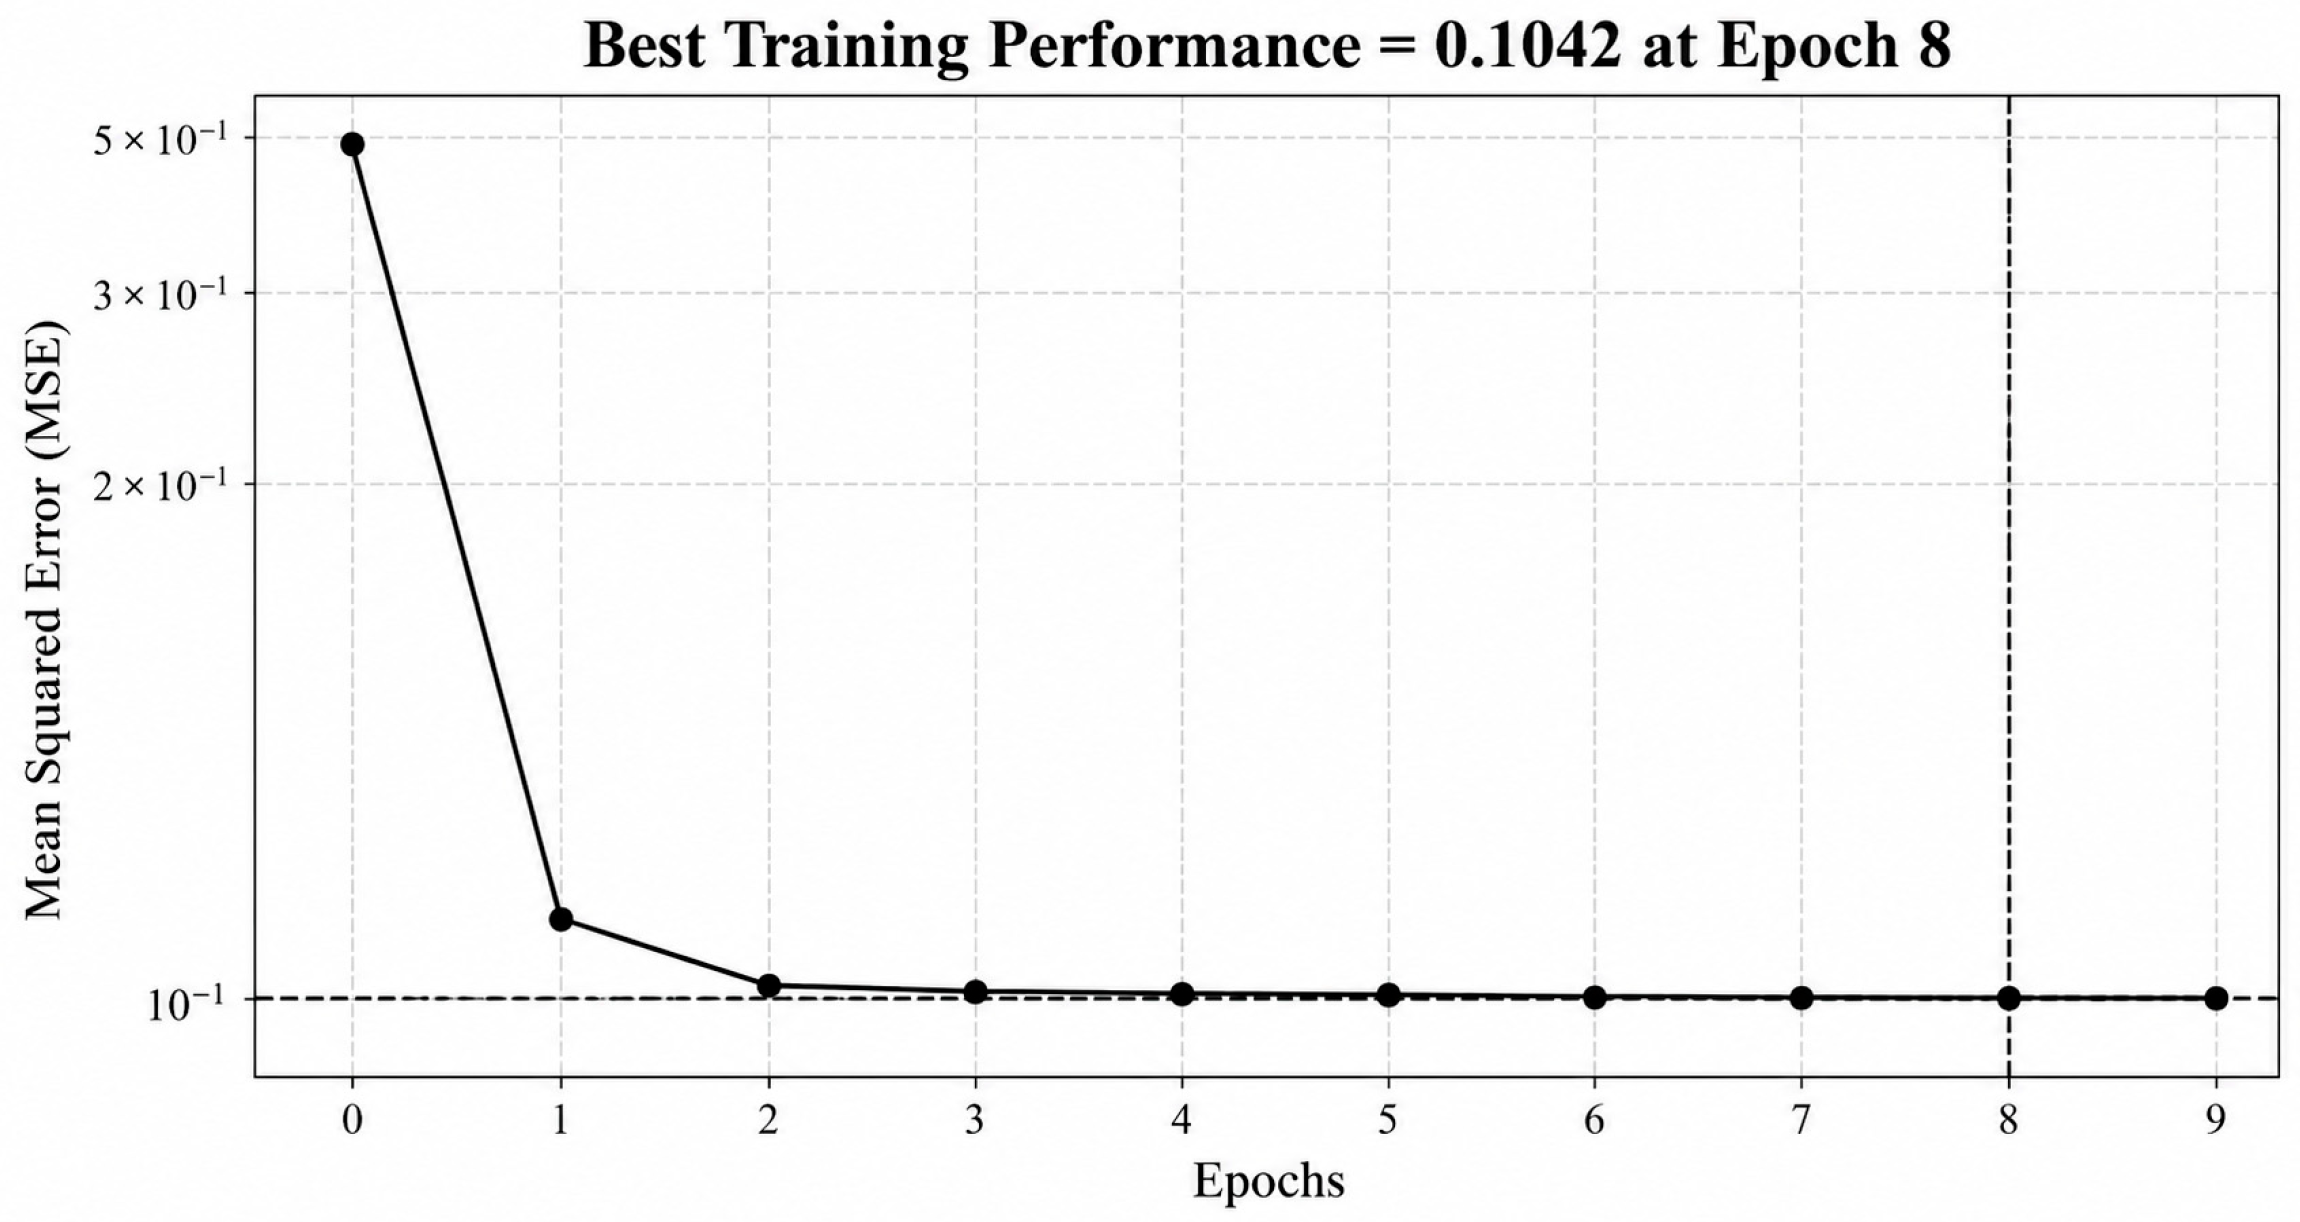
It can be observed that the ANN model captures the nonlinear relationship between input parameters (laser power and cutting velocity) and output responses. In most cases, the deviation between experimental and predicted values remains minimal, indicating effective learning of the process behaviour. However, slight variations are observed in certain samples, particularly at extreme parameter combinations (e.g., high laser power and low cutting speed), where prediction errors tend to increase. This suggests that the model sensitivity is higher under extreme processing conditions. As shown in Figure 5, the training error decreases rapidly during the initial epochs and gradually stabilizes, indicating effective learning and convergence of the ANN model. The best performance is achieved at epoch 8 with a minimum mean squared error (MSE) of 0.1042. This behaviour demonstrates that the model successfully captures the underlying nonlinear relationship between the input parameters and output responses.
Figure 5.
Best training performance achieved by the ANN model during the training process.
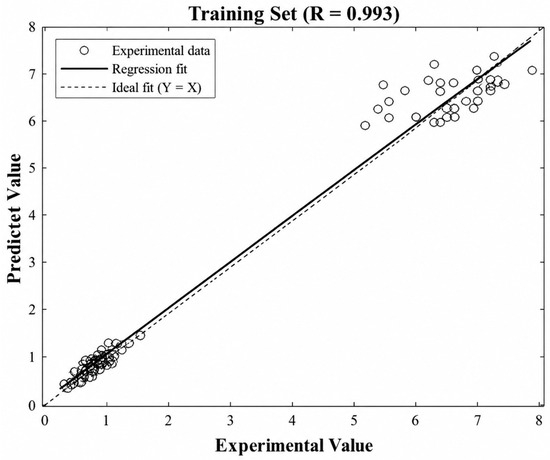
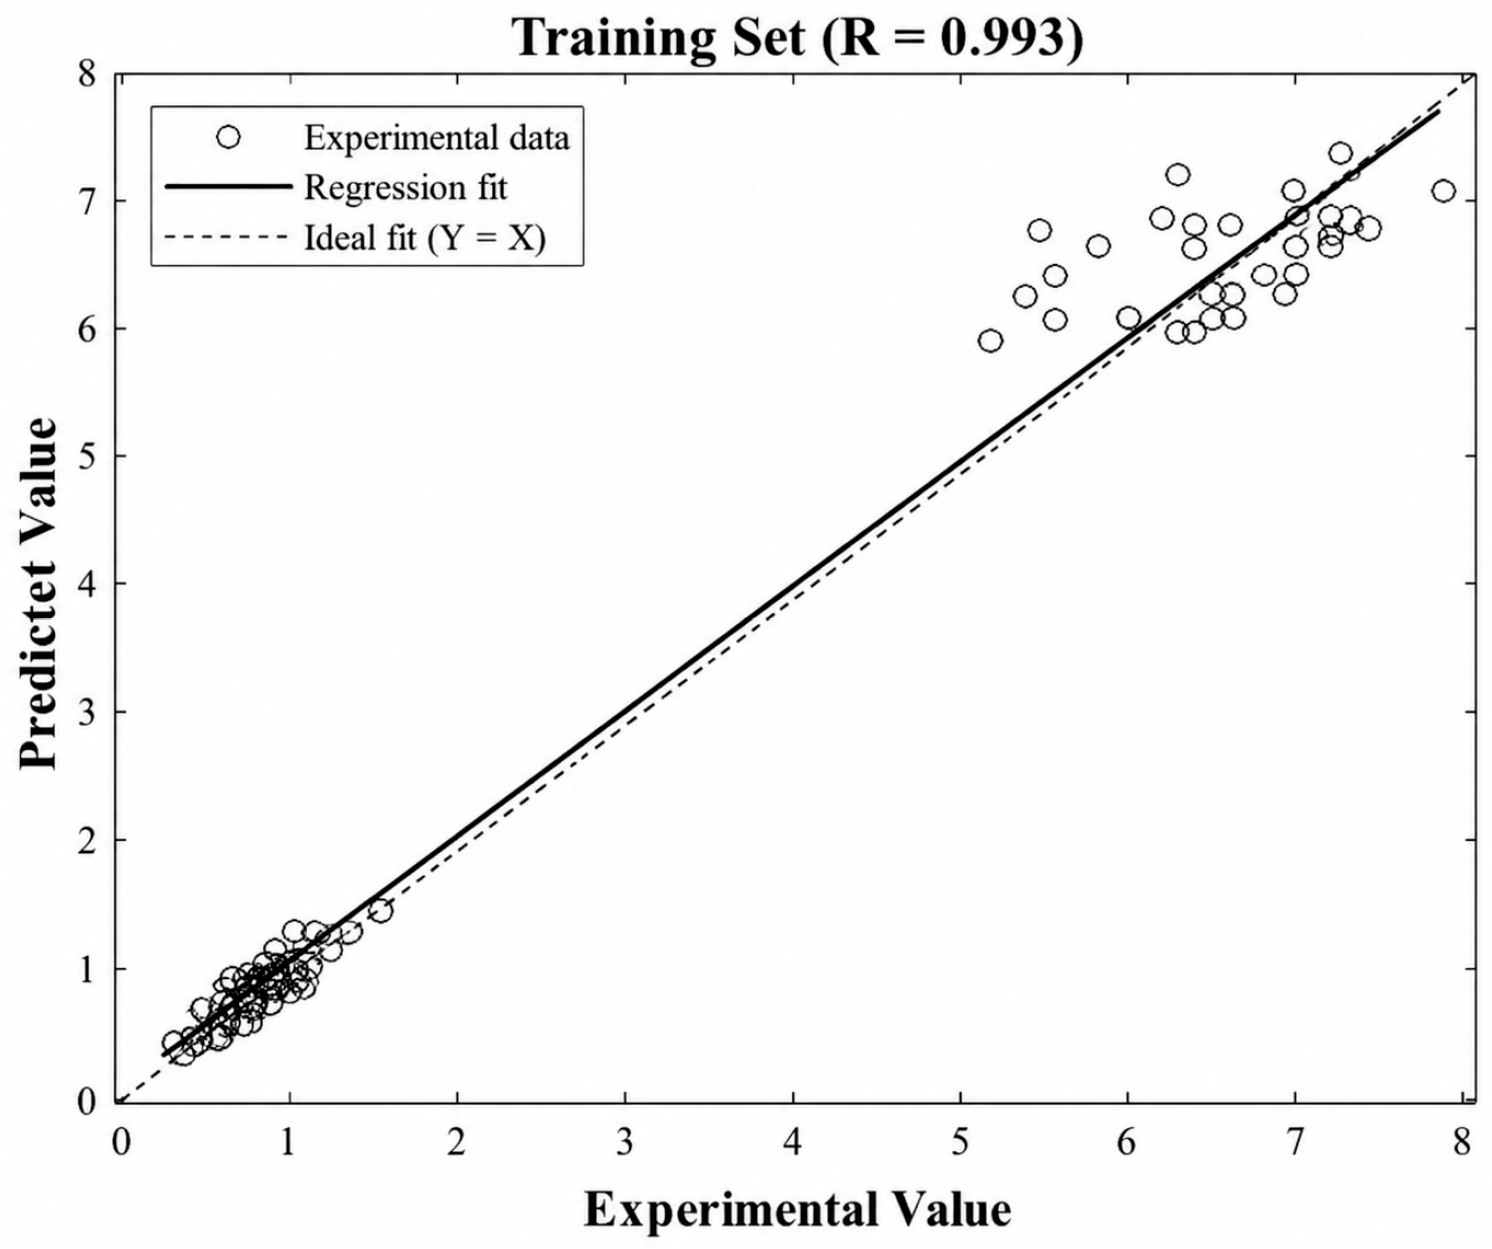
Furthermore, the regression analysis presented in Figure 6 demonstrates a strong linear correlation between the experimental and predicted values, with a correlation coefficient of R = 0.993. The close distribution of data points along the ideal line (Y = T) indicates a high level of prediction accuracy, confirming the model’s effectiveness in capturing the underlying relationship between input parameters and output responses.
Figure 6.
Regression analysis between predicted and target values using the ANN model.
Testing of ANN
The performance of the ANN model was further evaluated using the testing dataset (15% of the total data). Comparison between the experimental and predicted output indicates that the model maintains good generalization capability. The predicted values for HAZ and kerf width follow a consistent trend with experimental results, although minor deviations are present. Notably, larger discrepancies can be observed in surface electrical resistivity for certain samples, which may be attributed to the complex interaction between process parameters and material properties. This highlights the inherent difficulty in modelling electrical responses compared to geometrical outputs such as kerf width. Overall, the testing results confirm that the ANN model can predict output responses with acceptable accuracy. The error distribution between experimental and predicted values is shown in Figure 7. It can be observed that the prediction error remains relatively low for most samples, although slight deviations are noticeable for HAZ values, indicating higher sensitivity of thermal responses.
Figure 7.
Error rate between experimental HAZ values and testing predictions generated by the ANN model.
Validation of ANN
The validation results further confirm the robustness of the ANN model. The predicted outputs are in reasonable agreement with the experimental values, indicating that the model does not suffer from significant overfitting. From Table 4, it can be observed that the model maintains consistency across unseen data. However, in some cases, the predicted values show noticeable deviation from the experimental outputs, particularly for lower ranges of input parameters. This behaviour suggests that the model performance is slightly reduced when extrapolating beyond dominant patterns in the training dataset.
Table 4.
Experimental output parameters and corresponding validation predictions generated by the ANN model.
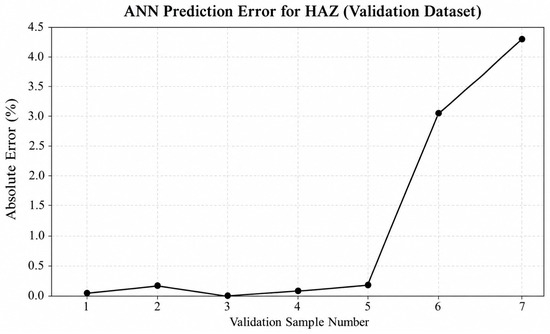
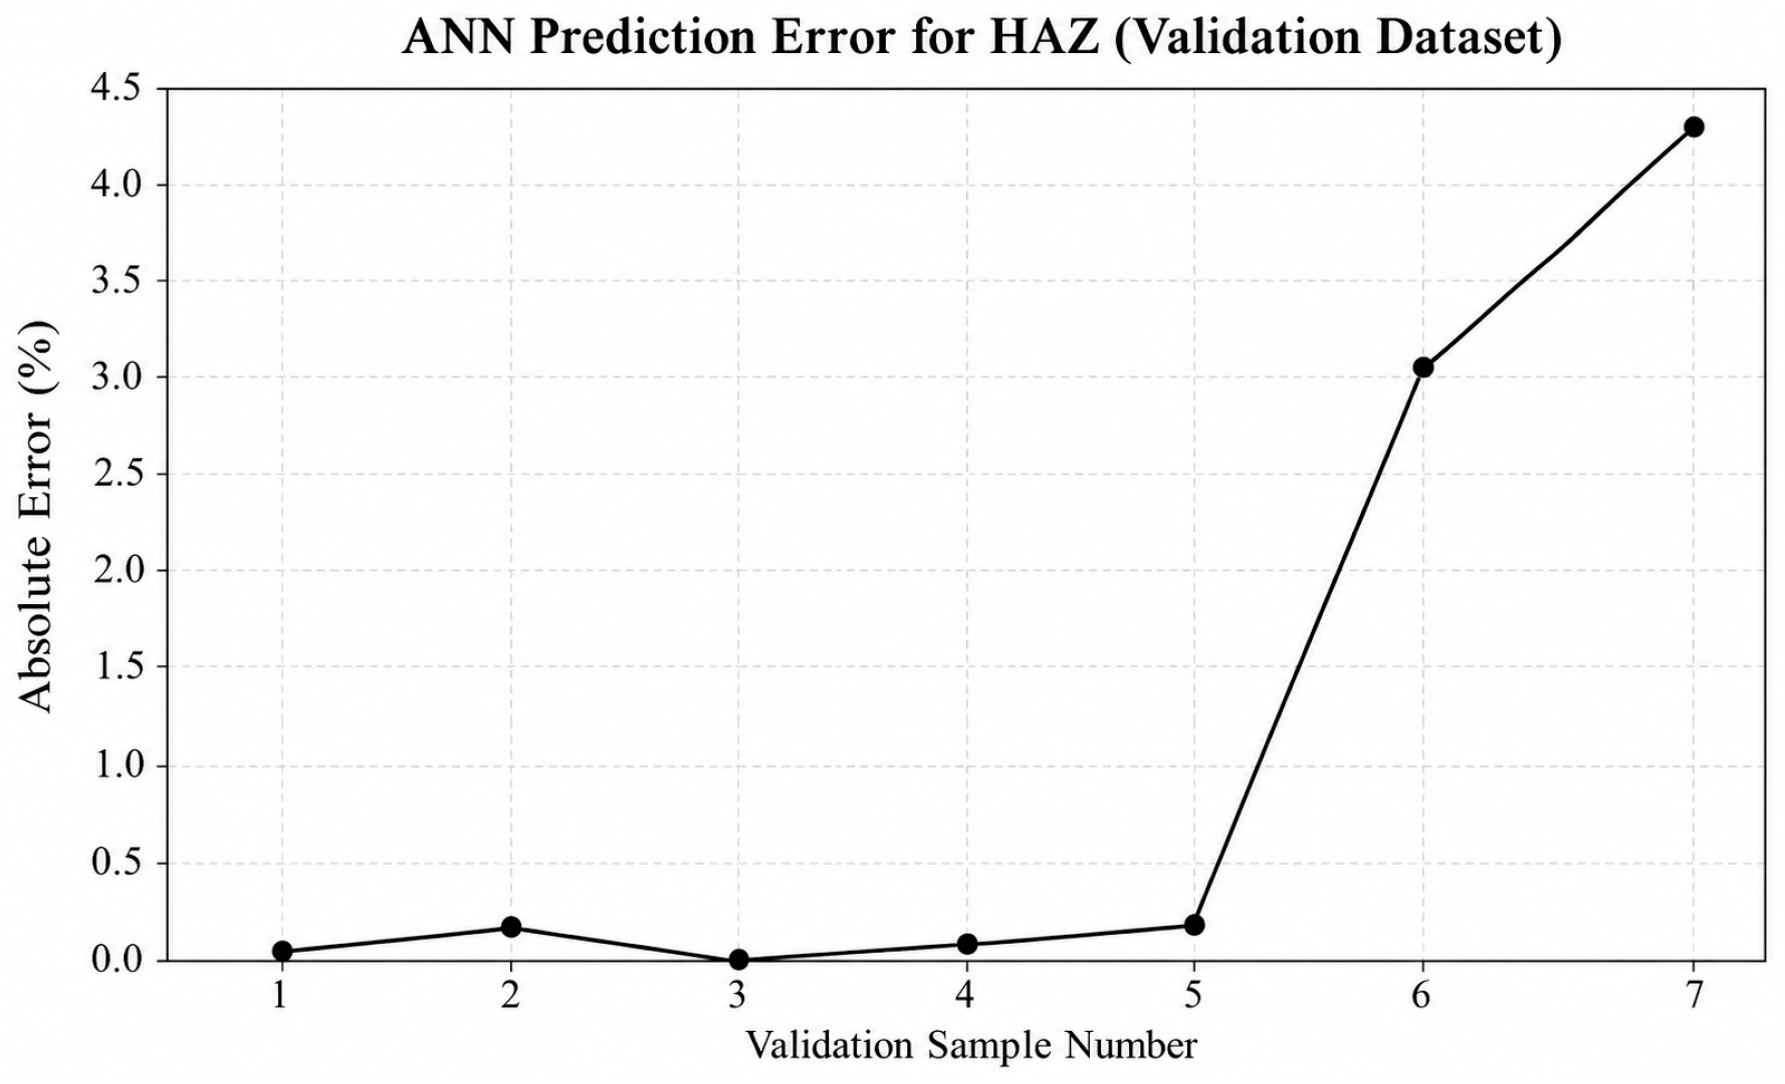
The validation error trends are illustrated in Figure 8. The ANN model maintains a reasonable level of accuracy across validation samples, confirming its generalization capability. However, some deviation can be observed for lower input parameter ranges.
Figure 8.
Error rate between experimental HAZ values and validation predictions generated by the ANN model.
RMSE for ANN
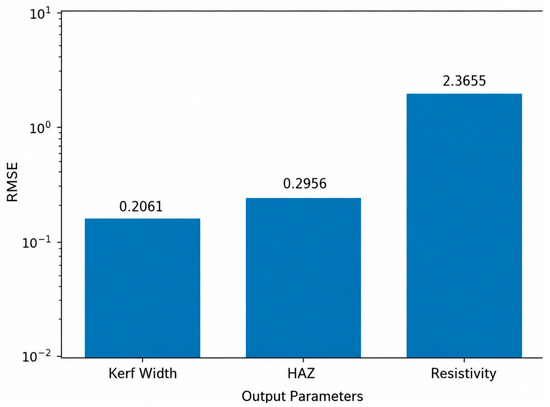
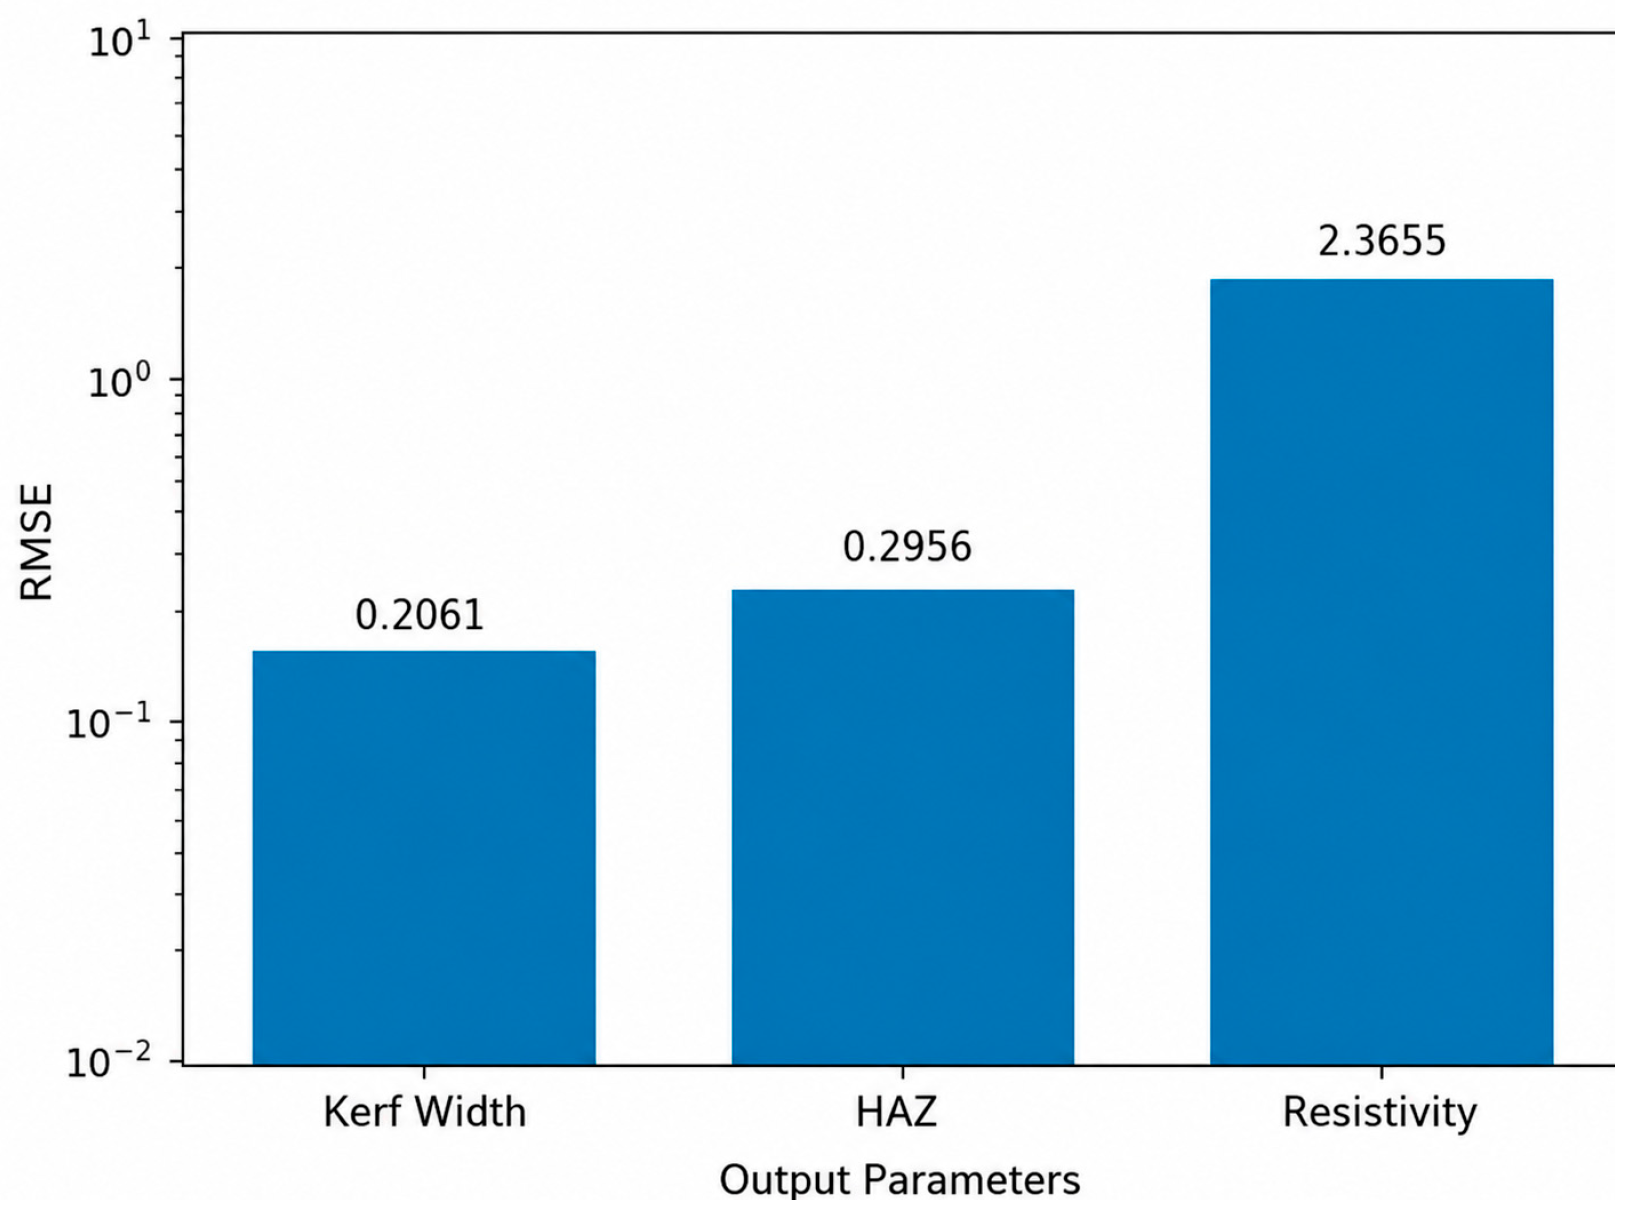
The predictive performance of the ANN model was evaluated using the Root Mean Square Error (RMSE). Based on Equation (1) presented in the Metaheuristic Approaches section, the RMSE values were calculated using the validation dataset, which was not used during the model training process. Figure 9 presents the RMSE results obtained for the ANN model. The calculated RMSE values were 0.2061 for kerf width, 0.2956 for HAZ, and 2.3655 for surface electrical resistivity. The results indicate that the ANN model achieved relatively low prediction errors for the geometrical responses, whereas a higher prediction error was observed for surface electrical resistivity. This suggests that the relationship between the laser cutting parameters and surface electrical resistivity is more complex than that of the geometrical characteristics. Overall, the ANN model demonstrated satisfactory predictive performance for the investigated laser cutting responses.
Figure 9.
RMSE comparison of ANN model outputs.
2.2.2. Fuzzy Logic System (FLS)
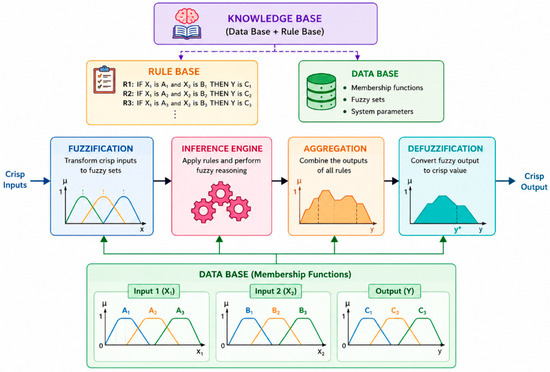
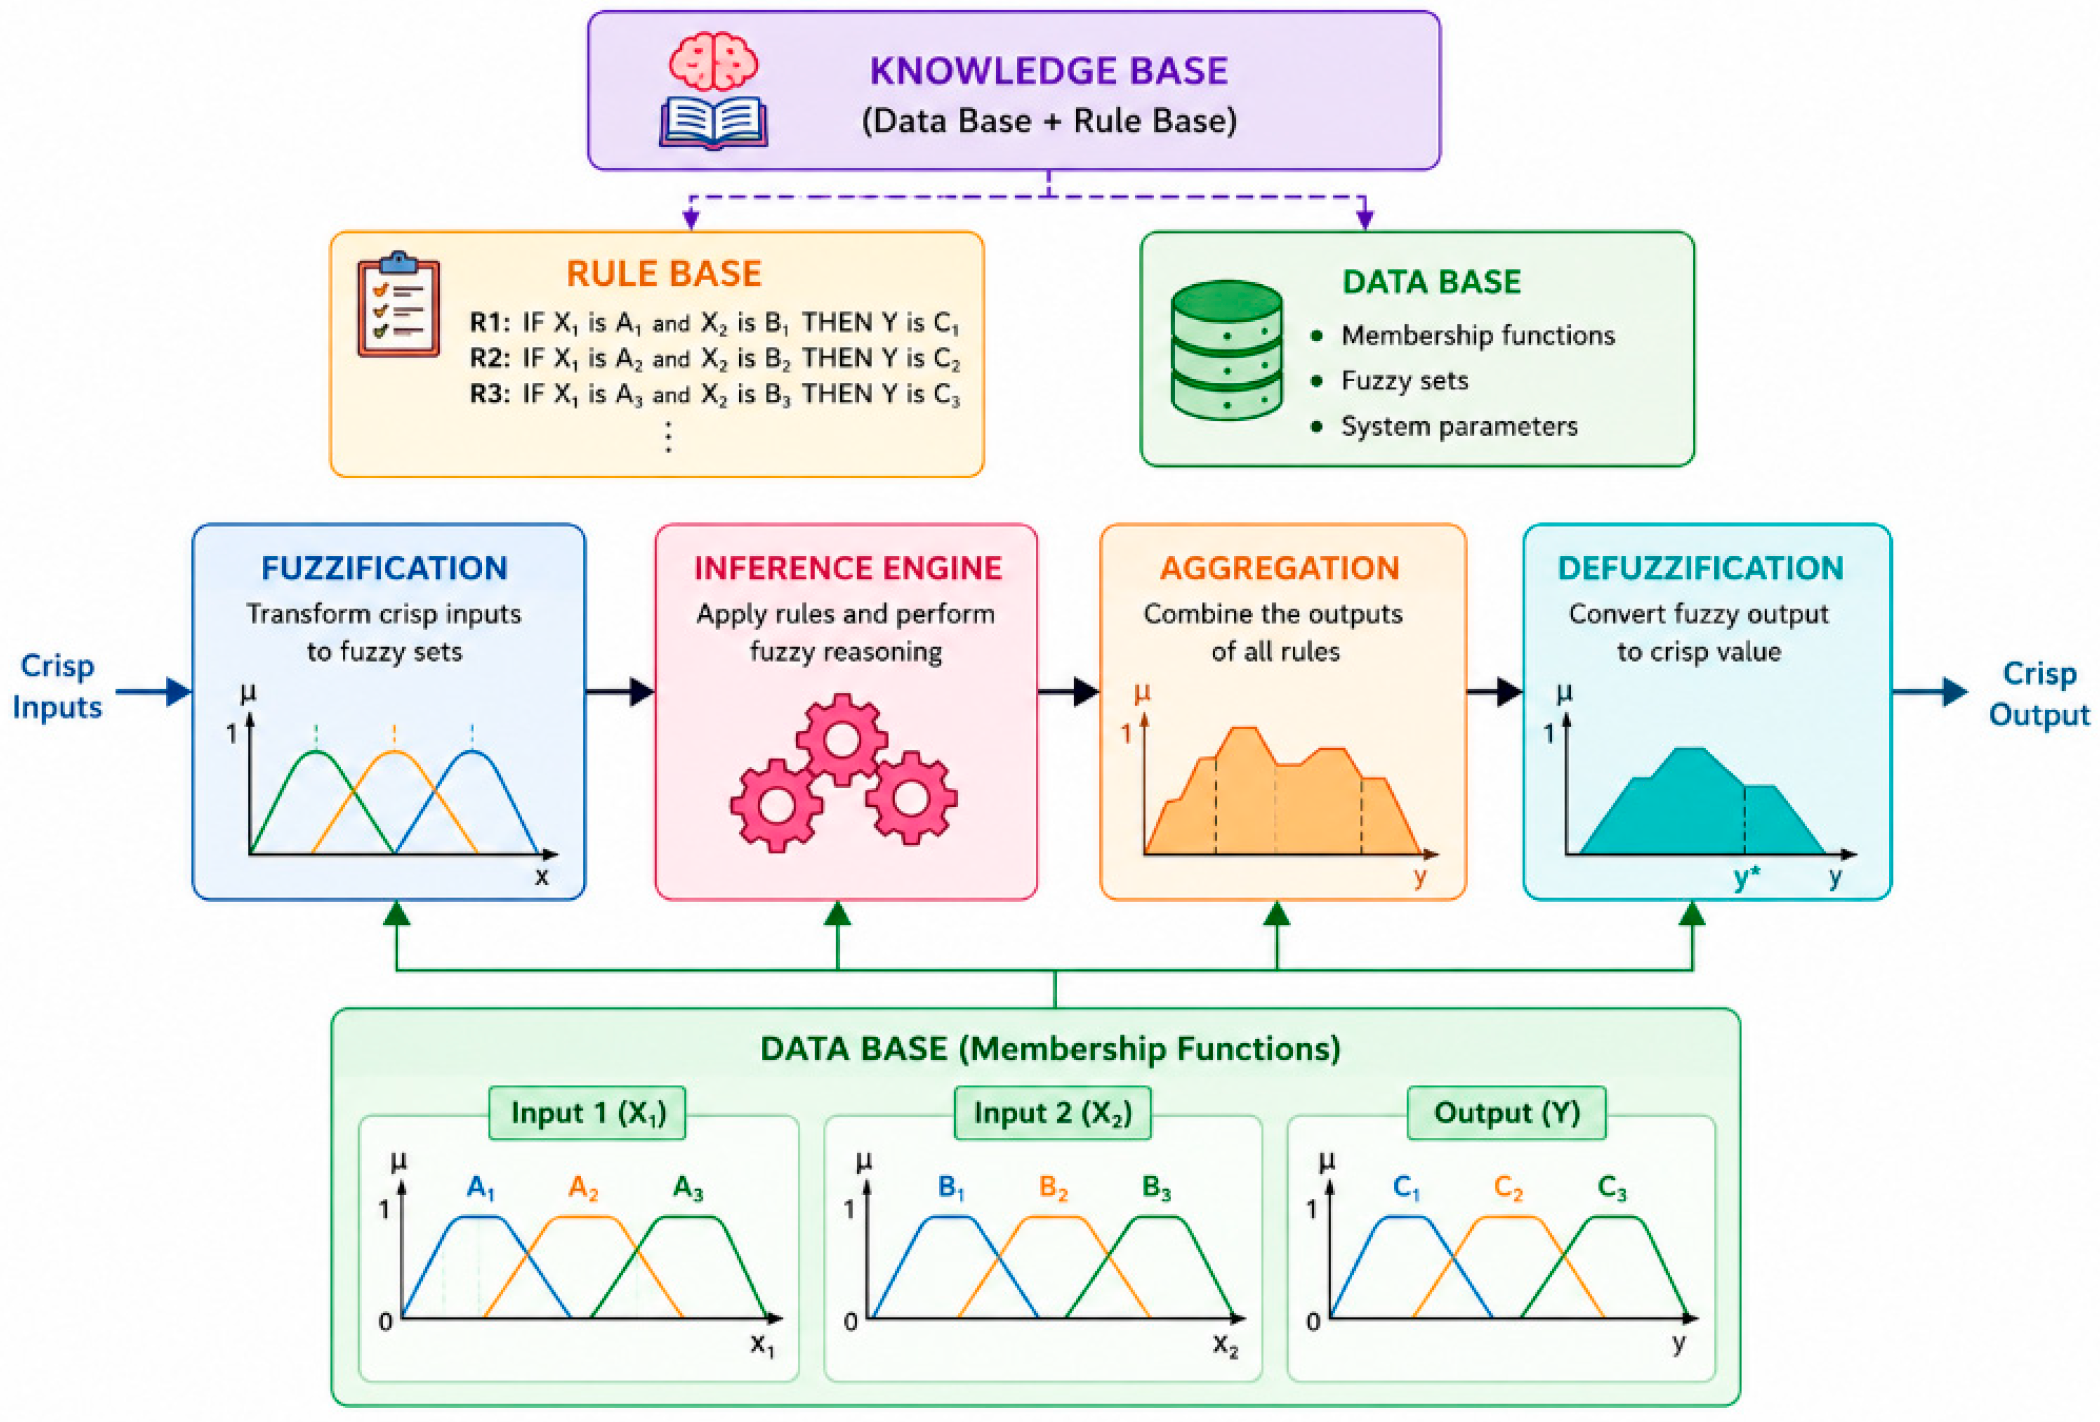
Fuzzy Logic System (FLS) was employed in this study to model the relationship between laser cutting input parameters and output responses. Unlike conventional mathematical models, FLS is well suited for handling nonlinear behaviour and uncertainty. The FLS model was developed using laser power and cutting velocity as input variables, while heat affected zone (HAZ), kerf width, and surface electrical resistivity were considered as output responses. The model was implemented in MATLAB R2024b using a Mamdani-type fuzzy inference system, where the relationship between inputs and outputs is defined through membership functions and a rule-based structure. In this framework, numerical input parameters are transformed into linguistic variables (e.g., low, medium, and high), enabling the model to capture gradual transitions between different operating conditions [23,36]. The overall structure of the FLS is illustrated in Figure 10.
Figure 10.
Schematic diagram of the FLS and inference process. The symbol y* represents the final defuzzified (crisp) output value. X1 and X2 denote the input variables, while Y denotes the output variable. A1–A3, B1–B3, and C1–C3 represent the fuzzy sets (linguistic terms) associated with X1, X2, and Y, respectively.
Construction of the FLS
The FLS was implemented in MATLAB using a Mamdani-type fuzzy inference system to model the relationship between laser cutting parameters and machining responses [36]. Three process parameters, namely, laser power, cutting velocity, and laser energy density, were considered as input variables, while HAZ, kerf width, and surface electrical resistivity were defined as output responses. Both input and output variables were represented using triangular membership functions (trimf), which transform numerical values into fuzzy linguistic terms. Three membership functions were assigned to each variable, corresponding to the linguistic levels low, medium, and high. This representation enabled smooth transitions between different operating conditions and improved the capability of the model to capture nonlinear process behaviour.
The fuzzy rule base was developed based on the observed trends in the experimental dataset and consisted of 25 IF–THEN rules. These rules were employed to describe the nonlinear relationships between the input parameters and output responses. The minimum operator was used for AND and implication operations, the maximum operator was applied for OR and aggregation operations, and the centroid method was adopted for defuzzification to convert fuzzy outputs into crisp numerical values.
FLS Rules and Membership Functions
The performance of the FLS depends on the definition of membership functions and the formulation of FLS. In this study, the input variables (laser power and cutting velocity) were classified into linguistic categories such as low, medium, and high, enabling smooth transitions between different operating conditions. Based on these definitions, a set of IF–THEN rules were developed to describe the relationship between input parameters and output responses. For example, a typical rule can be expressed as follows: IF laser power is high AND cutting velocity is low, THEN HAZ is high, kerf width is large, and surface electrical resistivity is moderate. By combining the membership functions with the rule base, the FLS is able to approximate the nonlinear relationship between process parameters and machining outputs in an interpretable manner.
Evaluation of the FLS
Unlike ANN models, the FLS approach does not involve a conventional training process. Instead, model performance is assessed by comparing the predicted outputs with the experimental data. Table 5 presents the comparison between experimental values and FLS predictions. The results indicate that the predicted outputs follow the general trend of the experimental data, demonstrating that the FLS is capable of approximating the nonlinear relationship between input parameters and output responses. Minor deviations are observed in some cases, particularly for surface electrical resistivity, which may be attributed to the complexity of modelling electrical behaviour compared to geometrical characteristics such as kerf width.
Table 5.
Comparison between experimental values and fuzzy model predictions.
Testing of the FLS
The performance of the FLS model was evaluated using the testing dataset, which represents 15% of the total experimental data. This stage aims to assess the generalization capability of the model in predicting unseen data. The comparison between experimental and predicted outputs is presented in Table 6.
Table 6.
Testing parameters and corresponding predicted output values obtained using the FLS model.
It can be observed that the fuzzy model captures the general trend of the output responses. For kerf width, the predicted values show relatively close agreement with the experimental results, indicating better performance in modelling geometrical characteristics. However, larger deviations are observed in the prediction of HAZ, reflecting the sensitivity of thermal behaviour to variations in process parameters. Similarly, discrepancies in surface electrical resistivity indicate the complexity of modelling electrical properties compared to geometrical responses. Overall, the results suggest that the fuzzy model is capable of approximating the nonlinear relationship between input parameters and output responses, although its prediction accuracy varies across different outputs.
Validation of the Fuzzy Model
To further assess the robustness of the fuzzy model, a validation stage was conducted using an independent dataset. This step aims to evaluate the ability of the model to generalize beyond the data used during model construction. Table 7 presents the comparison between experimental and predicted values for the validation dataset. The results show that the fuzzy model maintains a reasonable level of prediction accuracy, although slightly larger deviations are observed compared to the testing phase.
Table 7.
Experimental output parameters and corresponding validation predictions generated by the FLS model.
RMSE of the Fuzzy Model
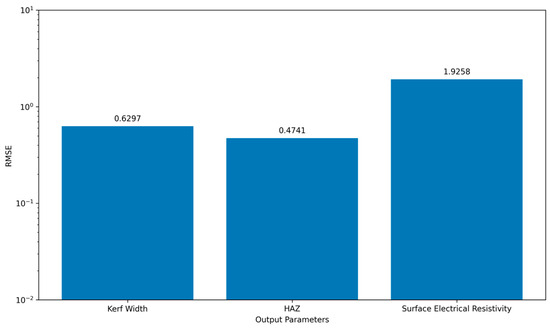
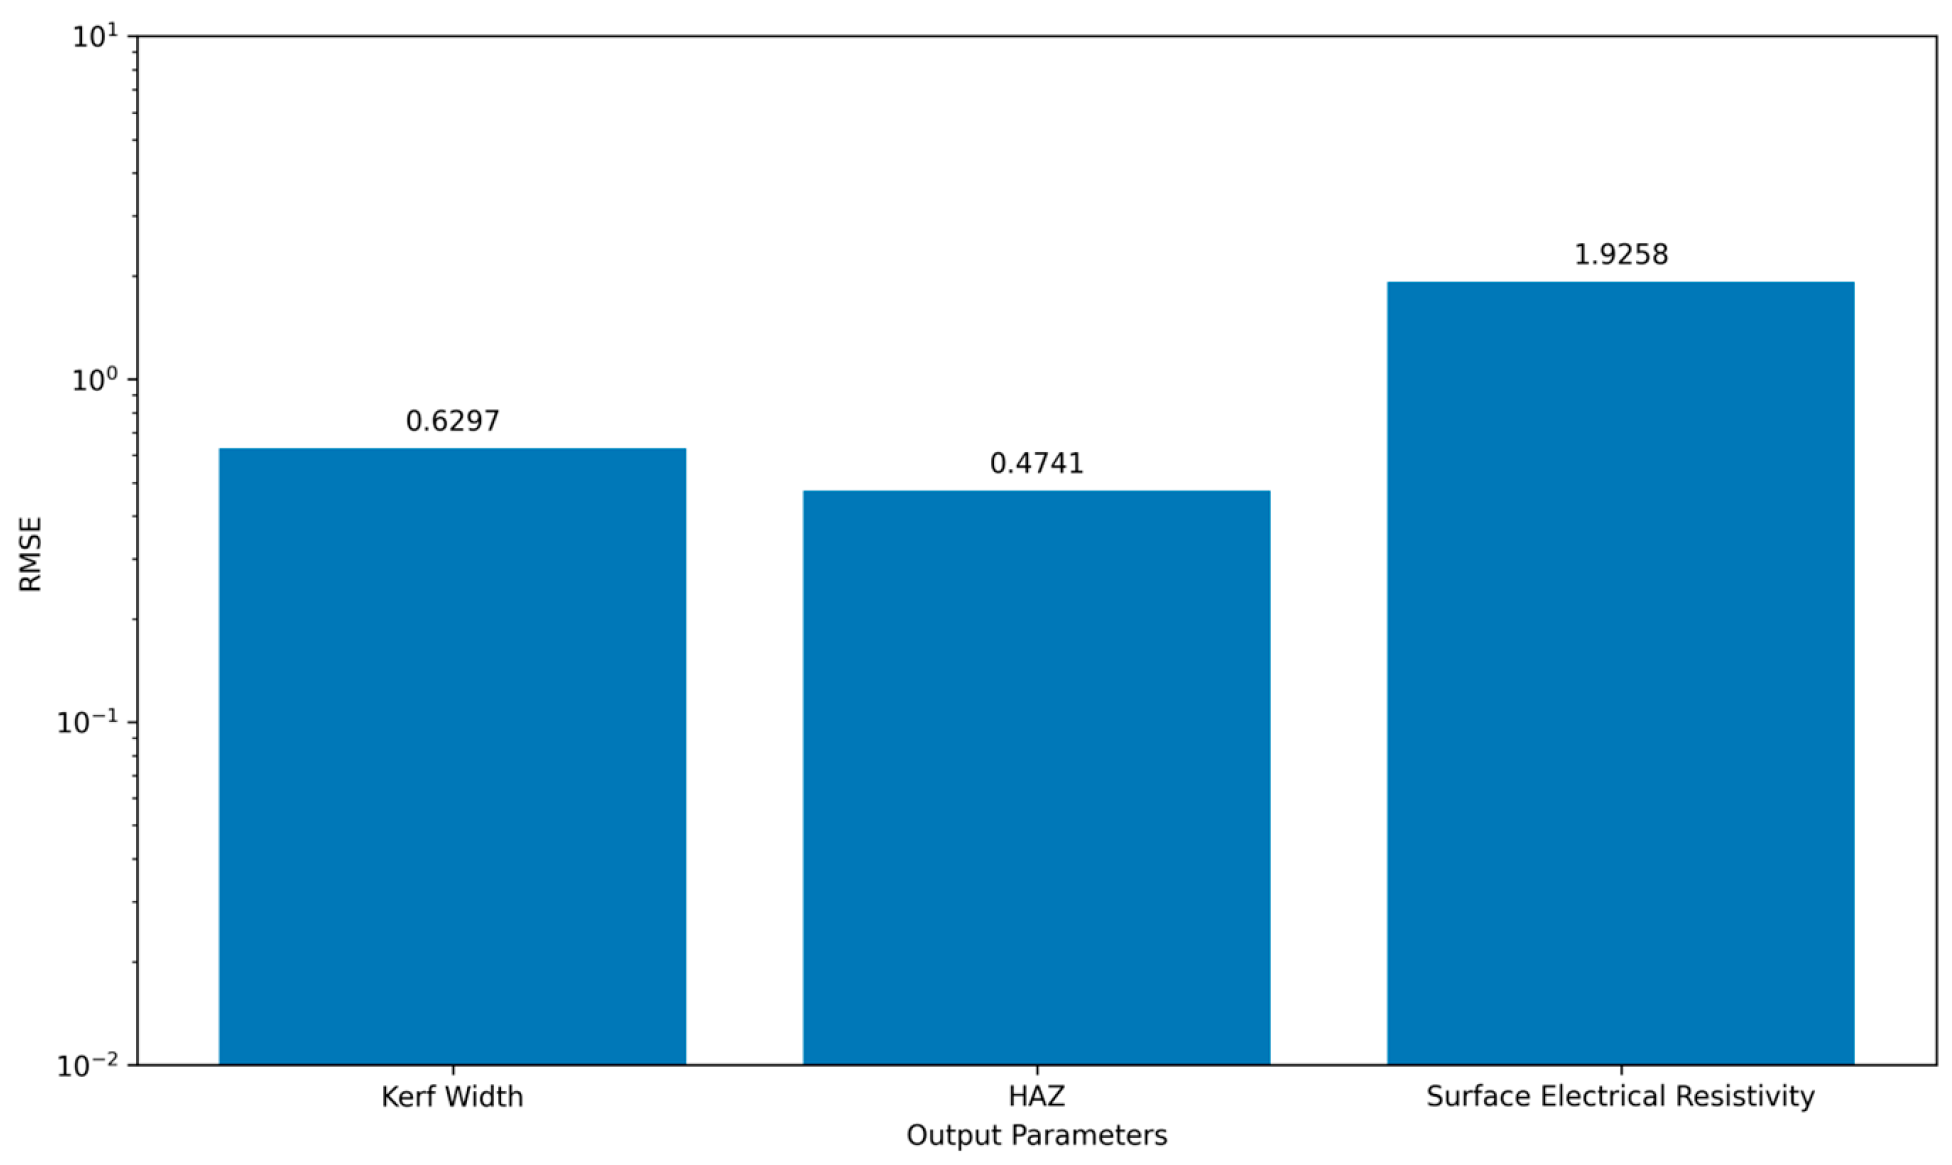
The predictive performance of the FLS model was evaluated using RMSE calculated from the validation dataset according to Equation (1). Figure 11 presents the RMSE comparison of the FLS model outputs. The obtained RMSE values were 1.0032 for kerf width, 1.0008 for HAZ, and 6.0046 for surface electrical resistivity. The results indicate that the FLS model produced comparable prediction errors for kerf width and HAZ. However, a considerably higher RMSE was observed for surface electrical resistivity, indicating a larger deviation between the predicted and experimental values for this response. This suggests that the FLS model was less effective in capturing the nonlinear relationship associated with surface electrical resistivity. Overall, the FLS model was able to capture the general trends of the laser cutting process, although its prediction accuracy was lower than that achieved for the geometrical responses.
Figure 11.
RMSE comparison of FLS model outputs.
2.2.3. ANFIS (Adaptive Neuro-Fuzzy Inference System)
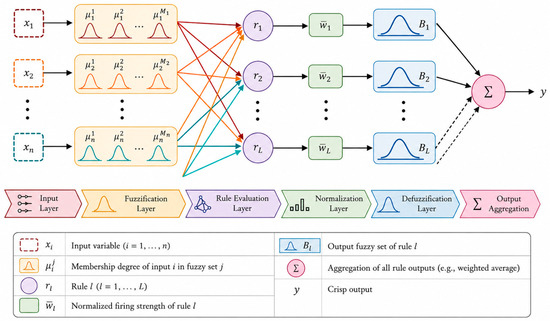
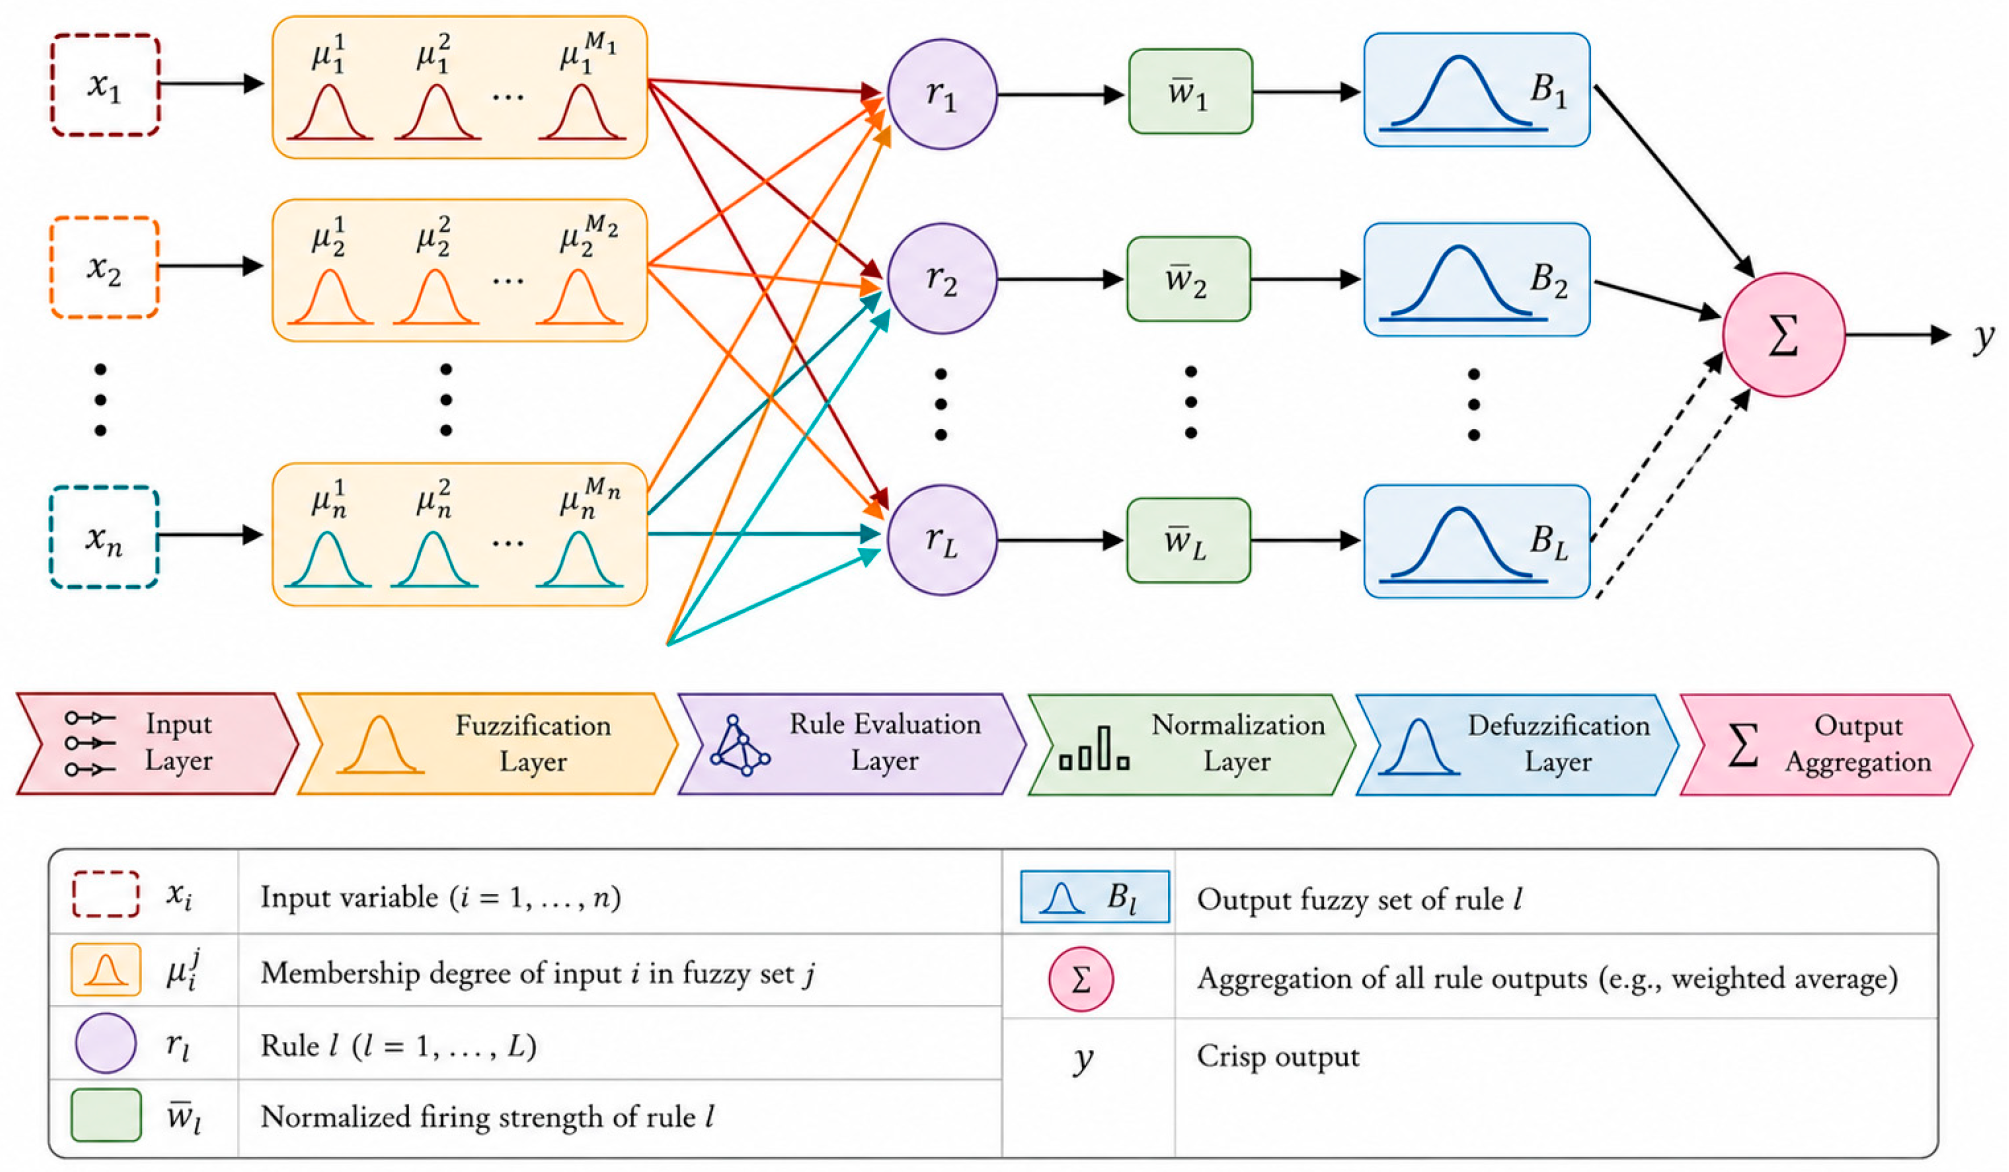
ANFIS was employed to model the relationship between laser cutting input parameters and output responses by combining the learning capability of Artificial Neural Networks with the interpretability of FLS. In this study, laser power, cutting velocity, and laser energy density were considered as input variables, while heat affected zone (HAZ), kerf width, and surface electrical resistivity were defined as output responses. The ANFIS model was implemented in MATLAB using a Sugano-type fuzzy inference system. Unlike conventional fuzzy models, the ANFIS can learn from data through a training process. It adjusts the parameters of membership functions using a hybrid learning algorithm, which combines least squares estimation and backpropagation. This enables the model to capture complex nonlinear relationships between input parameters and output responses with improved accuracy. The structure of the ANFIS model consists of multiple layers, including input, fuzzification, rule, normalization, and output layers, which together form a network capable of adaptive learning [27]. The overall architecture of the developed ANFIS model is illustrated in Figure 12.
Figure 12.
ANFIS model.
The ANFIS model was implemented in MATLAB using the Grid Partitioning method to generate the initial fuzzy inference structure. Three membership functions were assigned to each input variable. The model was trained using the hybrid learning algorithm, which combines least squares estimation for consequent parameter identification and gradient-descent optimization for premise parameter adjustment. The experimental dataset was divided into 39 training samples (70%), 7 testing samples (15%), and 7 validation samples (15%). For consistency with the ANN model, the training process converged after 8 epochs.
Training of ANFIS
The ANFIS model was trained using 70% of the experimental dataset to learn the relationship between input parameters and output responses. During the training process, the parameters of the membership functions were adjusted using a hybrid learning algorithm to minimize prediction error. Table 8 presents the comparison between experimental values and ANFIS-predicted outputs for the training dataset. It can be observed that the predicted values closely follow the experimental data, indicating that the model effectively captures the nonlinear behaviour of the process. However, minor deviations are observed in some cases, particularly in extreme parameter conditions, suggesting increased sensitivity of the model in those regions.
Table 8.
Training output responses vs. ANFIS-trained output responses.
Testing of ANFIS
The performance of the ANFIS model was evaluated using the testing dataset, which represents 15% of the total experimental data. The comparison between experimental and predicted outputs is presented in Table 9. The results indicate that the predicted values closely follow the experimental data across most samples.
Table 9.
Testing parameters and corresponding predicted output responses obtained using the ANFIS model.
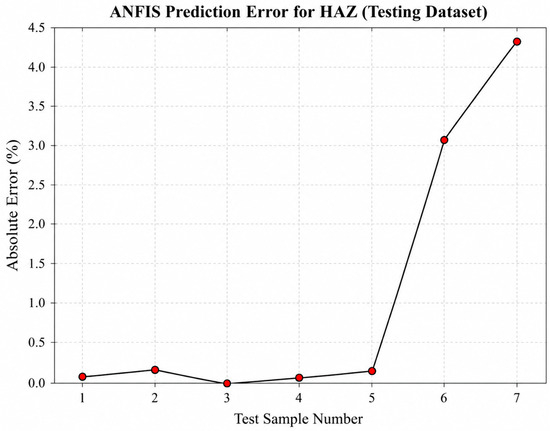
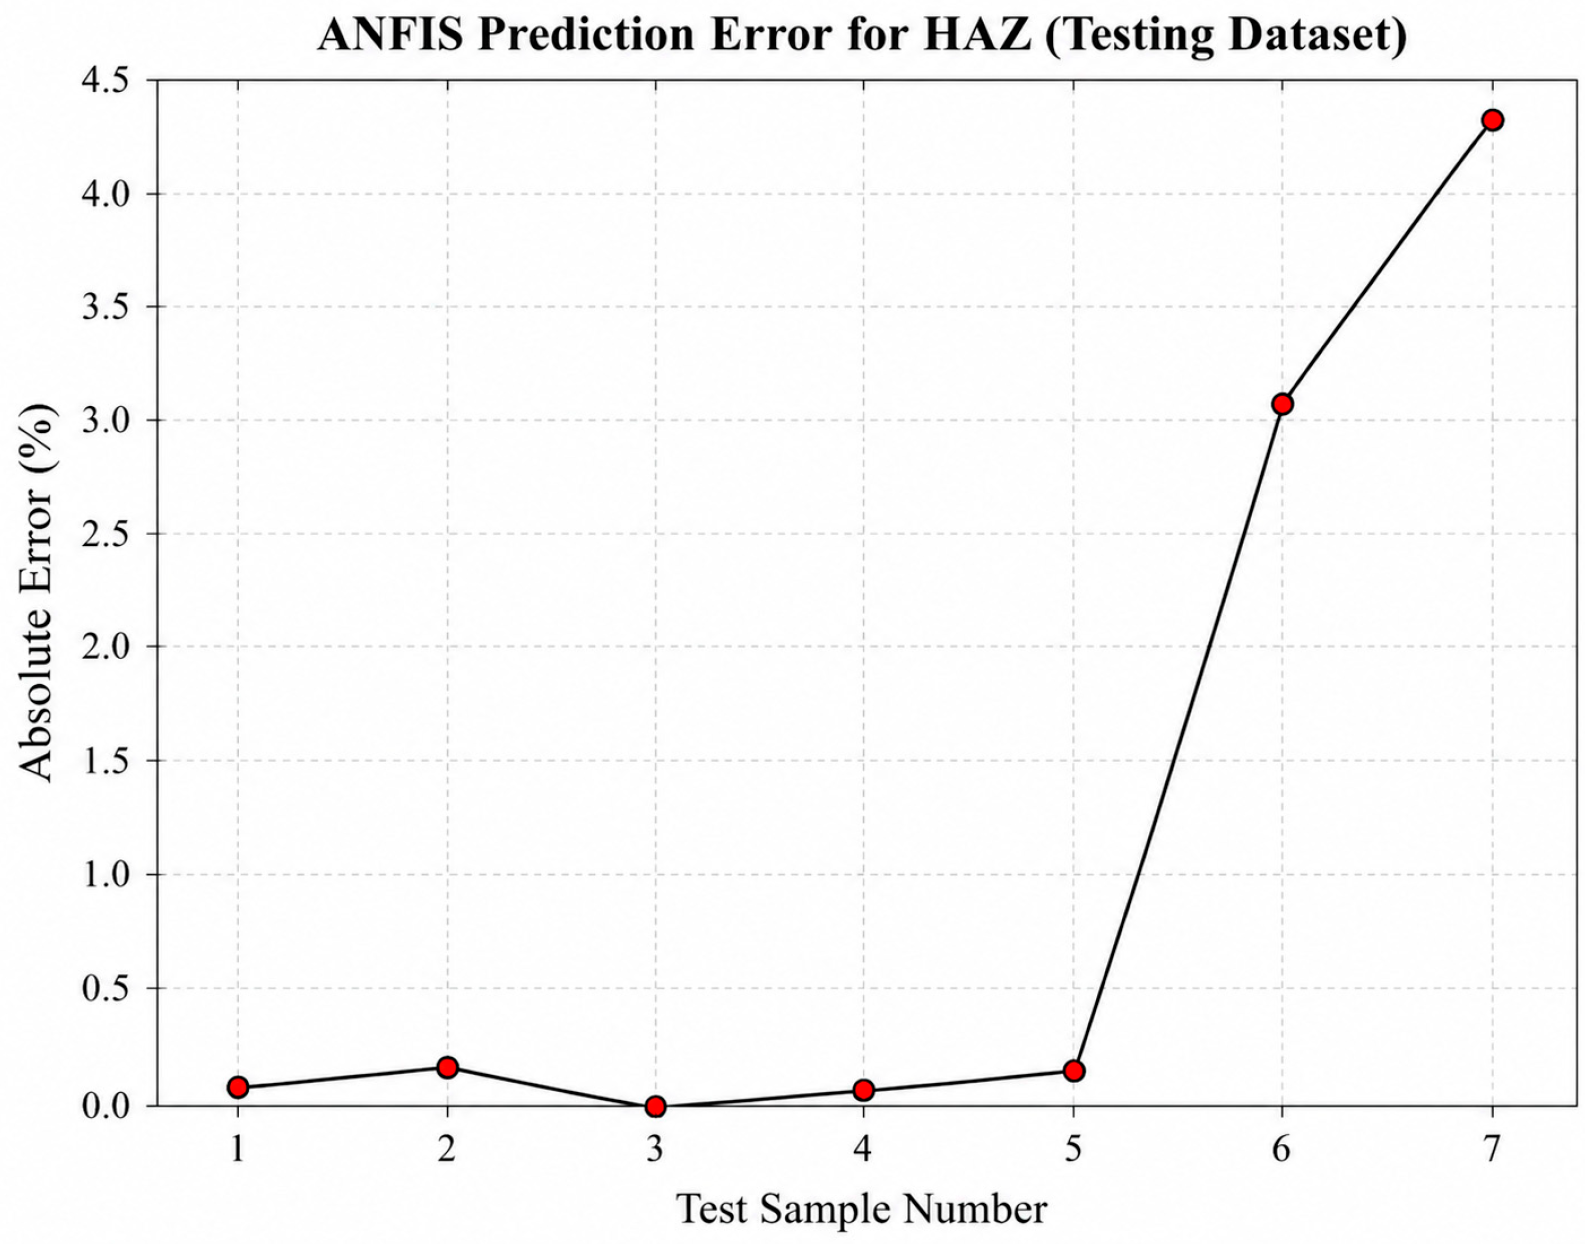
For HAZ, the comparison between experimental and predicted values is illustrated in Figure 13. It can be observed that the prediction error remains relatively low, indicating good model accuracy in capturing thermal behaviour.
Figure 13.
Error rate between HAZ experimental output vs. ANFIS testing predicted output.
Overall, the ANFIS model demonstrates strong generalization capability and provides more accurate predictions compared to the FLS, particularly in modelling nonlinear relationships.
Validation of ANFIS
The validation of the ANFIS model was performed using 15% of the experimental dataset that was not involved in the training process. The comparison between experimental and predicted outputs is presented in Table 10.
Table 10.
The experimental output parameters and ANFIS validation predicted output.
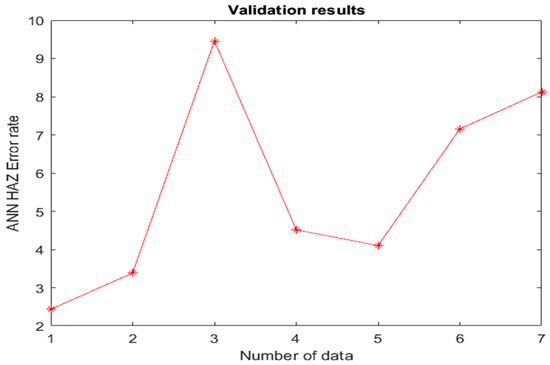
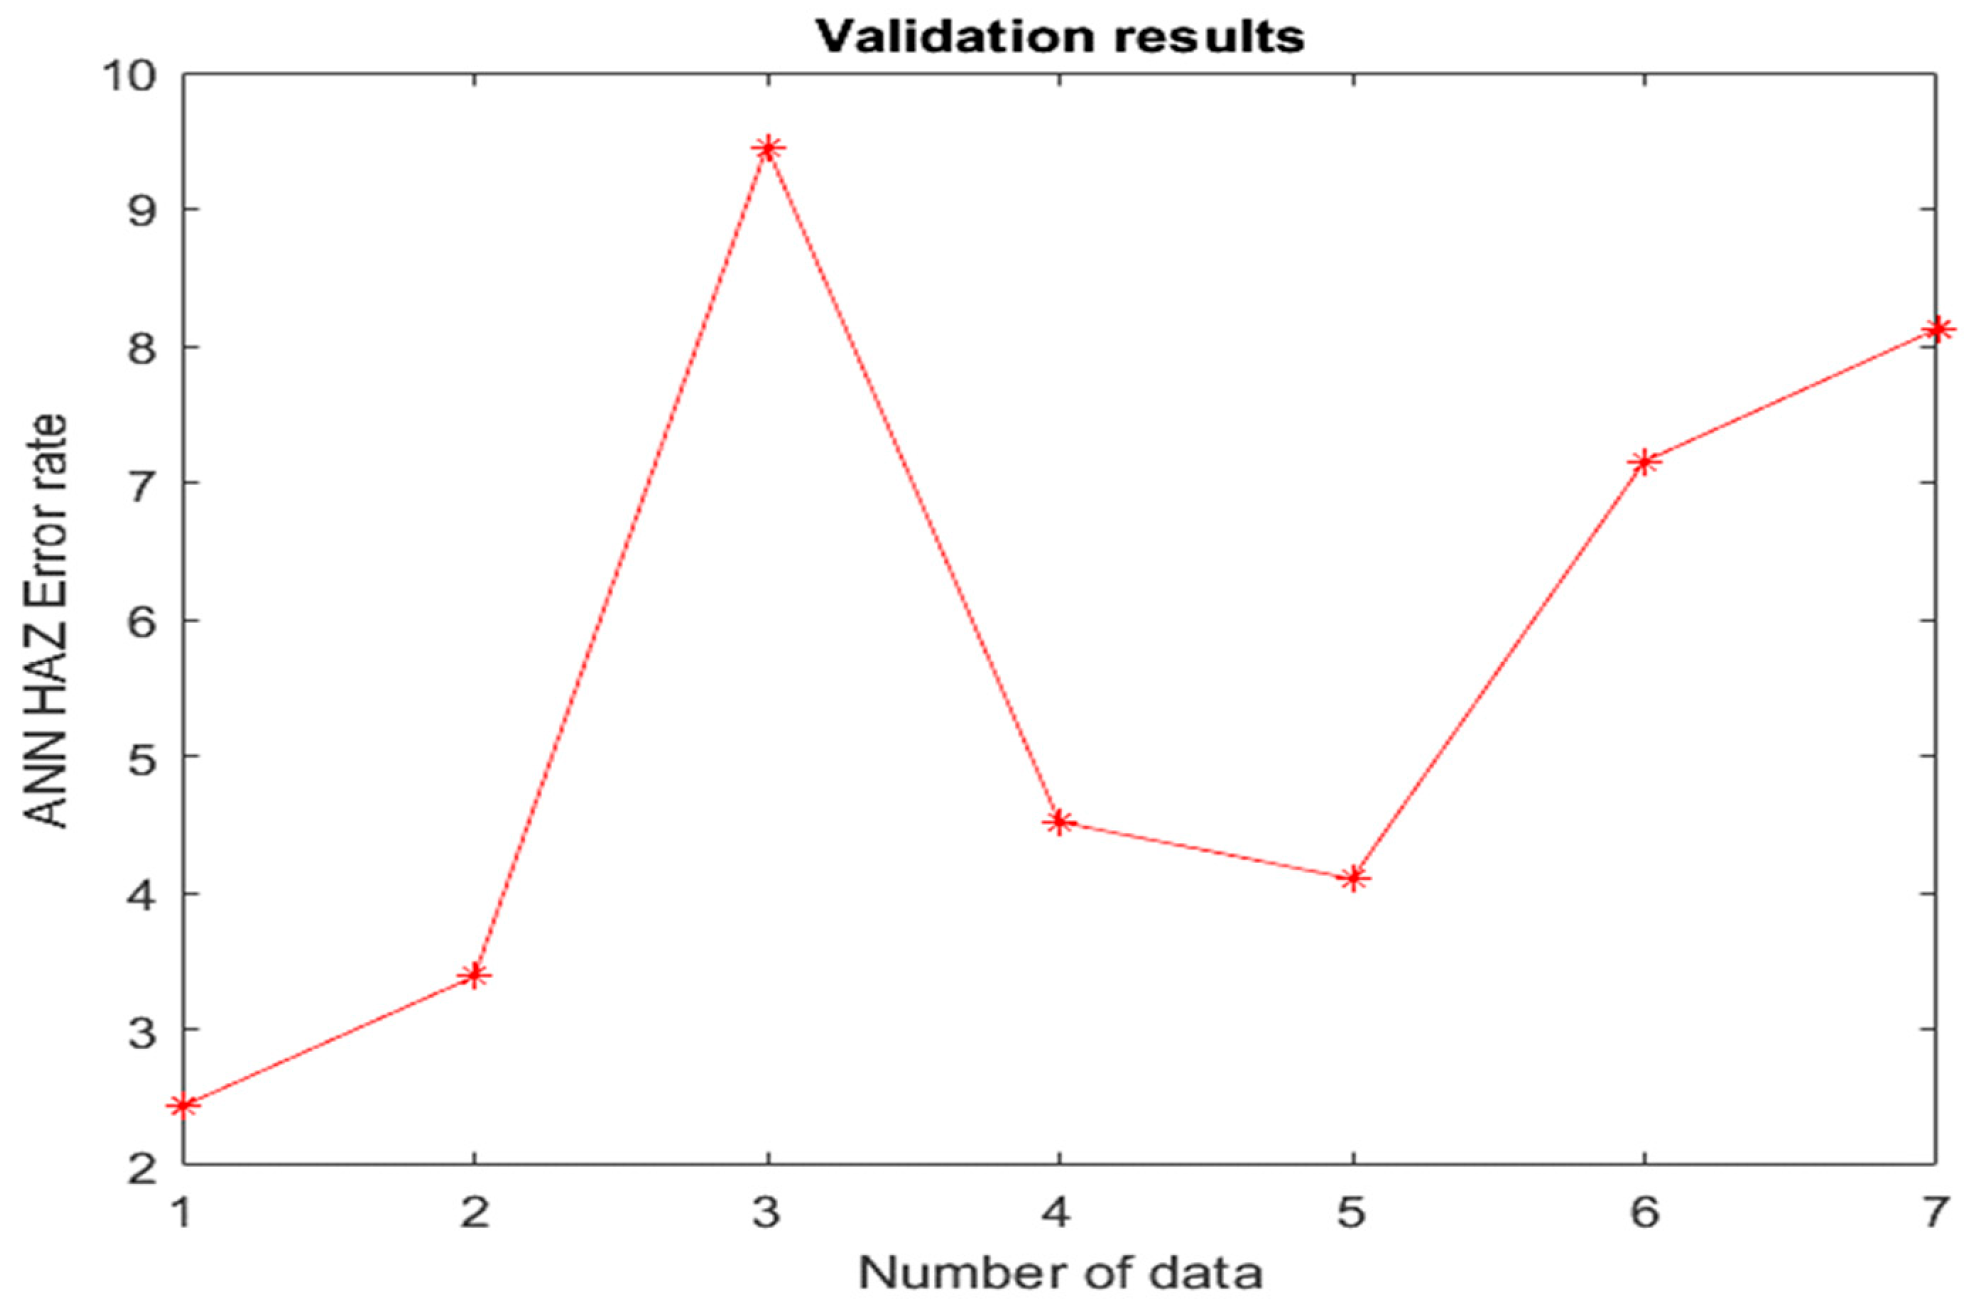
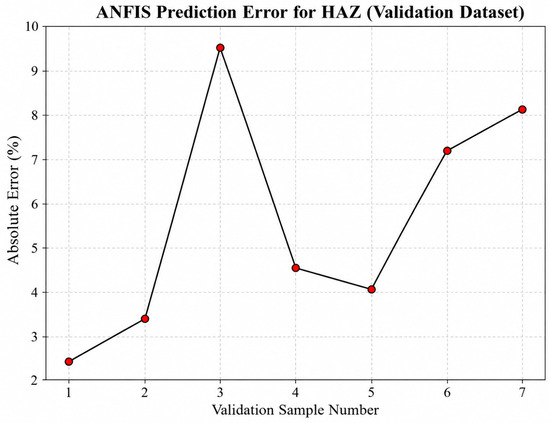
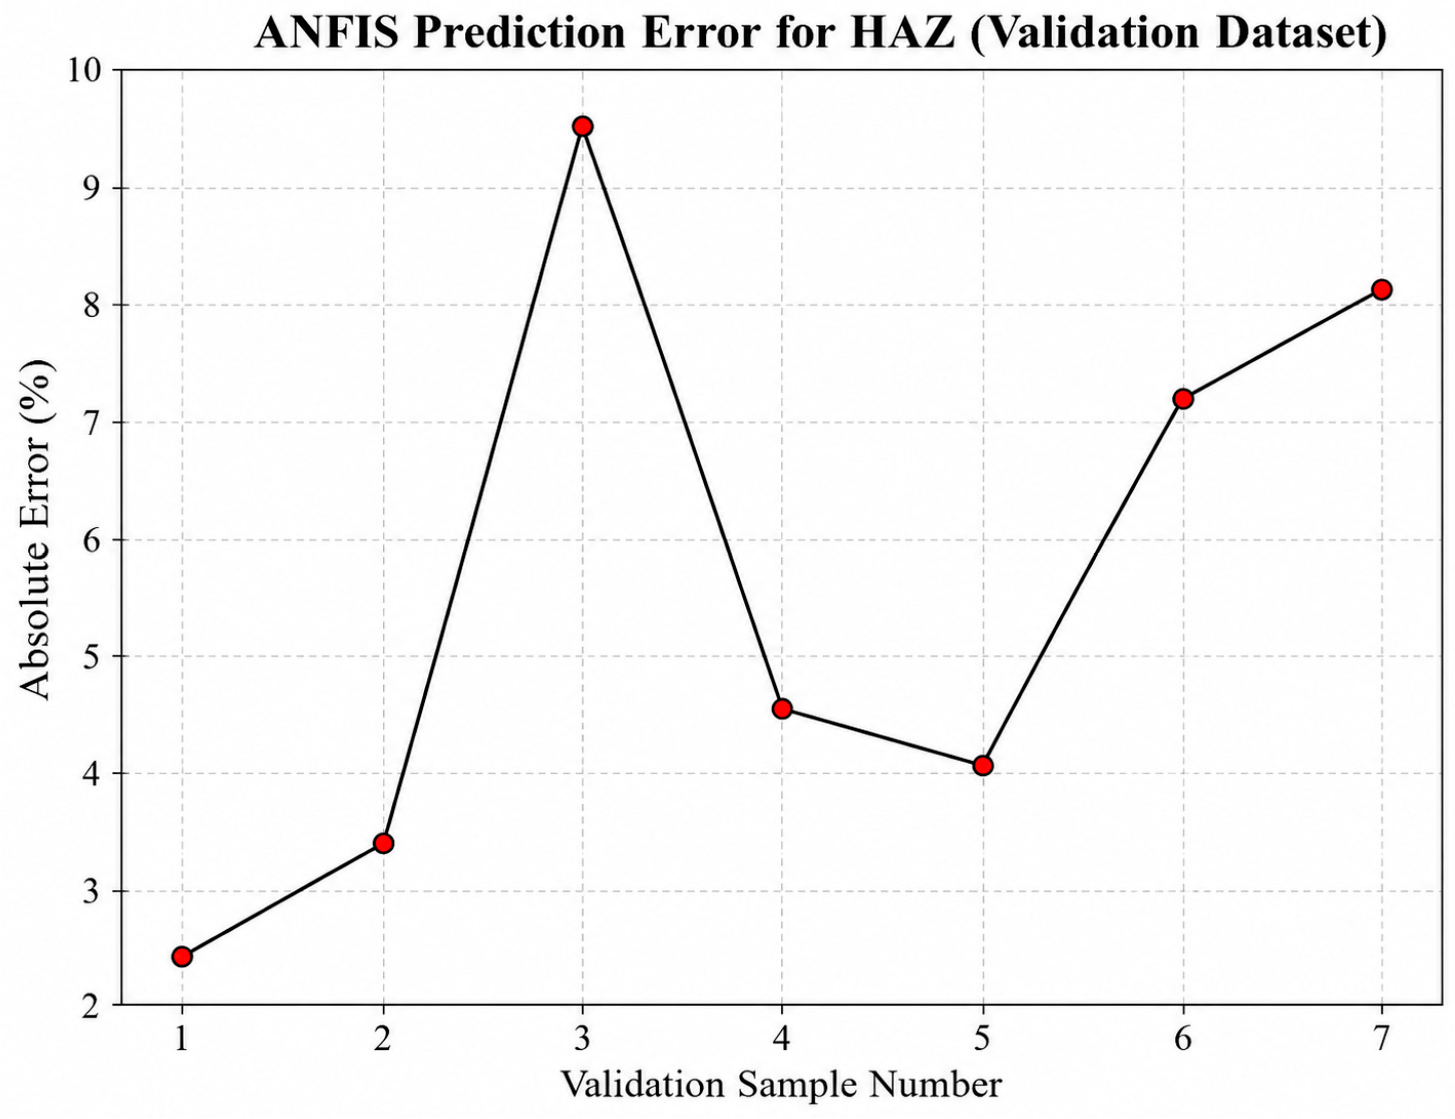
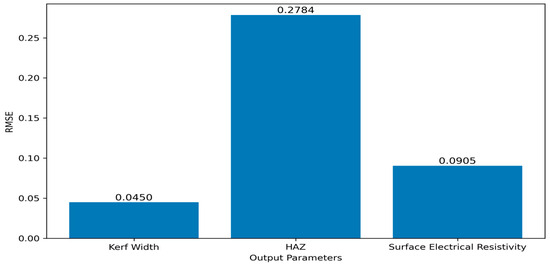
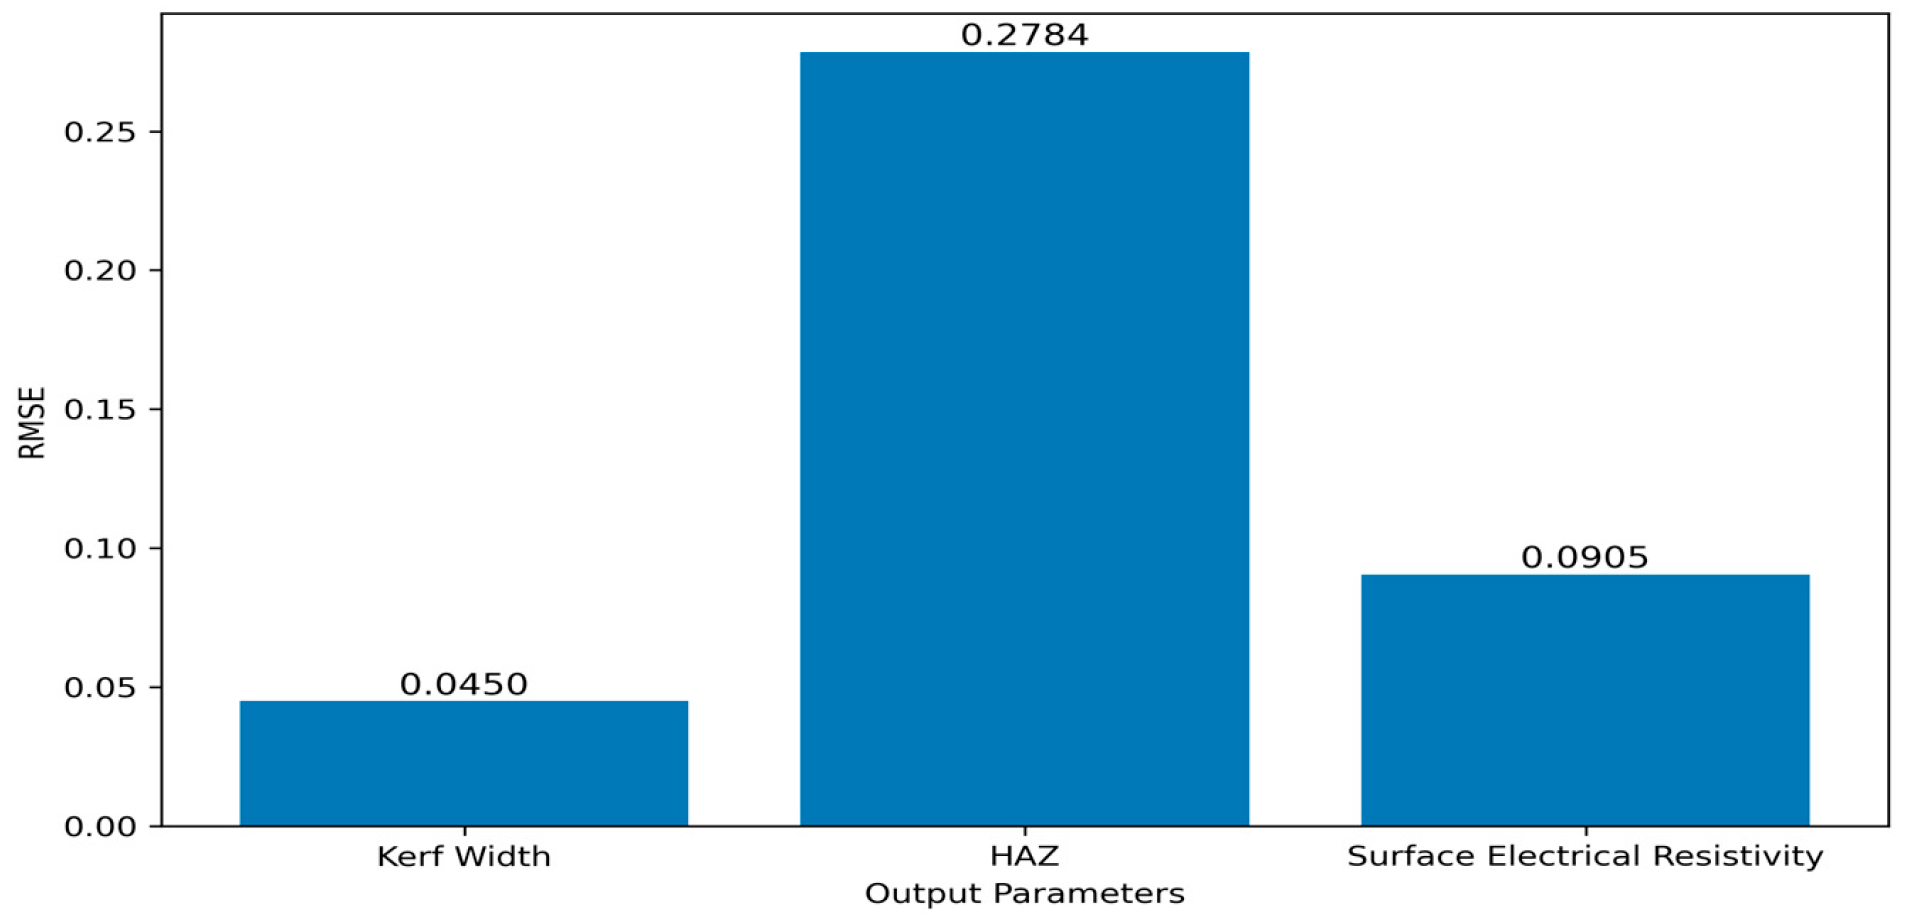
The results indicate that the predicted values closely follow the experimental data, confirming the robustness of the model. For HAZ, the comparison between experimental and predicted values is illustrated in Figure 13. It can be observed that the prediction error remains relatively low, demonstrating the ability of the ANFIS model to accurately capture complex thermal behaviour. Figure 14 presents the RMSE comparison of the ANFIS model outputs.
Figure 14.
Error rate between experimental HAZ values and validation predictions generated by the ANFIS model.
Overall, the validation results indicate that the ANFIS model has strong generalization capability and provides accurate predictions for unseen data.
RMSE of ANFIS
To quantitatively evaluate the prediction performance of the ANFIS model, the Root Mean Square Error (RMSE) was calculated using the validation dataset according to Equation (1). The RMSE values for HAZ, kerf width, and surface electrical resistivity were found to be 0.2784, 0.0450, and 0.0905, respectively. These results indicate that the ANFIS model achieved good prediction accuracy for all output responses, with the lowest error observed for kerf width. Although the RMSE value for HAZ was higher than those obtained for kerf width and surface electrical resistivity, it remained within an acceptable range, demonstrating the capability of the ANFIS model to capture the nonlinear relationship between the laser cutting parameters and the output responses. Overall, the results confirm that the ANFIS model provides satisfactory predictive performance for the investigated laser cutting process.
3. Discussion
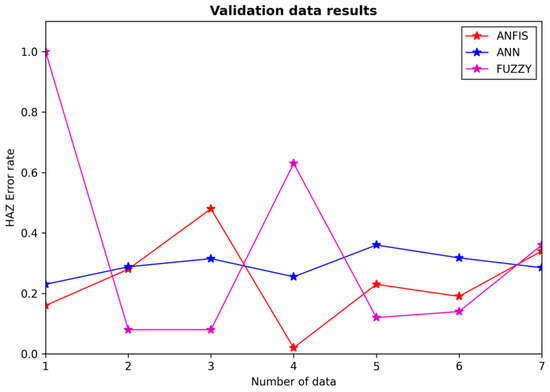
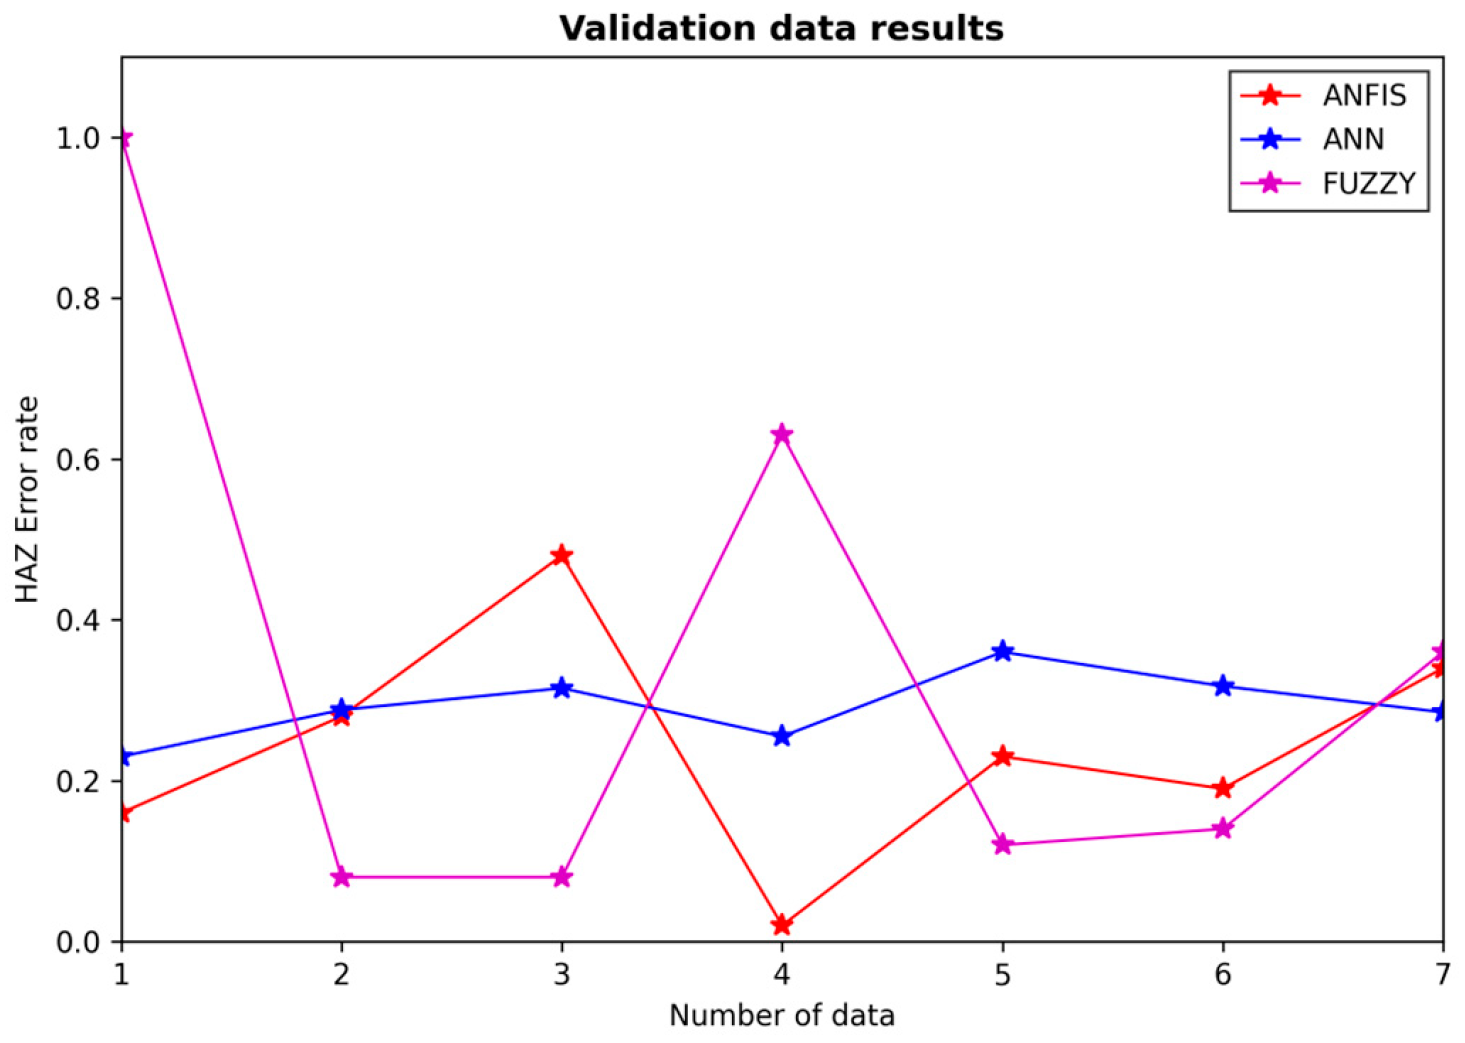
A comparative analysis of the prediction performance of ANN, FLS, and ANFIS models was conducted based on the validation results and RMSE evaluation. For HAZ, the comparison of validation errors is presented in Figure 15. It can be observed that the ANFIS achieved the lowest prediction error, with an RMSE value of 0.2784, followed closely by the ANN with an RMSE value of 0.2956. The FLS model produced a higher RMSE value of 0.4741. These results indicate that adaptive learning approaches are more effective in modelling the nonlinear thermal behaviour associated with the laser cutting process. Figure 16 demonstrates the closer agreement between the ANFIS predictions and the experimental HAZ values.
Figure 15.
RMSE comparison of ANFIS model outputs.
Figure 16.
Comparison of error rates between experimental HAZ values and validation predictions obtained using ANN, FLS, and ANFIS models.
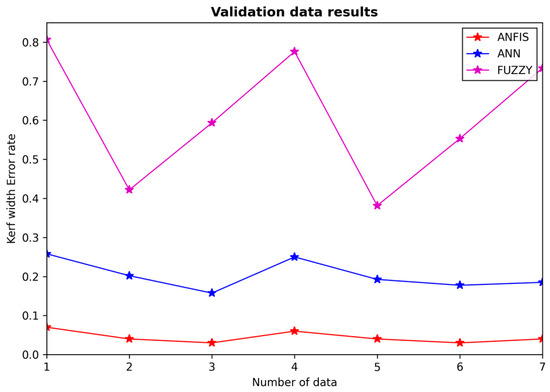
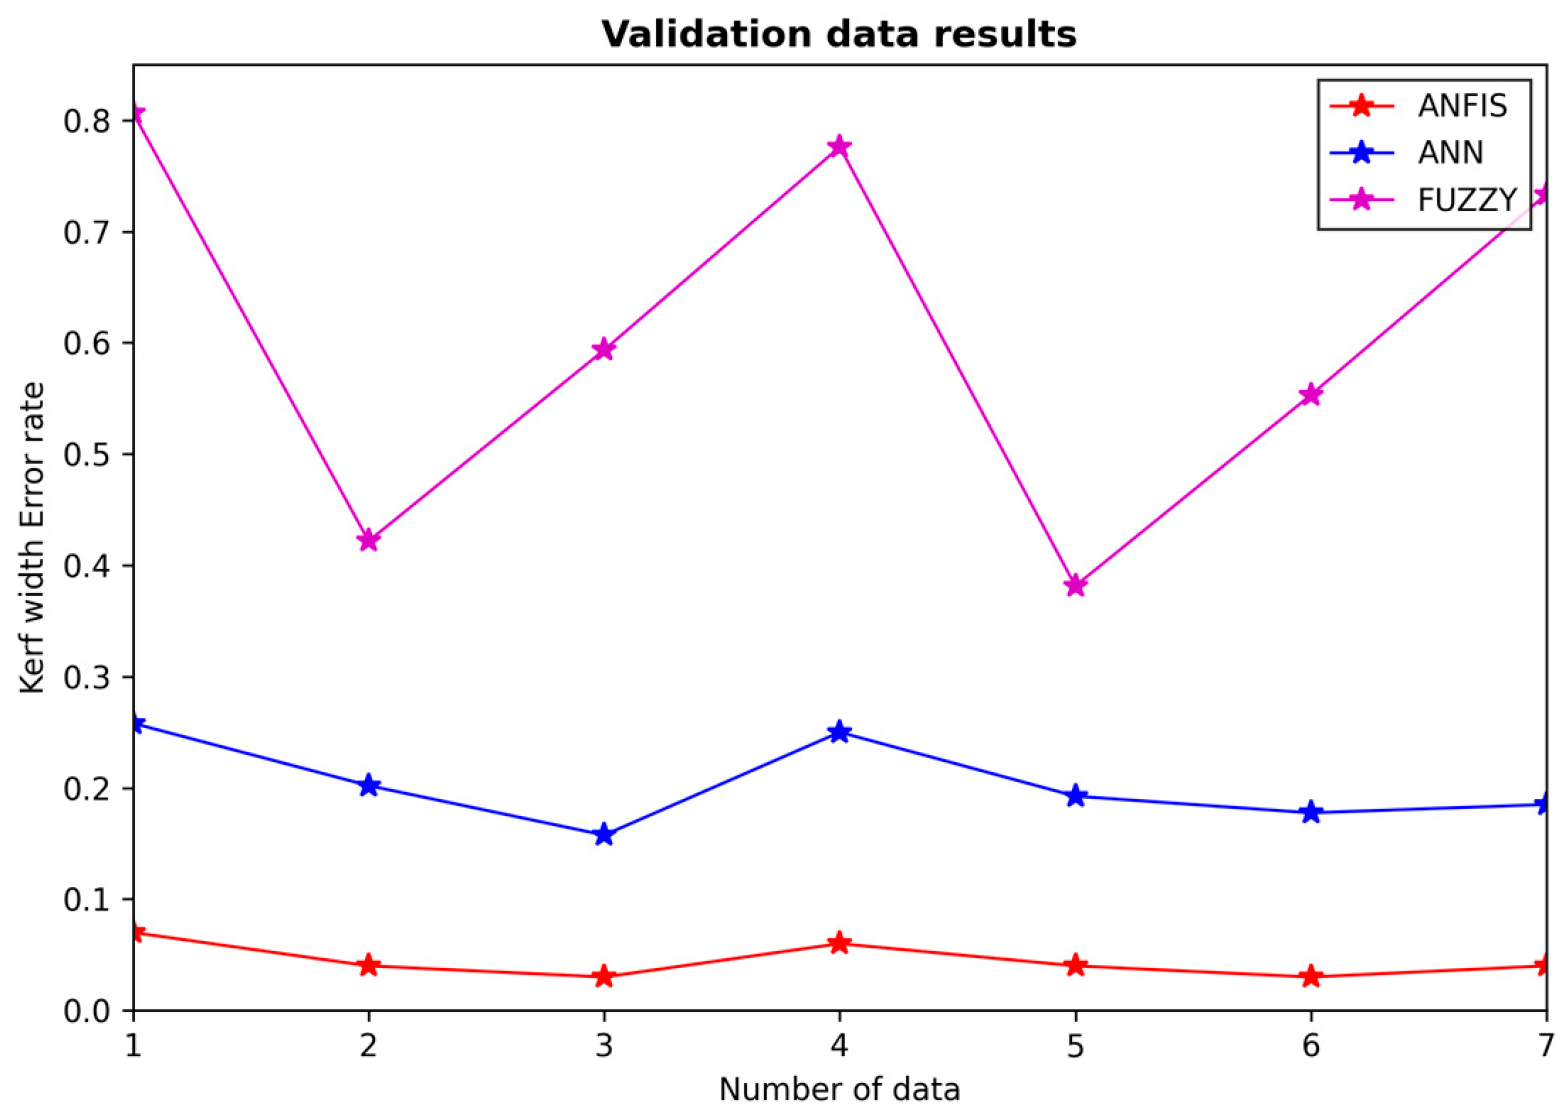
For kerf width, the comparison shown in Figure 17 demonstrates that ANFIS again outperformed the other models, achieving the lowest RMSE value of 0.0450. In comparison, the ANN produced an RMSE of 0.2061, while the FLS resulted in a higher RMSE of 0.6297. The validation curves presented in Figure 16 show that ANFIS predictions follow the experimental values more closely, indicating superior capability in modelling the geometrical characteristics of the kerf. Although ANN maintained an acceptable predictive performance, the deviations observed in the FLS suggest that a rule-based fuzzy structure alone is insufficient for accurately capturing the nonlinear relationship between laser cutting parameters and kerf formation.
Figure 17.
Comparison of error rates between experimental kerf width values and validation predictions generated by ANN, FLS, and ANFIS models.
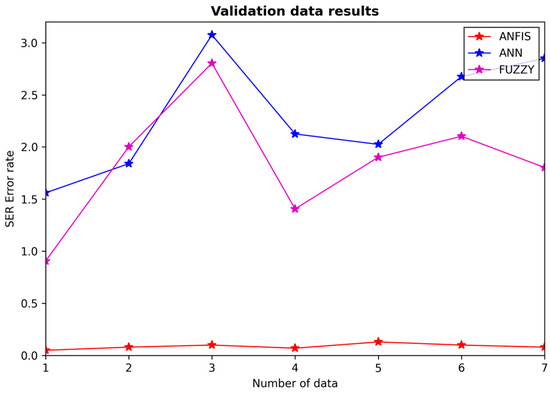
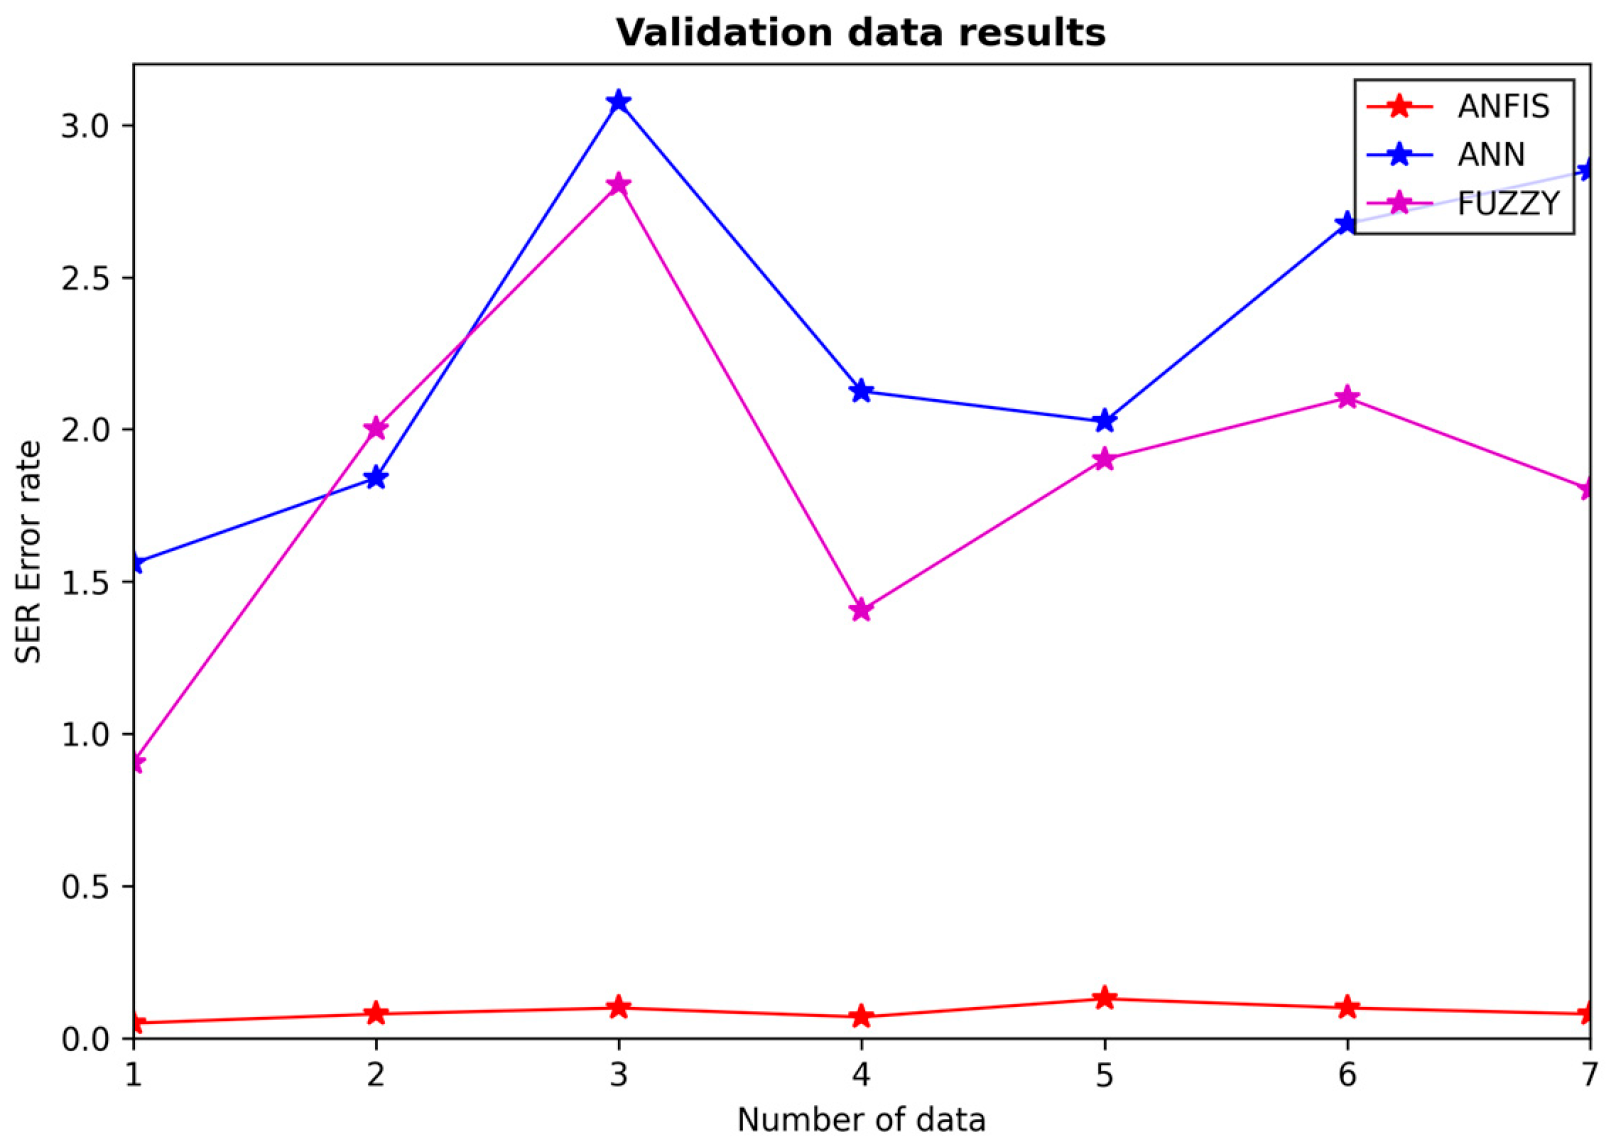
For surface electrical resistivity, the results in Figure 18 indicate a more pronounced difference between the three modelling approaches. The ANFIS achieved the lowest RMSE value of 0.0905, while the ANN and FLS produced larger RMSE values of 2.3655 and 1.9258, respectively. The validation results illustrated in Figure 17 confirm that the ANFIS maintained the closest agreement with the experimental resistivity values. This superior performance can be attributed to the ability of the ANFIS to combine adaptive learning with fuzzy reasoning, enabling it to effectively model the complex electrical behaviour of ABS/CNT nanocomposites.
Figure 18.
Comparison of error rates between experimental surface electrical resistivity values and validation predictions obtained using ANN, FLS, and ANFIS models.
Overall, the results presented in Figure 16, Figure 17 and Figure 18 consistently demonstrate that ANFIS provides the most accurate and reliable predictions across all output responses. The ANN achieved satisfactory performance, particularly for HAZ and kerf width prediction, but showed reduced accuracy for surface electrical resistivity. The FLS exhibited higher prediction errors than the ANFIS across all three responses. Therefore, among the investigated intelligent modelling techniques, the ANFIS can be considered the most effective approach for predicting HAZ, kerf width, and surface electrical resistivity in the CO2 laser cutting of ABS/CNT nanocomposites.
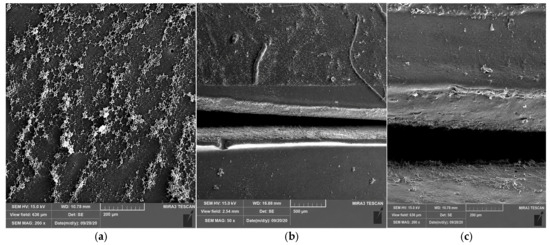
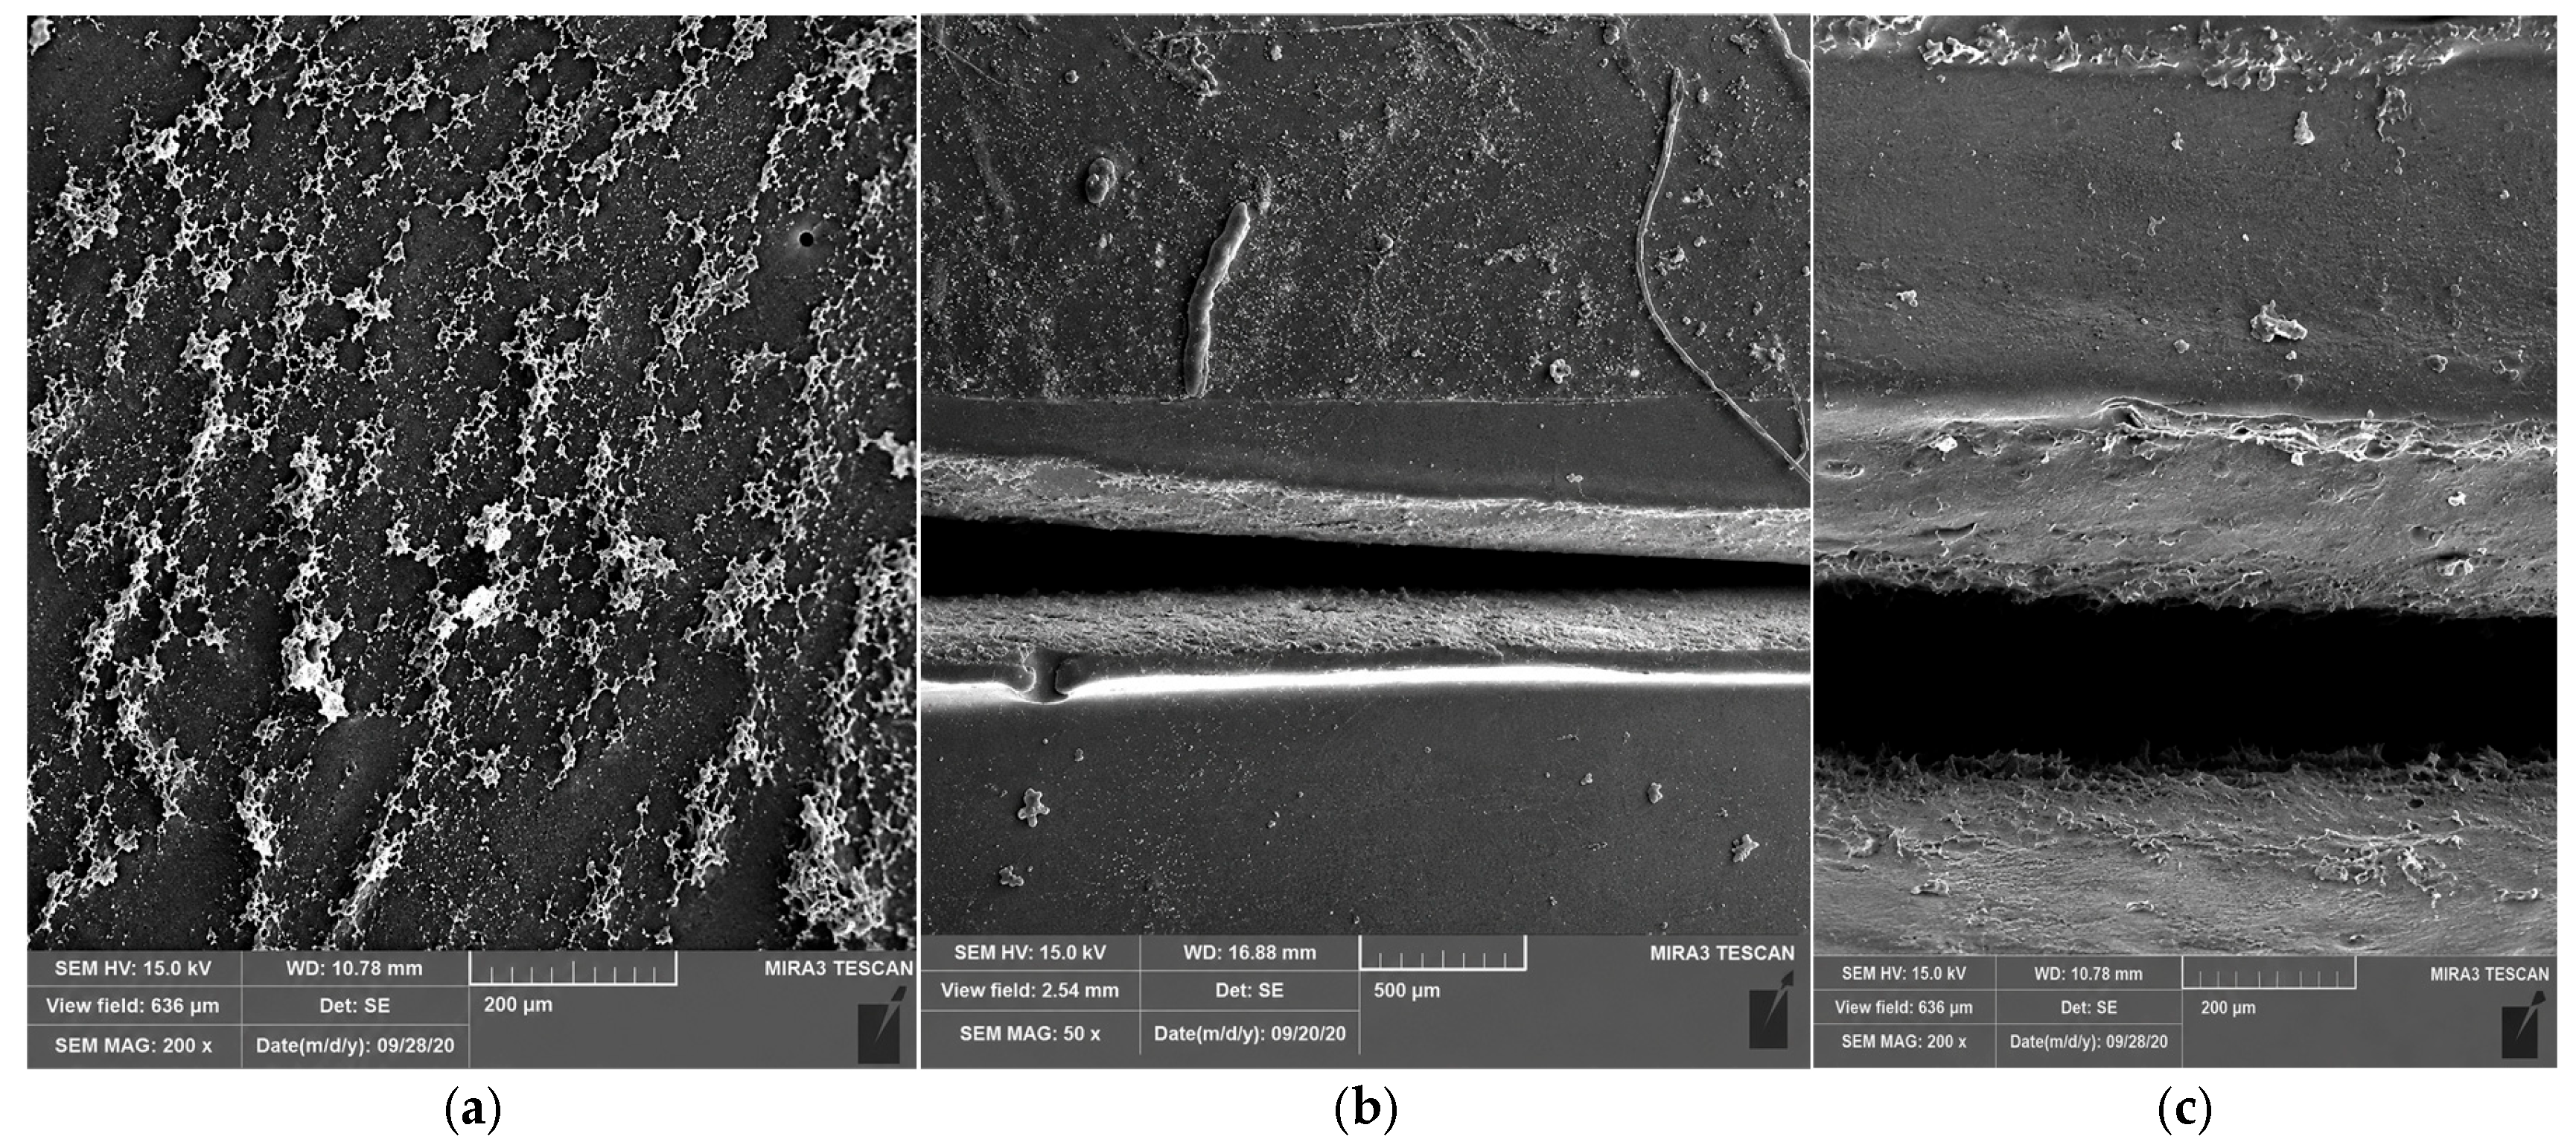
To further validate the predictive capability of the developed models, cross-sectional morphological analysis was performed for the laser cutting condition that yielded the most favourable combination of responses. Figure 19 presents representative FE-SEM micrographs of the cut surface for the optimal processing condition (sample #47, P = 45 W, V = 12 mm/s). The images show a clean kerf with minimal thermal damage and a narrow heat affected zone (HAZ). The kerf width and HAZ extent measured from these micrographs correspond closely to the values predicted by the ANFIS model for this condition, which demonstrated the highest accuracy among the investigated approaches. This experimental validation further supports the reliability of the proposed modelling framework for predicting and optimizing the CO2 laser cutting process of ABS/CNT nanocomposites.
Figure 19.
FE-SEM micrographs of the laser-cut cross-section obtained under the optimal processing condition (sample #47, P = 45 W, and V = 12 mm/s): (a) overall cut-surface morphology, (b) HAZ morphology, and (c) edge region showing kerf geometry.
4. Conclusions
To conclude, this study investigated the predictive efficiency of the ANN, FLS, and ANFIS in modelling the output responses of CO2 laser cutting of ABS/CNT nanocomposites. The models were developed using laser power and the cutting velocity as input variables, while the heat affected zone (HAZ), kerf width, and surface electrical resistivity were considered as output parameters. A comparative evaluation was conducted to assess the performance of each modelling approach.
The key findings of this study are summarized as follows:
- •
- The ANFIS achieved the highest prediction accuracy, yielding the lowest RMSE values of 0.2784 for HAZ, 0.0450 for kerf width, and 0.0905 for surface electrical resistivity, indicating its strong capability in modelling complex nonlinear relationships between process parameters and machining responses.
- •
- The ANN demonstrated a moderate predictive performance, achieving RMSE values of 0.2956 for HAZ, 0.2061 for kerf width, and 2.3655 for surface electrical resistivity. Although the model showed satisfactory prediction capability and a high correlation coefficient during training (R ≈ 0.99), its accuracy decreased when predicting unseen validation samples, particularly for surface electrical resistivity.
- •
- The FLS exhibited the lowest overall prediction performance, with RMSE values of 0.4741 for HAZ, 0.6297 for kerf width, and 1.9258 for surface electrical resistivity. While the fuzzy inference system was able to capture the general trends of the laser cutting process, the absence of adaptive learning capability limited its prediction accuracy, especially for geometrical responses.
- •
- The results indicate that the ANFIS is the most effective modelling technique among the investigated approaches, consistently outperforming both the ANN and FLS across all output parameters. The superior performance of the ANFIS can be attributed to its hybrid structure, which combines the learning capability of neural networks with the reasoning mechanism of fuzzy logic. This integration enables the model to better capture the complex nonlinear interactions governing HAZ formation, kerf geometry, and surface electrical resistivity.
- •
- Overall, the findings demonstrate that ANFIS provides a reliable and accurate predictive framework for the modelling and optimization of CO2 laser cutting processes involving advanced ABS/CNT nanocomposite materials. Therefore, ANFIS can be considered a promising intelligent modelling tool for future manufacturing applications requiring the accurate prediction of multiple output responses.
Author Contributions
Conceptualization, R.B., M.M. and R.K.; Methodology, R.B., M.M. and R.K.; Software, R.B.; Validation, R.B. and M.M.; Formal analysis, R.B.; Investigation, R.B. and M.M.; Data curation, R.B. and R.K.; Writing—original draft, R.B.; Writing—review and editing, M.M. and R.K.; Visualization, R.B. and R.K.; Supervision, M.M. All authors have read and agreed to the published version of the manuscript.
Funding
This research received no external funding.
Data Availability Statement
The data presented in this study are openly available in [Optics and Laser Technology] at [https://doi.org/10.1016/j.optlastec.2022.108973] (accessd on 23 December 2022).
Conflicts of Interest
The authors declare no conflicts of interest.
References
- Ma, W.; Li, X.; Qin, Y.; Chen, W.; Hu, G. High-power spatiotemporal mode-locked Yb-doped fiber laser based on transverse modes division control. Opt. Lett. 2025, 50, 5202–5205. [Google Scholar] [CrossRef] [Scilit] [PubMed]
- Liu, X.; Xie, L.; Hu, Q.; Zhu, B.; Liu, W.; Ye, F.; Li, J. Precipitate and dislocation regulation of laser melting deposited AlMgScZr alloy by cryogenic treatment with subsequent aging. J. Rare Earths, 2026; in press.
- Ghavidel, A.K.; Lawrence, J.; Moradi, M. Influence of the different nanostructures of acrylonitrile butadiene styrene/carbon nanotubes nanocomposites on laser cutting properties: Machining and chemical aspects. Opt. Laser Technol. 2023, 160, 108973. [Google Scholar] [CrossRef] [Scilit]
- Moradi, M.; Mehrabi, O.; Azdast, T.; Benyounis, K.Y. Enhancement of low-power CO2 laser cutting process for injection molded polycarbonate. Opt. Laser Technol. 2017, 96, 208–218. [Google Scholar] [CrossRef] [Scilit]
- Ma, Y.; Guan, Y. Recent progress on laser-assisted machining for silicon carbide materials. J. Manuf. Process. 2025, 151, 623–654. [Google Scholar] [CrossRef] [Scilit]
- Lin, J.; Yang, W.; Wu, P.; Long, Y.; Long, J. Preparation of ultrathin porous wick structures used for two-phase cooling by controlled deposition of ultrafast-laser-ablated products. Opt. Laser Technol. 2026, 193, 114163. [Google Scholar] [CrossRef] [Scilit]
- Wang, Q.; Chen, X.; An, Q.; Chen, M.; Xu, B.; Guo, H.; He, Y. Research on the method for improving the cutting performance of forming tools based on the non-uniform passivation of the cutting edge. Int. J. Adv. Manuf. Technol. 2025, 138, 3975–3987. [Google Scholar] [CrossRef] [Scilit]
- Tamrin, K.F.; Nukman, Y.; Choudhury, I.A.; Shirley, S. Multiple-objective optimization in precision laser cutting of different thermoplastics. Opt. Lasers Eng. 2015, 67, 57–65. [Google Scholar] [CrossRef] [Scilit]
- Genna, S.; Menna, E.; Rubino, G.; Tagliaferri, V. Experimental investigation of industrial laser cutting: The effect of the material selection and the process parameters on the kerf quality. Appl. Sci. 2020, 10, 4956. [Google Scholar] [CrossRef] [Scilit]
- Singh, Y.; Singh, J.; Sharma, S.; Sharma, A.; Chohan, J.S. Process parameter optimization in laser cutting of coir fiber reinforced epoxy composite—A review. Mater. Today Proc. 2022, 48, 1021–1027. [Google Scholar] [CrossRef] [Scilit]
- Ghavidel, A.K.; Azdast, T.; Shabgard, M.; Navidfar, A.; Shishavan, S.M. Effect of carbon nanotubes on laser cutting of multi-walled carbon nanotubes/poly methyl methacrylate nanocomposites. Opt. Laser Technol. 2015, 67, 119–124. [Google Scholar] [CrossRef] [Scilit]
- Ghavidel, A.K.; Zadshakouyan, M. Dimensional accuracy of CNTs/PMMA parts and holes produced by laser cutting. Appl. Sci. 2017, 11, 1736–1741. [Google Scholar]
- Zhang, Z.; He, R.; Han, B.; Ren, S.; Fan, J.; Wang, H.; Ma, Z. Magnetically Switchable Adhesive Millirobots for Universal Manipulation in both Air and Water. Adv. Mater. 2025, 37, 2420045. [Google Scholar] [CrossRef] [Scilit] [PubMed]
- Zhang, W.; Yu, X.; Wang, Y.; Zhan, X.; Zhang, H.; Di, X.; Chen, L.; Zhang, H.; Fu, Q.; Yin, L.; et al. A Low Noise Readout Circuit With Input-Common-Mode-Feedback Charge Sensitive Amplifier Using Differential Pseudo Resistors for MEMS Gyroscopes. IEEE Trans. Circuits Syst. I Regul. Pap. 2025, 72, 6436–6448. [Google Scholar] [CrossRef] [Scilit]
- Wang, C.; Zhang, Z.; Jing, X.; Yang, Z.; Xu, W. Optimization of multistage femtosecond laser drilling process using machine learning coupled with molecular dynamics. Opt. Laser Technol. 2022, 156, 108442. [Google Scholar] [CrossRef] [Scilit]
- Zhang, Z.; Yang, Z.; Wang, C.; Xu, W. Accelerating ultrashort pulse laser micromachining process comprehensive optimization using a machine learning cycle design strategy integrated with a physical model. J. Intell. Manuf. 2024, 35, 449–465. [Google Scholar] [CrossRef] [Scilit]
- Zhang, Z.; Liu, S.; Zhang, Y.; Wang, C.; Zhang, S.; Yang, Z.; Xu, W. Optimization of low-power femtosecond laser trepan drilling by machine learning and a high-throughput multi-objective genetic algorithm. Opt. Laser Technol. 2022, 148, 107688. [Google Scholar] [CrossRef] [Scilit]
- Yang, K.; Li, X.; Zhang, Z. Ultrafast beam steering with microradian tracking accuracy via feedforward tuning and real-time error compensation. Control Eng. Pract. 2025, 165, 106521. [Google Scholar] [CrossRef] [Scilit]
- Lv, T.; Xia, Y.; Murugan, S.P.; Okigami, F.; Ghassemi-Armaki, H.; Carlson, B.E.; Li, Y. Multi-physical process simulation of resistance spot welding available for synthetic data generation. J. Manuf. Process. 2025, 141, 709–724. [Google Scholar] [CrossRef] [Scilit]
- Liu, J.; Ma, C.; Li, M.; He, J.; Totis, G.; Hua, C.; Cui, G.; Wang, L.; Xue, R.; Tan, Z.; et al. A real-time spatiotemporal error compensation framework for face gear grinding. Eng. Appl. Artif. Intell. 2025, 162, 112429. [Google Scholar] [CrossRef] [Scilit]
- Wang, Q.; Yin, Z.; He, Y.; Wang, S.; Chen, X.; Zhang, C. Process optimization of electrolytic-assisted milling for titanium alloy based on numerical simulation and experimental study. Int. J. Adv. Manuf. Technol. 2026, 144, 6365–6384. [Google Scholar] [CrossRef] [Scilit]
- Madić, M.; Radovanović, M. Comparative modeling of CO2 laser cutting using multiple regression analysis and artificial neural network. Int. J. Phys. Sci. 2012, 7, 2422–2430. [Google Scholar] [CrossRef] [Scilit]
- Kechagias, J.D.; Ninikas, K.; Stavropoulos, P.; Salonitis, K. A generalised approach on kerf geometry prediction during CO2 laser cut of PMMA thin plates using neural networks. Lasers Manuf. Mater. Process. 2021, 8, 372–393. [Google Scholar] [CrossRef] [Scilit]
- Samura, L.; Hidayat, R.; Prasetyo, A.; Widodo, S. A new mathematical model for optimizing laser cutting parameters to improve fabric quality. J. Vibroeng. 2024, 26, 699–711. [Google Scholar]
- Alalawin, A.; AlAlaween, W.H.; Shbool, M.A.; Abdallah, O.; Al-Qatawneh, L. An interpretable predictive modelling framework for the turning process by the use of a compensated fuzzy logic system. Prod. Manuf. Res. 2022, 10, 89–107. [Google Scholar] [CrossRef] [Scilit]
- Pandey, A.K.; Dubey, A.K. Multiple quality optimization in laser cutting of difficult-to-laser-cut material using grey–fuzzy methodology. Int. J. Adv. Manuf. Technol. 2012, 65, 421–431. [Google Scholar] [CrossRef] [Scilit]
- Basar, G.; Der, O.; Guvenc, M.A. AI-powered hybrid metaheuristic optimization for predicting surface roughness and kerf width in CO2 laser cutting of 3D-printed PLA-CF composites. J. Thermoplast. Compos. Mater. 2025, 38, 2688–2717. [Google Scholar] [CrossRef] [Scilit]
- Rajamani, D.; Kumar, M.S.; Balasubramanian, E.; Tamilarasan, A. Nd:YAG laser cutting of Hastelloy C276: ANFIS modeling and optimization through WOA. Mater. Manuf. Process. 2021, 36, 1746–1760. [Google Scholar] [CrossRef] [Scilit]
- Chaki, S.; Bose, D.; Bathe, R.N. Multi-objective optimization of pulsed Nd:YAG laser cutting process using entropy-based ANN–PSO model. Lasers Manuf. Mater. Process. 2020, 7, 88–110. [Google Scholar] [CrossRef] [Scilit]
- Ji, M.; Krajnik, P.; Pimenov, D.Y.; Mia, M.; Gupta, M.K. Prediction and optimization kerf width in laser beam machining of titanium alloy using genetic algorithm tuned adaptive neuro-fuzzy inference system. Int. J. Adv. Manuf. Technol. 2024, 132, 5873–5893. [Google Scholar] [CrossRef] [Scilit]
- Tatachar, A.V. Comparative assessment of regression models based on model evaluation metrics. Int. Res. J. Eng. Technol. (IRJET) 2021, 8, 853–860. [Google Scholar]
- Sada, S.O.; Ikpeseni, S.C. Evaluation of ANN and ANFIS modeling ability in the prediction of AISI 1050 steel machining performance. Heliyon 2021, 7, e06136. [Google Scholar] [CrossRef] [Scilit] [PubMed]
- Kechagias, J.D.; Tsiolikas, A.; Petousis, M.; Ninikas, K.; Vidakis, N.; Tzounis, L. A robust methodology for optimizing the topology and the learning parameters of an ANN for accurate predictions of laser-cut edges surface roughness. Simul. Model. Pract. Theory 2022, 114, 102414. [Google Scholar] [CrossRef] [Scilit]
- Alhawsawi, A.M.; Moustafa, E.B.; Fujii, M.; Banoqitah, E.M.; Elsheikh, A. Kerf characteristics during CO2 laser cutting of polymeric materials: Experimental investigation and machine learning-based prediction. Eng. Sci. Technol. Int. J. 2023, 46, 101519. [Google Scholar] [CrossRef] [Scilit]
- Sivaraos; Zuhair, A.K.; Salleh, M.S.; Ali, M.A.M.; Kadirgama, U.K.; Dubey, U.K.; Pujari, S.; Sivakumar, L.D. Artificial neural network predictive modelling of laser micro-grooving for commercial pure titanium (CP Ti) Grade 2. J. Mech. Eng. 2021, 18, 217–234. [Google Scholar] [CrossRef] [Scilit]
- Kang, Y.; Yao, L.; Wang, H. Fault isolation and fault-tolerant control for Takagi–Sugeno fuzzy time-varying delay stochastic distribution systems. IEEE Trans. Fuzzy Syst. 2022, 30, 1185–1195. [Google Scholar] [CrossRef] [Scilit]

Disclaimer/Publisher’s Note: The statements, opinions and data contained in all publications are solely those of the individual author(s) and contributor(s) and not of MDPI and/or the editor(s). MDPI and/or the editor(s) disclaim responsibility for any injury to people or property resulting from any ideas, methods, instructions or products referred to in the content. |
© 2026 by the authors. Licensee MDPI, Basel, Switzerland. This article is an open access article distributed under the terms and conditions of the Creative Commons Attribution (CC BY) license.