


Abstract
Plunger lift systems are vital for optimizing production in gas wells, but their performance can be compromised by various operational anomalies. Traditional diagnostic methods and conventional convolutional neural network (CNN) approaches often struggle with the complex, transient data from these systems, particularly in capturing long-range temporal dependencies and generalizing from limited, imbalanced datasets. This study presents an enhanced diagnostic framework for plunger lift anomaly detection by leveraging the strengths of a pre-trained Vision Transformer (ViT). The methodology transforms one-dimensional time-series pressure data into two-dimensional image representations using the element-wise summation of Gramian Angular Summation Field (GASF) and Gramian Angular Difference Field (GADF), which simultaneously preserves global operational trends and local transient dynamics for vision model analysis. The ViT model, initialized with pre-trained weights, is further optimized using Bayesian optimization (BO) for hyperparameter tuning, and a tailored data augmentation pipeline is employed to improve robustness. Comparative evaluations demonstrate that the proposed ViT-based approach, particularly the ViT + GAF + BO model, significantly outperforms baseline CNN models and their optimized variants, achieving the highest Precision, Recall, and F1-score, with an F1-score of 0.93. Visualizations using t-SNE confirm the ViT’s superior capability in learning discriminative features, showcasing well-separated clusters for different operational conditions compared to CNNs. This research underscores the potential of pre-trained ViTs combined with appropriate data representation and optimization techniques for achieving accurate and reliable anomaly detection in plunger lift systems.
1. Introduction
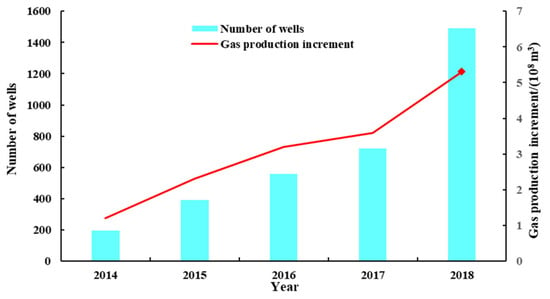
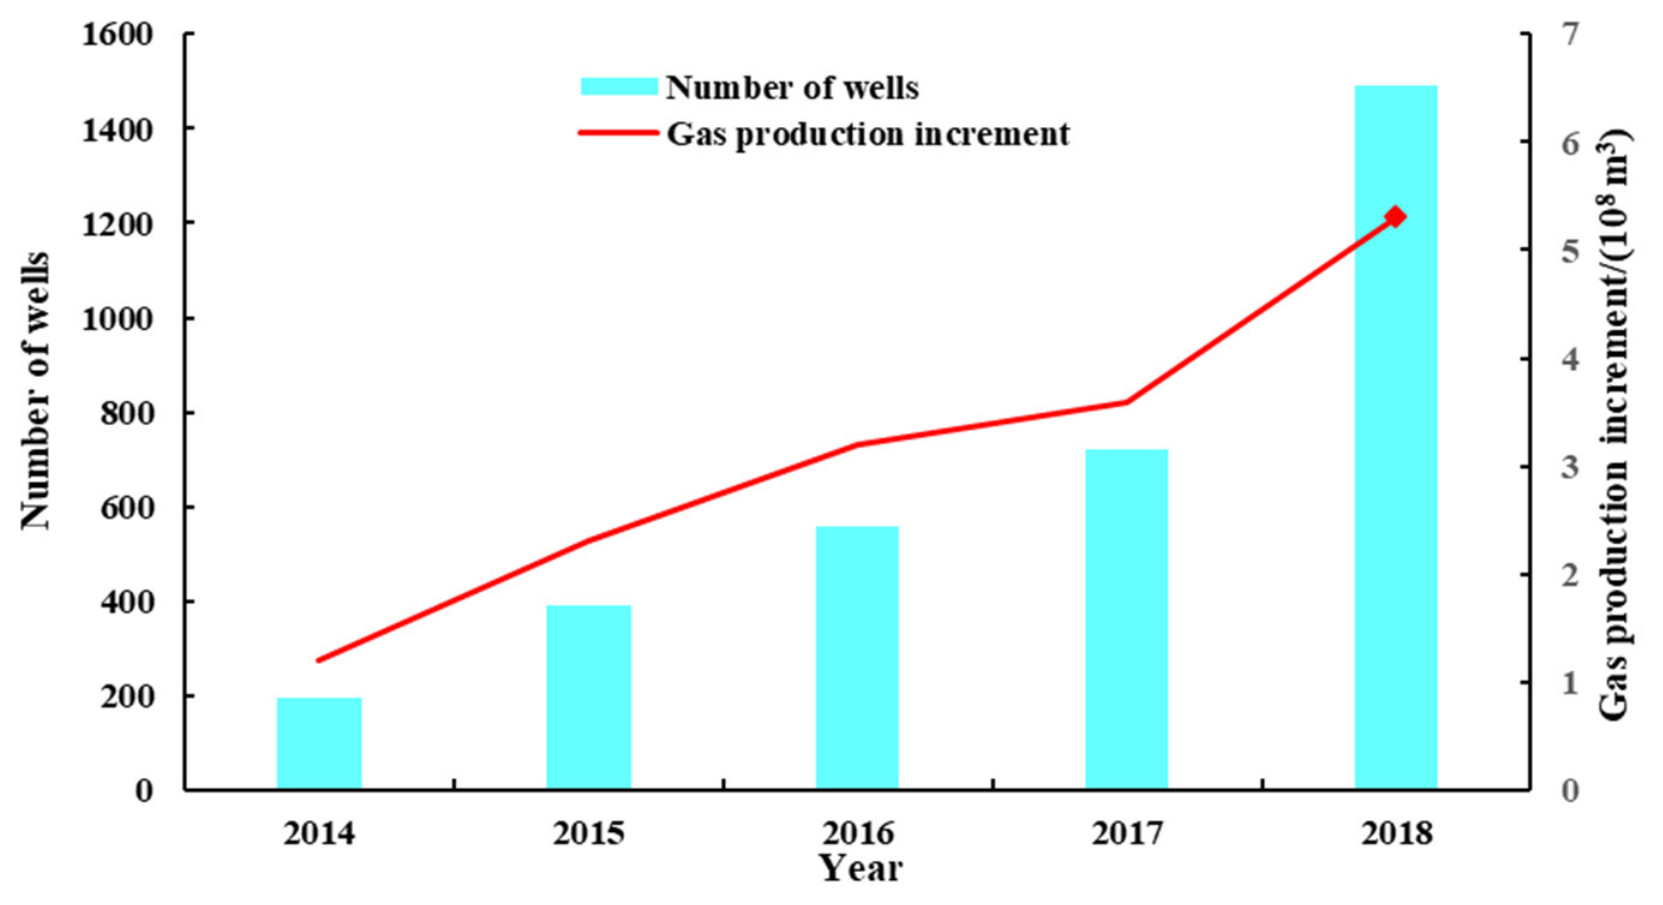
As a gas reservoir depletes, formation pressure significantly declines, leading to water encroachment from the edges, rising bottom water levels, and water influx into wellbores. If produced water is not discharged promptly, the accumulated liquid at the bottom of the well increases back pressure, reduces gas production, and, in severe cases, can result in flooding and halt production entirely [1,2]. Liquid accumulation elevates bottom-hole back pressure, reducing production rate and potentially causing liquid loading. Liquid loading initiates when the gas velocity falls below the critical liquid-carrying velocity defined by the Turner or Coleman criterion, resulting in liquid fallback. A complete liquid-loading lock occurs when the accumulated liquid column exerts a hydrostatic back pressure that exceeds the reservoir inflow pressure, mathematically expressed as + , effectively halting gas production until external energy intervention such as plunger lift is applied. Prolonged liquid retention can severely contaminate and damage gas reservoirs, further impacting gas production and overall hydrocarbon recovery [3]. To address the challenges of liquid loading and restore stable production in gas wells, plunger lift systems are widely utilized globally due to the simple design, cost-effectiveness, and low energy requirements [4,5,6]. Consequently, the number of new wells equipped with plunger lift systems in typical gas fields in China has steadily increased, resulting in a consistent rise in gas production over time, as illustrated in Figure 1 below [7].
Figure 1.
Yearly plunger lift applications for a typical gas field in China [7].
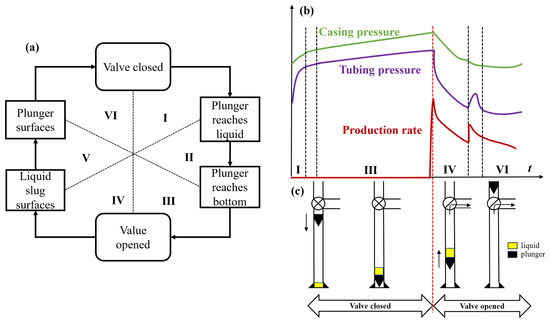
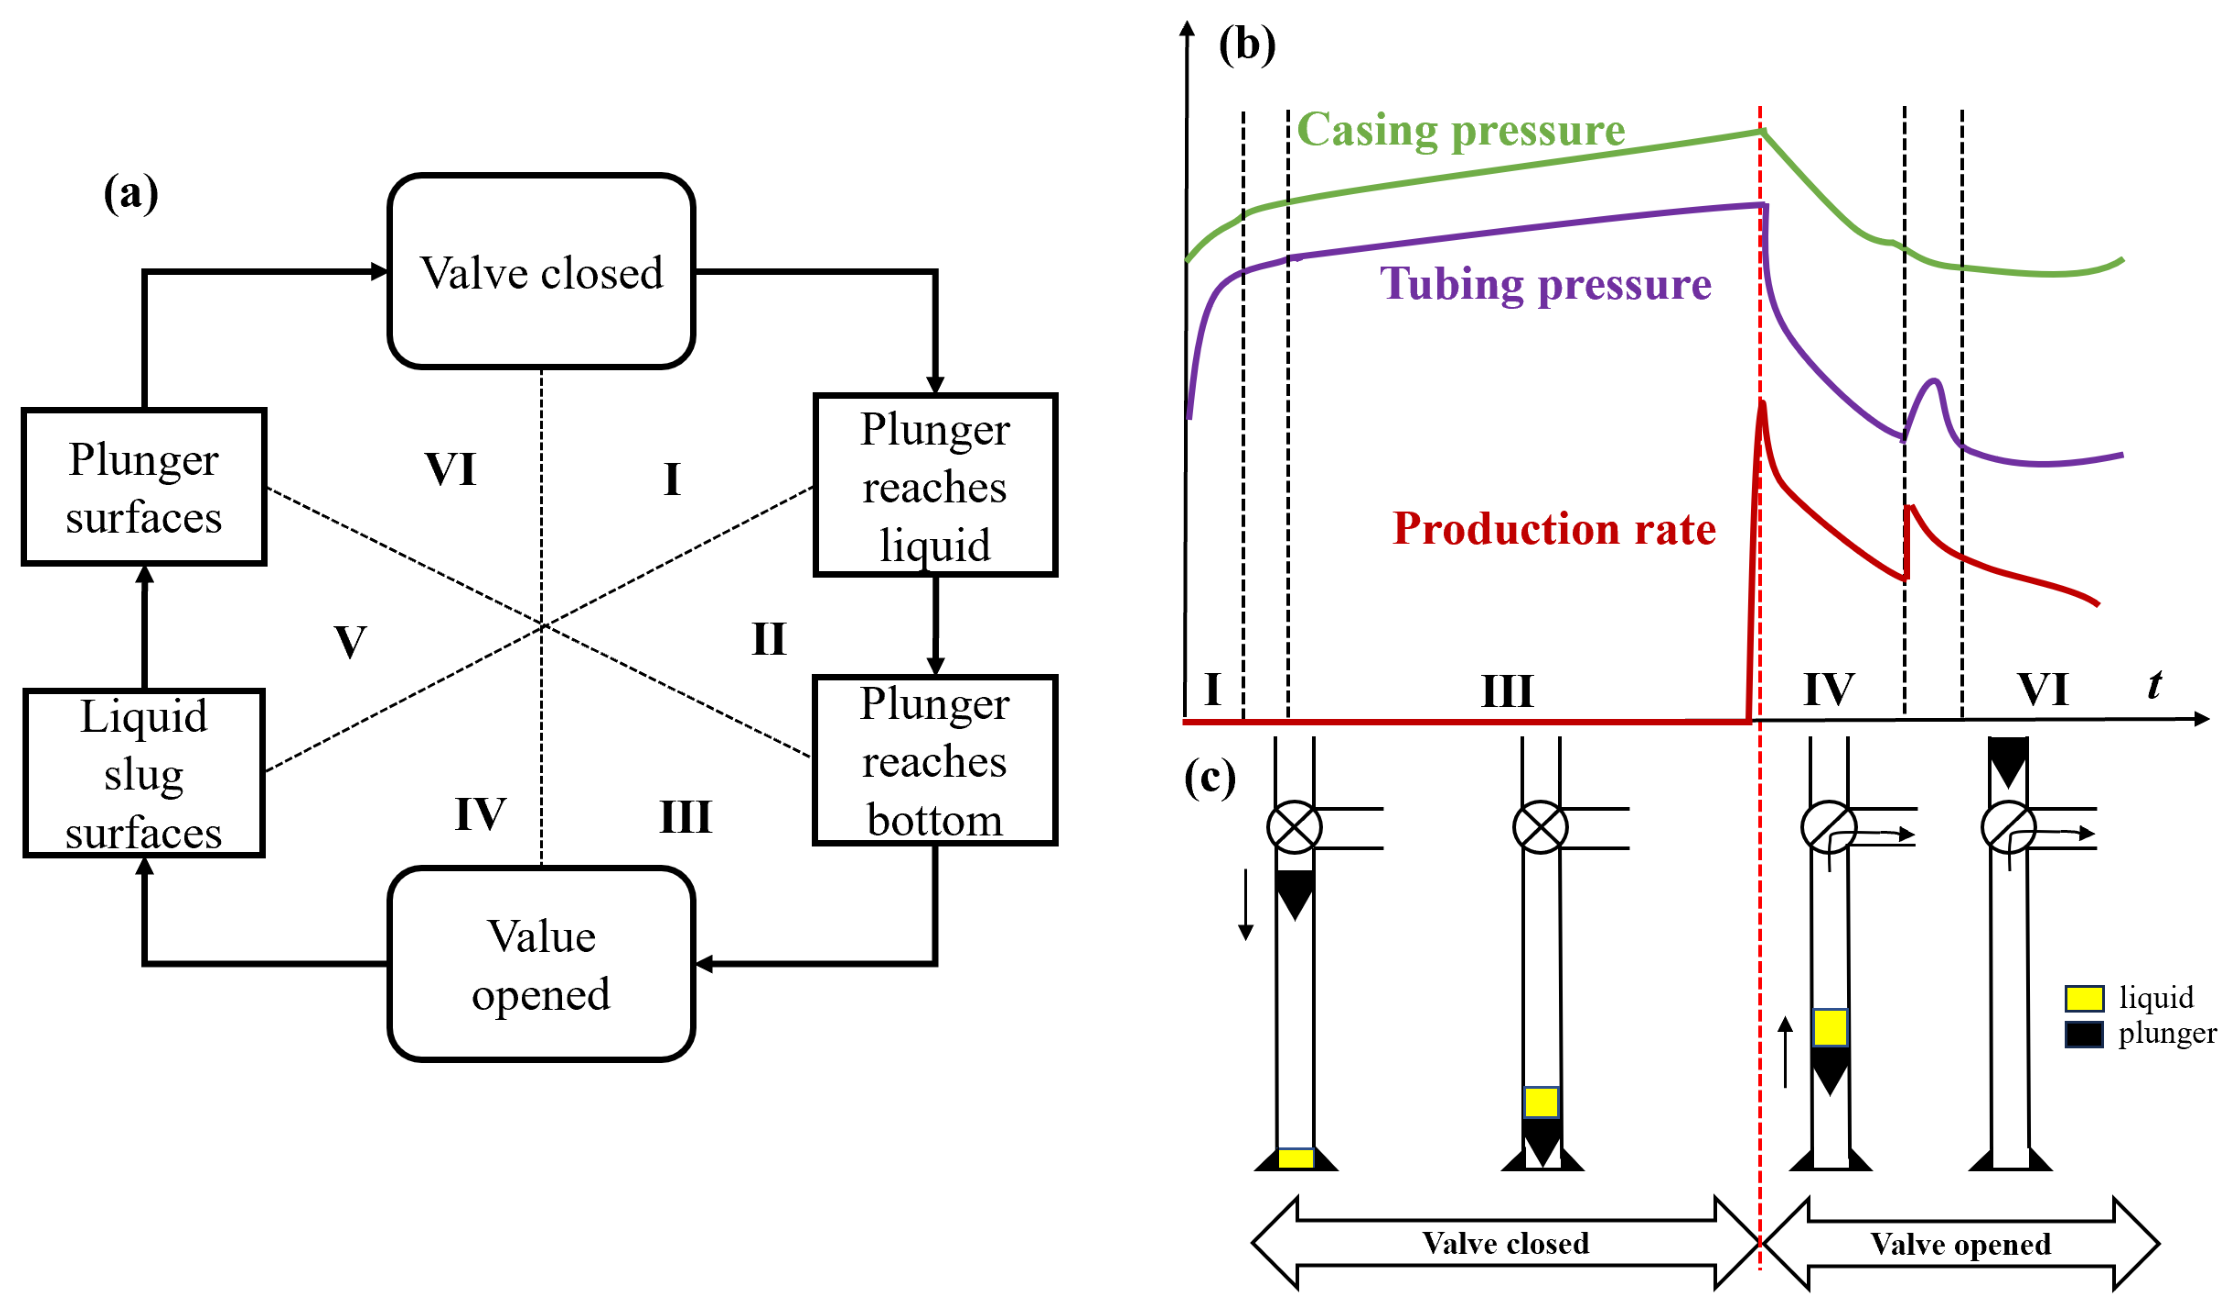
A plunger functions as a freely moving piston (Figure 2c) within the tubing, driven upward by well pressure and downward by gravitational force, returning to the well bottom [5]. The field data used in this study were acquired with a sampling frequency of 1 s per point (approx. 1 Hz). While this resolution may not capture millisecond-level valve actuation transients, it is sufficient to resolve the macroscopic pressure trends characteristic of each plunger lift cycle stage (which typically last tens of minutes to hours). A standard plunger lift system features an electrically operated valve at the wellhead that regulates the cyclic operation of the plunger system. This mechanism enables the plunger to traverse the wellbore while effectively minimizing liquid backflow. When the valve is closed, gravitational force causes the plunger to descend through the wellhead catcher and down the tubing, passing through gas and liquid columns before resting on the bumper spring. During this process, casing pressure gradually increases, while tubing pressure undergoes a sharp rise (Figure 2b), with the rate of change influenced by reservoir energy [8]. Upon opening, the valve connects the tubing to the surface pipeline, releasing gas pressure from both the tubing and casing. The resulting gas expansion propels the plunger and the liquid column above it upward [9]. Simultaneously, gas from the casing enters the tubing, causing a reduction in pressures in both regions. Once the plunger reaches the surface, normal production in the gas well resumes, and the cyclic production process repeats, as can be seen from Figure 2a, showing various stages in the operation of a single plunger lift cycle [10].
Figure 2.
Normal operation of the plunger lift through a complete production cycle: (a) Various stages and events in a single cycle, including: I—plunger falling through gas; II—plunger falling through liquid; III—buildup; IV—plunger rising; V—arrival of the liquid slug; VI—after flow. (b) Typical changes in pressure and production rate during a single cycle, (c) corresponding value and plunger status for a complete cycle.
Normal operation of a plunger lift system is featured by periodic and cyclical changes in tubing and casing pressures that correspond to distinct operational stages, including upward travel, afterflow, downward travel, and buildup, each of which exhibits characteristic pressure behaviors linked to valve actions and the plunger’s movement within the wellbore [11]. For instance, during upward travel, expanding gas lifts the plunger, causing both casing and tubing pressures to decline, while upon the plunger reaching the surface and discharging liquid, tubing pressure typically spikes sharply as gas production begins. The cycle concludes with a recovery or shut-in phase where pressures rebuild to a set level before the next cycle commences.
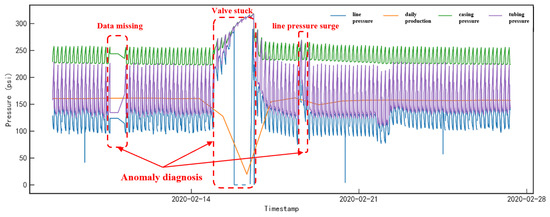
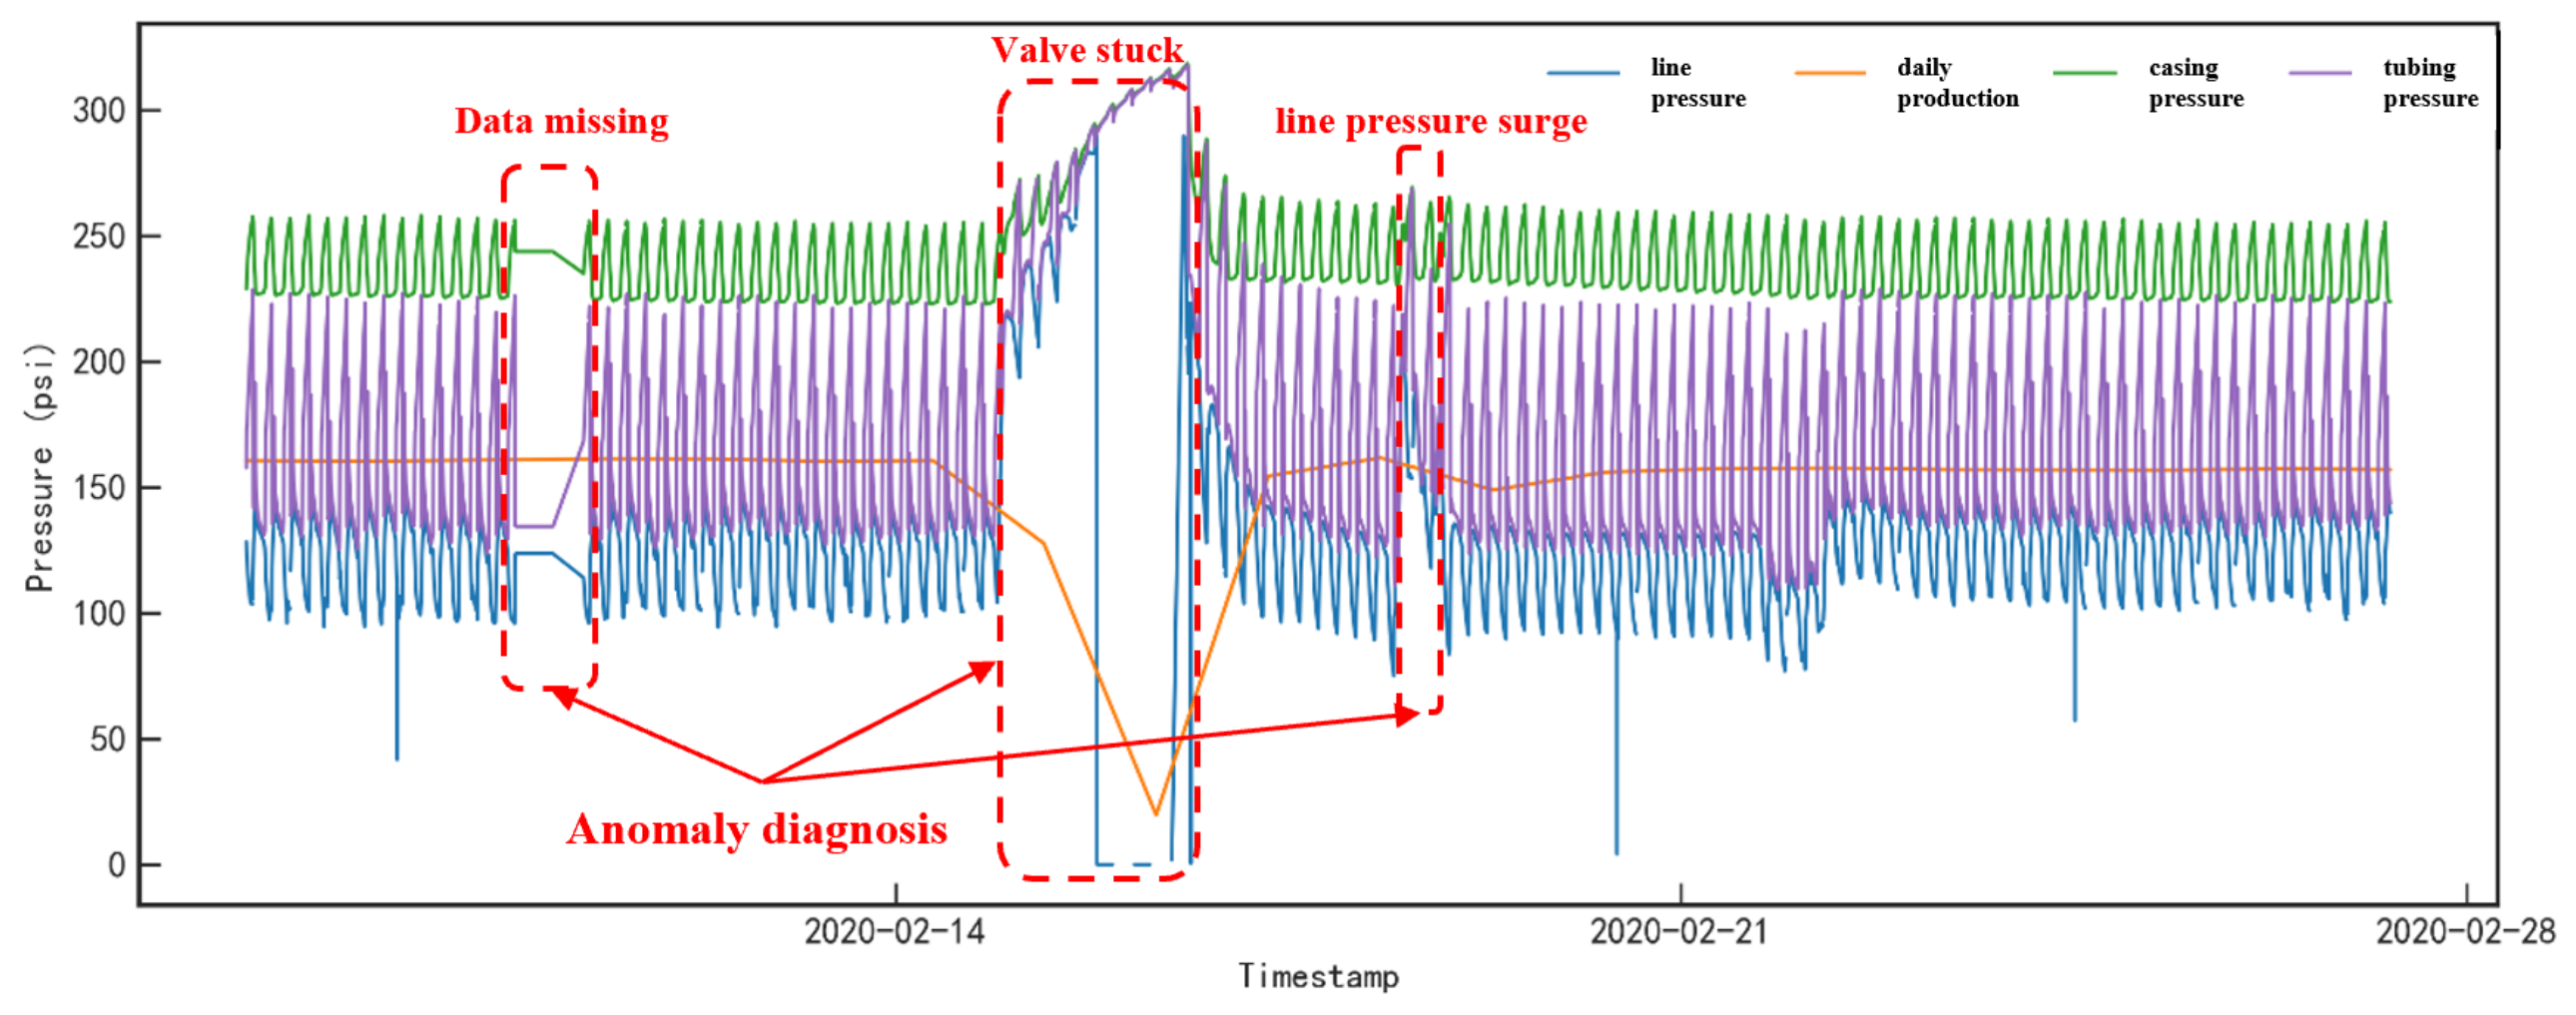
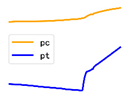
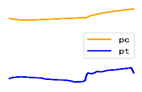
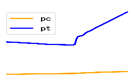
However, plunger lift systems are not without operational challenges. Gas wells equipped with plunger lift can experience various anomalies and malfunctions that disrupt the ideal cyclic operation (shown in Figure 3). Typical anomalies include the recurrence of liquid loading (e.g., early liquid fallback into the wellbore between cycles) [12], mechanical failures such as tubing ruptures [13] or a stuck motor valve, and sudden spikes in pipeline pressure caused by irregular surges of gas or liquid. These events can significantly impair the performance of the plunger lift [14,15]. For instance, a lodged plunger or a failed valve can halt the cyclic process of plunger lift, while an unexpected fluid surge can lead to unsafe pressure oscillations. Typical anomalies of a plunger lift production system are listed in Table 1, where the solutions were outlined by [5].
Figure 3.
Typical production data for a plunger lift-assisted gas well with anomaly diagnosis.
Table 1.
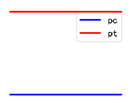
Typical anomalies of plunger lift production system: casing pressure (pc) and tubing pressure (pt).
Early detection and diagnosis of such anomalies are crucial to prevent prolonged downtime or damage to equipment. In practice, certain telltale patterns in the recorded well data can indicate an anomaly—for example, a clear divergence between the tubing pressure and casing pressure trends is a known signature of impending liquid loading in the cycle. Identifying these patterns in real time, however, is non-trivial. Plunger lift operations generate complex, transient pressure and flow signals, and distinguishing an abnormal event from normal cyclical fluctuations can be challenging, especially under noisy field conditions. Furthermore, the range of possible failure modes is broad, and some anomalies may develop subtly over many cycles, making them easy to overlook until a severe symptom appears [16].
Traditionally, operators have relied on rule-based heuristics and simple trend analyses to monitor plunger lift performance. For example, field engineers set threshold limits on pressure buildup rates, cycle durations, or fluid production volumes to flag potential problems. While these rule-based systems are straightforward, they often struggle with reliability: a fixed threshold might trigger false alarms under benign deviations or conversely fail to alarm for a developing issue that does not fit the pre-defined pattern. Each gas well can have unique characteristics, and static rules may not generalize well across different wells or changing reservoir conditions.
Conventional machine learning methods (e.g., linear classifiers or decision trees) have also been applied to assist in diagnostics [17,18,19,20], but these typically require extensive feature engineering and large labeled datasets for training. In practice, obtaining labeled data of all anomaly types is difficult—many failure modes are rare or only become evident after significant time. A supervised model trained on limited historical events might not recognize a new or evolving anomaly. Indeed, recent studies have highlighted the challenge of identifying previously unseen plunger lift conditions: models tend to struggle when confronted with fault scenarios that were not represented in the training set [21]. Fully supervised approaches would demand massive operational datasets encompassing a wide variety of failure examples to achieve broad coverage, a requirement that is seldom met in real-world operations. These limitations of rule-based and traditional ML approaches motivate the development of more robust, adaptive diagnostic techniques for plunger lift systems.
Recently, a growing interest in leveraging advanced data-driven methods, particularly deep learning, has been paid to improve anomaly detection and diagnosis in plunger lift operations [22]. This trend is mirrored in other complex industrial domains where deep learning models have proven effective at interpreting in-process sensor data for monitoring and classification. For instance, in precision grinding processes, hybrid CNN-LSTM models have been employed to fuse vibration and acoustic emission signals, successfully capturing temporal dependencies to predict surface roughness with high accuracy [23]. Similarly, in electrochemical machining, researchers have developed physics-interpretable CNN models that predict cavity profiles in real-time, effectively bridging the gap between theoretical process models and sensor data [24]. Deep learning has also demonstrated versatility in classifying geometric features from electrical discharge patterns, disentangling geometry-dependent effects from stochastic process variability [25]. Furthermore, non-invasive monitoring techniques have benefited from these advancements, such as using deep learning to detect discharge states in micro-EDM via radio frequency signals [26], and classifying process states from temporal thermal histories in additive manufacturing [27]. These studies collectively underscore the capability of deep neural networks to extract discriminative features from noisy, transient industrial signals, a challenge shared by plunger lift anomaly detection. Deep learning models can automatically learn complex patterns from large datasets, potentially capturing subtle relationships that manual analysis or simpler models might miss [28,29,30,31]. For example, convolutional neural networks (CNNs) have been employed to analyze plunger lift sensor data by transforming time-series signals into image-like representations [32]. Converting pressure vs. time data into 2D grayscale images (e.g., by plotting pressure ratios over sliding time windows) enhances the data expressiveness and exposes hidden features as visual patterns. These patterns, such as distinctive textures or gradients corresponding to different well conditions, can then be effectively recognized by CNNs, which excel at image classification tasks. Prior work has demonstrated that this approach enables CNN models to detect subtle differences between normal and abnormal plunger lift cycles, achieving accurate classification of various operating states. Based on our field data analysis, the average plunger lift cycle duration ranges from 120 to 180 min, corresponding to 7200–10,800 data points per cycle at the 1 s sampling interval. After GAF transformation with a sliding window of 224 min, each sample becomes a 224 × 224 image. Standard CNN architectures typically possess effective receptive fields limited to local patches unless extremely deep, making it difficult to capture full-cycle temporal dependencies in a single forward pass. In contrast, the ViT’s self-attention mechanism computes pairwise relationships across all 196 patches globally from the first layer, inherently addressing this limitation. For instance, Liu et al. (2025) converted plunger lift pressure signals into 200 × 200 pixel images and trained a deep CNN to classify multiple anomaly types, reporting significantly improved diagnostic accuracy over manual feature-based methods [33]. Similarly, other researchers have integrated signal processing techniques with deep learning, e.g., one study combined wavelet transforms and a multi-scale channel attention CNN, achieving over 83% accuracy in identifying plunger lift faults [34]. These results underscore the promise of CNN-based deep learning in automatically extracting diagnostic features and handling the complexity of plunger lift data.
Additionally, CNNs often demand large labeled datasets to generalize effectively, potentially overfitting or performing poorly on new wells or unfamiliar anomalies if training data is insufficient or non-diverse. Supporting this concern, Zhu et al. (2025) reported a standard CNN achieving only ~40% accuracy when tested on unseen data from variant gas wells [21].
Consequently, architectures like the Vision Transformer (ViT) are emerging as promising alternatives [35]. ViTs utilize self-attention mechanisms, allowing them to model long-range relationships and capture global context more effectively than CNNs [36,37,38]. This trend is further exemplified by recent hybrid architectures that seek to unify the advantages of localized convolutions and global attention. A prominent example is the Feature Cross-Layer Interaction Hybrid Method based on Res2Net and Transformer (FCIHMRT) [39]. This architecture innovatively integrates Res2Net modules—which excel at extracting multi-scale granular features within a single residual block—with Transformer layers that model long-range dependencies. Through a cross-layer interaction strategy, FCIHMRT enables the dynamic fusion of local textural details and global semantic information, demonstrating superior classification performance over traditional single-stream networks. The success of such methods underscores the potential of Transformer-driven architectures in decoding complex visual patterns, a capability this study aims to leverage for plunger lift anomaly detection. Recent studies highlight their potential in anomaly detection tasks [40]. Although recent variants such as Swin Transformer and FCIHMRT offer architectural improvements, we selected the standard ViT for its proven efficacy in transfer learning scenarios. Given the limited availability of fault samples in this study, the ability to utilize pre-trained weights (e.g., from ImageNet) is critical. The standard ViT architecture allows for the direct application of these robust pre-trained features, providing a distinct advantage in convergence speed and accuracy over more complex architectures that are harder to fine-tune on small-scale domain-specific data. For plunger lift analysis, treating the pressure image as patches enables ViTs to potentially learn the overall cycle dynamics better. Furthermore, ViTs excel in transfer learning scenarios: pre-trained models can be fine-tuned, leveraging existing knowledge from large datasets to provide strong feature representations even with limited plunger lift data, thereby improving learning efficiency and the ability to recognize anomaly signatures [41].
Another promising direction to enhance anomaly detection is the use of graphic data augmentation and synthesis [42,43,44]. Given that certain plunger lift anomalies are infrequent, the training data for those classes may be scarce and imbalanced. To address this, data augmentation techniques can be applied to the pressure image data—for instance, generating rotated or scaled versions of pressure plots, adding noise, or altering contrast—to simulate variability and expand the effective training set [45,46]. This approach helps the model become more robust to variations and prevents overfitting to too few examples. Recent studies have even explored using generative models to create synthetic data for plunger lift conditions; for example, Variational Autoencoders (VAEs) have been used to learn the distribution of normal cycle data and then generate additional realistic pressure cycles for training and validation [47]. By leveraging such augmented and synthetic data, a deep learning model can be exposed to a wider range of operational scenarios, which is invaluable for improving its anomaly recognition capabilities.
Beyond the aforementioned ViT and CNN architectures, recent studies have explored attention-based mechanisms for multi-parameter joint optimization in fault diagnosis [48]. Unlike our approach that focuses on pressure–time images, these methods directly optimize operational parameters (e.g., valve timing, pressure setpoints) alongside fault classification within a unified attention framework.
Motivated by recent advances, this study presents an enhanced Vision Transformer (ViT)-based framework for plunger lift anomaly detection, utilizing pre-trained knowledge and graphic data augmentation. The core of the approach is a ViT model, initialized with pre-trained weights, analyzing pressure-time images. A tailored data augmentation pipeline further improves model robustness and generalization by applying diverse transformations to these images. Our goal is to achieve superior accuracy and efficiency in recognizing a wide range of anomalies compared to conventional methods, leveraging the ViT’s strengths in capturing global patterns and transfer learning. The methodology, results, and comparative evaluations demonstrating the efficacy of this ViT-based strategy are presented in the following sections.
2. Materials and Methods
The methodology proposed in this study aims to address the limitations inherent in traditional rule-based and conventional machine learning approaches for plunger lift anomaly detection. By employing advanced Vision Transformer (ViT) architectures and integrating pretrained models, our approach leverages the power of self-attention mechanisms to effectively capture global and local patterns in graphical representations of sensor data. Additionally, we introduce a graphic data augmentation strategy based on Gramian Angular Fields (GAF), transforming time-series data into two-dimensional images suitable for ViT analysis. The following subsections provide a detailed explanation of data representation and augmentation procedures, the architecture of the ViT-based model, and the metrics used for comprehensive evaluation.
2.1. Plunger Lift System Overview
Plunger lift is an intermittent artificial lift strategy designed to mitigate liquid loading in mature gas wells by effectively leveraging formation energy. The core principle involves introducing a solid plunger into the tubing to act as a mechanical interface, providing a physical seal that isolates the lifting gas from the accumulated liquid slug, thereby minimizing liquid fallback. A standard system comprises downhole components (e.g., the plunger and bottom-hole bumper spring) and surface equipment (e.g., lubricator, motor valve, and sensors).
The operation follows a cyclic thermodynamic process generally divided into four distinct stages, each exhibiting unique pressure and flow characteristics:
Shut-in and Descent (Pressure Buildup): The surface controller closes the motor valve, halting production. The plunger falls under gravity through the gas and liquid columns to the bottom-hole bumper spring. Simultaneously, formation gas accumulates in the tubing-casing annulus, compressing to store the potential energy required for the subsequent lift.
Upward Lifting: Once the casing pressure or shut-in duration reaches a preset threshold, the motor valve opens. The rapid expansion of the high-pressure gas stored in the annulus propels the plunger and the liquid slug upward, overcoming gravitational forces and friction.
Liquid Unloading: Upon the plunger reaching the surface catcher, the liquid slug is immediately discharged into the gathering line.
Afterflow: Following liquid discharge, back pressure drops, allowing gas to flow at a high rate. As formation energy is consumed and the gas velocity falls below the critical liquid-carrying threshold, the cycle concludes, and the valve closes to initiate the next buildup phase.
Reliable operation depends on the precise coordination of these stages. Consequently, surface sensors continuously record tubing and casing pressures, generating time-series data where deviations from ideal cyclic patterns serve as key indicators for anomaly detection.
2.2. Data Representation and Augmentation
A critical step in applying vision-based models like Vision Transformers (ViT) to time-series data, e.g., that generated by plunger lift systems, is the transformation of the one-dimensional signal into a two-dimensional representation (i.e., an image). This conversion allows leveraging the powerful feature extraction capabilities of models pretrained on image datasets. In this study, we employ Gramian Angular Fields (GAFs) to encode the temporal dynamics of plunger lift sensor readings into a matrix format.
GAF is a technique designed to represent a time series in a 2D matrix by encoding temporal correlation through angular perspectives. It preserves temporal dependencies by mapping time points to polar coordinates and calculating trigonometric sums or differences between points. The process involves the following steps:
- Normalization: The raw time-series data is first normalized to a specific range, typically [−1, 1] or [0, 1], to mitigate issues related to differing scales or magnitudes. Let the normalized time series be . This normalization ensures that the subsequent angular encoding is consistent.
- Polar Coordinate Encoding: Each normalized value is mapped to the polar coordinate system. The value itself determines the angle, and the timestamp determines the radius. This is achieved using the following transformations: angle (): , where ∈ [0, π]; radius (ri): , where ti is the timestamp of the data point xi (assuming ti ∈ [1, 2, …, N]) and N is a constant factor related to the span of the time-series length. This encoding method is bijective, meaning it uniquely represents both the value and its temporal position without information loss. The angular position ϕi encodes the value, while the radial position ri preserves the temporal sequence.
- GAF Matrix Calculation: The GAF matrix is constructed by considering the angular relationships between pairs of points in the polar coordinate representation. Two main variants exist:
- •
- Gramian Angular Summation Field (GASF): Calculated using the cosine of the sum of angles:which can be expanded asThe GASF matrix essentially captures the angular correlation based on the sum of angles.
- •
- Gramian Angular Difference Field (GADF): Calculated using the sine of the difference between angles:which can be expanded as
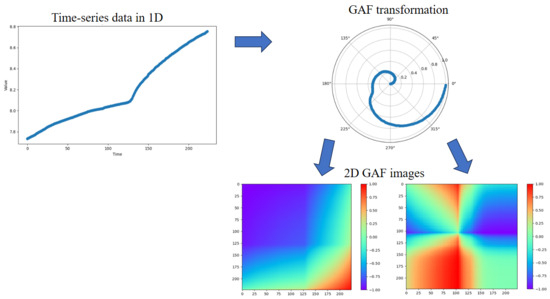
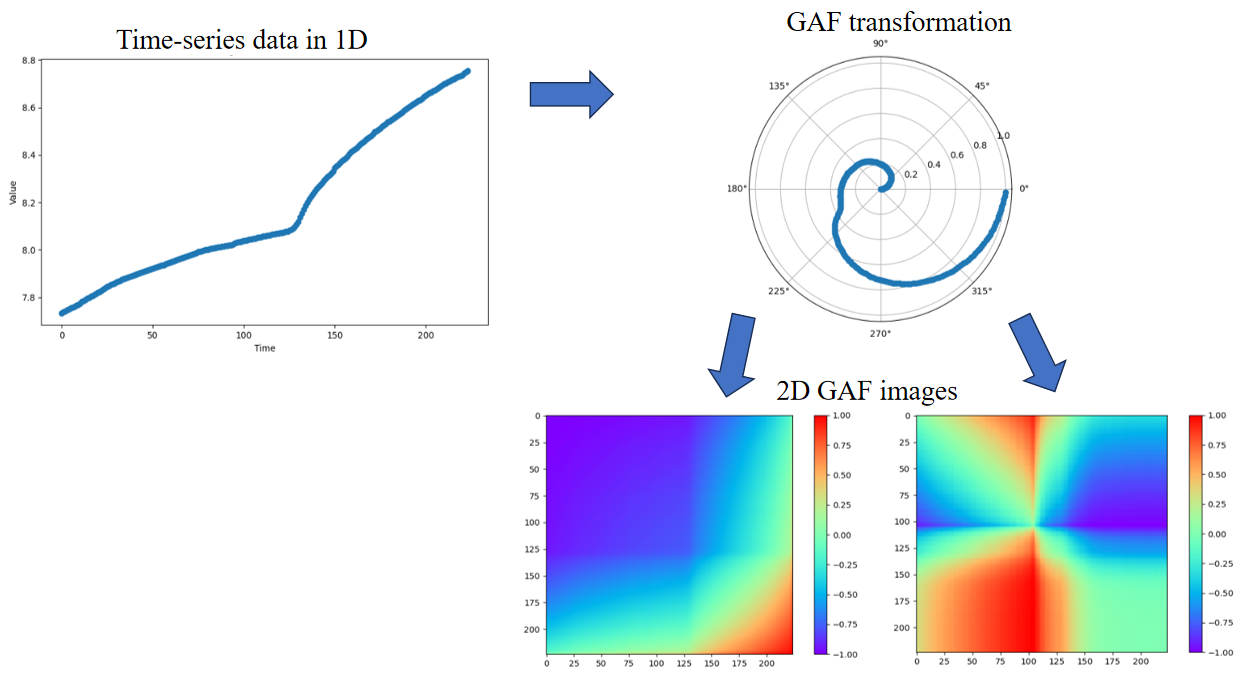
The GADF matrix captures correlation based on the angular difference, highlighting temporal variations. The resulting GAF matrix (either GASF or GADF) is a n × n matrix where each element (i, j) represents the angular relationship between time points ti and tj. This matrix serves as the 2D image representation of the original 1D time-series data, capturing complex temporal patterns and dependencies visually. Figure 4 below illustrates this transformation process.
Figure 4.
GAF transformation process: from 1D time-series data to polar coordinates and finally to 2D GAF mages.
To adapt the 1D time-series data for the Vision Transformer architecture, we employ a specific image encoding strategy that constructs a three-channel RGB-like representation. Unlike standard methods that simply replicate the grayscale map, we assign distinct temporal features to each channel to maximize information density:
Red Channel (GASF): Encodes the cosine of the phase sum (), preserving the temporal correlation and symmetry of the original signal’s amplitude.
Green Channel (GADF): Encodes the sine of the phase difference (), capturing the directional changes and dynamic transitions within the time series.
Blue Channel (Summation Map): Constructed by element-wise addition of the GASF and GADF matrices. This composite channel serves to highlight regions where both amplitude correlation and phase variation are significant, effectively enhancing the contrast of fault-related transient features for the ViT encoder.
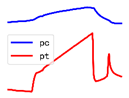
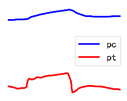
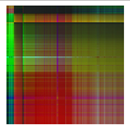
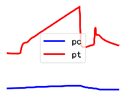
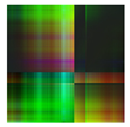
By converting the plunger lift time-series data into GAF images, we transform the anomaly detection problem into an image classification or analysis task. This representation enables the direct application of standard computer vision techniques, including graphic data augmentation. Table 2 shows the representative plunger lift data to the corresponding images by GAF transformation.
Table 2.
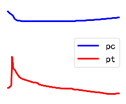
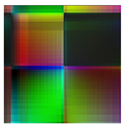
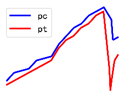
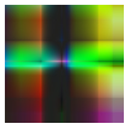
Plunger lift data and the corresponding GAF images.
The total dataset contains 26,262 samples obtained from field operations. The class-wise distribution is as follows: Normal (Class 0): 16.2%, Long-term closed (Class 1): 15.2%, Long-term open (Class 2): 11.4%, Unreasonable system (Class 3): 16.8%, Other anomalies (Class 4): 21.8%, and Data transmission error (Class 5): 19.8%. To ensure a rigorous and unbiased evaluation, the dataset was randomly divided into training and testing sets with a ratio of 7:3, maintaining consistent class distributions in both subsets to avoid distribution bias.
The interpretability of GAF representations can be understood by linking specific visual patterns to physical phenomena in the original pressure curves. Taking Class 1 (Motor valve won’t open) as an example: the raw pressure signal exhibits an extended ‘flatline’ or slowly increasing trend without the characteristic periodic drops. In the corresponding GAF image, this manifests as large, homogeneous rectangular blocks of uniform color, because the GASF and GADF matrices produce nearly constant values when the normalized pressure remains stable over time. In contrast, Class 0 (Normal) operations generate GAF images with fine-grained, diagonally oriented texture patterns, reflecting the periodic alternation between pressure buildup and drawdown. The transition from Class 0 to Class 3 (Unreasonable periods) produces GAF images with disrupted diagonal bands and irregular speckles—these correspond to variable cycle lengths and inconsistent valve timing. By training on these visual ‘signatures,’ the ViT learns to associate specific texture characteristics with underlying mechanical faults, providing a form of visual interpretability that complements traditional time-domain analysis.
2.3. Framework of ViT-Based Model
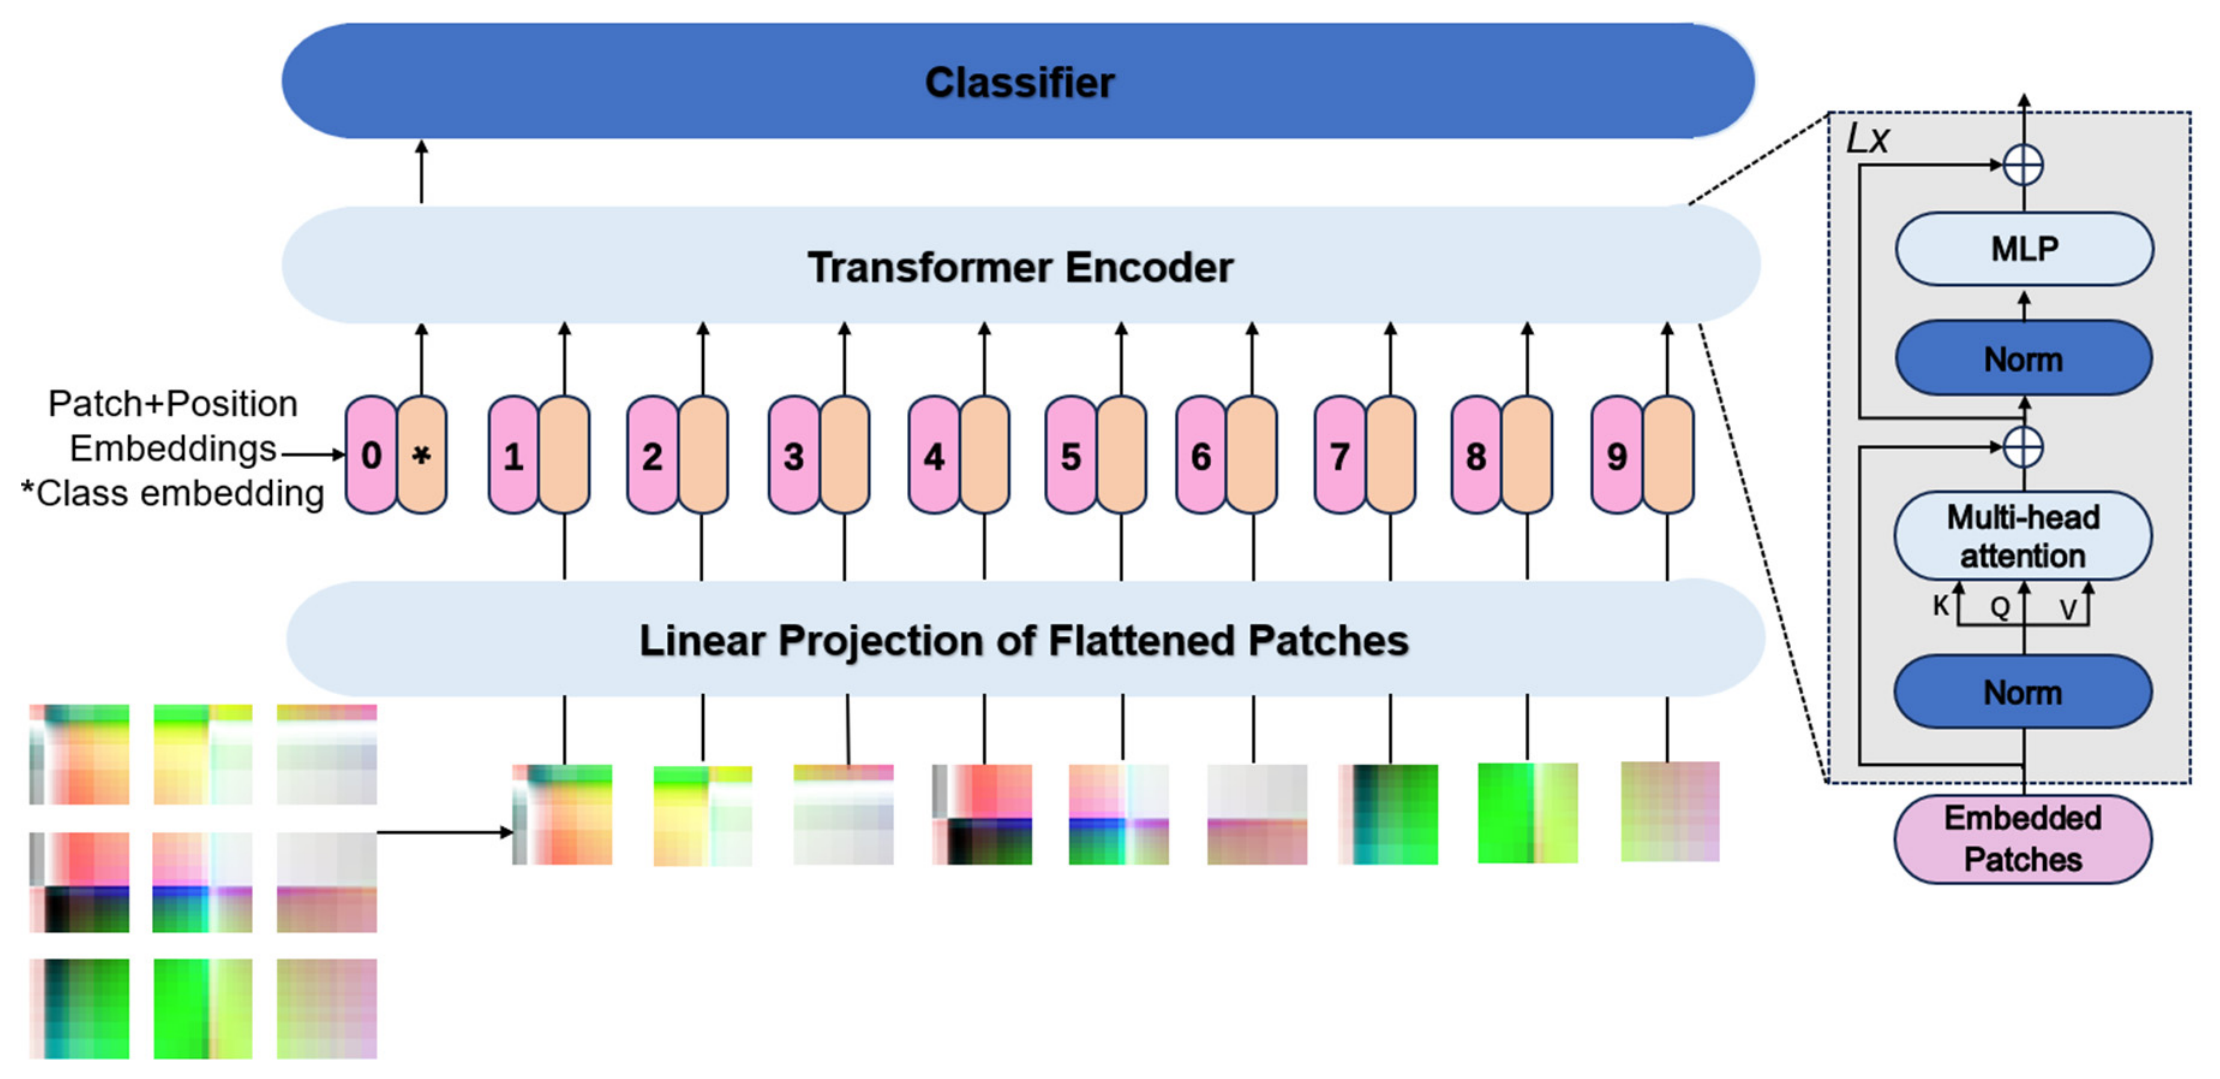
In this research, a ViT framework is applied to address anomaly detection in plunger lift operations, leveraging ViT’s superior capability in image-based feature extraction and classification tasks. The ViT architecture [35] represents a transformative approach to computer vision problems by extending the original Transformer model proposed by Vaswani et al. [38], initially designed for natural language processing (NLP). Unlike conventional CNNs that rely on localized receptive fields, ViT directly processes images as ordered sequences of flattened patches. Specifically, each input image is segmented into a grid of fixed-size patches, which are subsequently linearly projected into embeddings suitable for the Transformer encoder. These embedded patches are then analyzed using self-attention mechanisms, enabling the model to capture complex, long-range contextual relationships within the data.
The present study leverages a pretrained ViT model, initially trained on extensive datasets, to ensure effective transfer learning and robust feature extraction. By initializing the model with these pre-trained weights, the network can immediately leverage learned low-level visual features—such as edges, textures, and shapes—rather than learning from scratch. This transfer learning strategy significantly accelerates model convergence and enhances feature robustness, particularly when dealing with the relatively smaller dataset typical of plunger lift anomalies. To adapt to the specific anomaly classes observed in plunger lift systems, the pretrained encoder’s initial layers were kept static, serving as deep feature extractors, while the later layers were fine-tuned alongside a newly introduced classification head tailored for the unique characteristics of plunger lift anomaly identification.
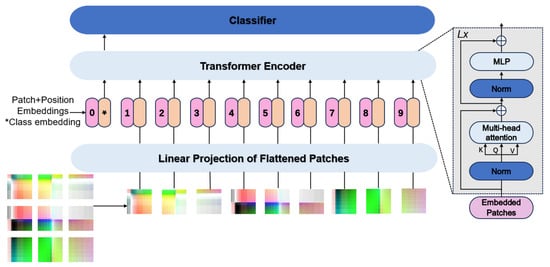
The ViT model employed in this work adheres closely to the foundational Transformer architecture, as shown in Figure 5 above, while adapting it for visual data through a patch-based input strategy. To accommodate the two-dimensional nature of the plunger lift sensor signals—represented as Gramian Angular Field (GAF) images —each image is divided into non-overlapping square patches of size . These patches are flattened into vectors and arranged into a sequence , where c is the number of image channels and defines the resulting sequence length input to the Transformer encoder. Each vectorized patch is then projected into a fixed-dimensional embedding space using a learnable linear transformation, producing what are referred to as patch embeddings. This transformation enables the model to treat the image as a sequence of tokens, allowing the self-attention mechanism to capture both local and global dependencies across the spatial dimensions of the original sensor data [49].
Figure 5.
Structure of the Vision Transformer (ViT) model.
2.4. Training and Evaluation Methods
The study’s computational tasks were executed on a server featuring an Intel® Core™ i7-14700KF CPU, NVIDIA GeForce RTX 4090 GPU, and 256GB RAM. Python 3 and the PyCharm 2019.3.3 x64 IDE provided the experimental software environment, while the PyTorch 1.4.0 framework facilitated the implementation of our model, which, as indicated earlier, utilized a pre-trained ViT. The post-training evaluation workflow included visualizing the training loss–accuracy curve to monitor learning progression. Performance on historical test data was then analyzed by generating a confusion matrix. Critically, due to the presence of six different classes representing various plunger lift conditions, a multi-class confusion matrix was employed, the specifics of which are outlined in Table 3. The corresponding performance metrics for this multi-class class, namely Precision, Recall, and the F1-score, were calculated to assess model effectiveness, using the equations presented below:
Table 3.
Confusion matrix for anomaly detection of plunger lift.
Within the confusion matrix detailed above, E (“Error”) indicates misclassifications, and TP denotes true predictions. The value Eij specifies the number of samples from true class i that the model incorrectly predicted as class j. This 6 × 6 matrix (for classes 0–5) displays the model’s class-specific prediction performance.
2.5. Hyperparameters Optimization
The analysis was performed on field data acquired over an 18-month duration from four wells (No. 1, 5, 8, and 51), which recorded tubing and casing pressure. Each well possessed distinct physical characteristics and exhibited complex operational patterns. Originally, a sliding window approach was adopted for data segmentation, configured with a window length of 224 min and a stride of 48 min, thereby enabling the window to shift forward at 48 min intervals. However, we subsequently utilized a Bayesian optimization (BO) algorithm to optimize hyperparameters.
To identify the optimal hyperparameter configuration for the model, Bayesian optimization was employed. Bayesian optimization is an algorithm based on Bayesian principles that searches for the global extremum of a target function within a bounded domain and is frequently used for hyperparameter tuning in deep learning. The Bayesian optimization algorithm primarily consists of two components:
A probabilistic surrogate model: This is an approximate function of the target function, incorporating both prior and posterior probability distributions. A Gaussian process was chosen as the probabilistic surrogate model due to its non-parametric nature, its resistance to overfitting, and its widespread application [50].
An acquisition function: This function is constructed based on the posterior probability distribution to determine the next point for evaluation.
In this study, the optimization was implemented using the Optuna framework. We utilized a Gaussian Process (GP) as the surrogate model to approximate the objective function, and the Expected Improvement (EI) was selected as the acquisition function to balance exploration and exploitation. The hyperparameter search space and the final optimal values are detailed in Table 4. This Bayesian optimization approach was used to fine-tune hyperparameters for the pre-trained ViT, including the dropout rate, initial learning rate (lr), batch size, and window step. The hyperparameter space was defined with the following ranges for each parameter: dropout rate: [0.1, 0.9], learning rate: [0.0001, 0.01], batch size: [8, 64], step (window stride): [20, 60]. For the Bayesian optimization process, we set the maximum number of iterations to 50. The search space was explored efficiently to identify the optimal hyperparameters, with the objective function monitored to prevent overfitting during the tuning phase.
Table 4.
Hyperparameter search space and optimal configuration.
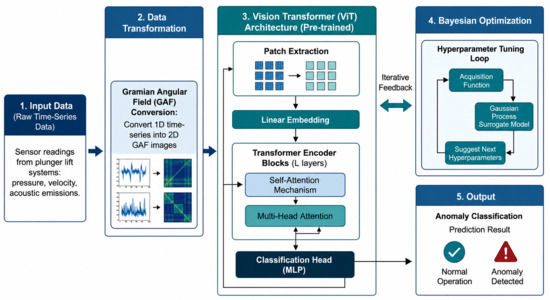
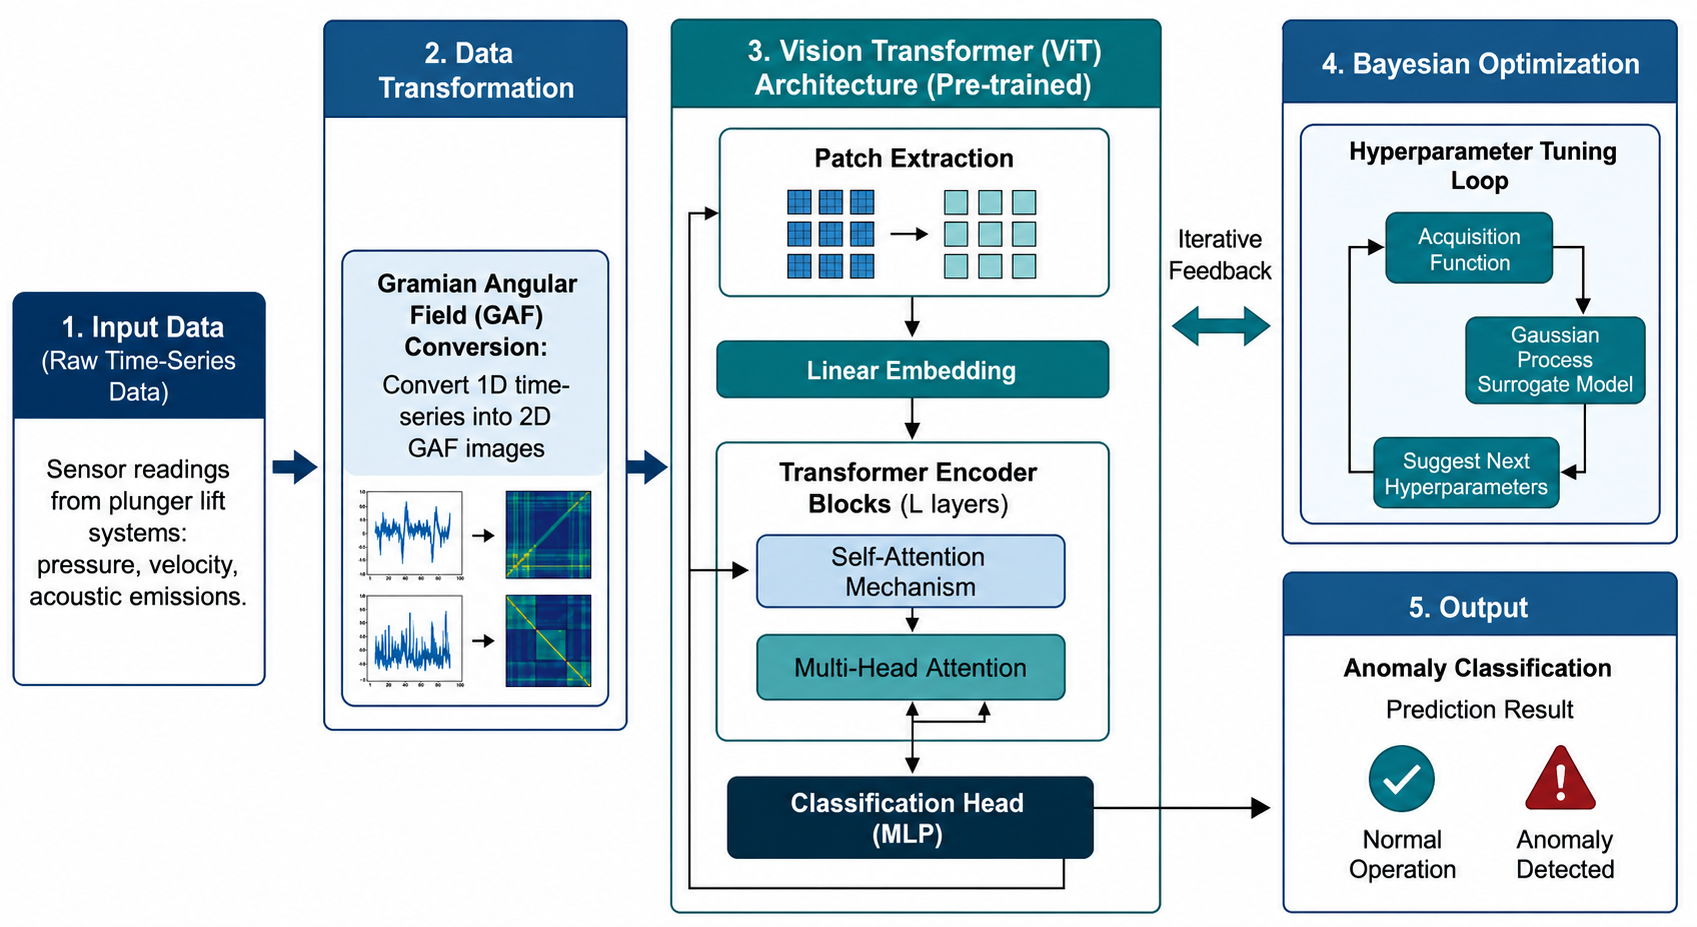
The optimization process involved following steps (shown in Figure 6 below): selecting the optimization algorithm, iteratively searching for the best hyperparameter configuration, and updating the Gaussian process model. The Optuna hyperparameter optimization library was utilized for this iterative search. In each iteration, the optimization algorithm selected the subsequent hyperparameter configuration based on the predictions from the Gaussian process model and evaluated its performance on the target function. As iterations progressed, the Gaussian process model was continuously updated to better capture the relationship between hyperparameters and performance metrics. This iterative refinement enabled the optimization algorithm to make more intelligent choices for subsequent configurations. The Bayesian optimization process terminates when no improvement in the objective function is detected for 10 consecutive iterations, or when the maximum number of 50 iterations is reached, whichever occurs first. The study mentions applying Bayesian optimization to optimize window and stride lengths specifically. The effectiveness of Bayesian optimization is also reflected in model comparisons where ViT models tuned with Bayesian optimization (ViT + BO) showed improved performance.
Figure 6.
Flowchart for optimizing the proposed anomaly detection model based on pretrained ViT.
3. Results
This section presents and analyzes the experimental results obtained from the proposed ViT-based anomaly detection framework. Model performance is evaluated across multiple dimensions, including classification accuracy, generalization to unseen wells, and robustness under data imbalance. Comparative analyses with baseline methods are also provided to highlight the advantages of the proposed approach. Key findings are further supported by visualizations and quantitative metrics to demonstrate the model’s diagnostic effectiveness in real-world plunger lift operations.
3.1. Model Training and t-SNE Visualization
Building upon our previous work [36], where class imbalance was addressed through random subsampling to ensure balanced representation of plunger lift operational conditions, this study adopted a similar strategy to mitigate skewed label distributions. In earlier work, we demonstrated that the predominance of normal operation data could bias the model toward trivial predictions unless appropriately balanced. By selectively sampling the minority classes and applying stratified train–validation–test splits, we were able to promote more equitable learning across anomaly types and improve classification robustness. Consistent with that, the present study implemented tailored data balancing during both pretraining and fine-tuning stages to enhance the model’s generalizability, particularly under data-sparse fault scenarios. Class imbalance was mitigated using random undersampling rather than synthetic oversampling methods such as SMOTE or GAN. This decision was motivated by two considerations: first, plunger lift pressure signals are highly structured time-series, and synthetically generated samples risk introducing physically implausible artifacts that could mislead the model, whereas undersampling preserves data authenticity; second, given the strong transfer learning capability of the pretrained ViT, the balanced subset provided sufficient discriminative features without requiring massive data volume. We acknowledge this trade-off and note that future work will explore physics-constrained generative augmentation to further address class imbalance while maintaining physical fidelity.
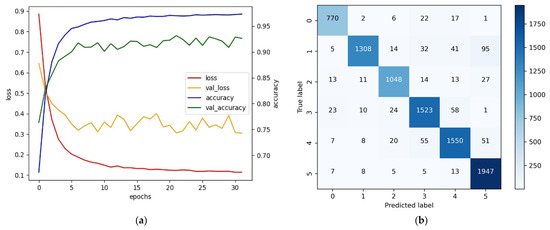
The training outcomes for the model, as depicted in Figure 7, are notably strong. Analysis of the loss and accuracy graphs reveals that the model converges quickly and fits the data well, achieving a 96% accuracy on the training set and 93% on the validation set, without indications of overfitting or underfitting. Furthermore, the confusion matrix underscores the model’s robust ability to detect anomalies, demonstrating a high level of classification accuracy alongside a minimal rate of false positives, thereby satisfying the criteria set for the pre-trained model. These findings confirm the model’s suitability for dependable anomaly detection, even when faced with the inherent variability of real-world data.
Figure 7.
Model training and performance: (a) loss–accuracy curves and (b) confusion matrix.
As detailed in Table 5, the proposed model achieves a high macro-average F1-score of 0.930, indicating robust performance across all six categories. The model demonstrates exceptional sensitivity in detecting “Sensor Malfunctions” (Class 5), achieving the highest Recall of 0.981. However, a closer inspection of the confusion matrix reveals that the primary source of error stems from Class 1 (“Motor valve won’t open”), which exhibits the lowest Recall at 0.875. Specifically, a significant number of Class 1 samples (95 instances) were misclassified as Class 5. This confusion likely arises from the similarity in signal characteristics: when the motor valve fails to open, the tubing and casing pressures may remain static or exhibit prolonged “flatline” behaviors that visually resemble the data patterns caused by sensor freezing or disconnection. Despite this specific challenge, the high Precision score for Class 1 (0.971) suggests that when the model identifies a valve failure, the prediction is highly trustworthy. Additionally, Class 4 (“Other anomalies”) shows a slightly lower F1-score (0.916), which is expected given the diverse and less structured nature of this residual category. To interpret this, we analyzed the raw signal characteristics. When a motor valve fails to open, the current feedback often remains at a low constant level or shows specific oscillation patterns, which bears a strong resemblance to the flat-line or noisy signals typical of sensor malfunctions. Since the GAF encoding converts these 1D signals into 2D textures, the visual patterns generated by a stuck valve and a broken sensor are structurally similar.
Table 5.
Class-wise performance metrics for the proposed ViT + GAF + BO model.
Beyond the confusion between Class 1 (Motor valve won’t open) and Class 5 (Sensor malfunction), other misclassification patterns merit attention. Specifically, 43 samples of Class 2 (Motor valve won’t close) were misclassified as Class 0 (Normal)—this arises because when the valve fails to close, the tubing pressure gradually increases without the sharp drop typically seen in normal cycles, but the overall pressure envelope may still resemble a prolonged afterflow phase, misleading the model. Conversely, 38 samples of Class 3 (Unreasonable open/close periods) were misclassified as Class 4 (Other anomalies), likely due to the highly irregular and non-repetitive nature of these cycles, which lack the structured periodicity that the ViT’s self-attention mechanism relies upon. Class 4 itself (Other anomalies) exhibited the lowest Precision (0.916), which is expected given its heterogeneous composition—this category includes multiple distinct failure modes (e.g., tubing leakage, scale deposition, intermittent plugging) that were grouped due to limited sample sizes. Future work should consider sub-classifying these anomalies when more labeled data becomes available.
With the class imbalance mitigated, model training proceeded using the curated dataset to optimize performance across all categories. To gain deeper insights into the model’s learning dynamics and feature discrimination capability, we further employed t-distributed stochastic neighbor embedding (t-SNE) to visualize the evolution of feature representations across different layers of the ViT. The following subsection details the training strategy and presents the t-SNE plots that illustrate how the model progressively refines its internal feature space to distinguish between various plunger lift conditions.
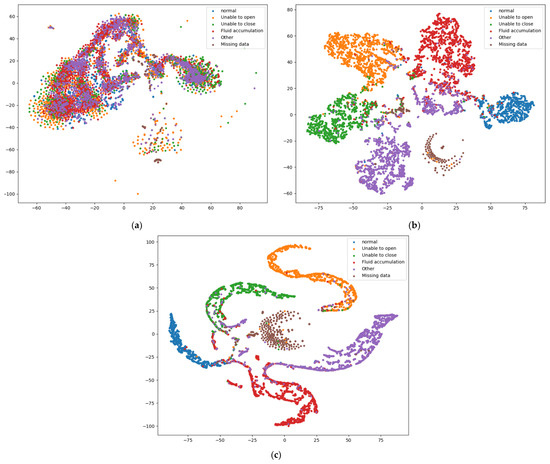
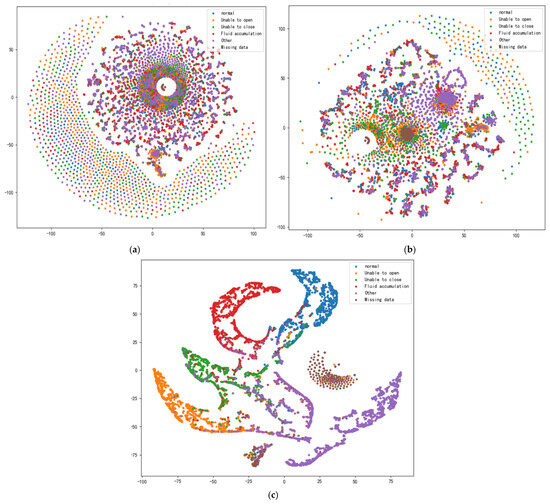
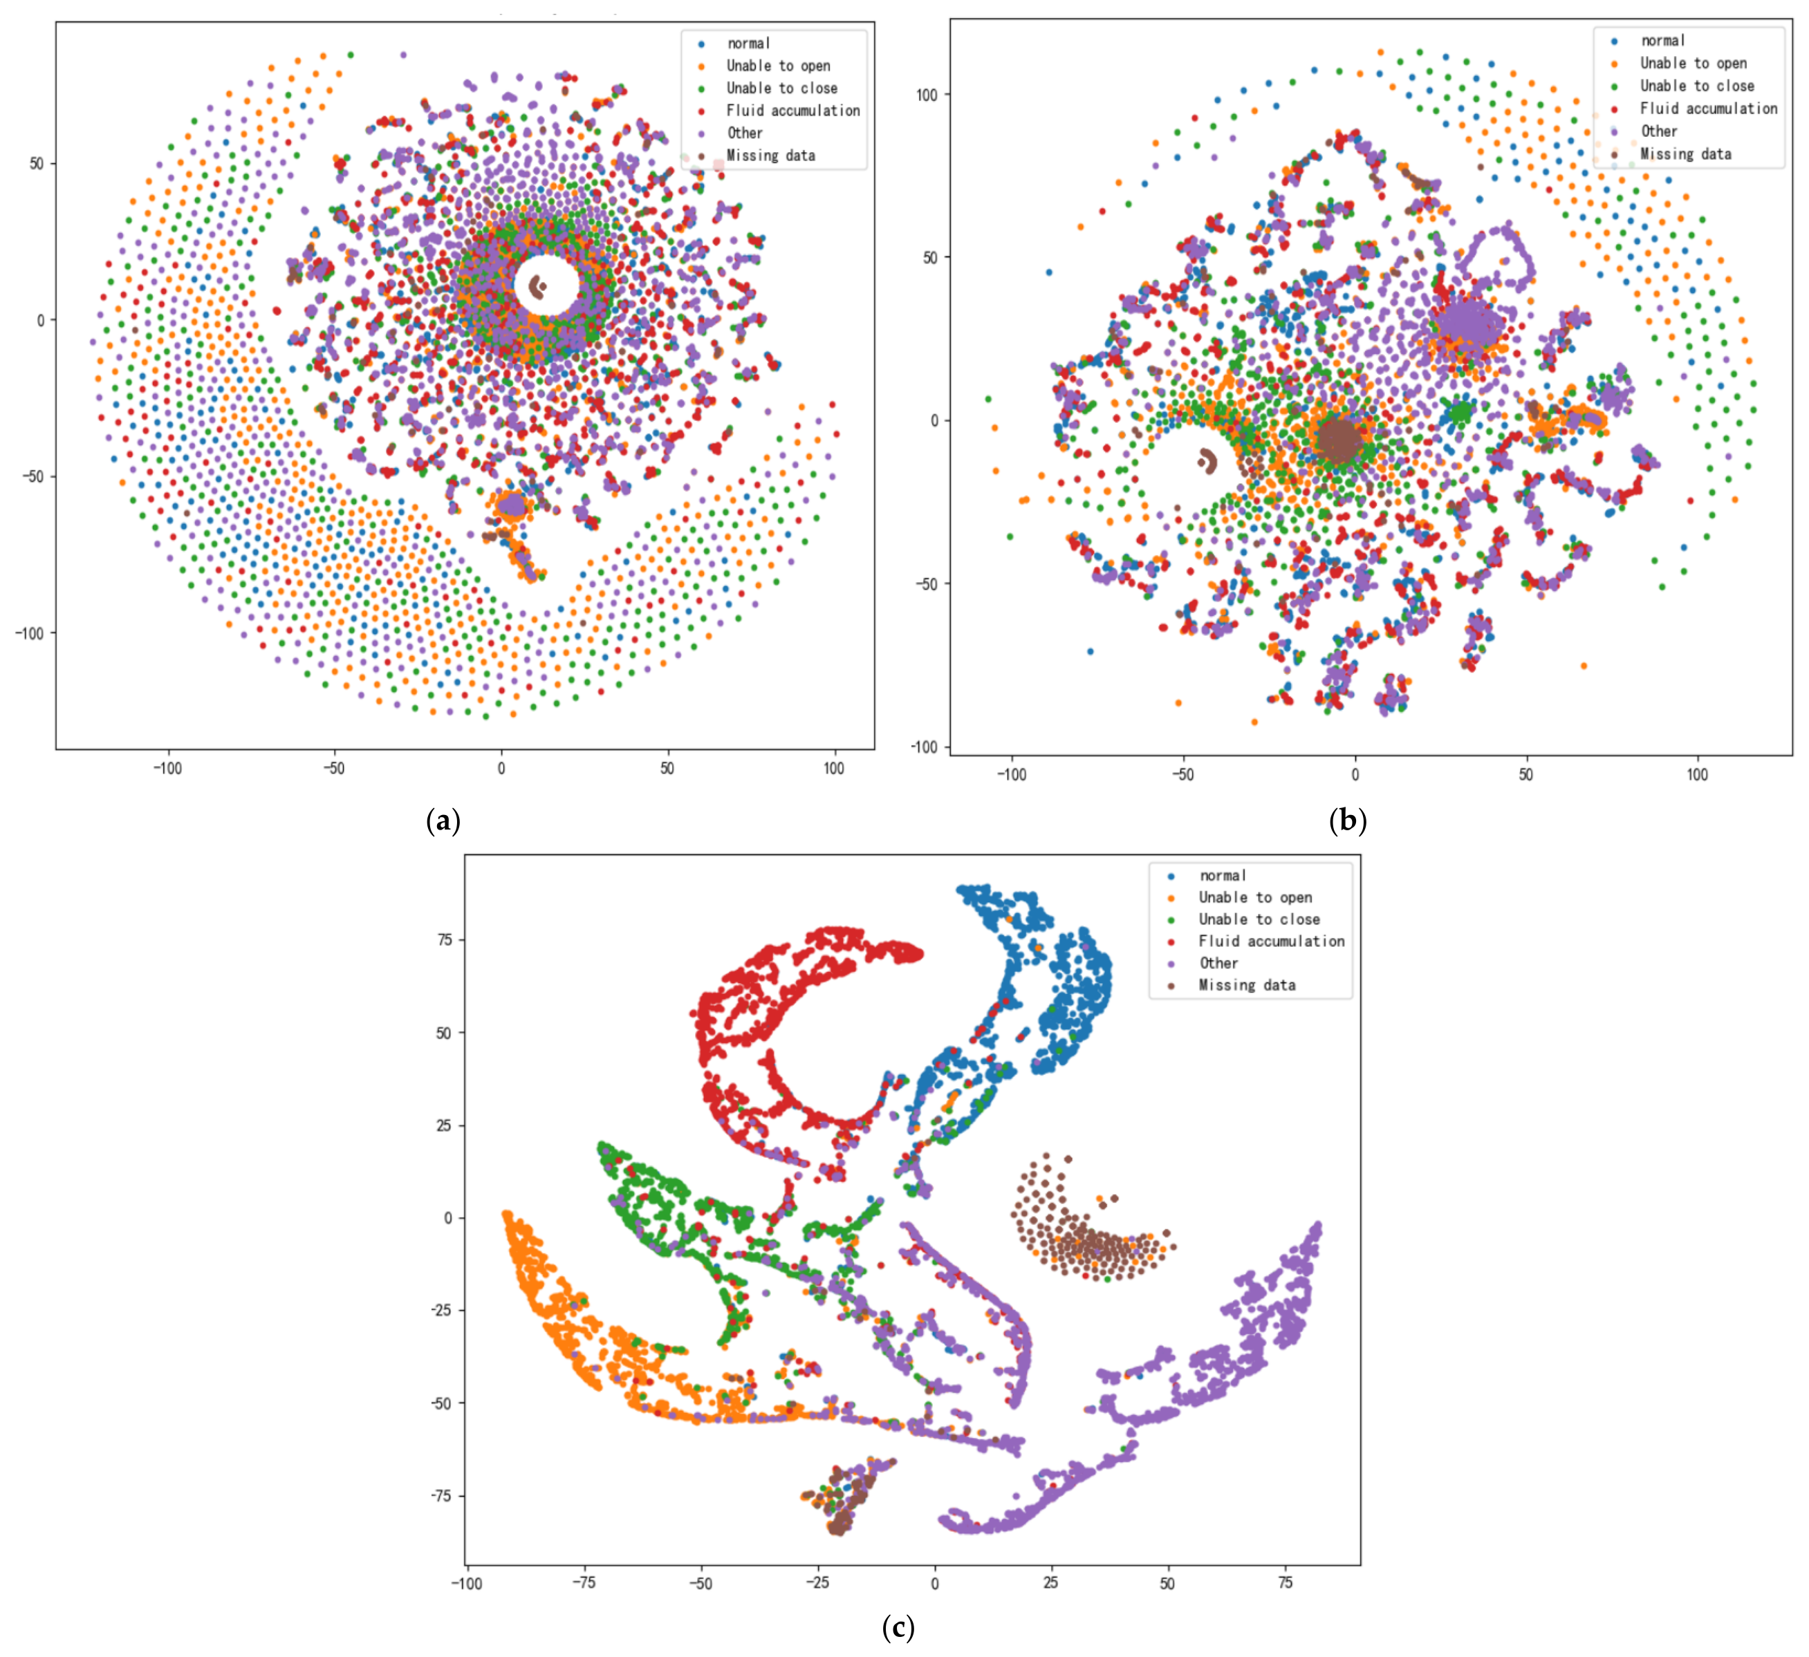
Figure 8 illustrates the transformation of feature distributions, visualized using t-SNE, at key stages of the pre-trained Vision Transformer (ViT): the input patch embeddings, a representative hidden layer within the Transformer encoder, and the final output layer. This visualization clearly reveals the progressive refinement of features as data traverses the model.
Figure 8.
t-SNE representation of the pretrained ViT model: (a) input layer, (b) dense layer, and (c) output layer.
Initially, at the input layer, t-SNE shows the distribution of the initial patch embeddings derived from the GAF images. At this stage, the data points appear relatively intermingled and widespread, reflecting the inherent complexity of the visual representations before the ViT’s self-attention mechanisms begin to process them. Classification at this early stage would be challenging due to the significant overlap between different conditions.
As the data passes through the Transformer encoder blocks, the t-SNE visualization of a representative hidden layer demonstrates significant structural changes. Here, the self-attention mechanisms have started to weigh and aggregate features across all image patches, leading to the emergence of more defined groupings. Distinctions between various operational conditions become more apparent as the model learns to capture global contextual information and relevant patterns, though some feature overlap may still exist as the representations are further refined.
This process of feature separation culminates at the output layer, typically after the classification head. The t-SNE plot for this stage shows that the data points have formed highly distinct and concentrated clusters. Each cluster corresponds to a specific operating condition, indicating optimal feature separability. This clear distinction in the feature space is what enables the ViT to achieve high classification accuracy.
A comparative analysis of the t-SNE visualizations further highlights the superior feature learning capabilities of the pre-trained ViT over the optimized convolutional neural network (CNN) model from our previous work [33]. As depicted in Figure 8, the ViT demonstrates a remarkable progression towards highly distinct and well-separated clusters in its output layer, indicative of robust feature discriminability. In contrast, while the t-SNE plots for the optimized CNN (Figure 9) show an improvement in feature separation from input to output, the final clusters (Figure 9c) appear less compact and exhibit more inter-class overlap compared to those achieved by the ViT. This visual evidence suggests that the pre-trained ViT achieves a more effective transformation of the input data into a feature space where different operational conditions are more clearly delineated, underscoring its enhanced potential for accurate classification in complex plunger lift scenarios.
Figure 9.
t-SNE representation of the optimized CNN model (CNN + BO), which was developed by optimizing the model from our previous work [33]: (a) input layer, (b) CNN layer, and (c) output layer.
3.2. Performance of the Proposed Model
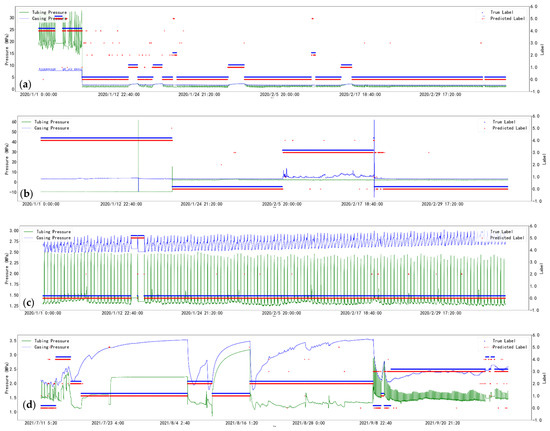
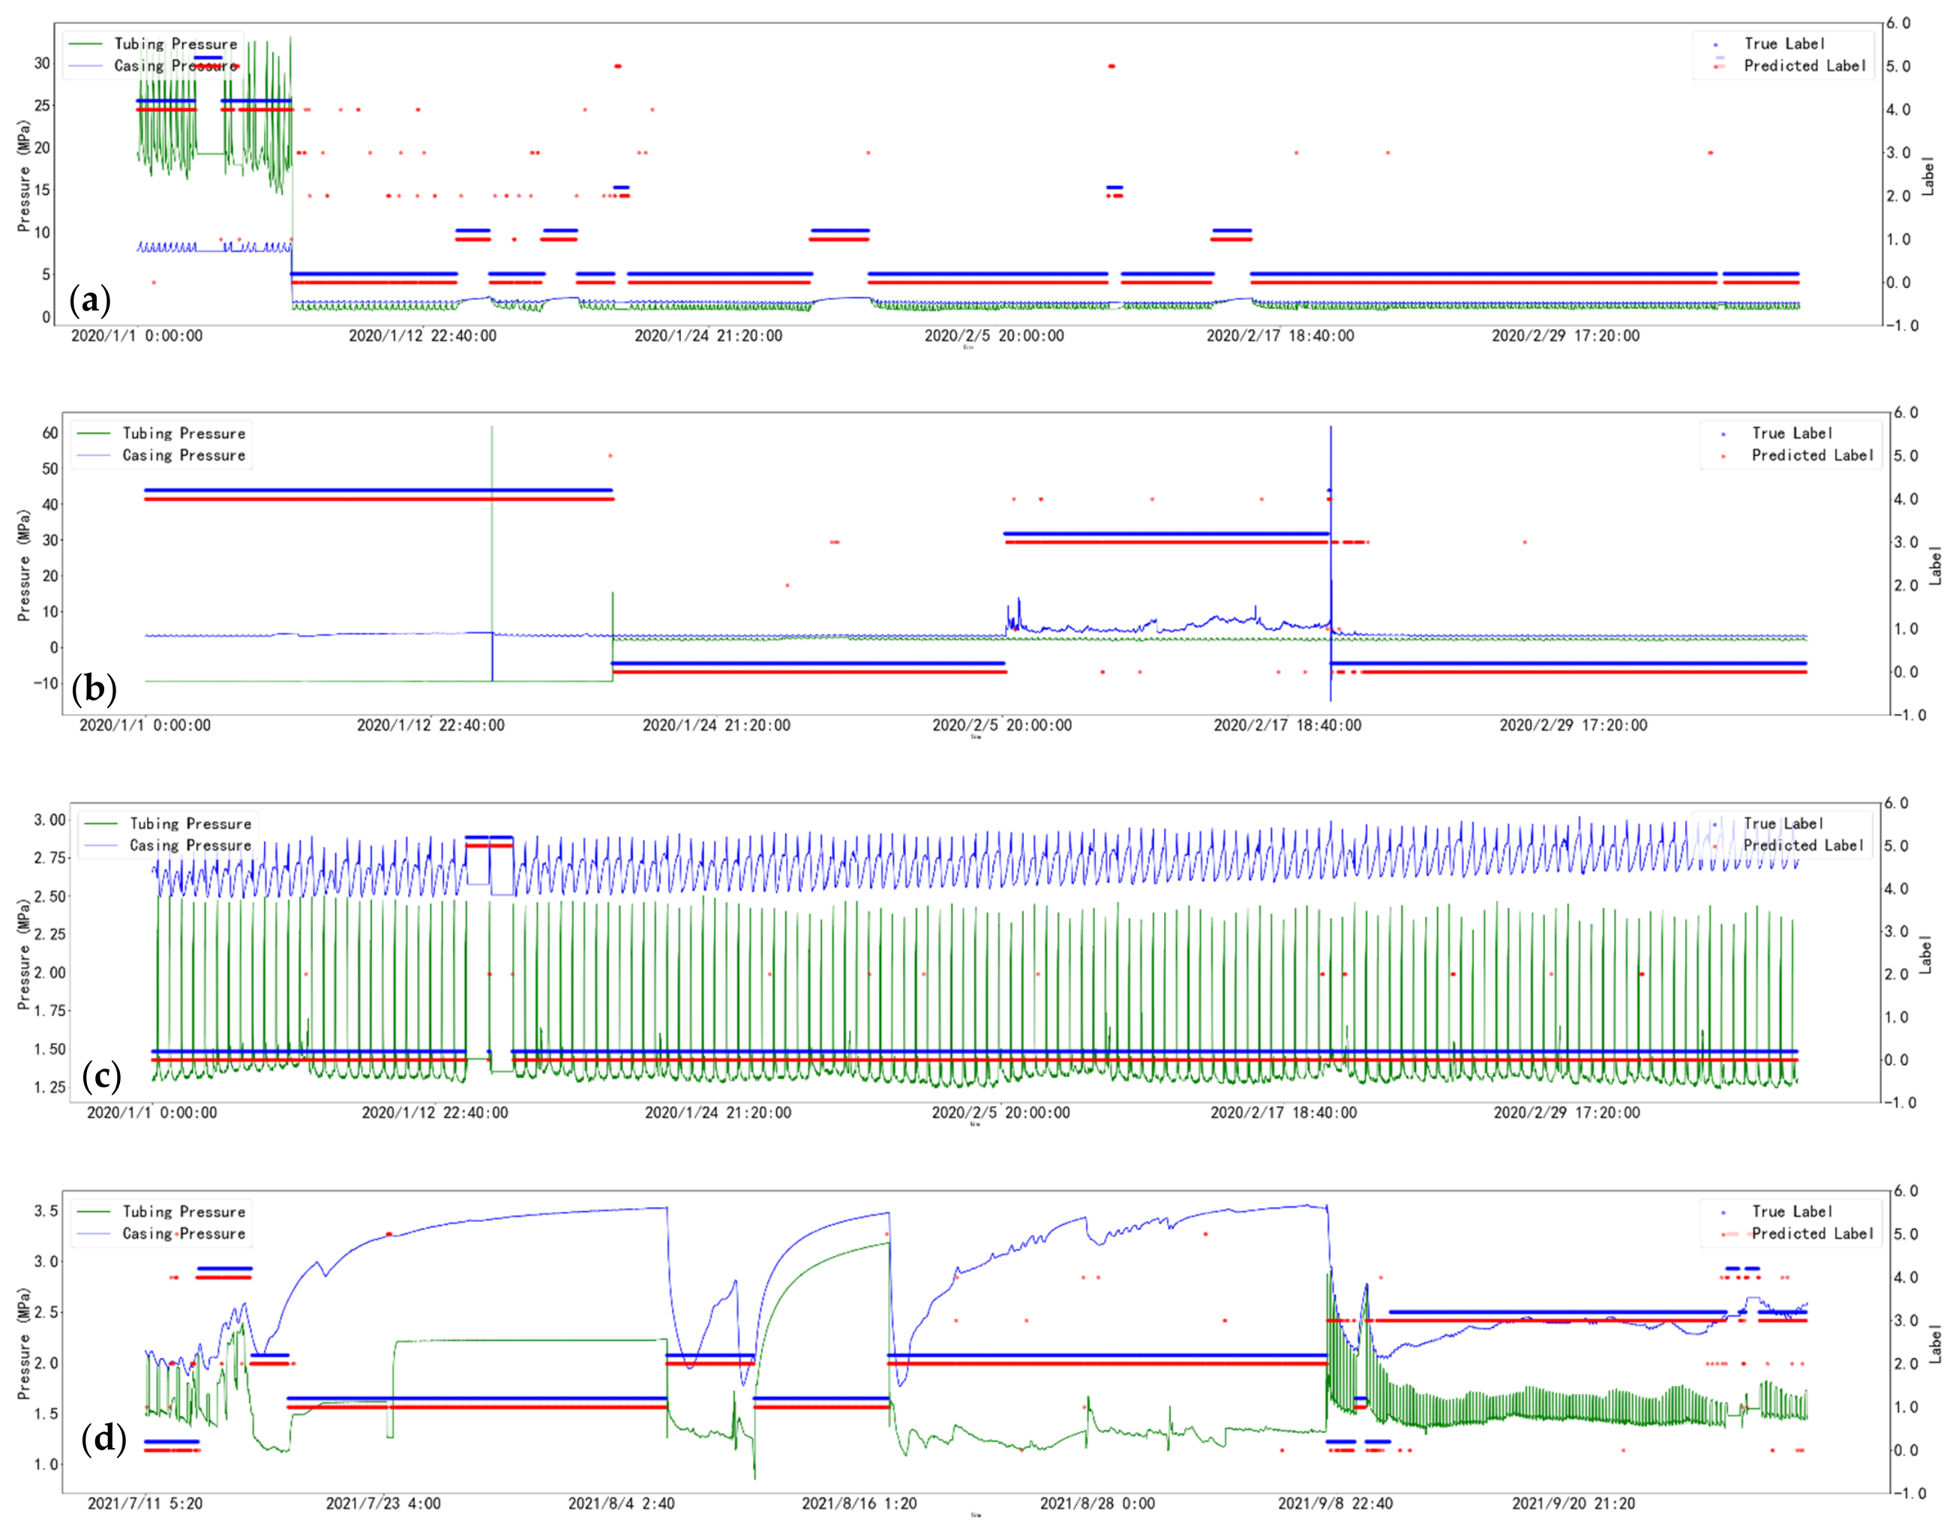
Figure 10 showcases the proposed new model’s predictive capabilities against field data from the four wells, presenting the predicted condition labels in conjunction with the pressure readings. The model demonstrates exceptional proficiency in classifying a wide array of operational conditions by leveraging tubing and casing pressures, indicative of its advanced overall performance. A significant majority of anomalies are accurately pinpointed with an extremely low incidence of false alarms. Notably, where the previous model occasionally faltered our previous work [33], this new model exhibits enhanced robustness, more effectively navigating the complexities of brief, transient pressure fluctuations that can obscure labeling (as observable across wells in Figure 10a–d). While no model is infallible, such instances of misdetection are markedly reduced. Consequently, the model consistently and accurately identifies changes in operational conditions, signifying its superior capability in managing diverse and challenging operational scenarios.
Figure 10.
Typical model predictions and corresponding field data: (a) well 1, (b) well 2, (c) well 3, and (d) well 4.
4. Discussion
To fully benchmark our proposed methodology against conventional CNNs, we selected five distinct models for comparison. This set included the primitive CNN architecture previously introduced in our previous work [33]. We also evaluated two enhanced CNN versions: one optimized by Bayesian optimization (CNN + BO), and another incorporating both BO and training on GAF-transformed data (CNN + GAF + BO). Completing the comparison, we included two Vision Transformer (ViT) based models: a pre-trained ViT with hyperparameters tuned using Bayesian optimization (ViT + BO), and a similar ViT + BO model that was further trained on GAF-transformed data (ViT + GAF + BO).
To evaluate the practical deployability of the proposed framework, we quantified its computational overhead and real-time performance. The GAF transformation, implemented in Python with NumPy vectorization, required an average of 0.023 s to convert a single 224-point time series into a 224 × 224 RGB image on the RTX 4090 GPU. The ViT + GAF + BO model achieved an average inference time of 0.011 s per sample, equivalent to a throughput of ~90 samples per second. The total model parameter count was 85.9 M, with a GPU memory footprint of 1.8 GB during inference (batch size = 8). These results indicate that while the ViT-based model incurs higher computational cost than lightweight CNNs (CNN + GAF + BO: 0.004 s/sample, 4.2 M parameters), it remains well within real-time constraints for centralized monitoring systems, where pressure data is sampled at 1 Hz and anomaly detection is required on a per-cycle basis.
To systematically evaluate the contribution of data augmentation, we conducted an ablation study comparing five augmentation strategies applied to GAF images: (1) no augmentation (baseline), (2) random rotation (±10°), (3) random horizontal flip, (4) color jitter (brightness/contrast adjustment), and (5) a composite strategy combining all three. All experiments used the ViT + GAF + BO framework with identical training settings. The composite augmentation achieved the highest F1-score (0.93), outperforming no augmentation (0.89), rotation-only (0.90), flip-only (0.90), and color jitter (0.91). Notably, color jitter provided the largest marginal gain (+0.02 F1) by enhancing the model’s robustness to pressure sensor noise and baseline drift. However, excessive rotation (>15°) degraded performance due to the loss of temporal order information inherent in GAF’s polar encoding. These results confirm that task-specific augmentation, rather than generic image transformations, is critical for plunger lift anomaly detection.
The model comparison results presented in Table 6 clearly demonstrate a progressive improvement in performance with added optimizations and architectural choices. The baseline CNN model achieved an F1-score of 0.803. Incorporating Bayesian optimization (CNN + BO) significantly boosted this to 0.85, and the further addition of GAF encoding (CNN + GAF + BO) maintained this high F1-score while slightly improving Precision. Notably, the Vision Transformer models outperformed the CNNs; the ViT optimized with Bayesian optimization (ViT + BO) reached an F1-score of 0.90. The top performance was achieved by the ViT + GAF + BO model, which scored highest across all metrics with a Precision, Recall, and F1-score of 0.93, underscoring the combined benefits of the ViT architecture, Bayesian optimization, and GAF data transformation.
Table 6.
Comparison results among various detection models.
From the quantitative results summarized in Table 6, the performance improvement of the proposed method can be disassembled into three incremental gains originating from GAF transformation, Bayesian optimization (BO) and ViT backbone structure respectively.
First, the Gramian Angular Field (GAF) converts raw one-dimensional transient pressure time-series of plunger lift wells into two-dimensional feature maps. Compared with the baseline CNN model fed with original 1D sequential data, the CNN equipped with GAF preprocessing achieves an average accuracy increment of 4.1% and F1-score improvement of 3.8%. Such promotion is attributed to the inherent advantage of GAF, which encodes implicit temporal correlation and periodic variation hidden in wellbore dynamic data into spatial pixel distribution, overcoming the defect of conventional sequential input that fails to visualize long-term cyclic features of plunger lift working conditions.
Second, Bayesian optimization is adopted to automatically search optimal hyperparameters including initial learning rate, transformer patch size and batch size, instead of empirical manual parameter tuning. After introducing BO on the basis of GAF-enhanced CNN, the model further gains approximately 2.6% on macro F1 metric. BO eliminates subjective bias in hyperparameter selection and matches optimal configuration for the irregular and imbalanced plunger lift fault dataset, stabilizing model convergence and reducing overfitting risk on minority fault samples such as valve malfunction.
Third, replacing convolutional backbone with Vision Transformer brings the most prominent performance gain of 5.2% in classification accuracy. Benefiting from multihead self-attention mechanism, ViT breaks the local receptive field limitation of standard CNN and captures global long-range dependencies spanning the complete plunger production cycle across tubing-casing pressure fluctuation sequences. As listed in Table 6, the final integrated framework combining GAF, BO and ViT outperforms all contrast baselines comprehensively, which verifies the respective effectiveness and complementary advantage of the three core improvements for complex drainage gas recovery anomaly identification.
As shown in Table 7, the ViT-based models require substantially more parameters and training time than the CNN baselines, primarily due to the computational complexity of the multihead self-attention layers (12 heads × 12 layers). However, despite this overhead, the inference latency of the ViT model remains highly efficient at approximately 12.5 ms per sample, which is fully capable of meeting the throughput requirements for most anomaly screening tasks. Nevertheless, for edge deployment scenarios with strictly limited GPU memory (<2 GB) or extreme lightweight requirements, the CNN + GAF + BO model continues to offer a superior lightweight alternative, with only a moderate drop in the F1-score (0.85 vs. 0.93).
Table 7.
Computational cost comparison between representative models.
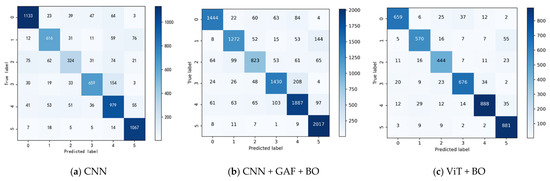
Figure 11 provides a comparative visualization of the confusion matrices for the baseline CNN, the enhanced CNN + GAF + BO, and the ViT + BO models, offering insights into their respective classification behaviors and error distributions. The baseline CNN model exhibits a foundational level of performance, with correct classifications along the diagonal but also a discernible spread of misclassifications across various off-diagonal cells. An improvement is evident in the matrix for the CNN + GAF + BO model, which generally demonstrates higher values along the diagonal and reduced off-diagonal instances, indicating more accurate and confident predictions due to the incorporation of GAF-transformed data and Bayesian optimization. The confusion matrix for the ViT + BO model presents its own distinct pattern of correct classifications and errors, which, when visually compared here, suggests different strengths and weaknesses in class-specific predictions relative to the optimized CNN. However, if compared to the ViT + GAF + BO model (the top-performing model, with its confusion matrix shown in Figure 7b), the ViT + GAF + BO matrix would exhibit even more pronounced diagonal concentrations and fewer misclassifications, reflecting its superior overall accuracy and F1-score. This further underscores the benefit of integrating GAF-transformed data with the Vision Transformer architecture and Bayesian optimization for achieving the most robust diagnostic performance.
Figure 11.
Comparison of confusion matrices by different models.
Beyond its standalone diagnostic capabilities, the proposed framework could serve as a critical component in more comprehensive asset management systems. For example, it could function as the core status awareness and parameter calibration module within a Digital Twin platform for the entire heat-electric coupled system of a production field, providing real-time health status that informs simulations and predictive maintenance strategies [51]. This integration would elevate the model from a diagnostic tool to a key enabler of intelligent, autonomous operations.
The proposed ViT-based framework offers distinct advantages, primarily its ability to capture global temporal dependencies through the self-attention mechanism, which CNNs often miss. The integration of GAF further allows the model to leverage rich 2D visual patterns from 1D signals. However, a limitation is the higher computational cost associated with the Transformer architecture compared to lightweight CNNs, as well as the preprocessing time required for GAF generation. Despite this, the model’s high accuracy makes it highly suitable for deployment in centralized control centers or as a “status awareness” module within Digital Twin platforms, where it can support real-time health monitoring and decision-making for intelligent gas field management.
5. Conclusions
Based on the experimental results and discussions presented in the previous sections, the following specific conclusions are drawn regarding the performance of the proposed Vision Transformer (ViT)-based framework for plunger lift anomaly detection:
- Superior Diagnostic Accuracy: The integration of ViT with Gramian Angular Field (GAF) data representation and Bayesian optimization (BO) demonstrated a significant improvement in diagnostic Precision. As evidenced by the experimental results (Table 6), the ViT + GAF + BO model achieved a macro-average F1-score of 0.93, outperforming the baseline CNN model (F1-score: 0.803) and the optimized CNN + GAF + BO model (F1-score: 0.85). This indicates a substantial reduction in false positives and missed detections compared to conventional methods.
- Enhanced Feature Discrimination: The t-SNE visualizations (Figure 8) confirm that the pre-trained ViT architecture learns a more discriminative feature space than CNNs (Figure 9). The feature clusters for different operational conditions (e.g., “Normal,” “Motor valve won’t open”) are more compact and well-separated in the ViT output layer, which directly supports the model’s high classification accuracy and robustness.
- Robustness to Data Imbalance and Transients: Despite the challenges posed by class imbalance (mitigated via random subsampling) and complex transient pressure fluctuations in field data (Figure 10), the proposed model maintained high sensitivity across all six classes. Specifically, the model achieved a Recall of 0.981 for “Sensor Malfunction” and demonstrated stable performance in distinguishing subtle anomalies, such as “Unreasonable open/close periods,” from normal operational variations.
- Architecture and Optimization Synergy: The comparative analysis validates that the global attention mechanism of ViT is more effective than localized CNN convolutions in capturing the long-range temporal dependencies inherent in plunger lift cycles. Furthermore, the Bayesian optimization process successfully identified the optimal hyperparameter configuration (e.g., dropout rate: 0.35, learning rate: 0.0005), which was critical for maximizing the model’s generalization capability.
In summary, this study establishes that the ViT + GAF + BO framework provides a highly accurate and reliable solution for plunger lift monitoring, directly addressing the limitations of traditional rule-based systems and CNN-based approaches identified in the Introduction.
Despite the promising results, this study has several limitations that should be acknowledged. First, the dataset, while field-derived, is limited to four wells from a single gas field; generalizability to different reservoir types, tubing configurations, or operating practices remains unvalidated. Second, the ViT’s high computational cost (85.9M parameters, 3.8 GB GPU memory) precludes deployment on resource-constrained edge devices without model compression. Third, the random undersampling strategy, while effective for class imbalance, discards potentially informative normal-cycle data; physics-constrained generative methods (e.g., conditional GANs with pressure dynamics constraints) may offer a superior alternative. Fourth, the ‘Other anomalies’ (Class 4) remains a heterogeneous catch-all category, limiting diagnostic specificity. Fifth, the current study does not experimentally validate zero-shot generalization to completely unseen anomaly types [52]. All evaluated anomalies belong to the six predefined classes. Therefore, any claim of zero-shot capability is not supported by the present results.
Future research will focus on: (1) cross-well and cross-field validation using publicly available plunger lift datasets; (2) model lightweighting via knowledge distillation and pruning to enable edge deployment; (3) integrating physics-informed neural networks (PINNs) to enforce pressure-transient constraints during training; (4) extending the framework to a Digital Twin platform for real-time closed-loop optimization; and (5) exploring few-shot and zero-shot learning to rapidly adapt to new wells or anomaly types with minimal labeled data.
Author Contributions
Conceptualization, J.Z. and H.Z.; methodology, J.Z.; software, Y.L.; validation, Y.L., H.W. and M.C.; formal analysis, N.L. and G.C.; investigation, R.Z.; resources, J.Z.; data curation, H.Z.; writing—original draft preparation, Y.L.; writing—review and editing, H.Z.; visualization, Y.L.; supervision, J.Z.; project administration, J.Z.; funding acquisition, G.C. All authors have read and agreed to the published version of the manuscript.
Funding
This project is funded by National Natural Science Foundation of China (Grant No. 52474064), Frontier Interdisciplinary Exploration Research Program of China University of Petroleum, Beijing (Grant No. 2462024XKQY005) and Oil & Gas Major Project (No. 2025ZD1404200).
Data Availability Statement
All the data are included in the paper.
Acknowledgments
The authors would like to acknowledge the support of the National Natural Science Foundation of China (Grant No. 52474064), Frontier Interdisciplinary Exploration Research Program of China University of Petroleum, Beijing (Grant No. 2462024XKQY005) and Oil & Gas Major Project (No. 2025ZD1404200). The authors are grateful for the field production data of gas wells provided by PetroChina Research Institute of Petroleum Exploration & Development (RIPED).
Conflicts of Interest
Authors Haoyu Wang, Mai Chen, Nan Li and Guangqiang Cao were employed by the company PetroChina Research Institute of Petroleum Exploration & Development. The remaining authors declare that the research was conducted in the absence of any commercial or financial relationships that could be construed as a potential conflict of interest.
References
- Han, G.; Xing, Z.; Yue, Z.; Yang, B.; Zuo, H.; Liang, X. Research status and prospect of deliquification and gas recovery by plunger lift. Nat. Gas Ind. 2024, 44, 52–63. (In Chinese) [Google Scholar]
- Zhao, Q.; Zhu, J.; Cao, G.; Zhu, H.; Zhang, H.-Q. Transient modeling of plunger lift for gas well deliquification. SPE J. 2021, 26, 2928–2947. [Google Scholar] [CrossRef] [Scilit]
- Wang, H.; Yao, H.; Guo, Q.; Yu, X.; Zhang, X.; Cong, L. A transformer fault diagnosis method based on multiscale 1DCNN. J. Electr. Power Sci. Technol. 2023, 38, 104–112. [Google Scholar]
- Jia, Y.; Shi, S.; Tian, W.; Tan, B.; Yang, Y.; Li, X. Transient modeling of plunger lift with check valve for gas well deliquification in horizontal well. Energy Sources Part A Recovery Util. Environ. Eff. 2023, 45, 2267–2283. [Google Scholar] [CrossRef] [Scilit]
- Lea, J.F., Jr.; Rowlan, L. Gas Well Deliquification; Gulf Professional Publishing: Waltham, MA, USA, 2011. [Google Scholar]
- Miao, S.; Liu, X.; Feng, X.; Shi, H.; Luo, W.; Liu, P. A Dynamic Plunger Lift Model for Shale Gas Wells. Fluid. Dyn. Mater. Process 2023, 19, 1735–1751. [Google Scholar] [CrossRef] [Scilit]
- Cao, G.; Jiang, X.; Li, N.; Jia, M.; Zhang, Y.; Wang, H. Domestic and foreign research status and development direction of drainage gas recovery technologies in water-producing gasfields. Oil Drill. Prod. Technol. 2019, 41, 614–623. (In Chinese) [Google Scholar]
- Hashmi, G.M.; Hasan, A.R.; Kabir, C.S. Design of plunger lift for gas wells. In SPE Artificial Lift Conference and Exhibition-Americas; SPE: Singapore, 2016; p. D011S003R001. [Google Scholar]
- Xie, Y.; Ma, S.; Wang, H.; Li, N.; Zhu, J.; Wang, J. Unsupervised clustering for the anomaly diagnosis of plunger lift operations. Geoenergy Sci. Eng. 2023, 231, 212305. [Google Scholar] [CrossRef] [Scilit]
- Gupta, A.; Kaisare, N.S.; Nandola, N.N. Dynamic plunger lift model for deliquification of shale gas wells. Comput. Chem. Eng. 2017, 103, 81–90. [Google Scholar] [CrossRef] [Scilit]
- Agwu, O.E.; Alatefi, S.; Azim, R.A.; Alkouh, A. Applications of Artificial Intelligence Algorithms in Artificial Lift Systems: A Critical Review. Flow Meas. Instrum. 2024, 97, 102613. [Google Scholar] [CrossRef] [Scilit]
- Zaimes, G.G.; Littlefield, J.A.; Augustine, D.J.; Cooney, G.; Schwietzke, S.; George, F.C.; Skone, T.J. Characterizing regional methane emissions from natural gas liquid unloading. Environ. Sci. Technol. 2019, 53, 4619–4629. [Google Scholar] [CrossRef] [Scilit] [PubMed]
- Nguyen, T. Artificial Lift Methods: Design, Practices, and Applications; Springer Nature: Berlin/Heidelberg, Germany, 2020. [Google Scholar]
- He, Y.; Guo, Z.; Wang, X.; Abdul, W. A Hybrid Approach of the Deep Learning Method and Rule-Based Method for Fault Diagnosis of Sucker Rod Pumping Wells. Energies 2023, 16, 3170. [Google Scholar] [CrossRef] [Scilit]
- Xing, Z.; Han, G.; Jia, Y.; Tian, W.; Gong, H.; Zuo, H.; Jiang, W.; Liang, X. Mechanistic Modeling and Experimental Study of Multistage Plunger Lift for Liquid Unloading in Ultra-Deep Gas Well. Geoenergy Sci. Eng. 2025, 246, 213653. [Google Scholar] [CrossRef] [Scilit]
- Mayfield, W.; Lopez, F.; Yu, Y.; Wang, H. Finding Optimal Motor Valve Open Triggers in Plunger Lifted Wells with Offline Reinforcement Learning. In Abu Dhabi International Petroleum Exhibition and Conference; SPE: Singapore, 2023; p. D041S120R001. [Google Scholar]
- Akhiiartdinov, A.; Pereyra, E.; Sarica, C.; Severino, J. Data analytics application for conventional plunger lift modeling and optimization. In SPE Artificial Lift Conference and Exhibition-Americas; OnePetro: Richardson, TX, USA, 2020. [Google Scholar]
- Kamari, A.; Bahadori, A.; Mohammadi, A.H. Prediction of maximum possible liquid rates produced from plunger lift by use of a rigorous modeling approach. SPE Prod. Oper. 2017, 32, 7–11. [Google Scholar]
- Singh, A.; Shukla, A.; Purwar, S. Leveraging machine learning and interactive voice interface for automated production monitoring and diagnostic. In SPE Annual Technical Conference and Exhibition; SPE: Singapore, 2022; p. D021S038R003. [Google Scholar]
- Tian, C.; Horne, R.N. Applying machine-learning techniques to interpret flow-rate, pressure, and temperature data from permanent downhole gauges. SPE Reserv. Eval. Eng. 2019, 22, 386–401. [Google Scholar] [CrossRef] [Scilit]
- Zhu, J.; Liu, Y.; Chen, M.; Wang, H.; Li, Y.; Zhu, H. Enhanced Zero-Shot Classification of Plunger Lift Operating Conditions via a Modified CLIP Architecture and Selective Data Sampling. SSRN Electron. J. 2026, SSRN 5668251. Available online: https://ssrn.com/abstract=5668251 (accessed on 15 June 2026).
- Xing, Z.; Han, G.; Jia, Y.; Tian, W.; Gong, H.F.; Jiang, W.B.; Mai, P.D.; Liang, X.Y. Optimization of plunger lift working systems using reinforcement learning for coupled wellbore/reservoir. Pet. Sci. 2025, 22, 2154–2168. [Google Scholar] [CrossRef] [Scilit]
- Chen, B.; Zha, J.; Cai, Z.; Wu, M. Predictive modelling of surface roughness in precision grinding based on hybrid algorithm. CIRP J. Manuf. Sci. Technol. 2025, 59, 1–17. [Google Scholar] [CrossRef] [Scilit]
- Wu, M.; Yao, Z.; Verbeke, M.; Karsmakers, P.; Gorissen, B.; Reynaerts, D. Data-driven models with physical interpretability for real-time cavity profile prediction in electrochemical machining processes. Eng. Appl. Artif. Intell. 2025, 160, 111807. [Google Scholar] [CrossRef] [Scilit]
- Wu, M.; Yao, Z.; Ye, L.; Verbeke, M.; Karsmakers, P.; Reynaerts, D. Geometrical Feature Classification in Electrical Discharge Machining Using In-Process Monitoring and Machine Learning. Procedia CIRP 2025, 137, 462–467. [Google Scholar] [CrossRef] [Scilit]
- Yao, Z.; Wu, M.; Qian, J.; Reynaerts, D. Intelligent discharge state detection in micro-EDM process with cost-effective radio frequency (RF) radiation: Integrating machine learning and interpretable AI. Expert Syst. Appl. 2025, 291, 128607. [Google Scholar] [CrossRef] [Scilit]
- Li, X.; Siahpour, S.; Lee, J.; Wang, Y.; Shi, J. Deep learning-based intelligent process monitoring of directed energy deposition in additive manufacturing with thermal images. Procedia Manuf. 2020, 48, 643–649. [Google Scholar] [CrossRef] [Scilit]
- Cen, S.; Kim, D.O.; Lim, C.G. A fused CNN-LSTM model using FFT with application to real-time power quality disturbances recognition. Energy Sci. Eng. 2023, 11, 2267–2280. [Google Scholar] [CrossRef] [Scilit]
- Deng, C.; Deng, Z.; Lu, S.; He, M.; Miao, J.; Peng, Y. Fault diagnosis method for imbalanced data based on multi-signal fusion and improved deep convolution generative adversarial network. Sensors 2023, 23, 2542. [Google Scholar] [CrossRef] [Scilit] [PubMed]
- Wang, J.; Zhuang, J.; Duan, L.; Cheng, W. A multi-scale convolution neural network for featureless fault diagnosis. In 2016 International Symposium on Flexible Automation (ISFA); IEEE: New York, NY, USA, 2016; pp. 65–70. [Google Scholar]
- Wang, X.; Ma, W.; Luo, W.; Liao, R. Drainage Research of Different Tubing Depth in the Horizontal Gas Well Based on Laboratory Experimental Investigation and a New Liquid-Carrying Model. Energies 2023, 16, 2165. [Google Scholar] [CrossRef] [Scilit]
- Shen, Q.; Zhang, Z. Fault diagnosis method for bearing based on attention mechanism and multi-scale convolutional neural network. IEEE Access 2024, 12, 12940–12952. [Google Scholar] [CrossRef] [Scilit]
- Liu, Q.; Zhu, J.; Wang, H.; Chen, S.; Wang, H.Y.; Li, N.; Zhong, R.Z.; Liu, Y.J.; Zhu, H.W. Deep Feature Learning for Anomaly Detection in Gas Well Deliquification using Plunger Lift: A Novel CNN-based Approach. Pet. Sci. 2025, in press. [Google Scholar] [CrossRef] [Scilit]
- Shi, H.; Su, Y.; Pan, Y.; Zhang, W.; Chen, Z.; Liao, R. Research on failure diagnosis analysis of plunger gas lift system using convolutional neural network with multi-scale channel attention mechanism based on wavelet transform. Chem. Eng. Sci. 2024, 304, 121031. [Google Scholar] [CrossRef] [Scilit]
- Dosovitskiy, A.; Beyer, L.; Kolesnikov, A.; Weissenborn, D.; Zhai, X.; Unterthiner, T.; Dehghani, M.; Minderer, M.; Heigold, G.; Gelly, S.; et al. An image is worth 16x16 words: Transformers for image recognition at scale. arXiv 2020, arXiv:2010.11929. [Google Scholar]
- Liu, Z.; Hu, H.; Lin, Y.; Yao, Z.; Xie, Z.; Wei, Y.; Ning, J.; Cao, Y.; Zhang, Z.; Dong, L.; et al. Swin transformer v2: Scaling up capacity and resolution. In Proceedings of the IEEE/CVF Conference on Computer Vision and Pattern Recognition, New Orleans, LA, USA, 19–20 June 2022; pp. 12009–12019. [Google Scholar]
- Oquab, M.; Darcet, T.; Moutakanni, T.; Vo, H.; Szafraniec, M.; Khalidov, V.; Fernandez, P.; Haziza, D.; Massa, F.; El-Nouby, A.; et al. Dinov2: Learning robust visual features without supervision. arXiv 2023, arXiv:2304.07193. [Google Scholar]
- Vaswani, A.; Shazeer, N.; Parmar, N.; Uszkoreit, J.; Jones, L.; Gomez, A.N.; Kaiser, Ł.; Polosukhin, I. Attention is all you need. In Advances in Neural Information Processing Systems; Curran Associates Inc.: Red Hook, NY, USA, 2017; p. 30. [Google Scholar]
- Huo, Y.; Gang, S.; Guan, C. FCIHMRT: Feature cross-layer interaction hybrid method based on Res2Net and transformer for remote sensing scene classification. Electronics 2023, 12, 4362. [Google Scholar] [CrossRef] [Scilit]
- Mia, M.S.; Arnob, A.B.H.; Naim, A.; Voban, A.A.B.; Islam, M.S. ViTs are Everywhere: A Comprehensive Study Showcasing Vision Transformers in Different Domain. In 2023 International Conference on the Cognitive Computing and Complex Data (ICCD); IEEE: New York, NY, USA, 2023; pp. 101–117. [Google Scholar]
- Huang, L.; Zeng, J.; Yu, M.; Ding, W.; Bai, X.; Wang, K. Efficient feature selection for pre-trained vision transformers. Comput. Vis. Image Underst. 2025, 254, 104326. [Google Scholar] [CrossRef] [Scilit]
- Mikołajczyk, A.; Grochowski, M. Data augmentation for improving deep learning in image classification problem. In 2018 International Interdisciplinary PhD Workshop (IIPhDW); IEEE: New York, NY, USA, 2018; pp. 117–122. [Google Scholar]
- Mumuni, A.; Mumuni, F. Data augmentation: A comprehensive survey of modern approaches. Array 2022, 16, 100258. [Google Scholar] [CrossRef] [Scilit]
- Shorten, C.; Khoshgoftaar, T.M. A survey on image data augmentation for deep learning. J. Big Data 2019, 6, 1–48. [Google Scholar] [CrossRef] [Scilit]
- Jaderberg, M.; Simonyan, K.; Zisserman, A. Spatial transformer networks. Adv. Neural Inf. Process. Syst. 2015, 28, 2017–2025. [Google Scholar]
- Karargyris, A. Color space transformation network. arXiv 2015, arXiv:1511.01064. [Google Scholar]
- Zhang, M.; Ai, J.; Shi, T. An empirical analysis of feature fusion task heads of ViT pre-trained models on OOD classification tasks. J. Syst. Softw. 2025, 223, 112358. [Google Scholar] [CrossRef] [Scilit]
- Guo, Y.; Du, C.; Liu, X.; Zhang, X.; Jin, Z. Research on attention-based fault diagnosis and multi-parameter joint optimization of CO2 heat pump system. Appl. Therm. Eng. 2026, 289, 129942. [Google Scholar] [CrossRef] [Scilit]
- Han, K.; Wang, Y.; Chen, H.; Chen, X.; Guo, J.; Liu, Z.; Tang, Y.; Xiao, A.; Xu, C.; Xu, Y.; et al. A Survey on Vision Transformer. IEEE Trans. Pattern Anal. Mach. Intell. 2020, 45, 87–110. [Google Scholar]
- Pan, Y.; Bi, R.; Yang, S.; Lyu, Z.; Ju, X. Application of a Bayesian Ensemble Algorithm for Automated Production Diagnostic of Gas Wells with Plunger-Lift. In International Petroleum Technology Conference; IPTC: Singapore, 2024; p. D011S029R008. [Google Scholar]
- Guan, A.; Zhou, S.; Gu, W.; Wu, Z.; Gao, M.; Liu, H.; Zhang, X.P. Dynamic simulation and parameter calibration-based experimental digital twin platform for heat-electric coupled system. IEEE Trans. Sustain. Energy 2025, 17, 1132–1145. [Google Scholar]
- Zhu, J.; Cao, G.; Tian, W.; Zhao, Q.; Zhu, H.; Song, J.; Peng, J.; Lin, Z.; Zhang, H.-Q. Improved data mining for production diagnosis of gas wells with plunger lift through dynamic simulations. In SPE Annual Technical Conference and Exhibition; SPE: Singapore, 2019; p. D021S030R001. [Google Scholar]



Disclaimer/Publisher’s Note: The statements, opinions and data contained in all publications are solely those of the individual author(s) and contributor(s) and not of MDPI and/or the editor(s). MDPI and/or the editor(s) disclaim responsibility for any injury to people or property resulting from any ideas, methods, instructions or products referred to in the content. |
© 2026 by the authors. Licensee MDPI, Basel, Switzerland. This article is an open access article distributed under the terms and conditions of the Creative Commons Attribution (CC BY) license.