


Abstract
Carbon capture, utilization and storage (CCUS) is a key technology for carbon neutrality and efficient oilfield development. Oil well cement suffers serious carbonation degradation under high-temperature, high-pressure and high CO2 partial pressure environments, leading to well cementing failure. In this study, TA@Gr-OTES (TGO) composite was prepared by surface grafting modification, and a hydrophobic oil well cement system suitable for CCUS was constructed. The anti-carbonation performance was tested under simulated formation conditions (130 °C, 25 MPa, CO2 partial pressure 7 MPa). Results show that TGO-modified cement maintains stable hydrophobicity, with a 60-day compressive strength attenuation rate of only 6.7%, and its permeability and porosity are much lower than those of plain cement. TGO inhibits deep carbonation and corrosion product leaching, preserves hydration products, and reduces defect volume. The potential triple mechanisms of a hydrophobic barrier, graphene physical shielding and matrix densification effectively blocks CO2 intrusion. This study provides theoretical and technical support for long-life cementing materials in CCUS wells.
1. Introduction
Carbon capture, utilization and storage (CCUS) technology is a core technology for achieving the carbon neutrality goal and ensuring the efficient development of oilfields, and has broad application prospects in oil and gas fields and low-carbon engineering [1]. As the key structural material of cementing engineering, oil well cement stone needs to bear the coupled erosion of high temperature, high pressure, high salinity fluid in the formation and high concentration CO2 in the long term. After CO2 invades the cement matrix, it will undergo a severe carbonation reaction with hydration products (Ca(OH)2), C-S-H gel, etc.), generating CaCO3 accompanied by volume expansion and structural loosening [2], which leads to a sharp drop in the strength of cement stone, a surge in permeability, and crack penetration. Eventually, it causes engineering accidents such as cementing sealing failure and fluid channeling, seriously threatening the long-term safe service of CCUS wells [3,4].
Conventional Grade G oil well cement has limited high-temperature resistance and corrosion resistance to CO2. Although its high-temperature stability can be improved by mineral admixtures such as silica fume and fly ash, it is difficult to inhibit the intrusion of acidic media and carbonation deterioration at the interface and microstructural levels [5]. Graphene (Gr) has high barrier properties, high mechanical strength and a two-dimensional lamellar structure, and can be used as an efficient modifying component for cement-based materials [6,7,8]; tannic acid (TA) is rich in phenolic hydroxyl groups and can be used as a dispersing and bridging additive to improve the dispersion of Gr in the cement matrix [9,10]; n-Octyltriethoxysilane (OTES) can endow the material surface with hydrophobic properties and block the transmission path of moisture and CO2 [11,12]. Compared with conventional graphene-modified oil well cement systems, which primarily rely on physical tortuous diffusion pathways to mitigate CO2 ingress [7,13], the present TA@Gr-OTES (TGO) composite introduces a multi-functional hydrophobic interface via silane grafting, directly reducing water/CO2 wettability and lowering the driving force for CO2 dissolution and diffusion [14]. Unlike silane-only modified cement, which suffers from poor dispersion and weak interfacial bonding under high-temperature high-pressure (HTHP) conditions [13], TGO employs TA as a bridging agent to improve graphene dispersion and enhance interfacial adhesion between graphene and cement hydrates [9]. Conventional hydrophobic admixtures often degrade or lose hydrophobicity under 130 °C and high salinity, whereas the chemically grafted OTES layer in TGO provides stable hydrophobicity at elevated temperatures, maintaining a persistent barrier effect [11,15]. The innovation of this work lies in the integration of a hydrophobic barrier, graphene physical shielding, and matrix densification into one composite material, which achieves a synergistic anti-carbonation effect that cannot be realized by single-component graphene or silane modification alone. Current research on oil well cement modification for CCUS environments still has distinct scientific gaps, most studies focus on single-component modification (e.g., only graphene or single silane) or the simple physical blending of multiple components, lacking the exploration of multi-component chemical grafting composite strategies that couple hydrophobic function, physical barrier and matrix optimization. Gong et al. demonstrated the reinforcing effects of graphene oxide as a single additive for CO2 storage well cement, relying solely on physical barrier effects without hydrophobic functionalization [16]; Martimiano et al. adopted organo-modified montmorillonite nanoclay as a single hydrophobic additive to improve CO2 resistance, lacking multi-scale structural regulation [17]. Although Xia et al. reported a polymer-grafted nanosilica composite via chemical grafting, the design target was fluid loss control rather than anti-carbonation under high CO2 partial pressure, and it did not integrate a hydrophobic barrier, physical shielding and matrix densification into one system [18]. Additionally, existing works rarely systematically investigate the potential anti-carbonation mechanisms of multi-functional composite modified cement under extreme conditions of 130 °C, 25 MPa and high CO2 partial pressure, and the correlation between multi-scale structural evolution and macroscopic anti-carbonation performance remains unclear. Song et al. revealed the mineralogical and mechanical degradation of plain oil well cement under high-temperature and high-pressure CO2 carbonation via multi-scale techniques but did not address modified cement systems [19]; Lu et al. investigated nanoparticle–cellulose fiber synergistic modification and multi-scale structural changes, but did not consider the coupled effects of hydrophobic grafting and graphene-based physical shielding [20]. Pang et al. summarized research advances on oil well cement under high-temperature and high-pressure curing, highlighting the scarcity of systematic mechanism studies for multi-functional grafted composites in extreme CCUS environments [21].
Based on this, this paper prepares TA@Gr-OTES (TGO) composite material to construct a hydrophobic oil well cement system suitable for the CCUS environment, simulates real formation corrosion conditions (130 °C, 25 MPa, CO2 partial pressure 7 MPa), systematically evaluates its macroscopic service performance and microstructure evolution, clarifies the anti-carbonation mechanism of hydrophobic cement, and aims to provide an experimental basis and theoretical guidance for the design and application of high-performance cementing materials under severe CO2-rich environments.
2. Materials and Methods
2.1. Materials
The composition of Grade G oil well cement (Sichuan Jiahua Special Cement Co., Ltd., Leshan, China) is shown in Table 1. Silica fume (300 mesh), organic silicon defoamer, polycarboxylate dispersant, and retarder (Dezhou Continental Shelf Petroleum Engineering Technology Co., Ltd., Dezhou, China) are all commonly used industrial-grade additives for cementing, with clear functions and stable performance. The solid content of water-based fluorocarbon resin (Shanghai Yien Chemical Technology Co., Ltd., Shanghai, China) is 48%.
Table 1.
Chemical composition of different types of oil well cements (wt%) [7].
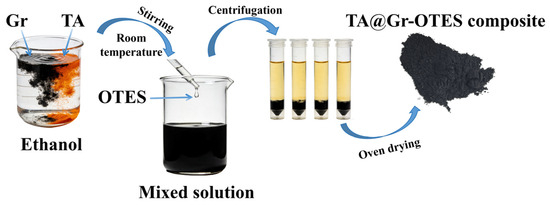
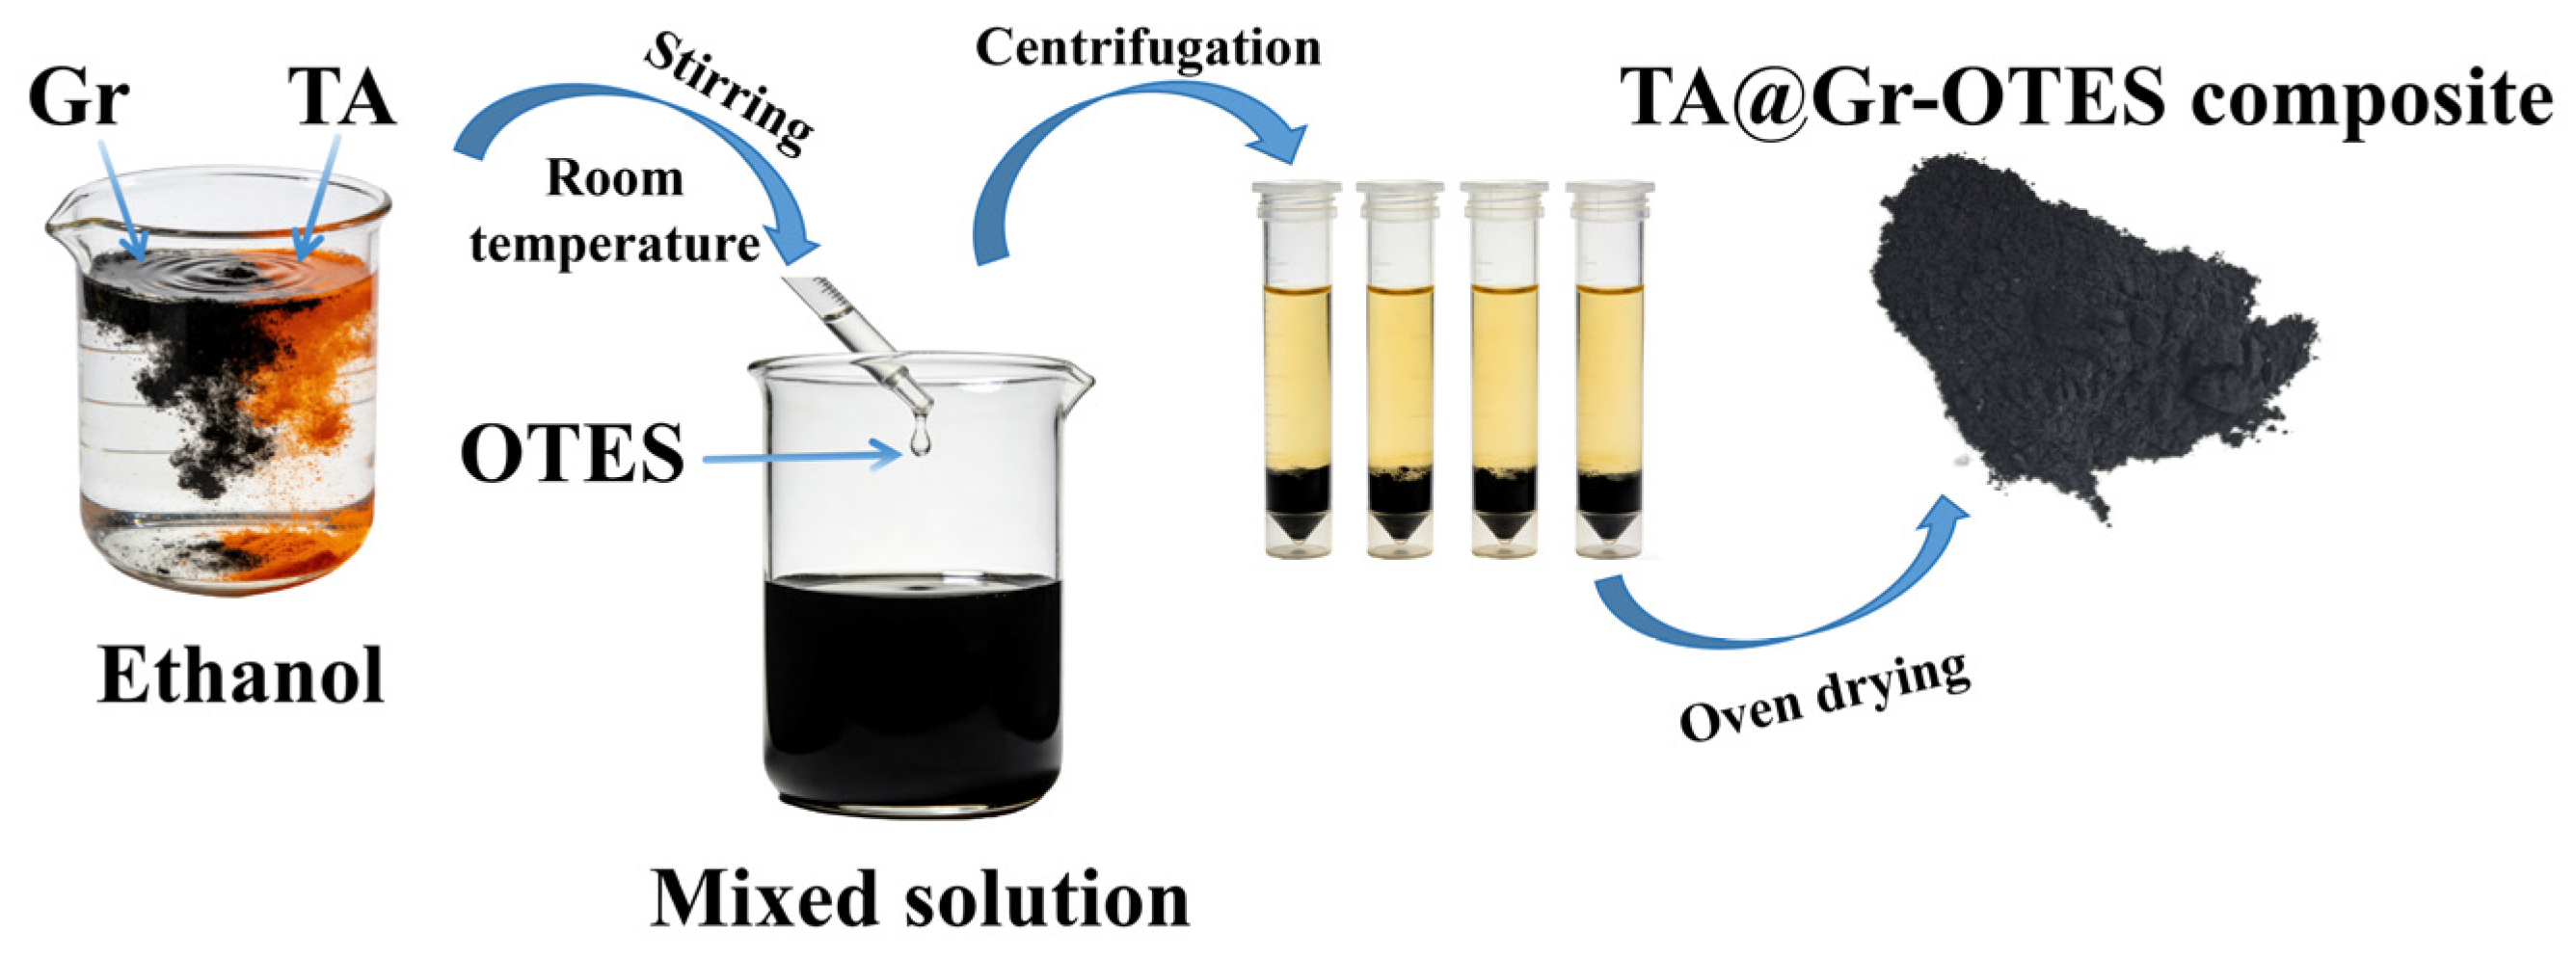
The TGO composite material is prepared by the surface graft modification method (Figure 1). Under the condition that the ratio of TA to Gr is maintained at 1:1, Gr powder (purity ≥ 98%, sheet thickness 1–3 nm) was first dispersed in anhydrous ethanol (analytical grade, solvent system) via ultrasonic dispersion at 300 W power for 40 min to avoid agglomeration. Then, TA powder was added to the Gr ethanol dispersion, configuring TA/Gr nanoparticles with a total concentration of 8 mg/mL in 50 mL of anhydrous ethanol solution. The mixture was magnetically stirred at 500 r/min for 2 h at room temperature. Subsequently, 10 mL of OTES solution is added to the above solution, and magnetic stirring is continued at 500 r/min for 1 h to obtain a black mixed solution. After centrifugation, washing and drying, the TGO composite material is obtained. The materials used in the preparation of the TGO composite material are purchased from Shanghai Aladdin Biochemical Technology Co., Ltd., Shanghai, China.
Figure 1.
Flow chart of TA@Gr-OTES composite preparation.
The yield of the TGO composite prepared by this method is 89.2%. A preliminary cost assessment shows that the cost of TGO composite per kilogram is about 185 CNY, and the additional cost of adding 1% TGO to oil well cement is about 12.5 CNY per ton of cement, which has a negligible impact on the overall cost of oil well cementing and meets the requirements of large-scale field application.
2.2. Preparation and Corrosion of Cement Samples
2.2.1. Preparation of Cement Samples
The mix ratios of the ordinary (PT) cement system and the TGO cement system are shown in Table 2. The basis for mix ratio optimization is that a silica fume content of 35% can balance high-temperature stability and alkali content control [22], while a TGO content of 1% and a water-based fluorocarbon resin content of 5% are determined based on preliminary pre-experiments (balancing modification effect and economy). The cement slurry was stirred at 12,000 rpm for 35 s using a constant-speed mixer (TG-3060 A, Shenyang Taige Petroleum Instrument Equipment Co., Ltd., Shenyang, China), poured into a (50.8 × 50.8 × 50.8 mm3) mold (complying with API standards [23]), and cured at 130 °C and 25 MPa for 7 days; then, cylindrical specimens of Φ25 mm × 50 mm were cored. This size design can ensure the uniform penetration of corrosive media and meet the subsequent test requirements.
Table 2.
Composition of cement slurry (wt%).
2.2.2. Corrosion of Cement Specimens
A high-temperature and high-pressure corrosion kettle (TL-3, Jingzhou Taling Machinery Co., Ltd., Jingzhou, China) was used for corrosion experiments. The simulated water composition refers to the actual water salinity formation of the Shengli Oilfield million-ton CCUS well (Table 3). The corrosion conditions were set as 130 °C, at 25 MPa (CO2 partial pressure of 7 MPa). The temperature and pressure were monitored in real time during corrosion, with errors controlled within ±0.5 °C and ±0.1 MPa to ensure the stability of test conditions.
Table 3.
Composition of simulated saline water (mg/L).
2.3. Experimental Methods
2.3.1. Wettability Test
At room temperature, a contact angle measuring instrument (CA500S, Beidou Instrument Co., Ltd., Chongqing, China) was used to determine the contact angle (WCA) of the sample by the drop method. In total, 5 μL of deionized water was used as the droplet, and at least 5 different positions were measured on each specimen to evaluate the WCA of the coating by taking the average value.
2.3.2. Corrosion Depth
The phenolphthalein color development method (1% phenolphthalein ethanol solution) was used to determine the carbonation depth by measuring the distance of the color development boundary on the cross-section. This method is intuitive and has been widely used in cement carbonation evaluation [24], with test error ≤ 0.1 mm.
2.3.3. Compressive Strength
A universal mechanical testing machine (HY-20080, Shanghai Hengyi Precision Instrument Co., Ltd., Shanghai, China) was used to test at a loading rate of 1.2 kN/s. Three parallel samples were set for each group, and the average value was taken. This loading rate complies with the GB/T 17671-2021 standard [25], which can accurately reflect the bearing capacity of cement stone.
2.3.4. Permeability and Porosity
Specimens were oven-dried at 60 °C for 24 h until constant mass was achieved. The permeability and porosity of the dried cement samples were subsequently determined using a core flow apparatus (LDY 50-180, Nantong Yichuang Experimental Instrument Co., Ltd., Nantong, China). Triplicate measurements were performed, and the mean value was reported.
2.3.5. Phase Composition Analysis
FTIR (Nicolet iS20, Thermo Fisher Scientific Inc., Waltham, MA, USA) was used to characterize the chemical bond changes in materials. XRD (Ultima IV, Malvernpanalytical, Worcestershire, UK) (scanning speed of 0.08°/s, 2θ = 5°~70°) was used for qualitative analysis of phase composition; thermal analyzer (TG-DTA8122, Rigaku, Japan) (heating rate 20 °C/min) was used for the quantitative detection of CaCO3 content. The two methods complement each other to fully reveal the phase evolution law.
2.3.6. Microstructure Analysis
SEM-EDS (SU5000, Hitachi, Tokyo, Japan) was used to analyze the cross-sectional morphology of composite materials and cement stone, and XCT (Phoenix V tome x M300, Baker Hughes, Houston, TX, USA) (parameters shown in Table 4) was used to non-destructively characterize the three-dimensional defect evolution. This combined characterization can analyze structural changes from macro to micro and from whole to local, providing direct evidence for mechanism analysis.
Table 4.
XCT scanning parameters and standard settings.
3. Results and Analysis
3.1. Characterization of TA@Gr-OTES Composite
3.1.1. Chemical Structure and Phase Analysis
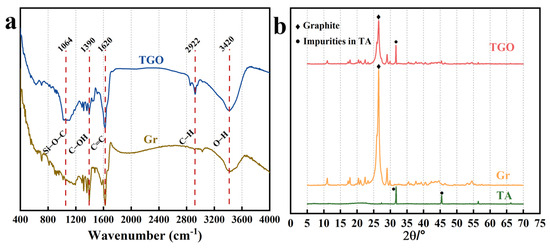
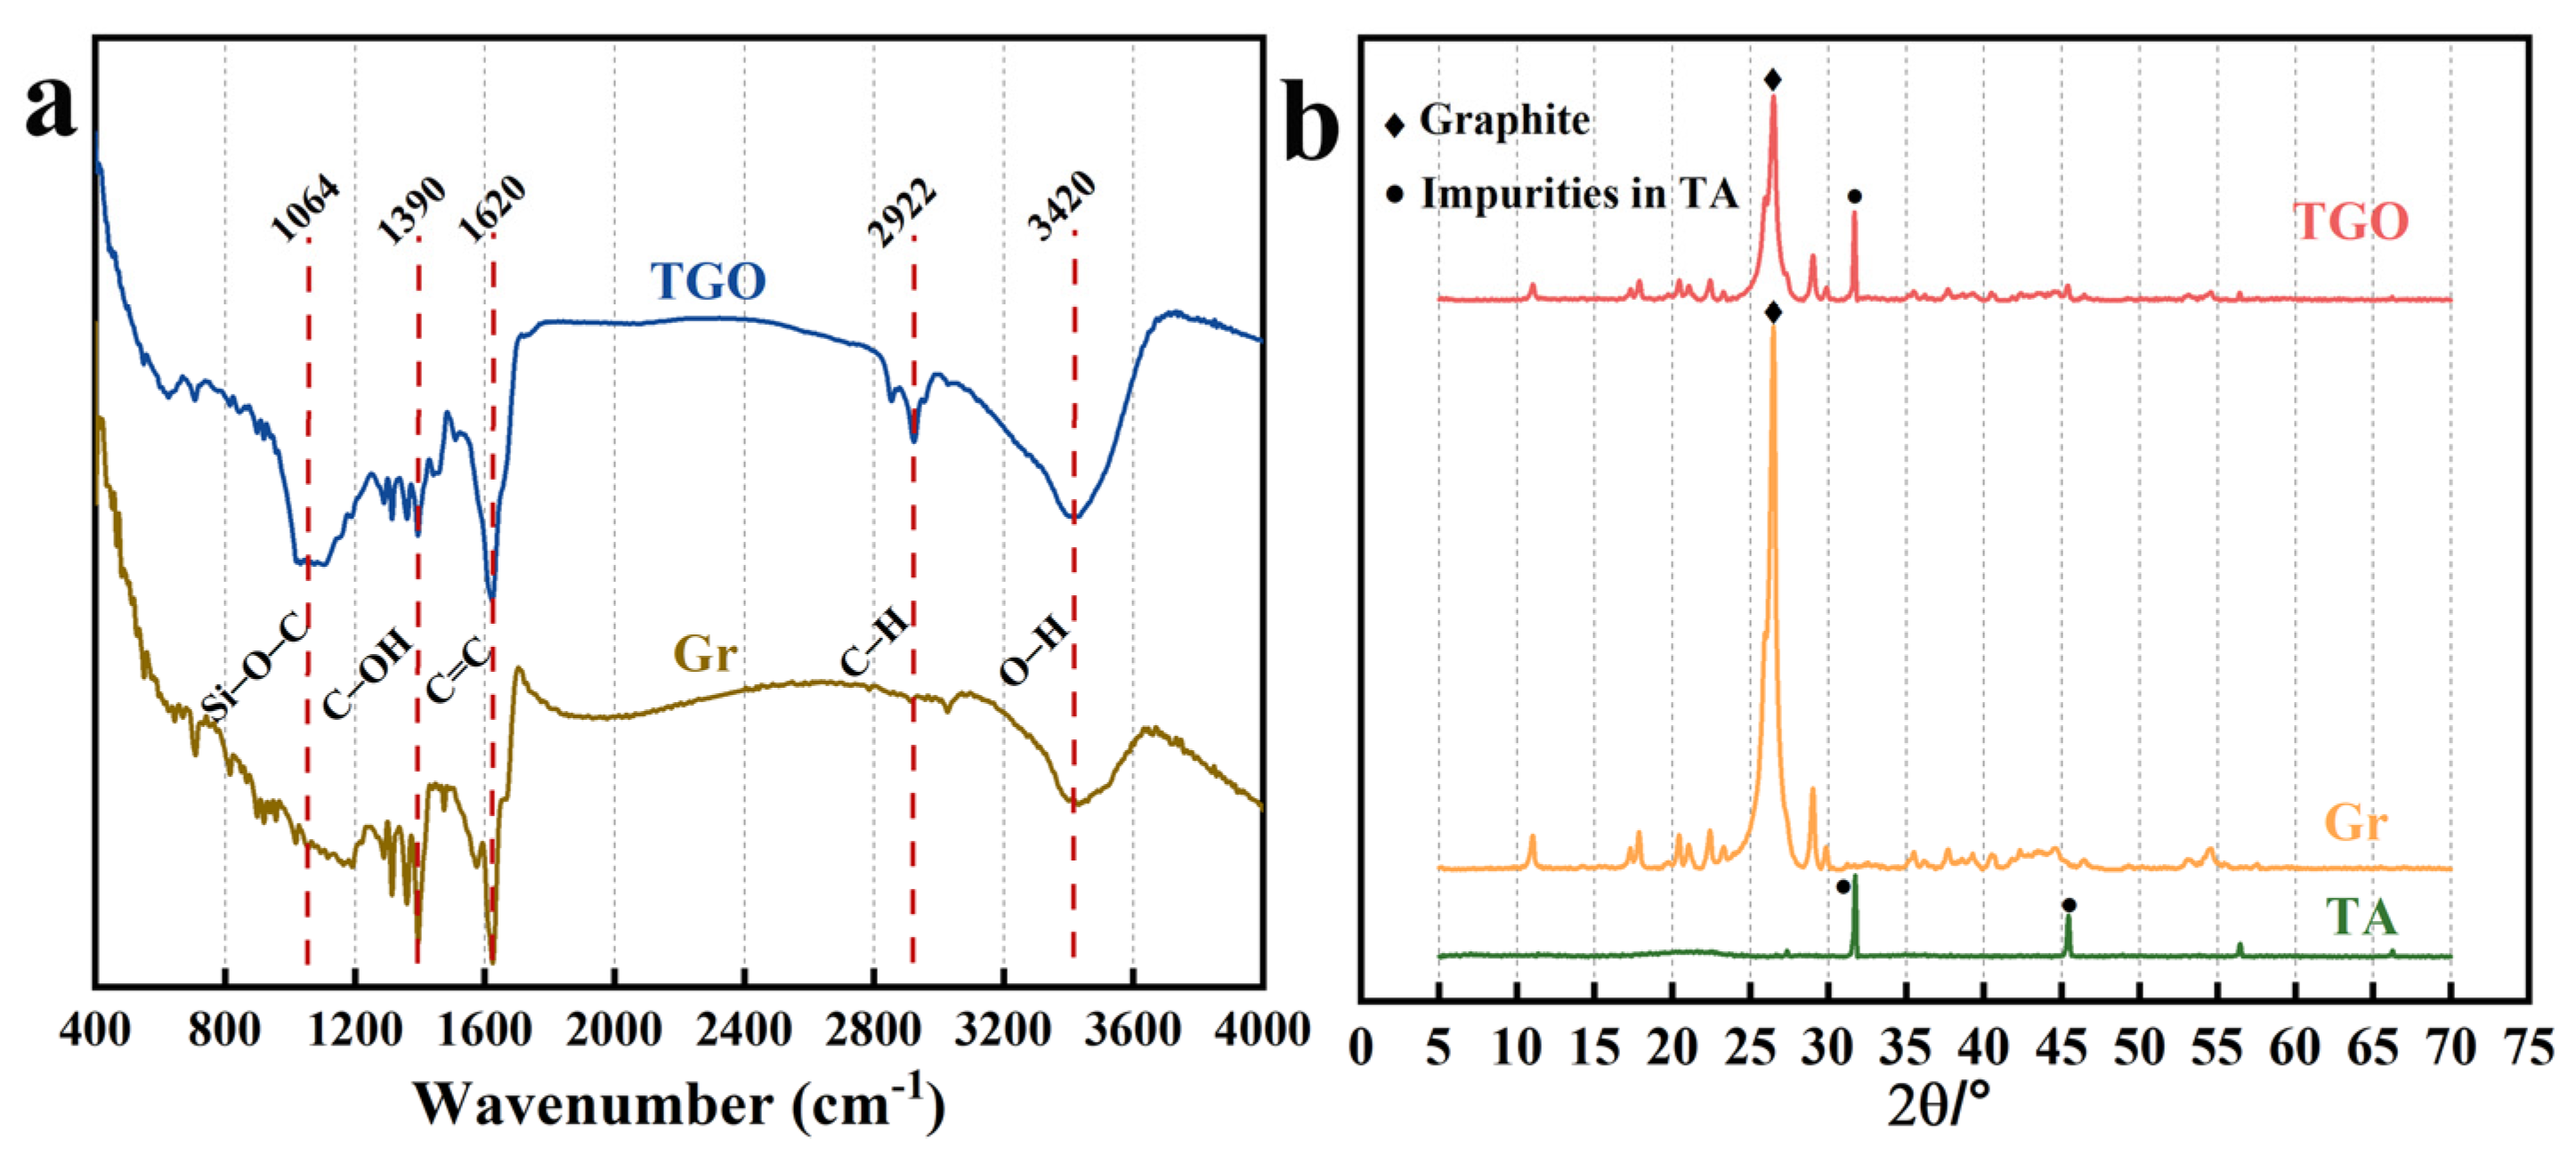
To clarify the formation mechanism, chemical interaction and crystal structure characteristics of the TGO composite, FTIR and XRD test results were jointly analyzed (Figure 2).
Figure 2.
RTIR curves (a) and XRD curves (b) of different materials.
From the perspective of chemical interaction and functional group changes, the characteristic peak of Gr confirms the existence of its sp2 carbon skeleton and residual hydroxyl groups on the surface. The TGO composite still retains a clear C=C stretching vibration peak at 1620 cm−1, indicating that the conjugated skeleton structure of Gr is not destroyed during the modification process, which is highly consistent with the conclusion that TGO still maintains the basic lamellar structure of Gr in XRD analysis. Meanwhile, the intensity of the Si-O-C stretching vibration peak of the TGO at 1064 cm−1 is significantly enhanced, which directly proves that after the hydrolysis of OTES, it undergoes a condensation reaction with hydroxyl groups on the surface of Gr and TA and is successfully grafted to form a stable cross-linked network, which is also the core structural basis for TGO to obtain hydrophobic properties, indicating that TGO is not a simple physical mixture of Gr and TA but has significant chemical interaction.
From the perspective of crystal structure and lamellar evolution, TA only shows weak and diffuse diffraction signals without obvious characteristic peaks, indicating that it is an amorphous structure with no long-range ordered arrangement between molecules. Pure Gr shows a strong and sharp diffraction peak at 2θ ≈ 26°, corresponding to Gr (002) crystal plane, reflecting its typical lamellar stacking structure and high crystallinity. The diffraction peak shape of the TGO composite changes significantly, and the intensity of the characteristic peak at 2θ ≈ 26° decreases obviously and the peak shape broadens, indicating that the introduction of TA and OTES destroys the original perfect lamellar stacking of Gr, leading to a moderate decrease in its crystallinity. This crystal structure change is completely consistent with the chemical action revealed by FTIR. The bridging effect of TA and hydrophobic modification of OTES not only retain the lamellar skeleton structure of Gr but also form a composite structure with increased interlayer spacing and moderately reduced crystallinity through intermolecular interaction and chemical grafting, taking into account the structural stability and hydrophobic function of the material.
3.1.2. Microscopic Morphology Analysis
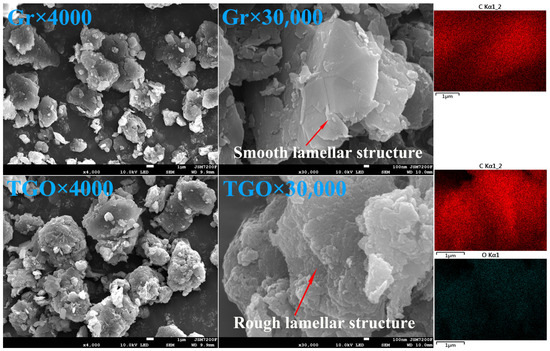
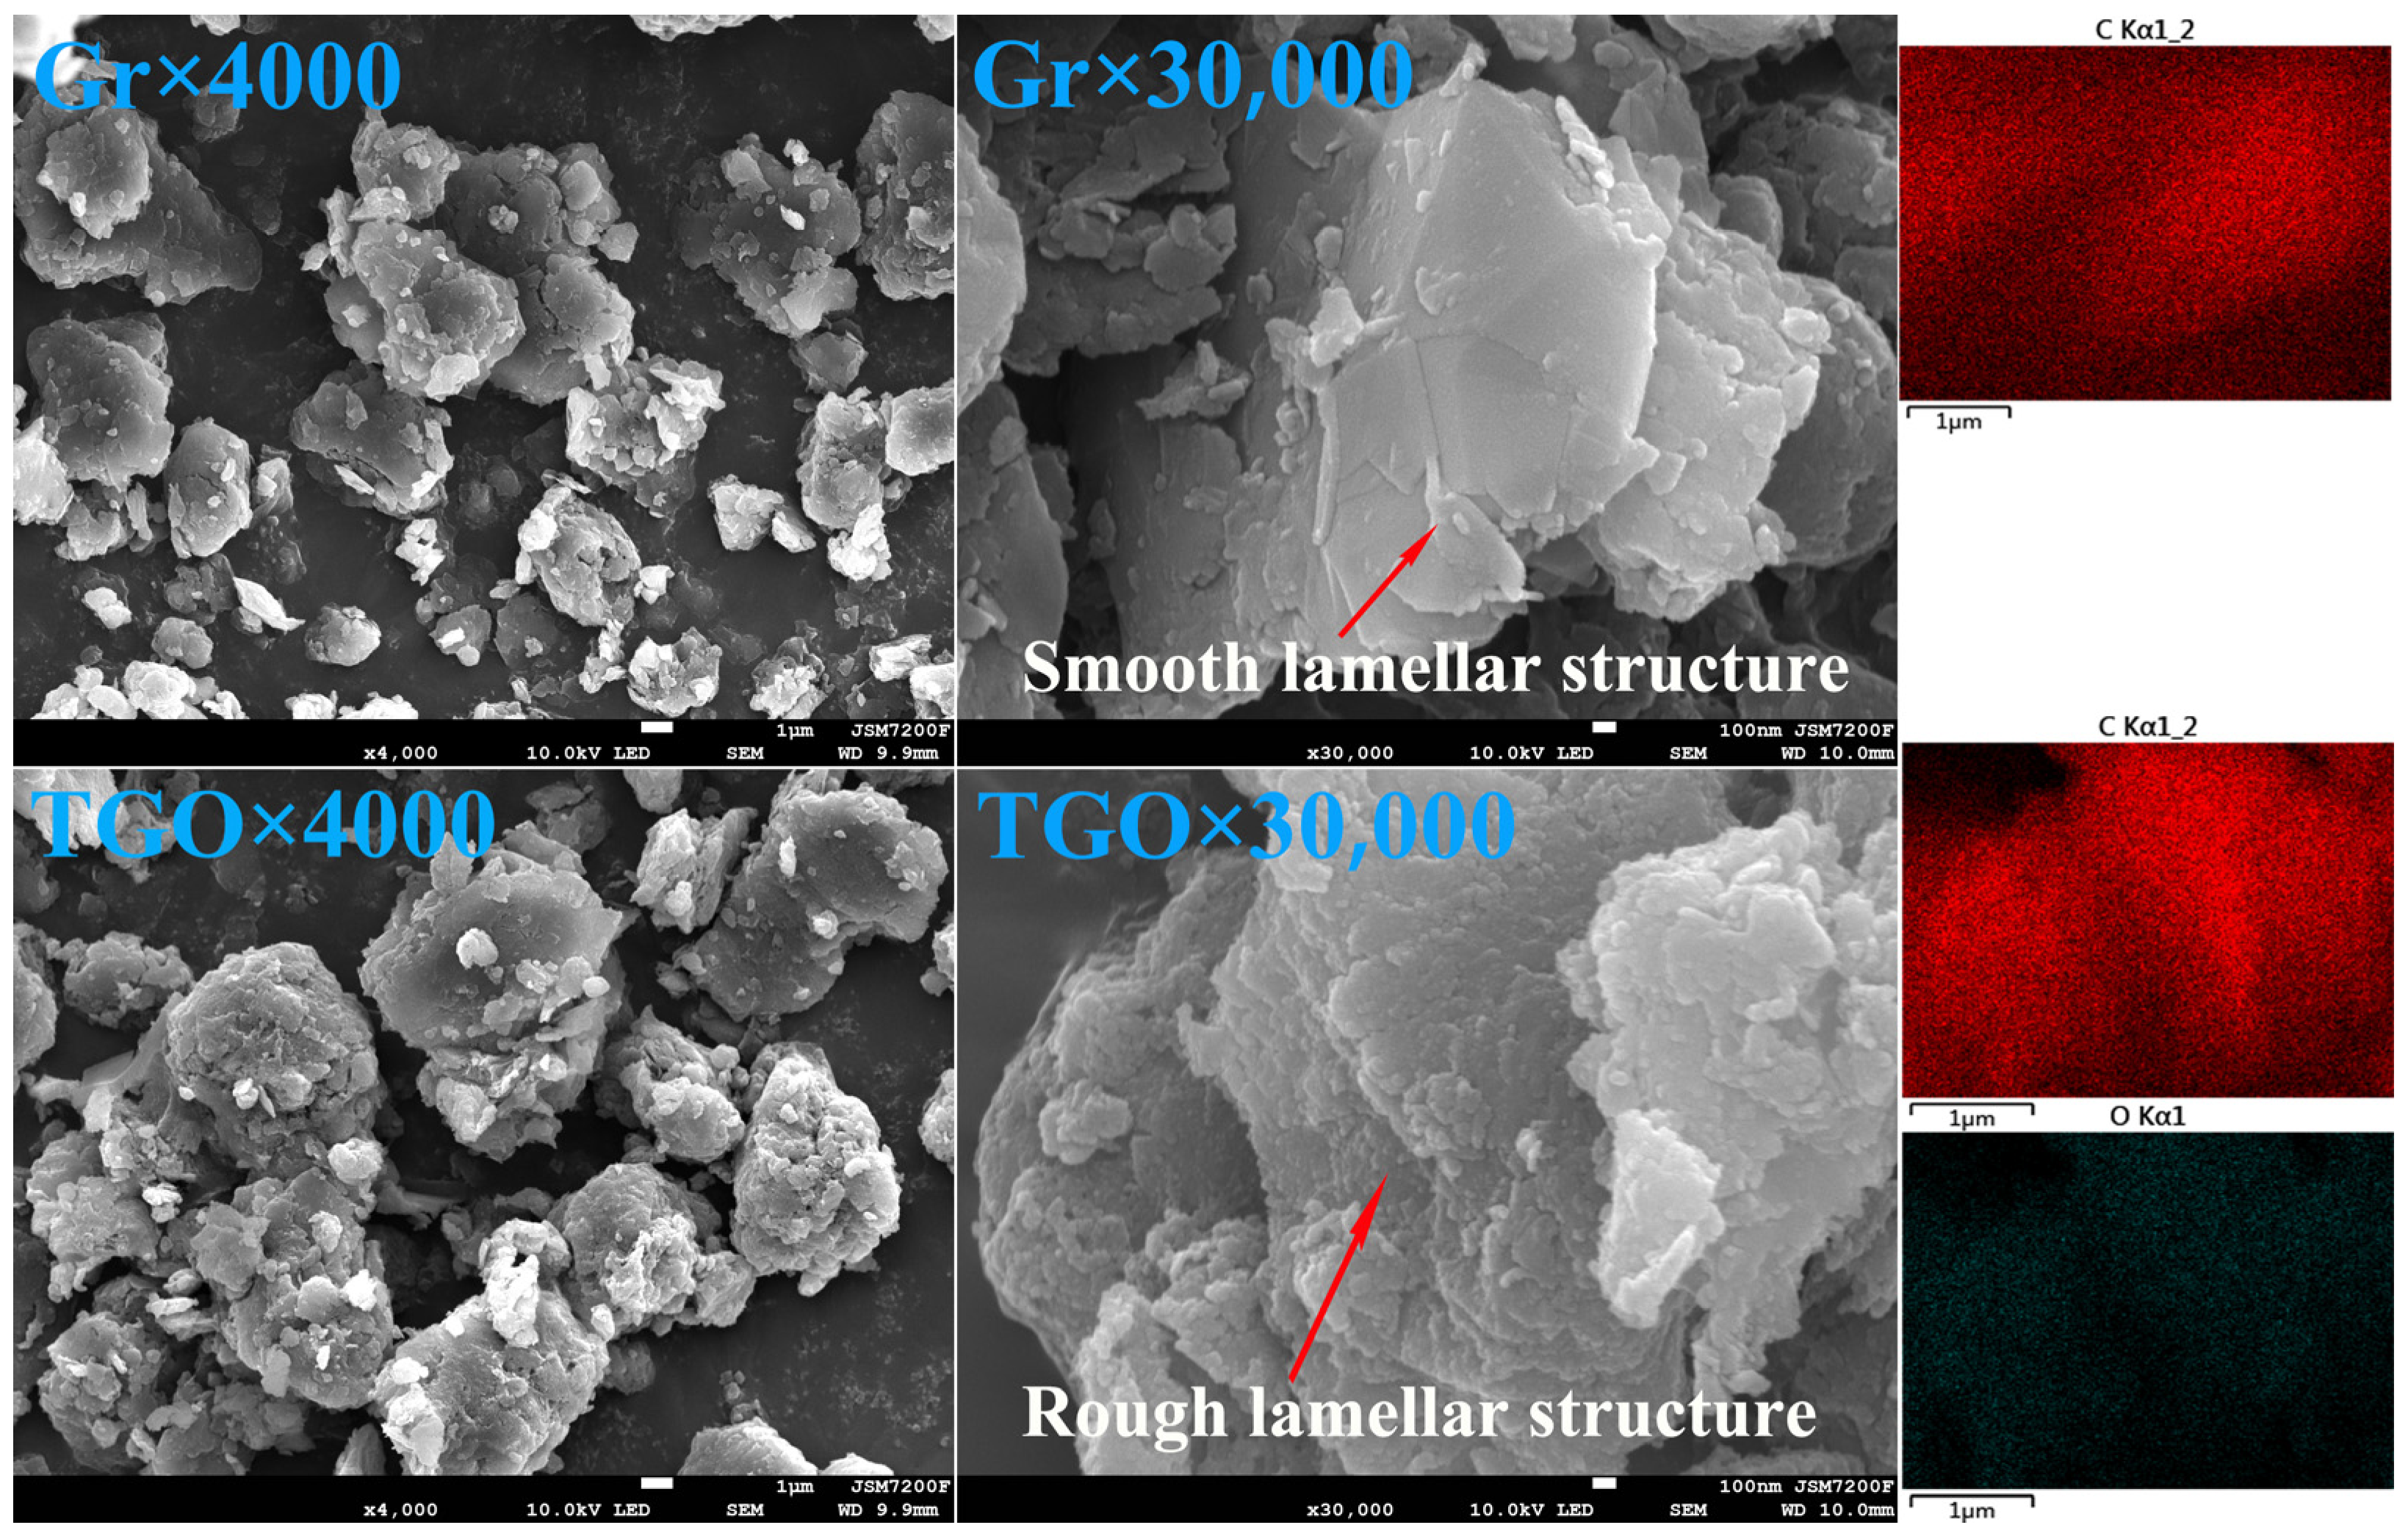
The electron microscopy image of Gr (Figure 3) shows a typical lamellar structure with relatively smooth and flat lamellar surfaces, and slight stacking exists between the lamellae. This structural characteristic of Gr lamellae endows it with excellent physical barrier properties. However, its surface lacks active functional groups, and the van der Waals forces between the lamellae tend to cause agglomeration, which is not conducive to compounding with other components and the uniform dispersion in the cement matrix. This also provides the necessity for subsequent modification and functionalization using TA and OTES.
Figure 3.
SEM Images of TGO Composite and Gr.
The electron microscopy images of TA@Gr-OTES composites show significant changes compared to those of Gr. Their lamellar structure is still completely retained, but the surface becomes rough and inhomogeneous, with a layer of film-like substance uniformly attached to the originally smooth Gr sheet surface. This change in micro-morphology is direct evidence of the successful modification of Gr by TA and OTES. As a bridging molecule, the phenolic hydroxyl groups in TA molecules undergo chemical reactions with the residual groups on the Gr surface, forming an organic modification layer on the Gr surface [8]; the siloxane segments formed after OTES hydrolysis are further grafted onto the Gr and TA surfaces, which not only increases the surface roughness but also constructs a stable hydrophobic interface [26,27]. In addition, there are no obvious aggregates of TA or OTES on the composite surface, indicating that TA and OTES have realized combination with Gr through chemical interactions. Good compounding is achieved instead of simple physical mixing, which further confirms the successful preparation of the TA@Gr-OTES composite material.
3.2. Macroscopic Performance Evolution of Cement Stone
3.2.1. Wetting Performance
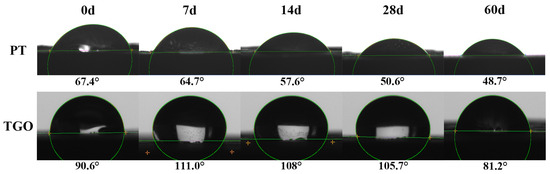
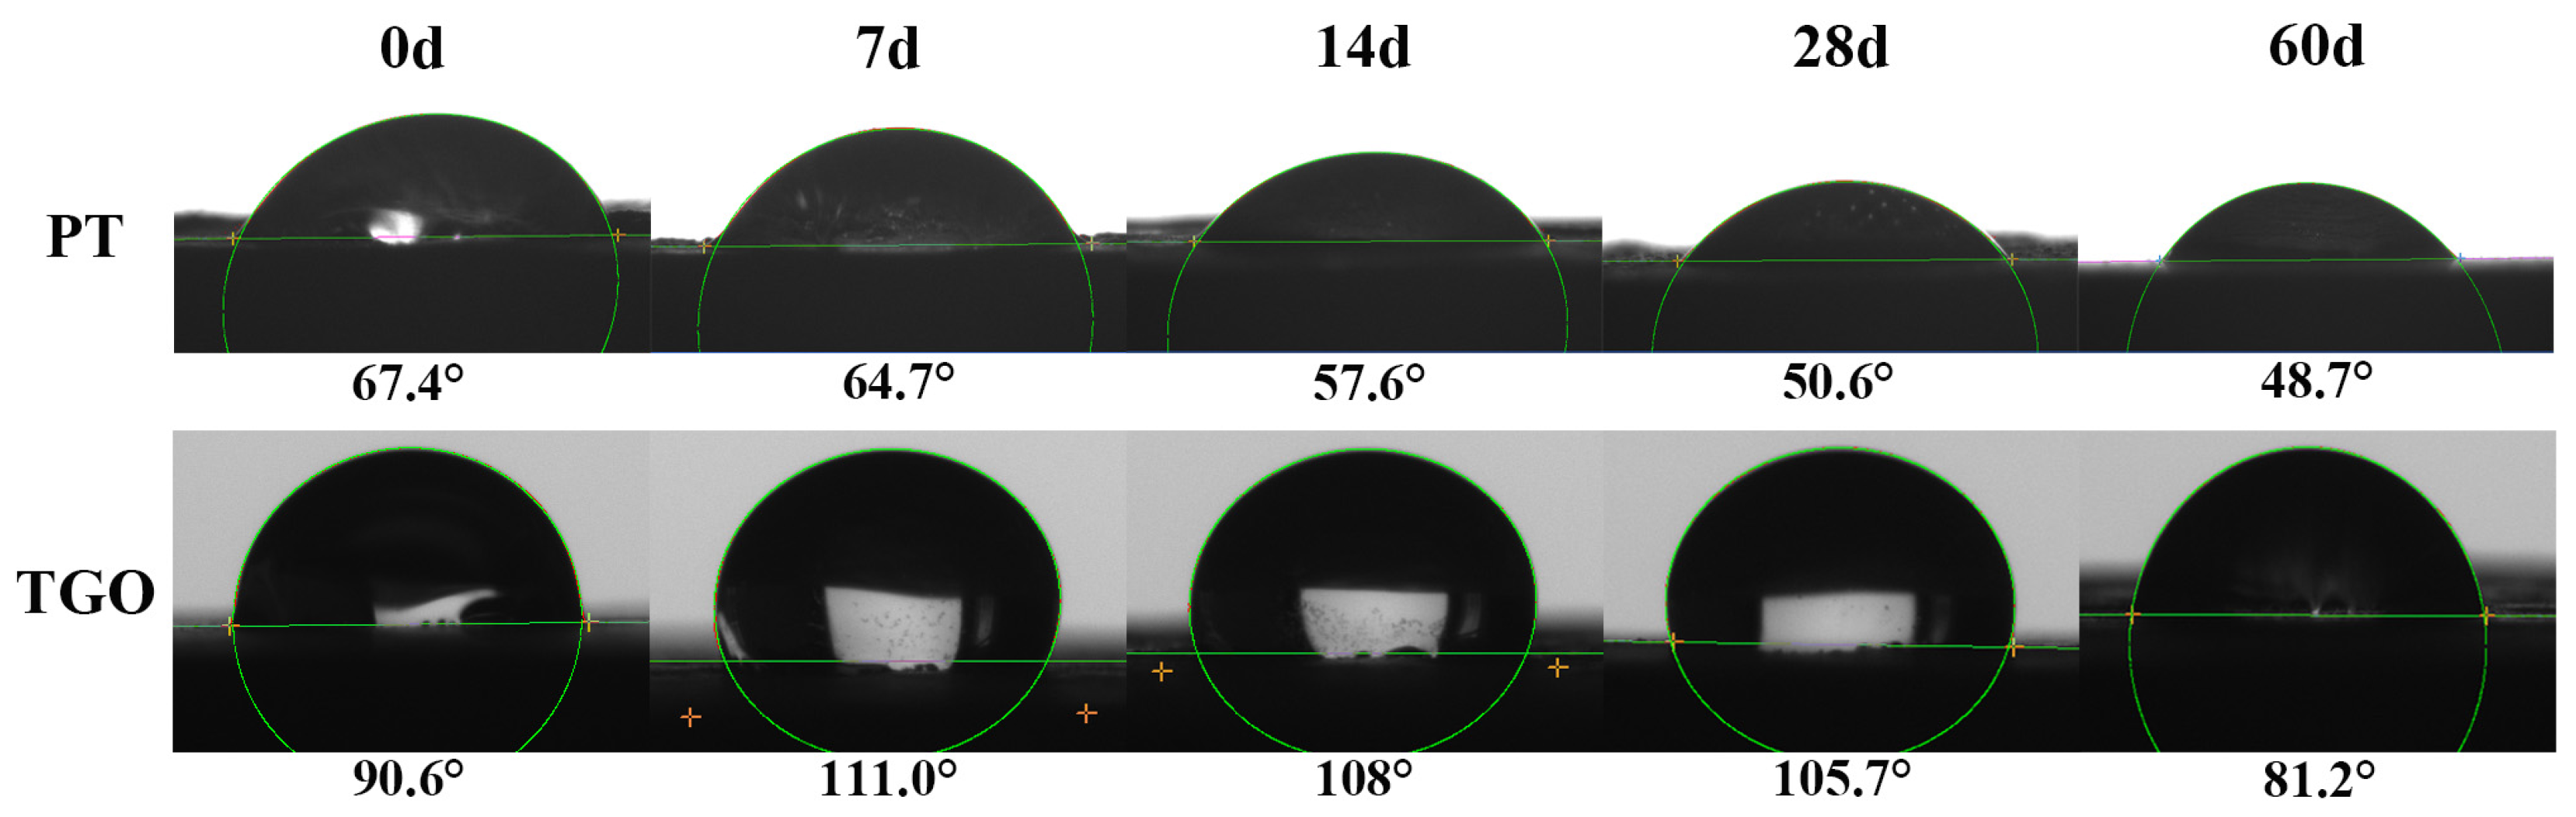
To quantitatively evaluate the evolution of the interface wetting performance of the PT group and TGO group in a corrosive environment, the water contact angles of different corrosion ages were tested and analyzed, and the results are shown in Figure 4.
Figure 4.
Water contact angles of cement pastes of different systems at different corrosion ages.
The water contact angle of the PT group continuously decreases with the corrosion age, dropping gradually from the initial 67.4° to 48.7° at 28 days, with an overall decrease of 27.7%, and it always exhibits hydrophilicity. This is because the surface of ordinary cement paste is rich in hydrophilic groups such as hydroxyl groups [28]. The continuous intrusion of corrosive media further damages the surface structure, exposing more hydrophilic groups, which makes it impossible to form an effective hydrophobic barrier and facilitates the penetration of corrosive media.
The water contact angle of the TGO group is always significantly higher than that of the PT group, with an initial value of 90.6° (exceeding the hydrophobic critical angle of 90°), rising to 111.0° in the middle of corrosion, and slowly falling back to 81.2° in the later stage but still maintained in the relatively hydrophobic range. The initial increase in contact angle is due to the strengthened hydrophobic interface; the slight decrease in contact angle in the later stage is related to slight surface corrosion, but the overall hydrophobic state is still maintained. This directly confirms that TA@Gr-OTES-modified components successfully construct a stable hydrophobic barrier layer in cement stone, effectively inhibiting the intrusion rate of corrosion medium from the interface level, providing a key interface guarantee for the multi-stage synergistic anti-corrosion mechanism.
3.2.2. Macroscopic Morphology and Corrosion Depth
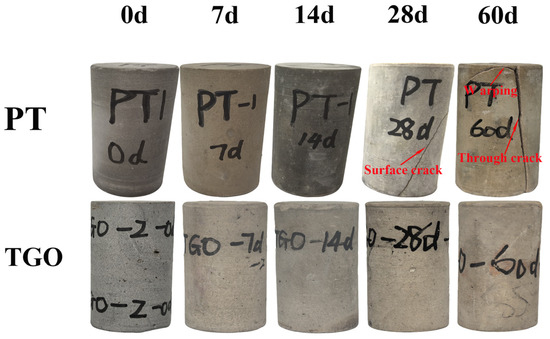
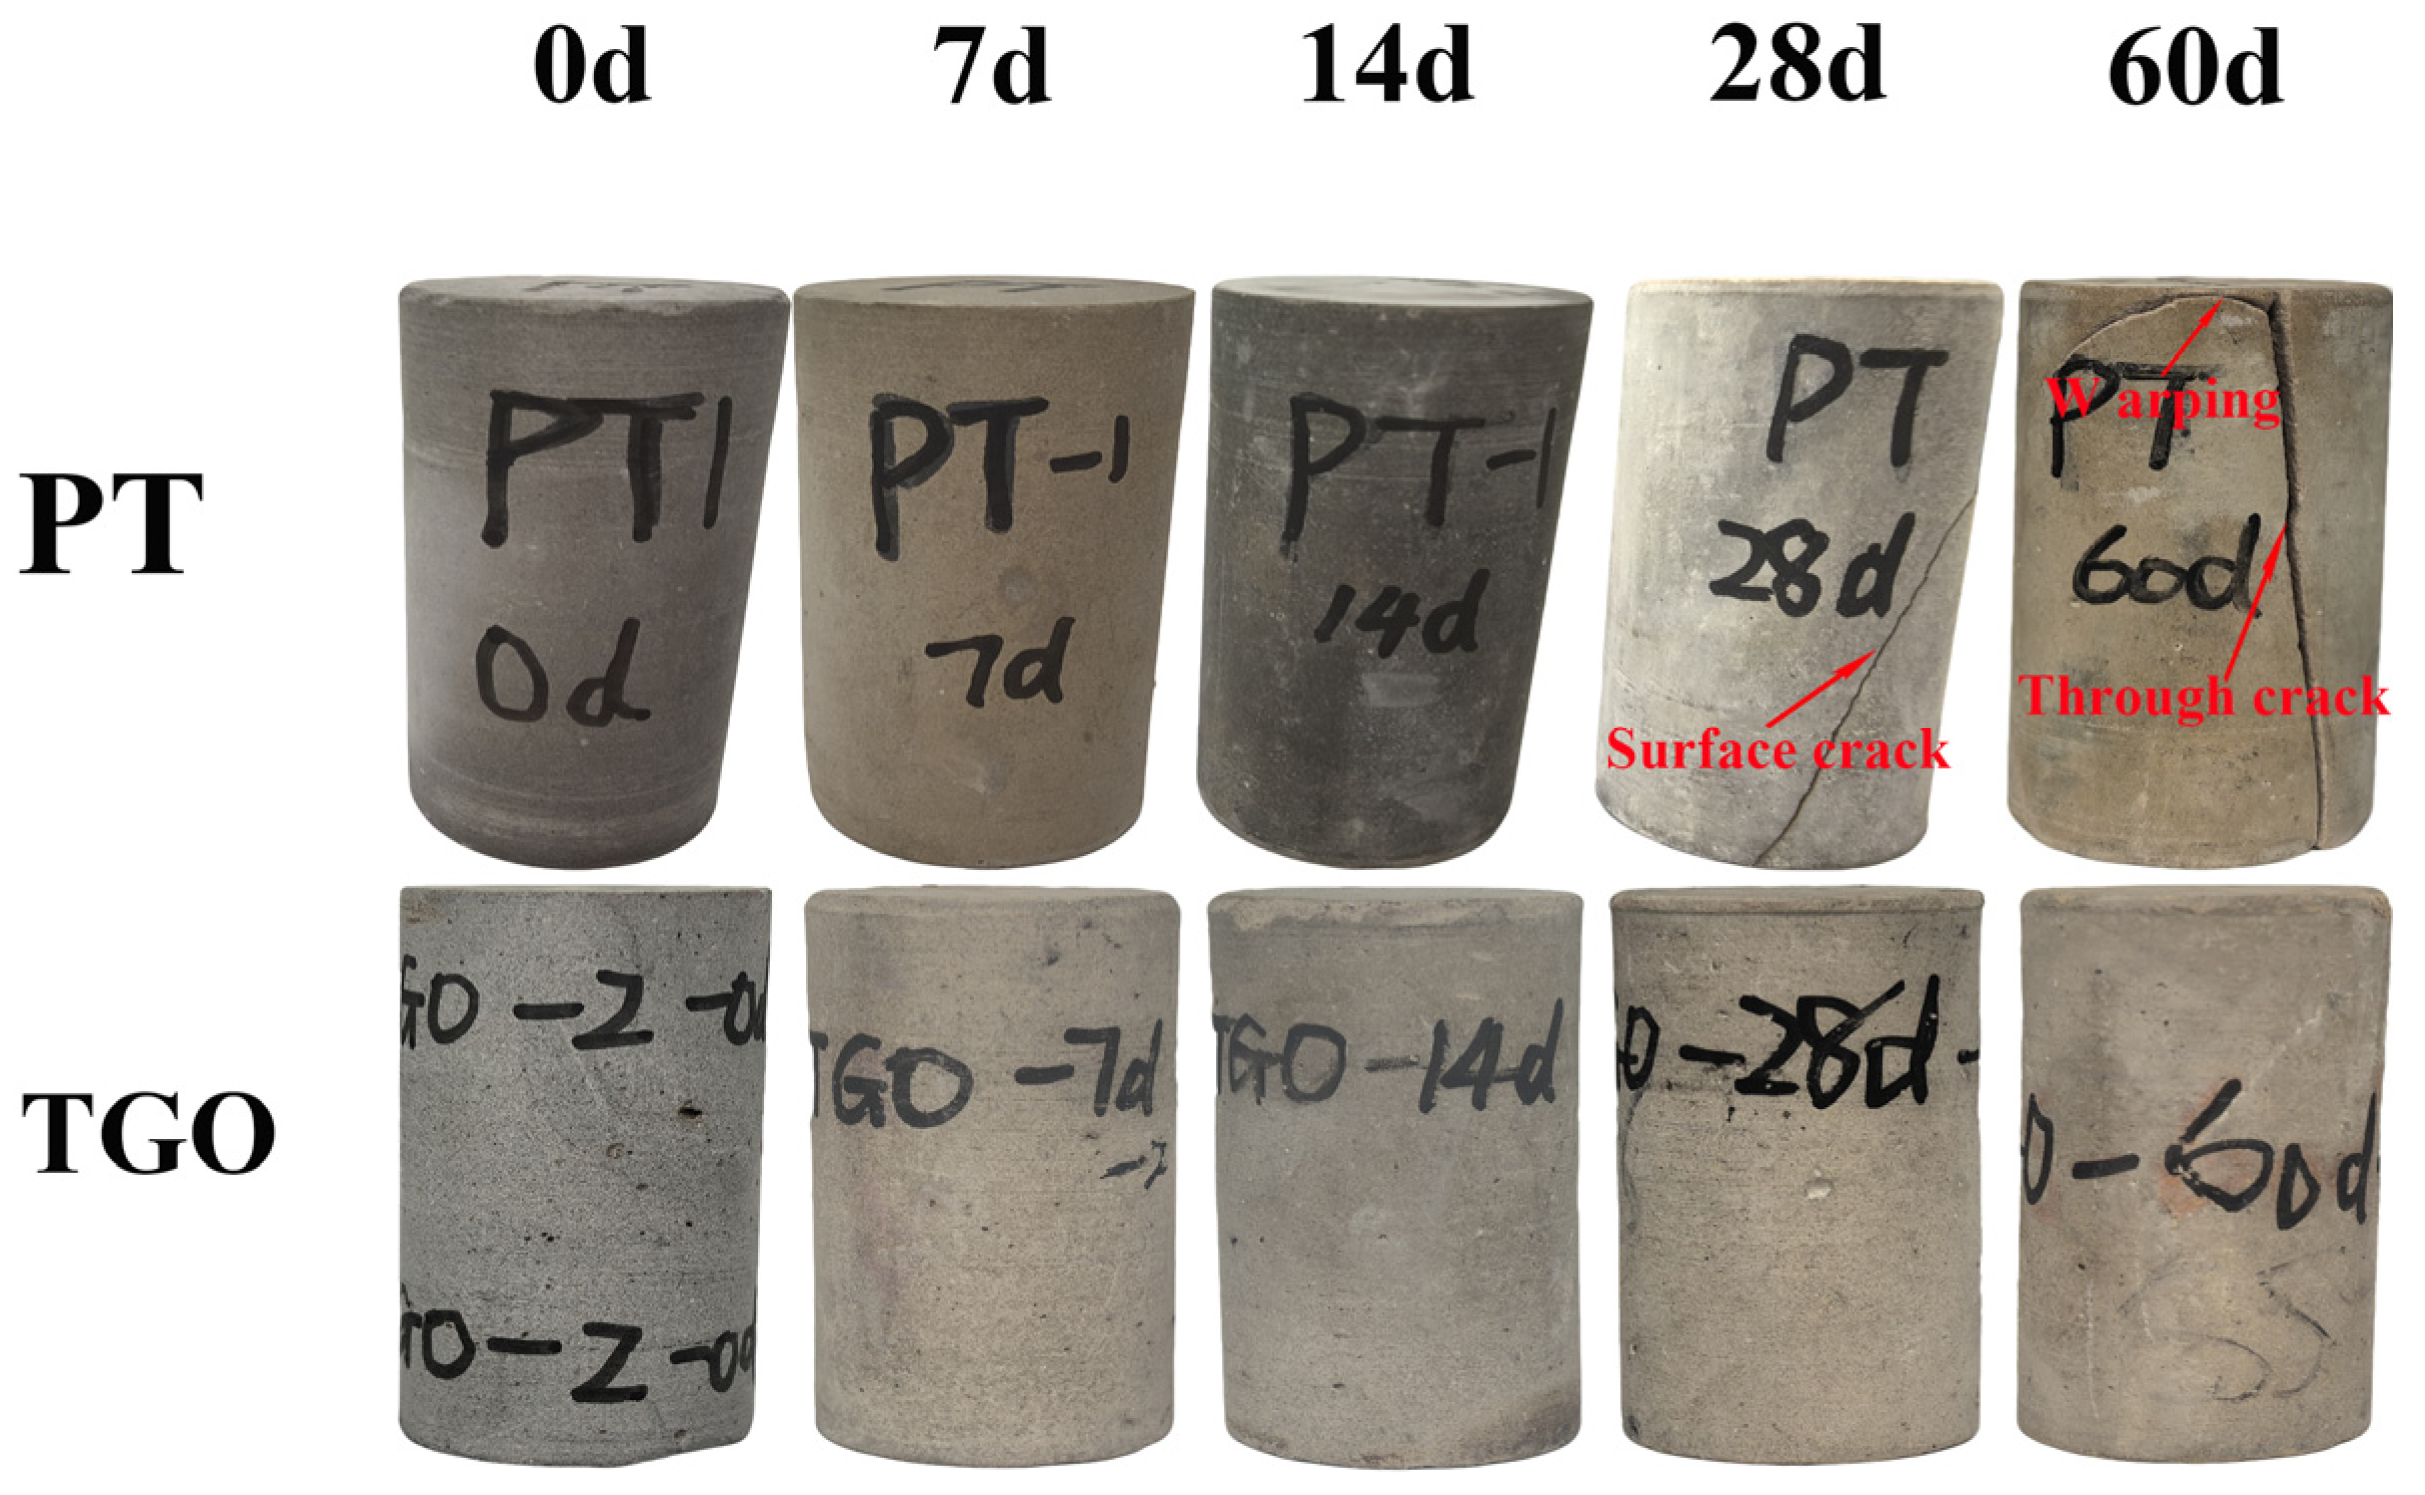
Under ahigh-temperature and high-pressure acidic corrosion environment, the PT group shows progressive degradation and a gradual loss of structural integrity (Figure 5). In the early and middle stages of 0~28 d corrosion, the specimens have a complete appearance and dense surface, only color change occurs and no obvious cracks and structural damage appear, indicating that surface carbonation is the main process at this stage and no substantial damage to the matrix has been caused. In the later stage of 60 d corrosion, the specimens have serious longitudinal large cracks through them; the matrix has obvious cracking, warping and loose degradation; and the structural integrity is completely destroyed. The TGO group maintains excellent structural integrity and stability throughout the 0~60 d corrosion cycle. The specimens have a complete appearance and dense surface, without any macroscopic cracks, spalling or structural damage, only slight color gradient occurs, and no cracking phenomenon of the PT group in the later stage of corrosion appears.
Figure 5.
Macromorphologies of different systems at different corrosion ages.
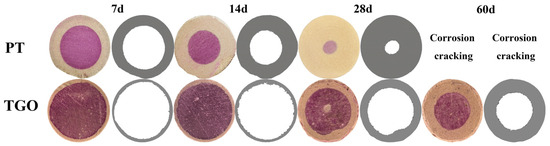
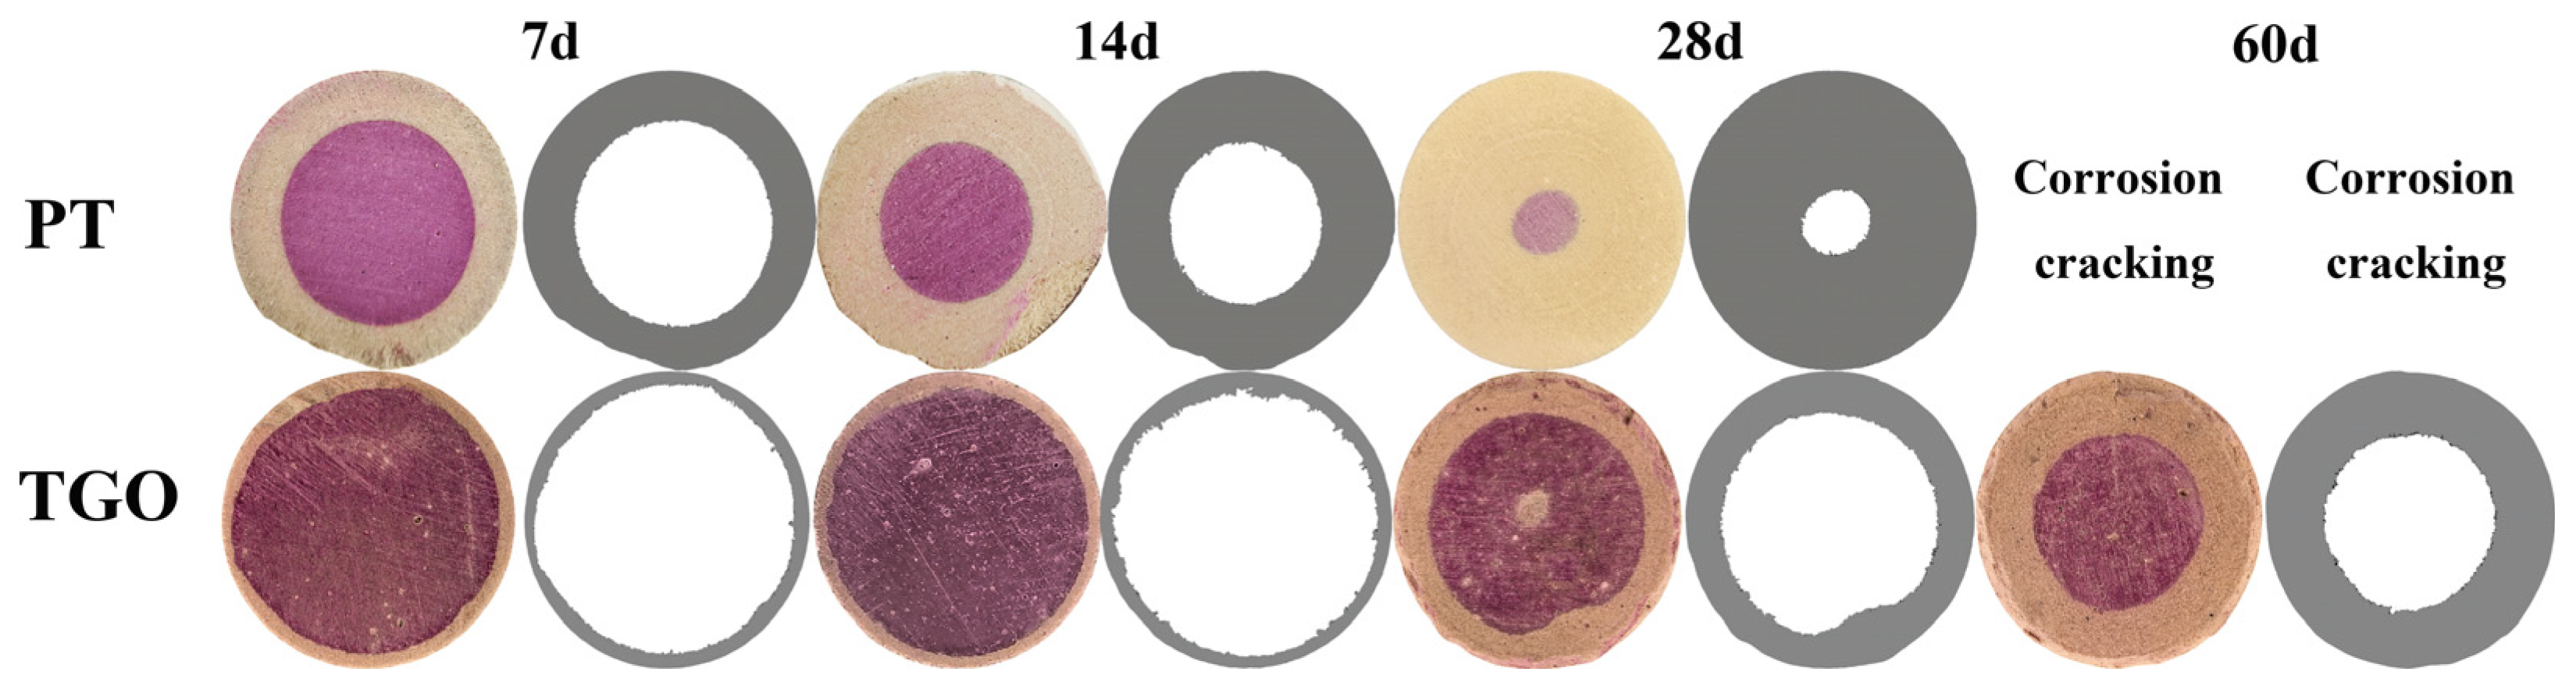
The evolution characteristics of the corrosion depth (Figure 6) of the PT group and TGO group show significant differences. Specifically, the corrosion damage of the PT group is characterized by rapid deepening and global penetration. In the initial stage of corrosion (7 d), the corrosion area is concentrated on the edge, indicating that the acidic medium only undergoes local carbonation on the surface layer, and the matrix structure is still intact. Entering the 14 d corrosion stage, the corrosion area further expands, the corrosion boundary extends rapidly, and the corrosion ring shows obvious graying and edge blurring characteristics. Particularly critical, at 60 d, the PT group cracks due to corrosion, which means that the corrosion medium has penetrated the matrix to form a continuous channel, causing serious structural degradation and macroscopic cracks, resulting in the inability to effectively define the corrosion depth, and the overall structural integrity completely collapses. In sharp contrast, the TGO group shows extremely strong corrosion depth blocking ability. During 7 d to 14 d, the corrosion area of the TGO group is significantly smaller than that of the PT group and the corrosion area develops slowly, reflecting the effective physical barrier of the TGO layer to corrosion medium diffusion in the initial stage. With the corrosion age advancing to 28 d and 60 d, the TGO system significantly inhibits the extension of corrosion depth: although the corrosion area extends to the center, there is no large-area gray degradation and edge blurring like the PT group, the corrosion ring always remains clear and controlled in scope, and no macroscopic cracking signs appear. This directly proves that the TGO group greatly prolongs the penetration path of acidic medium by constructing a dense hydrophobic barrier, blocks the dissolution and migration of corrosion products microscopically, and finally successfully limits the corrosion damage to a local range, realizing precise control of corrosion depth.
Figure 6.
Corrosion depth of cement paste in different systems at different corrosion ages.
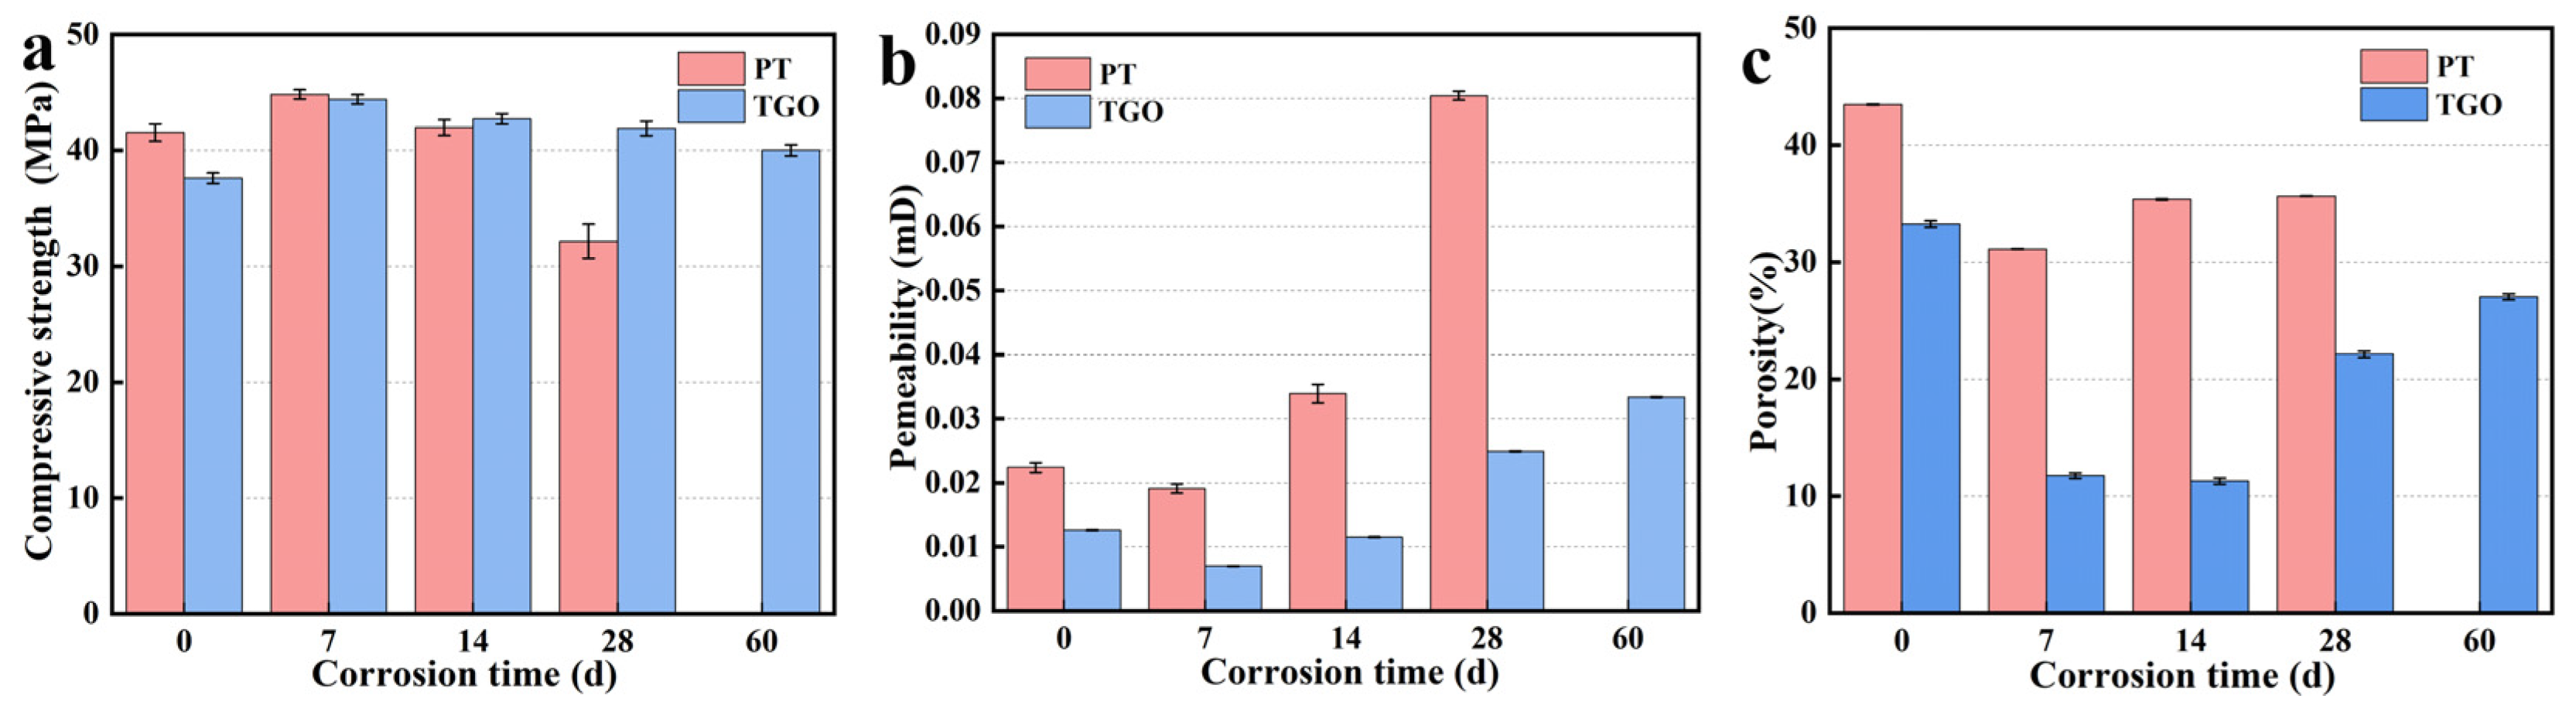
3.2.3. Compressive Strength, Permeability and Porosity
Under different corrosion ages, the evolution law of compressive strength of the PT group and TGO group shows significant differences (Figure 7a). The compressive strength of the PT group is characterized by first increasing and then sharply decreasing, with a long-term large attenuation. The initial strength at 0 d is about 41.53 MPa, slightly increasing to 44.83 MPa at 7 d due to the short-term carbonation densification effect, then continuously attenuating, sharply dropping to 32.15 MPa at 28 d, and cannot be tested at 60 d due to structural cracking, and the mechanical bearing capacity is seriously degraded in the later stage of corrosion. The TGO group shows excellent mechanical properties with high stability and low attenuation throughout the process. The initial strength at 0 d is about 37.6 MPa, rising to 44.4 MPa at 7 d, maintaining at 42.7 MPa at 14 d, only slightly dropping to 41.9 MPa at 28 d, and still maintaining 40 MPa at 60 d. The overall strength attenuation rate is only 6.7%, and the mechanical retention rate is significantly improved.
Figure 7.
Compressive strength (a), permeability (b) and porosity (c) of cement slurries of different systems at different corrosion ages.
The evolution laws of permeability (Figure 7b) and porosity (Figure 7c) further confirm the structural stability differences between the two systems. The permeability of the PT group is characterized by first decreasing and then soaring, with out-of-control violent fluctuation in the middle stage. The initial permeability at 0 d is about 0.022 mD, soaring to 0.08 mD at 28 d, an increase of 135% compared with 14 d, reflecting the rapid deterioration of internal pore connectivity in the middle stage of corrosion; its porosity is characterized by first decreasing and then continuously rising, with a long-term high level. The initial porosity at 0 d is about 43.5%, dropping to 31.1% at 7 d, rising to 35.6% at 28 d, and cannot be effectively tested at 60 d due to structural cracking, and the microstructure is completely loose. The permeability of the TGO group maintains low fluctuation and low growth throughout the process. The initial permeability at 0 d is about 0.013 mD and only 0.025 mD at 28 d, only 31.25% of that of the PT group in the same period. The porosity remains at a low level throughout the process, with the initial porosity at 0 d at about 33.2%, dropping to 11.7% at 7 d, and only increasing to 27% at 60 d; the overall porosity is much lower than that of the PT group, and the microstructure compactness is significantly improved.
Based on the evolution laws of the three performance indicators, the PT group shows typical progressive degradation characteristics under a high-temperature and high-pressure acidic corrosion environment. The short-term performance improvement brought by initial carbonation cannot offset the destructive effect of long-term corrosion, and finally a chain degradation of sharp strength drop, soaring permeability and out-of-control porosity occurs, and the structural integrity is completely lost. The TGO group achieves synergistic stability of mechanical properties, impermeability and microstructure, and always maintains an excellent state of high compressive strength, low permeability and low porosity throughout the corrosion cycle, fundamentally inhibiting the structural damage of cement stone by corrosive environments, and significantly improving its long-term service reliability.
3.3. Phase Evolution Analysis
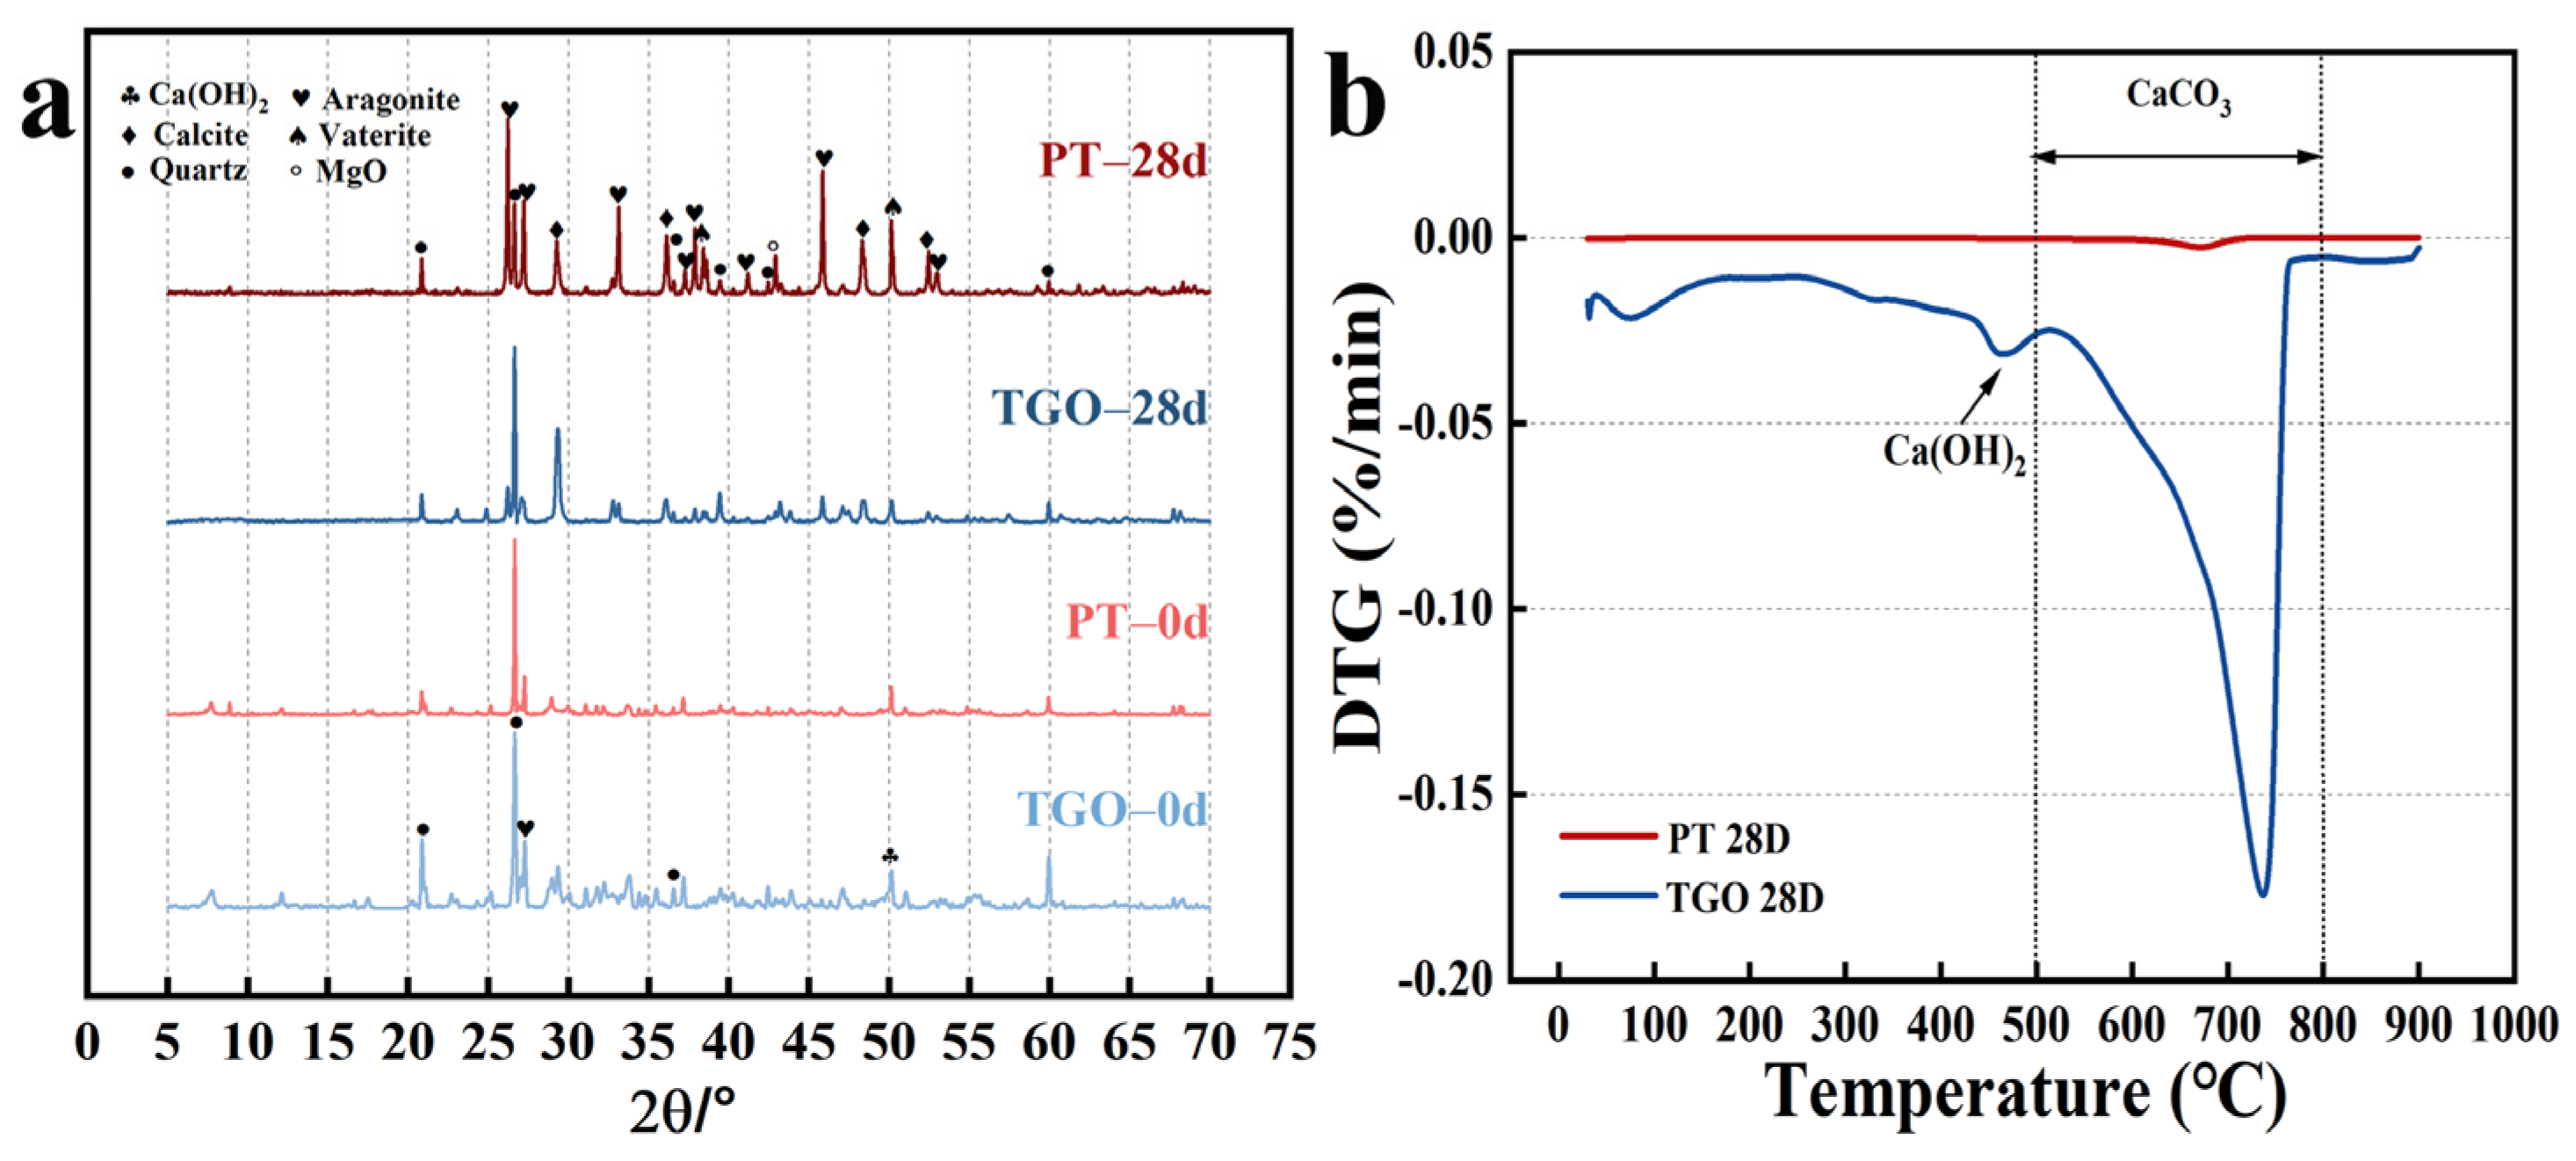
To elucidate the phase evolution law of different modified cement systems during carbonation, X-ray diffraction (XRD) and thermogravimetric analysis (TG-DTG) were used to systematically characterize the phase compositions and thermal decomposition behavior of the PT and TGO groups (Figure 8). All XRD patterns were normalized with the strongest diffraction peak as the reference to ensure the comparability of phase characteristics among different samples.
Figure 8.
XRD (a) and DTG (b) patterns of cement stones in different systems at different corrosion ages.
In the uncorroded state (0 d), the main crystalline phases in both groups were portlandite (Ca(OH)2, PDF#00-044-1481) and quartz (SiO2, PDF#01-079-1910, from silica fume). The hydration product phases of the two groups were similar. As the main hydration product, amorphous calcium silicate hydrate (C–S–H, PDF#00-034-002) gel did not show sharp diffraction peaks but presented a typical diffuse “hump peak” in the range of 2θ = 28–30°.
After 28 d of high-temperature and high-pressure CO2 corrosion, significant differences in phase evolution were observed between the two groups. In the PT group, the characteristic diffraction peaks of hydration products (including Ca(OH)2) completely disappeared, while the characteristic peaks of CaCO3 polymorphs (calcite, aragonite, vaterite) rose sharply. In contrast, the intensities of CaCO3 peaks of the TGO group were significantly lower than those in the PT group, indicating that the carbonation degree was effectively suppressed.
To further quantify the carbonation degree and hydration product stability, TG-DTG analysis was performed on specimens corroded for 28 d, and the mass losses in typical temperature ranges were analyzed with reference to quantitative methods reported in relevant studies [29]. In the range of 30–200 °C (evaporation of free water and bound water from C-S-H gel), the mass losses were 2.44% for the PT group and 2.67% for the TGO group, with the slightly higher loss in the TGO group indicating a higher residual content of hydrated C-S-H gel. In the range of 400–500 °C (decomposition of Ca(OH)2), the PT group showed a very low mass loss of only 1.9% and no obvious decomposition peak on the DTG curve, indicating that most Ca(OH)2 had been consumed by carbonation; in contrast, the TGO group exhibited a significant decomposition peak and a mass loss of 2.56%, proving that a large amount of Ca(OH)2 was retained in the matrix. In the range of 600–900 °C (decomposition of CaCO3 polymorphs), the PT group showed a mass loss of 19.95%, corresponding to the decomposition of large amounts of calcite, aragonite, and vaterite formed by the complete carbonation of Ca(OH)2 and C-S-H gel, whereas the TGO group exhibited a lower mass loss of 19.65%, confirming its weaker carbonation degree.
Correspondingly, the differences in phase evolution between the two systems are closely consistent with the corrosion depth results described in Section 3.2.2. The severe consumption of Ca(OH)2 and C–S–H gel in the PT group, accompanied by massive formation and the leaching of CaCO3, directly accelerates the penetration of CO2 and corrosive ions, resulting in a rapidly deepened corrosion front and eventually penetrating cracking. In contrast, the TGO-modified system retains a high content of hydration products and significantly reduces the degree of carbonation, which restricts the carbonation reaction to the near-surface region and effectively limits the corrosion depth within a narrow range.
3.4. Multi-Scale Structural Characterization
To systematically clarify the damage mechanism of different cement systems under CO2 corrosion, scanning electron microscope (SEM) and X-ray computed tomography (XCT) are comprehensively used to reveal the structural evolution law from two-dimensional microscopic morphology, element distribution and three-dimensional spatial structure.
3.4.1. Three-Dimensional Defects
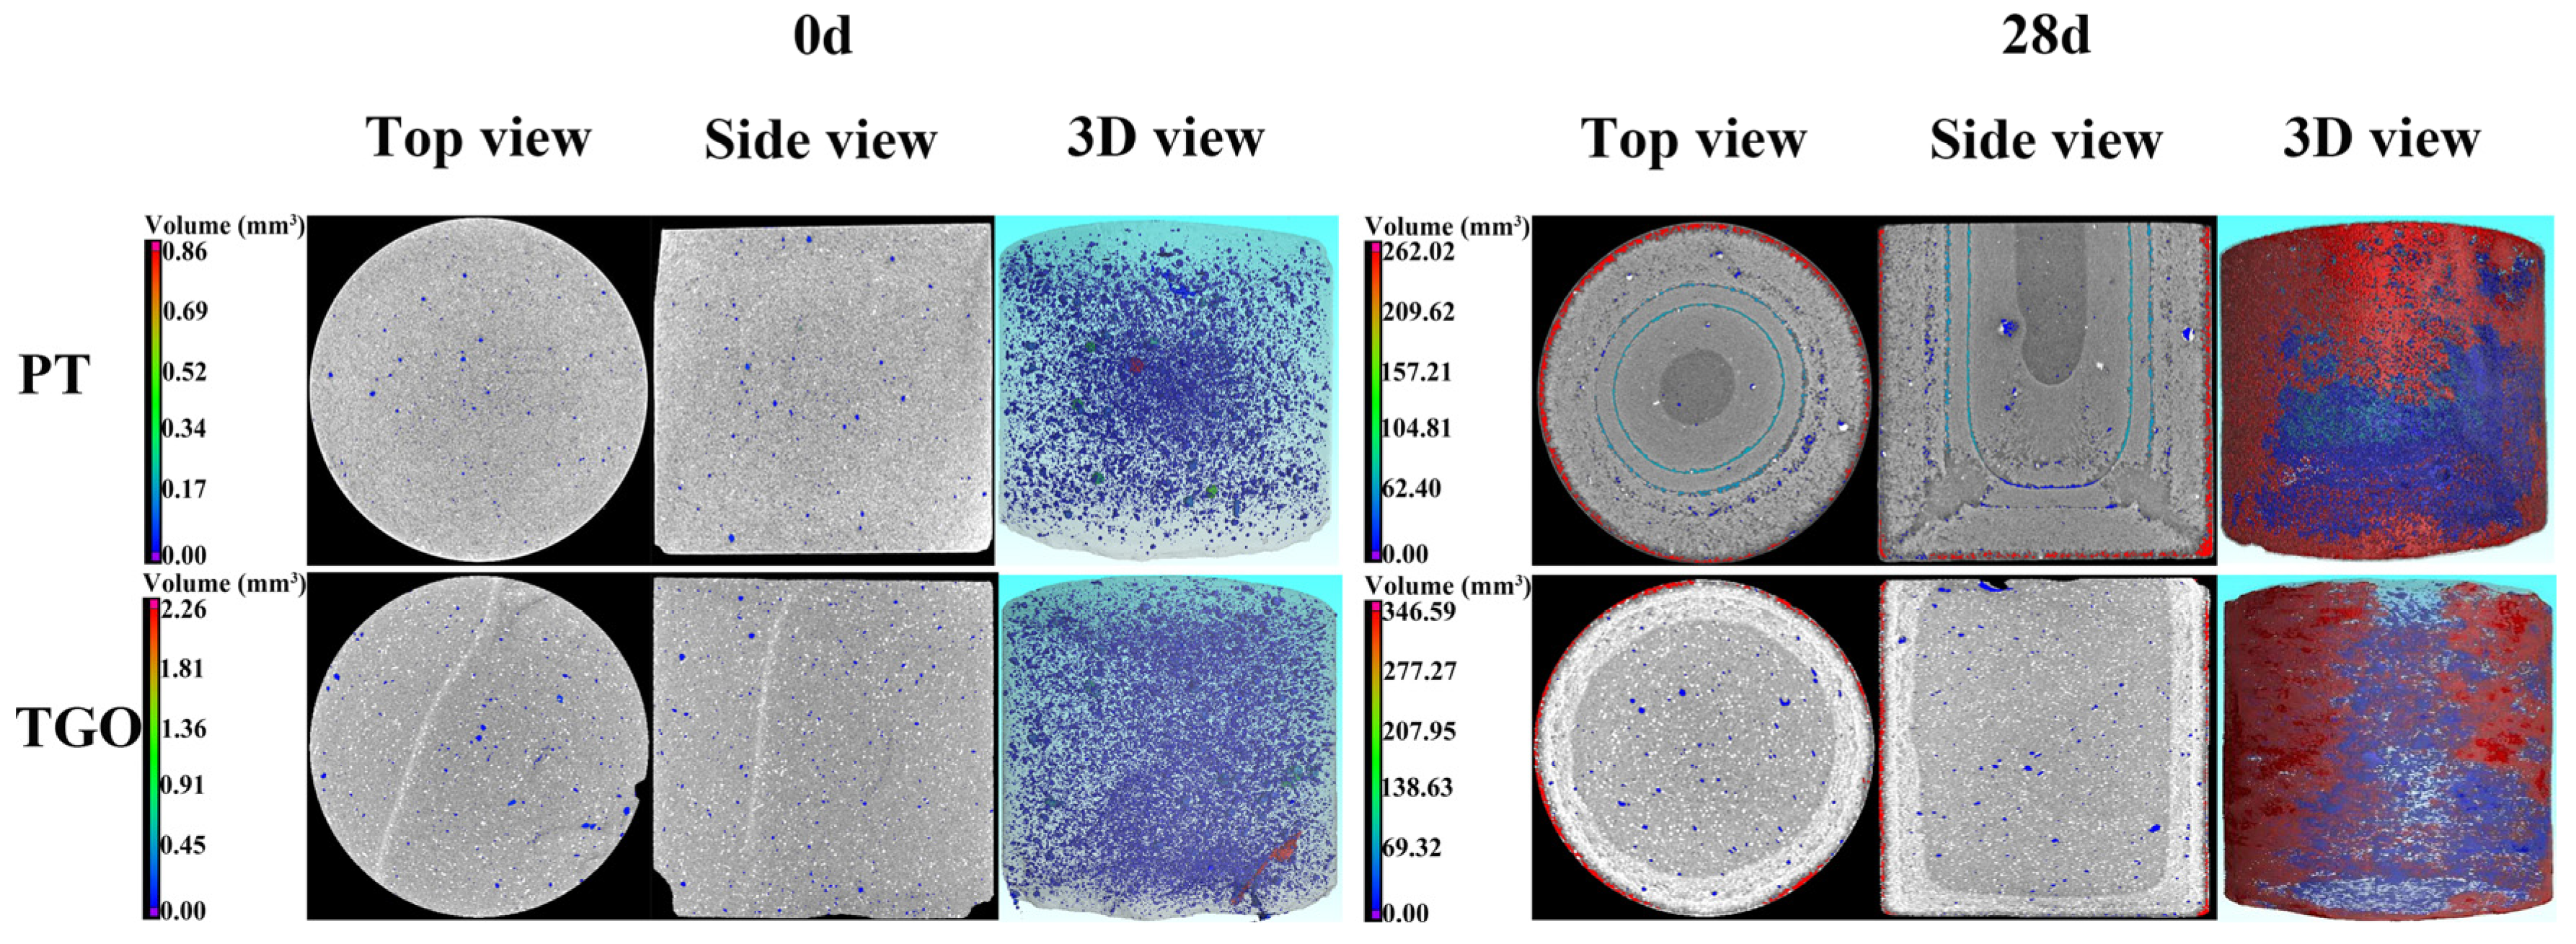
Figure 9 shows the 2D/3D morphology of the XCT scanning of two groups of cement stones after 0 d and 28 d corrosion, and Table 5 shows the corresponding defect quantitative data. In the uncorroded stage, both groups of specimens show uniform and diffuse micro-defect distributions without connected cracks, and the initial structural compactness is good. For the PT group, the color scale range of pore sizes is 0.00–0.86 mm3, showing uniformly distributed small-sized pores with only scattered discrete micropores, corresponding to an initial defect volume fraction of only 0.50%. For the TGO group, the color scale range is 0.00–2.26 mm3, indicating a slightly larger maximum pore size than the PT group; a small number of tiny bubbles introduced during the modification process (seen as reddish/orange points) are locally visible, but the overall distribution remains dominated by uniformly dispersed micropores without connected defects, with an initial defect volume fraction of 0.81%. After 28 d of high-temperature and high-pressure acidic corrosion, the microscopic defect evolution of the two groups of specimens shows essential differences. For the PT group, the color scale range increases significantly to 0.00–262.02 mm3, with the maximum defect size increasing by approximately 305 times compared to the initial stage. The top view shows corrosion ring stratification, and the 2D image reveals longitudinal through-going large cracks. In the 3D view, a large area of red (high-defect-volume regions) covers the main body of the specimen, and the side view shows longitudinal through-going large cracks. The defect volume surges from 40.13 mm3 to 605.95 mm3 (an increase of 1410%), and the defect ratio soars from 0.50% to 5.21%, indicating that the pores have evolved from micron-scale micropores to millimeter-scale connected corrosion channels, with an explosive growth in defect size and complete microstructural degradation. In contrast, for the TGO group, although the color scale range is 0.00–346.59 mm3, the red regions (large-sized defects) are only concentrated on the surface layer of the specimen, while the interior remains dominated by blue micropores with no significant deterioration in pore size. No through-going connected cracks are observed, and the internal matrix remains complete and dense. The defect volume fraction at 28 d is only 2.42%, which is merely 46.4% of that of the PT group at the same stage, demonstrating that the modified system effectively inhibits the growth and connectivity of pore sizes, and the interior of the matrix maintains the dense micropore structure from the initial stage throughout the corrosion process, with greatly improved microstructural stability.
Figure 9.
2D and 3D images of cement stones of different systems at different corrosion ages.
Table 5.
Detailed defect information of cement stone in different systems at different corrosion ages.
3.4.2. Cross-Sectional Microscopic Morphology
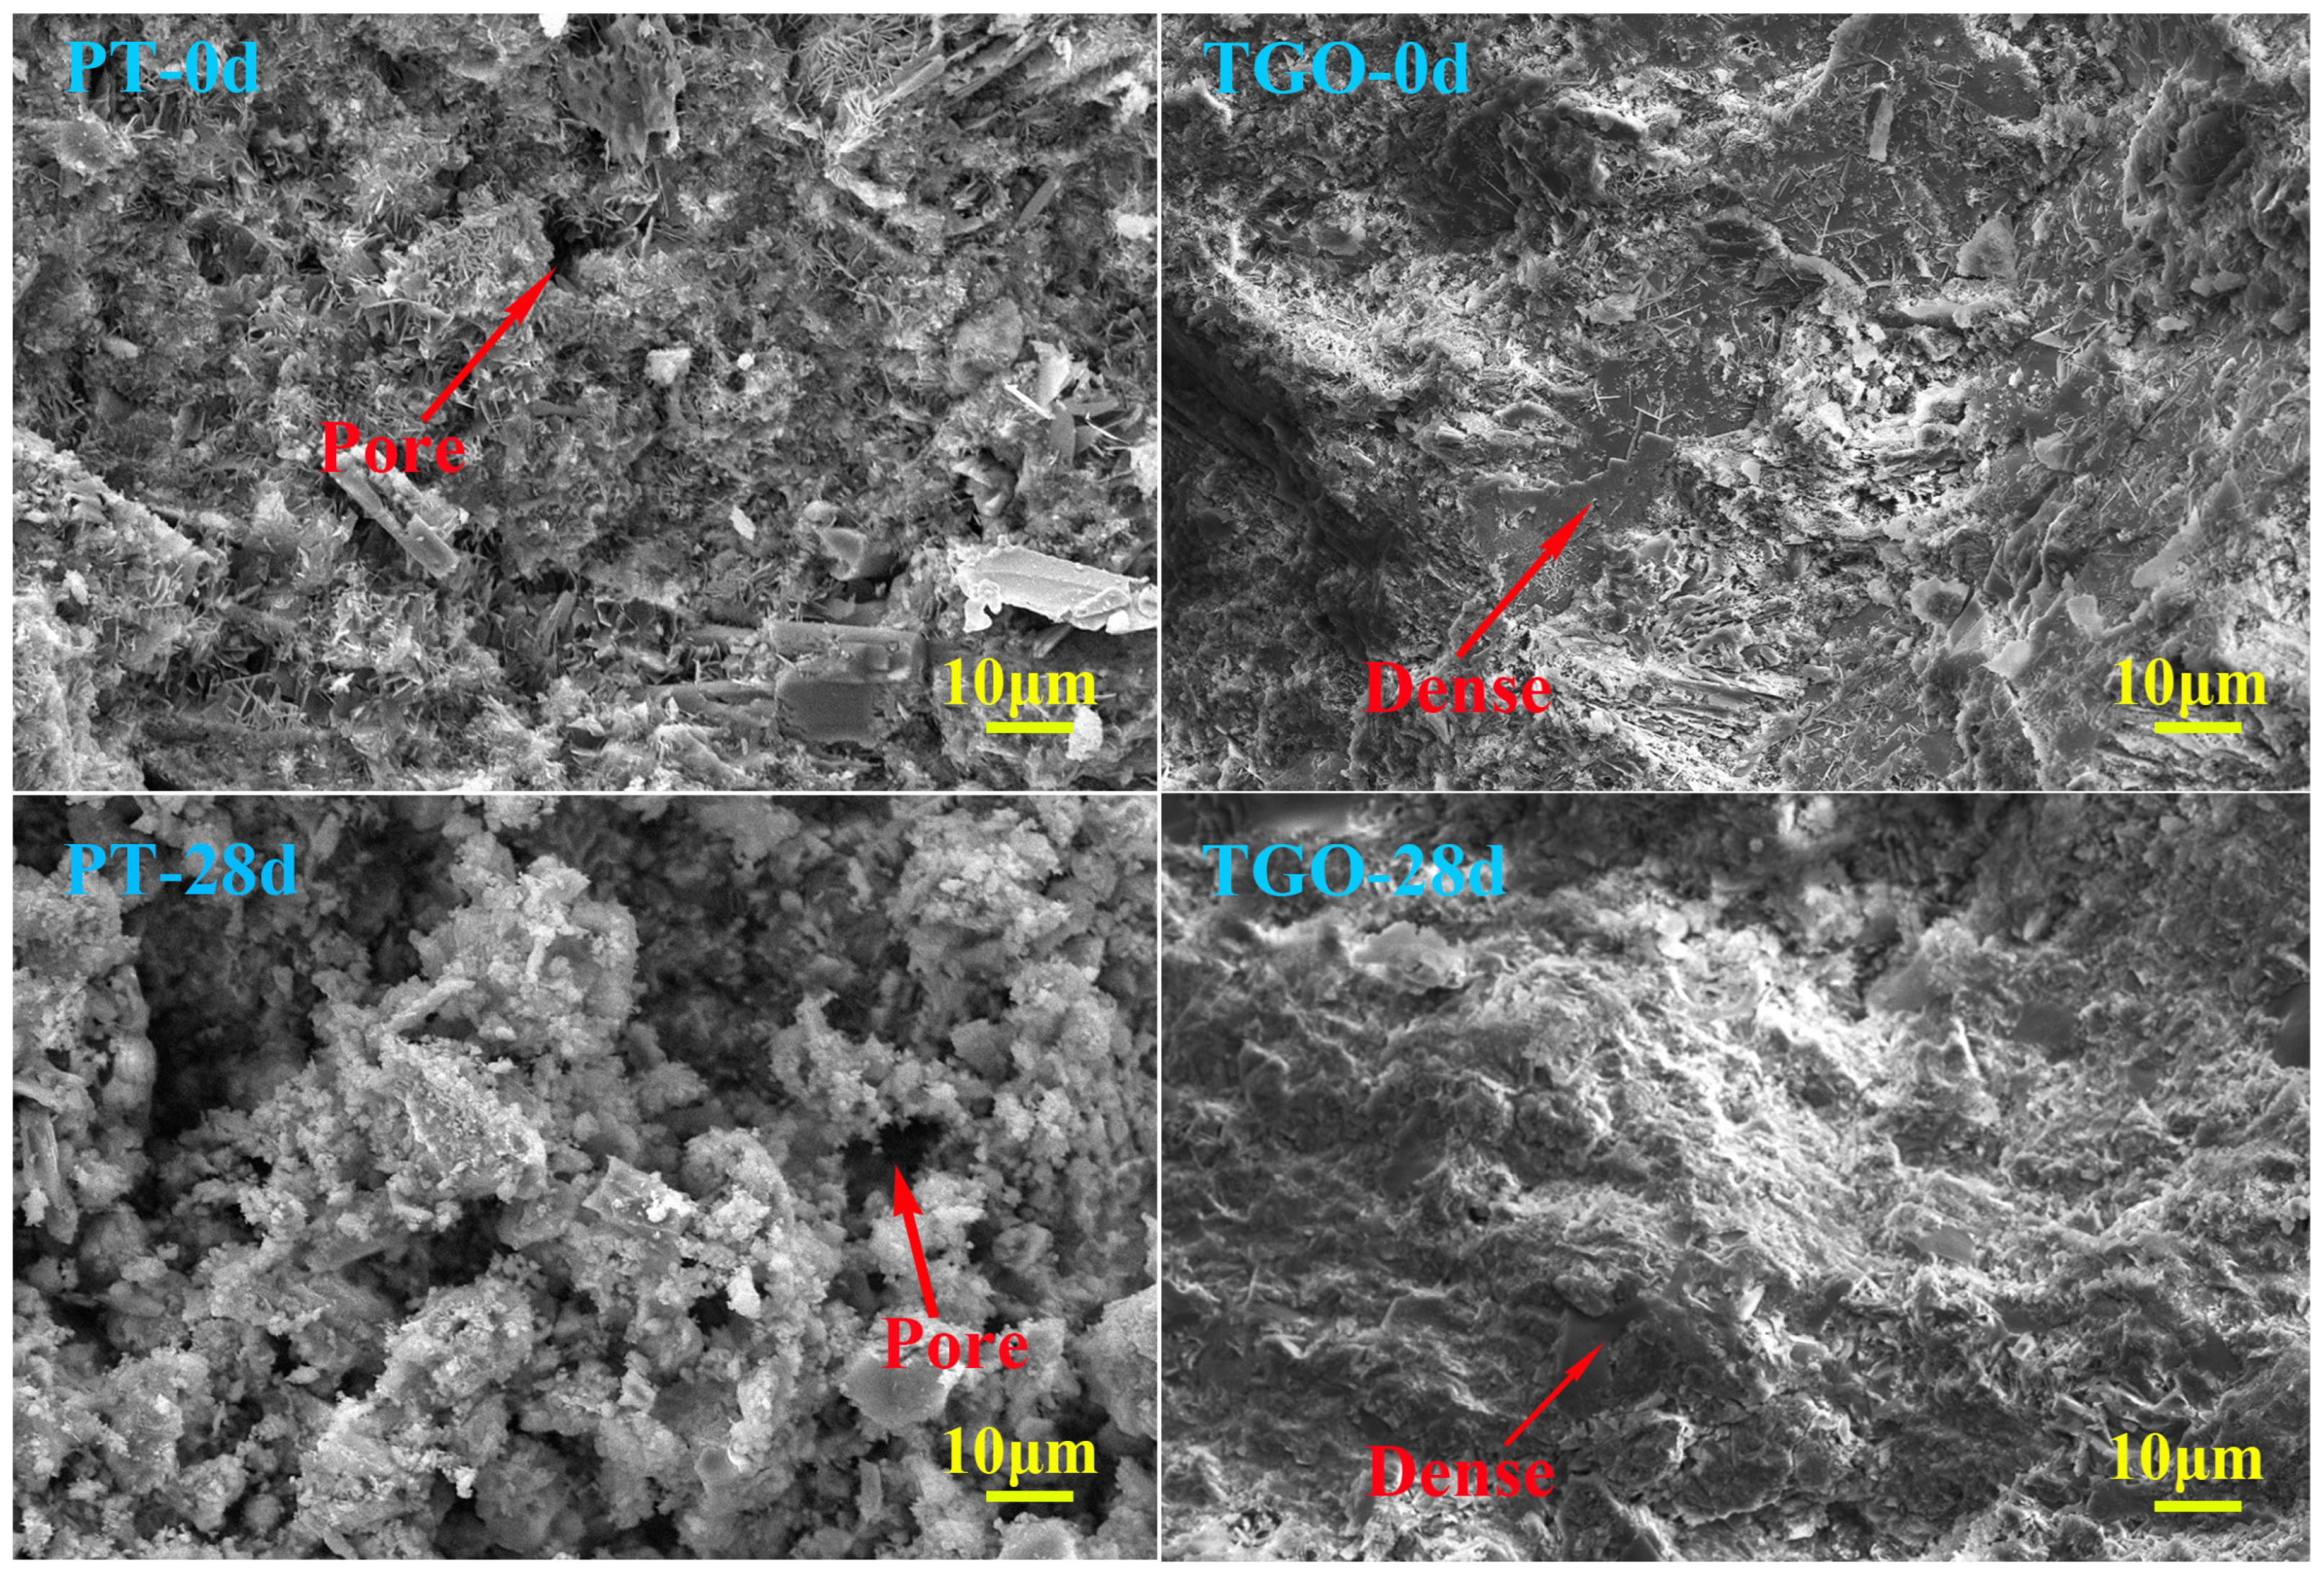
The cross-sectional SEM morphology results of two groups of cement stones after 0 d and 28 d corrosion show (Figure 10) that TA@Gr-OTES hydrophobic modification can significantly optimize the initial microstructure of cement stone and inhibit structural degradation during corrosion. In the uncorroded stage, the PT group shows a typical loose and porous morphology with obvious large-size pores and high connectivity defects, providing channels for corrosion medium intrusion; while the TGO group forms a denser C-S-H gel network through the physical filling and interface bridging of TA@Gr-OTES functional materials, significantly reducing the initial large pores, and greatly improving microstructure compactness. After 28 d of high-temperature and high-pressure CO2 corrosion, the microstructure of the PT group is destroyed catastrophically, the pore network expands and connects on a large scale, the C-S-H skeleton completely collapses, and the matrix is stacked in loose particles, finally leading to a sharp drop in macroscopic strength and a surge in permeability; the TGO group always maintains a complete and dense continuous C-S-H network without through defects, TA@Gr-OTES functional materials continue to play a physical barrier role, only local slight dissolution occurs, and the microstructure stability is significantly better than that of the PT group. This result confirms from the microscopic morphology level that the TGO group effectively blocks the positive feedback cycle of “dissolution-pore expansion-accelerated corrosion” through the dual mechanisms of structural densification and interface barrier, providing a solid microstructural guarantee for the long-term service of cement stone in a high-temperature and high-pressure CO2 environment.
Figure 10.
Cross-sectional SEM images of cement stones of different systems at different corrosion ages.
4. Discussion
4.1. Analysis of Differences in Carbonation Degradation Behavior
The PT group shows the characteristics of rapid degradation and overall failure in a CCUS high-temperature and high-pressure CO2 environment. For the PT group, CO2 continuously invades the matrix and fully reacts with hydration products (Ca(OH)2 and C–S–H gel), generating a large amount of CaCO3. The volume expansion of CaCO3 and leaching of loose reaction products lead to internal structural loosening and crack propagation, which manifests as severe degradation in macroscopic morphology. The initial surface carbonation brings temporary densification, but CO2 invades rapidly and reacts completely with hydration products, Ca(OH)2 is rapidly consumed, the alkalinity of the system is lost, C-S-H gel continues to decompose, pores connect rapidly and defects expand sharply, finally leading to strength collapse and structural cracking, which cannot meet long-term service requirements.
The TGO group shows the characteristics of gradual corrosion inhibition and overall stability. For the TGO group, the hydrophobic barrier and graphene physical shielding effectively inhibit CO2 intrusion, and a large amount of Ca(OH)2 and C–S–H gel are retained. These stable hydration products maintain matrix compactness, so the macroscopic morphology remains intact without obvious degradation. The hydrophobic interface potentially reduces wettability and lowers the intrusion rate of CO2 and water [30]; graphene lamellae potentially create a labyrinth physical barrier to extend the diffusion path of corrosive media [6,31]; and TA potentially improves dispersion and enhances the compactness and alkalinity retention capacity of the matrix itself [32]. The potential synergy of these three factors restricts the carbonation reaction to the surface layer, while the internal structure and mechanical properties are preserved over the long term.
4.2. Correlation Between Phase Evolution and Structural Stability
After corrosion, the hydration products of the PT group are completely converted into CaCO3 accompanied by a large amount of leaching, leading to volume instability and soaring porosity, which is the root cause of structural failure. The TGO group can effectively retain Ca(OH)2 and C-S-H gel, maintain high alkalinity of the system, inhibit deep carbonation, and reduce the loss of corrosion products, so that cement stone maintains volume stability and structural integrity, ensuring long-term durability from the phase level.
4.3. Multi-Scale Synergistic Anti-Carbonation Mechanism
The excellent anti-carbonation performance of TGO-modified cement comes from a potential triple synergistic protection mechanism (Figure 11). OTES grafting forms a low surface energy hydrophobic layer, blocking the intrusion channels of water and CO2, reducing the corrosion driving force from the source. Gr lamellae are staggered in the matrix, filling pores and prolonging diffusion paths, inhibiting ion and medium transmission. As a bridging agent, TA improves Gr dispersion, maintains high alkalinity and structural compactness. This multi-scale synergistic effect realizes the whole chain protection of intrusion inhibition, transmission block, reaction slowdown and structural stability, so that the cement stone still maintains excellent mechanical and impermeability properties in extreme CCUS environments.
Figure 11.
Mechanism diagram of enhanced carbonation resistance of TA@Gr-OTES-modified cement stone.
The current corrosion duration is limited to 60 days. Future work will extend the corrosion exposure to 90, 180, and 365 days under simulated reservoir conditions to further validate the long-term anti-carbonation performance and structural stability of the TGO-modified cement system.
5. Conclusions
In summary, the TA@Gr-OTES composite exhibits outstanding modification effects on oil well cement and significantly enhances its service performance in harsh CCUS environments.
- TA@Gr-OTES composite can be successfully prepared by surface grafting method. OTES forms a stable chemical graft structure with Gr and TA, endowing the material with good hydrophobic properties and dispersibility.
- In the CCUS simulated environment characterized by high temperature (130 °C), high pressure (25 MPa), and high CO2 partial pressure (7 MPa), TGO-modified cement stone shows stable hydrophobic characteristics, the 60-day compressive strength attenuation rate is only 6.7%, the permeability and porosity are much lower than those of ordinary cement, no macroscopic cracking occurs, and the corrosion depth is effectively limited.
- TA@Gr-OTES can significantly inhibit deep carbonation and corrosion product leaching of cement stone, preserve Ca(OH)2 and C-S-H gel, the 28-day defect volume ratio is only 46.4% of that of ordinary cement, and maintain a dense and continuous microstructure.
- TA@Gr-OTES inhibits CO2 corrosion in the whole chain through these potential triple mechanisms of hydrophobic interface barrier, graphene physical barrier and cement self-compaction, significantly improving the anti-carbonation performance and structural stability of oil well cement in extreme CCUS environments.
- The TA@Gr-OTES hydrophobic cement system constructed in this study is suitable for long-life well cementing engineering of CCUS wells, and can provide theoretical and technical support for the design and application of high-performance CO2 corrosion-resistant oil well cement materials.
- The TGO composite has a preparation yield of 89.2% and a low additional cost for oil well cement. The modification method has good scalability and practical feasibility for on-site CCUS well cementing engineering.
Supplementary Materials
The following supporting information can be downloaded at: https://www.mdpi.com/article/10.3390/pr14111685/s1, Figure S1: The cement stone samples were cored to dimensions of Φ25 mm × 50 mm; Figure S2: Cement stone sample holder in the corrosion autoclave; Figure S3: Wettability Test; Figure S4: Tukey multiple comparison results for compressive strength; Table S1: Physical properties of Grade G oil well cement; Table S2: Compressive strength test results of cement stone with different TGO dosages before corrosion; Table S3: Rheological test results of cement paste with different fluorocarbon resin dosages.
Author Contributions
Y.C.: conceptualization, data curation, formal analysis, investigation, methodology, visualization, writing—original draft, writing—review and editing; S.Z.: resources, supervision; R.L.: conceptualization, funding acquisition, writing—review and editing; Q.T.: funding acquisition, project administration, resources. All authors have read and agreed to the published version of the manuscript.
Funding
This research was funded by the Oil and Gas Major Project “Engineering Technology and Equipment for Full-Lifecycle Well Integrity” (NO. 2025ZD1402200) and the Key Research and Development Program of Xinjiang Uygur Autonomous Region scheme (NO. 2024B1012-3).
Data Availability Statement
The original contributions presented in this study are included in the article/Supplementary Materials. Further inquiries can be directed to the corresponding authors.
Conflicts of Interest
Authors Yaqiong Cao, Shiming Zhou, Rengguang Liu, and Qian Tao were employed by the company “SINOPEC Research institute of Petroleum Engineering Co., Ltd.”. The authors declare that the research was conducted in the absence of any commercial or financial relationships that could be construed as potential conflicts of interest.
References
- Mammadov, O.; Mahmoud, A.A.; Al-Yaseri, A.; Al Ramadan, M. A Comprehensive Review of Cement Degradation Analysis under Downhole Conditions: CCS/CCUS/CO2-EOR Applications. ACS Omega 2025, 10, 28515−28533. [Google Scholar] [CrossRef] [Scilit]
- Xie, Y.; Tiong, M.; Liu, Q.; Wu, T.; Xue, W.; Wang, C. Recent advancements in durable and self-healing oil well cement: A pathway to secure carbon sequestration. J. CO2 Util. 2025, 92, 103036. [Google Scholar] [CrossRef] [Scilit]
- AlAwad, M.N.J.; Fattah, K.A. Characterization of Oil Well Cement–Formation Sheath Bond Strength. Eng 2025, 6, 117. [Google Scholar] [CrossRef] [Scilit]
- Eissa, B.; Watson, M.; Arbad, N.; Emadi, H.; Thiyagarajan, S.; Baig, A.R.; Shahin, A.; Abdellatif, M. A Review of Key Challenges and Evaluation of Well Integrity in CO2 Storage: Insights from Texas Potential CCS Fields. Sustainability 2025, 17, 5911. [Google Scholar] [CrossRef] [Scilit]
- Sammer, T.; Nasiri, A.; Kostoglou, N.; Ravi, K.; Raith, J.G. Insight into Carbon Black and Silica Fume as Cement Additives for Geoenergy Wells: Linking Mineralogy to Mechanical and Physical Properties. J. Carbon Res. 2024, 10, 71. [Google Scholar] [CrossRef] [Scilit]
- Li, H.; Zhao, G.; Zhang, H. Recent Progress of Cement-Based Materials Modified by Graphene and Its Derivatives. Materials 2023, 16, 3783. [Google Scholar] [CrossRef] [Scilit]
- Cao, Y.; Zhou, S.; Liu, R.; Tao, Q.; Liu, L. Study on Cement Carbonation Resistance and Reinforcement in CCUS-EOR. Processes 2026, 14, 1352. [Google Scholar] [CrossRef] [Scilit]
- Chen, H.; Xu, N.; Jiang, P.; Jiang, L. Study on the Effect of Freeze–Thaw Action on the Electrical Conductivity and Sensing Properties of Graphene-Based Cement Composites. Materials 2023, 16, 855. [Google Scholar] [CrossRef] [Scilit] [PubMed]
- Andrés, M.P.S.; Baños-Cabrera, M.; Gutiérrez-Fernández, L.; Díez-Pascual, A.M.; Vera-López, S. Fluorescence Study of Riboflavin Interactions with Graphene Dispersed in Bioactive Tannic Acid. Int. J. Mol. Sci. 2021, 22, 5270. [Google Scholar] [CrossRef] [Scilit]
- Zhu, B.; Zhang, Z.; Song, F.; Guo, Z.; Liu, B. Efficient Removal Of U(VI) Ions fromAqueous Solutions by Tannic Acid/Graphene Oxide Composites. Appl. Sci. 2020, 10, 8870. [Google Scholar] [CrossRef] [Scilit]
- Materak, K.; Wieczorek, A.; Bednarska, D.; Koniorczyk, M. Internal hydrophobization of cement-based materials by means of silanes. J. Phys. Conf. Ser. 2023, 2521, 012009. [Google Scholar] [CrossRef] [Scilit]
- Meng, F.; Han, K.; Guo, T.; Shu, X.; Guo, Y.; Dong, L.; Cai, J.; Ran, Q. Elucidating the effects and mechanisms of OTES@silica nano capsules on water resistance and compressive strength of cement paste. Cem. Concr. Res. 2025, 198, 108003. [Google Scholar] [CrossRef] [Scilit]
- Kremieniewski, M. Influence of Graphene Oxide on Rheological Parameters of Cement Slurries. Energies 2020, 13, 5441. [Google Scholar] [CrossRef] [Scilit]
- Chen, X.; Zhang, Y.; Li, S.; Geng, Y.; Hou, D. Influence of a New Type of Graphene Oxide/Silane Composite Emulsion on the Permeability Resistance of Damaged Concrete. Coatings 2021, 11, 208. [Google Scholar] [CrossRef] [Scilit]
- Cai, J.; Ran, Q.; Ma, Q.; Zhang, H.; Liu, K.; Zhou, Y.; Mu, S. Influence of a Nano-Hydrophobic Admixture on Concrete Durability and Steel Corrosion. Materials 2022, 15, 6842. [Google Scholar] [CrossRef] [Scilit] [PubMed]
- Gong, K.; Pan, Z.; Korayem, A.H.; Qiu, L.; Li, D.; Collins, F.; Wang, C.M.; Duan, W.H. Reinforcing Effects of Graphene Oxide on Portland Cement Paste. J. Mater. Civ. Eng. 2018, 27, A4014010. [Google Scholar] [CrossRef] [Scilit]
- Moraes, M.K.; da Costa, E.M. Effect of adding organo-modified montmorillonite nanoclay on the performance of oil-well cement paste in CO2-rich environments. Cem. Concr. Compos. 2022, 127, 104400. [Google Scholar] [CrossRef] [Scilit]
- Xia, X.; Guo, J.; Feng, Y.; Chen, D.; Yu, Y.; Jin, J.; Liu, S. Hydrophobic associated polymer “grafted onto” nanosilica as a multi-functional fluid loss agent for oil well cement under ultrahigh temperature. RSC Adv. 2016, 6, 91728–91740. [Google Scholar] [CrossRef] [Scilit]
- Song, Y.; Yao, C.; Guo, X.; Zhao, J.; Zhang, X.; Wang, M.; Chen, S. Mineralogical evolution and mechanical degradation of oil well cement under high-temperature and high-pressure CO2 carbonation. Geoenergy Sci. Eng. 2025, 255, 214112. [Google Scholar] [CrossRef] [Scilit]
- Lu, H.; Zhao, W.; Fu, Y.; Ma, S.; Lu, Z.; Yang, R.; Ding, Z.; Shi, C. Enhancing anti-carbonation properties of oil well cement slurry through nanoparticle and cellulose fiber synergy. Constr. Build. Mater. 2024, 450, 138578. [Google Scholar] [CrossRef] [Scilit]
- Pang, X.; Qin, J.; Bu, Y.; Yuan, Z.; Wang, Y.; Wang, Z. Research Advances in Oil Well Cement Subjected to High Temperature and High Pressure Curing Environment. J. Oil Gas Technol. 2020, 42, 13–23. [Google Scholar] [CrossRef]
- Silva, J.C.; Milestone, N.B. Cement/rock interaction in geothermal wells. The effect of silica addition to the cement and the impact of CO2 enriched brine. Geothermics 2018, 73, 16–31. [Google Scholar] [CrossRef] [Scilit]
- API RP 10B-2-2024; Recommend Practice for Testing Well Cements. API Publishing Services Company: Washington, DC, USA, 2024.
- Ranjana, A.; Kumar, S.; Kumarc, R.; Mohanc, D. Experimental study on carbonation depths of OPC and PPC concrete by conventional and advanced methods. Indian J. Eng. Mater. Sci. 2024, 31, 67–75. [Google Scholar] [CrossRef] [Scilit]
- GB/T 17671-2021; Test Method of Cement Mortar Strength. State Administration for Market Regulation & Standardization Administration of China: Beijing, China, 2021.
- Zhao, S.; Xie, S.; Sun, P.; Zhao, Z.; Li, L.; Shao, X.; Liu, X.; Xin, Z. Synergistic effect of graphene and silicon dioxide hybrids through hydrogen bonding self-assembly in elastomer composites. RSC Adv. 2018, 8, 17813–17825. [Google Scholar] [CrossRef] [Scilit]
- Gu, J.; An, Q.; Li, J.; Ge, P.; Wu, Y.; Li, Y. Preparation of Superhydrophobic Materials and Establishment of Anticorrosive Coatings on the Tinplate Substrate by Alkylation of Graphene Oxide. Polymers 2023, 15, 1280. [Google Scholar] [CrossRef] [Scilit]
- Wang, F.; Lei, S. Permeabilities and Mechanical Properties of Hardened Cement Pastes Modified with Sodium Laurate and Nano Silica. Materials 2020, 13, 4867. [Google Scholar] [CrossRef] [Scilit]
- Zhang, S.; Yan, Z.; Xu, G.; Liu, X.; Zhu, H.; Jiang, X. A comparative study on spalling behaviors of alkali-activated ultra-high performance concrete (AAUHPC) and cement-based UHPC. J. Clean. Prod. 2026, 554, 148084. [Google Scholar] [CrossRef] [Scilit]
- Sebastian, D.; Yao, C.-W.; Lian, I. Mechanical Durability of Engineered Superhydrophobic Surfaces for Anti-Corrosion. Coatings 2018, 8, 162. [Google Scholar] [CrossRef] [Scilit]
- Tene, T.; Tubon-Usca, G.; Haro-Barroso, C.; Castelo, G.M.V.; Gomez, C.V. Two-Dimensional Materials-Based Thin Films and Coatings. Coatings 2024, 14, 1242. [Google Scholar] [CrossRef] [Scilit]
- Xiao, Z.; Chang, Z.; Liu, Y.; Ma, Y.; Wei, F.; Xiao, D. Eco-Friendly Tannic Acid-Based Concrete Coating with Anti-Chloride Performance via One-Step Assembly. Sustainability 2024, 16, 9422. [Google Scholar] [CrossRef] [Scilit]

Disclaimer/Publisher’s Note: The statements, opinions and data contained in all publications are solely those of the individual author(s) and contributor(s) and not of MDPI and/or the editor(s). MDPI and/or the editor(s) disclaim responsibility for any injury to people or property resulting from any ideas, methods, instructions or products referred to in the content. |
© 2026 by the authors. Licensee MDPI, Basel, Switzerland. This article is an open access article distributed under the terms and conditions of the Creative Commons Attribution (CC BY) license.