


Abstract
The rapid growth of electric vehicles has increased the demand for lithium-ion batteries, highlighting the need for sustainable recycling of spent cathode materials. This study combines laboratory-scale leaching experiments and Material Flow Cost Accounting (MFCA) to compare citric, tartaric, and succinic acids for recovering Ni, Co, Mn, and Li. Under optimized conditions, citric acid achieved leaching efficiencies of 81.66% (Li), 76.05% (Co), 91.46% (Ni), and 98.94% (Mn) at a cost of USD 6.50 per 10 g battery; tartaric acid reached 87.29% (Li), 80.52% (Co), 95.79% (Ni), and 99.65% (Mn) at USD 17.23 per 10 g battery; succinic acid yielded 87.05% (Li), 73.82% (Co), 86.27% (Ni), and 99.12% (Mn) at USD 4.11 per 10 g battery. MFCA shows acid consumption dominates costs, suggesting reagent optimization and recycling could reduce expenses. These results provide a cost-oriented laboratory-scale perspective for selecting organic acids, while industrial feasibility requires further evaluation of scale-up, reagent regeneration, and process optimization.
1. Introduction
Currently, conventional fuel-powered vehicles consume substantial petroleum resources [1], contributing to severe air pollution [2,3,4,5] and posing challenges to environmental sustainability and human health [6,7,8]. In response, governments worldwide are actively promoting the adoption of electric vehicles [9,10,11] to mitigate environmental impacts. However, the growing demand for electric vehicles has led to a significant increase in the production and use of lithium-ion (Li-ion) batteries. According to the International Energy Agency (IEA), global electric vehicle production is projected to rise from 8 million units in 2019 to 50 million units by 2030 [12]. Consequently, the proper management and disposal of waste Li-ion batteries is becoming an increasingly critical issue.
With the rapid expansion of the Li-ion battery industry [13,14], the supply of metal resources has experienced both price increases [15,16] and heightened demand [17,18,19]. Based on the U.S. Geological Survey (USGS) 2023 report [20], global lithium mining is expected to increase from 107,000 tons in 2021 to approximately 130,000 tons by 2030, representing a 21% increase. Furthermore, the prices of lithium (Li), nickel (Ni), and manganese (Mn) are projected to rise by approximately 150% [21], 35% [20], and 44% [20], respectively, compared to 2021. Recycling metals from waste batteries is, therefore, considered a promising approach to mitigate the impact of rising metal prices.
Li-ion batteries generally consist of three components: the positive electrode (cathode), the negative electrode (anode), and the electrolyte. Cathode materials typically comprise metal oxides of the type LiMO2 (M = metal) [22,23], such as LiCoO2 (LCO), LiMn2O4 (LMO), LiFePO4 (LFP), and LiNi1-x-yCoxMnyO2 (NCM), whereas anode materials generally include graphite [24,25], polyvinylidene fluoride (PVDF) binders [26], and additives such as LiPF6. Among these, cathode materials are of high economic value and are therefore considered key targets for circular economy initiatives.
In particular, ternary Li-ion batteries, which utilize hexagonal layered Ni-Co-Mn-Li oxide (LiNi1-x-yCoxMnyO2, NCM) as the cathode material, exhibit excellent electrochemical performance and are the focus of this study [27,28,29,30,31]. The NCM structure is obtained by partially substituting Ni in LiNiO2 with Co and Mn, providing advantages including high conductivity (LiCoO2), structural stability (LiCoO2), high specific capacity (LiNiO2), low cost, and improved safety (LiMnO2) [32,33].
Current recycling technologies for Li-ion batteries involve several steps. First, waste batteries are discharged in saltwater [34,35], disassembled [36,37,38], and the cathode is separated, crushed, and sieved to obtain a powder containing Li, Co, Ni, and Mn while removing aluminum (Al) [39]. Second, the powder is treated with inorganic acids (e.g., H2SO4 [40,41,42,43,44], HCl [45,46], HNO3 [47], H3PO4 [48]) or organic acids (e.g., citric acid [49,50,51], malic acid [52,53], malonic acid [54], lactic acid [55], succinic acid [56], tartaric acid [23]) to dissolve the metals. Third, metals are recovered using solvent extraction [43,57,58,59,60,61,62,63], ion exchange [64,65,66,67], or precipitation methods [40,68,69,70,71,72,73]. Precipitates of Li, Co, Ni, and Mn can subsequently be reused for battery production. However, most previous studies have focused solely on recovery efficiency, without considering recovery costs. Therefore, this study emphasizes the leaching step to identify the most suitable organic acid solution in terms of both efficiency and cost.
Given the high costs associated with waste battery recycling [67], cost-effective strategies are critical. Material flow cost accounting (MFCA), standardized under ISO-14051 [74], was adopted in this study to evaluate material and energy efficiency. MFCA provides a transparent, data-driven method to trace material flows throughout the production process, enabling the identification of low-efficiency steps and potential cost savings. Costs are categorized into material, energy, system, and waste management costs, allowing a clearer understanding of material loss compared to conventional accounting methods.
Accordingly, this study aims to assess the leaching performance and economic feasibility of three selected organic acids—citric acid, malic acid, and lactic acid—for recovering cathode materials from ternary Li-ion batteries, chosen for their environmental friendliness, availability, and effective metal-chelating properties. Based on the results, a cost-effective organic acid leaching system is proposed to facilitate sustainable recycling and promote the development of a circular economy.
2. Materials and Methods
2.1. Materials
The waste Li-ion batteries (NCM111) used in this study were obtained from Han Jin Technology Co., Ltd. (Nantou City, Taiwan). The discarded batteries were first immersed in a saturated sodium chloride solution to undergo discharge. After 24 h, the completion of the discharge process was confirmed by the absence of any reaction. The batteries were then manually disassembled to extract the positive electrode material. For subsequent leaching experiments, the material was crushed and sieved through a 0.177 mm screen to separate the black powder from aluminum (Al). The composition of the powder is summarized in Table 1, with Li, Co, Ni, and Mn identified as the primary metals recovered in this study.
Table 1.
Primary metal components in the cathode materials of used lithium-ion batteries.
In this work, citric acid (99.8%), tartaric acid (99%), and succinic acid (99%) were sourced from Echo Chemical Co. Ltd. (Miaoli, Taiwan), and all solutions were made using deionized (DI) water.
2.2. Equipment
The cathode materials from spent lithium-ion batteries were first ground using a crusher (CW-1, Hsiang Tai, New Taipei, Taiwan). A thermostatic water-stirring tank (Shin-Kwang Precision Industry Ltd., New Taipei, Taiwan) was employed to maintain the leaching temperature and stirring rate. Solid–liquid separation was performed with vacuum pumps (Chemker 300, Rone Scientific Co., Ltd., New Taipei, Taiwan). The metal concentrations in the resulting solutions were analyzed by atomic absorption spectrometry (AAS) using a PinAAcle 900F spectrometer (PerkinElmer Inc., Waltham, MA, USA) to evaluate leaching efficiency.
2.3. Leaching Process
To analyze the metal composition of the cathode powder, digestion with aqua regia was carried out. In this procedure, 1 g of lithium-ion battery powder was placed into a 250 mL Erlenmeyer flask containing 10 mL of nitric acid and 30 mL of hydrochloric acid, along with a magnetic stirring bar. The flask was then submerged in a thermostatically controlled water-stirring bath at 90 °C and agitated continuously for 24 h to ensure complete dissolution of the powder. After filtration, the metal concentrations were measured using atomic absorption spectroscopy (AAS). The composition of the cathode materials is summarized in Table 1.
In the experiments, the battery powder, acid solution, and hydrogen peroxide were combined in a 250 mL conical flask with a magnetic stirrer, immersed in a constant-temperature water bath at the designated temperature for the specified leaching time. After separation of the solid and liquid phases by filtration, the metal concentrations in the leachate were determined by AAS, and the leaching efficiencies were calculated according to Formula (1).
where Wp is the weight of the powder, Mp is the percentage of the metal in the powder, C is the concentration of the metal in the leachate, and V is the volume of the leaching solution.
2.4. Leaching Optimization Using the Taguchi Method
The Taguchi method was employed to optimize the leaching experiments, enabling a systematic investigation of the effects of multiple factors, including temperature, acid concentration, solid–liquid ratio, leaching time, and the amount of H2O2 added. An L16(45) orthogonal array was designed to evaluate the influence of each parameter while minimizing the number of experimental runs, as shown in Table 2. Subsequent factor effect analysis was conducted to determine the response values KX for each factor level. The extreme deviation values for each control factor were then calculated according to Formula (2), followed by ranking these deviations to quantify the relative contribution and significance of each factor on the metal leaching response. Finally, confirmation experiments were performed to validate the optimal leaching conditions determined through the Taguchi analysis.
Table 2.
Factors and Levels for Taguchi L16(45) Orthogonal Array.
2.5. Cost Analysis
In this study, the Material Flow Cost Accounting (MFCA) approach was employed to assess the allocation of leaching expenses. Total leaching costs were divided into four categories: materials, energy, system, and waste disposal. Material costs included primary materials, auxiliaries, and consumables. Energy costs comprised electricity, fuel, and water usage. System costs encompassed expenses not classified under materials, energy, or waste disposal, such as equipment depreciation, processing fees, and amortization. Waste disposal costs covered the fees associated with waste management. This method provides a transparent breakdown of cost allocation.
A key aspect of MFCA is determining the cost allocation ratio. Output volume percentages were calculated based on positive and negative product quantities, and allocation ratios were applied to material, energy, and system costs. By quantifying product and material loss costs in each system, plant managers can identify effective strategies for cost reduction.
Table 3 summarizes the prices of the raw materials employed in the leaching experiments. Material costs were determined based on quotations provided by Echo Chemical Co., Ltd. (Miaoli, Taiwan). The cost of water was obtained from Taiwan Water Corporation (Taipei, Taiwan), while electricity expenses were taken from Taiwan Power Company (Taipei, Taiwan). Additionally, the price of the thermostatic water-stirring bath was estimated according to a quotation from Shin-Kwang Precision Industry Ltd. (New Taipei, Taiwan). Waste disposal costs were based on rates from the Environmental Resources Center at National Cheng Kung University (Tainan, Taiwan). Equipment depreciation costs per hour were calculated assuming a service life of 7 years, corresponding to approximately 13,440 operating hours.
Table 3.
Material cost, energy cost, system cost, and waste treatment cost of leaching lithium-ion battery cathode powder (in TWD and USD).
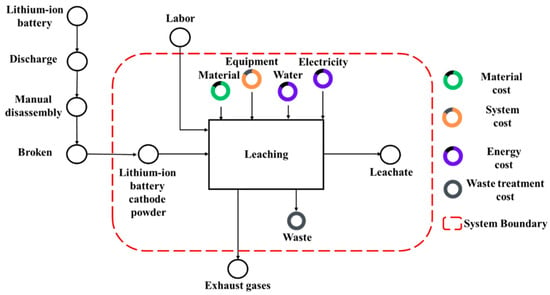
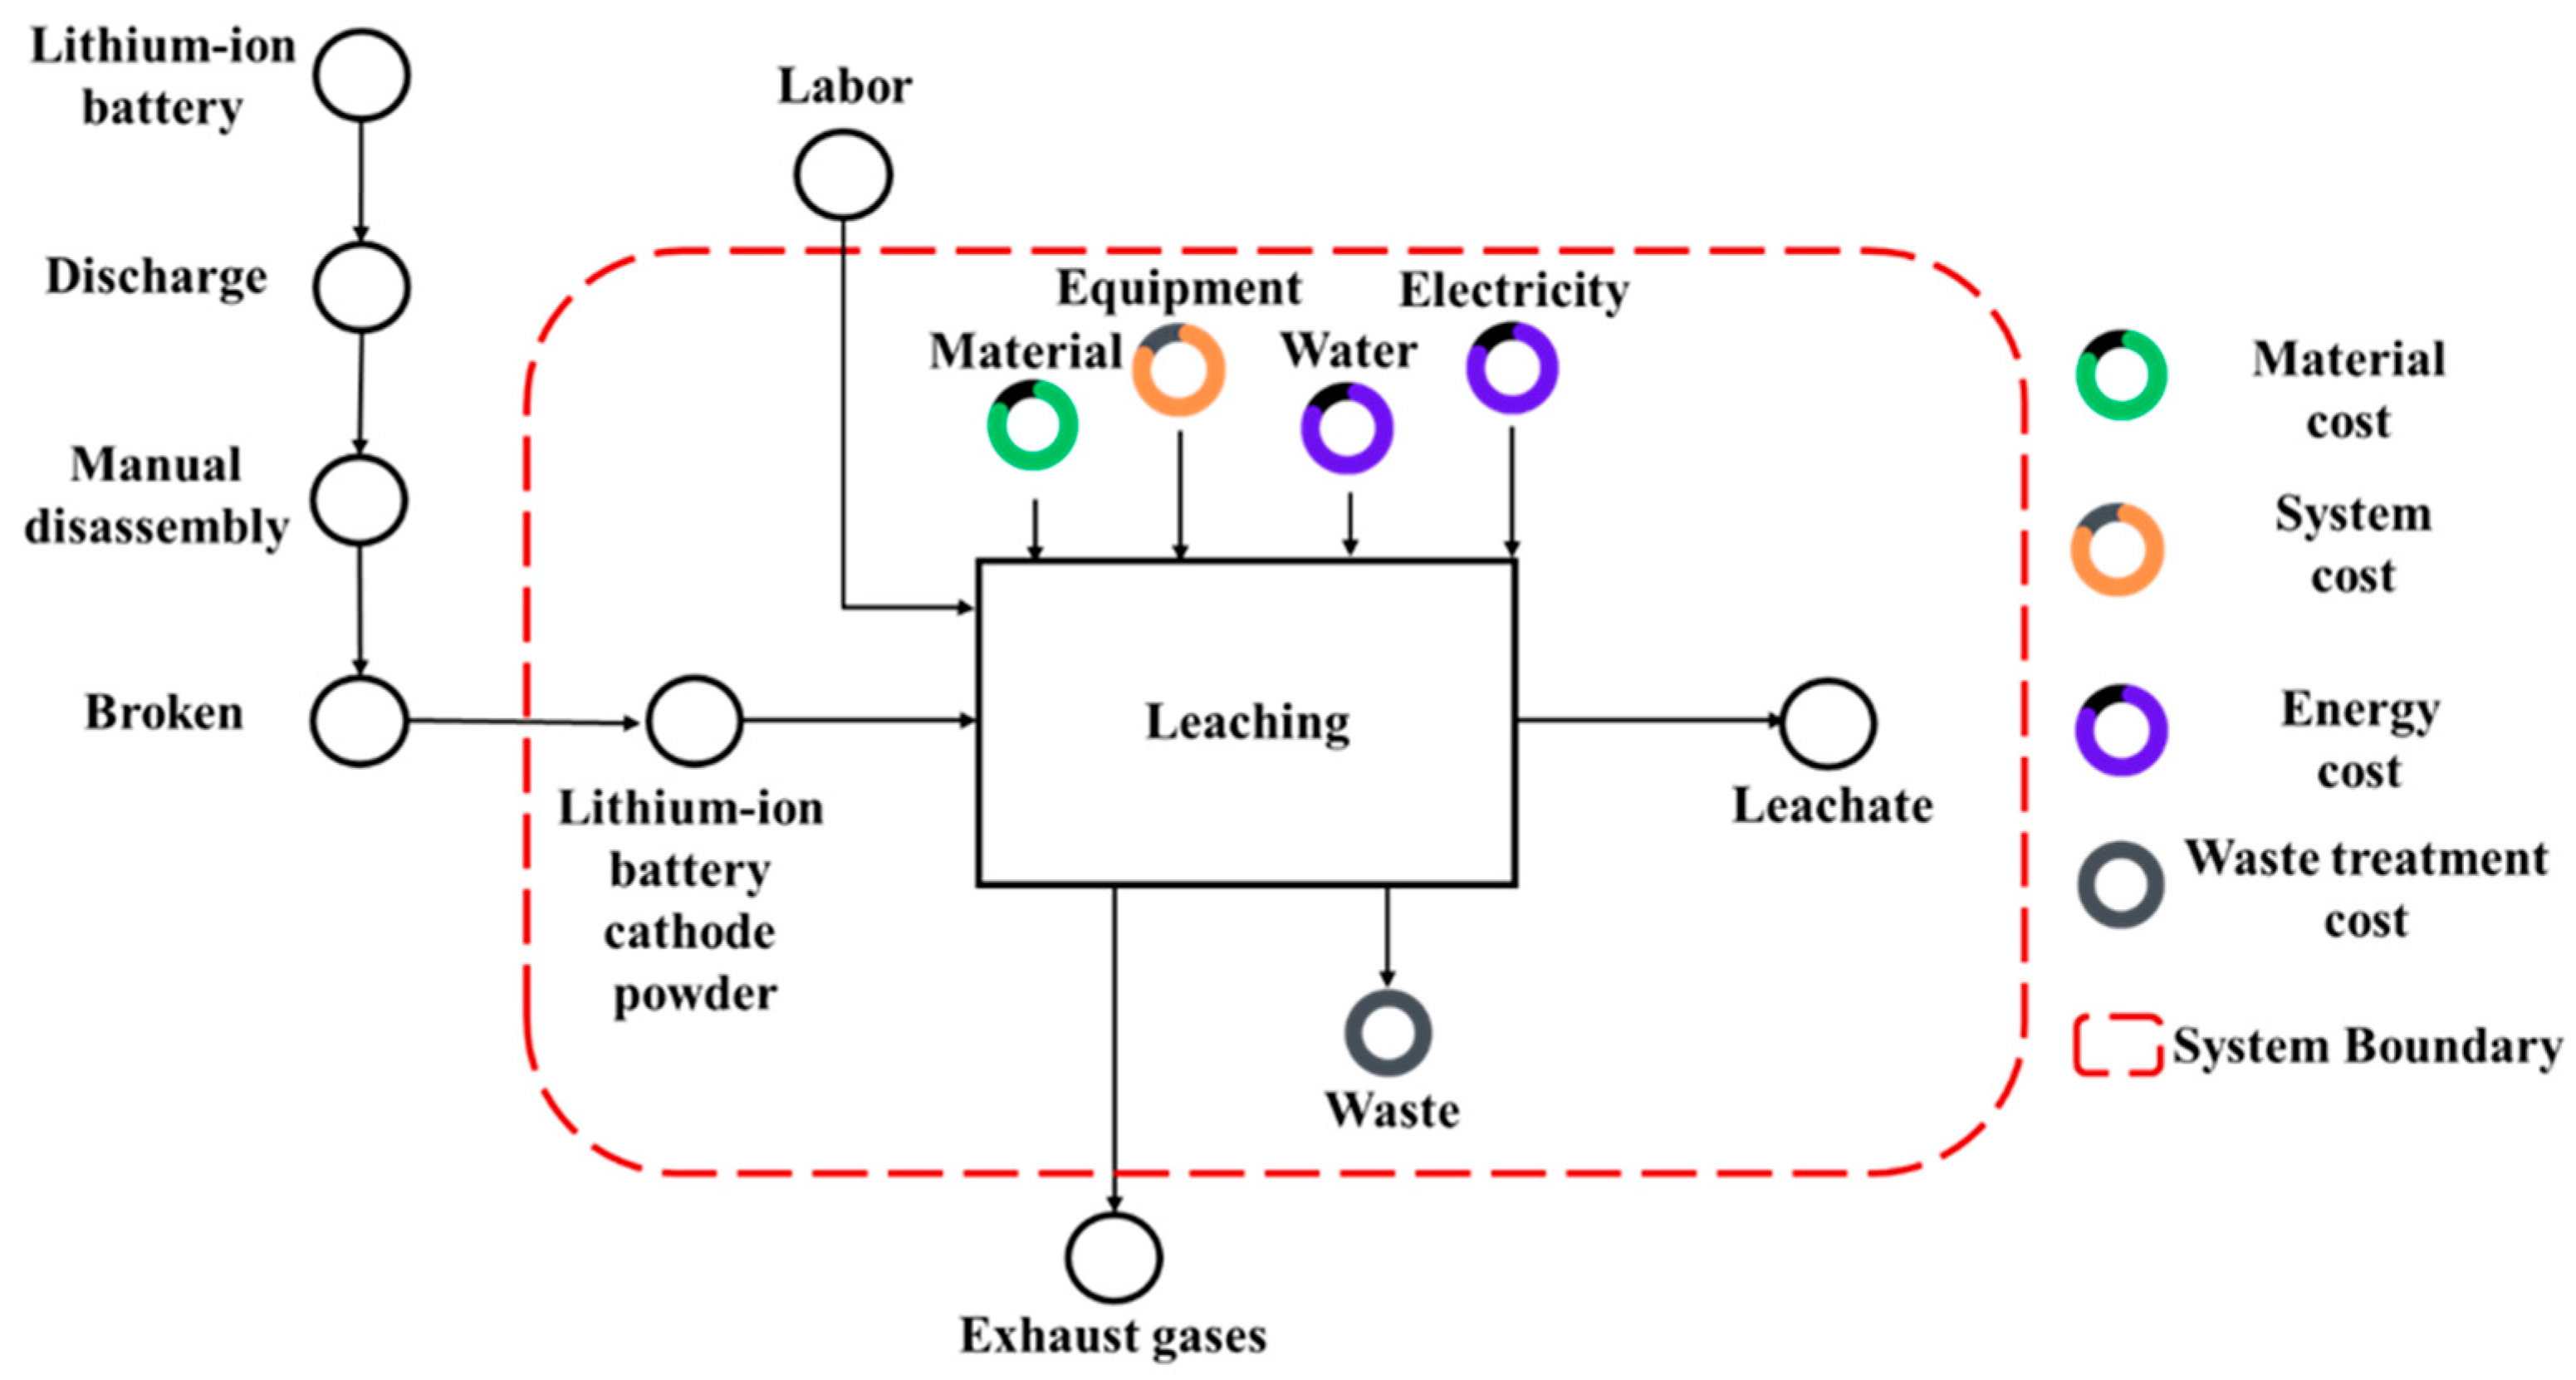
For the laboratory-based economic analysis, 10 g of Li-ion battery cathode powder was used as the basis for each recycling procedure. Note that labor costs may vary by country, and the laboratory’s labor costs may not accurately reflect those in an industrial setting. Therefore, labor costs were excluded from the system cost evaluation. The system boundary for cost analysis is illustrated in Figure 1.
Figure 1.
System boundary for the cost of leaching lithium-ion battery cathode powder.
3. Results
3.1. Taguchi-Optimized Leaching Parameters for Citric Acid
Citric acid was employed to leach valuable metals (Li, Co, Ni, and Mn) from spent lithium-ion battery cathode materials. The leaching efficiencies obtained under various experimental conditions are summarized in Table 4, demonstrating that temperature, leaching time, acid concentration, H2O2 addition, and solid-to-liquid ratio all exert significant influence on metal recovery. A factor effect analysis was subsequently performed based on the results in Table 5 to quantify the relative contribution of each parameter. The factors were ranked in descending order of influence as follows: temperature > leaching time > solid-to-liquid ratio > H2O2 addition > acid concentration.
Table 4.
Experimental Results of Citric Acid Leaching Based on L16(45) Orthogonal Array.
Table 5.
Factor Effect Analysis of Citric Acid Leaching.
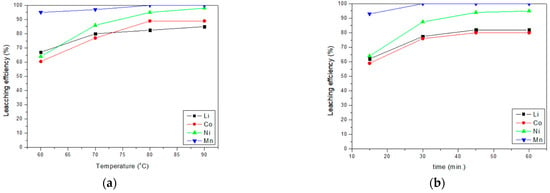
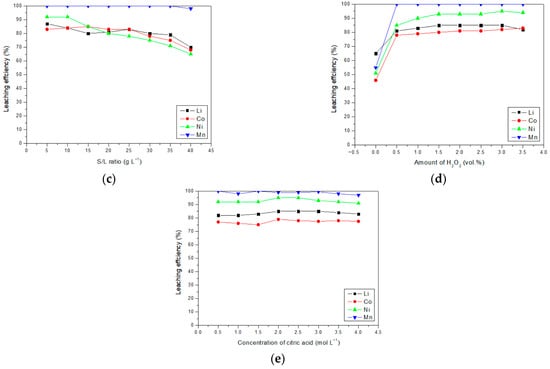
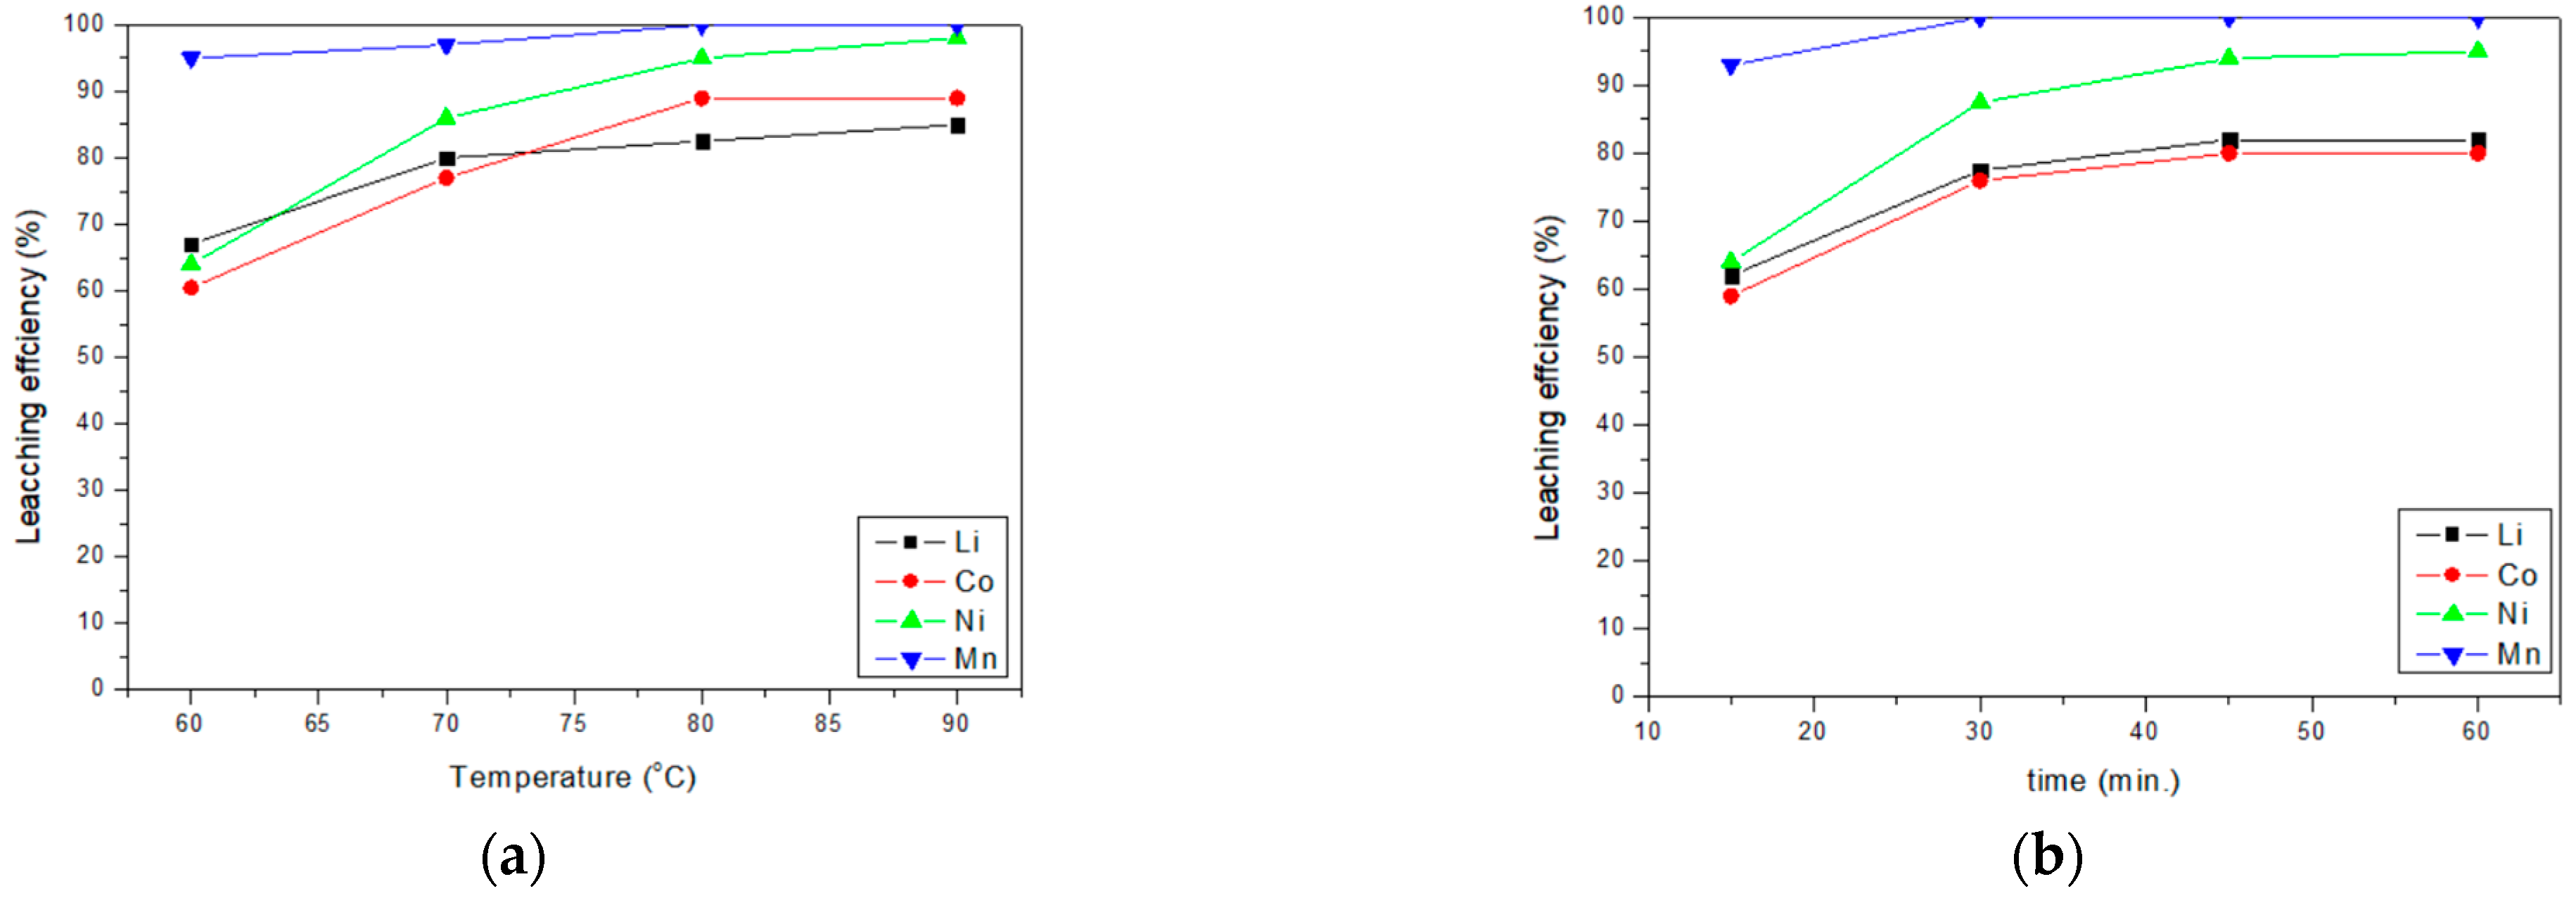
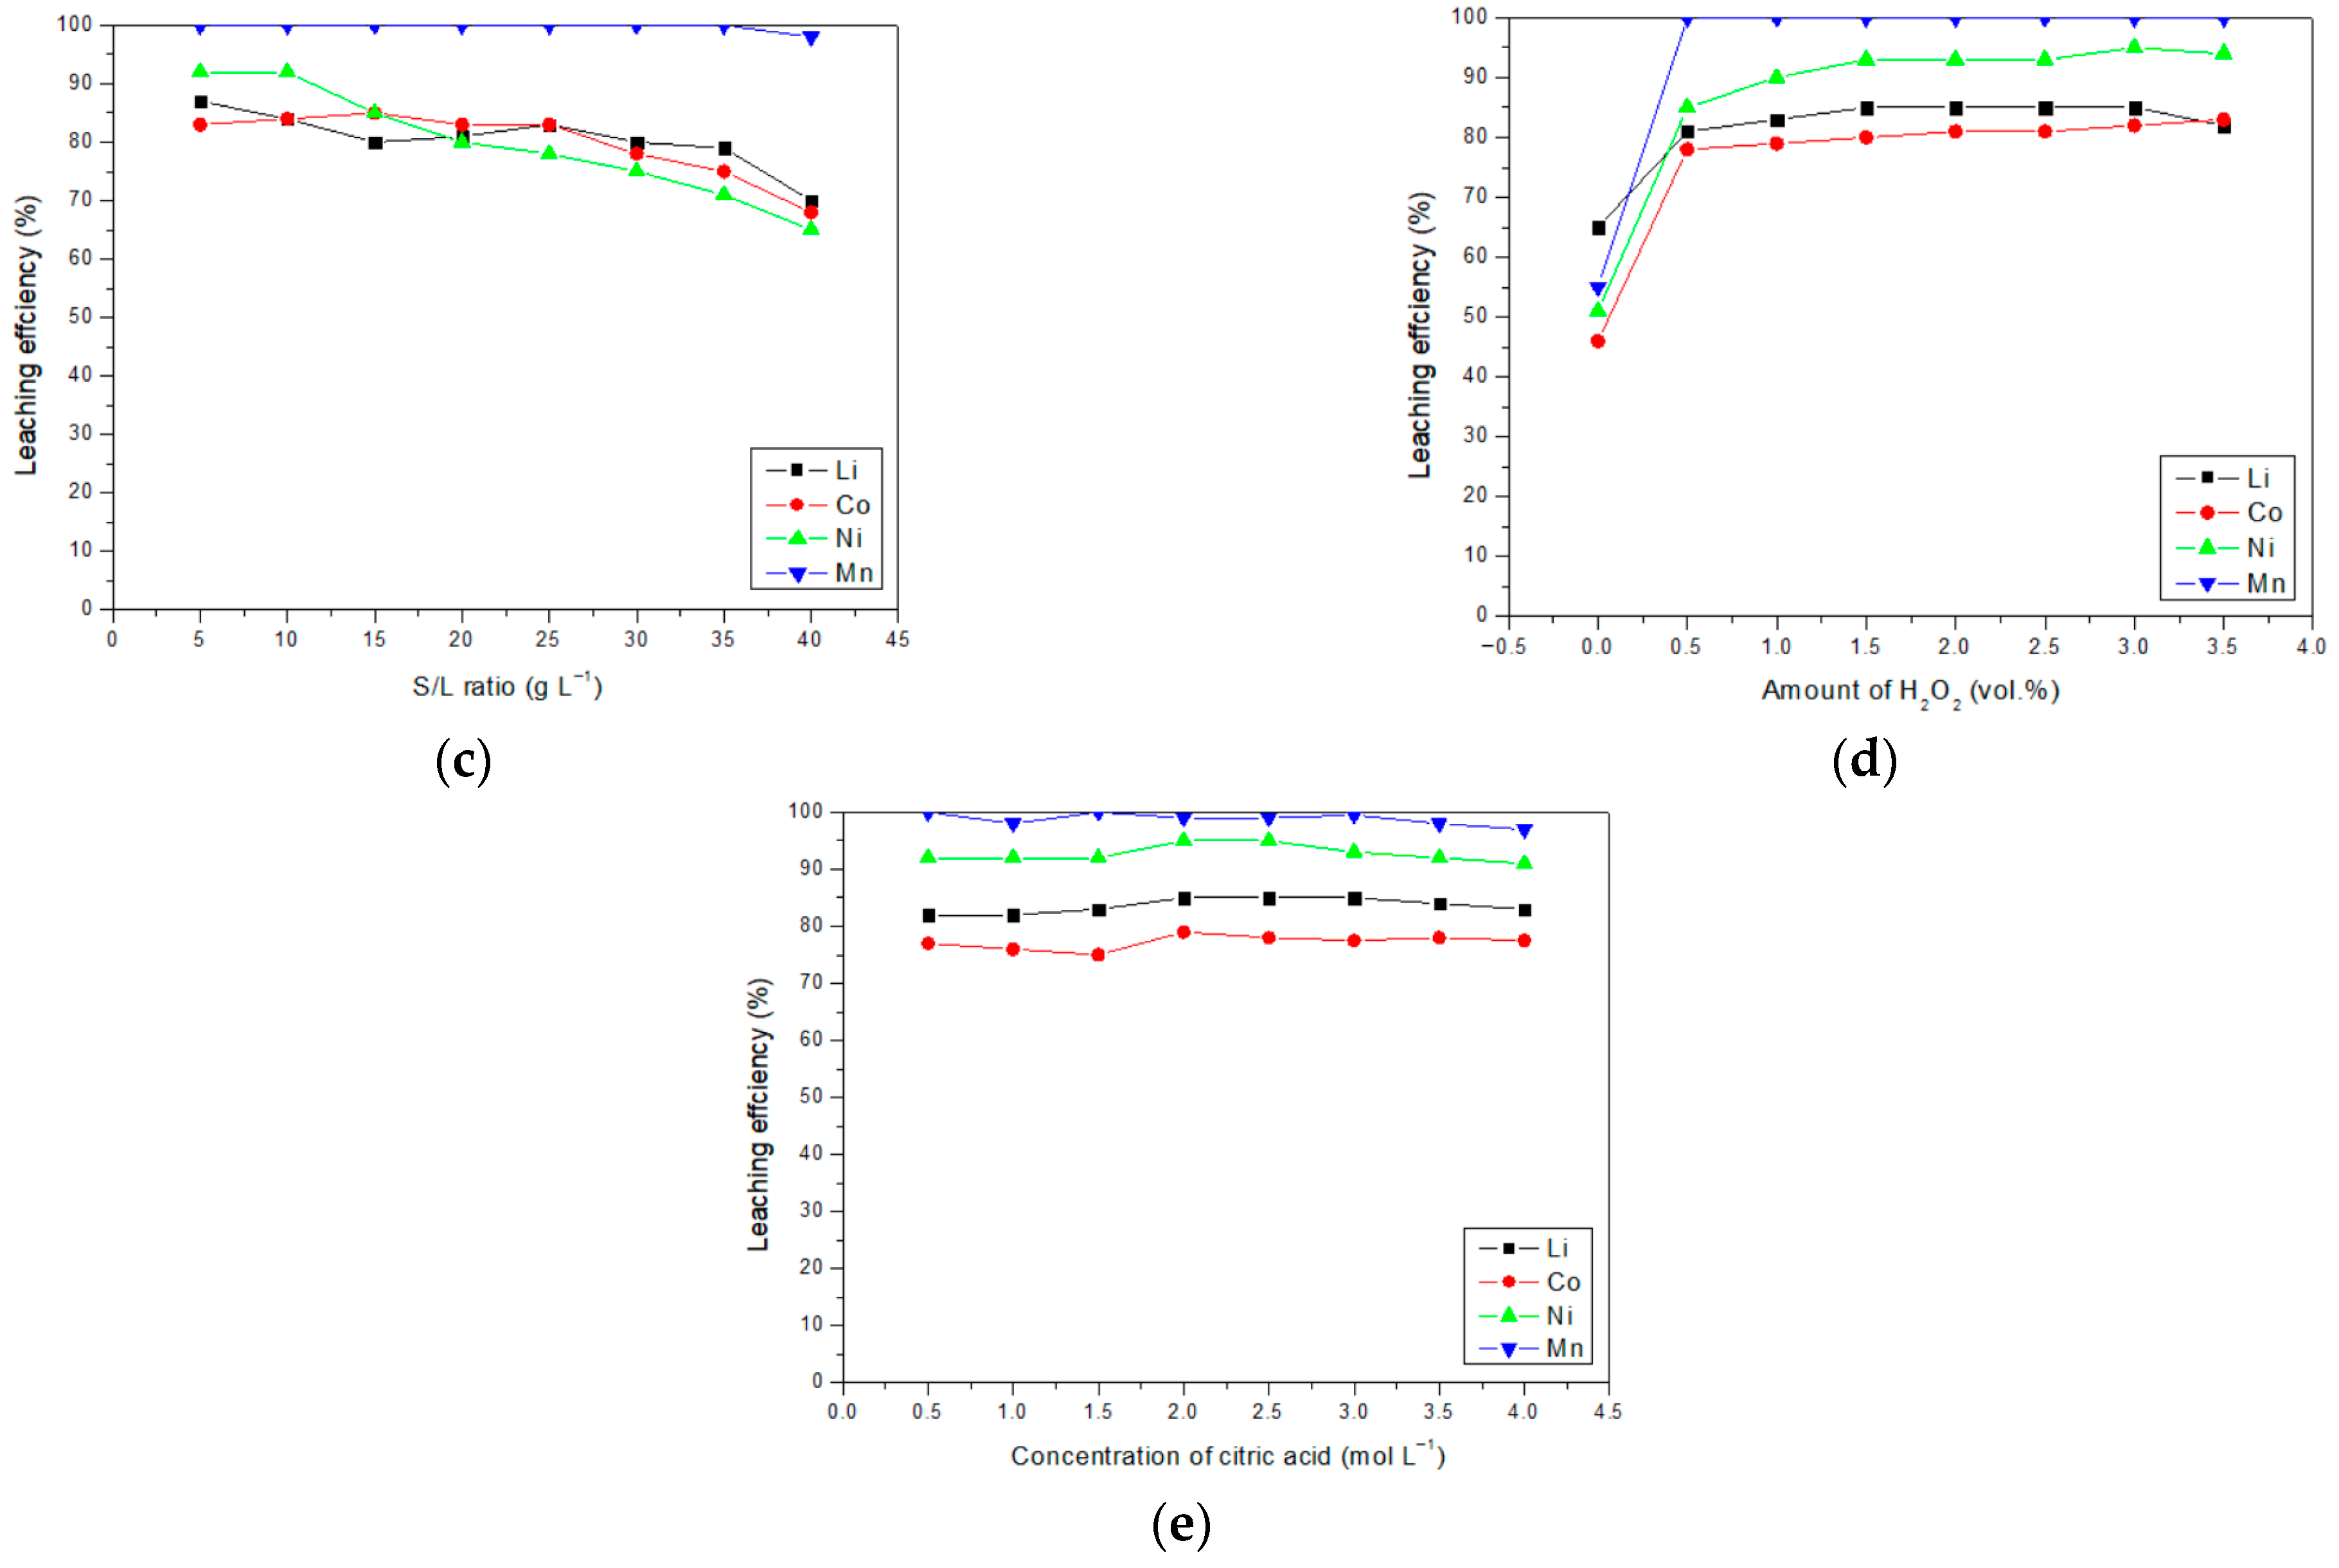
Based on the ranked factor effects, a series of sequential confirmation experiments was then conducted to verify the predicted optimal parameter combination, as shown in Figure 2. The final optimal leaching conditions were determined to be 80 °C, 45 min, a solid-to-liquid ratio of 10 g/L, 1.5 vol% H2O2, and 0.5 mol/L citric acid concentration. Under these optimized conditions, the corresponding leaching efficiencies reached 81.66% for Li, 76.05% for Co, 91.46% for Ni, and 98.94% for Mn.
Figure 2.
Effect of (a) temperature, (b) time, (c) S/L ratio, (d) amount of H2O2 added, and (e) acid concentration on leaching efficiency of Citric Acid.
3.2. Taguchi-Optimized Leaching Parameters for Tartaric Acid
Tartaric acid was employed to leach valuable metals (Li, Co, Ni, and Mn) from spent lithium-ion battery cathodes. The leaching efficiencies obtained under various experimental conditions are summarized in Table 6, demonstrating that temperature, leaching time, acid concentration, H2O2 addition, and the solid-to-liquid ratio all exert significant effects on metal recovery. A factor-effect analysis was subsequently carried out based on the results in Table 7 to assess the relative contribution of each parameter. The influence ranking was determined to be: acid concentration > temperature > leaching time > solid-to-liquid ratio > H2O2 addition.
Table 6.
Experimental Results of Tartaric Acid Leaching Based on L16(45) Orthogonal Array.
Table 7.
Factor Effect Analysis of Tartaric Acid Leaching.
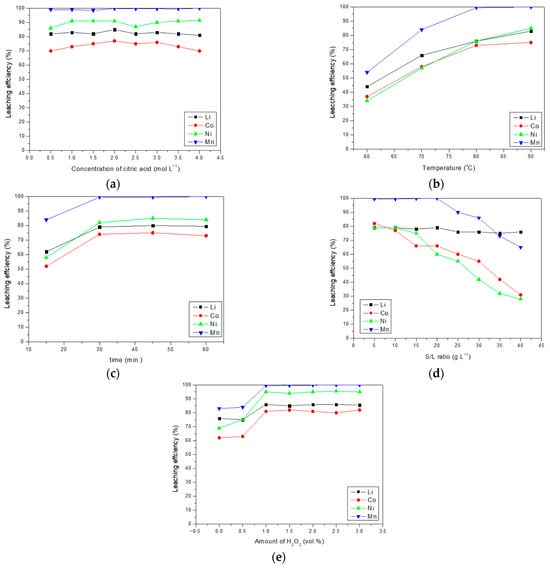
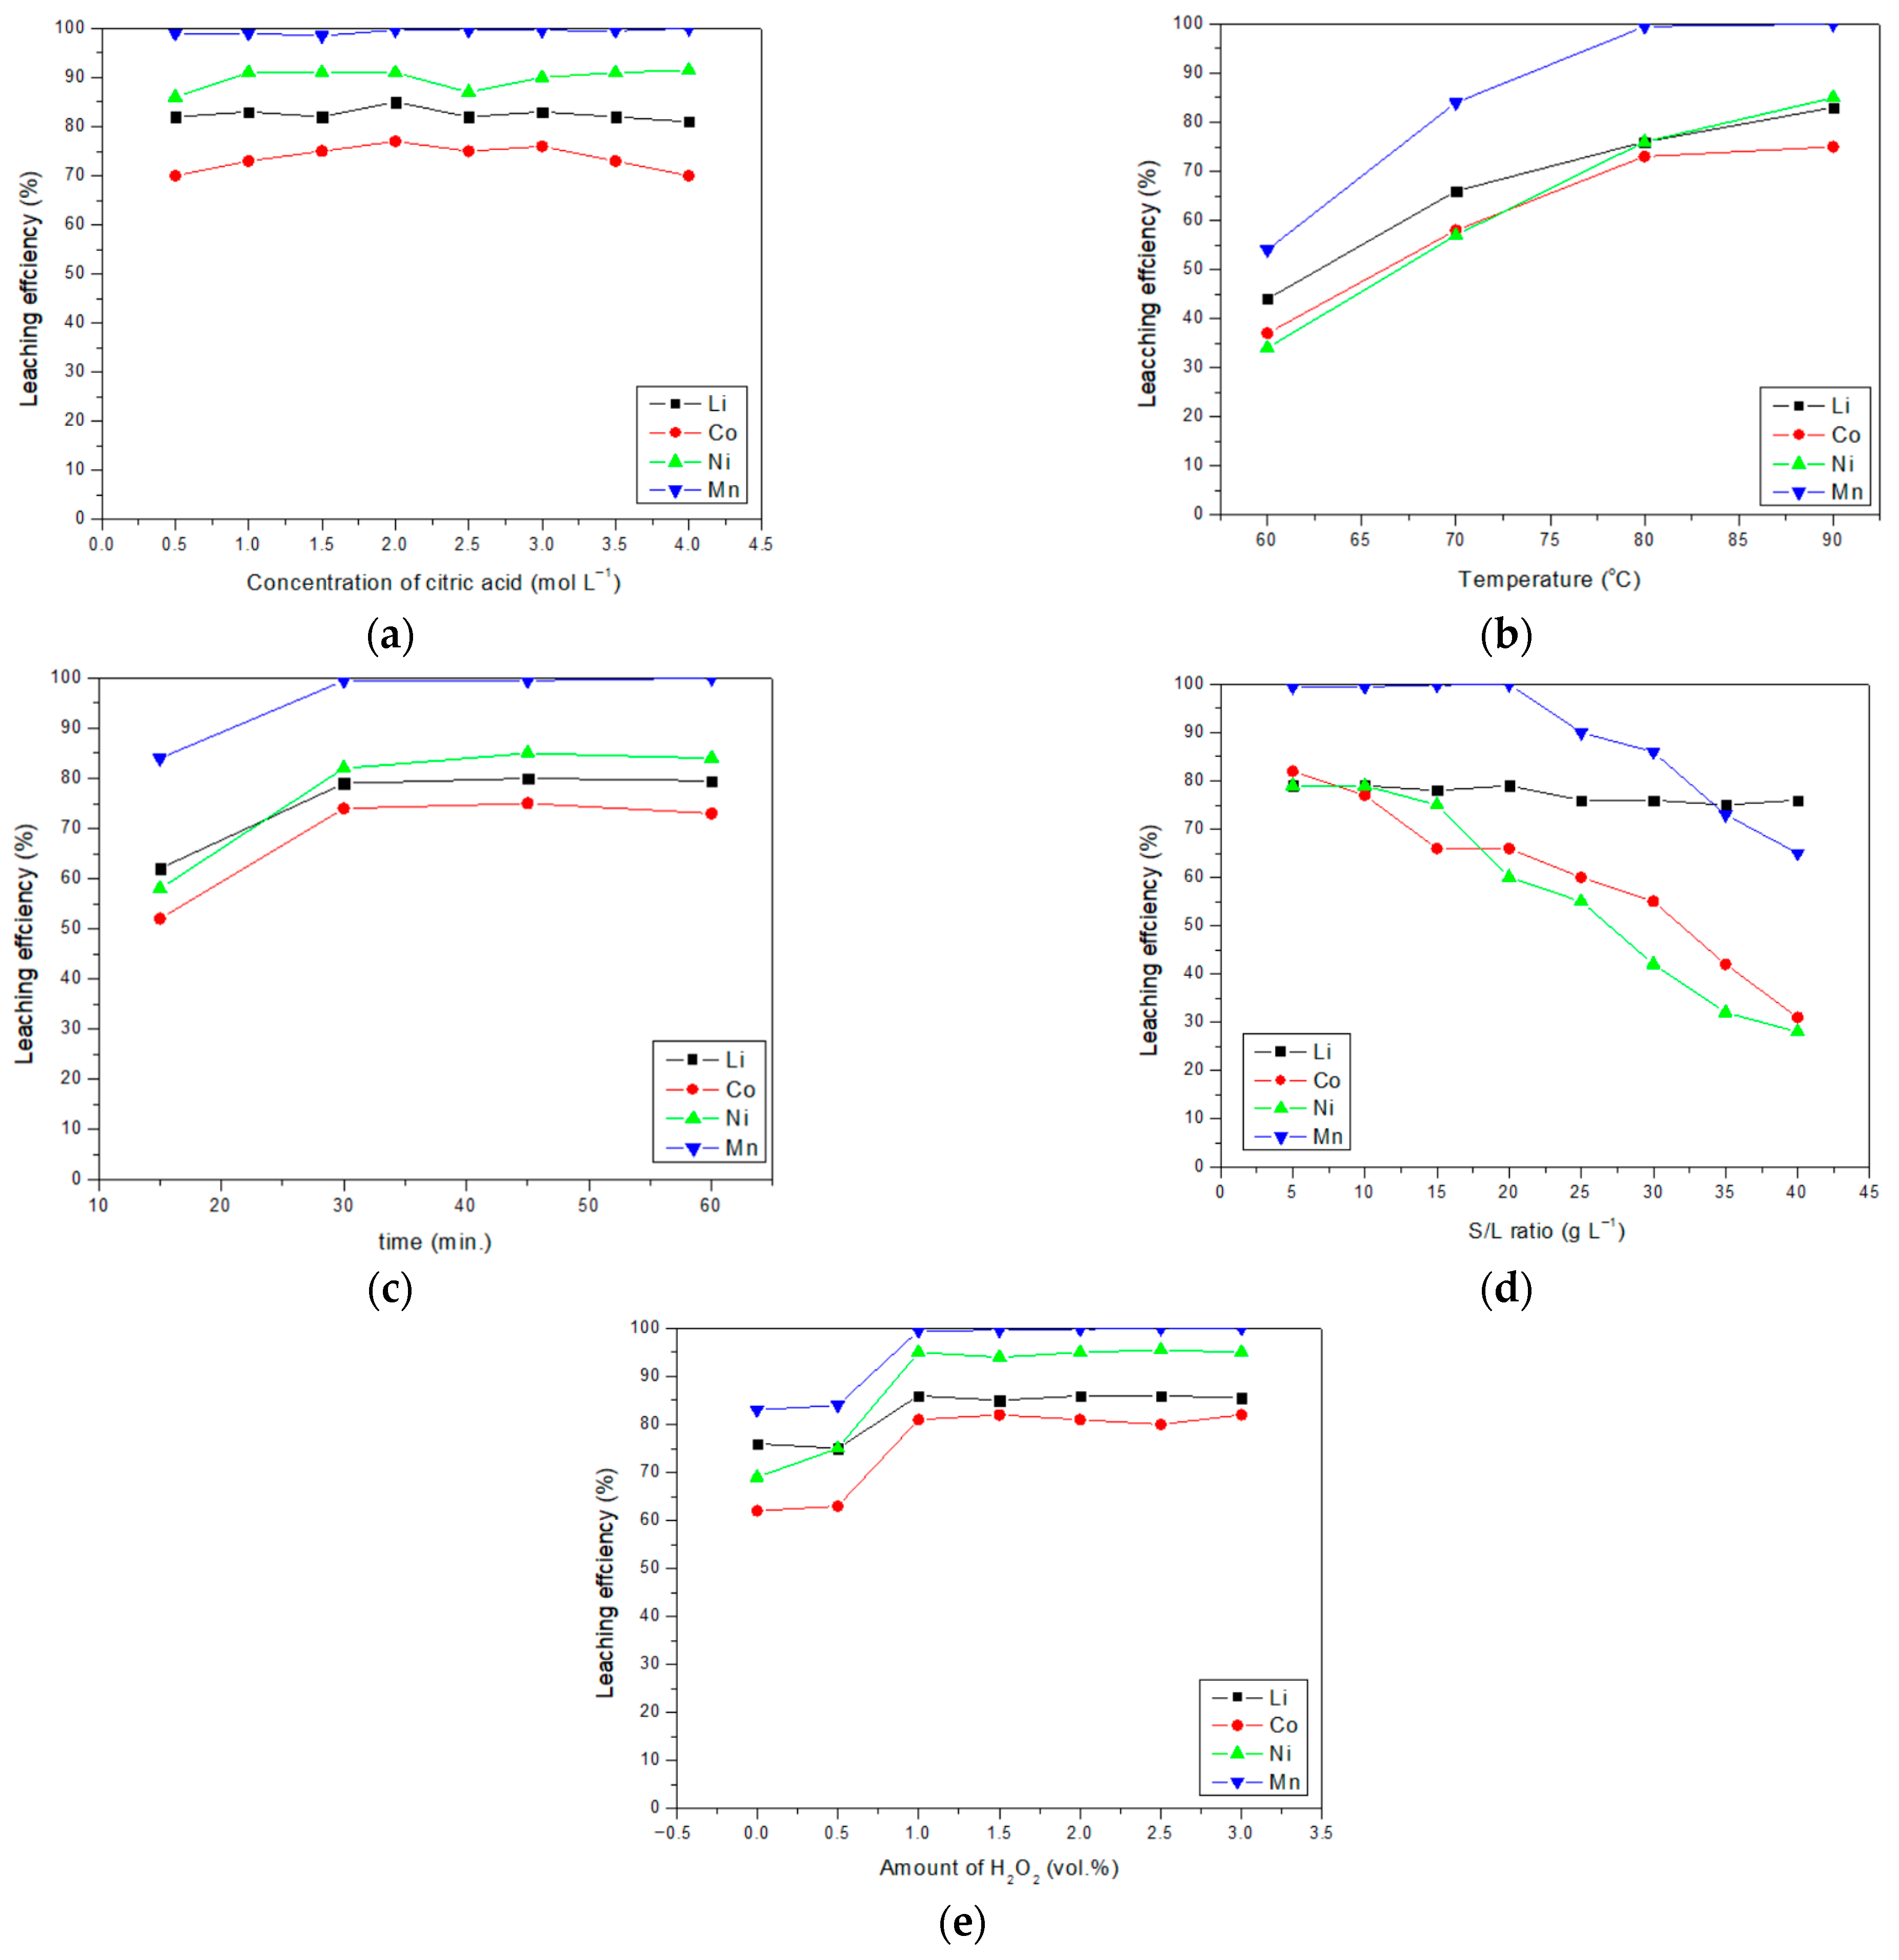
Based on these ranked factor effects, sequential confirmation experiments were then conducted to validate the predicted optimal conditions, as illustrated in Figure 3. The final optimal leaching parameters were confirmed to be 90 °C, 30 min, a solid-to-liquid ratio of 10 g/L, 1.5 vol% H2O2, and an acid concentration of 2.0 mol/L. Under these conditions, the leaching efficiencies reached 87.29% for Li, 80.52% for Co, 95.79% for Ni, and 99.65% for Mn.
Figure 3.
Effect of (a) acid concentration, (b) temperature, (c) time, (d) S/L ratio, and (e) amount of H2O2 added on the leaching efficiency of Tartaric Acid.
3.3. Taguchi-Optimized Leaching Parameters for Succinic Acid
Succinic acid was employed to leach valuable metals (Li, Co, Ni, and Mn) from spent lithium-ion battery cathodes. The leaching efficiencies obtained under various experimental conditions are summarized in Table 8, demonstrating that temperature, leaching time, acid concentration, H2O2 addition, and the solid-to-liquid ratio all exert notable influences on metal recovery. Factor effect analysis, conducted based on the results in Table 9, was used to quantify the relative significance of each parameter, yielding the following order of influence: H2O2 addition > solid-to-liquid ratio > acid concentration > leaching time > temperature.
Table 8.
Experimental Results of Succinic Acid Leaching Based on L16(45) Orthogonal Array.
Table 9.
Factor Effect Analysis of Succinic Acid Leaching.
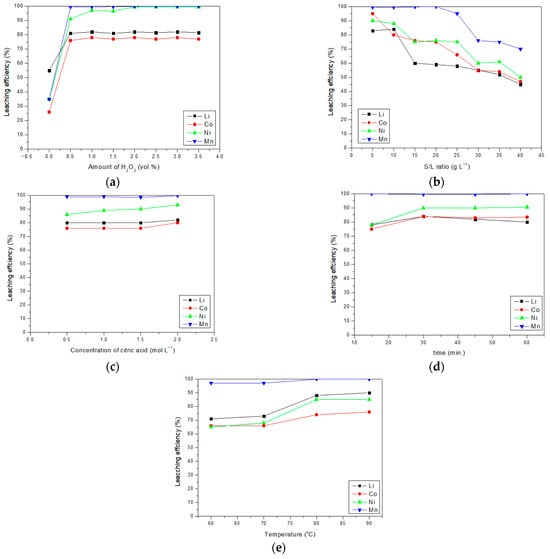
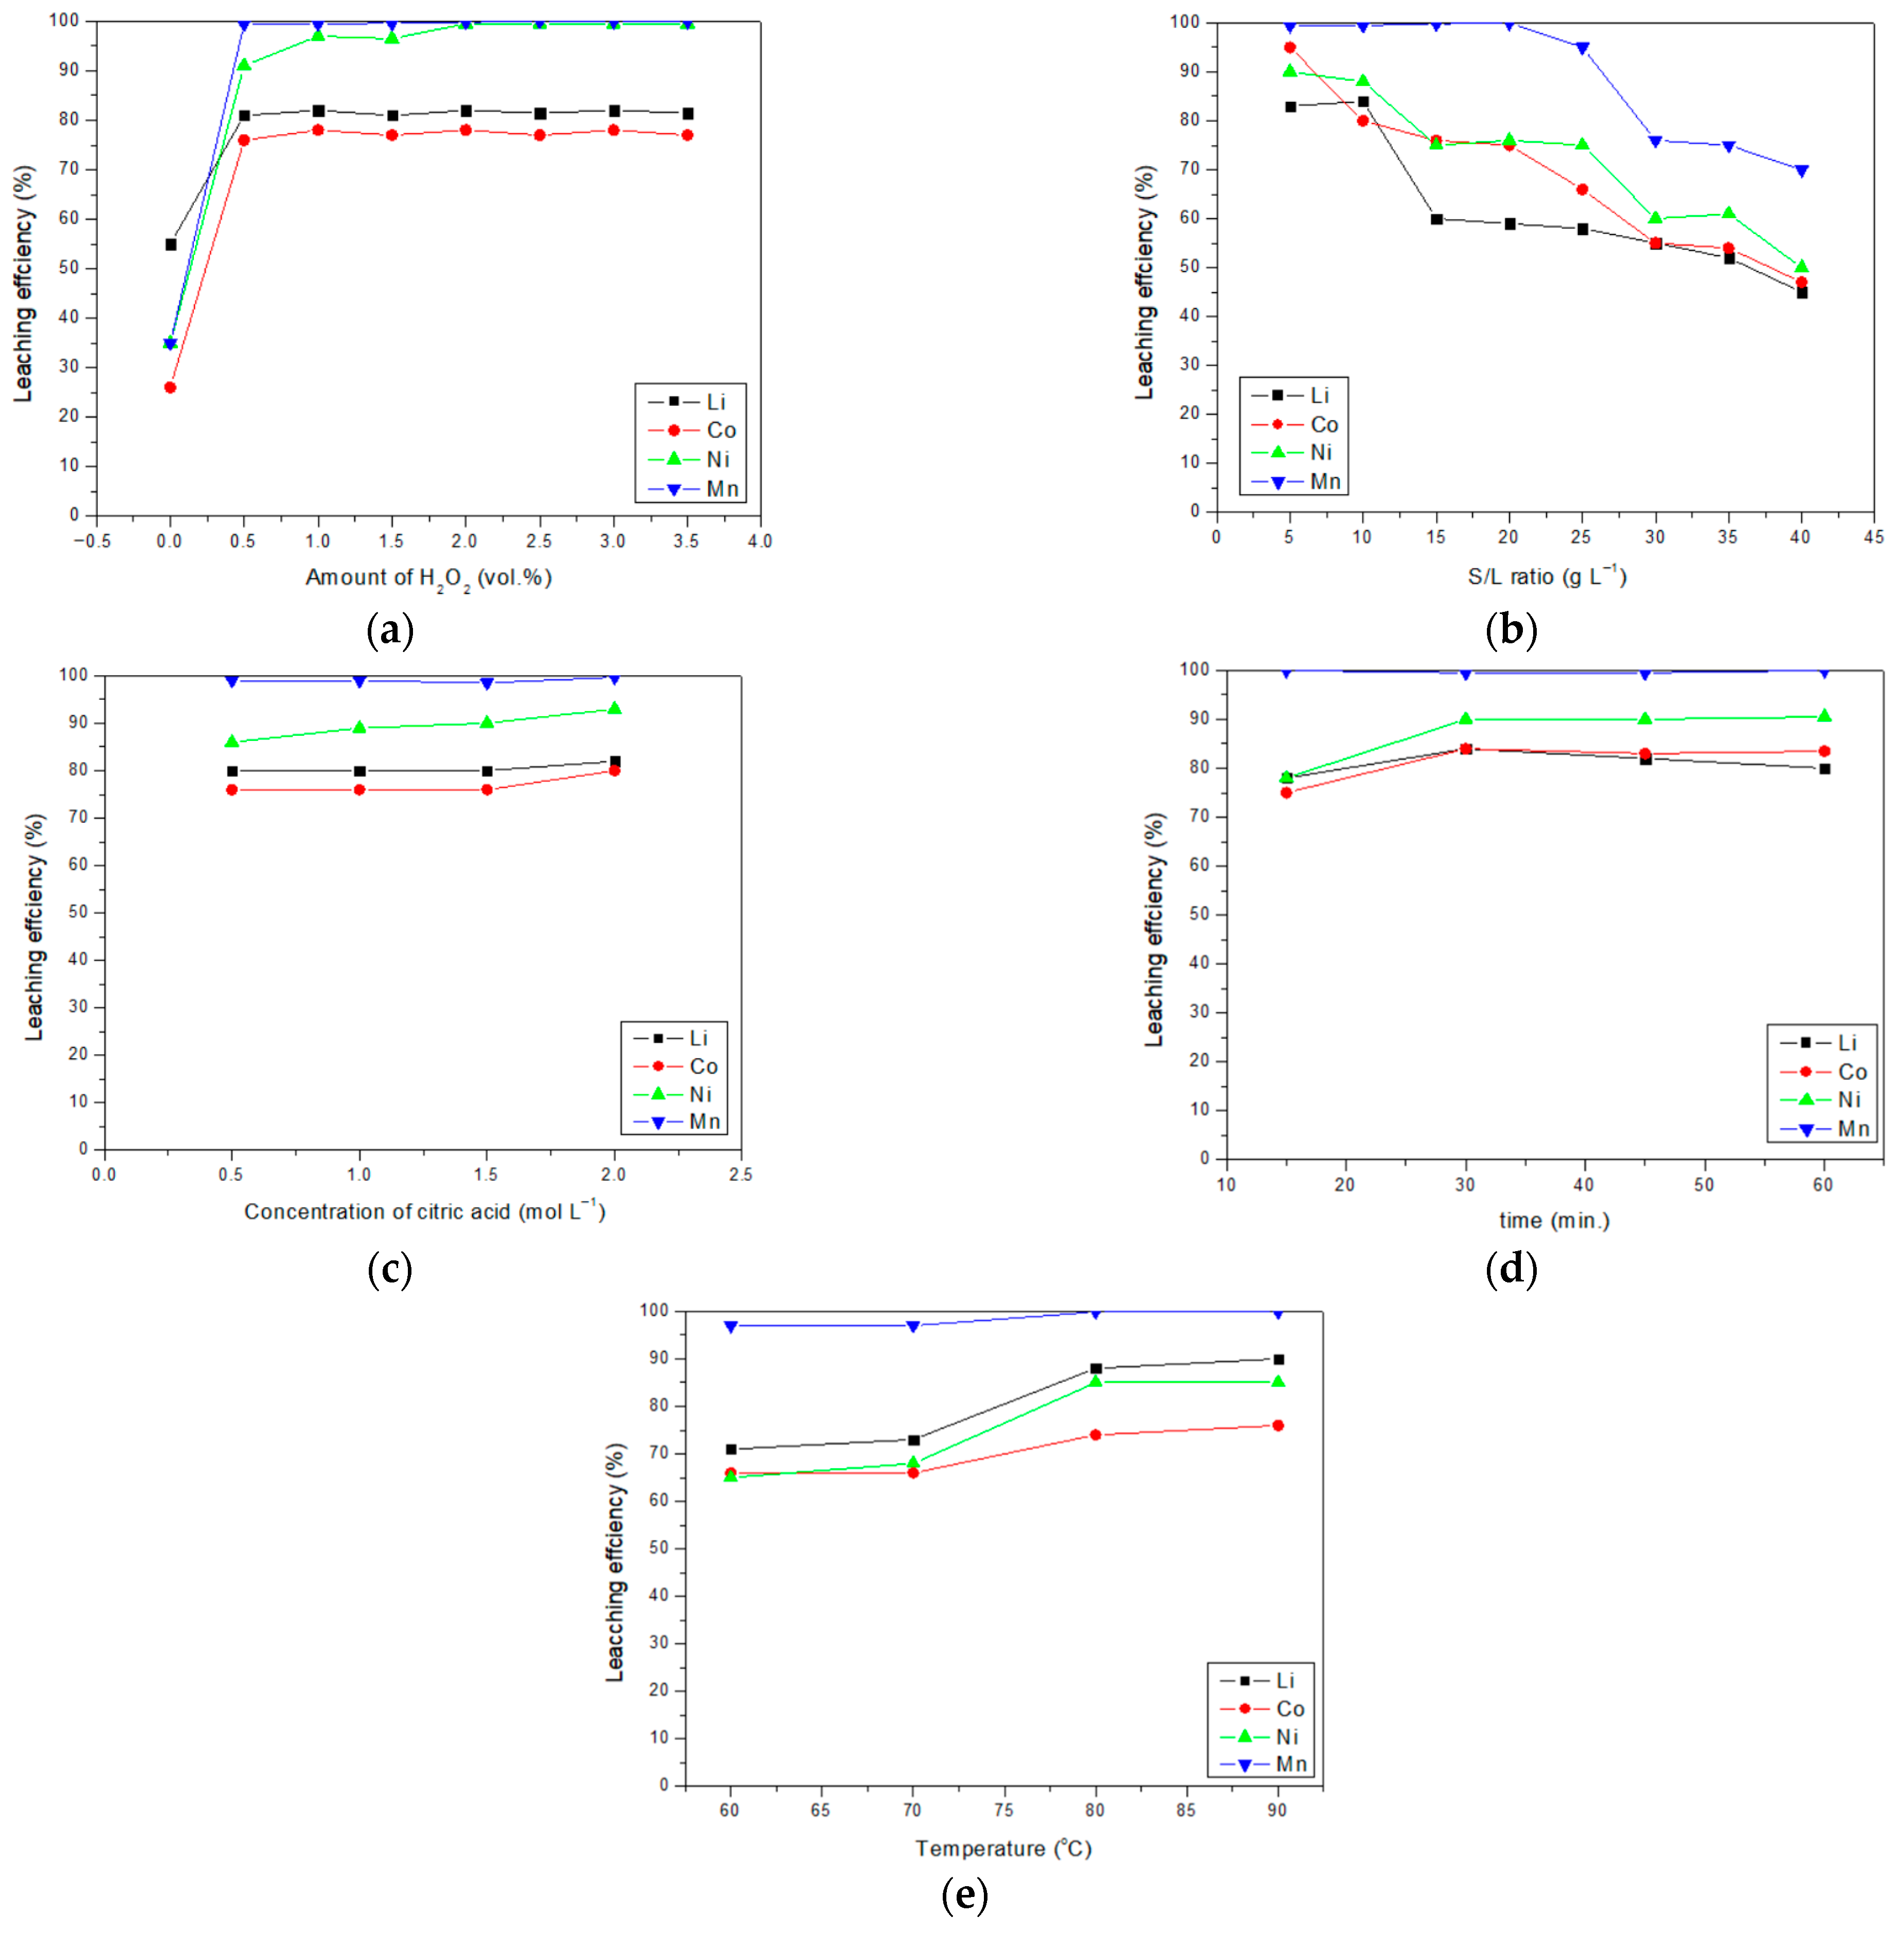
Following the ranked factor contributions, a series of sequential confirmation experiments was performed to validate the predicted optimal leaching conditions, as illustrated in Figure 4. The final optimized parameters were confirmed to be 90 °C, 30 min, a solid-to-liquid ratio of 10 g/L, 1.5 vol% H2O2, and an acid concentration of 2.0 mol/L. Under these conditions, the leaching efficiencies achieved were 87.05% for Li, 73.82% for Co, 86.27% for Ni, and 99.12% for Mn.
Figure 4.
Effect of (a) amount of H2O2, (b) S/L ratio, (c) acid concentration, (d) time, and (e) temperature on leaching efficiency of Succinic Acid.
3.4. Total Leaching Efficiency Comparison
As shown in Table 10, a mong the target metals, Mn consistently exhibited the highest leaching efficiency (>98%) across all acid systems, due to its higher reactivity and lower reduction potential, whereas Co showed the lowest efficiency (~70–80%) under mild organic acid conditions. Ni and Li displayed moderate to high leachability depending on the acid type, with Ni leaching particularly enhanced in tartaric acid due to its dual carboxyl and hydroxyl functional groups that facilitate metal–ligand complex formation. The differences in leaching performance among citric, tartaric, and succinic acids can be attributed to several chemical factors: the acidity (pKa values) of each acid affects proton availability and metal solubilization, while their chelating ability, determined by the number and arrangement of carboxyl and hydroxyl groups, influences the stability of metal–ligand complexes. Under the optimal conditions determined via Taguchi optimization and confirmed by verification experiments, the leaching efficiencies for each acid were as follows: citric acid (80 °C, 45 min, 10 g/L solid-to-liquid ratio, 1.5 vol% H2O2, 0.5 mol/L acid concentration) achieved Li 81.66%, Co 76.05%, Ni 91.46%, and Mn 98.94%; tartaric acid (90 °C, 30 min, 10 g/L solid-to-liquid ratio, 1.5 vol% H2O2, 2.0 mol/L acid concentration) achieved Li 87.29%, Co 80.52%, Ni 95.79%, and Mn 99.65%; and succinic acid (80 °C, 30 min, 10 g/L solid-to-liquid ratio, 1.0 vol% H2O2, 0.5 mol/L acid concentration) achieved Li 87.05%, Co 73.82%, Ni 86.27%, and Mn 99.12%. These results indicate that the leaching performance is strongly influenced by the acidity and chelating strength of the organic acids, and that the Taguchi method effectively identifies acid-specific parameters that balance metal recovery efficiency with experimental feasibility.
Table 10.
Optimal leaching conditions and total leaching efficiency of organic acids.
3.5. Analysis of the Cost of Citric Acid
In this study, the mass of NCM111 powder was fixed at 10 g per unit volume. For the citric acid leaching system, costs associated with materials, energy, and equipment were apportioned according to the material flow distribution, with 99.59% attributed to the final product and 0.41% to material loss, while all waste management costs were assigned to the material loss (Table 11).
Table 11.
Amounts of materials, energy, equipment, and solid residues involved in the citric acid leaching process.
The citric acid system required a total reagent input of 1025 g, comprising 10 g of NCM111 powder, 96.06 g of citric acid, 15 g of hydrogen peroxide, and 903.94 g of water. The process yielded 1020.82 g of product, resulting in a material loss of 4.18 g. Compared to tartaric and succinic acids (1020 g total input each), the citric acid system consumed marginally more material, primarily due to the higher oxidant requirement. Additionally, the leaching duration for citric acid (45 min) exceeded that of the alternative acids, contributing to elevated energy consumption and equipment depreciation. Specifically, total energy input amounted to 9.6 kWh, with 9.56 kWh incorporated into the product and 0.039 kWh constituting energy loss. The system cost associated with the temperature-controlled stirring apparatus was 3.96 TWD, of which 3.94 TWD was allocated to the product and 0.016 TWD to the material loss. Waste management costs were exclusively applied to the 4.18 g of material loss.
The economic assessment, based on material flow analysis, indicated that material costs accounted for the majority of total expenditure (79.09%), followed by energy costs (18.38%) and system costs (2%), with negligible waste-related costs (Table 12). Notably, the proportion of input costs incorporated into the final product was 99.47%, reflecting high material utilization efficiency. Despite the slightly higher material consumption and extended leaching duration relative to tartaric and succinic acids, the lower concentration of citric acid under the same solid-to-liquid ratio resulted in a total cost lower than that observed for tartaric acid.
Table 12.
The products obtained, corresponding material losses, and total expenses for citric acid leaching (in TWD and USD).
Overall, the citric acid leaching system demonstrates favorable economic performance, characterized by efficient material utilization, minimal energy and system losses, and limited waste generation. These findings suggest that citric acid can achieve effective metal recovery with cost efficiency superior to alternative organic acids under comparable operational conditions.
3.6. Analysis of the Cost of Tartaric Acid
For the tartaric acid leaching system, material, energy, and equipment costs were allocated according to the material flow distribution, with 99.61% assigned to the final product and 0.39% to material loss, while all waste management costs were attributed exclusively to material loss (Table 13).
Table 13.
Amounts of materials, energy, equipment, and solid residues involved in the tartaric acid leaching process.
At the same solid-to-liquid ratio (10 g L−1), tartaric acid consumed less oxidant than citric acid but an amount equal to that of succinic acid. Consequently, the total material usage was lower than that of citric acid and identical to succinic acid. The total reagent input for the tartaric acid system was 1020 g, comprising 10 g of NCM111 powder, 300.17 g of tartaric acid, 10 g of hydrogen peroxide, and 699.83 g of water. The final product yield was 1016.07 g, resulting in a material loss of 3.93 g. Since the leaching time of tartaric acid was identical to that of succinic acid, equipment depreciation and energy consumption were also equivalent. Specifically, the total energy consumption was 6.4 kWh, with 6.38 kWh incorporated into the product and 0.025 kWh lost. The system cost for the temperature-controlled stirring apparatus was 2.64 TWD, of which 2.63 TWD was allocated to the product and 0.01 TWD to material loss. Waste management costs applied solely to the 3.93 g of material loss.
Based on the material flow analysis, material costs accounted for the largest proportion of the total cost (94.44%), substantially higher than citric acid (79.09%) and succinic acid (78.21%) (Table 14). This is primarily due to the higher acid concentration in the tartaric acid system, which increased acid consumption and led to the highest total leaching cost (17.23 USD). Energy and system costs accounted for 4.63% and 0.5% of the total cost, respectively, while waste management costs were negligible. Notably, 99.63% of the input costs were effectively incorporated into the product, indicating high material utilization efficiency. However, compared with citric acid, the unit cost remains higher, suggesting that although high acid concentration can enhance leaching efficiency, it also imposes a greater economic burden.
Table 14.
The products obtained, corresponding material losses, and total expenses for tartaric acid leaching (in TWD and USD).
In summary, the tartaric acid leaching system exhibits high material utilization efficiency, but the elevated acid concentration results in a disproportionately high material cost, leading to a total cost higher than that of the citric acid and succinic acid systems. In practical applications, a balance between leaching efficiency and economic cost must be considered to achieve cost-effective metal recovery.
3.7. Analysis of the Cost of Succinic Acid
In the succinic acid leaching system, material, energy, and equipment costs were allocated according to the material flow distribution, with 99.58% assigned to the final product and 0.42% to material loss, while all waste management costs were attributed solely to material loss (Table 15). Given that the leaching parameters for succinic acid were comparable to those of tartaric acid, the resulting mass flow distribution closely resembled that of the tartaric acid system.
Table 15.
Amounts of materials, energy, equipment, and solid residues involved in the succinic acid leaching process.
The total reagent input for the succinic acid system was 1020 g, consisting of 10 g of NCM111 powder, 59.05 g of succinic acid, 10 g of hydrogen peroxide, and 940.96 g of water. The final product weight was 1015.07 g, corresponding to a material loss of 4.3 g. The total energy consumption was 6.4 kWh, of which 6.37 kWh was incorporated into the product and 0.027 kWh was lost. The system cost of the temperature-controlled stirring apparatus totaled 2.64 TWD, with 2.63 TWD allocated to the product and 0.011 TWD to material loss. Waste management costs applied exclusively to the 4.3 g of material loss.
Based on the material flow analysis, the total leaching cost using succinic acid was determined (Table 16). Material costs accounted for 77.88% of the total cost, followed by energy (19.40%) and system costs (2.11%), with waste-related costs being negligible. Compared with citric acid and tartaric acid, succinic acid exhibited the lowest total leaching cost due to its lower acid concentration and shorter leaching duration. Specifically, the cost to leach 10 g of Li-ion battery cathode powder using succinic acid was 4.11 USD. Notably, 99.58% of input costs were effectively incorporated into the product, reflecting high material utilization efficiency.
Table 16.
The products obtained, corresponding material losses, and total expenses for succinic acid leaching (in TWD and USD).
In summary, the succinic acid system provides a cost-effective alternative for Li-ion battery cathode leaching, achieving lower overall costs while maintaining high material utilization. This highlights the potential of succinic acid as an economically favorable option in comparison to citric acid and tartaric acid under comparable operational conditions.
3.8. Best Selection of Leaching Solution
Table 17 summarizes the leaching efficiencies for Li, Co, Ni, and Mn, along with the corresponding costs of the three organic acids evaluated in this study. Tartaric acid achieved the highest metal-specific leaching efficiencies among the organic acids (Li 87.29%, Co 80.52%, Ni 95.79%, Mn 99.65%), but its cost was 17.23 USD, considerably higher than that of citric acid (Li 81.66%, Co 76.05%, Ni 91.46%, Mn 98.94%; 6.50 USD) and succinic acid (Li 87.05%, Co 73.82%, Ni 86.27%, Mn 99.12%; 4.11 USD), indicating limited economic feasibility for large-scale industrial application. Succinic acid showed slightly lower leaching efficiencies than citric acid for some metals, but it had the lowest unit cost, high material utilization, and moderate energy consumption. From a cost–benefit perspective, succinic acid provides the most favorable economic performance, particularly in laboratory-scale operations where low reagent cost can significantly reduce overall expenses.
Table 17.
Comparison of Organic Acid Leaching with Reported Inorganic Acid Data.
For comparison, the leaching efficiencies of commonly used inorganic acids reported in the literature—such as sulfuric acid, hydrochloric acid, and nitric acid—are also presented in Table 10. These inorganic acids generally achieve slightly higher metal-specific leaching efficiencies (e.g., Li 90.60–96.41%, Co 77.66–82.53%, Ni 87.07–92.08%, Mn 95.42–99.99%) at substantially lower reagent costs (0.48–0.79 USD per batch). While inorganic acids demonstrate superior metal recovery, they are associated with greater environmental concerns, corrosivity, and safety risks. In contrast, organic acids provide a more environmentally friendly alternative with lower handling hazards, though sometimes at the expense of slightly lower leaching efficiency or higher cost.
It should be emphasized that these results are based on laboratory-scale experiments. In actual industrial applications, factors such as scale-up effects, acid regeneration, equipment efficiency, energy consumption, and market prices must be considered. For instance, even though tartaric acid shows high metal-specific leaching efficiencies, its higher cost may limit industrial adoption unless the value of the recovered metals justifies the expense. Therefore, while both citric acid and succinic acid have potential for industrial application, their competitiveness relative to inorganic acids should be evaluated through a comprehensive assessment under realistic industrial conditions to ensure economic feasibility and operational efficiency.
4. Conclusions
This study systematically evaluated the metal-specific leaching efficiencies and costs of lithium-ion battery cathode materials using citric, tartaric, and succinic acids under laboratory-scale conditions. For citric acid, the leaching efficiencies for Li, Co, Ni, and Mn were 81.66%, 76.05%, 91.46%, and 98.94%, respectively, with a cost of 6.50 USD to leach 10 g of cathode material. Tartaric acid achieved higher leaching efficiencies (Li 87.29%, Co 80.52%, Ni 95.79%, Mn 99.65%) but at a higher cost of 17.23 USD, while succinic acid offered leaching efficiencies of 87.05% (Li), 73.82% (Co), 86.27% (Ni), and 99.12% (Mn) at the lowest cost of 4.11 USD.
Although tartaric acid provided the highest metal-specific recovery, its elevated cost limits its industrial economic feasibility. Citric acid delivered a compromise between leaching performance and cost, whereas succinic acid demonstrated the most economically favorable option due to its low reagent cost and moderate energy consumption.
It should be noted that these conclusions are based on laboratory-scale experiments. In practical industrial operations, factors such as scale-up effects, acid regeneration, equipment efficiency, energy consumption, and market prices of recovered metals must be considered. Therefore, the selection of a leaching agent should be based on a comprehensive evaluation of metal-specific recovery rates, operational costs, and market conditions to ensure both economic viability and process efficiency.
Author Contributions
Conceptualization, J.-Z.W. and Y.-C.T.; methodology, J.-Z.W. and Y.-C.T.; validation, J.-Z.W. and Y.-C.T.; investigation, J.-Z.W. and Y.-C.T.; resources, J.-Z.W. and Y.-C.T.; data curation, J.-Z.W. and Y.-C.T.; writing—original draft preparation, J.-Z.W. and Y.-C.T.; writing—review and editing, J.-Z.W. and Y.-C.T.; supervision, Y.-H.S.; project administration, Y.-H.S. All authors have read and agreed to the published version of the manuscript.
Funding
This research received no external funding.
Data Availability Statement
The original contributions presented in this study are included in the article. Further inquiries can be directed to the corresponding author.
Acknowledgments
The authors wish to acknowledge the support of National Cheng Kung University’s Department of Resources Engineering and the Ministry of Science and Technology, R.O.C.
Conflicts of Interest
Author Yi-Chin Tang was employed by the China Steel Corporation. The remaining authors declare that the research was conducted in the absence of any commercial or financial relationships that could be construed as a potential conflict of interest.
References
- Yang, L.; Wang, Y.; Lian, Y.; Guo, Z.; Liu, Y.; Wu, Z.; Zhang, T. Key Factors, Planning Strategy and Policy for Low-Carbon Transport Development in Developing Cities of China. Int. J. Environ. Res. Public Health 2022, 19, 13746. [Google Scholar] [CrossRef] [Scilit]
- Wang, L.; Li, S.; Hu, L. Looking for the missing link: Driving restriction, car trips, and air pollution in Beijing. Cities 2023, 132, 104055. [Google Scholar] [CrossRef] [Scilit]
- Rivera, N.M. Air quality warnings and temporary driving bans: Evidence from air pollution, car trips, and mass-transit ridership in Santiago. J. Environ. Econ. Manag. 2021, 108, 102454. [Google Scholar] [CrossRef] [Scilit]
- Guo, J.X.; Zeng, Y.; Zhu, K.; Tan, X. Vehicle mix evaluation in Beijing’s passenger-car sector: From air pollution control perspective. Sci. Total Environ. 2021, 785, 147264. [Google Scholar] [CrossRef] [Scilit]
- Ping, L.; Wang, Y.; Lee, L.C.; Peng, B.; Ahmed, B.Y.; Zhang, H.; Ma, W. Cost–Benefit Analysis of Synergistic CO2 and NOx Energy-Efficient Technologies for the Road Transport Sector in China. Atmosphere 2022, 13, 1540. [Google Scholar] [CrossRef] [Scilit]
- Linda, J.; Pospíšil, J.; Köbölová, K. Identification of Wind-Induced Particle Resuspension in Urban Environment Using CFD Modelling. Atmosphere 2023, 14, 57. [Google Scholar] [CrossRef] [Scilit]
- Ho, Q.B.; Vu, H.N.K.; Nguyen, T.T.; Huynh, T.T.N. An Innovative Method for BTEX Emission Inventory and Development of Mitigation Measures in Developing Countries—A Case Study: Ho Chi Minh City, Vietnam. Int. J. Environ. Res. Public Health 2022, 19, 16156. [Google Scholar] [CrossRef] [Scilit]
- Randal, E.; Shaw, C.; McLeod, M.; Keall, M.; Woodward, A.; Mizdrak, A. The Impact of Transport on Population Health and Health Equity for Māori in Aotearoa New Zealand: A Prospective Burden of Disease Study. Int. J. Environ. Res. Public Health 2022, 19, 2032. [Google Scholar] [CrossRef] [Scilit]
- Lebrouhi, B.E.; Khattari, Y.; Lamrani, B.; Maaroufi, M.; Zeraouli, Y.; Kousksou, T. Key challenges for a large-scale development of battery electric vehicles: A comprehensive review. J. Energy Storage 2021, 44, 103273. [Google Scholar] [CrossRef] [Scilit]
- Cao, J.; Chen, X.; Qiu, R.; Hou, S. Electric vehicle industry sustainable development with a stakeholder engagement system. Technol. Soc. 2021, 67, 101771. [Google Scholar] [CrossRef] [Scilit]
- Shakeel, U. Electric vehicle development in Pakistan: Predicting consumer purchase intention. Clean. Responsible Consum. 2022, 5, 100065. [Google Scholar] [CrossRef] [Scilit]
- Yu, W.; Guo, Y.; Xu, S.; Yang, Y.; Zhao, Y.; Zhang, J. Comprehensive recycling of lithium-ion batteries: Fundamentals, pretreatment, and perspectives. Energy Storage Mater. 2023, 54, 172–220. [Google Scholar] [CrossRef] [Scilit]
- Dash, A. Adapting to electric vehicles value chain in India: The MSME perspective. Case Stud. Transp. Policy 2023, 12, 100996. [Google Scholar] [CrossRef] [Scilit]
- Wang, X.; Wang, J.; Xu, C.; Zhang, K.; Li, G. Electric Vehicle Charging Infrastructure Policy Analysis in China: A Framework of Policy Instrumentation and Industrial Chain. Sustainability 2023, 15, 2663. [Google Scholar] [CrossRef] [Scilit]
- Fastmarkets. Battery Materials. 2023. Available online: https://www.fastmarkets.com/newgen/battery-materials (accessed on 13 May 2023).
- Asia NIKKEI. Battery Costs Rise as Lithium Demand Outstrips Supply. 2022. Available online: https://asia.nikkei.com/Spotlight/Market-Spotlight/Battery-costs-rise-as-lithium-demand-outstrips-supply (accessed on 13 May 2023).
- Zhou, Z.; Huang, J.; Li, M.; Lu, Y. The Dynamic Evolution of the Material Flow of Lithium Resources in China. Sustainability 2022, 14, 16928. [Google Scholar] [CrossRef] [Scilit]
- Bajolle, H.; Lagadic, M.; Louvet, N. The future of lithium-ion batteries: Exploring expert conceptions, market trends, and price scenarios. Energy Res. Soc. Sci. 2022, 93, 102850. [Google Scholar] [CrossRef] [Scilit]
- Kaya, M. State-of-the-art lithium-ion battery recycling technologies. Circ. Econ. 2022, 1, 100015. [Google Scholar] [CrossRef] [Scilit]
- USGS. Mineral Commodity Summaries 2023. 2023. Available online: http://pubs.er.usgs.gov/publication/mcs2023 (accessed on 13 May 2023).
- Wu, X.; Ma, J.; Wang, J.; Zhang, X.; Zhou, G.; Liang, Z. Progress, Key Issues, and Future Prospects for Li-Ion Battery Recycling. Glob. Chall. 2022, 6, 2200067. [Google Scholar] [CrossRef] [Scilit]
- Manthiram, A. A reflection on lithium-ion battery cathode chemistry. Nat. Commun. 2020, 11, 1550. [Google Scholar] [CrossRef] [Scilit]
- Natarajan, S.; Krishnamoorthy, K.; Kim, S.J. Effective regeneration of mixed composition of spent lithium-ion batteries electrodes towards building supercapacitor. J. Hazard. Mater. 2022, 430, 128496. [Google Scholar] [CrossRef] [Scilit]
- Vanderbruggen, A.; Gugala, E.; Blannin, R.; Bachmann, K.; Serna-Guerrero, R.; Rudolph, M. Automated mineralogy as a novel approach for the compositional and textural characterization of spent lithium-ion batteries. Miner. Eng. 2021, 169, 106924. [Google Scholar] [CrossRef] [Scilit]
- Sankar, A.; Paramasivaganesh, K.; Parthibavarman, M.; Meganathan, K.L. ZIF-8 derived CuFe2O4 nanoparticles: Evolution of composition and microstructures, and their electrochemical performances as anode for lithium-ion batteries. Inorg. Chem. Commun. 2022, 140, 109424. [Google Scholar] [CrossRef] [Scilit]
- Mekonnen, Y.; Sundararajan, A.; Sarwat, A.I. A review of cathode and anode materials for lithium-ion batteries. In Proceedings of the SoutheastCon 2016, Norfolk, VA, USA, 30 March–3 April 2016; Available online: https://ieeexplore.ieee.org/abstract/document/7506639 (accessed on 13 May 2023).
- Hua, W.B.; Zheng, Z.; Li, L.Y.; Guo, X.D.; Liu, H.; Shen, C.H.; Wu, Z.G.; Zhong, B.H.; Huang, L. Synthesis of Nanostructured LiNi1/3Co1/3Mn1/3O2 by Ammonia-Evaporation-Induced Synthesis and Its Electrochemical Properties as a Cathode Material for a High-Power Li-Ion Battery. Acta Phys.-Chim. Sin. 2014, 30, 1481–1486. [Google Scholar]
- Sun, B.; Zhang, C.; Xu, Z.; Liu, S.; Yang, Q. Ultrasonic diagnosis of the nonlinear aging characteristics of lithium-ion battery under high-rate discharge conditions. J. Power Sources 2023, 567, 232921. [Google Scholar] [CrossRef] [Scilit]
- Zha, G.; Ouyang, C.; Yin, S.; Yao, K.; Agarwal, S.; Hu, N.; Hou, H. High Cycling Stability of the LiNi0.8Co0.1Mn0.1O2 Cathode via Surface Modification with Polyimide/Multi-Walled Carbon Nanotubes Composite Coating. Small 2021, 17, 2102981. [Google Scholar] [CrossRef] [Scilit]
- Rao, Q.S.; Liao, S.Y.; Huang, X.W.; Li, Y.Z.; Liu, Y.D.; Min, Y.G. Assembly of MXene/PP Separator and Its Enhancement for Ni-Rich LiNi0.8Co0.1Mn0.1O2 Electrochemical Performance. Polymers 2020, 12, 2192. [Google Scholar] [CrossRef] [Scilit]
- Xu, J.; Gao, P.; Qiu, X.; Li, H.; Zhuang, Q.; Wu, K.; Zheng, H. Kinetic and transport characteristics of LiNi0.8Co0.1Mn0.1O2 lithium-ion batteries. Solid State Ion. 2023, 395, 116216. [Google Scholar] [CrossRef] [Scilit]
- Xu, J.; Xie, S.; Lin, Z.; Qiu, X.; Wu, K.; Zheng, H. Studies of interfacial reaction characteristics for high power lithium-ion battery. Electrochim. Acta 2022, 435, 141305. [Google Scholar] [CrossRef] [Scilit]
- Ohzuku, T.; Makimura, Y. Layered Lithium Insertion Material of LiCo1/3Ni1/3Mn1/3O2 for Lithium-Ion Batteries. Chem. Lett. 2001, 30, 642–643. [Google Scholar] [CrossRef] [Scilit]
- He, L.P.; Sun, S.Y.; Mu, Y.Y.; Song, X.F.; Yu, J.G. Recovery of Lithium, Nickel, Cobalt, and Manganese from Spent Lithium-Ion Batteries Using l-Tartaric Acid as a Leachant. ACS Sustain. Chem. Eng. 2017, 5, 714–721. [Google Scholar] [CrossRef] [Scilit]
- Li, J.; Wang, G.; Xu, Z. Generation and detection of metal ions and volatile organic compounds (VOCs) emissions from the pretreatment processes for recycling spent lithium-ion batteries. Waste Manag. 2016, 52, 221–227. [Google Scholar] [CrossRef] [Scilit]
- Shuva, M.; Asw, K. Characterization of Spent Lithium Ion Batteries in The Process of Recovery of Value Metals. Mater. Sci. -Indian J. 2013, 9, 389–394. [Google Scholar]
- Yao, Y.; Zhu, M.; Zhao, Z.; Tong, B.; Fan, Y.; Hua, Z. Hydrometallurgical Processes for Recycling Spent Lithium-Ion Batteries: A Critical Review. ACS Sustain. Chem. Eng. 2018, 6, 13611–13627. [Google Scholar] [CrossRef] [Scilit]
- Soh, S.L.; Ong, S.K.; Nee, A.Y.C. Design for Disassembly for Remanufacturing: Methodology and Technology. Procedia CIRP 2014, 15, 407–412. [Google Scholar] [CrossRef] [Scilit]
- Zhang, T.; He, Y.; Ge, L.; Fu, R.; Zhang, X.; Huang, Y. Characteristics of wet and dry crushing methods in the recycling process of spent lithium-ion batteries. J. Power Sources 2013, 240, 766–771. [Google Scholar] [CrossRef] [Scilit]
- Zhu, S.G.; He, W.Z.; Li, G.M.; Zhou, X.; Zhang, X.J.; Huang, J.W. Recovery of Co and Li from spent lithium-ion batteries by combination method of acid leaching and chemical precipitation. Trans. Nonferrous Met. Soc. China 2012, 22, 2274–2281. [Google Scholar] [CrossRef] [Scilit]
- Sun, L.; Qiu, K. Vacuum pyrolysis and hydrometallurgical process for the recovery of valuable metals from spent lithium-ion batteries. J. Hazard. Mater. 2011, 194, 378–384. [Google Scholar] [CrossRef] [Scilit]
- Jha, M.K.; Kumari, A.; Jha, A.K.; Kumar, V.; Hait, J.; Pandey, B.D. Recovery of lithium and cobalt from waste lithium ion batteries of mobile phone. Waste Manag. 2013, 33, 1890–1897. [Google Scholar] [CrossRef] [Scilit]
- Kang, J.; Senanayake, G.; Sohn, J.; Shin, S.M. Recovery of cobalt sulfate from spent lithium ion batteries by reductive leaching and solvent extraction with Cyanex 272. Hydrometallurgy 2010, 100, 168–171. [Google Scholar] [CrossRef] [Scilit]
- Chen, X.; Guo, C.; Ma, H.; Li, J.; Zhou, T.; Cao, L.; Kang, D. Organic reductants based leaching: A sustainable process for the recovery of valuable metals from spent lithium ion batteries. Waste Manag. 2018, 75, 459–468. [Google Scholar] [CrossRef] [Scilit]
- Zhang, P.; Yokoyama, T.; Itabashi, O.; Wakui, Y.; Suzuki, T.M.; Inoue, K. Hydrometallurgical process for recovery of metal values from spent nickel-metal hydride secondary batteries. Hydrometallurgy 1998, 50, 61–75. [Google Scholar] [CrossRef] [Scilit]
- Joulié, M.; Laucournet, R.; Billy, E. Hydrometallurgical process for the recovery of high value metals from spent lithium nickel cobalt aluminum oxide based lithium-ion batteries. J. Power Sources 2014, 247, 551–555. [Google Scholar] [CrossRef] [Scilit]
- Lee, C.K.; Rhee, K.I. Reductive leaching of cathodic active materials from lithium ion battery wastes. Hydrometallurgy 2003, 68, 5–10. [Google Scholar] [CrossRef] [Scilit]
- Chen, X.; Ma, H.; Luo, C.; Zhou, T. Recovery of valuable metals from waste cathode materials of spent lithium-ion batteries using mild phosphoric acid. J. Hazard. Mater. 2017, 326, 77–86. [Google Scholar] [CrossRef] [Scilit]
- Zheng, Y.; Long, H.L.; Zhou, L.; Wu, Z.S.; Zhou, X.; You, L.; Yang, Y.; Liu, J.W. Leaching Procedure and Kinetic Studies of Cobalt in Cathode Materials from Spent Lithium Ion Batteries using Organic Citric acid as Leachant. Int. J. Environ. Res. 2016, 10, 159–168. [Google Scholar]
- Chen, X.; Luo, C.; Zhang, J.; Kong, J.; Zhou, T. Sustainable Recovery of Metals from Spent Lithium-Ion Batteries: A Green Process. ACS Sustain. Chem. Eng. 2015, 3, 3104–3113. [Google Scholar] [CrossRef] [Scilit]
- Li, L.; Dunn, J.B.; Zhang, X.X.; Gaines, L.; Chen, R.J.; Wu, F.; Amine, K. Recovery of metals from spent lithium-ion batteries with organic acids as leaching reagents and environmental assessment. J. Power Sources 2013, 233, 180–189. [Google Scholar] [CrossRef] [Scilit]
- Li, L.; Ge, J.; Chen, R.; Wu, F.; Chen, S.; Zhang, X. Environmental friendly leaching reagent for cobalt and lithium recovery from spent lithium-ion batteries. Waste Manag. 2010, 30, 2615–2621. [Google Scholar] [CrossRef] [Scilit]
- Sun, C.; Xu, L.; Chen, X.; Qiu, T.; Zhou, T. Sustainable recovery of valuable metals from spent lithium-ion batteries using DL-malic acid: Leaching and kinetics aspect. Waste Manag. Res. 2018, 36, 113–120. [Google Scholar] [CrossRef] [Scilit]
- Fan, E.; Yang, J.; Huang, Y.; Lin, J.; Arshad, F.; Wu, F.; Li, L.; Chen, R. Leaching Mechanisms of Recycling Valuable Metals from Spent Lithium-Ion Batteries by a Malonic Acid-Based Leaching System. ACS Appl. Energy Mater. 2020, 3, 8532–8542. [Google Scholar] [CrossRef] [Scilit]
- Li, L.; Fan, E.; Guan, Y.; Zhang, X.; Xue, Q.; Wei, L.; Wu, F.; Chen, R. Sustainable Recovery of Cathode Materials from Spent Lithium-Ion Batteries Using Lactic Acid Leaching System. ACS Sustain. Chem. Eng. 2017, 5, 5224–5233. [Google Scholar] [CrossRef] [Scilit]
- Li, L.; Qu, W.; Zhang, X.; Lu, J.; Chen, R.; Wu, F.; Amine, K. Succinic acid-based leaching system: A sustainable process for recovery of valuable metals from spent Li-ion batteries. J. Power Sources 2015, 282, 544–551. [Google Scholar] [CrossRef] [Scilit]
- Chen, X.; Zhou, T.; Kong, J.; Fang, H.; Chen, Y. Separation and recovery of metal values from leach liquor of waste lithium nickel cobalt manganese oxide based cathodes. Sep. Purif. Technol. 2015, 141, 76–83. [Google Scholar] [CrossRef] [Scilit]
- Chen, X.; Xu, B.; Zhou, T.; Liu, D.; Hu, H.; Fan, S. Separation and recovery of metal values from leaching liquor of mixed-type of spent lithium-ion batteries. Sep. Purif. Technol. 2015, 144, 197–205. [Google Scholar] [CrossRef] [Scilit]
- Chen, X.; Chen, Y.; Zhou, T.; Liu, D.; Hu, H.; Fan, S. Hydrometallurgical recovery of metal values from sulfuric acid leaching liquor of spent lithium-ion batteries. Waste Manag. 2015, 38, 349–356. [Google Scholar] [CrossRef] [Scilit]
- Tang, W.; Chen, X.; Zhou, T.; Duan, H.; Chen, Y.; Wang, J. Recovery of Ti and Li from spent lithium titanate cathodes by a hydrometallurgical process. Hydrometallurgy 2014, 147, 210–216. [Google Scholar] [CrossRef] [Scilit]
- Chen, L.; Tang, X.; Zhang, Y.; Li, L.; Zeng, Z.; Zhang, Y. Process for the recovery of cobalt oxalate from spent lithium-ion batteries. Hydrometallurgy 2011, 108, 80–86. [Google Scholar] [CrossRef] [Scilit]
- Joo, S.H.; Shin, D.J.; Oh, C.; Wang, J.P.; Senanayake, G.; Shin, S.M. Selective extraction and separation of nickel from cobalt, manganese and lithium in pre-treated leach liquors of ternary cathode material of spent lithium-ion batteries using synergism caused by Versatic 10 acid and LIX 84-I. Hydrometallurgy 2016, 159, 65–74. [Google Scholar] [CrossRef] [Scilit]
- Joo, S.H.; Shin, D.; Oh, C.; Wang, J.P.; Shin, S.M. Extraction of manganese by alkyl monocarboxylic acid in a mixed extractant from a leaching solution of spent lithium-ion battery ternary cathodic material. J. Power Sources 2016, 305, 175–181. [Google Scholar] [CrossRef] [Scilit]
- Wang, J.; Huo, X.; Zhang, F.; Wang, L.; Wang, X.; Li, J.; Yang, J. Separation of cobalt and lithium from spent LiCoO2 batteries using zeolite NaA and the resulting ion exchange product for N2/O2 separation. Sep. Purif. Technol. 2023, 313, 123449. [Google Scholar] [CrossRef] [Scilit]
- Jin, Y.; Wu, Y.; Cao, J.; Wu, Y. Adsorption behavior of Cr(VI), Ni(II), and Co(II) onto zeolite 13x. Desalination Water Treat. 2015, 54, 511–524. [Google Scholar] [CrossRef] [Scilit]
- Rodríguez-Iznaga, I.; Rodríguez-Fuentes, G.; Petranovskii, V. Ammonium modified natural clinoptilolite to remove manganese, cobalt and nickel ions from wastewater: Favorable conditions to the modification and selectivity to the cations. Microporous Mesoporous Mater. 2018, 255, 200–210. [Google Scholar] [CrossRef] [Scilit]
- Strauss, M.L.; Diaz, L.A.; McNally, J.; Klaehn, J.; Lister, T.E. Separation of cobalt, nickel, and manganese in leach solutions of waste lithium-ion batteries using Dowex M4195 ion exchange resin. Hydrometallurgy 2021, 206, 105757. [Google Scholar] [CrossRef] [Scilit]
- Cai, G.; Fung, K.Y.; Ng, K.M.; Wibowo, C. Process Development for the Recycle of Spent Lithium Ion Batteries by Chemical Precipitation. Ind. Eng. Chem. Res. 2014, 53, 18245–18259. [Google Scholar] [CrossRef] [Scilit]
- Wang, M.M.; Zhang, C.C.; Zhang, F.S. An environmental benign process for cobalt and lithium recovery from spent lithium-ion batteries by mechanochemical approach. Waste Manag. 2016, 51, 239–244. [Google Scholar] [CrossRef] [Scilit]
- Pegoretti, V.C.B.; Dixini, P.V.M.; Smecellato, P.C.; Biaggio, S.R.; Freitas, M.B.J.G. Thermal synthesis, characterization and electrochemical study of high-temperature (HT) LiCoO2 obtained from Co(OH)2 recycled of spent lithium ion batteries. Mater. Res. Bull. 2017, 86, 5–9. [Google Scholar] [CrossRef] [Scilit]
- Zheng, R.; Zhao, L.; Wang, W.; Liu, Y.; Ma, Q.; Mu, D.; Li, R.; Dai, C. Optimized Li and Fe recovery from spent lithium-ion batteries via a solution-precipitation method. RSC Adv. 2016, 6, 43613–43625. [Google Scholar] [CrossRef] [Scilit]
- Kang, J.; Sohn, J.; Chang, H.; Senanayake, G.; Shin, S.M. Preparation of cobalt oxide from concentrated cathode material of spent lithium ion batteries by hydrometallurgical method. Adv. Powder Technol. 2010, 21, 175–179. [Google Scholar] [CrossRef] [Scilit]
- Chen, X.; Fan, B.; Xu, L.; Zhou, T.; Kong, J. An atom-economic process for the recovery of high value-added metals from spent lithium-ion batteries. J. Clean. Prod. 2016, 112, 3562–3570. [Google Scholar] [CrossRef] [Scilit]
- ISO-14051; Environmental Management—Material Flow Cost Accounting—General Framework. International Organization for Standardization: Geneva, Switzerland, 2011. Available online: https://www.iso.org/obp/ui/#iso:std:iso:14051:ed-1:v1:en (accessed on 13 May 2023).
- Tang, Y.-C.; Wang, J.-Z.; Chou, C.-M.; Shen, Y.-H. Material and Waste Flow Analysis for Environmental and Economic Impact Assessment of Inorganic Acid Leaching Routes for Spent Lithium Batteries’ Cathode Scraps. Batteries 2023, 9, 207. [Google Scholar] [CrossRef] [Scilit]

Disclaimer/Publisher’s Note: The statements, opinions and data contained in all publications are solely those of the individual author(s) and contributor(s) and not of MDPI and/or the editor(s). MDPI and/or the editor(s) disclaim responsibility for any injury to people or property resulting from any ideas, methods, instructions or products referred to in the content. |
© 2025 by the authors. Licensee MDPI, Basel, Switzerland. This article is an open access article distributed under the terms and conditions of the Creative Commons Attribution (CC BY) license.