


Abstract
Distribution networks are facing increasing challenges due to the growing share of renewable energy sources (RESs), particularly because of the volatile nature of the available power. In addition to targeted grid expansion measures, the concept of a dynamic grid topology offers an additional layer of flexibility in the power system. Furthermore, there are concepts to use active coupling methods in distribution grids, such as medium-voltage direct current (MVDC) systems, which enable horizontal power flows between distribution grids and thus active control. This paper investigates the potential of combining dynamic passive and active coupling between two distribution grids. Particle swarm optimization (PSO) is used to determine both an optimized operating point of two MVDC interconnections as well as the most efficient switch configuration within both networks. The goal of the optimization is to reduce both network losses and power exchange between the different voltage levels. To evaluate its potential, various use cases are simulated using a representative feed-in of photovoltaics while considering grid constraints. Individual and combined impacts of dynamic AC switching and DC coupling are compared using a modified IEEE-123 test feeder. The results show a significant optimization potential, especially with an increase in RES penetration within the grid. In the best scenarios, the power losses can be decreased by 33.73% and the power transfer can be reduced by 8.75%.
1. Introduction
1.1. Motivation and Significance
Motivated by the increasing integration of renewable energy sources (RESs), numerous studies have investigated innovative grid management strategies for distribution system operators (DSOs), as well as the deployment of new technologies at lower levels of the electric power system. Modern distribution grids are no longer solely responsible for the distribution of electricity; they now play a critical role in managing the increasingly decentralized input from RESs. Unlike predictable load patterns, RES generation is inherently volatile and subject to significant temporal fluctuations. Furthermore, the placement and connection to a grid often depend on political and economic interactions between stakeholders, DSOs, and municipalities. Consequently, the uptake and location of the available power from RESs in a grid region may not be optimized for the demand of the customers, leading to reverse power flows to higher grid levels, especially during peak generation periods and dynamic load situations. This variability not only challenges local distribution networks, but also impacts grid infrastructure on higher voltage levels. To address these challenges, DSOs must implement measures that enhance the integration of RESs. One promising approach is the active coupling of the grid using medium-voltage direct current (MVDC) systems, which can redistribute surplus local energy. Additionally, strategies such as distribution network reconfiguration (DNR) and grid meshing offer the ability to optimize grid performance during specific timeframes and adapt to rapidly changing conditions, thereby supporting overall grid stability [1].
1.2. Literature Review
DNR has already been the subject of numerous studies, and several algorithms have been developed to solve DNR problems. In most studies, the main goal of DNR was to minimize losses, prevent overloads without costly network expansions, and achieve a stable voltage level. Jo et al. successfully introduced a hybrid genetic algorithm with the k-nearest neighbors approach to solve the non-linear DNR problem with respect to a radial topology and tested it on the IEEE-14 and IEEE-123 test feeders [2].
The particle swarm optimization (PSO) algorithm was applied by Olamaei, Niknam, and Gharehpetian in 2008 for DNR and optimized allocation of distributed generation (DG) units as a complement to central power systems [3]. While this study assumed centralized power plants would remain the primary energy source in the future, it demonstrated that dynamic network reconfiguration and DG dispatch using PSO could enhance overall network performance. Due to increasing decentralized power generation, Merzoug, Abdelkrim, and Larbi successfully applied a PSO algorithm to the IEEE-33 test feeder to find an optimized network configuration with reduced power losses and increased voltage stability [4]. Several additional studies have found the PSO algorithm to be highly suitable for solving the non-linear DNR problem in distribution networks represented by the IEEE-33 or IEEE-69 test feeder [5,6,7,8]. Niknam therefore developed a PSO-HBMO algorithm that combines PSO with honey bee mating optimization (HBMO), a swarm intelligence method modeled after the behavior of honey bees and their different functionalities in a colony [5]. Recent publications underline the effectiveness of meta-heuristic approaches for power system optimization [9,10].
In addition, the PSO method has been compared with other DNR-algorithms; for example, Kahouli et al. conducted a performance evaluation of the PSO and the genetic algorithm (GA) implemented in the IEEE-33 test feeder [8]. In this context, the PSO algorithm proved to be better suited for practical applications due to its faster convergence. Olamaei, Niknam, and Gharehpetian also stated that the PSO is precise and capable of being used in practical systems after comparing convergence times of solutions based on PSO, GA, tabu search (TS), and differential evolution (DE) [3]. Consequently, this paper will focus on adapting the PSO for solving the DNR problem for extended distribution grids.
Although high-voltage direct current (HVDC) systems are already globally established in high-voltage networks, there are currently very few implementations of MVDC systems integrated into distribution networks. MVDC systems offer a broad spectrum of potential applications, including use in rail transport, shipboard electrical systems, offshore energy collection, and power distribution networks [11]. Even in usage within a distribution network, there are a few different reasons why such a technology could be useful, as shown by Bathurst, Hwang, and Tejwani in their study of the MVDC as a new technology for distribution networks [12]. This can be summarized as an enhancement of transfer capacity, along with improved power quality and voltage regulation, achieved through the use of four-quadrant converters capable of supplying reactive power. An example of increasing the transfer capacity is the already realized angle-DC project, where existing AC lines were converted to DC operation, allowing a higher power rating [13]. In Zhuhai (China) the implementation of a three-terminal DC distribution system with a voltage of ±10 kV is used to perform investigations on higher power quality, RES uptake, and integration of energy storage and electric vehicles [14]. Kangsheng et al. describe the technical advantages of an MVDC system as an interconnection between two normally separated medium-voltage networks [15]. According to their mathematical calculations, MVDC has a high potential for improving networks with unbalanced load distribution, network congestion, and a substantial amount of RESs.
An important aspect to consider in grid coupling is the influence on the protection scheme, particularly the potential alteration of short-circuit currents. The combination of closed-ring structures and DG poses a significant challenge for traditional distance protections due to the two-sided feed-in to the fault location, and, additionally, relays can be blinded by a high share of DG [16]. Biller and Jaeger are presenting a variety of possible solutions such as relocating protection devices, fault current limiters, and also the use of MVDC [17].
1.3. Contribution
As discussed in Section 1.2, PSO is widely used and modified for the DNR optimization problem. However, a research gap appears when integrating active and passive couplings in distribution grids simultaneously. In this study, a modified PSO algorithm is used to compare active and passive grid coupling scenarios in distribution grids. Specifically, potential and possible interactions in combining active and passive grid coupling concurrently will be examined. Therefore, AC switches and MVDC connections are simulated in a modified IEEE benchmark medium-voltage network, and network states are optimized. Both technologies are used individually and in combination within different scenarios. The optimization problem is characterized by a multi-criteria PSO including binary and continuous PSO. The optimization goals are reduction in network losses or load flow exchange between the high-voltage and medium-voltage networks or a combination of both. Furthermore, the installed photovoltaic (PV) feed-in is increased in the scenarios to determine possible impacts due to increasing RES uptake.
The following aspects underline this paper’s significant contributions:
- Implementation and application of a multi-objective PSO algorithm for extended hybrid distribution grids;
- Presenting the potential in combining active and passive grid coupling;
- Detailed analysis of reduction in network losses;
- Detailed analysis of power transfer minimization between medium- and high-voltage grid;
- Consideration of the increasing RES influence on the aforementioned analyses.
2. Problem Formulation
2.1. Objective Function
A PSO-based DNR algorithm has been developed by the authors in previous studies, details of which can be found in [18,19]. To compare the results within each iteration of the PSO, this study also employs an approach considering multiple sub-objectives with , given in Equation (1). This approach facilitates the incorporation of multiple criteria in evaluating the identified sub-objective function and allows these criteria to be weighted differently by their weighting factors .
2.2. Sub-Objectives
A detailed description of the sub-objectives implemented can be found in [18]. Two sub-objectives, which are particularly relevant for the different scenarios, are the power transfer optimization and the minimization of power losses . To achieve better comparability and balance of these two parameters, their weighting factors are normalized at the beginning of each time step. The value of the non-optimized simulation result serves as the normalization parameter so that the final parameter is calculated by Equation (2).
where is the parameter set in the configuration at the beginning of the simulation. Thus, the evaluation of each individual criterion includes a relative change from the initial state , and by selecting the parameter , a weighting between different sub-objectives can be chosen.
2.2.1. Sub-Objectives with Fixed Weighting Factors
For all scenarios considered in this paper, some sub-objectives have a constant weighting factor. The first factor is the convergence of the MATPOWER [20] load flow calculation , following Equation (3).
This is necessary to ensure that all topology changes always lead to valid grid states. Since particle positions without a converging load flow calculation are not allowed, the weighting factor is assumed to be infinite.
Grid separation or islanding of any grid section must also be prevented at all times (). The sub-objective function is given by Equation (4).
Thus, if the MATPOWER function returns an array with a dimension higher than one, an invalid topology is given ( ).
Finally, a weighting of is used to prevent congestion, which could occur due to violated nodal voltage limits or by exceeding the maximum transmission capacity of lines or transformers. The sub-objective is calculated according to Equation (5), including the percentage voltage violation at node i and the percentage exceeding of apparent power across line l and generator g , respectively.
These three sub-objectives are included in all scenarios with the fixed weighting factors described in Section 2.3.
2.2.2. Open-Ring Operation
Open-ring operation is a crucial criterion for many DSOs in the operation of their networks due to the current protection scheme and the ease of limiting short-circuit currents. On the other hand, it limits the amount of valid network states which can be found by DNR. To compare both operation modes and examine the potential in DNR without the traditional mitigation of closed-ring structures, the simulation is carried out twice, first with the setting to prevent a closed-ring structure and second with , which allows closed-ring structures. Both MVDC connections are implemented by a virtual generator on each side, enabling the power output on one side to be determined by the input on the other side and accounting for losses. Due to this, the MVDC connections are not considered as a line while verifying the ring structure. In the case that the two networks are connected via two AC switches, they are considered as a line.
The sub-objective function for the open-ring operation is calculated by Equation (6). is the number of medium-voltage lines connecting two nodes, including the high-voltage/medium-voltage transformers, represents the number of parallel lines connecting the same nodes, and is the number of medium-voltage nodes. When and , there are no closed rings in the grid.
2.2.3. Power Transfer Optimization
Minimizing power transfer between medium-voltage and high-voltage grids ensures that the power generated from RESs is distributed mainly within the MV network, reducing the need for double transfer. For evaluation, the sub-objective function , calculated by Equation (7), is the sum of the apparent power of each transformer t.
Depending on the scenario, the power transfer optimization can be activated () or deactivated ().
2.2.4. Minimization of Power Losses
With weighting , the minimization of power losses can be taken into account. Therefore, the losses of all lines l and transformers t are summed and complemented by the losses of the MVDC system. Thus, the power losses can be calculated by Equation (8).
2.3. Parameter Configuration of Weighting Factors
The configuration for all sub-objectives can be found in Table 1. For the parameter configuration of the sub-objectives, the gradation with and ensures that only valid network states in a non-islanded network are considered. The sub-objective is weighted 1000 times higher than the corresponding main objective functions and to ensure, by simple comparison, that for the selected network in this paper, if the absolute value of the objective function is below the value 1000, no congestion occurs in the network at any timestep.
Table 1.
Parameter configuration of the weighting factors for the sub-objectives.
3. Methodology
3.1. Particle Swarm Optimization
Particle swarm optimization (PSO) is based on social interactions such as the behavior of a flock of birds searching for food [21]. Each individual, represented by a particle, is striving for the best location while its own movement and the movement of the others are considered for the next movement. As a result, the whole swarm is moving towards the best location. PSO is a meta-heuristic optimization method that is particularly well suited for solving nonlinear and multidimensional optimization problems [22]. Since its initial introduction by Eberhart and Kennedy in 1995 [23], PSO has undergone continuous development and has been implemented in numerous variations [21]. The equations in Section 3.2, Section 3.3 and Section 3.4 are based on the methodology of [23] and on further developments given in the references. In general, a distinction can be made between continuous PSO, in which particles move within a defined solution space, and binary PSO, in which particles can assume values of either 0 or 1.
3.2. Properties of Particles
Each particle, used for the optimization and indexed by i, has a total of four properties. Firstly, the position vector in Equation (9) describes the current position within the d-dimensional solution space.
The initial position of each particle is generated randomly within the solution space. This solution space is defined in Equation (10) by a lower bound and an upper bound for each decision variable.
The change in position of a particle is governed by its velocity vector shown in Equation (11).
Finally, each particle contains information on its best position so far defined in Equation (12).
To evaluate social influence, the best position of all particles is needed, which is called the global best position defined in Equation (13).
3.3. Workflow of the PSO Algorithm
During the optimization process of the PSO for all particles, several iterations are conducted to find the best position. Each iteration always follows the same workflow:
- Initialization of starting positions;
- Iterations:
- (a)
- Evaluation of the objective function;
- (b)
- If better than : ;
- (c)
- If better than : ;
- (d)
- Updating the velocities ;
- (e)
- Updating the positions ;
- (f)
- If termination criterion is fulfilled: abort the iteration;
- Return as the solution of the optimization.
In this study, the termination criterion is either a maximum number of 50 iterations or the absence of any improvement in the global best position over the last 20 iterations.
3.4. Updating the Decision Variables
3.4.1. Continuous-PSO
The PSO update scheme for continuous parameters is implemented according to Equation (14).
The new position is thus determined on the basis of the previous position and the newly computed velocity of the particle. Therefore, the new velocity is calculated in each step using Equation (15).
Firstly, the velocity of the previous step is continued (). With the inertia weight , the influence of the current velocity is determined. This first term is called the component of the inertial force. The second term, the cognitive component, points in the direction of the best local solution of the corresponding particle. Finally, the third term considers the direction of the best global solution. It is responsible for the interaction between all particles and is thus named the social component. The second and third terms are multiplied by acceleration coefficients and , allowing a weighting between the cognitive and social components. The random variables and are uniformly distributed in the interval (0, 1) and introduce a stochastic influence on the search behavior.
If one or more bounds of individual decision variables according to Equation (10) are exceeded, the corresponding values are set to their violated boundary value .
3.4.2. Binary PSO
The binary PSO update scheme is implemented analogously to [24]. With this kind of binary PSO, the velocity can be seen as the change rate of the particles, similar to the continuous PSO. For implementation, two additional velocity vectors and are introduced. contains the probability for a change from 1 to 0 for the bits of a particle i, and so does the opposite. Consequently, the velocity of the decision variable j for particle i is a function of its current position as given in Equation (16).
The velocity vectors and are updated according to Equations (17) and (18) depending on the current velocity, the best position of the particle, and the best global position .
The auxiliary vectors in Equations (19) and (20) are needed to increase or decrease the values of the velocity vectors and . This occurs as a function of the positions of and .
Similar to continuous PSO, is the inertia weight, and are random variables in the interval of , and and are acceleration coefficients for weighting. To describe it in words, this means that the probability that a bit changes its value to 1 increases if due to and vice versa. As a logical consequence, it must be set as and to change the probability of a bit turning into 0 in the other direction. To update the position of a particle, the normalized velocity is calculated with the help of the sigmoid function Equation (21).
With the help of a random variable in the interval of , the position of each bit j of the particle i can be determined following Equation (22).
3.5. Parameterization of the PSO
The search behavior of the PSO can be influenced primarily by the parameter swarm size, number of iterations, inertia, and acceleration coefficients. In terms of the convergence performance of the particle swarm optimization, the optimal values of the parameters depend highly on the specific optimization problem itself and cannot generally be calculated according to [21]. Table 2 shows the parameters chosen for this study. The selection is made based on the ranges of values proposed in [21] and manually adjusted based on empirical experience [18].
Table 2.
Parameter configuration of the PSO settings.
4. Case Study
4.1. Modified IEEE-123 Test Feeder
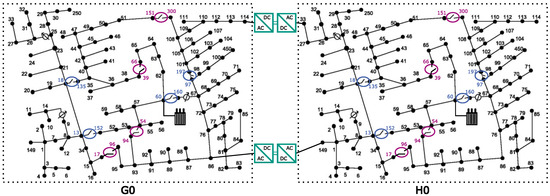
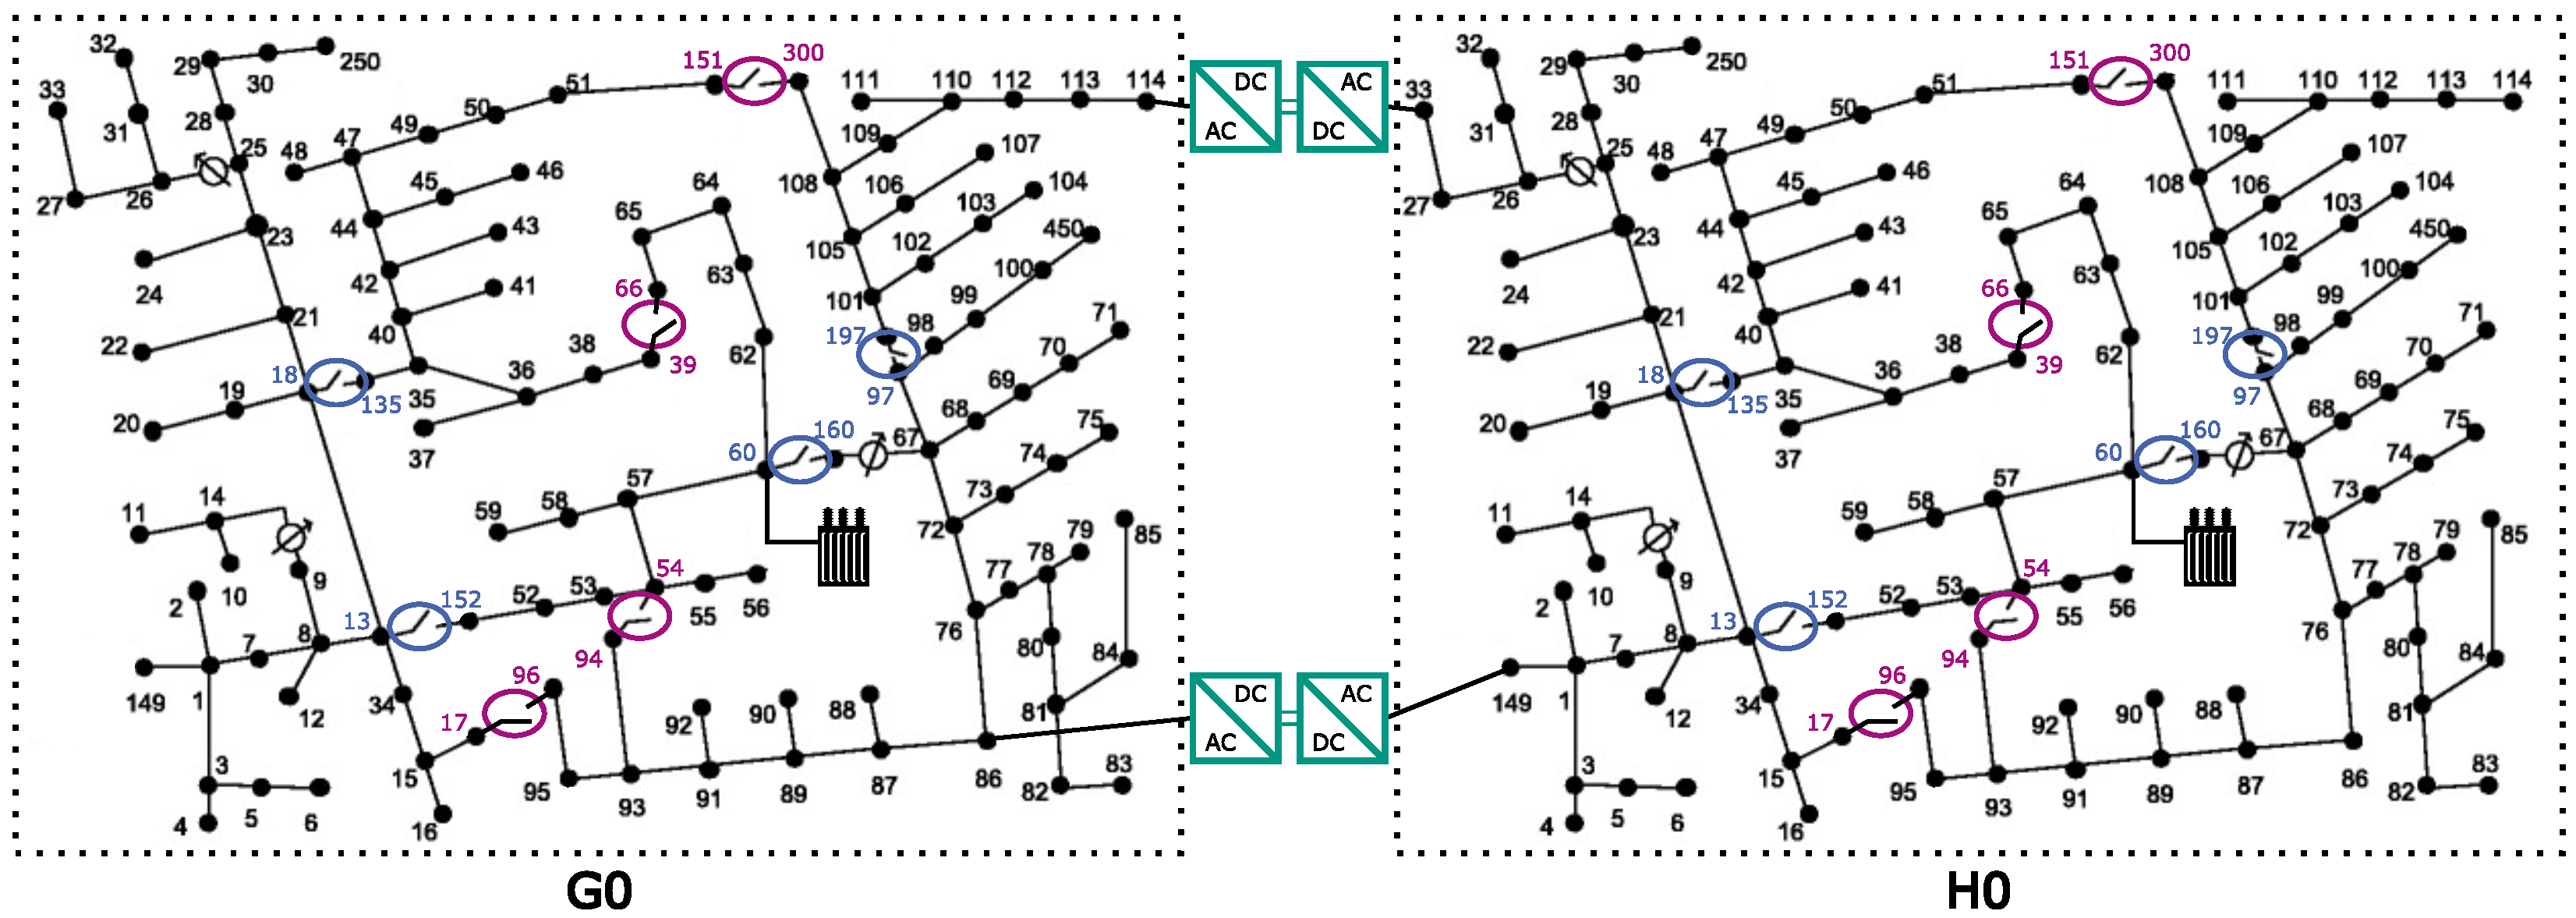
Figure 1 shows the modified and doubled IEEE-123 test feeder used in this paper. The double test feeder contains two single IEEE-123 test feeders [25] with an equivalent topology, which is suitable for testing optimal configuration procedures [26]. Following a similar approach to [2], the original single-phase branches of the IEEE-123 test feeder were converted to fully three-phase lines for the entire grid. In addition to the existing switches in the original IEEE-123 test feeder, two additional switches connecting buses 39 to 66 and 17 to 96 are added. The additional switches are divided into initially closed and initially open switches. The configuration is shown in Table 3. To allow for comparison of different load profiles, the test feeder was duplicated, resulting in two parallel grids with identical topology but different load profiles. The load profiles are represented by the load profiles “G0” and “H0”, published by the German Association of Energy and Water Industries (BDEW [27]). This data source includes data for a time-dependent load scaling within a whole year with a time interval of 15 min. The “H0” provides load data for households, so it is used in this paper to represent a grid of a typical residential area. For the other grid, the “G0” data are used, which include various commercial customers. Consequently, the two parts of the expanded test feeder are referred to as the G0-subgrid and the H0-subgrid, as shown in Figure 1. The installed capacity on each node is given by the IEEE-123 test feeder. Since the load on weekdays differs from that on weekends, Friday and Saturday were chosen for the simulation, matching the PV feed-in presented in Section 4.3.
Figure 1.
Modified and doubled IEEE-123 test feeder connected with two back-to-back MVDC systems (green), initially closed switches (blue) and initially opened switches (pink).
Table 3.
Switch configuration for the test grid visualized in Figure 1.
4.2. Grid Connections
The two subgrids are interconnected via two links: one connecting G114 to H33 and the other connecting G84 to H149. These connections are realized as either MVDC systems with back-to-back converters or simple initially open AC switches.
The lines between the coupling points are assumed to be short. So, in case of AC switches, there are no power losses to be considered. For the MVDC back-to-back connections, hereafter referred to as DC connections, the power losses are calculated for each converter individually. Analogously to [19], a constant loss factor of per converter is assumed. If a power P is injected into the DC connection, the DC losses are calculated by Equation (23).
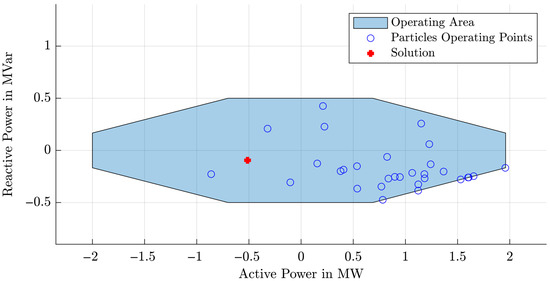
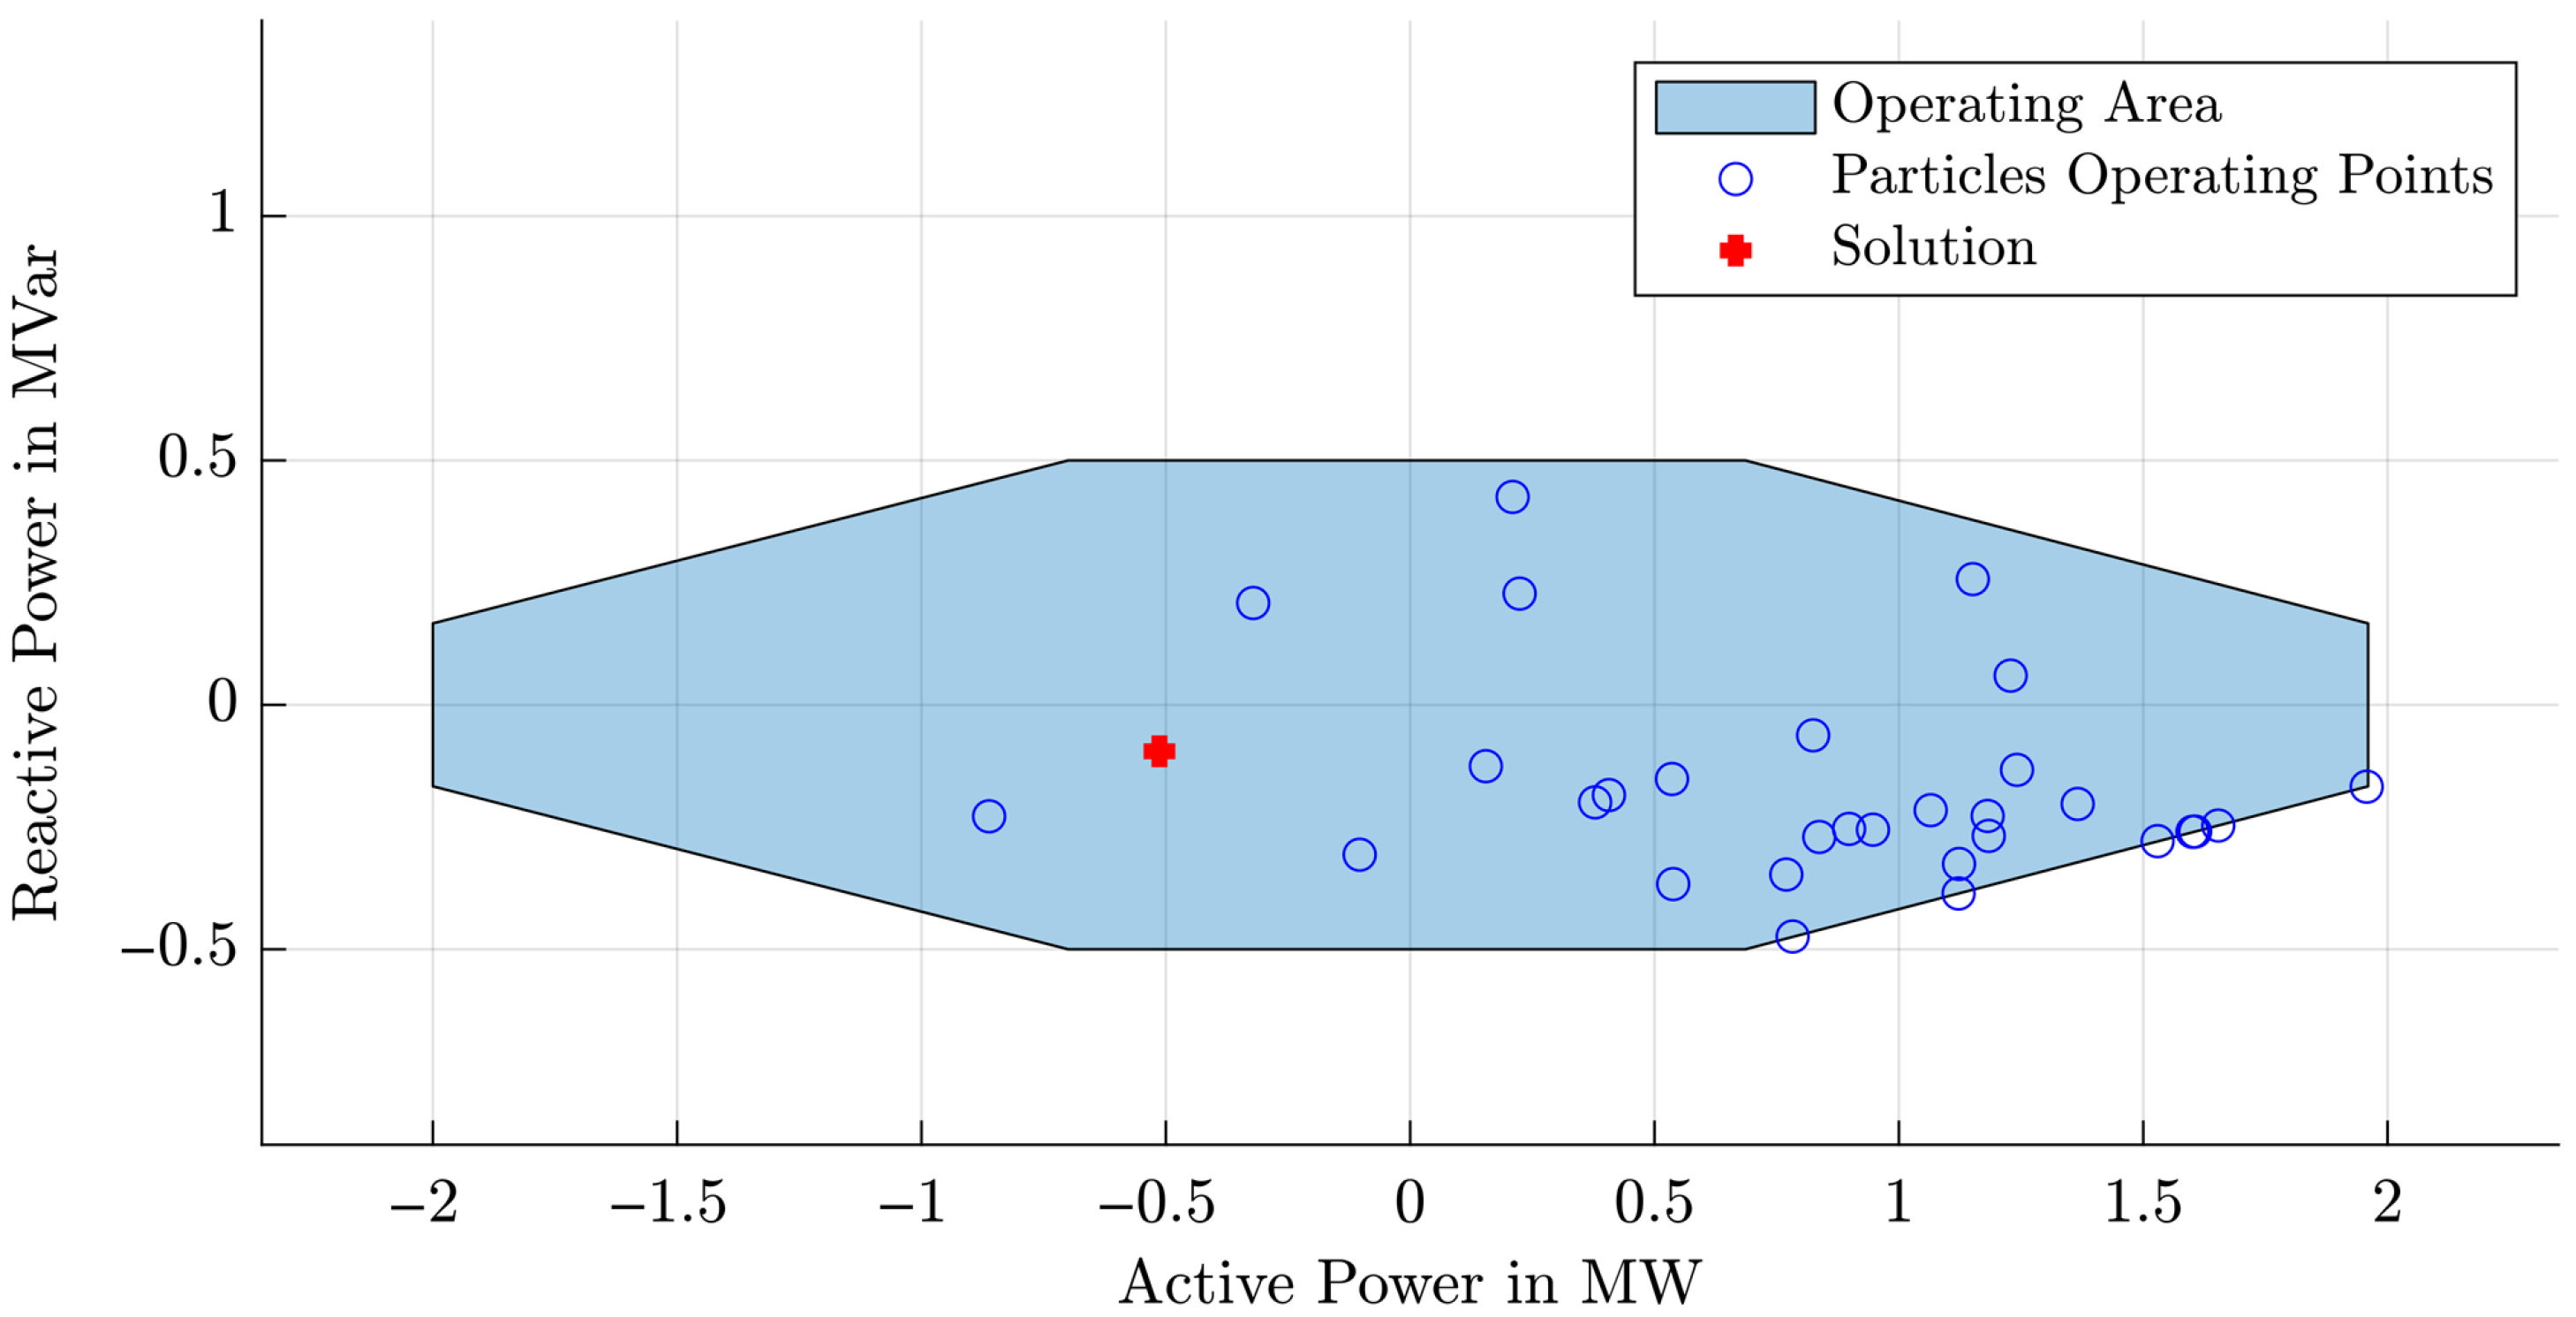
A random particle, containing the active power and reactive power within the feasible operation region (FOR) of Figure 2, is generated on the G-grid-side of the DC connection by the PSO algorithm. Due to energy conservation, the active power on the other side of the DC connections is coupled to the power according to Equation (24).
Figure 2.
Working area and particle positions of an MVDC power station for a exemplary particle and iteration.
A negative value of represents an active power transmission from the G-grid into the H-grid. Accordingly, a positive value for means active power transmission in the opposite direction. This also has to be considered for the loss calculation, such that Equation (23) must be distinguished into Equation (25).
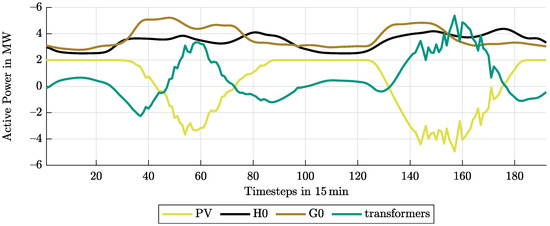
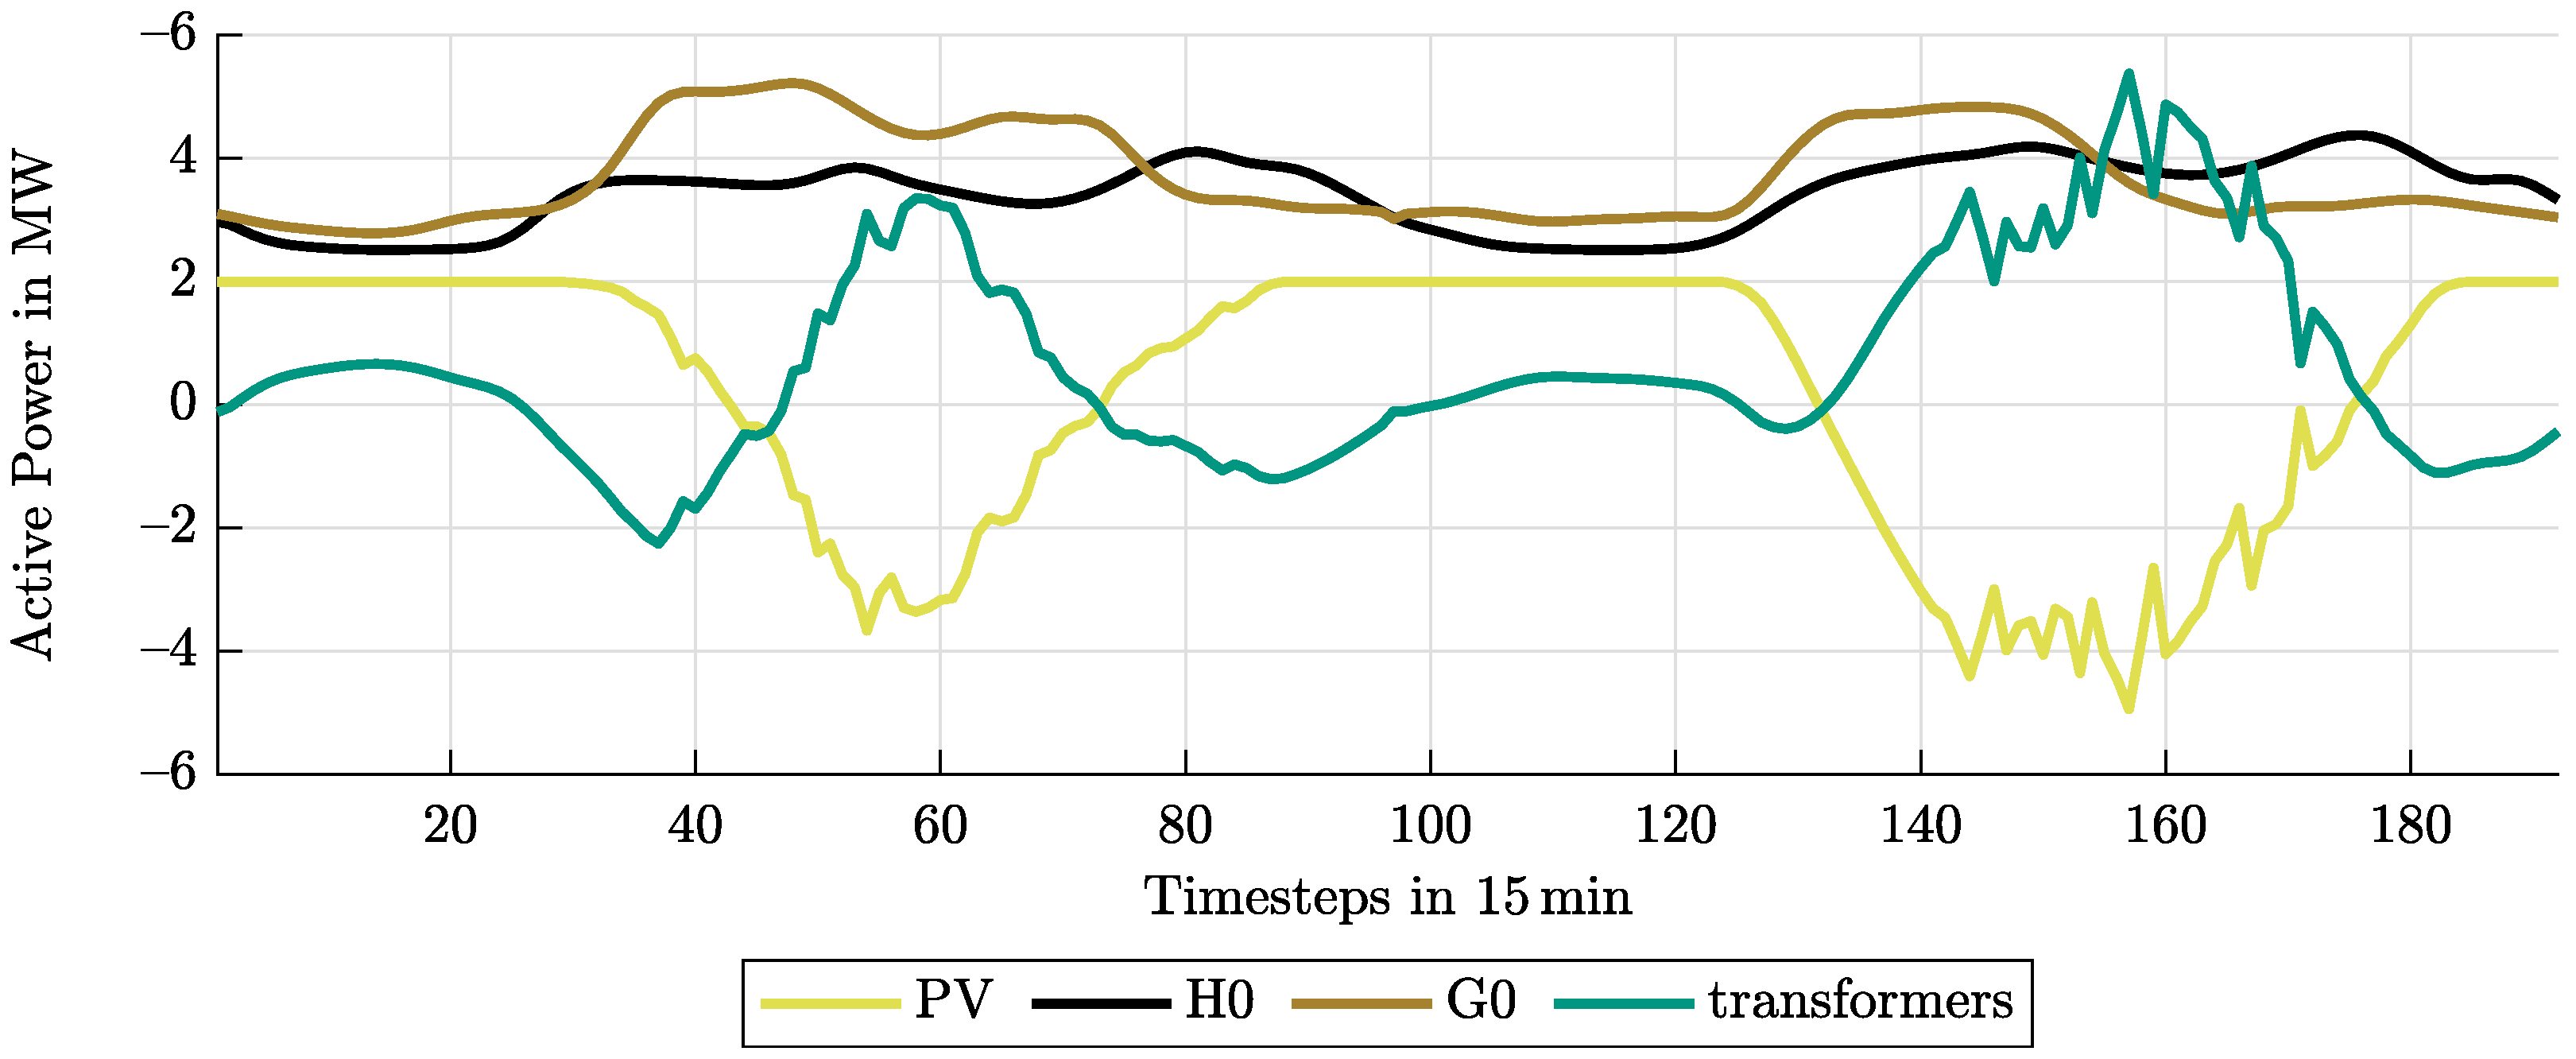
The FOR shown in Figure 2 is chosen based on the peak load in one part of the grid, which is for the G-grid-side at timestep 48 (see Figure 3). The maximum active power is set to 2 to enable a power transfer higher than half of the maximum load by a single MVDC system. For most consumers in the IEEE-123 test feeder, the absolute value of reactive power is approximately half of the amount of active power. However, since this paper focuses on the transmission of active power, the maximum reactive power of an MVDC converter has been limited to one quarter of the active power, which is MVAr. Analogous to the approach presented in [19], the FOR has a polygonal shape, which is a common specification for MVDC converters.
Figure 3.
Profiles of loads, PV feed-in, and total HV-feed-in for the considered time period in the initial grid configuration without any optimization.
Referring to Section 3.4.1, the update process of the DC working area is implemented as a continuous PSO where, in general, the position of a particle is determined by the active and reactive power given in Equation (26).
4.3. Variable PV Feed-In
Recent research papers show particular interest in PV penetration levels and the influence of PV feed-in, especially on distribution grids [28,29,30]. To add PV profiles to the test feeder buses in this study, a procedure similar to [31] is chosen. The PV feed-in is distributed randomly across the grid among individual customers. In the H0-subgrid, a single customer is modeled with a peak load of 10 kW and 5 kVAr, while in the G0-subgrid, a single customer has a peak load of 20 kW and 10 kVAr. So, the number of customers connected to each bus results from the spot load given in the original IEEE-123 test feeder. In total, there are 347 customers in the H0-grid and 172 in the G0-subgrid. If the spot load divided by the load of one customer is not an integer, then the number of customers is rounded off. Each customer can have a PV feed-in depending on their maximum load. For the lower boundary, the peak load of the customer is used, and the upper boundary is twice the peak load. The PV size per customer is therefore between 10 kWp and 20 kWp in the H0-subgrid, and between 20 kWp and 40 kWp in the G0-subgrid. These boundaries were chosen so that each customer can have a PV feed-in which is higher than his own consumption, and the grid is thus dominated by PV feed-in at specific time steps. The exact PV size of each customer is generated randomly. For different scenarios, the PV penetration can be varied from 0%, which means that there are no customers with PV, to 100%, which means every customer has PV. For values between 0% and 100%, the customers with PV are randomly selected all over the grid. Additionally, a penetration higher than 100% can be set, which simply scales the size of each PV feed-in. For example, a 200% PV penetration provides twice the power of 100% without affecting the distribution over the grid. To generate a realistic feed-in curve, the measured data of a network operator in south-west Germany from the year 2022 were used for scaling the PV feed-in. A period of two days (Friday and Saturday) in early May was chosen due to the high PV utilization.
4.4. Scenario Overview
To compare active and passive grid coupling and to find interactions and benefits in a simultaneous operation, a few different scenarios were conducted. Both technologies were initially applied independently (Scenario 1: MVDC, Scenario 2: AC switches), and subsequently in combination (Scenario 3). Each of these three scenarios contains three sub-scenarios ((a), (b), and (c)) with different sub-objectives, as shown in Table 4. All these scenarios were simulated with PV penetrations of 0%, 50%, 100%, and 200%. The investigations were conducted twice, first with the prohibition of closed-ring structures and then with ring branches allowed, which does not affect scenario 1, as written above.
Table 4.
Power transfer reduction for different scenarios; ring branches not allowed.
5. Results
Figure 3 shows the load profile with a PV penetration of 100% over two days in 15 min time steps. It can be seen that on both days, the PV feed-in exceeds the total power of the loads, resulting in reverse power flow.
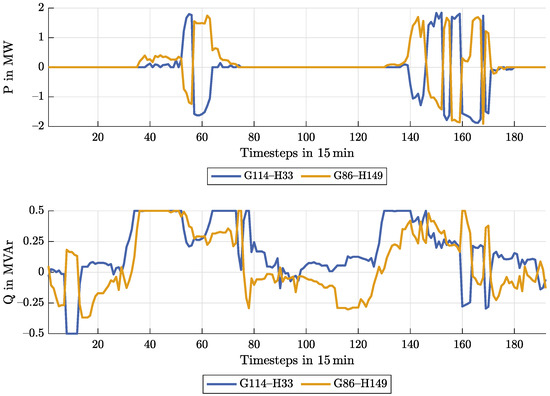
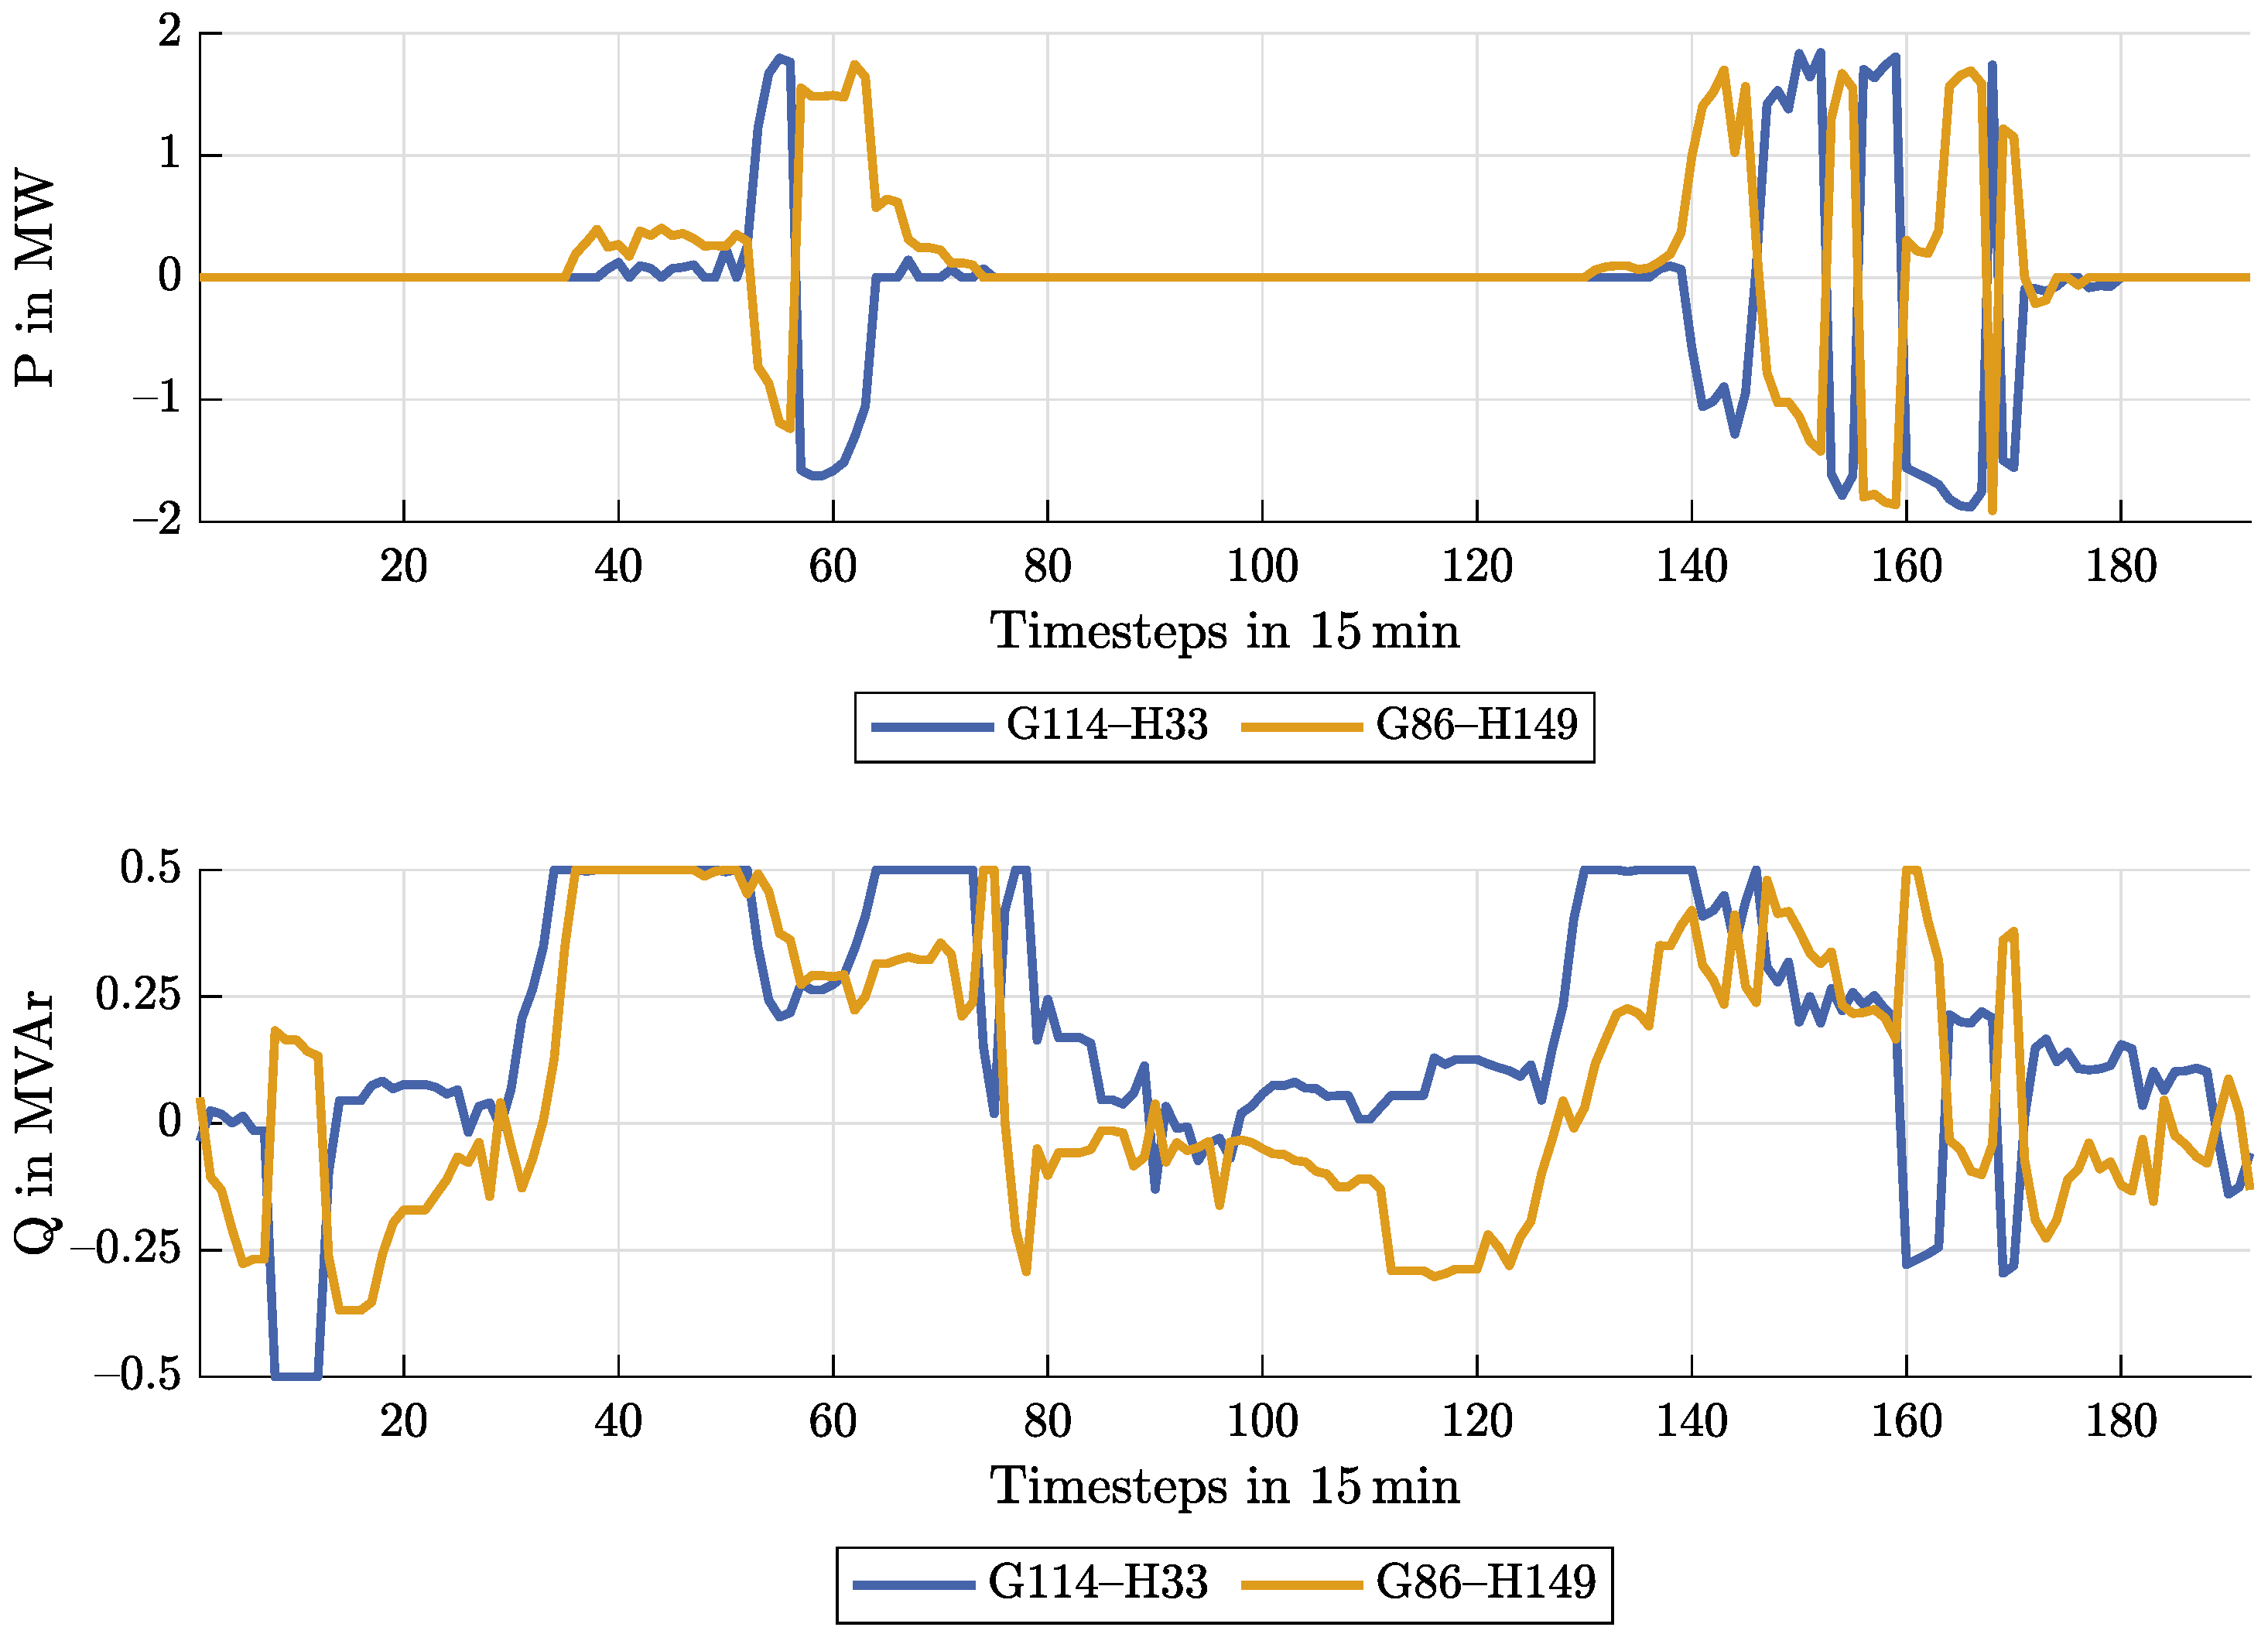
The operating point of the MVDC connections for Scenario 1 (a) with a 100% PV penetration is presented in Figure 4. While aiming for a loss reduction and power transfer minimization, it is clearly evident that the MVDC connections are transferring active power during PV feed-in. According to Table 5, the transmitted power has been reduced by 4.53% compared to the initial value, while the power losses have been reduced by 21.42% as shown in Table 6. Both results indicate a significant improvement in the power system efficiency.
Figure 4.
Exemplary profiles of the active and reactive power of the MVDC connections for 100% PV, no AC switches, ring branches not allowed, and optimization with .
Table 5.
Power transfer compared to non-optimized original topology in % for different scenarios; ring branches not allowed.
Table 6.
Power losses compared to non-optimized original topology in % for different scenarios; ring branches not allowed.
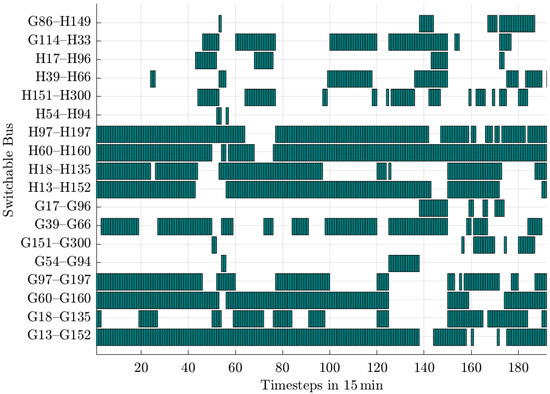
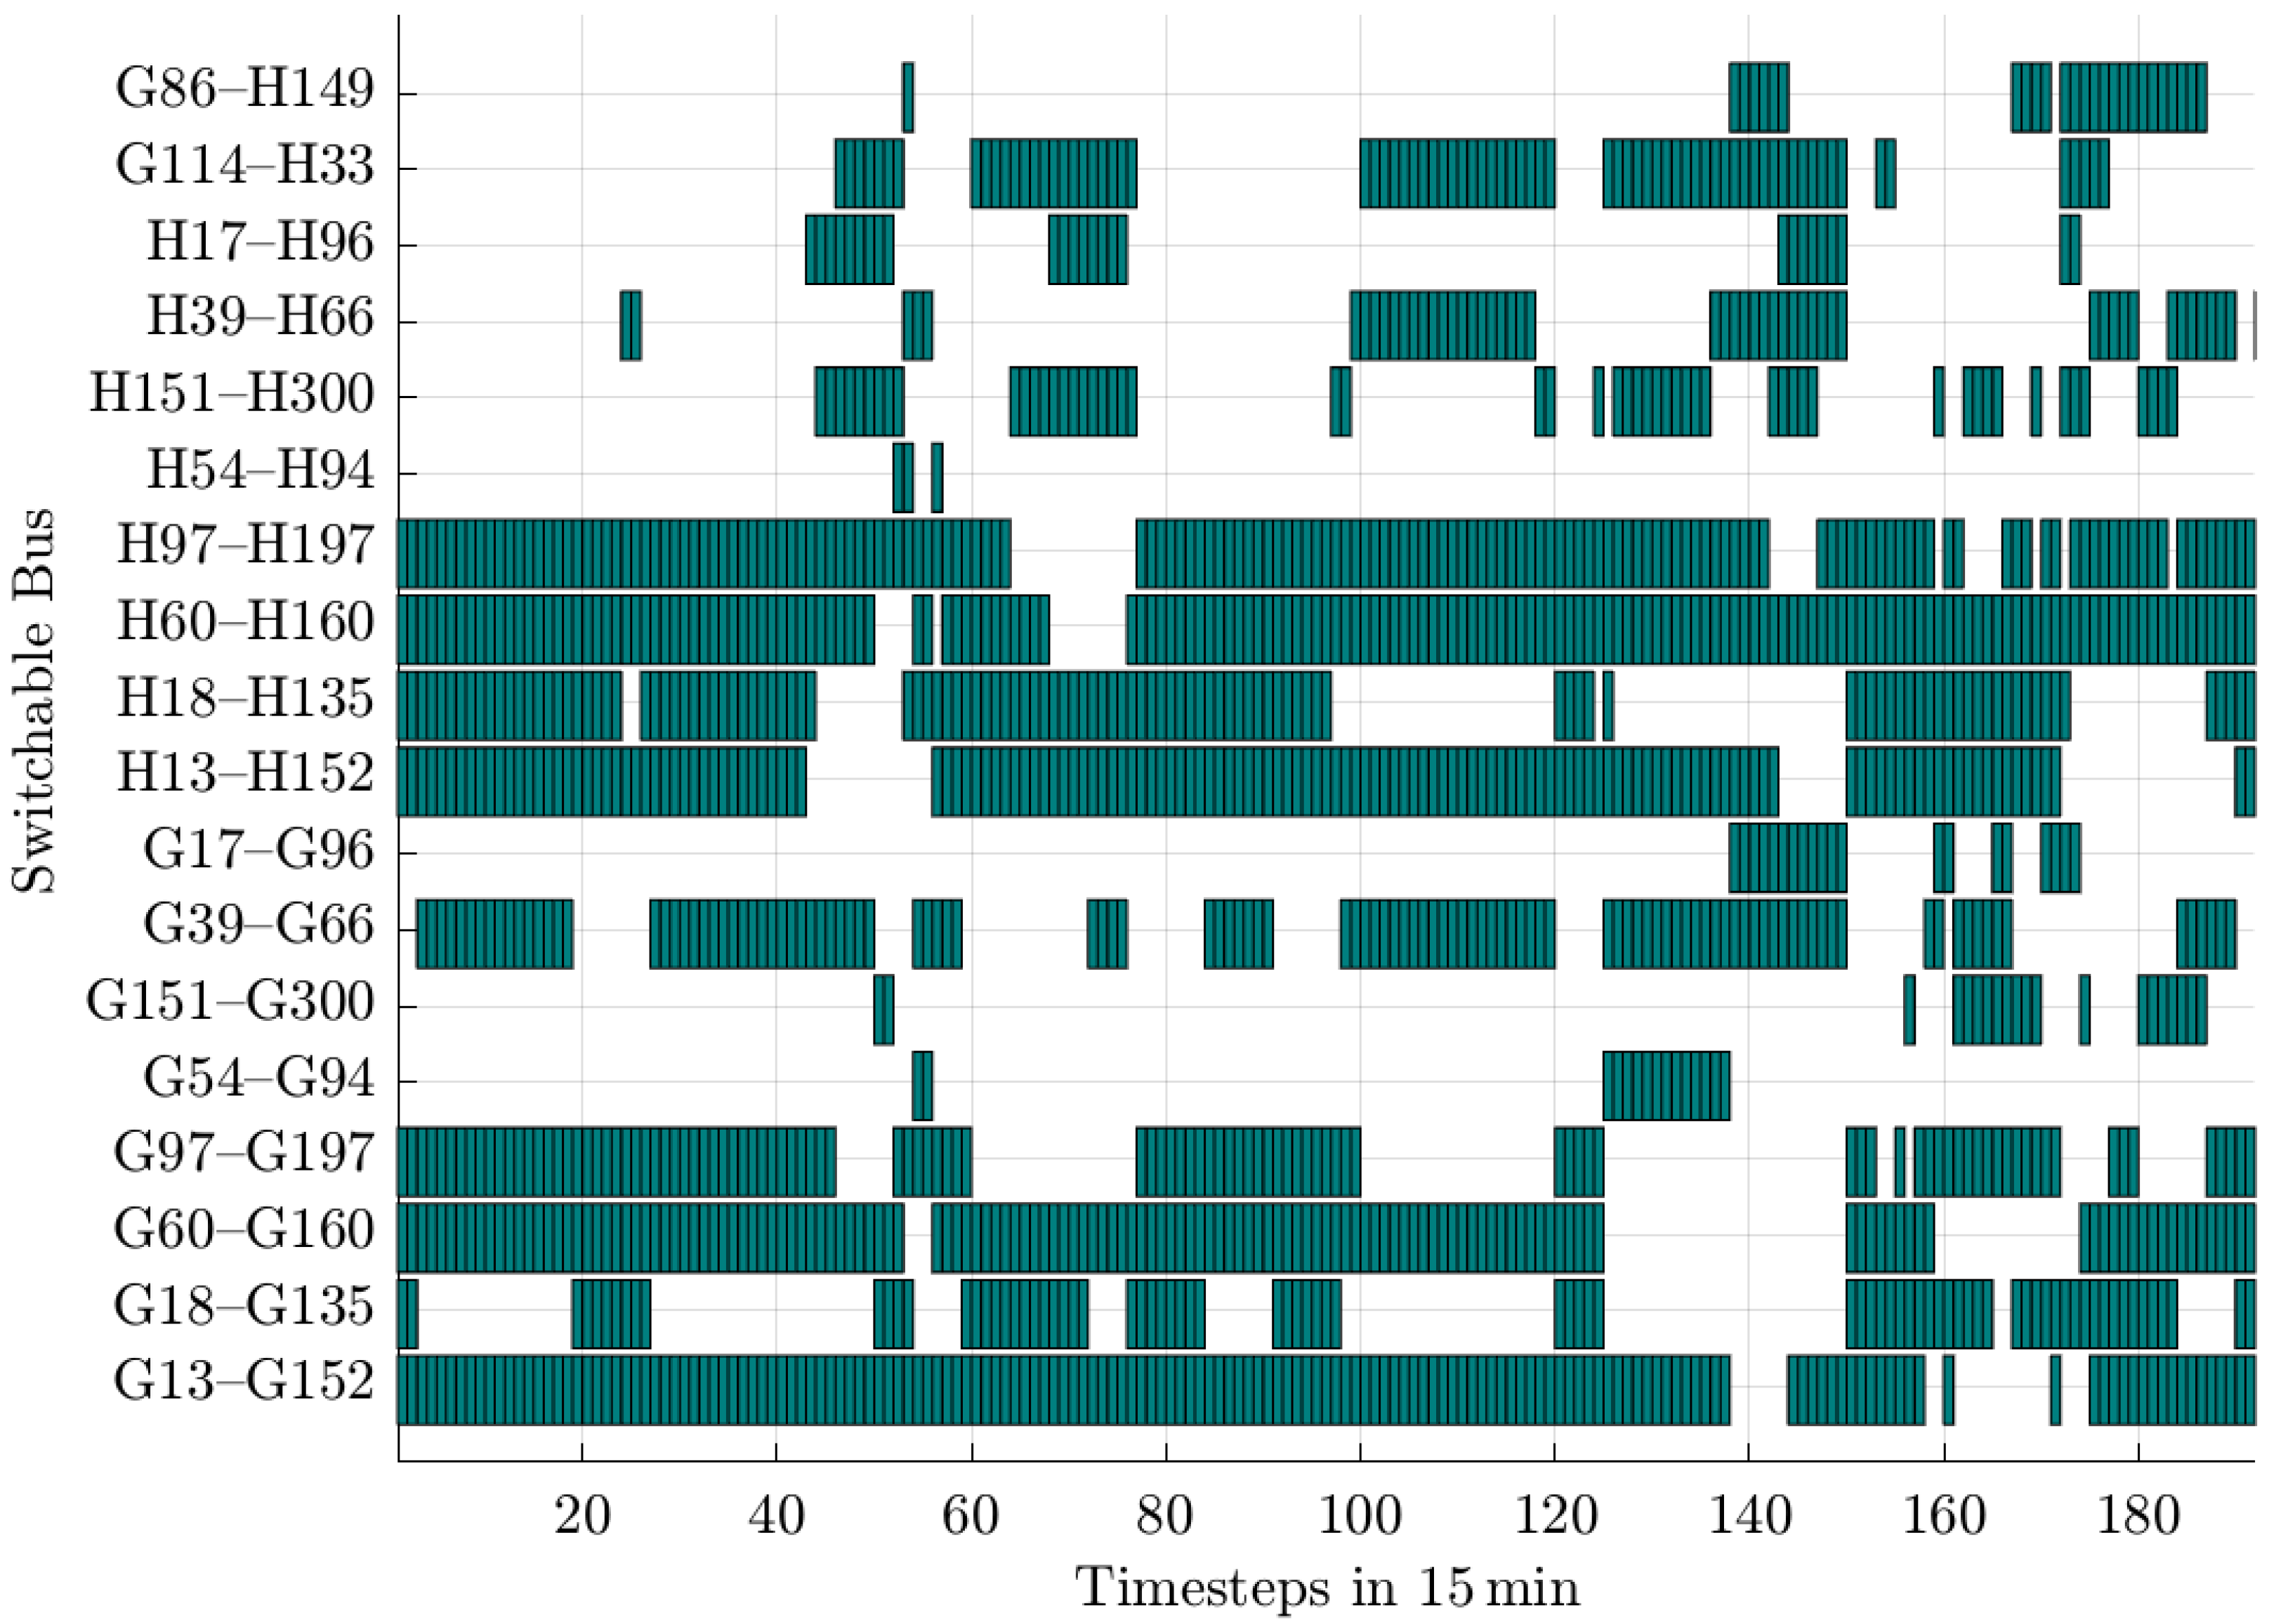
For the case of optimizing AC switches in Scenario 2 (a) with PV-penetration of 100% and forbidden ring branches, the results of the switch states can be seen in Figure 5. A green block for a timestep in this figure means that the corresponding switch listed on the y-axis is closed. It can be observed that during periods with PV feed-in, switching operations occur more frequently, resulting in several different topologies within a short time span, compared to periods without PV feed-in. However, because of the optimization process, the original topology can be altered at all times.
Figure 5.
Visualization of closed switches for the scenario of 100% PV, no MVDC, and optimization with both and ; ring branches not allowed.
An interesting finding is that the original switching states can still be observed, since initial closed switches stay closed in the majority of time steps and vice versa. Apart from that, switch G39–G66 proves to be a more favorable choice than G18–G135 to supply the subnet of nodes G35 to G51 over multiple time steps. Furthermore, the switching behavior confirms the effectiveness of ring network prevention: with switch G13–G152 remaining nearly permanently closed, switches G18–G135 and G39–G66 operate in a mutually exclusive manner to avoid forming a closed loop among those three switches.
In contrast to the usage of MVDC connections, the switches connecting both networks, G114–H33 and G86–H149, are not permanently closed at times with PV feed-in, since the AC switches cannot enable continuous power flow between the MV networks, unlike the MVDC connections. As a consequence, the transferred power is reduced to 97.13%.
The results shown in Table 5, Table 6, Table 7 and Table 8 differ depending on whether an open ring structure is allowed or not. As mentioned in Section 2.2.2, the MVDC couplings do not play a role in the consideration of the ring structure, which can consequently be seen in the results. When using MVDC couplings alone, without simultaneous AC switching, there are no differences in the results between the open- and closed-ring structures.
Table 7.
Power transfer compared to non-optimized original topology in % for different scenarios; ring branches allowed.
Table 8.
Power losses compared to non-optimized original topology in % for different scenarios; ring branches allowed.
5.1. Power Transfer Optimization
The results for power transfer optimization are shown in Table 5 (ring branches not allowed) and Table 7 (ring branches allowed). For all scenarios, the losses have been reduced if the value of sub-objective was set to 1. Scenario 2 (c), with closed-ring structures and a PV penetration of 100%, achieved the best performance by reducing the power transfer by 8.75%.
In general, it can be said that operating in Scenario 2, the closed-ring structure enables a more effective minimization of the transferred power. Scenario 1 (c) performs approximately 1 to 1.5 percentage points worse than Scenario 2 (c) across all levels of PV penetration in the case of closed-ring configurations.
But when it comes to Scenario (a), both technologies are on a comparable level. Thus, the two optimization criteria pose a greater challenge for the AC switches than for the MVDC.
The combination of both technologies in Scenario 3 (a) leads to nearly the same result as the best result from Scenario 1 (a) and 2 (a): with an open-ring structure, it is comparable to the MVDC and with no enforcement of the open-ring structure, it is close to the result of the AC switches. For sub-scenario (b), where the aim was only to reduce the losses, the power transfer could be slightly reduced, but mostly less than 1%. Only for Scenario 1 and 2 (b) and a PV penetration of 200%, the transferred power increased.
5.2. Minimization of Power Losses
In Table 6 and Table 8, the results for the minimization of power losses are shown. Scenario 3 (b) containing MVDC and AC switching, and closed-ring structures achieved the best loss reduction. For example, for a PV penetration of 100% the losses were reduced by 33.73%, which is a massive improvement in terms of transmission efficiency.
In general, allowing closed-ring branches leads to a higher loss reduction when AC switching is included (Scenario 2 and 3). While Scenario 1 with the MVDC is comparable to Scenario 2 and 3 in open-ring structures, the optimization potential of Scenario 2 and 3 with the allowance of closed rings is for all PV penetrations more than 10 percentage points higher than in Scenario 1.
While most Scenarios have their highest optimization potential at 100% PV penetration, Scenarios 1 and 2, in combination with forbidden closed rings, perform best at 200% PV penetration.
For Scenarios 1 (c) and 2 (c) in closed-ring structures, the reduction in the transferred power leads to significantly higher losses as shown in Table 8.
6. Conclusions
In this paper, the PSO algorithm was applied to a multi-objective optimization problem for the distribution network reconfiguration of a modified IEEE-123 test feeder to investigate the potential application of active and passive grid coupling and their combination. Therefore, two MV networks next to each other were connected by two MVDC connections or AC switches. In addition, several AC switches were used to optimize the grid topology. The results of different scenarios are promising. With a high PV penetration of 100%, where every customer has a PV feed-in, the algorithms and technologies are able to optimize the grid topology with respect to the sub-objectives. The results differ depending on the scenario and the given sub-objectives. In general, allowing closed-ring structures enables a more effective optimization potential than the constraint of a radial grid topology. When aiming for a minimization of power transfer and a minimization of power losses, the combination of MVDC and AC switching performs best in a closed-ring structure.
The direct continuation of this work is the scheduling of selected passive or active coupling elements. The switching state optimization concept was based on ideal switching operations and did not consider dynamic effects within the grid. The method can be applied by incorporating real-time measurements of generation units, as well as load data received, for example, from smart meter measurements, into the operating strategy of real distribution grids. However, before practical implementation, the resulting switching sequences must be examined and compared with operational limitations, such as permissible circulating currents, or assumptions in the protection scheme.
Author Contributions
Conceptualization, F.G.; methodology, F.G. and S.H.; software, F.G. and S.H.; validation, F.G. and M.S.; formal analysis, F.G.; investigation, F.G. and S.H.; resources, T.L. and M.S.; data curation, S.H.; writing—original draft preparation, F.G. and S.H.; writing—review and editing, F.G., S.H., M.S. and T.L.; visualization, S.H. and F.G.; supervision, M.S. and T.L.; project administration, M.S. and T.L.; funding acquisition, F.G., M.S. and T.L. All authors have read and agreed to the published version of the manuscript.
Funding
This work was supported by the Helmholtz Association of German Research Centers (HGF) within the framework of the Program-Oriented Funding POF IV in the program Energy Systems Design (ESD, project number 37.12.02). Furthermore, we acknowledge support from the KIT Publication Fund of the Karlsruhe Institute of Technology.
Data Availability Statement
The original contributions presented in this study are included in the article. Further inquiries can be directed to the corresponding author.
Conflicts of Interest
The authors declare no conflicts of interest. The funders had no role in the design of the study; in the collection, analyses, or interpretation of data; in the writing of the manuscript; or in the decision to publish the results.
Abbreviations
The following abbreviations are used in this manuscript:
| RES | Renewable energy source |
| MVDC | Medium-voltage direct current |
| PSO | Particle swarm optimization |
| DSO | Distribution system operators |
| DNR | Distribution network reconfiguration |
| DG | Distributed generation |
| HBMO | Honey bee mating optimization |
| GA | Genetic algorithm |
| HVDC | High-voltage direct current |
| PV | Photovoltaic |
References
- Wolter, D.; Zdrallek, M.; Stötzel, M.; Schacherer, C.; Mladenovic, I.; Biller, M. Impact of meshed grid topologies on distribution grid planning and operation. Cired Open Access Proc. J. 2017, 2017, 2338–2341. [Google Scholar] [CrossRef] [Scilit]
- Jo, S.; Oh, J.-Y.; Lee, J.; Oh, S.; Moon, H.S.; Zhang, C. Hybrid Genetic Algorithm with k-Nearest Neighbors for Radial Distribution Network Reconfiguration. IEEE Trans. Smart Grid 2024, 15, 2614–2624. [Google Scholar] [CrossRef] [Scilit]
- Olamaei, J.; Niknam, T.; Gharehpetian, G. Application of for distribution feeder reconfiguration considering distributed generators. Appl. Math. Comput. 2008, 201, 575–586. [Google Scholar] [CrossRef] [Scilit]
- Merzoug, Y.; Abdelkrim, B.; Larbi, B. Distribution network reconfiguration for loss reduction using PSO method. Int. J. Electr. Comput. Eng. (IJECE) 2020, 10, 5009–5015. [Google Scholar] [CrossRef] [Scilit]
- Niknam, T. An efficient hybrid evolutionary algorithm based on PSO and HBMO algorithms for multi-objective Distribution Feeder Reconfiguration. Energy Convers. Manag. 2009, 50, 2074–2082. [Google Scholar] [CrossRef] [Scilit]
- Shetty, V.J.; Magadum, R.B.; Ankaliki, S.G.; Ankaliki, G. Distribution system Network Reconfiguration for Voltage profile improvement and loss reduction Using BPSO. In Proceedings of the 2019 2nd International Conference on Power and Embedded Drive Control (ICPEDC), Chennai, India, 21–23 August 2019; pp. 454–457. [Google Scholar] [CrossRef] [Scilit]
- Essallah, S.; Khedher, A. Optimization of distribution system operation by network reconfiguration and DG integration using MPSO algorithm. Renew. Energy Focus. 2020, 34, 37–46. [Google Scholar] [CrossRef] [Scilit]
- Kahouli, O.; Alsaif, H.; Ali, N.B.; Chaabene, M. Power system reconfiguration in distribution network for improving reliability using genetic algorithm and particle swarm optimization. Appl. Sci. 2021, 11, 3092. [Google Scholar] [CrossRef] [Scilit]
- Hazra, S.; Roy, P.K.; Paul, C. State of the art for moth-flame optimization applied electric vehicles–solar–wind–hydro–thermal power system. Electr. Eng. 2025, 107, 8909–8935. [Google Scholar] [CrossRef] [Scilit]
- Hazra, S.; Datta, D.; Paul, C.; Roy, P.K.; Sultana, S.; Kumar, S.; Dutta, S. Electric vehicle integrated tidal-solar-wind-hydro-thermal systems for strengthing the microgrid and environment sustainability. Sci. Rep. 2025, 15, 14888. [Google Scholar] [CrossRef] [Scilit] [PubMed]
- Coffey, S.; Timmers, V.; Li, R.; Wu, G.; Egea-Àlvarez, A. Review of MVDC Applications, Technologies, and Future Prospects. Energies 2021, 14, 8294. [Google Scholar] [CrossRef] [Scilit]
- Bathurst, G.; Hwang, G.; Tejwani, L. MVDC—The New Technology for Distribution Networks. In Proceedings of the 11th IET International Conference on AC and DC Power Transmission, Birmingham, UK, 10–12 February 2015; pp. 1–5. [Google Scholar] [CrossRef] [Scilit]
- Yu, J.; Smith, K.; Urizarbarrena, M.; MacLeod, N.; Bryans, R.; Moon, A. Initial designs for the ANGLE DC project; converting existing AC cable and overhead line into DC operation. In Proceedings of the 13th IET International Conference on AC and DC Power Transmission (ACDC 2017), Manchester, UK, 14–16 February 2017; pp. 1–6. [Google Scholar] [CrossRef] [Scilit]
- Qu, L.; Yu, Z.; Song, Q.; Yuan, Z.; Zhao, B.; Yao, D.; Chen, J.; Liu, Y.; Zeng, R. Planning and analysis of the demonstration project of the MVDC distribution network in Zhuhai. Front. Energy 2019, 13, 120–130. [Google Scholar] [CrossRef] [Scilit]
- Kangsheng, C.; Ruixiong, Y.; Yurong, L.; Jianfu, C.; Lu, Q.; Yong, C. Technical Advantages Quantitative Evaluation of MVDC Applied in Flexible Interconnection of Distribution Network. In Proceedings of the 2022 5th International Conference on Power and Energy Applications (ICPEA), Guangzhou, China, 18–20 November 2022; IEEE: Piscataway, NJ, USA, 2022; pp. 253–258. [Google Scholar] [CrossRef] [Scilit]
- Biller, M.; Jaeger, J. Robust Distance Protection Algorithm for Closed-Ring Structures. In Proceedings of the 7th International Conference on Advanced Power System Automation and Protection (APAP2017), Jeju, South Korea, 16–19 October 2017. [Google Scholar]
- Biller, M.; Jaeger, J. Relay Coordination of Highly Meshed Distribution Grids in the Presence of Volatile Infeed and Power Flow Control. In Proceedings of the APAP 2015, Advanced Power System Automation and Protection, Nanjing, China, 20–23 September 2015. [Google Scholar]
- Gielnik, F.; Pinter, P.; Leibfried, T. Multi-objective Particle Swarm Optimization for Comparison of Optimal Distribution Grid Reconfiguration Tasks. In Proceedings of the 2024 59th International Universities Power Engineering Conference (UPEC), Cardiff, UK, 2–6 September 2024; pp. 1–6. [Google Scholar] [CrossRef] [Scilit]
- Gielnik, F.; Pinter, P.; Swietlik, J.; Suriyah, M.; Leibfried, T. Active medium-voltage grid coupling using particle swarm optimization. In Proceedings of the CIRED 2024 Vienna Workshop, Vienna, Austria, 19–20 June 2024; pp. 1019–1022. [Google Scholar] [CrossRef] [Scilit]
- Zimmerman, R.D.; Murillo-Sánchez, C.E.; Thomas, R.J. MATPOWER: Steady-State Operations, Planning, and Analysis Tools for Power Systems Research and Education. IEEE Trans. Power Syst. 2011, 26, 12–19. [Google Scholar] [CrossRef] [Scilit]
- Poli, R.; Kennedy, J.; Blackwell, T. Particle swarm optimization. Swarm Intell 2007, 1, 33–57. [Google Scholar] [CrossRef] [Scilit]
- Talbi, E.-G. Metaheuristics: From Design to Implementation; John Wiley & Sons: London, UK, 2009. [Google Scholar] [CrossRef] [Scilit]
- Eberhart, R.; Kennedy, J. A new optimizer using particle swarm theory. MHS’95. In Proceedings of the Sixth International Symposium on Micro Machine and Human Science, Nagoya, Japan, 4–6 October 1995; pp. 39–43. [Google Scholar] [CrossRef] [Scilit]
- Khanesar, M.A.; T, M.; Shoorehdeli, M.A. A novel binary particle swarm optimization. In Proceedings of the 2007 Mediterranean Conference on Control & Automation, Athens, Greece, 27–29 June 2007; pp. 1–6. [Google Scholar] [CrossRef] [Scilit]
- IEEE PES Disbribution Systems Analysis Subcommittee Radial Test Feeders. IEEE PES Test Feeder. Available online: https://cmte.ieee.org/pes-testfeeders/resources/ (accessed on 5 December 2024).
- Schneider, K.P.; Mather, B.A.; Pal, B.C.; Ten, C.W.; Shirek, G.J.; Zhu, H.; Fuller, J.C.; Pereira, J.L.R.; Ochoa, L.F.; de Araujo, L.R.; et al. Analytic Considerations and Design Basis for the IEEE Distribution Test Feeders. IEEE Trans. Power Syst. 2017, 33, 3181–3188. [Google Scholar] [CrossRef] [Scilit]
- Bundesverband der Energie- und Wasserwirtschaft e.V. (BDEW). Standardlastprofile Strom. [German Association of the Energy and Water Industries. Standard Load Profiles for Electricity]. Available online: https://www.bdew.de/energie/standardlastprofile-strom/ (accessed on 13 December 2024).
- Simonič, E.; Seme, S.; Sredenšek, S.K. Research on the Modelling and Analysis of the Penetration of Renewable Sources and Storage into Electrical Networks. Energies 2025, 18, 2263. [Google Scholar] [CrossRef] [Scilit]
- Maghami, M.R.; Pasupuleti, J.; Ling, C.M. Impact of Photovoltaic Penetration on Medium Voltage Distribution Network. Sustainability 2023, 15, 5613. [Google Scholar] [CrossRef] [Scilit]
- Maghami, M.R.; Pasupuleti, J.; Ling, C.M. A Static and Dynamic Analysis of Photovoltaic Penetration into MV Distribution Network. Processes 2023, 11, 1172. [Google Scholar] [CrossRef] [Scilit]
- Bhusal, N.; Kamruzzaman, M.; Benidris, M. Photovoltaic Hosting Capacity Estimation Considering the Impact of Electric Vehicles. In Proceedings of the 2019 IEEE Industry Applications Society Annual Meeting, Baltimore, MD, USA, 29 September–3 October 2019; pp. 1–6. [Google Scholar] [CrossRef] [Scilit]

Disclaimer/Publisher’s Note: The statements, opinions and data contained in all publications are solely those of the individual author(s) and contributor(s) and not of MDPI and/or the editor(s). MDPI and/or the editor(s) disclaim responsibility for any injury to people or property resulting from any ideas, methods, instructions or products referred to in the content. |
© 2025 by the authors. Licensee MDPI, Basel, Switzerland. This article is an open access article distributed under the terms and conditions of the Creative Commons Attribution (CC BY) license (https://creativecommons.org/licenses/by/4.0/).