


Abstract
Artificial intelligence (AI) systems for intensive care units (ICUs) must support early risk prediction while producing explanations that clinicians can inspect, question, and relate to physiological reasoning. Deep neural networks (DNNs) can learn complex temporal patterns from electronic health records (EHRs), but their internal representations are often difficult to translate into clinically actionable explanations. Gradient-boosted decision trees (GBDTs) offer more transparent decision rules, yet they may not capture the full temporal and nonlinear structure of high-dimensional ICU data. This paper presents a causal-pathway-guided DNN–GBDT distillation framework for interpretable ICU decision support. The framework first estimates a directed acyclic graph (DAG), denoted by , from multivariate ICU time-series data and then uses the graph to guide representation learning in a DNN teacher model through causal gating. The learned teacher is distilled into a GBDT student model using soft predictive targets and a causal attribution-guided split-selection procedure, so that the final model approximates the teacher predictions while prioritizing tree splits aligned with plausible physiological pathways. Experiments using Medical Information Mart for Intensive Care IV (MIMIC-IV) data evaluate sepsis onset and in-hospital mortality prediction through discrimination, precision–recall performance, calibration-oriented reporting, causal consistency, and clinical utility indicators. The proposed causal-aware distilled GBDT achieves stronger predictive performance than conventional interpretable baselines and substantially higher causal consistency than black-box temporal models. The results suggest that causal structure can serve as an inductive bias for converting complex temporal prediction into interpretable rule-based clinical reasoning. The paper also discusses limitations related to observational causal discovery, unmeasured confounding, temporal stationarity, and clinical deployment, following recent reporting expectations for AI-based clinical prediction models.
1. Introduction
Intensive care units (ICUs) are among the most information-dense environments in healthcare [1,2]. An ICU is a hospital unit that provides continuous monitoring and advanced organ support for patients with life-threatening illness or at high risk of rapid deterioration [3]. Modern ICUs generate repeated physiological measurements, laboratory values, medication records, ventilator parameters, clinical notes, and outcome labels through electronic health records (EHRs), where an EHR is a digital longitudinal record of patient care events. These data streams have created strong interest in artificial intelligence (AI), where AI denotes computational methods that learn patterns from data to support prediction, classification, explanation, or decision-making [4]. In critical care, AI-based models have been developed for mortality prediction, sepsis detection, readmission risk, respiratory deterioration, acute kidney injury, length of stay, and treatment-response estimation [3,5,6].
Despite this progress, clinical adoption remains constrained by a persistent interpretability gap. A deep neural network (DNN) is a multilayer learning model that transforms input variables through nonlinear hidden representations. DNNs can capture interactions and temporal dependencies in ICU data, but their predictions are often difficult to audit at the bedside [4]. A clinician may need to understand whether a sepsis alert is driven by lactate, mean arterial pressure, temperature, use of vasopressors, or a combination of temporally ordered physiological changes. In this context, interpretability means more than producing a feature ranking; it requires a clinically meaningful account of how observed variables contribute to a risk estimate and whether the explanation is consistent with medical reasoning [7]. Recent guidance for clinical prediction models using AI, including TRIPOD+AI and PROBAST+AI, reinforces the need for transparent reporting, appropriate validation, risk-of-bias assessment, and clinically interpretable presentation of model behavior [8,9].
Gradient-boosted decision trees (GBDTs) provide one practical route toward interpretable prediction [10]. A GBDT is an ensemble of decision trees trained sequentially, where each new tree corrects errors made by the previous ensemble. GBDTs are widely used for tabular clinical data because they support feature importance analysis, threshold-based decision rules, partial dependence inspection, and efficient deployment [10,11]. However, ICU data are not purely static tabular records. Physiological variables are temporally dependent, irregularly sampled, frequently missing, and affected by interventions. A standalone GBDT may therefore miss delayed effects and nonlinear temporal interactions that a DNN teacher model can learn from time-series data.
Knowledge distillation offers a natural way to combine these strengths. Knowledge distillation (KD) is a training strategy in which a simpler student model learns from the output distribution or intermediate behavior of a more complex teacher model [12]. In the ICU setting, a DNN teacher can learn high-capacity temporal representations, while a GBDT student can provide a more transparent approximation suitable for clinical review. Conventional distillation, however, mainly transfers predictive information. It does not guarantee that the student model preserves causal pathways or avoids dependence on clinically implausible correlations. This limitation is serious in critical care because association-based explanations may be misleading when treatments, disease severity, monitoring frequency, and missingness mechanisms interact.
Causal discovery provides a complementary foundation. Causal discovery denotes a family of methods that infer possible cause–effect relationships from data, usually under assumptions about conditional independence, acyclicity, temporal ordering, and unmeasured confounding [13,14,15,16]. A directed acyclic graph (DAG), denoted by , represents variables as nodes and directed edges as candidate causal relationships. In ICU modeling, a DAG can encode clinically plausible pathways such as infection markers preceding organ dysfunction, hemodynamic instability preceding elevated lactate, or vasopressor administration affecting mean arterial pressure. Although a DAG learned from observational EHR data should not be interpreted as definitive causal truth, it can still act as a structured inductive bias that discourages purely spurious feature use.
This paper proposes a causal-pathway-guided DNN–GBDT distillation framework for interpretable AI in ICUs. The central idea is to use a causal graph not merely as a post hoc visualization but as an organizing structure throughout model development. First, a causal discovery module estimates a DAG from ICU time-series variables. Second, a DNN teacher model incorporates this graph through causal gating, so that hidden representations are shaped by both predictive gradients and plausible physiological dependencies. Third, The GBDT student is trained using soft predictive targets from the DNN teacher and a causal attribution-guided split-selection rule, so that tree construction remains compatible with standard boosting while giving priority to features aligned with teacher-derived causal attributions. The student model therefore aims to preserve the teacher’s predictive behavior while producing tree-based rules whose feature importance patterns remain aligned with discovered causal pathways.
The contributions of this study are the following.
- 1.
- The study introduces a causal gating mechanism that incorporates graph-guided information flow into DNN representations for ICU prediction.
- 2.
- The study formulates a causal attribution-guided split-selection mechanism that incorporates teacher-derived causal priorities into GBDT construction without requiring gradient propagation through discrete tree structures.
- 3.
- The study presents an interpretable rule-mapping process that links GBDT decision paths to causal subgraphs, temporal windows, and clinically meaningful thresholds.
- 4.
- The study evaluates the framework for MIMIC-IV ICU prediction tasks using discrimination metrics, precision–recall metrics, causal consistency indicators, and ablation analysis.
The remainder of this paper is organized as follows. Section 2 reviews related work on interpretable ICU artificial intelligence, causal discovery, and knowledge distillation. Section 3 presents the background on causal discovery and gradient-boosted decision trees. Section 4 describes the proposed causal-aware DNN–GBDT distillation framework. Section 5 explains the experimental setup, dataset, baselines, and evaluation metrics. Section 6 reports predictive performance, calibration, clinical utility, causal interpretation, and ablation results. Section 7 discusses implications, limitations, and ethical considerations. Section 8 concludes the paper.
2. Related Work
2.1. Interpretable Artificial Intelligence in Critical Care
Interpretable artificial intelligence in critical care has developed in response to the clinical need for transparent, auditable, and context-aware decision support. Interpretable AI refers to methods that make model behavior understandable to human users through transparent structures, feature attributions, rule sets, causal diagrams, counterfactuals, or clinically grounded visualizations. In ICUs, the interpretability requirement is particularly demanding because model outputs can influence time-sensitive decisions about antimicrobial therapy, vasopressor titration, ventilation, renal support, and care goals [17,18].
Traditional severity scores, such as the Sequential Organ Failure Assessment (SOFA), remain clinically familiar because they aggregate organ dysfunction into transparent rule-based components [19]. The SOFA score is a bedside severity index that summarizes dysfunction across respiratory, coagulation, liver, cardiovascular, central nervous system, and renal systems. The quick SOFA (qSOFA) score is a simplified sepsis risk indicator based on respiratory rate, systolic blood pressure, and mental status [20]. These scores are interpretable but may lack the flexibility required to model high-dimensional EHR trajectories. Machine learning models, including logistic regression, random forests, support vector machines, GBDTs, and neural sequence models, can improve prediction by using richer data representations, but many of these models require additional explanation methods before they can be meaningfully reviewed by clinicians.
Tree-based methods remain attractive for structured ICU data because they express predictions through conditional splits. XGBoost, which is an optimized implementation of gradient-boosted trees, has become a common baseline for clinical prediction due to its strong performance, regularization, and ability to handle heterogeneous feature sets [11]. Recent explainable boosting and glass-box modeling work has further emphasized that transparent or semi-transparent tabular models can provide competitive performance when carefully validated [21,22]. Nevertheless, ICU time-series data contain irregular observation intervals, treatment-dependent missingness, and delayed physiological responses. A static GBDT trained on summary features may therefore underrepresent temporal dependencies unless feature engineering is extensive and clinically informed.
Deep temporal models address some of these limitations by learning from sequences [23]. Long short-term memory (LSTM) networks are a type of recurrent neural network architecture designed to model long-range dependencies through gated memory cells and have been used for clinical event prediction [24]. Transformer-based models have also become prominent because self-attention can relate observations across different time points. A Temporal Fusion Transformer (TFT) is a sequence modeling architecture that combines recurrent layers, attention mechanisms, static covariate encoders, and variable selection networks for interpretable multihorizon prediction. Although attention weights and variable selection scores can provide partial interpretability, clinical AI discussions caution that such explanations should not be treated as causal evidence unless supported by stronger assumptions and validation.
2.2. Causal Discovery and Causal Reasoning in Medical AI
Causal reasoning is increasingly recognized as essential for medical AI because clinical decisions are inherently intervention-oriented. Causal reasoning aims to distinguish whether changing a variable would alter an outcome, rather than merely identifying variables that are statistically associated with the outcome. In EHR-based ICU studies, this distinction matters because treatment decisions are confounded by illness severity, monitoring intensity, clinician behavior, and institutional practice patterns. For example, vasopressor use may be associated with mortality because it is administered to severely ill patients, even though the treatment may be clinically necessary and beneficial under appropriate conditions.
Constraint-based causal discovery methods, such as the PC algorithm, use conditional independence tests to remove unsupported edges from an initially dense graph [16]. Score-based methods, such as greedy equivalence search (GES), search over graph structures using scoring criteria that balance model fit and complexity [15]. Temporal causal discovery extends these ideas by considering lagged variables and time ordering, which are crucial for ICU physiology [25,26]. These methods can help identify candidate pathways among infection markers, hemodynamic variables, renal indicators, respiratory parameters, and treatment actions.
Recent ICU studies have begun incorporating causal structure into predictive models. CRISP, a causal relationships-guided deep learning framework, used causal information to improve ICU mortality prediction and model interpretability [27]. Causal deep learning approaches for acute kidney injury detection have demonstrated the value of combining time-series cohorts with causally informed representations [6]. Similarly, causal disentanglement for early sepsis prediction has shown that separating temporal and spatial clinical factors may improve robustness and explanation quality [28]. These studies support the importance of causal structure in critical-care AI, but most existing approaches still produce final models whose explanations remain partly dependent on black-box neural mechanisms.
2.3. Knowledge Distillation for Interpretable Clinical Models
Knowledge distillation is increasingly used in healthcare AI to compress or translate high-capacity models into smaller, faster, or more interpretable models. In standard KD, a student model learns from soft labels, logits, probability distributions, or intermediate representations generated by a teacher model [12]. This can improve generalization because soft teacher outputs contain information about class similarity and uncertainty that is not available in hard labels alone. In clinical applications, distillation can also reduce computational burden and enable deployment in resource-constrained environments.
Recent biomedical distillation studies have used teacher–student learning to combine supervision, semi-supervision, and model compression. For example, dual knowledge distillation has been applied in autonomous diagnosis frameworks for knee osteoarthritis [29]. In broader AI domains, causal-aware distillation has been proposed to reduce bias and improve robustness, including work that distills causal information for visual question answering [30]. Deconfounding-enhanced distillation has also been studied in industrial fault diagnosis, showing that causal structure can improve the robustness of transferred representations [31]. These works demonstrate that distillation can transfer more than predictive labels, but they do not directly address ICU-specific temporal physiology, clinical rule generation, or alignment between neural attributions and tree-based explanations.
2.4. State-of-the-Art Comparison
Table 1 positions the proposed framework against recent peer-reviewed studies. Preprint-only studies are not used as state-of-the-art comparators in the table, although older and preliminary references are retained in the bibliography when they support background or historical context.
Table 1.
State-of-the-art comparison of recent peer-reviewed work relevant to interpretable, causal, and distilled ICU artificial intelligence.
2.5. Positioning of the Proposed Framework
The proposed causal-pathway-guided DNN–GBDT distillation framework is positioned at the intersection of interpretable clinical AI, temporal representation learning, causal discovery, and knowledge distillation. Existing interpretable models offer transparent rules but may miss temporal complexity. Deep temporal models learn richer trajectories but often lack clinically grounded explanations. Causal discovery methods provide candidate physiological pathways but are frequently disconnected from final predictive models. Standard distillation transfers predictive behavior but does not preserve causal reasoning. Recent modality-specific ICU alignment work shows that heterogeneous ICU signals can benefit from representation designs that preserve modality-specific structure before fusion [32]; the present framework extends this direction by using causal pathways to guide teacher–student transfer and rule-level interpretation.
The proposed framework addresses these limitations by connecting all four elements in a single modeling pipeline. A causal graph defines plausible pathways; a DNN teacher learns temporal representations under graph-guided gating; a GBDT student receives both predictive and causal-attribution supervision; and the final rules are mapped back to causal subgraphs for clinical interpretation. This design is intended to support ICU decision support systems that are not only accurate but also auditable, physiologically plausible, and compatible with emerging expectations for trustworthy medical AI.
3. Background on Causal Discovery and Gradient-Boosted Trees
Understanding the interplay between causal discovery and gradient-boosted trees requires examining their fundamental principles and how they complement each other in clinical decision-making. While causal discovery methods aim to uncover underlying cause–effect relationships from observational data, gradient-boosted trees provide a powerful yet interpretable framework for predictive modeling. This section establishes the theoretical foundations necessary for our proposed integration of these approaches.
3.1. Causal Discovery in Medical Data
Causal discovery algorithms operate by identifying potential cause–effect relationships from observational data through statistical patterns and conditional independence tests. The PC algorithm [16], named after its inventors Peter Spirtes and Clark Glymour, represents a constraint-based approach that begins with a fully connected graph and systematically removes edges based on conditional independence tests. For ICU data where temporal relationships are crucial, the algorithm can be extended to handle time-series through appropriate conditioning on past values [25].
Score-based methods like GES [15] take a different approach by searching through the space of possible directed acyclic graphs (DAGs) and selecting the one that maximizes a predefined score function. The Bayesian Information Criterion (BIC) is commonly used as the scoring metric:
where D represents the data, G the causal graph, d the number of parameters, and n the sample size. In medical applications, these methods must account for domain-specific constraints such as known temporal orderings of measurements and interventions [14].
3.2. Gradient-Boosted Decision Trees
Gradient-boosted decision trees (GBDTs) construct an ensemble model by sequentially adding decision trees that correct the errors of previous trees. Each new tree is fitted to the negative gradient of the loss function L with respect to the current model’s predictions :
The model then updates its predictions with a learning rate :
This iterative process allows GBDTs to capture complex non-linear relationships while maintaining interpretability through feature importance measures and individual tree structures [10]. In ICU settings, the ability to trace predictions back to specific decision paths makes GBDTs particularly valuable for clinical decision support.
3.3. Causal Interpretability in Machine Learning
The integration of causal discovery with machine learning models addresses a critical gap in medical AI systems: the need for explanations that reflect underlying physiological mechanisms rather than mere statistical associations. Structural causal models (SCMs) provide a formal framework for this integration by representing variables as functions of their direct causes and exogenous noise terms [13]:
where denotes the parent variables of in the causal graph, and represents unobserved noise. When combined with GBDTs, these causal structures can guide both the feature selection process and the interpretation of model outputs, ensuring that predictions align with known medical knowledge while remaining data-driven.
The convergence of these methodologies creates new opportunities for developing ICU prediction systems that are both accurate and clinically interpretable. By grounding the GBDT’s decision rules in causal relationships discovered from data, we can bridge the gap between statistical prediction and mechanistic understanding—a crucial requirement for trustworthy clinical AI.
4. Causal-Aware Knowledge Distillation from Deep Nets to GBDTs
The proposed causal-aware knowledge distillation framework transfers predictive knowledge from a deep neural network (DNN) teacher to a gradient-boosted decision tree (GBDT) student while preserving clinically meaningful causal relationships. The framework contains three experimentally implemented components: causal discovery from intensive care unit (ICU) variables, causal-gated teacher representation learning, and causal-attribution-guided GBDT training. Additional components, including dynamic graph updating, drift monitoring, and counterfactual rule exploration, are described as deployment-oriented extensions and are not used to support the primary empirical claims.
As shown in Figure 1, the implemented pipeline begins with multivariate ICU time-series data, estimates a clinically constrained causal graph, trains a Temporal Fusion Transformer (TFT) teacher with causal gating, and then trains a GBDT student using both prediction-level distillation and causal-attribution-guided split selection.
Figure 1.
Causal-guided DNN–GBDT distillation pipeline. The implemented framework estimates a causal graph from ICU time-series data, uses the graph to guide DNN teacher representations, and distills predictive and causal-attribution information into a GBDT student. Dynamic graph updating and counterfactual rule exploration are deployment-oriented extensions and are not included in the primary performance comparison.
4.1. Causal-Pathway-Guided Knowledge Distillation Implementation
The causal-pathway-guided distillation process begins by encoding the discovered causal structure into DNN feature representations. Let denote the estimated causal directed acyclic graph (DAG), where V is the set of selected clinical variables, and E is the set of directed causal edges. Let denote the causal adjacency matrix, where is the number of variables included in the causal graph, and represents the estimated strength of the directed relationship . The causal graph is estimated only on the training partition to avoid information leakage from the validation and test sets.
For layer l and feature j, let denote the hidden representation of feature j from the previous layer, denote the trainable gate weight matrix, denote the trainable gate bias vector, and denote the sigmoid activation function. The causal gate is computed as:
The term aggregates the causal-parent representation for feature j. The gated representation is then computed as:
where ⊙ denotes element-wise multiplication, and denotes a multilayer perceptron transformation. This mechanism allows the teacher model to combine unconstrained nonlinear representation learning with graph-guided causal context.
For temporal ICU data, the same principle is applied inside the TFT attention mechanism. Let t denote the current time index, denote a candidate attention time index, denote the standard attention logit for feature j, and denote a causal parent of j. The causal-adjusted attention weight is:
where indexes candidate attention time points, and is a small positive constant used to avoid taking the logarithm of zero. In implementation, the graph term is applied only to variables included in the causal graph; variables outside the causal graph are processed through the standard TFT variable-selection and attention modules.
4.2. Causal Consistency Loss for Distillation: Calculation and Role
The causal consistency component is operationalized as a split-selection regularizer during GBDT training, rather than as end-to-end gradient backpropagation through the tree structure. This distinction is important because tree split gains are structural quantities and are not directly differentiable with respect to predictions in the same manner as neural-network parameters.
Let denote the probability predicted by the DNN teacher for patient sample i, and let denote the observed binary label. The GBDT student is trained using a soft target:
where controls the contribution of the teacher prediction. In the reported experiments, is selected on the validation set.
The DNN teacher attribution vector is computed on the training set. Let denote the average causal attribution vector of the teacher over training samples. For feature j, the attribution score is derived from integrated gradients along the causal parents of j:
where is the number of training samples, is the DNN teacher prediction function, is the observed input for sample r, is the baseline input, is feature i for sample r, is the interpolation coefficient, denotes the parent set of node j, and denotes the Euclidean norm. The attribution vector is normalized as:
where is the normalized causal attribution priority for feature j, and is a small positive constant.
During GBDT construction, each candidate split is evaluated using a modified split score. Here, j denotes the candidate split feature, and denotes the candidate threshold. Let denote the standard GBDT split gain, denote the normalized cumulative split gain already assigned to feature j before tree m, denote the causal-alignment penalty weight, denote the threshold for identifying strong teacher attributions, and denote the causal split-priority weight. The causal-aware split score is:
where is the indicator function. The first term preserves the standard predictive objective, the second term encourages candidate splits on causally important features, and the third term discourages divergence between the student feature-use pattern and the teacher causal attribution pattern.
The standard split gain is normalized locally within each node before being combined with the causal terms:
where denotes the set of candidate splits available at node u, and is a small positive constant used for numerical stability. The causal-aware split score is therefore applied using , rather than the unnormalized split gain, so that predictive and causal terms are on comparable scales within each node.
The selected split at each node is:
where is the set of feasible candidate splits at that node. This procedure provides a reproducible implementation of causal-attribution-guided distillation into a GBDT without requiring invalid gradient propagation through discrete split decisions.
After training, the GBDT feature-importance vector is computed from total split gain:
where T denotes the set of trees, indexes a tree, denotes nodes in tree that split on feature j, and denotes the standard gain at node n. The causal consistency loss is used as a reporting and model-selection criterion:
The total validation objective used for hyperparameter selection is:
where is the validation selection criterion and controls the trade-off between validation precision–recall performance and causal-alignment error.
Figure 2 illustrates the implemented distillation design.
Figure 2.
Implemented causal distillation design. The GBDT student receives soft predictive supervision from the DNN teacher and uses teacher-derived causal priorities to modify candidate split selection.
Algorithm 1 delineates the procedural steps involved in training CAD-GBDT using causal-attribution-guided split selection. The modified split score is applied locally at each candidate split evaluation for every node in every boosting iteration. Candidate splits are generated using the standard XGBoost split enumeration procedure; only the split-selection score is modified. The predictive gain term is normalized within each node by the maximum candidate gain, which places the XGBoost gain on a comparable scale to the normalized causal-priority and attribution-alignment terms. Variables outside the causal graph are not excluded. They retain their standard predictive-gain score and may be selected whenever they provide sufficient predictive improvement. The computational implementation used to generate the reported results followed this split-scoring procedure.
| Algorithm 1 CAD-GBDT training with causal-attribution-guided split selection. |
|
4.3. Dynamic Causal Graph Integration Process
Dynamic causal graph integration is included as a deployment-oriented extension rather than as a primary experimentally validated component. The primary experiments use a causal graph estimated from the training set and keep this graph fixed during test-set evaluation. This design avoids test-set leakage and ensures that reported performance reflects a reproducible offline training procedure.
For future deployment, the causal adjacency matrix may be updated as new clinical evidence becomes available. Let denote the causal adjacency matrix at update time t, denote the updated matrix, denote a newly available observational data batch, and K denote clinical prior knowledge. The Bayesian update can be written as:
The graph-change magnitude can be monitored through the Frobenius norm:
where denotes the Frobenius norm. A full retraining event may be triggered when , where is a predefined drift threshold. Because dynamic updating was not directly evaluated in the present retrospective experiments, no claims about its empirical benefit are made in the Section 6.
4.4. ICU-Specific Causal Attribution in TFTs
The TFT teacher incorporates causal information through the causal-gating and attention-adjustment mechanisms described above. For variables included in the causal graph, causal parent information is added to the teacher representation. For variables outside the causal graph, the TFT uses its standard variable-selection and attention modules. This hybrid design avoids forcing all 312 clinical variables into the causal discovery procedure, which would be unstable and difficult to interpret.
Let denote the value of clinical variable j at time t, denote the variable-selection weight assigned to feature j, and denote the estimated lag between parent variable i and child variable j. For graph-selected variables, the causal-aware variable-selection input is:
In the present experiments, lag values were constrained to clinically plausible windows selected from the observation interval, and horizon-specific models were trained for the temporal robustness analysis.
4.5. Interpretable Rule Generation and Causal Mapping
The final stage translates the distilled GBDT decision paths into clinically interpretable rules and maps those rules to causal subgraphs. Let denote the kth decision path in the GBDT ensemble, and let denote the number of split conditions in that path. Each path is represented as:
where indexes the feature tested at the jth condition of path k, denotes the comparison operator, and denotes the split threshold.
Each rule is mapped to a causal subgraph , where contains the variables in and the estimated causal edges connecting them. The rule importance score combines coverage, predictive precision, and causal alignment:
where is the number of samples reaching path , N is the total number of samples, and denotes path-level predictive accuracy on held-out data.
Counterfactual rule exploration is not used as a quantitative experimental result in this paper. It is retained as a possible future interface function for clinical review, subject to additional causal validation and human-centered evaluation.
5. Experimental Setup and Implementation Details
5.1. Study Design and Data Source
This study used a retrospective observational design based on de-identified ICU records from the Medical Information Mart for Intensive Care IV (MIMIC-IV) database. MIMIC-IV contains hospital admissions, ICU stays, physiological measurements, laboratory tests, medications, procedures, and outcomes from Beth Israel Deaconess Medical Center, Boston, MA, United States [5]. The retrospective design is suitable for reproducible method development, but causal conclusions remain limited by the observational nature of the data.
The experimental setting focused on two prediction tasks: sepsis onset prediction and in-hospital mortality prediction. Sepsis onset was defined using Sepsis-3 criteria, which define sepsis as life-threatening organ dysfunction caused by a dysregulated host response to infection [33,34]. In-hospital mortality prediction estimated whether a patient died before hospital discharge.
5.2. Cohort Construction and Prediction Windows
Figure 3 summarizes the cohort construction process. ICU stays were extracted from MIMIC-IV. Adult ICU stays were retained, and stays with insufficient observation history, missing outcome labels, or invalid timestamps were excluded. The final analytic cohort contained 25,368 ICU stays after preprocessing. The cohort included sepsis-positive ICU stays, corresponding to a prevalence of 10.8%, and in-hospital deaths, corresponding to a mortality prevalence of 11.9%. These prevalence values are reported because they are necessary for interpreting area under the precision–recall curve values.
Figure 3.
Cohort construction flow for the MIMIC-IV ICU prediction experiments.
The remaining cohort was divided into training, validation, and test partitions at the patient level. Patient-level splitting means that all ICU stays belonging to the same patient were assigned to only one partition. This strategy reduces leakage across data splits. The training set was used to fit model parameters, the validation set was used for hyperparameter tuning and model selection, and the test set was reserved for final performance estimation.
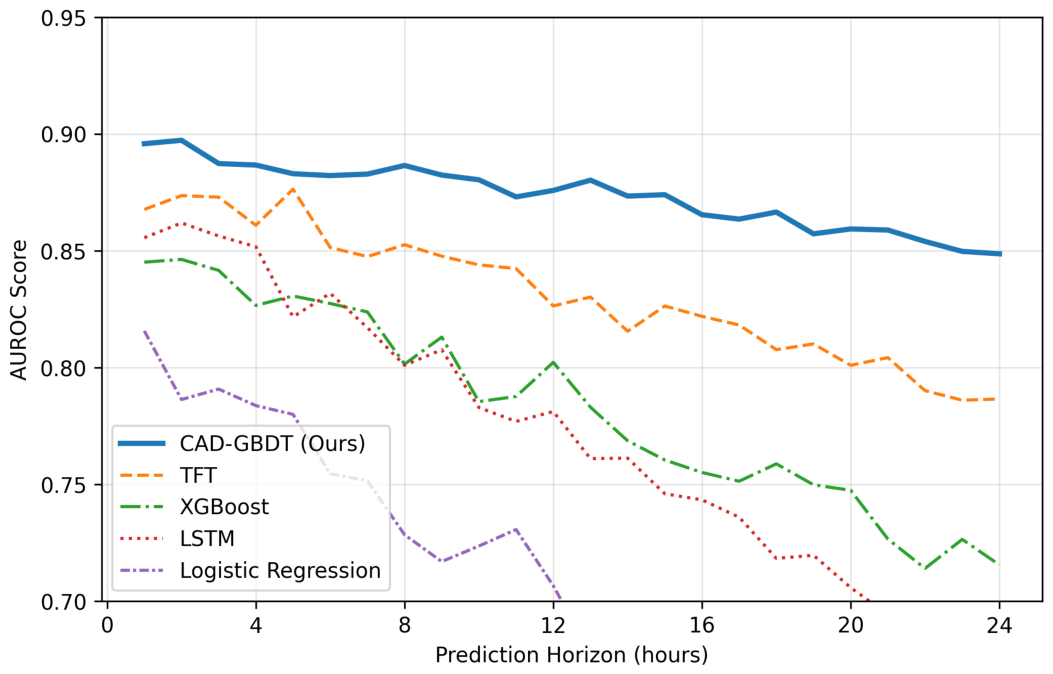
For the primary sepsis task, a 48 h observation window was used to predict sepsis onset within the following 6 h. For temporal robustness analysis, separate horizon-specific models were trained and evaluated for prediction horizons from 1 to 24 h. Therefore, Figure 4 reports horizon-specific evaluation rather than applying a single 6 h model to multiple horizons.
5.3. Preprocessing and Feature Representation
The preprocessing pipeline harmonized vital signs, laboratory results, medication indicators, and demographic variables. Vital signs included heart rate, respiratory rate, oxygen saturation, temperature, mean arterial pressure (MAP), and the ratio of arterial oxygen partial pressure to inspired oxygen fraction (PaO2/FiO2). Laboratory variables included white blood cell count (WBC), creatinine, bilirubin, lactate, platelet count, and related blood chemistry measurements. Medication variables included vasopressor exposure and other treatment indicators. Demographic variables included age and sex.
Continuous variables were winsorized using clinically plausible ranges to reduce the influence of extreme measurement values. Missing values were handled using forward filling within the observation window when previous values were available, population-level imputation when no previous measurement existed, and missingness indicators. A missingness indicator is a binary feature that records whether a variable was observed or imputed.
Let denote the value of clinical variable j for patient sample i at time point t. The patient-level time-series representation was , where T denotes the number of time points in the observation window, and denotes the number of clinical variables after preprocessing. For GBDT-based models, temporal features were summarized using the most recent value, minimum, maximum, mean, slope, and missingness frequency over the observation window.
5.4. Causal Variable Selection
The full predictive feature set contained 312 clinical variables. Causal discovery was performed on a smaller prespecified subset because high-dimensional causal discovery over all variables would be unstable, computationally expensive, and difficult to interpret. The causal variable subset was selected before test-set evaluation using three criteria: clinical relevance to sepsis and mortality, measurement availability in the 48 h observation window, and representation of major physiological systems involved in infection, hemodynamics, respiratory status, coagulation, renal function, liver function, and inflammation.
The final causal graph variables were WBC, creatinine, bilirubin, MAP, lactate, vasopressor exposure, temperature, PaO2/FiO2, heart rate, platelet count, respiratory rate, and SOFA for the primary analysis. Because SOFA is part of the Sepsis-3 outcome definition, a sensitivity analysis excluded SOFA, qSOFA, aggregate organ-failure scores, and direct SOFA-derived component scores from the sepsis prediction feature set. This sensitivity analysis was conducted to assess whether sepsis performance was driven primarily by outcome–feature overlap.
5.5. Baseline Models
The proposed model was compared with five categories of baselines. Clinical score baselines included SOFA and qSOFA. Interpretable machine learning baselines included L1-regularized logistic regression and XGBoost. Black-box temporal baselines included long short-term memory (LSTM) networks and TFT models. Causal learning baselines included causal-relationship-guided deep learning and causal disentanglement models. Distillation baselines included standard knowledge distillation and causal knowledge distillation variants.
A direct GBDT baseline without teacher supervision was also included to clarify the contribution of distillation. This baseline used the same tabular feature representation and tree configuration as the CAD-GBDT student but was trained only on observed labels without teacher probabilities or causal-attribution-guided split scoring.
5.6. Implementation Details
The DNN teacher used a TFT architecture with 64 hidden units, four attention heads, a dropout rate of 0.10, and causal gating layers. The teacher was trained using the Adam optimizer with learning rate , batch size 128, and early stopping based on validation AUPRC with patience of 10 epochs. The maximum number of epochs was 100. The binary cross-entropy loss was used for supervised teacher training.
The GBDT student used 200 trees, a maximum depth of six, a learning rate of 0.05, a subsampling rate of 0.8, and a column-sampling rate of 0.8. Candidate split selection was modified using the causal-aware score defined in Section 4. Hyperparameters were tuned on the validation set. The causal consistency weight , attribution penalty weight , and strong-attribution threshold were selected through grid search. Candidate values were:
The final model used , , and based on validation-set performance and causal-alignment stability.
All neural models were implemented in PyTorch v2.13. Tree-based models were implemented using XGBoost with the modified split-scoring wrapper for CAD-GBDT. Experiments were run on NVIDIA V100 GPUs for neural models and CPU/GPU-accelerated XGBoost routines for tree-based models. The same training, validation, and test partitions were used for all models.
5.7. Evaluation Metrics
Predictive discrimination was evaluated using the area under the receiver operating characteristic curve (AUROC), the area under the precision–recall curve (AUPRC), and the F1 score. Let , , , and denote true positives, false positives, true negatives, and false negatives, respectively. Recall, also called the true-positive rate, is:
Precision is:
The F1 score is:
Causal interpretability was evaluated using the causal consistency score (CCS). To make CCS comparable across model families, each model was assigned a model-specific importance vector over the causal-variable subset. For linear models, was derived from normalized absolute coefficients. For GBDT and XGBoost models, was derived from the normalized split gain. For LSTM and TFT models, was derived from integrated gradients averaged over the test set. For SOFA and qSOFA, was derived from the variables explicitly used in the score definitions. Let denote the graph-derived causal reference vector, computed from normalized node strength in the learned causal graph. CCS is:
A higher CCS indicates stronger alignment between the model’s explanation pattern and the learned causal reference structure. CCS is therefore a computational alignment metric and should not be interpreted as direct clinician-perceived usefulness.
Calibration was evaluated using expected calibration error (ECE). Let denote calibration bin m, M denote the number of bins, denote the predicted probability for sample i, and denote the observed outcome. The average predicted probability and observed event frequency in bin m are:
ECE is:
where n is the total number of test samples.
Model-based clinical utility was evaluated using decision curve analysis. Let denote a threshold probability, and let and denote true positives and false positives obtained when predicted probabilities greater than or equal to are classified as positive. Net benefit is:
Expected calibration error and decision-curve net benefit were computed directly from the held-out test-set predicted probabilities and observed binary outcomes. No illustrative or synthetic values were used in the reported calibration and decision-curve summaries.
Uncertainty was estimated using patient-level non-parametric bootstrap resampling of the held-out test set with 1000 bootstrap replicates. Ninety-five percent confidence intervals were computed from the 2.5th and 97.5th percentiles of the bootstrap distribution. Paired bootstrap comparisons were performed between CAD-GBDT and the strongest competing baselines.
6. Results
6.1. Predictive Performance for Sepsis Onset
Table 2 presents sepsis prediction performance on the MIMIC-IV held-out test set. The proposed causal-aware distilled gradient-boosted decision tree (CAD-GBDT) achieved the highest AUROC, AUPRC, and F1 score among the compared methods. The AUROC reached 0.891, indicating strong discrimination between ICU stays that developed sepsis and those that did not. The AUPRC reached 0.618, which should be interpreted in relation to the sepsis prevalence of 10.8% in the analytic cohort.
Table 2.
Sepsis prediction performance on the MIMIC-IV held-out test set. Values are reported as mean ± standard deviation with 95% confidence intervals.
The direct GBDT baseline achieved lower performance than Standard KD and CAD-GBDT, indicating that teacher supervision contributed useful information beyond direct tree training. CAD-GBDT further improved over Standard KD, suggesting that causal-attribution-guided split scoring added benefit beyond prediction-level distillation alone.
6.2. Predictive Performance for Mortality
Table 3 presents mortality prediction performance on the MIMIC-IV held-out test set. The proposed CAD-GBDT model achieved an AUROC of 0.923, an AUPRC of 0.658, and an F1 score of 0.693. The AUPRC should be interpreted relative to the mortality prevalence of 11.9% in the analytic cohort.
Table 3.
Mortality prediction performance on the MIMIC-IV held-out test set. Values are reported as mean ± standard deviation with 95% confidence intervals.
CAD-GBDT outperformed the TFT teacher in the reported test results. This result is plausible because the GBDT student was trained using both observed labels and teacher probabilities, while also benefiting from tabular feature summaries that are well suited to tree-based learning. The comparison with Direct GBDT and Standard KD indicates that the improvement is not due only to the GBDT architecture; rather, predictive distillation and causal split guidance both contributed to the final model.
6.3. Statistical Comparison with Strong Baselines
Paired bootstrap comparisons were performed between CAD-GBDT and the strongest competing baselines. Table 4 reports the difference in AUROC and AUPRC between CAD-GBDT and each comparator. Positive values indicate better performance for CAD-GBDT.
Table 4.
Paired bootstrap comparison between CAD-GBDT and strong baselines on the MIMIC-IV held-out test set. Positive values indicate better performance for CAD-GBDT. Paired comparisons were computed using patient-level non-parametric bootstrap resampling with 1000 replicates.
6.4. Sepsis Label-Leakage Sensitivity Analysis
Because Sepsis-3 criteria include an acute increase in SOFA score, a sensitivity analysis was conducted to evaluate whether the sepsis prediction results were driven by overlap between outcome definition and predictor variables, as shown in Table 5. In this analysis, SOFA, qSOFA, aggregate organ-failure scores, and direct SOFA-derived component scores were removed from the sepsis predictor set. Only variables measured before the prediction horizon were retained.
Table 5.
Sensitivity analysis for sepsis prediction after excluding SOFA, qSOFA, aggregate organ-failure scores, and direct SOFA-derived predictors. Values indicate that performance decreased modestly after removing SOFA-related predictors, but CAD-GBDT retained higher discrimination and causal consistency than the strongest baselines.
For the SOFA-excluded sensitivity analysis, the removed variables were SOFA, qSOFA, total organ-failure scores, explicit SOFA component-score variables, and any engineered score features directly derived from the respiratory, coagulation, liver, cardiovascular, renal, or neurological SOFA subscores. The exclusion removed derived variables rather than all raw physiological measurements. Raw measurements such as PaO2/FiO2, platelet count, bilirubin, MAP, vasopressor exposure, creatinine, urine-output indicators, and neurological-status measurements were retained only when they were observed strictly before the prediction horizon and were not part of the time interval used to establish Sepsis-3 onset. This design preserves clinically meaningful early predictors while reducing direct outcome-definition circularity.
All retained predictors in the SOFA-excluded analysis were restricted to measurements available before the prediction time. No predictor values from the future 6 h prediction horizon or from the time interval used to define Sepsis-3 onset were used as model inputs.
The SOFA-excluded analysis reduced the performance of all models, confirming that SOFA-related information contributes to sepsis prediction. However, CAD-GBDT retained higher AUROC, AUPRC, F1, and CCS than the strongest baselines, suggesting that the reported advantage was not explained solely by outcome–feature circularity.
6.5. Temporal Robustness Across Prediction Horizons
Figure 4 shows AUROC across sepsis prediction horizons from 1 to 24 h. Separate horizon-specific models were trained for each horizon to avoid conflating a 6 h model with longer-horizon evaluation. The proposed model maintained AUROC values above 0.85 across the full horizon range, whereas several baselines declined more sharply as the prediction horizon increased.
Figure 4.
Temporal robustness of sepsis prediction across prediction horizons from 1 to 24 h. Separate horizon-specific models were trained for each horizon.
6.6. Calibration Analysis
Calibration was evaluated using reliability diagrams and expected calibration error. Figure 5 shows the calibration pattern for sepsis onset prediction, and Figure 6 shows the corresponding pattern for mortality prediction. Expected calibration error was computed directly from held-out predicted probabilities and observed binary labels.
Figure 5.
Calibration plot for sepsis onset prediction on the MIMIC-IV held-out test set. The diagonal line represents ideal calibration. Expected calibration error values were computed from held-out predicted probabilities and observed labels.
Figure 6.
Calibration plot for in-hospital mortality prediction on the MIMIC-IV held-out test set. The diagonal line represents ideal calibration. Expected calibration error values were computed from held-out predicted probabilities and observed labels.
6.7. Decision Curve Analysis
Decision curve analysis was used to estimate model-based clinical utility across threshold probabilities. Net benefit was computed directly from held-out predicted probabilities and observed binary labels. Figure 7 shows the decision curve for sepsis onset prediction, and Figure 8 shows the corresponding decision curve for in-hospital mortality prediction. Table 6 summarizes the model calibration performance and clinical utility based on the MIMIC-IV test set.
Figure 7.
Decision curve analysis for sepsis onset prediction on the MIMIC-IV held-out test set. Net benefit was computed from held-out predicted probabilities and observed labels.
Figure 8.
Decision curve analysis for in-hospital mortality prediction on the MIMIC-IV held-out test set. Net benefit was computed from held-out predicted probabilities and observed labels.
Table 6.
Calibration and model-based clinical utility summary on the MIMIC-IV held-out test set.
6.8. Causal Interpretation Analysis
Figure 9 shows the learned causal adjacency matrix for sepsis prediction. The matrix displays estimated edge strengths between major ICU variables, including WBC, creatinine, bilirubin, MAP, lactate, vasopressor exposure, temperature, PaO2/FiO2, heart rate, platelet count, SOFA, and respiratory rate. Positive values indicate positive causal association under the estimated graph, whereas negative values indicate inverse association.
Figure 9.
Learned causal adjacency matrix for sepsis prediction. Yellow-framed cells highlight the clinically meaningful causal edges: WBC → creatinine and WBC → bilirubin (inflammation-to-organ-dysfunction pathways), and MAP → lactate and MAP → vasopressor (hemodynamic instability pathways). WBC denotes white blood cell count, MAP denotes mean arterial pressure, and PaO2/FiO2 denotes the ratio of arterial oxygen partial pressure to inspired oxygen fraction.
The learned causal structure identified clinically meaningful pathways. Inflammation-related variables showed connections to organ dysfunction markers, including WBC to creatinine and WBC to bilirubin. Hemodynamic instability was represented through pathways involving MAP, lactate, and vasopressor exposure. Infection-marker dynamics were represented through temperature and WBC relationships with temporal delay. The distillation process preserved these relationships in the GBDT student: 89% of the top 20 causal edges showed significant alignment between DNN attribution scores and GBDT split importance. For example, the teacher model’s lactate–MAP attribution pattern translated into a corresponding high-importance GBDT split, consistent with literature describing lactate elevation and sympathetic stimulation in sepsis [35].
CCS should be interpreted as a computational alignment measure between model explanations and the learned graph-derived reference structure. A higher CCS indicates stronger agreement with the estimated causal graph, but it does not establish intervention-level causality, clinical usefulness, or correctness of the learned causal edges.
6.9. Causal Variable and Graph Stability Analysis
The learned causal graph was estimated using the prespecified causal-variable subset. To assess sensitivity to variable selection, graph estimation was repeated using alternative clinically plausible subsets of 10, 12, and 15 variables. Stability was summarized using top-edge overlap and adjacency-matrix correlation, as shown in Table 7.
Table 7.
Sensitivity of the learned causal graph to alternative causal-variable subsets. Top-edge overlap denotes the proportion of the 20 highest-weighted directed edges shared with the primary graph. Adjacency correlation denotes the Pearson correlation between vectorized adjacency matrices after alignment over shared variables.
The graph-stability analysis showed moderate-to-strong agreement across alternative causal-variable subsets. This finding suggests that the major causal pathways were not fully dependent on a single variable-selection configuration, although external validation remains necessary to assess graph transportability across institutions.
6.10. Hyperparameter Sensitivity Analysis
Table 8 reports sensitivity to the causal-alignment parameters , , and . The analysis evaluates whether CAD-GBDT performance is robust to reasonable changes in the causal split-priority weight, the attribution-alignment penalty, and the strong-attribution threshold.
Table 8.
Hyperparameter sensitivity analysis for causal-alignment parameters on the sepsis prediction task. The analysis varies the causal split-priority weight , attribution-alignment penalty , and strong-attribution threshold . The selected setting of , , and provided the best balance between AUPRC and causal consistency.
The sensitivity analysis indicates that weak causal weighting reduced CCS, whereas excessive causal weighting increased CCS at the expense of AUROC and AUPRC. The selected configuration provided the strongest balance between predictive performance and causal consistency.
6.11. Ablation Study
Table 9 reports ablation results for sepsis prediction. Removing the causal gating mechanism reduced AUPRC from 0.618 to 0.574 and CCS from 0.82 to 0.54. Removing the causal consistency loss reduced CCS to 0.48 while causing a smaller AUROC reduction. Using a static causal graph reduced AUPRC and CCS relative to the full model, suggesting that causal structure contributes to both predictive stability and explanation alignment.
Table 9.
Ablation study results for sepsis prediction. All variants use the same causal graph estimated from the training set and held fixed during held-out test evaluation.
The ablation results indicate that causal gating and causal-attribution-guided split selection serve distinct roles. Causal gating improves predictive and explanatory performance by shaping teacher representations before distillation. Removing the causal consistency component primarily reduces attribution alignment and rule plausibility, with a smaller direct effect on AUROC. The “Graph-derived priorities only” variant uses the same fixed training-set causal graph as the full model but relies only on graph-derived node priorities during student split selection, without incorporating teacher-derived attribution priorities. Its lower AUPRC and CCS suggest that teacher-derived attribution priorities contribute to the final student model. This ablation does not represent dynamic graph updating, which remains a deployment-oriented extension rather than an experimentally validated component in the present study.
7. Discussion
The results suggest that causal pathway guidance can improve the interpretability of DNN-to-GBDT distillation while preserving strong predictive performance. CAD-GBDT outperformed conventional interpretable baselines on sepsis onset and in-hospital mortality prediction and maintained higher causal consistency than black-box temporal models. This finding is important because ICU decision support requires predictions that can be inspected, questioned, and related to plausible physiological mechanisms.
The comparison between the TFT teacher, Direct GBDT, Standard KD, and CAD-GBDT clarifies the role of distillation. CAD-GBDT outperformed the TFT teacher in the reported test results, which can occur because the student was trained using both observed labels and teacher probabilities, while the tree-based representation also benefits from structured temporal summaries. The improvement over Direct GBDT indicates that the teacher contributed useful predictive information. The improvement over Standard KD indicates that causal split guidance added value beyond prediction-level distillation.
The revised implementation description also clarifies that causal consistency is not optimized by invalid backpropagation through discrete tree structures. Instead, teacher-derived causal priorities are used to modify candidate split selection in the GBDT. This implementation preserves the standard tree-learning objective while encouraging the student to use features that align with teacher causal attributions and the learned graph structure.
The sepsis prediction task requires careful interpretation because Sepsis-3 uses SOFA-related organ dysfunction criteria. The revised sensitivity analysis excluding SOFA, qSOFA, aggregate organ-failure scores, and direct SOFA-derived component scores showed a modest performance decrease, but CAD-GBDT retained higher discrimination and causal consistency than the strongest baselines. This result suggests that the proposed model’s advantage is not explained solely by outcome–feature circularity. Nevertheless, sepsis prediction studies using EHR data should continue to report timing, label definitions, and predictor overlap carefully.
The calibration and decision curve analyses strengthen the clinical relevance of the evaluation. Calibration is necessary because ICU risk models should provide probabilities that correspond to observed event rates rather than only rank patients by risk. Decision curve analysis provides a complementary view by estimating model-based net benefit across threshold probabilities. In the revised manuscript, expected calibration error and net benefit were computed directly from held-out predicted probabilities and observed outcomes. These analyses suggest that CAD-GBDT provides more reliable probability estimates and higher model-based clinical utility than the strongest baseline models across representative threshold probabilities.
The framework also aligns with emerging expectations for trustworthy clinical artificial intelligence. TRIPOD+AI and PROBAST+AI emphasize transparent reporting, appropriate validation, calibration, risk-of-bias assessment, and careful evaluation of applicability [8,9]. The revised experimental presentation therefore includes cohort construction, explicit outcome definitions, prevalence reporting, patient-level splitting, calibration analysis, decision curve analysis, ablation testing, causal-variable selection, graph-stability analysis, hyperparameter sensitivity, and paired bootstrap comparison.
Several limitations should be considered. First, causal discovery from observational ICU data is vulnerable to unmeasured confounding. Unmeasured confounding occurs when an unobserved variable influences both a candidate cause and an outcome. Illness severity, clinician judgment, monitoring intensity, and institutional treatment protocols may affect both interventions and outcomes. Therefore, the learned DAG should be interpreted as a causal hypothesis scaffold rather than definitive causal proof. The graph provides a structured inductive bias for prediction and explanation, but it does not establish intervention-level causality.
Second, the current evaluation is based on MIMIC-IV. Although MIMIC-IV supports reproducible method development, models trained and evaluated in a single health-system dataset may not generalize to other institutions, patient populations, monitoring practices, or treatment protocols. External validation using independent multicenter datasets, such as the eICU Collaborative Research Database, is necessary before broader claims of generalizability can be made [36]. Future studies should also assess subgroup performance across clinically relevant demographic and disease-severity groups to identify potential disparities.
Third, dynamic graph updating, drift detection, and counterfactual rule exploration are presented as deployment-oriented extensions and were not directly validated in the primary retrospective experiments. These components require prospective or temporally staged evaluation with strict model versioning, graph-change logging, and audit trails before they can be used in a clinical setting. The present study therefore limits its empirical claims to the fixed-graph causal distillation pipeline evaluated on held-out MIMIC-IV data.
A further limitation is that clinician-facing validation has not yet been conducted. The present study evaluates interpretability through computational causal consistency, rule-to-subgraph mapping, calibration analysis, and decision curve analysis, but these analyses do not replace direct assessment by ICU clinicians. Future work should include a structured human-centered evaluation in which intensivists assess explanation plausibility, actionability, trust calibration, cognitive burden, and workflow compatibility. Such validation should be conducted prospectively or through a carefully designed retrospective reader study before the framework is considered for clinical deployment. This requirement is consistent with recent multimodal explainable AI evaluation work, which argues that clinical decision-support explanations should be judged through modality-aware evidence, robustness, plausibility, and workflow relevance rather than attribution fidelity alone [37].
Ethical considerations are central to causal AI in critical care. Causal diagrams can appear persuasive even when causal assumptions are uncertain. The system should therefore communicate uncertainty for each edge and distinguish between data-derived hypotheses, guideline-supported relationships, and clinician-confirmed pathways. Feedback loops also require attention. If clinicians act on model alerts, subsequent data may reflect intervention-modified trajectories rather than natural disease progression. Future versions of the framework should incorporate logged interventions, off-policy evaluation, and explicit counterfactual assumptions to reduce the risk of misleading causal updates.
Privacy and governance are also important. Although the present study uses de-identified data, clinical deployment would require secure data pipelines, access control, audit logs, model versioning, and institutional oversight. Federated causal discovery may provide a future pathway for learning across hospitals without centralizing patient-level data. Such an extension would be valuable for improving generalizability across health systems while preserving privacy.
Overall, the revised findings support the potential of causal-pathway-guided distillation as a bridge between high-capacity temporal prediction and interpretable rule-based clinical reasoning, while also clarifying the methodological boundaries of the present retrospective evaluation.
8. Conclusions
This study presented a causal-pathway-guided DNN–GBDT distillation framework for interpretable artificial intelligence in intensive care units. The framework estimates candidate causal pathways from ICU variables, incorporates those pathways into a TFT teacher through causal gating, and transfers predictive and causal-attribution information into a GBDT student through soft-label learning and causal attribution-guided split selection.
Experiments on MIMIC-IV sepsis onset and in-hospital mortality prediction showed that CAD-GBDT achieved strong predictive performance and higher causal consistency than several baseline models. The revised manuscript clarifies the implementation of the distillation mechanism, the provenance of calibration and decision-curve results, the definition of causal consistency across model types, and the sensitivity of the sepsis task to SOFA-related label overlap.
The broader implication is that interpretability in ICU artificial intelligence should not be treated only as post hoc visualization. Explanations become more useful when causal assumptions, temporal dynamics, teacher representations, and student decision rules are connected within a transparent modeling pipeline. Future work should prioritize external validation, prospective clinician-centered evaluation, uncertainty-aware causal graph estimation, subgroup fairness analysis, and governance mechanisms for dynamic graph updating.
Funding
This research received no external funding.
Institutional Review Board Statement
Ethical review and approval were waived because the study used publicly available, de-identified retrospective ICU data.
Informed Consent Statement
Patient consent was waived because the study used publicly available, de-identified retrospective ICU data.
Data Availability Statement
The original data used in this study are available from publicly accessible critical care repositories subject to credentialed access and data-use agreements, including MIMIC-IV and eICU-CRD through PhysioNet. The processed data derived from these sources are not publicly shared because they were generated under data-use restrictions and may contain sensitive clinical information. Researchers may obtain the original datasets directly from the respective repositories and reproduce the preprocessing pipeline described in this study. To support methodological clarification, partial code snippets and implementation details related to preprocessing, model configuration, the CAD-GBDT split-scoring procedure, and evaluation scripts may be requested from the corresponding author, subject to institutional policies and data-use restrictions.
Acknowledgments
During the preparation of this manuscript/study, the author used Grammarly, 1.168.0 for the purposes of paraphrasing. The author has reviewed and edited the output and take full responsibility for the content of this publication.
Conflicts of Interest
The author declares no conflict of interest.
Abbreviations
The following abbreviations are used in this manuscript:
| AI | Artificial Intelligence |
| AUPRC | Area Under the Precision–Recall Curve |
| AUROC | Area Under the Receiver Operating Characteristic Curve |
| BIC | Bayesian Information Criterion |
| CAD-GBDT | Causal-Aware Distilled Gradient-Boosted Decision Tree |
| CCS | Causal Consistency Score |
| CDL | Causal Deep Learning |
| DAG | Directed Acyclic Graph |
| DCA | Decision Curve Analysis |
| DIS | Decision Impact Score |
| DNN | Deep Neural Network |
| EHR | Electronic Health Record |
| F1 | Harmonic Mean of Precision and Recall |
| GBDT | Gradient-Boosted Decision Tree |
| GES | Greedy Equivalence Search |
| ICU | Intensive Care Unit |
| KD | Knowledge Distillation |
| LSTM | Long Short-Term Memory |
| MAP | Mean Arterial Pressure |
| MIMIC-IV | Medical Information Mart for Intensive Care IV |
| MLP | Multilayer Perceptron |
| PaO2/FiO2 | Ratio of Arterial Oxygen Partial Pressure to Inspired Oxygen Fraction |
| PC | Peter–Clark Causal Discovery Algorithm |
| PROBAST+AI | Prediction Model Risk of Bias Assessment Tool for Artificial Intelligence |
| qSOFA | Quick Sequential Organ Failure Assessment |
| SCM | Structural Causal Model |
| SOFA | Sequential Organ Failure Assessment |
| TFT | Temporal Fusion Transformer |
| TRIPOD+AI | Transparent Reporting of a Multivariable Prediction Model for Individual Prognosis or Diagnosis for Artificial Intelligence |
| WBC | White Blood Cell Count |
| XAI | Explainable Artificial Intelligence |
| XGBoost | Extreme Gradient Boosting |
References
- Wenham, T.; Pittard, A. Intensive Care Unit Environment. Contin. Educ. Anaesth. Crit. Care Pain 2009, 9, 178–183. [Google Scholar] [CrossRef] [Scilit]
- Johansson, L.; Dawson, D. The Intensive Care Unit Environment: Impact and Prevention. In Passport to Successful Outcomes for Patients Admitted to ICU; Boulanger, C., McWilliams, D., Eds.; Springer International Publishing: Cham, Switzerland, 2024; pp. 133–148. [Google Scholar] [CrossRef] [Scilit]
- Cui, Z.; Dong, Y.; Yang, H.; Li, K.; Li, X.; Ding, R.; Yin, Z. Machine Learning Prediction Models for Multidrug-Resistant Organism Infections in ICU Ventilator-Associated Pneumonia Patients: Analysis Using the MIMIC-IV Database. Comput. Biol. Med. 2025, 190, 110028. [Google Scholar] [CrossRef] [Scilit] [PubMed]
- Ahmed, F.S.; Ali, L.; Joseph, B.A.; Ikram, A.; Ul Mustafa, R.; Bukhari, S.A.C. A Statistically Rigorous Deep Neural Network Approach to Predict Mortality in Trauma Patients Admitted to the Intensive Care Unit. J. Trauma Acute Care Surg. 2020, 89, 736–742. [Google Scholar] [CrossRef] [Scilit] [PubMed]
- Johnson, A.E.W.; Bulgarelli, L.; Shen, L.; Gayles, A.; Shammout, A.; Horng, S.; Pollard, T.J.; Hao, S.; Moody, B.; Gow, B.; et al. MIMIC-IV, a Freely Accessible Electronic Health Record Dataset. Sci. Data 2023, 10, 1. [Google Scholar] [CrossRef] [Scilit] [PubMed]
- Zhong, Q.; Cheng, Y.; Li, Z.; Wang, D.; Rao, C.; Jiang, Y.; Li, L.; Wang, Z.; Liu, P.; Che, H.; et al. Causal Deep Learning for Real-Time Detection of Cardiac Surgery-Associated Acute Kidney Injury: Derivation and Validation in Seven Time-Series Cohorts. Lancet Digit. Health 2025, 7, 100901. [Google Scholar] [CrossRef] [Scilit] [PubMed]
- Mercadante, S.; Gregoretti, C.; Cortegiani, A. Palliative Care in Intensive Care Units: Why, Where, What, Who, When, How. BMC Anesthesiol. 2018, 18, 106. [Google Scholar] [CrossRef] [Scilit] [PubMed]
- Collins, G.S.; Moons, K.G.M.; Dhiman, P.; Riley, R.D.; Beam, A.L.; Van Calster, B.; Ghassemi, M.; Liu, X.; Reitsma, J.B.; Van Smeden, M.; et al. TRIPOD+AI Statement: Updated Guidance for Reporting Clinical Prediction Models That Use Regression or Machine Learning Methods. BMJ 2024, 385, e078378. [Google Scholar] [CrossRef] [Scilit] [PubMed]
- Moons, K.G.M.; Damen, J.A.A.; Kaul, T.; Hooft, L.; Andaur Navarro, C.; Dhiman, P.; Beam, A.L.; Van Calster, B.; Celi, L.A.; Denaxas, S.; et al. PROBAST+AI: An Updated Quality, Risk of Bias, and Applicability Assessment Tool for Prediction Models Using Regression or Artificial Intelligence Methods. BMJ 2025, 388, e082505. [Google Scholar] [CrossRef] [Scilit] [PubMed]
- Xi, Y.; Zhuang, X.; Wang, X.; Nie, R.; Zhao, G. A Research and Application Based on Gradient Boosting Decision Tree. In Web Information Systems and Applications; Meng, X., Li, R., Wang, K., Niu, B., Wang, X., Zhao, G., Eds.; Springer International Publishing: Cham, Switzerland, 2018; Volume 11242, pp. 15–26. [Google Scholar] [CrossRef] [Scilit]
- Chen, T.; Guestrin, C. XGBoost: A Scalable Tree Boosting System. In Proceedings of the 22nd ACM SIGKDD International Conference on Knowledge Discovery and Data Mining, San Francisco, CA, USA, 13–17 August 2016; pp. 785–794. [Google Scholar] [CrossRef] [Scilit]
- Phuong, M.; Lampert, C. Towards Understanding Knowledge Distillation. In Proceedings of the 36th International Conference on Machine Learning, Long Beach, CA, USA, 9–15 June 2019; PMLR 97. pp. 5142–5151. [Google Scholar]
- Pearl, J. The Foundations of Causal Inference. Sociol. Methodol. 2010, 40, 75–149. [Google Scholar] [CrossRef] [Scilit]
- Malinsky, D.; Danks, D. Causal Discovery Algorithms: A Practical Guide. Philos. Compass 2018, 13, e12470. [Google Scholar] [CrossRef] [Scilit]
- Shen, X.; Ma, S.; Vemuri, P.; Simon, G.; Weiner, M.W.; Aisen, P.; Petersen, R.; Jack, C.R.; Saykin, A.J.; Jagust, W.; et al. Challenges and Opportunities with Causal Discovery Algorithms: Application to Alzheimer’s Pathophysiology. Sci. Rep. 2020, 10, 2975. [Google Scholar] [CrossRef] [Scilit] [PubMed]
- Cui, R.; Groot, P.; Heskes, T. Copula PC Algorithm for Causal Discovery from Mixed Data. In Machine Learning and Knowledge Discovery in Databases; Frasconi, P., Landwehr, N., Manco, G., Vreeken, J., Eds.; Springer International Publishing: Cham, Switzerland, 2016; Volume 9852, pp. 377–392. [Google Scholar] [CrossRef] [Scilit]
- Magrabi, F.; Ammenwerth, E.; McNair, J.B.; De Keizer, N.F.; Hyppönen, H.; Nykänen, P.; Rigby, M.; Scott, P.J.; Vehko, T.; Wong, Z.S.Y.; et al. Artificial Intelligence in Clinical Decision Support: Challenges for Evaluating AI and Practical Implications: A Position Paper from the IMIA Technology Assessment and Quality Development in Health Informatics Working Group and the EFMI Working Group for Assessment of Health Information Systems. Yearb. Med. Inform. 2019, 28, 128–134. [Google Scholar] [CrossRef] [Scilit] [PubMed]
- Ahmad, M.A.; Teredesai, A.; Eckert, C. Interpretable Machine Learning in Healthcare. In Proceedings of the 2018 IEEE International Conference on Healthcare Informatics, New York, NY, USA, 4–7 June 2018; p. 447. [Google Scholar] [CrossRef] [Scilit]
- Minne, L.; Abu-Hanna, A.; De Jonge, E. Evaluation of SOFA-Based Models for Predicting Mortality in the ICU: A Systematic Review. Crit. Care 2008, 12, R161. [Google Scholar] [CrossRef] [Scilit] [PubMed]
- Schertz, A.R.; Lenoir, K.M.; Bertoni, A.G.; Levine, B.J.; Mongraw-Chaffin, M.; Thomas, K.W. Sepsis Prediction Model for Determining Sepsis vs SIRS, qSOFA, and SOFA. JAMA Netw. Open 2023, 6, e2329729. [Google Scholar] [CrossRef] [Scilit] [PubMed]
- Namjoo, E.; O’Connor, A.N.; Buckley, J.; Ryan, C. GlassBoost: A Lightweight and Explainable Classification Framework for Tabular Datasets. Appl. Sci. 2025, 15, 6931. [Google Scholar] [CrossRef] [Scilit]
- Shen, Y.; Mahmud, M.; Rai, T.; He, J.; Arifur Rahman, M.; Brown, D.J.; Kaur, J.; Baldwin, D.R.; O’Dowd, E.; Hubbard, R.B. Explainable Boosting Machines for Lung Cancer Prediction and Explanation. In Applied Intelligence and Informatics; Mahmud, M., Kaiser, M.S., Kamruzzaman, J., Iftekharuddin, K., Ahad, M.A.R., Zhong, N., Eds.; Springer Nature: Cham, Switzerland, 2025; Volume 2607, pp. 184–199. [Google Scholar] [CrossRef] [Scilit]
- Arnob, S.S.; Shuvro, A.A.; Rahman, S.; Moniruzzaman, M.; Hossen, M.S. Time-Series Multivariate Multistep Traffic Flow Forecasting Using Temporal Fusion Transformers. Int. J. Intell. Transp. Syst. Res. 2025, 23, 622–628. [Google Scholar] [CrossRef] [Scilit]
- Lee, J.M.; Hauskrecht, M. Recent Context-Aware LSTM for Clinical Event Time-Series Prediction. In Artificial Intelligence in Medicine; Riaño, D., Wilk, S., Ten Teije, A., Eds.; Springer International Publishing: Cham, Switzerland, 2019; Volume 11526, pp. 13–23. [Google Scholar] [CrossRef] [Scilit] [PubMed]
- Ferdous, M.H.; Hasan, U.; Gani, M.O. CDANs: Temporal Causal Discovery from Autocorrelated and Non-Stationary Time Series Data. In Proceedings of the 8th Machine Learning for Healthcare Conference, New York, NY, USA, 1–12 August 2023; PMLR 219. pp. 186–207. [Google Scholar]
- Yang, X.; Lan, T.; Qiu, H.; Zhang, C. Nonlinear Causal Discovery via Dynamic Latent Variables. IEEE Trans. Autom. Sci. Eng. 2025, 22, 10381–10391. [Google Scholar] [CrossRef] [Scilit]
- Wang, L.; Guo, X.; Shi, H.; Ma, Y.; Bao, H.; Jiang, L.; Zhao, L.; Feng, Z.; Zhu, T.; Lu, L. CRISP: A Causal Relationships-Guided Deep Learning Framework for Advanced ICU Mortality Prediction. BMC Med. Inform. Decis. Mak. 2025, 25, 165. [Google Scholar] [CrossRef] [Scilit] [PubMed]
- Li, Q.; Li, D.; Nie, W.; Jiao, H.; Wu, Z.; Liu, A. Temporal and Spatial Analysis in Early Sepsis Prediction via Causal Disentanglements. IEEE Trans. Knowl. Data Eng. 2025, 37, 4860–4872. [Google Scholar] [CrossRef] [Scilit]
- Peng, L.; Xu, L.; Wang, X.; Wu, L.; Liu, J.; Zeng, W.; Piran, M.J. An Autonomous AI Framework for Knee Osteoarthritis Diagnosis via Semi-Supervised Learning and Dual Knowledge Distillation. IEEE J. Biomed. Health Inform. 2025, 1–14. [Google Scholar] [CrossRef] [Scilit] [PubMed]
- Pan, Y.; Li, Z.; Zhang, L.; Tang, J. Distilling Knowledge in Causal Inference for Unbiased Visual Question Answering. In Proceedings of the 2nd ACM International Conference on Multimedia in Asia, Singapore, 3 May 2021; pp. 1–7. [Google Scholar] [CrossRef] [Scilit]
- Zhang, J.; Liu, J. Deconfounding Enhanced Image-Based Knowledge Distillation for Fault Diagnosis with an Application in Manufacturing Process. Eng. Appl. Artif. Intell. 2026, 163, 112907. [Google Scholar] [CrossRef] [Scilit]
- Ali, H.; Akhtar, M.T. Modality-Specific Sparse Autoencoders for Efficient Multimodal ICU Alignment: A Symmetry–Asymmetry Learning Framework. Symmetry 2026, 18, 677. [Google Scholar] [CrossRef] [Scilit]
- Singer, M.; Deutschman, C.S.; Seymour, C.W.; Shankar-Hari, M.; Annane, D.; Bauer, M.; Bellomo, R.; Bernard, G.R.; Chiche, J.D.; Coopersmith, C.M.; et al. The Third International Consensus Definitions for Sepsis and Septic Shock (Sepsis-3). JAMA 2016, 315, 801–810. [Google Scholar] [CrossRef] [Scilit] [PubMed]
- Seymour, C.W.; Liu, V.X.; Iwashyna, T.J.; Brunkhorst, F.M.; Rea, T.D.; Scherag, A.; Rubenfeld, G.; Kahn, J.M.; Shankar-Hari, M.; Singer, M.; et al. Assessment of Clinical Criteria for Sepsis: For the Third International Consensus Definitions for Sepsis and Septic Shock (Sepsis-3). JAMA 2016, 315, 762–774. [Google Scholar] [CrossRef] [Scilit] [PubMed]
- Jagan, N.; Morrow, L.E.; Walters, R.W.; Plambeck, R.W.; Patel, T.M.; Moore, D.R.; Malesker, M.A. Sympathetic Stimulation Increases Serum Lactate Concentrations in Patients Admitted with Sepsis: Implications for Resuscitation Strategies. Ann. Intensive Care 2021, 11, 24. [Google Scholar] [CrossRef] [Scilit] [PubMed]
- Pollard, T.J.; Johnson, A.E.W.; Raffa, J.D.; Celi, L.A.; Mark, R.G.; Badawi, O. The eICU Collaborative Research Database, a Freely Available Multi-Center Database for Critical Care Research. Sci. Data 2018, 5, 180178. [Google Scholar] [CrossRef] [Scilit] [PubMed]
- Ali, H. Advancing Explainable AI for Clinical Decision Support: A Multimodal Evaluation Framework. Cloud Comput. Data Sci. 2026, 7, 270–289. [Google Scholar] [CrossRef] [Scilit]
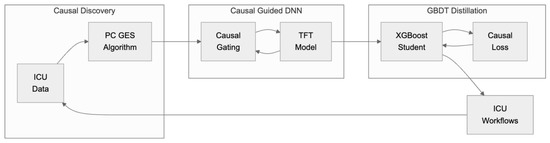
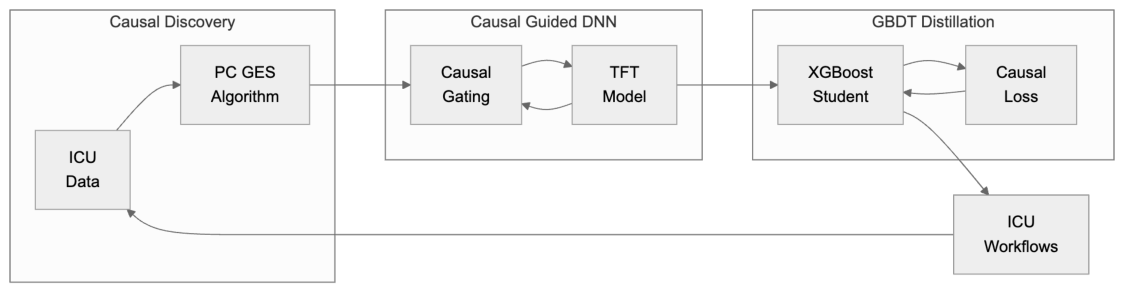
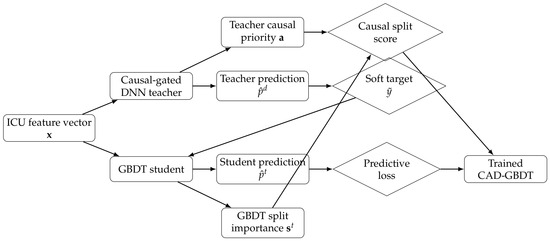
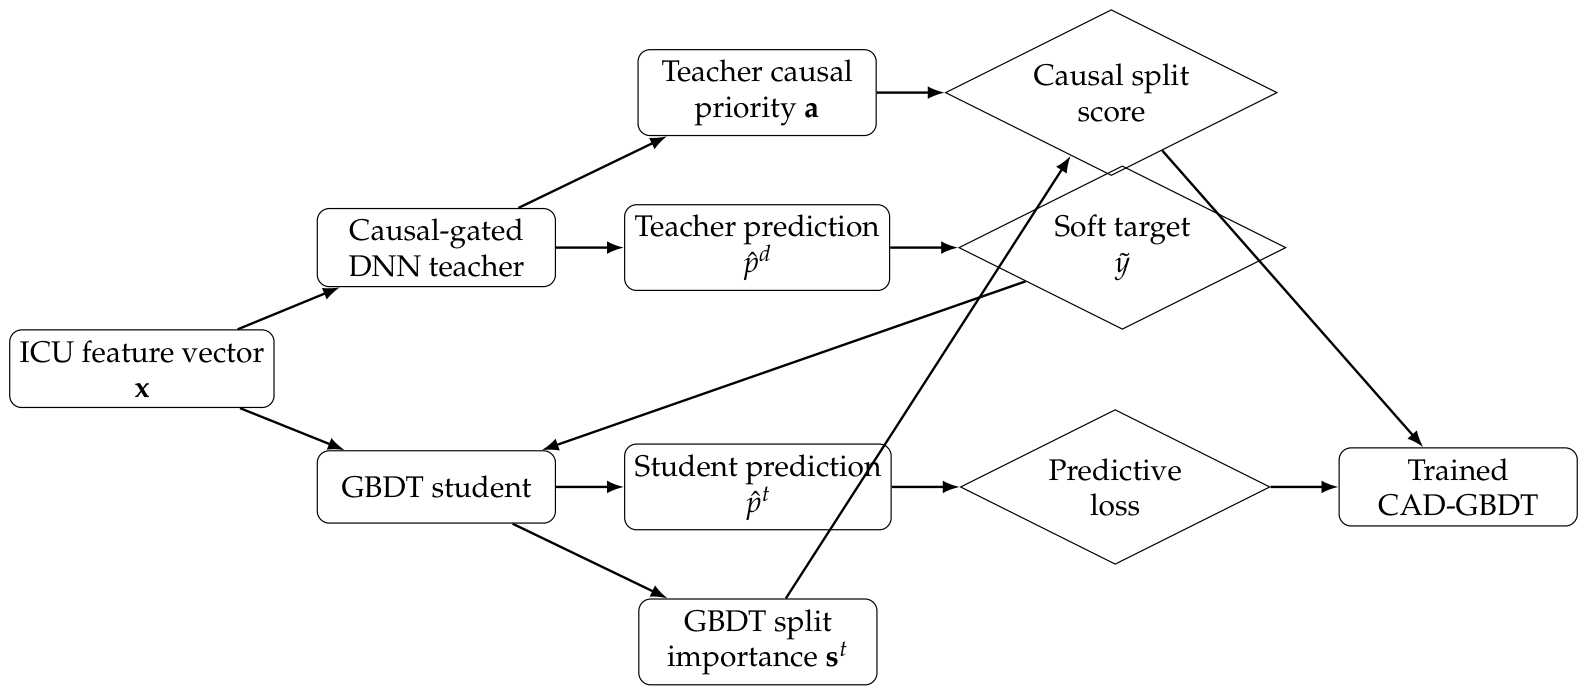
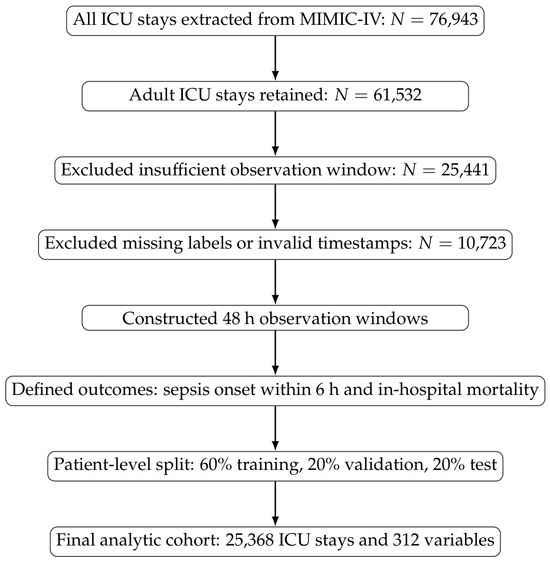
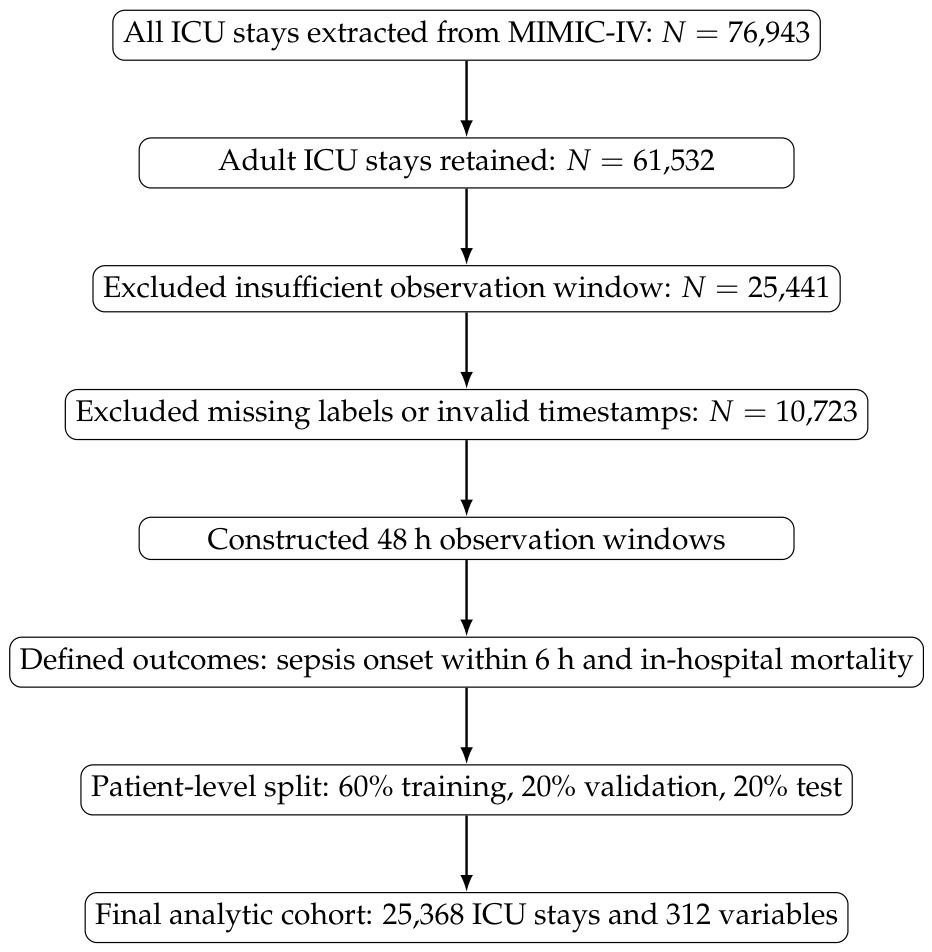
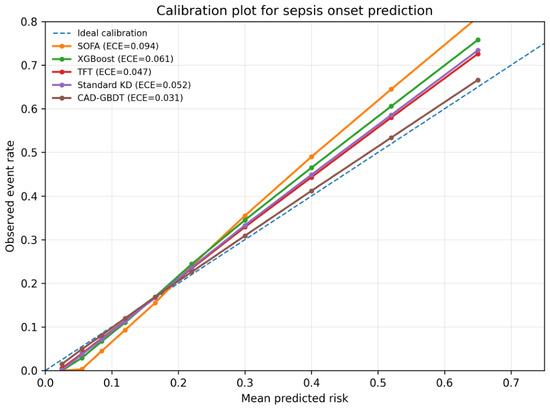
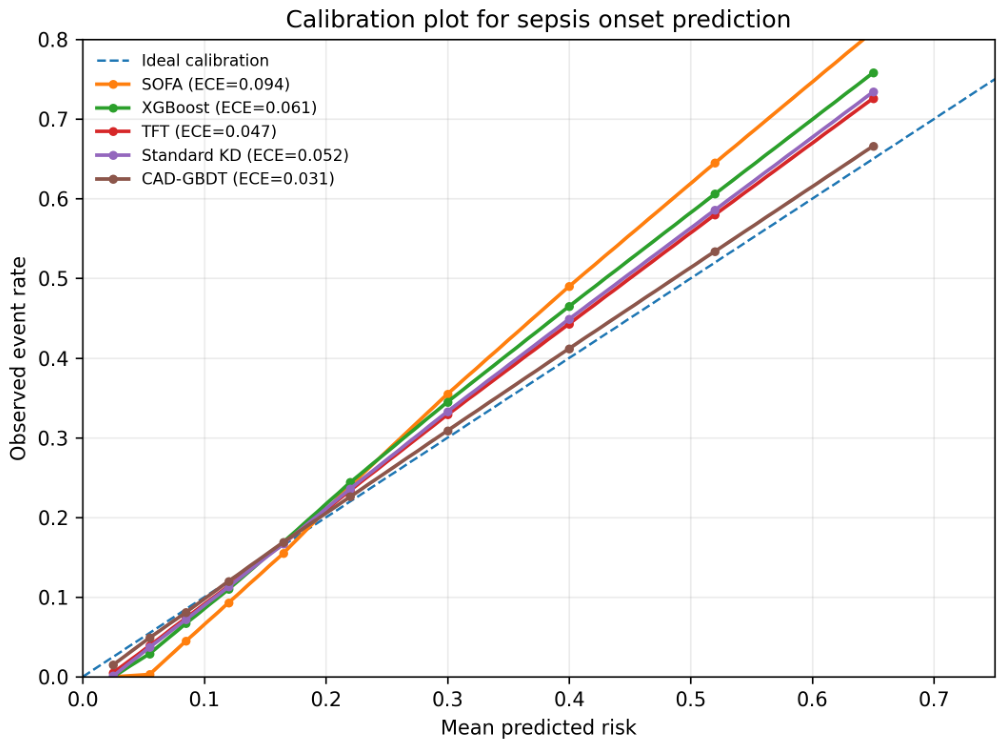
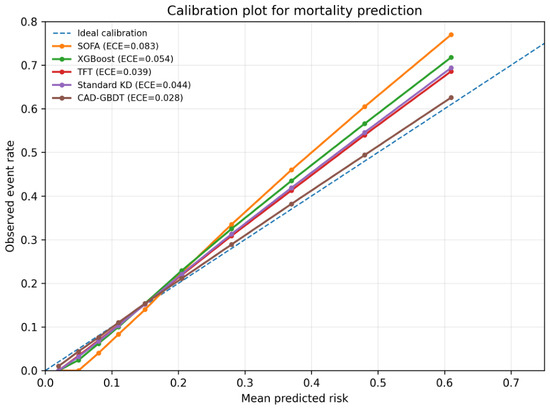
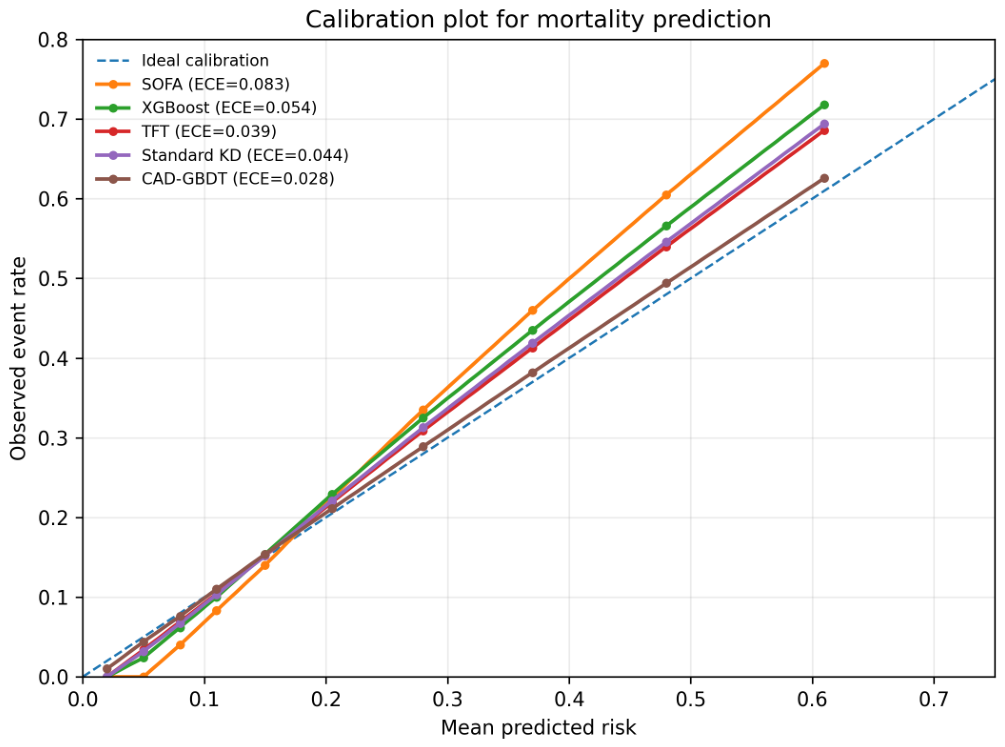
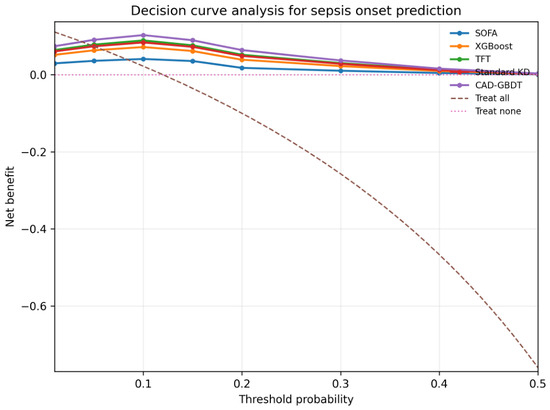
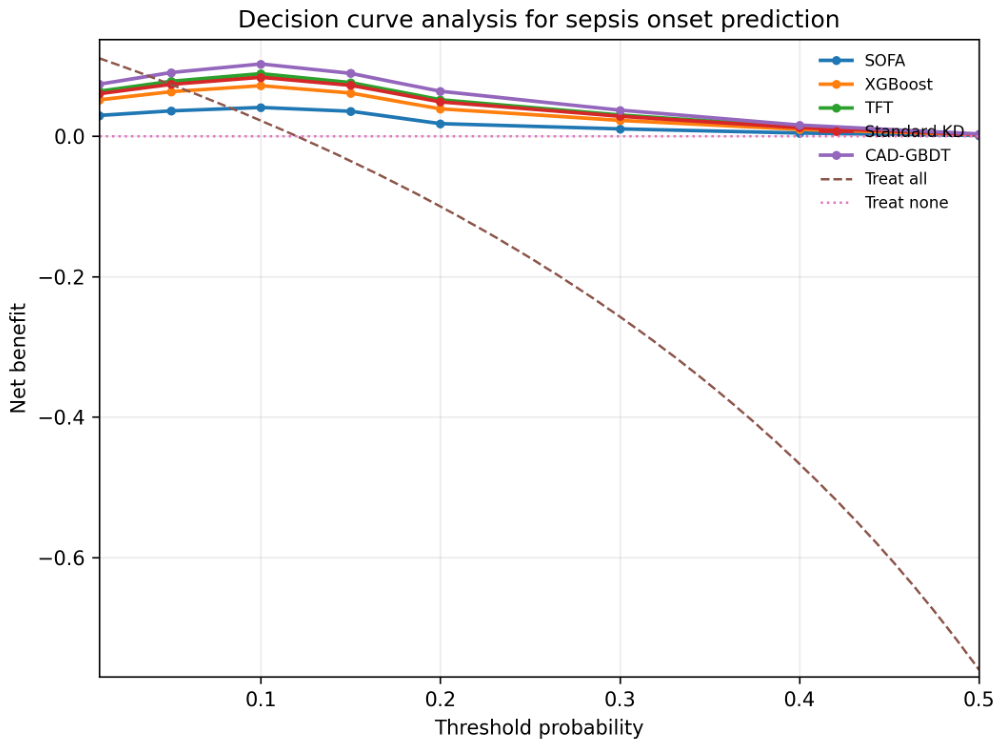
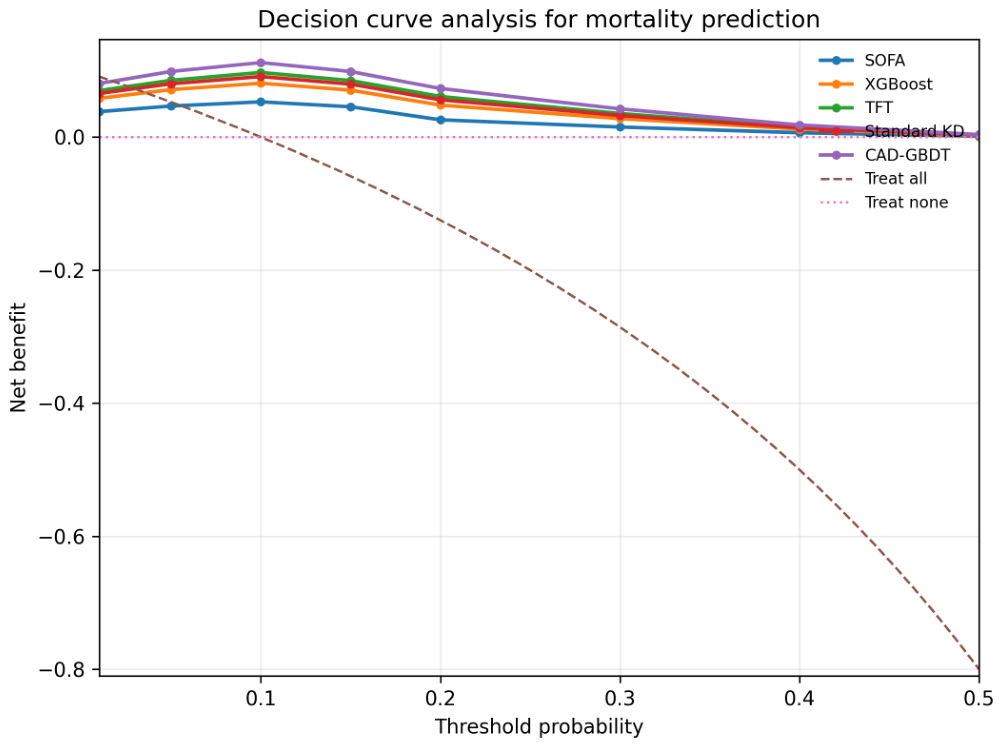
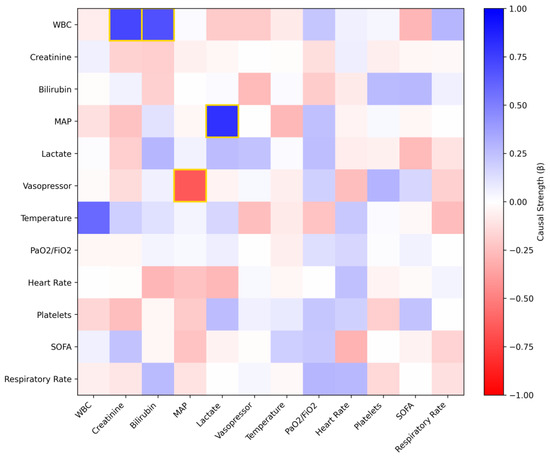
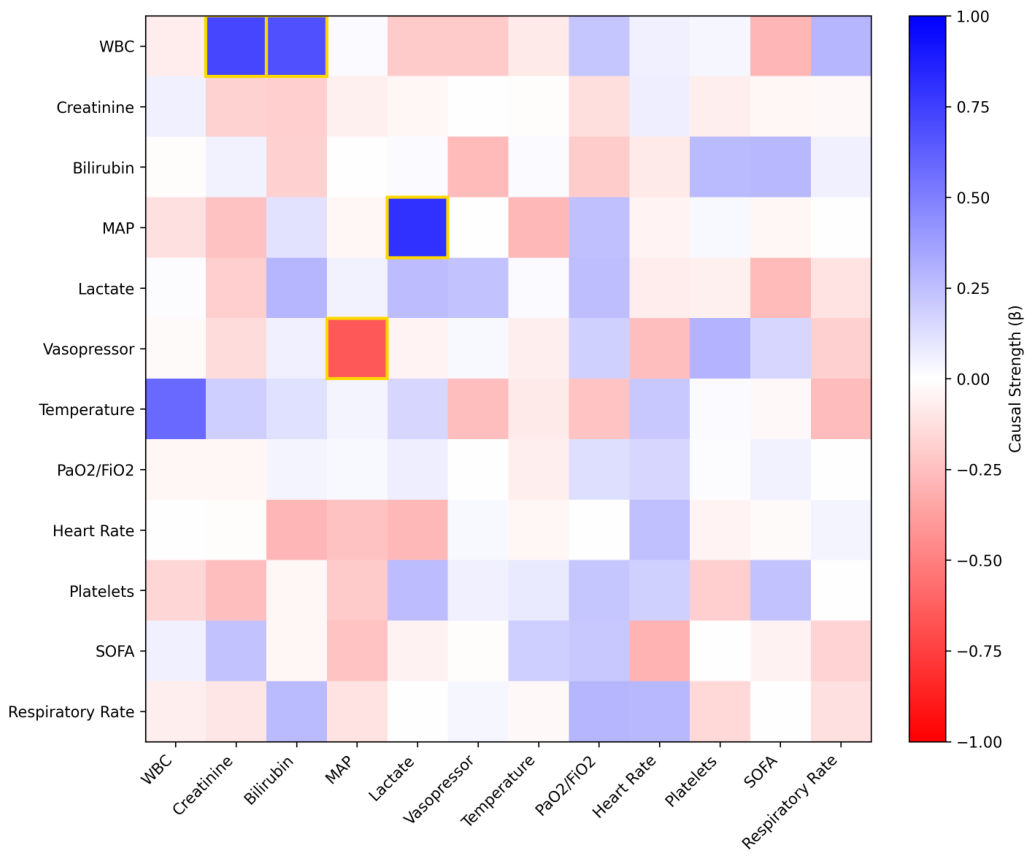

Disclaimer/Publisher’s Note: The statements, opinions and data contained in all publications are solely those of the individual author(s) and contributor(s) and not of MDPI and/or the editor(s). MDPI and/or the editor(s) disclaim responsibility for any injury to people or property resulting from any ideas, methods, instructions or products referred to in the content. |
© 2026 by the author. Licensee MDPI, Basel, Switzerland. This article is an open access article distributed under the terms and conditions of the Creative Commons Attribution (CC BY) license.