


Abstract
Accurate classification of cognitive levels in instructional dialogues is essential for personalized education and intelligent teaching systems. However, most existing methods predominantly rely on static textual features and a shallow semantic analysis. They often overlook dynamic temporal interactions and struggle with class imbalance. To address these limitations, this study proposes a novel framework for cognitive-level classification. This framework integrates time entropy-enhanced dynamics with a dynamically weighted, heterogeneous ensemble strategy. Specifically, we reconstruct the original Multi-turn Classroom Dialogue (MCD) dataset by introducing time entropy to quantify teacher–student speaking balance and semantic richness features based on Term Frequency-Inverse Document Frequency (TF-IDF), resulting in an enhanced MCD-temporal dataset. We then design a Dynamic Weighted Heterogeneous Ensemble (DWHE), which adjusts weights based on the class distribution. Our framework achieves a state-of-the-art macro-F1 score of 0.6236. This study validates the effectiveness of incorporating temporal dynamics and adaptive ensemble learning for robust cognitive level assessment, offering a more powerful tool for educational AI applications.
1. Introduction
Accurately assessing students’ cognitive levels is a critical component of achieving personalized teaching and remains a core challenge in the field of educational artificial intelligence [1]. This study tackles a key research question: How can we effectively improve cognitive level classification in instructional dialogues? The goal is to enhance both classification accuracy and robustness. This will be achieved by integrating temporal dynamic features, such as time entropy and semantic richness. Additionally, a dynamically weighted heterogeneous ensemble strategy will be used. The approach specifically addresses the common challenge of class imbalance.
Nowadays, main research methods suffer from significant limitations. Current assessment systems overly rely on static textual features [2] and a shallow semantic analysis [3], and fail to adequately consider the systematic impact of two key factors in the teaching process: dynamic temporal behavioral features and differences in teaching styles [4] on learning effectiveness. Furthermore, models struggle with the prevalent class imbalance [5], which leads to poor performance on minority classes. Although Chen et al. (2024) released the MCD dataset [6], providing an essential foundational resource for dialogue understanding research, but it lacks quantitative representation of temporal features (e.g., time entropy calculation [7]) and fails to establish a classification framework for teaching styles, severely limiting the optimization potential of adaptive teaching strategies in educational practice.
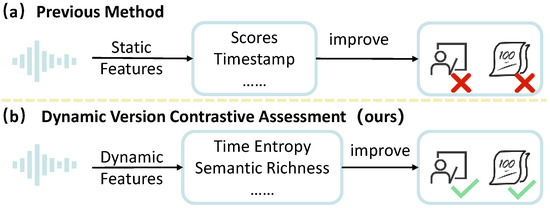
As illustrated in Figure 1a, the research motivation diagram, traditional methods rely on static features and fractional timestamps [8], making it difficult to comprehensively characterize the essence of instructional dialogues, which hinders the enhancement of student cognitive levels and teaching quality.
Figure 1.
Conceptual contrast between previous static assessment methods and our proposed temporally dynamic assessment framework. (a) Previous Assessment. (b) Proposed dynamic assessment.
To address these limitations, this study proposes a novel framework (Figure 1b) that shifts the paradigm from static feature analysis to modeling instructional dynamics. Building on established uses of entropy to quantify patterns in educational settings [9], we introduce time entropy, a metric that operationalizes this shift by quantifying the balance of teacher–student speaking turns. Combined with semantic richness [10] and other dynamic features, this measure enables the direct assessment of teaching quality and student engagement as interactions unfold.
Moreover, this study starts with comprehensive data preprocessing and feature extraction, followed by teaching style based on the time entropy calculation, a semantic analysis, identification of golden speeches via a weighted scoring mechanism, and finally an ensemble modeling strategy utilizing four machine learning algorithms. The algorithms include Extreme Gradient Boosting (XGBoost [11]), Light Gradient Boosting Machine (LightGBM [12]) combined with stratified k-Fold cross-validation [13], and Synthetic Minority Over-Sampling Technique (SMOTE [14]) oversampling techniques to address the class imbalance problem. The comparison of the deficiencies in the previous work and our contributions are shown in Appendix A.
Our contributions in this work are summarized as follows:
- 1.
- We propose time entropy and semantic richness features to dynamically quantify teaching style and dialogue quality, moving beyond static textual analysis.
- 2.
- We design a DWHE that adaptively fuses XGBoost [11] and LightGBM [12], innovating in handling class imbalance with a data-driven weighting strategy.
- 3.
- We construct the MCD-temporal dataset, enhancing the original MCD dataset with nine dynamic features to support temporal-semantic research in education.
- 4.
- We demonstrate superior and robust performance, achieving a macro-F1 score of 0.6236 and showing significant gains on the challenging minority class.
2. Related Work
2.1. Current State and Challenges of Cognitive Assessment in Instructional Dialogues
Current research on cognitive level classification in instructional dialogues predominantly relies on static textual features (e.g., word frequency [15], syntactic structures [16]), and a shallow semantic analysis, and fails to model the dynamic interactions inherent in teaching processes. Most studies employ traditional machine learning methods [17] or single deep learning models and overlook the temporal structure of dialogues and the moderating effect of teaching style. Moreover, the prevalent issue of class imbalance further exacerbates model training, leading to poor performance on minority classes. Although existing resources like the MCD dataset provide a foundation for multi-turn dialogue understanding, they lack dynamic features such as time entropy and quantitative teaching style representations, which limits the adaptability and interpretability of models in real educational settings [18]. Our work addresses these gaps by reconstructing the MCD dataset into MCD-temporal dataset, incorporating temporal dynamics and semantic richness features and proposing a dynamic ensemble framework specifically designed for imbalanced educational data.
2.2. Application and Limitations of Temporal Dynamic Features in the Educational Analysis
Temporal dynamic features (e.g., speech rhythm, response latency) have recently been introduced into the educational analysis to capture temporal patterns in teaching interactions. Time entropy, as a metric for measuring the balance of teacher–student speaking time, has shown preliminary correlations with teaching style and cognitive engagement. However, existing studies often rely on theoretical thresholds for style categorization, lack data-driven adaptive classification methods, and fail to deeply integrate temporal features with semantic information. Furthermore, traditional approaches overlook the synergy between temporal features and semantic richness. This oversight prevents them from building a unified representation for fine-grained cognitive level assessment. In contrast, our methodology introduces a data-driven percentile-based approach for teaching style classification and jointly models temporal entropy with latent semantic density to create a more holistic feature set for cognitive level prediction.
2.3. Advances in Ensemble Learning for Imbalanced Educational Data
To address class imbalance in educational data, ensemble learning methods [19] such as XGBoost [11] and LightGBM [12] are widely adopted, which leverage weighted loss functions or sampling strategies [20] to improve minority class recognition. However, current methods mostly employ homogeneous ensembles or static weighting schemes and fail to fully exploit the complementary strengths of heterogeneous models. Particularly in instructional dialogues, significant variations in data distribution across teaching style necessitate dynamic weight adjustment mechanisms. The proposed DWHE framework innovatively combines the cost-sensitive learning [21] of XGBoost with the automatic class balancing of LightGBM [12] and employs a data-driven weighting strategy to achieve more accurate and robust classification across cognitive levels.
3. Dataset
3.1. Dataset Reconstruction and Enhancement
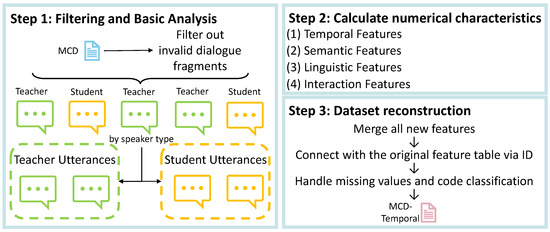
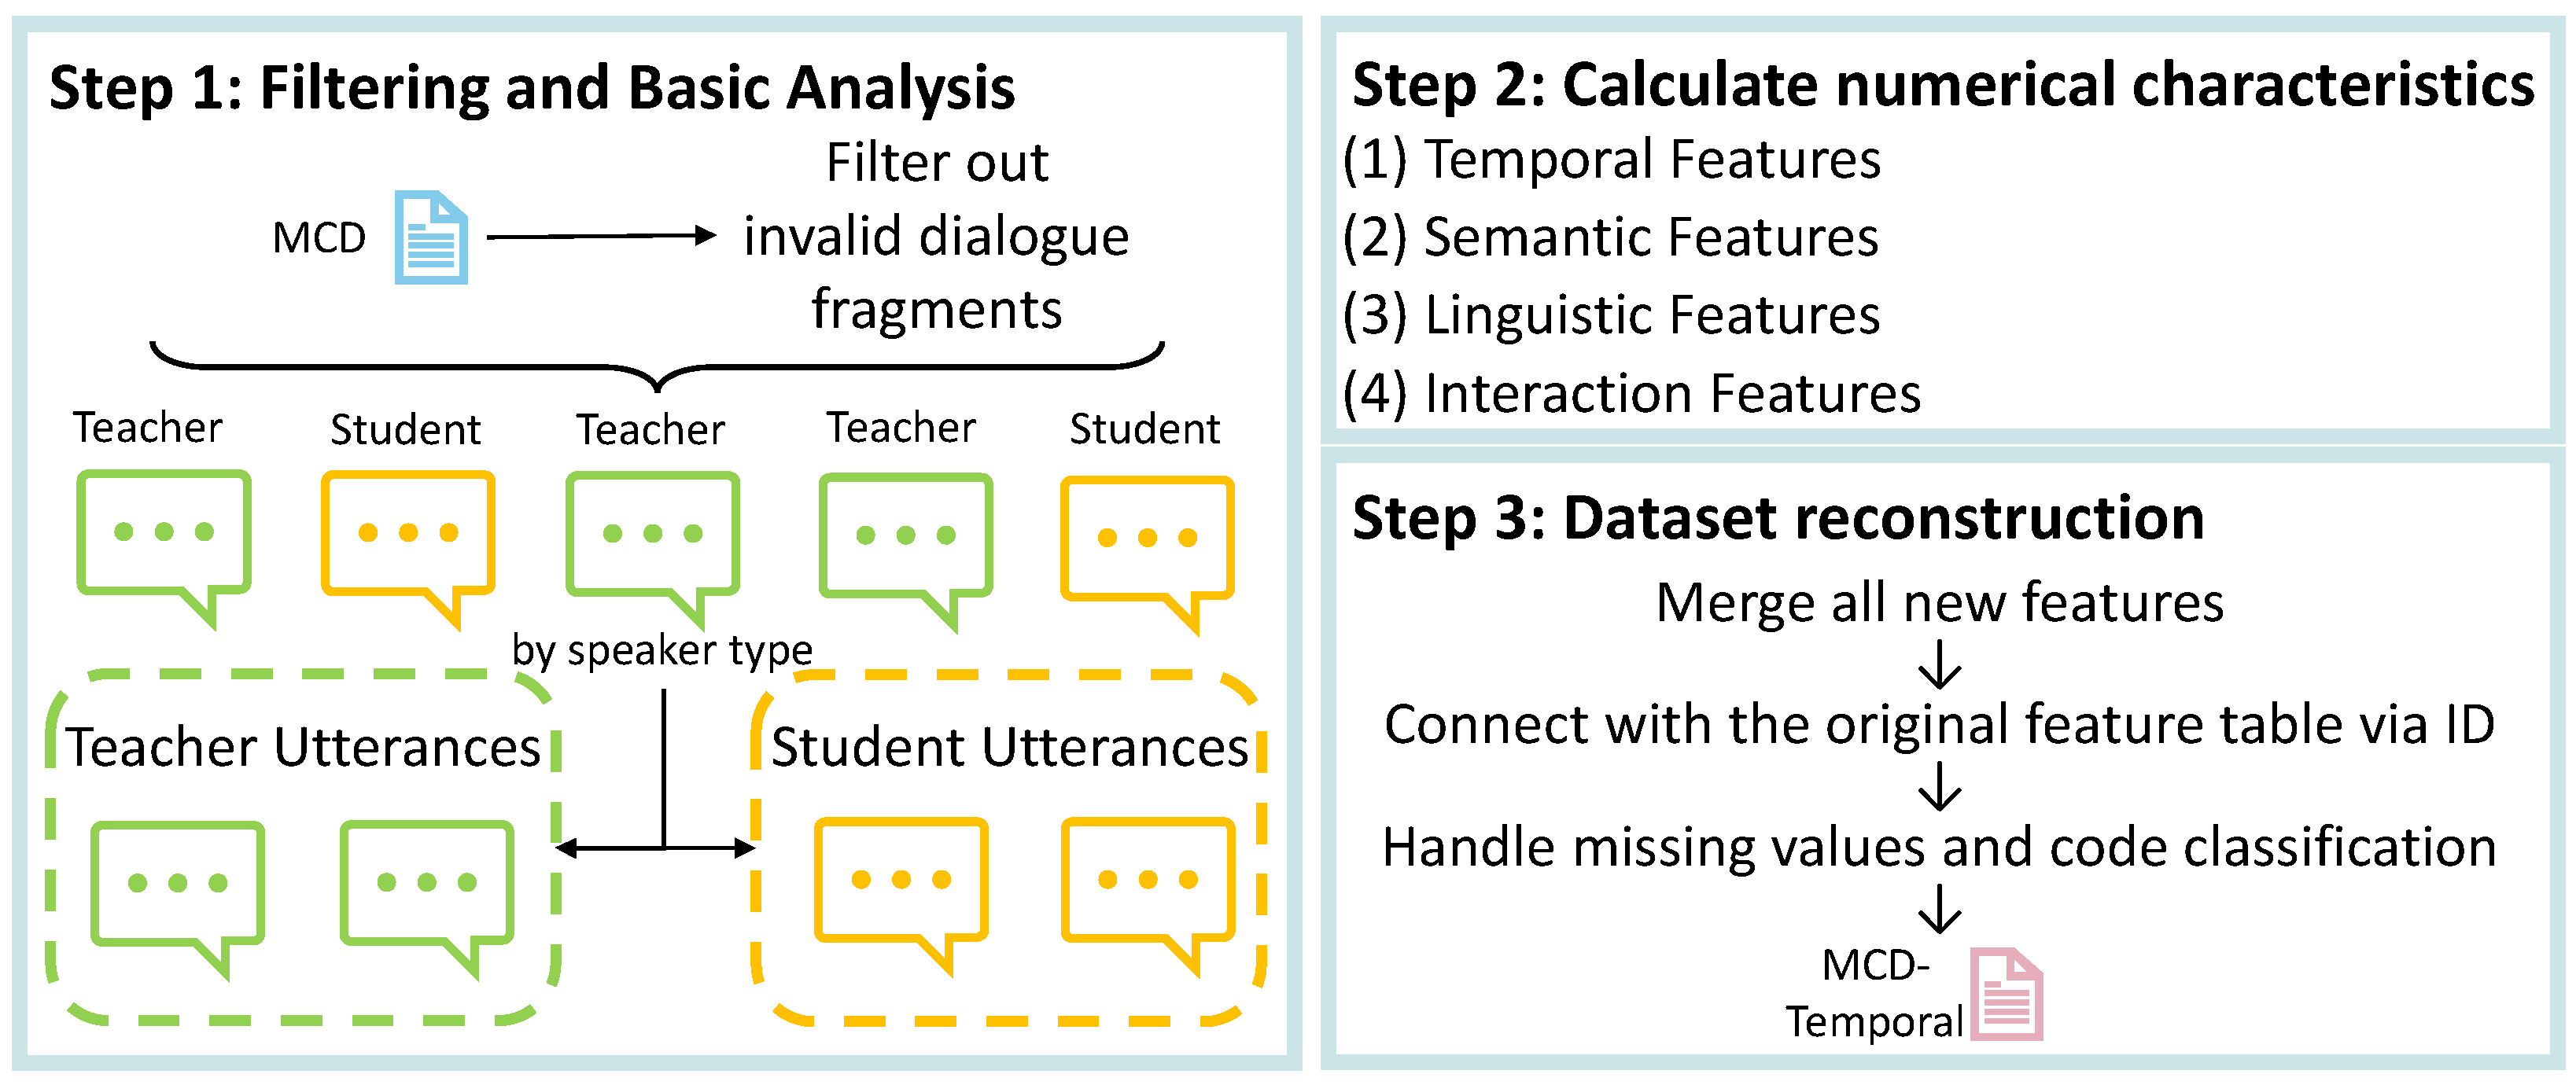
This study reconstructs and enhances the MCD dataset to form the MCD-temporal dataset. The MCD dataset contains 5226 instructional dialogue samples, each characterized by 25 static features, with labels for three cognitive levels (mastery, understanding, and apprentice). While retaining all original features, the new dataset adds nine dynamic features. The specific process is illustrated in Figure 2.
Figure 2.
Construction and feature extraction pipeline for the MCD-temporal dataset.
The schematic diagram of the MCD-temporal dataset reconstruction process illustrates a three-step reconstruction process. The process involves: (1) filtering out invalid dialogue segments and separating utterances by speaker type; (2) calculating the four main types of numerical features: temporal features, semantic features, linguistic features, and interaction features; and (3) merging all new features with the original feature table through ID connection, handling missing values, and completing dataset reconstruction. This process makes the new features systematic and reproducible.
A comparison between the original and enhanced datasets is presented in Table 1.
Table 1.
Comparison of feature categories between the MCD dataset and the proposed MCD-temporal dataset.
Table 1 systematically compares the feature systems of the two datasets. The left side lists the static features of the original MCD dataset, while the right side presents nine new dynamic features that cover multiple dimensions such as temporal interaction, semantic depth, linguistic expression, and interaction quality [22]. The new features focus on dynamic interaction patterns and linguistic cognitive characteristics during the teaching process [23], and provide richer temporal and semantic information for cognitive level identification.
The MCD-temporal dataset introduces the following new features:
- (1)
- Temporal Features: Time entropy quantifies the teacher–student speaking balance to categorize instructional styles, ranging from lecture-heavy (low entropy) to dialogic and student-active (high entropy). Teaching style classifies patterns, enabling tailored analysis of instructional efficacy.
- (2)
- Semantic Features: Semantic richness evaluates information density, signaling dialogue substance and cognitive demand.
- (3)
- Student Features: Lexical diversity reflects vocabulary breadth, pointing to language development needs. Explanation ratio measures logical elaboration, tracing the growth of structured reasoning. Student mastery score evaluates proficiency, informing personalized learning paths.
- (4)
- Teacher Features: Question ratio quantifies questioning, assessing the use of inquiry. Explanation ratio assesses exposition, measuring direct knowledge transfer. Guidance ratio evaluates prompting, gauging scaffolding effectiveness. Teacher guidance score integrates impact, benchmarking instructional quality.
- (5)
- Interaction Features: Student response depth measures relevance, capturing moment-to-moment engagement quality. Teacher question quality identifies open-ended prompts, highlighting catalysts for critical thinking. Dialogue coherence evaluates continuity, ensuring the conversation builds knowledge logically.
- (6)
- Comprehensive Evaluation Features: Golden speech ratio detects pivotal responses, spotlighting transformative learning moments. Interaction quality score rates effectiveness, quantifying the overall pedagogical value of a dialogue.
3.2. Detailed Feature Computation
This section provides explicit computational formulas for all new dynamic features in the MCD-temporal dataset.
(1) Time Entropy: For each individual dialogue, let be the total teacher speaking time and be the total student speaking time. The teacher speaking proportion is computed as the following:
applying Laplace smoothing (), the time entropy is calculated as:
(2) Teaching style is assigned per dialogue and classified as spoon-feeding, balanced, and inquiry-based using the 25th () and 75th () percentiles of all values.
(3) Semantic richness evaluates the informational density through TF-IDF vectorization [24]:
where N is the number of dialogue samples and is the number of valid text segments in the i-th sample.
(4) Lexical diversity measures vocabulary variation in student responses:
where is the set of distinct words and is the total word count.
(5) Explanation ratio for students quantifies explanatory language usage:
counting utterances with explanatory keywords (e.g., “because”, “so”, “therefore”).
(6) Student mastery score integrates Lexical diversity and explanation ratio:
components are ensured to be at least 0.001.
(7) Question ratio assesses teacher questioning frequency:
identifying utterances with question keywords.
(8) Explanation ratio for teachers uses the same calculation as students:
(9) Guidance ratio evaluates teacher’s guiding language:
based on guidance keywords (e.g., “think”, “analyze”).
(10) Teacher guidance score synthesizes three ratios:
(11) Student response depth measures answer relevance using the Jaccard similarity:
where and represent word sets. The final score averages similarity across adjacent pairs.
(12) Teacher question quality identifies open-ended questions:
counting open-ended questions while excluding closed-ended markers.
(13) Dialogue coherence assesses semantic continuity:
where and represent word sets. The final score averages similarity across consecutive pairs.
(14) Golden speech ratio identifies high-quality student responses:
a golden utterance must meet thresholds in length, complexity, and explanation scores.
(15) Interaction quality score provides a comprehensive evaluation by averaging four core metrics:
the code for calculating all the aforementioned dynamic features is publicly available in our Gitee repository, ensuring full reproducibility.
4. Methodology
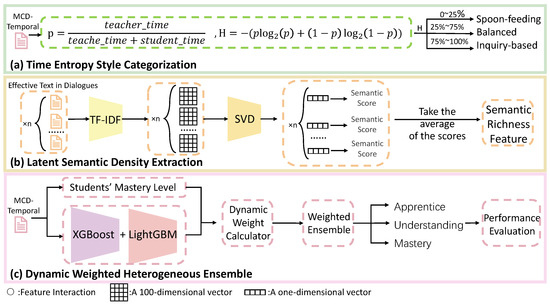
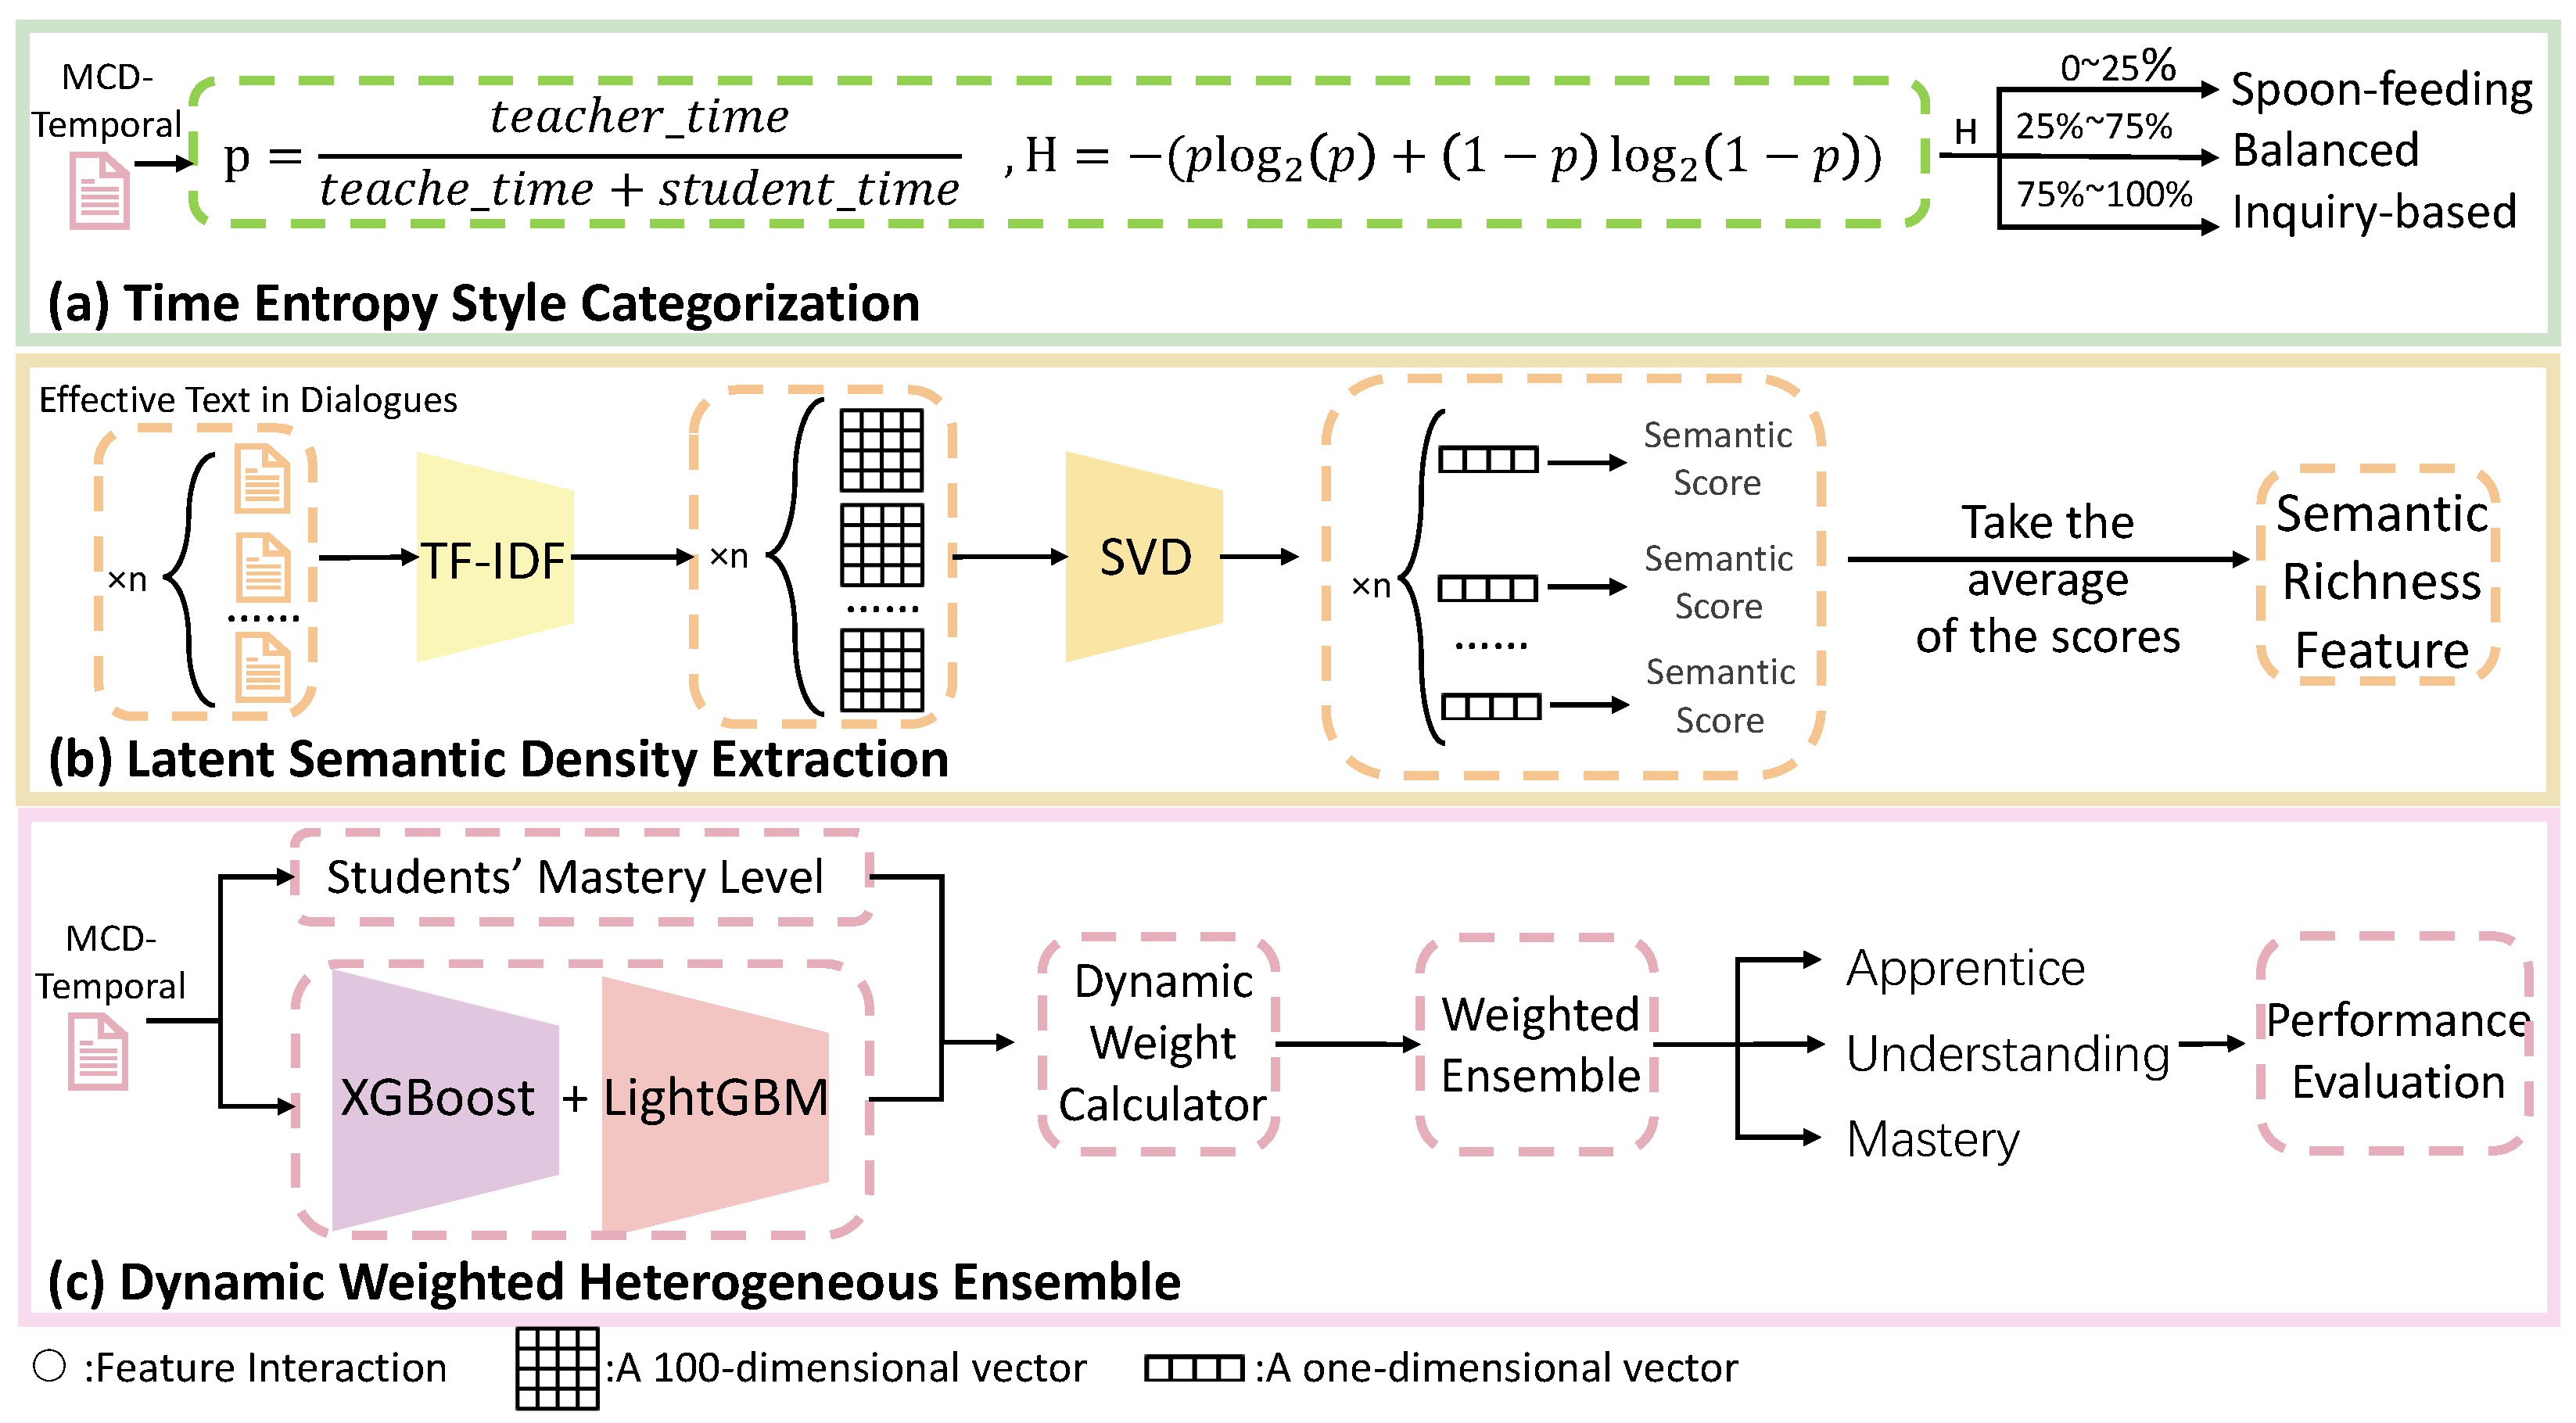
The overall framework of the proposed temporal-semantic adaptive ensemble framework is shown in Figure 3, mainly comprising three core modules: (a) time style classification, (b) latent semantic density extraction, and (c) dynamic weighted heterogeneous ensemble. This framework systematically extracts dynamic features from raw dialogue data and employs an adaptive ensemble strategy for precise classification.
Figure 3.
Architecture of the temporal-semantic adaptive ensemble framework: (a) time style categorization, (b) latent semantic density extraction (SVD: singular value decomposition), and (c) dynamic weighted heterogeneous ensemble.
4.1. Time Entropy Style Categorization
This module (Figure 3a) aims to quantitatively assess the balance of teacher–student speaking time and classify the teaching style into three types: spoon-feeding, balanced, and inquiry-based. The process is as follows:
Our approach uses the time entropy and teaching style features defined in Section 3.2 to quantify teacher–student interaction patterns. We use a data-driven percentile-based method rather than fixed theoretical thresholds to establish classification boundaries. The division details of teaching style are shown in Algorithm 1.
| Algorithm 1: Teaching style classification |
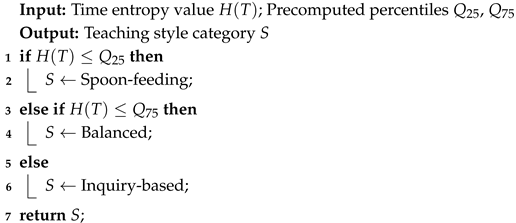 |
Spoon-feeding teaching style: The teacher dominates the exposition, which limits students’ verbal contributions. It is typically associated with lower time entropy, indicating a discourse dominated by the teacher. This style aligns with traditional, transmission-based instructional models [25], which often prioritize knowledge transfer over the development of critical thinking skills, potentially limiting students’ cognitive engagement.
Balanced teaching style: This style facilitates scaffolded interactions where the teacher provides guidance while actively encouraging student participation. It is captured by moderate time entropy, reflecting a dynamic balance in the dialogue. This interaction pattern embodies the principle of scaffolding within a constructivist framework [26], where the teacher supports students in taking on increasing responsibility for their learning, thereby fostering a collaborative knowledge-building process.
Inquiry-based teaching style: This pedagogy encourages student exploration and the verbalization of their reasoning. It is associated with higher time entropy, signifying a more student-centered dialogue. This is a direct manifestation of inquiry-based learning [27] and social constructivism [28], where learning is driven by students’ questions and peer interaction. The high time entropy quantitatively captures the active cognitive engagement and metacognitive processes (e.g., verbalizing reasoning) that are central to deep learning in these theories.
This empirical percentile-based approach adapts to the inherent distribution of the data [29]. It replaces fixed theoretical bounds with robust, context-aware thresholds. These thresholds reflect actual teaching patterns observed in the classroom.
4.2. Latent Semantic Density Extraction
This pattern is responsible for capturing the latent semantic information density within the dialogue, going beyond surface-level word statistics. Quantifies the semantic density and informational richness of the dialogue, serving as an auxiliary feature to assess both student comprehension levels and the quality of instructional guidance provided by teachers. Its process is shown in Figure 3b.
4.2.1. TF-IDF Vectorization with SVD for Extraction
To capture the latent semantic information in instructional dialogues, we transform the textual content into a numerical representation using TF-IDF vectorization, which effectively weights words by their importance. We then apply truncated singular value decomposition (SVD [30]) to reduce dimensionality and extract salient semantic features. This process results in a compact latent semantic vector for each dialogue, which serves as the basis for semantic richness estimation and enhances the generalization capability of our feature set.
4.2.2. Role of Semantic Richness in the Ensemble
The semantic richness feature, as formally defined by Equation (3), quantifies the informational density of each dialogue. Within our ensemble framework, it provides a crucial semantic signal that complements the temporal dynamics captured by time entropy. This integration is designed to provide a more nuanced representation of dialogues, with the aim of improving discriminative capacity for cognitive level assessment beyond what is possible with lexical or turn-based features alone. The inclusion of this semantic dimension is essential for robust classification, as it directly reflects the complexity and depth of both instructional content and student responses.
4.3. Dynamic Weighted Heterogeneous Ensemble
This module represents the core contribution of our work, with its architecture detailed in Figure 3c. We designed a dynamically weighted heterogeneous ensemble framework that effectively integrates the strengths of two powerful base learners, XGBoost [11] and LightGBM [12] and introduces an adaptive weighting strategy to address the pronounced class imbalance inherent in educational dialogue data. The detailed hyperparameter optimization process and optimal configurations are provided in Appendix B.
4.3.1. Dynamic Weight Calculation Strategy
The dynamic weight calculation strategy adaptively fuses predictions from two heterogeneous base learners—XGBoost and LightGBM—by dynamically adjusting their contribution weights based on multiple factors: the class distribution of the training data (especially the proportion of the minority understanding class), class overlap characteristics, and the relative performance of each base learner across different cognitive levels. This multi-faceted approach effectively addresses the complex class imbalance issues inherent in educational dialogue data.
The detailed procedure is described in Algorithm 2, which operates as follows: First, a dynamic threshold = 0.1826 was empirically determined through five-fold cross-validation analysis, representing the 15th percentile of understanding class distribution with 8% conservative adjustment to enhance robustness against class imbalance.
| Algorithm 2: Dynamic weight calculation strategy |
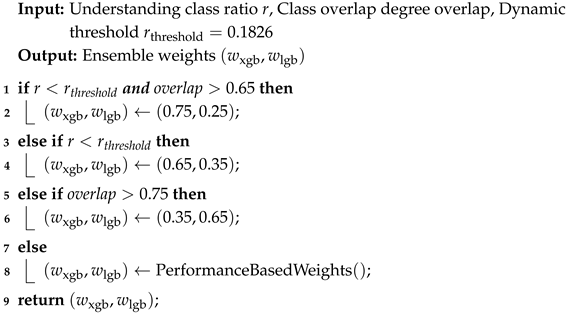 |
For complete reproducibility, including detailed fold-wise threshold calculations, parameter selection rationale, and statistical validation of the optimized threshold , refer to Appendix C.
Second, the degree of class overlap is quantified via a k-nearest neighbors approach (k = 5), measuring the average proportion of same-class neighbors within the five nearest neighbors for each sample.
Third, for each base learner, F1 scores are evaluated through three-fold cross-validation within the training set, with a combined score calculated as 60% weight on understanding class performance and 40% weight on overall performance. The performance-based weights serve as the foundation and are computed as:
where and are the average F1 scores for the understanding class achieved by XGBoost and LightGBM, respectively.
This strategy offers three key advantages: (1) Adaptability: The weighting scheme dynamically adjusts based on data distribution. This design aims to enhance model robustness across different dialogue contexts and teaching styles. (2) Interpretability: The weighting logic is transparent and grounded in imbalanced learning theory, providing clear insight into the model’s decision-making process. (3) Performance: The ensemble leverages the complementary strengths of XGBoost and LightGBM. It is engineered to achieve superior generalization, particularly for recognizing minority classes.
Overall, this comprehensive strategy provides a principled, data-driven approach to handling class imbalance in educational AI applications.
4.3.2. Weighted Probability Fusion Mechanism
For an input sample X, the final prediction probability Pensemble of the ensemble model is calculated by:
where c is the class label, and are the dynamic weights, and . The final classification result is the class with the highest probability.
4.3.3. Feature Importance Analysis
The ensemble framework provides a unified and robust view into the model’s decision-making process through a weighted-average feature importance mechanism. This approach synthesizes the feature importance scores from both base learners, XGBoost [11] and LightGBM [12], into a single, authoritative ranking. The core of this synthesis is a weighted average, where the dynamic ensemble weights—determined by the class distribution of the training data—are applied to the importance vectors from each model. This calculation is formally represented by the equation:
where and denote the feature importance vectors extracted from the XGBoost and LightGBM models, respectively. The weights and are the same dynamic ensemble weights used for probability fusion, satisfying . This ensures that the final importance score for each feature reflects its contribution to the ensemble’s final prediction, weighted by the confidence in each base model.
This method offers a significant advantage by adapting to the data distribution. In scenarios of severe class imbalance, where XGBoost [11] is assigned a higher weight, features it deems critical for identifying minority classes will be proportionally emphasized in the unified importance score. Consequently, this mechanism moves beyond providing a mere black-box prediction; it delivers actionable insights by clearly identifying the most influential drivers of the model’s decisions, such as time entropy or semantic richness, thereby offering educators a interpretable understanding of the key factors affecting cognitive level classification.
4.3.4. Comprehensive Evaluation System
The framework employs two cross-validation strategies: teacher-aware group cross-validation to prevent data leakage across teachers, and stratified cross-validation for ablation studies. The group-based approach ensures that all dialogues from the same teacher remain within the same fold, effectively preventing teacher-specific data leakage. It particularly guarantees sufficient representation of minority classes in every validation round, leading to more reliable performance estimation.
The primary evaluation metric is macro-F1, as it treats all classes equally and comprehensively reflects the model’s overall performance on both majority and minority classes—making it especially suitable for imbalanced classification scenarios like the one in this task. Additionally, accuracy, recall, precision, and receiver operating characteristic-area under curve (ROC-AUC [31]) values are used as supplementary metrics for a multi-dimensional comprehensive assessment, enabling a thorough evaluation of the model’s classification capability and generalization performance. Furthermore, the area under the precision–recall curve, known as average precision (AP), was used to evaluate performance for each class, particularly the challenging minority class.
The innovativeness of this ensemble framework lies in the following: (1) Weights dynamically adapt to the data distribution, rather than being statically set. (2) It organically combines the different advantages of XGBoost (cost-sensitive learning) and LightGBM (automatic balancing) in addressing the class imbalance problem. (3) The probability fusion mechanism enhances the reliability and robustness of the final predictions by integrating the base models’ predictive probabilities through weighted combination, thereby preserving their uncertainty in classification.
4.4. Decision Flow for Practical Implementation
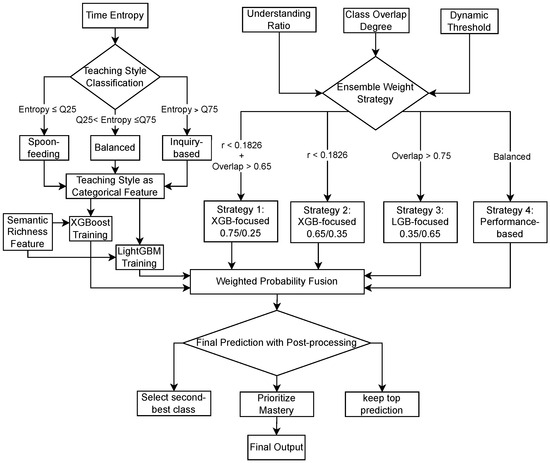
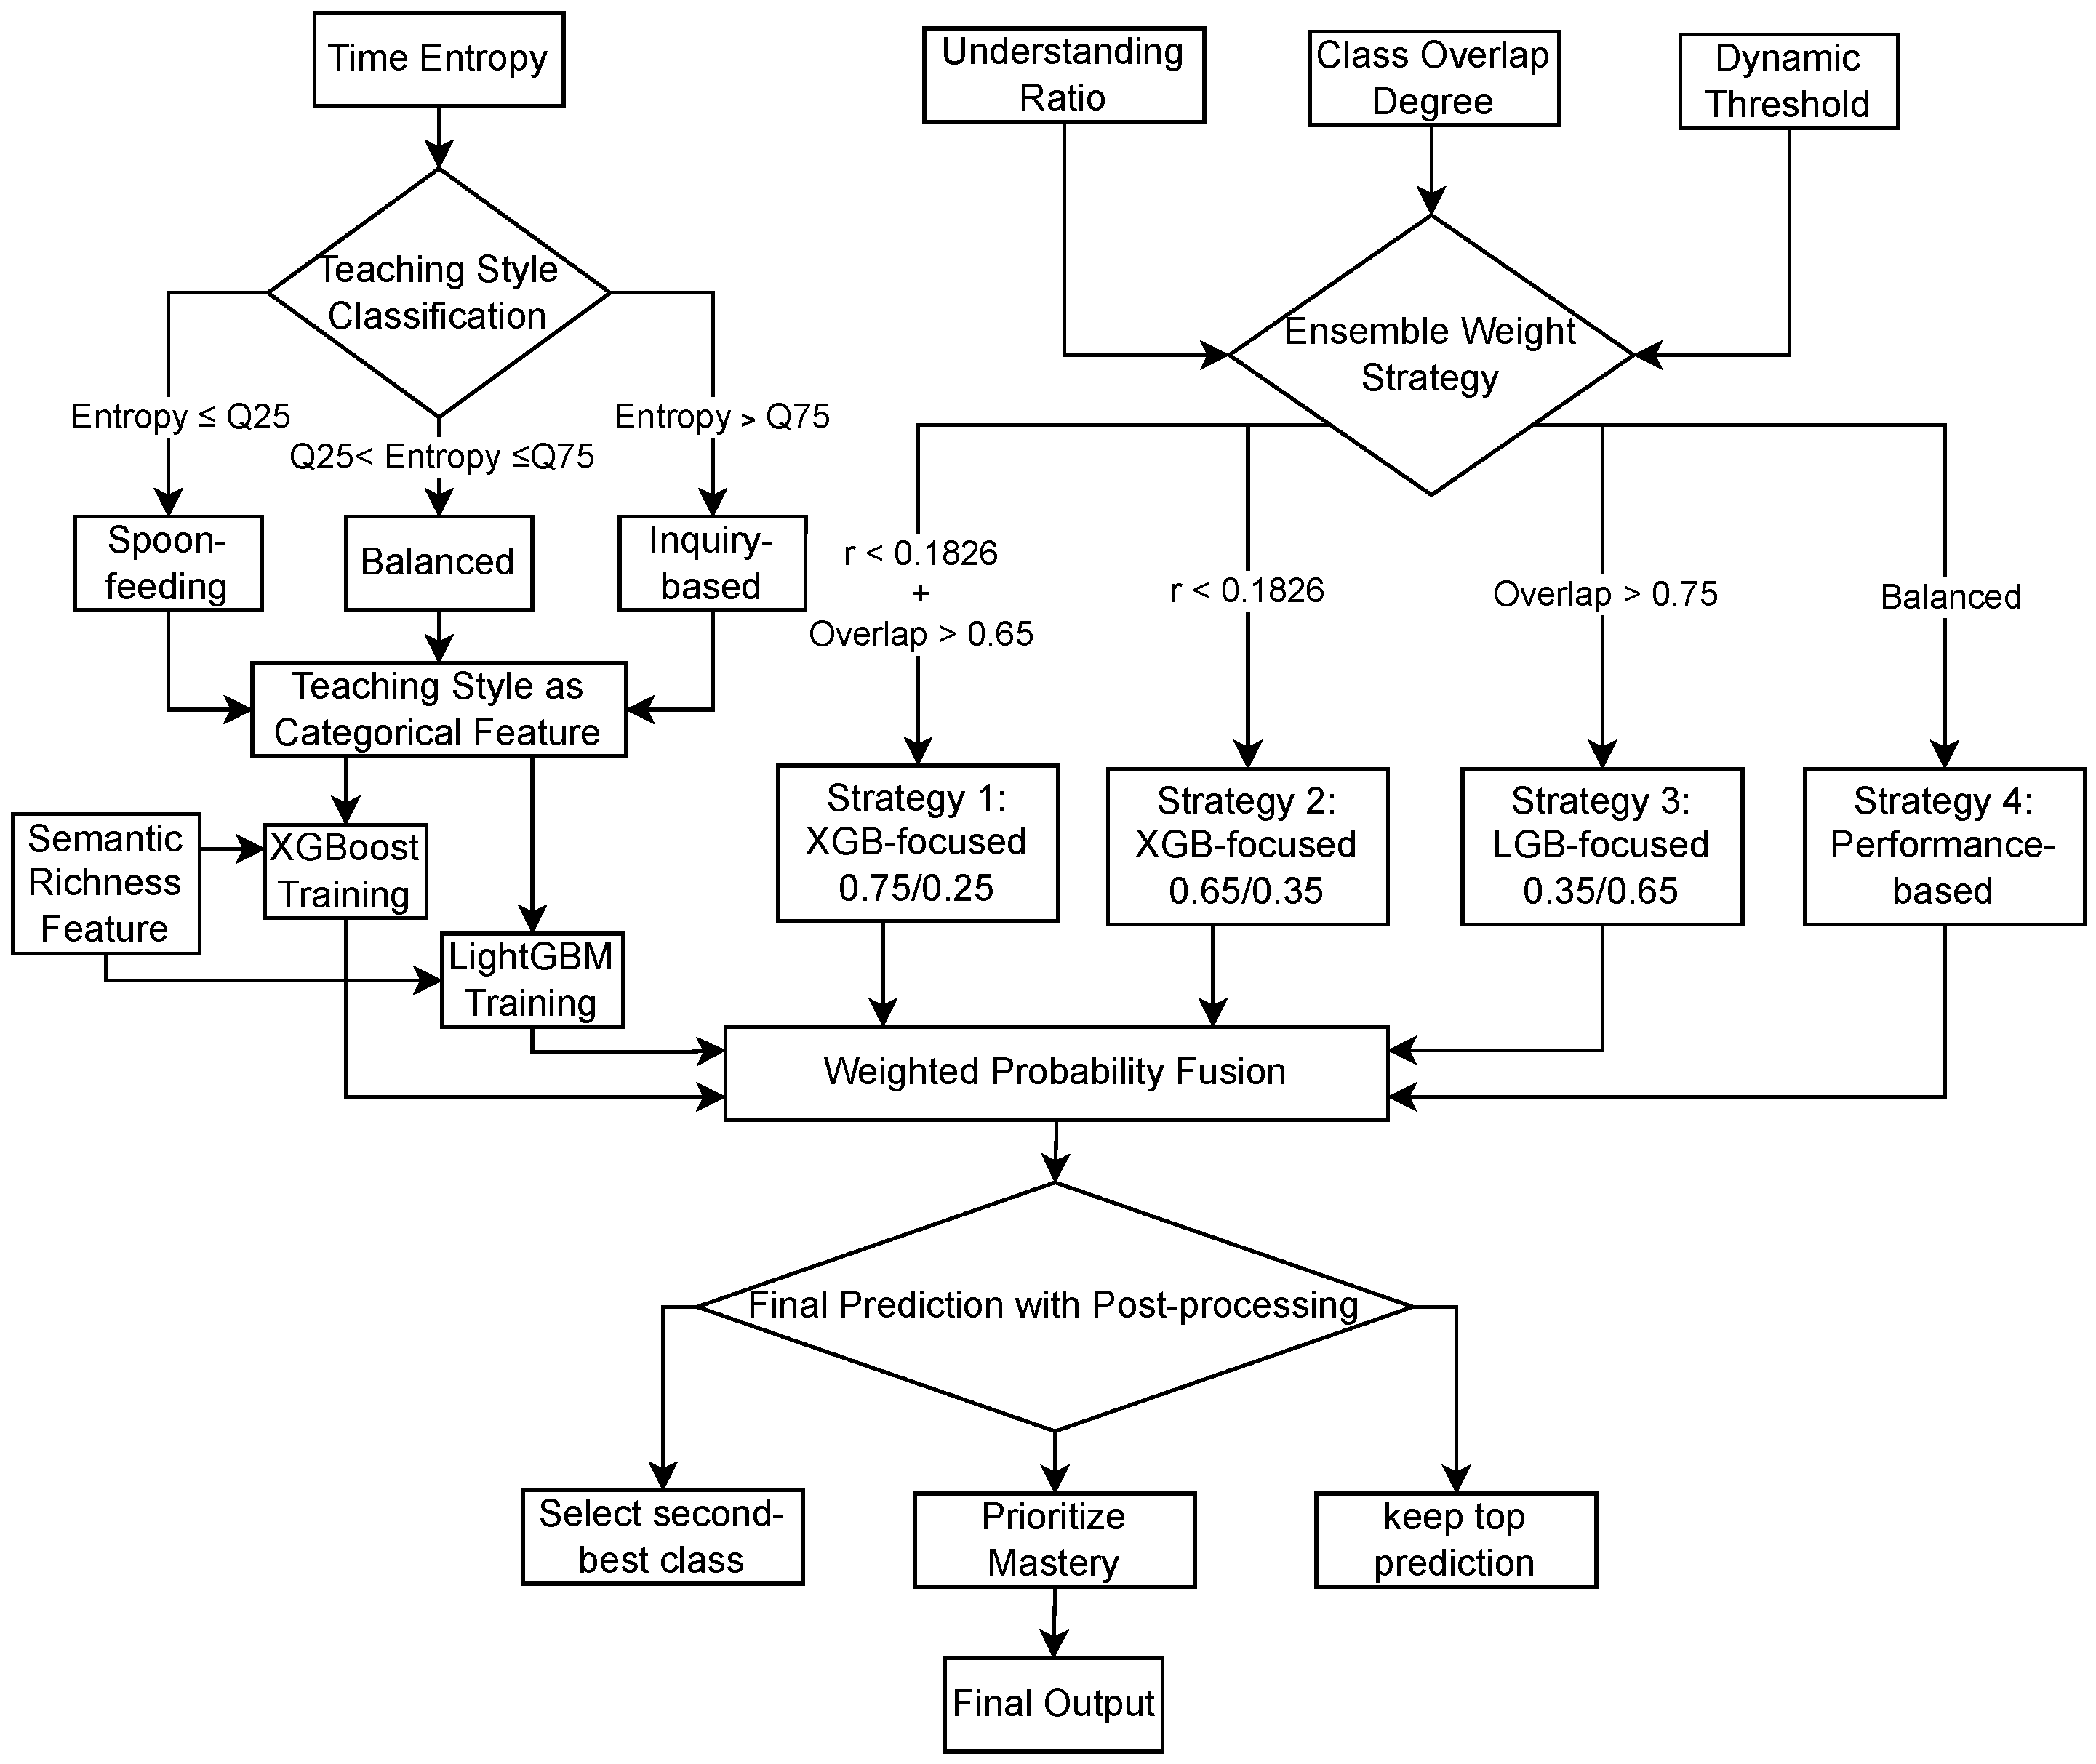
To facilitate practical adoption of the proposed framework, Figure 4 presents a concise decision flowchart that illustrates the complete pipeline from temporal dynamics analysis to final ensemble prediction. This visual guide demonstrates how time entropy quantifies classroom interaction patterns, how these patterns inform teaching style classification, and ultimately how the identified style guides the dynamic weight calculation for heterogeneous ensemble fusion.
Figure 4.
Practical decision flowchart of the temporal-enhanced DWHE framework.
As shown in the figure, the decision-making process begins with time entropy feature extraction, and the teaching dialogue is classified into three teaching styles through a data-driven percentile method. The classification result, together with the semantic richness feature, jointly affects the selection of the dynamic weight calculation strategy. Specifically, when the proportion of understanding class samples is low and the degree of category overlap is high, the framework tends to adopt a weight distribution dominated by XGBoost. In cases where there is significant category overlap, LightGBM should be given priority. Ultimately, the prediction results of the two base learners are integrated through a weighted probability fusion mechanism, and the final cognitive level classification is output after post-processing optimization.
This streamlined workflow highlights the core innovation of this framework: organically integrating the dynamic characteristics of teaching interaction (time entropy, teaching style) and the characteristics of data distribution (category imbalance, overlap degree) into the integrated weight decision, achieving context-based adaptive classification.
5. Experiments
This section aims to answer the study’s core questions through a series of experiments. First, we evaluate the overall classification performance of the proposed framework to verify its effectiveness. Subsequently, the contributions of the dynamic weighting mechanism and heterogeneous integration were deeply analyzed through the ablation study. We further evaluated the reliability and robustness of the results through statistical significance tests and model discriminant ability analysis. Finally, through fine-grained error analysis, model bottlenecks are diagnosed and directions for future improvements are pointed out. All experiments were carried out around the core research questions, aiming to verify the value of dynamic feature integration and adaptive ensemble learning in solving the problems of cognitive level classification and category imbalance.
5.1. Experimental Setup
Teaching style was assigned per dialogue based on time entropy thresholds computed separately within each training fold. To prevent teacher-specific data leakage, we employed teacher-aware cross-validation where all dialogues from the same teacher were kept within the same fold.
We fitted all preprocessing steps—including SMOTE oversampling (k = 3), feature standardization, one-hot encoding, and time entropy percentile computation for style assignment—exclusively on training folds. This ensured that no test set information influenced feature engineering or model training.
5.1.1. Experimental Dataset
Experiments in this study were conducted on the reconstructed MCD-temporal dataset. This dataset contains 5226 instructional dialogue samples, with cognitive level labels divided into three classes: mastery, understanding, and apprentice. The dataset exhibits significant class imbalance (). The specific distribution is shown in Table 2.
Table 2.
Student cognitive level classification: class distribution and sample statistics.
5.1.2. Evaluation Metrics and Experimental Design
To comprehensively evaluate model performance, this study uses macro-F1 as the core evaluation metric, supplemented by accuracy, recall, precision, and ROC-AUC [31] values. The ROC-AUC was computed using the one-vs.-rest approach, which evaluated each class against the rest to provide a macro-average ROC-AUC score. Experiments employed stratified k-fold cross-validation, ensuring the class distribution in each fold was consistent with the whole—particularly verifying that the proportion of the understanding class remained stable across all folds (approximately 19.8% of samples)—with the random seed set to 42. All experiments were conducted under the same hardware environment (Intel Core i9-13900H, 32GB RAM) and software environment (Python 3.9, scikit-learn 1.3).
5.1.3. Comparison Methods
To validate the effectiveness of the proposed DWHE, we compare the following six methods:
Logistic regression [32] (with class weight adjustment), random forest [33], balanced random forest [34], XGBoost [11], LightGBM [12], DWHE (our Method).
The selection of these baseline models is motivated by their representativeness in tackling classification tasks, particularly those with imbalanced data. Logistic regression serves as a simple yet strong linear benchmark. random forest represents traditional bagging ensemble methods, while balanced random forest is its variant specifically designed for imbalanced datasets through class-weighted bootstrapping. XGBoost and LightGBM are state-of-the-art gradient boosting frameworks that are highly effective across diverse domains and are commonly used as strong baselines for tabular data classification. Comparing against these established and powerful models allows for a comprehensive and convincing evaluation of the proposed DWHE framework’s advantages.
Furthermore, to verify the effectiveness of the ensemble strategy and dynamic weighting mechanism, the following ablation studies are designed: XGBoost_Only: using only the XGBoost model; LightGBM_Only: using only the LightGBM model; and static_Weight_Ensemble: fixed weight ensemble (0.5 for XGBoost and 0.5 for LightGBM).
5.2. Results and Analysis
5.2.1. Dataset Statistical Analysis
To empirically validate the impact of temporal dynamics and pedagogical features on cognitive level classification, this study first conducts a comprehensive exploratory analysis of the MCD-temporal dataset. The following figures reveal key relationships among time entropy, teaching style, interaction quality, and cognitive levels, providing an important data foundation and theoretical basis for subsequent modeling.
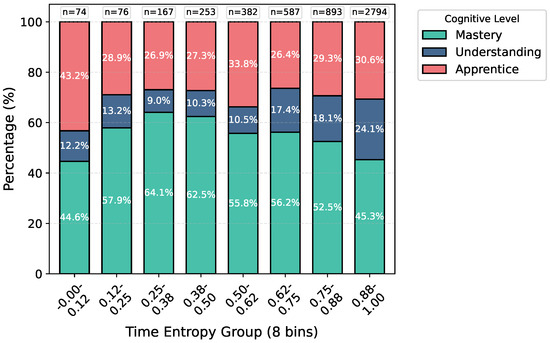
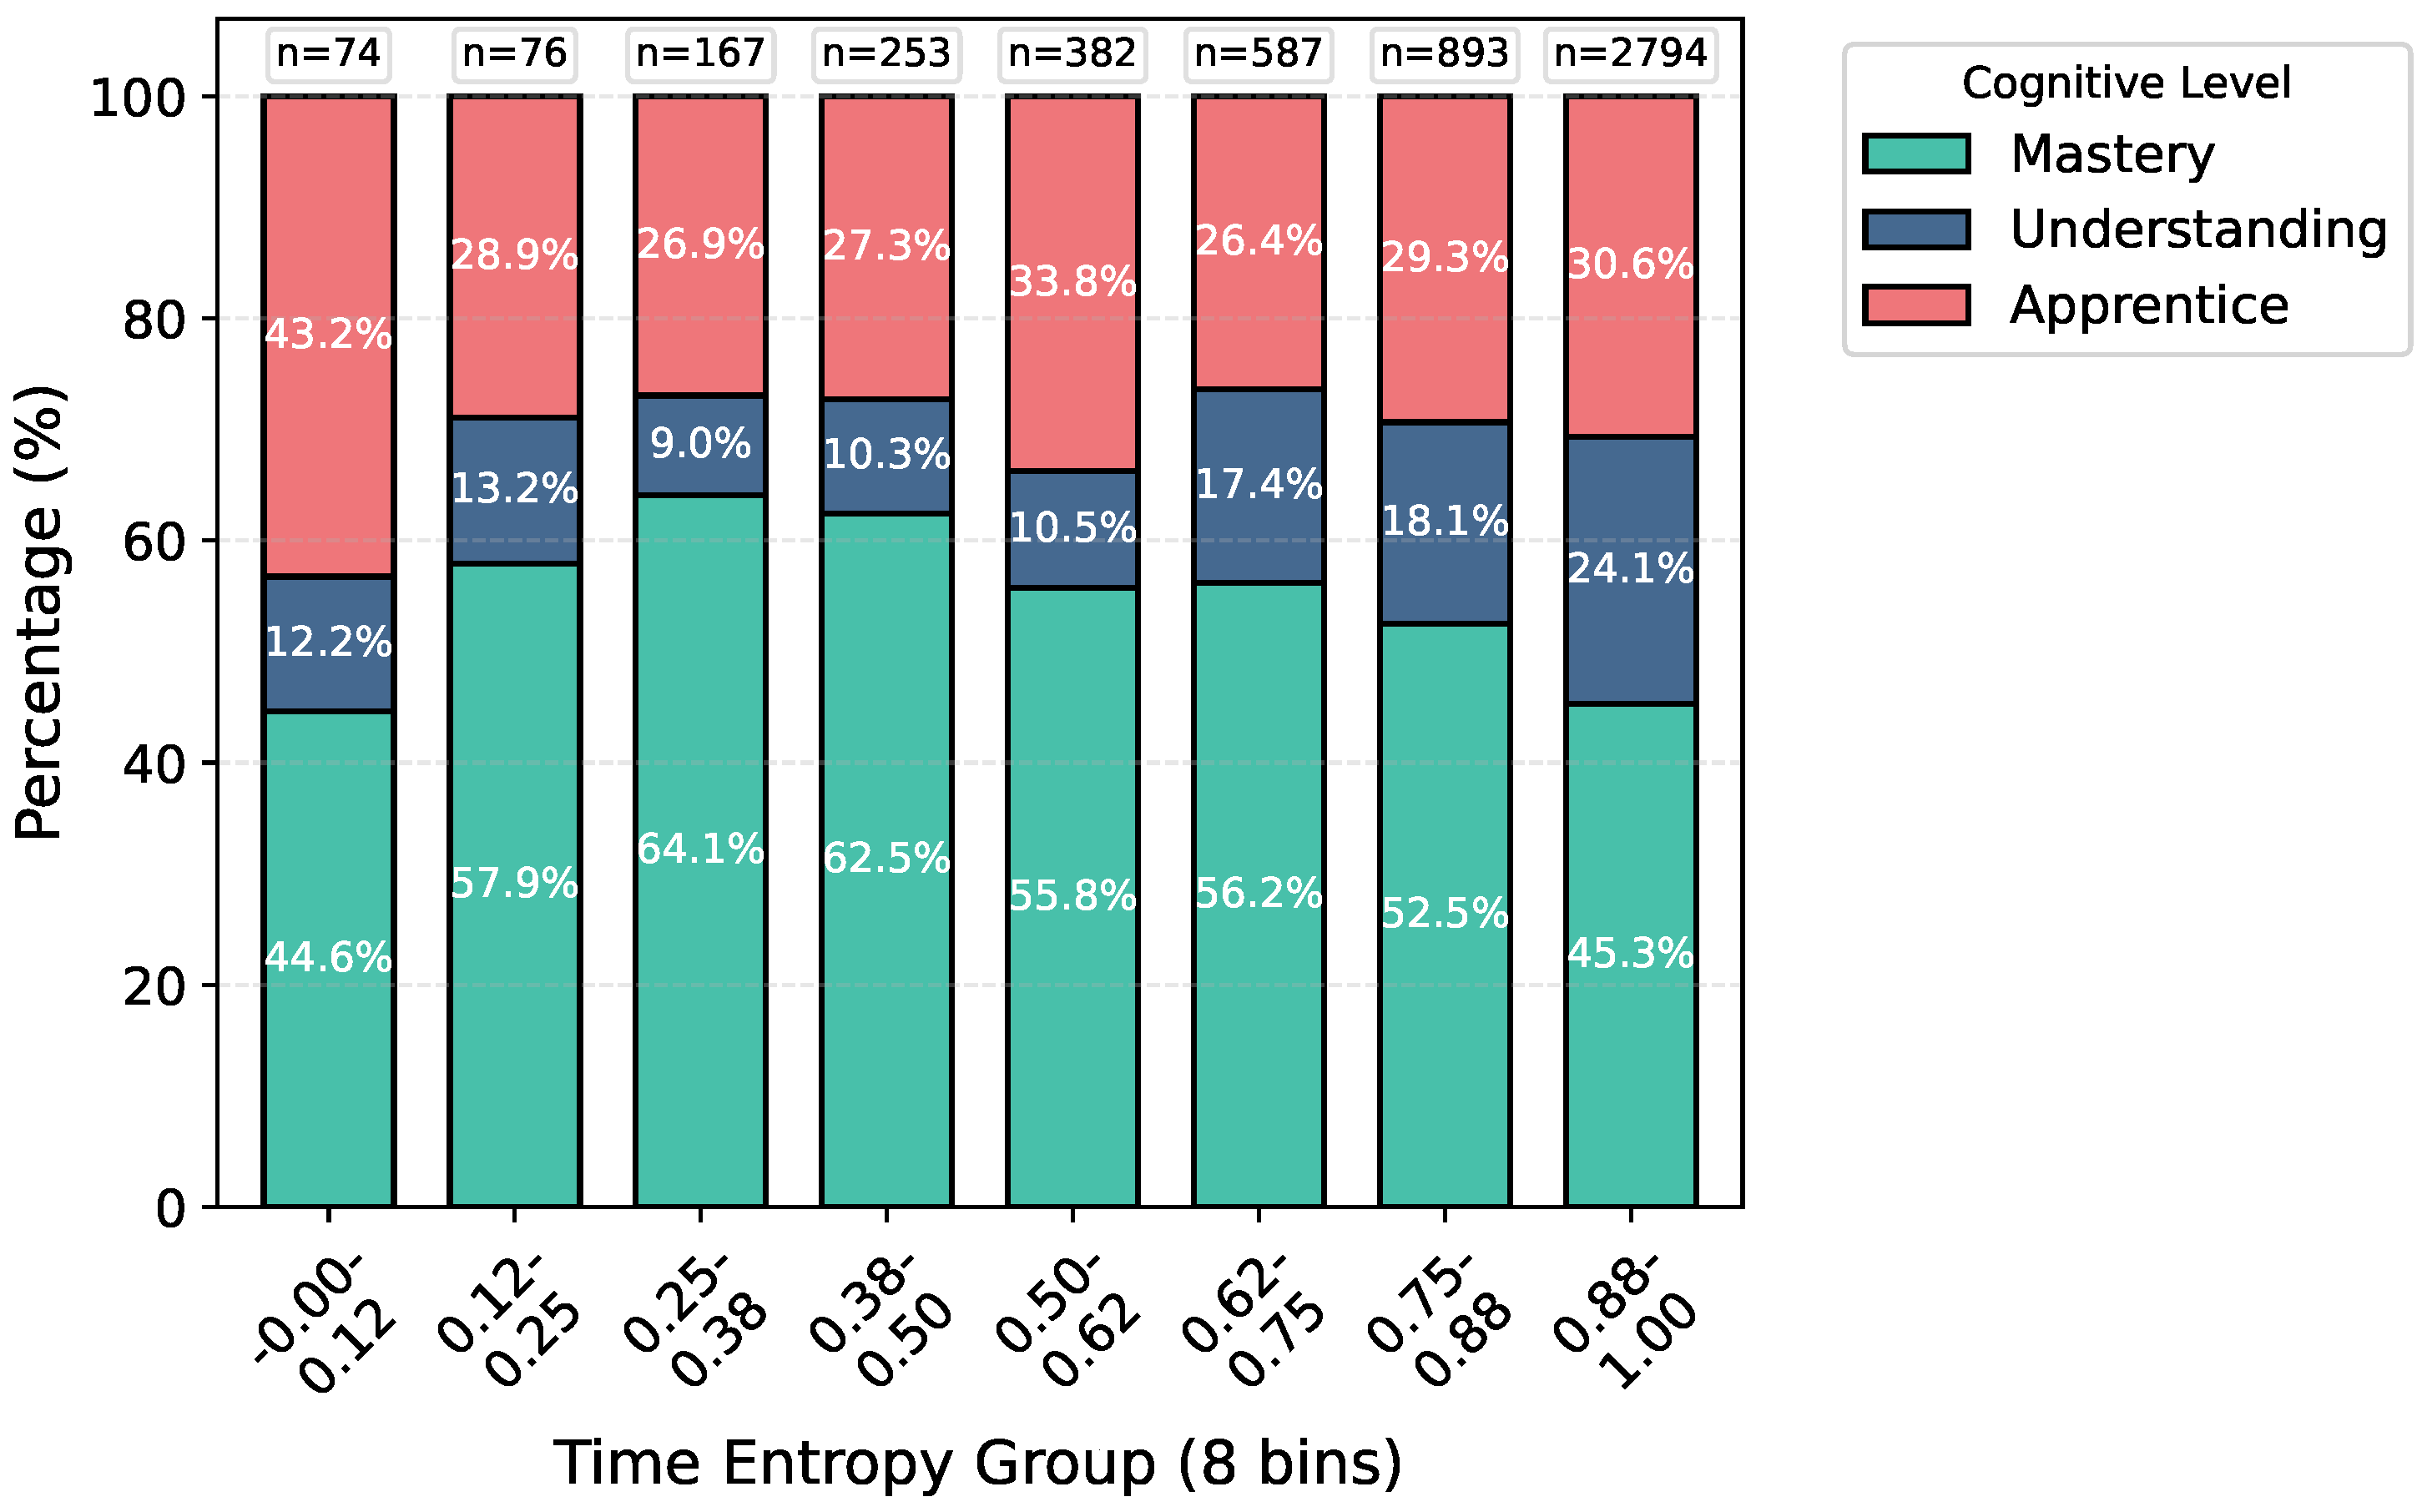
Figure 5 illustrates the distribution of cognitive levels across eight equally divided time entropy groups. As time entropy increases (from left to right), indicating a more balanced distribution of teacher–student speaking time, the proportion of mastery-class students gradually decreases, while apprentice-class students increase significantly. For example, in the highest entropy group, apprentice and understanding students account for over 55%, suggesting that a more balanced dialogue structure may facilitate active participation by beginners. Understanding-class students show some fluctuation but generally account for between 8% and 25% across all groups. While not perfectly stable, their proportion is consistently lower than that of the mastery and apprentice classes in most bins.
Figure 5.
Distribution of cognitive Levels by time entropy groups. The dataset was divided into eight equal-interval bins based on time entropy (a metric of teacher–student speaking balance). The percentage distribution of cognitive levels within each bin is shown. Sample sizes for each bin (from left to right): n = 74, n = 76, n = 167, n = 253, n = 382, n = 587, n = 893, n = 2794.
This trend not only verifies a significant correlation between temporal dynamics (quantified by time entropy) and cognitive levels but also interprets its pedagogical value. The increase in apprentice-class students within high time entropy dialogues suggests that balanced turn-taking may enhance participation among beginners. Consequently, time entropy transcends its mathematical formulation to serve as a diagnostic indicator of classroom interaction quality, guiding educators toward more inclusive teaching practices.
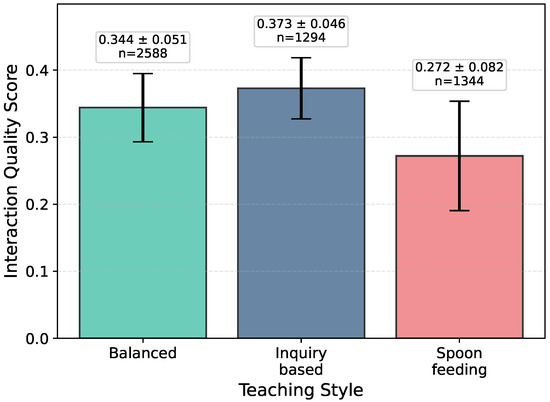
This bar chart with error bars (Figure 6) displays the average interaction quality score and standard deviations for each teaching style. The inquiry-based teaching style has the highest interaction quality (0.373 ± 0.046), followed by the balanced style (0.344 ± 0.051), and the spoon-feeding style has the lowest (0.272 ± 0.082). The results show that teaching style with higher time entropy (i.e., more balanced teacher–student dialogue) are often accompanied by better interaction quality, validating the effectiveness of time entropy as a feature for capturing teaching dynamics.
Figure 6.
Interaction quality by teaching style. Teaching styles were classified as spoon-feeding, balanced, and inquiry-based based on time entropy percentiles (25th and 75th) computed from the entire dataset. The interaction quality score is a composite metric calculated as the mean of four core features: time entropy, golden speech ratio, student mastery score, and teacher guidance score. Mean scores ± standard deviation are: inquiry-based (0.373 ± 0.046), balanced (0.344 ± 0.051), and spoon-feeding (0.272 ± 0.082). Sample sizes are n = 1294 for inquiry-based, n = 1344 for balanced, and n = 1294 for spoon-feeding.
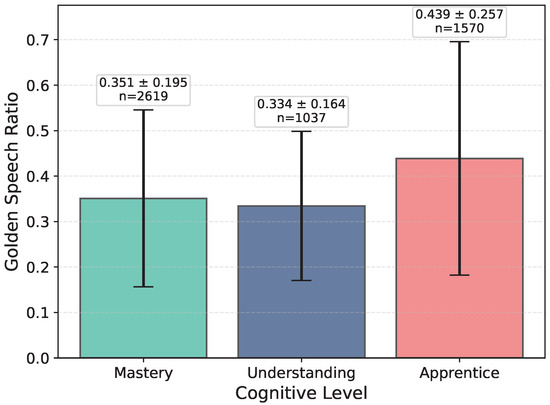
As shown in Figure 7, apprentice-class students have the highest golden speech ratio (), exceeding both mastery and understanding levels. This suggests that beginners may produce high-quality responses more frequently, such as by asking questions or providing detailed explanations. This counterintuitive result reveals the complexity of cognitive engagement and implies that traditional assumptions about student performance need to be re-examined.
Figure 7.
Golden Speech Ratio by Cognitive Level. The golden speech ratio measures the proportion of high-quality student utterances per dialogue. Mean scores ± standard deviation are: apprentice (0.439 ± 0.257), mastery (0.351 ± 0.195), and understanding (0.334 ± 0.164). Sample sizes are n = 1570 for apprentice, n = 2619 for mastery, and n = 1037 for understanding.
In summary, the above figures show a consistent pattern: teaching style with higher time entropy (e.g., inquiry-based) are often associated with higher participation of apprentice students, better interaction quality, and higher-quality golden speeches from beginners. This indicates that a balanced dialogue structure not only promotes participation among students at different cognitive levels but may also encourage students with weaker knowledge foundations to contribute higher-quality dialogues. These findings further confirm the importance of incorporating dynamic features such as time entropy and teaching style into cognitive level classification models, as they capture key teaching interaction mechanisms that may be overlooked by pure semantic analysis.
5.2.2. Overall Performance Comparison
Following the comprehensive statistical analysis of the MCD-temporal dataset and its relationship with cognitive levels, we evaluated the overall classification performance of the proposed DWHE framework. We compare it against several baseline methods to validate its superiority in terms of key metrics such as macro-F1.
Table 3 shows the macro-F1 performance of each method. The proposed framework demonstrates state-of-the-art performance (), achieving the highest performance among all compared methods. It indicates that simple category balance strategies are insufficient to fully capture the dynamic semantics and temporal patterns in instructional dialogues.
Table 3.
Macro-F1 performance comparison of various methods.
5.2.3. Ablation Study Analysis
Having established the overall superiority of the DWHE framework, we now conduct a systematic ablation study to dissect its internal mechanisms and validate the effectiveness of both the dynamic weighting strategy and the heterogeneous ensemble design.
The numerical results in Table 4 provide a systematic ablation study validating our proposed framework: the heterogeneous ensemble strategy itself (static_Weight_Ensemble, ) significantly outperforms individual models (XGBoost_Only: 0.6205, LightGBM_Only: 0.6152), while the dynamic weighting mechanism (DWHE, 0.6236) further enhances the ensemble performance. This conclusively demonstrates the critical role of the dynamic weight adjustment strategy in handling class imbalance, as its data-driven adaptability proves superior to a static weighting scheme.
Table 4.
Ablation study of the proposed ensemble framework.
Most significantly, our DWHE framework demonstrates remarkable effectiveness in minority class recognition. DWHE achieved the highest understanding F1 (0.4044), representing a 61.8% improvement over XGBoost_Only and a 24.9% improvement over Static Weight Ensemble. This performance pattern confirms that our dynamic weighting strategy successfully reallocates model attention to the challenging minority class.
This ablation study conclusively demonstrates the critical role of the dynamic weight adjustment strategy in handling class imbalance, as its data-driven adaptability proves superior to static weighting schemes for educational dialogue classification tasks.
5.2.4. Statistical Significance Test
We used paired t-tests (results from five-fold CV) to perform statistical significance analysis () comparing DWHE with other methods. The results indicate that our method achieves statistical significance () in comparisons against XGBoost (), while differences with other methods were not statistically significant (logistic_Regression: p = 0.891, balanced_RF: p = 0.419). The difference with LightGBM () approached but did not reach the threshold for statistical significance, suggesting a trend that warrants further investigation.
For the ablation study, the paired t-tests yielded p-values of 0.576, 0.211, and 0.241 when comparing DWHE against XGBoost_Only, LightGBM_Only, and Static_Weight _Ensemble, respectively.
These statistical results, combined with its top-ranked macro-F1 score, suggest that the DWHE framework provides a consistent and practically valuable improvement for cognitive level classification, even though the gains over some strong baselines do not always reach the threshold of statistical significance in this evaluation setup.
5.2.5. ROC and Model Discriminative Ability
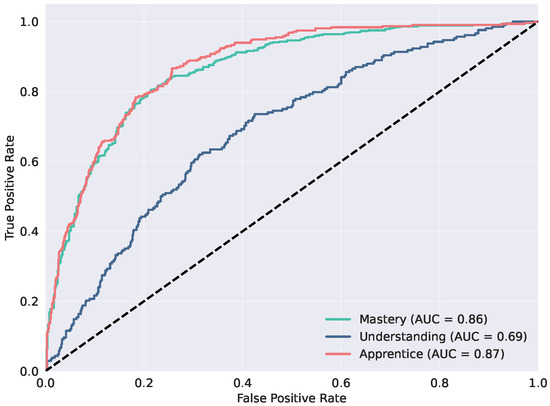
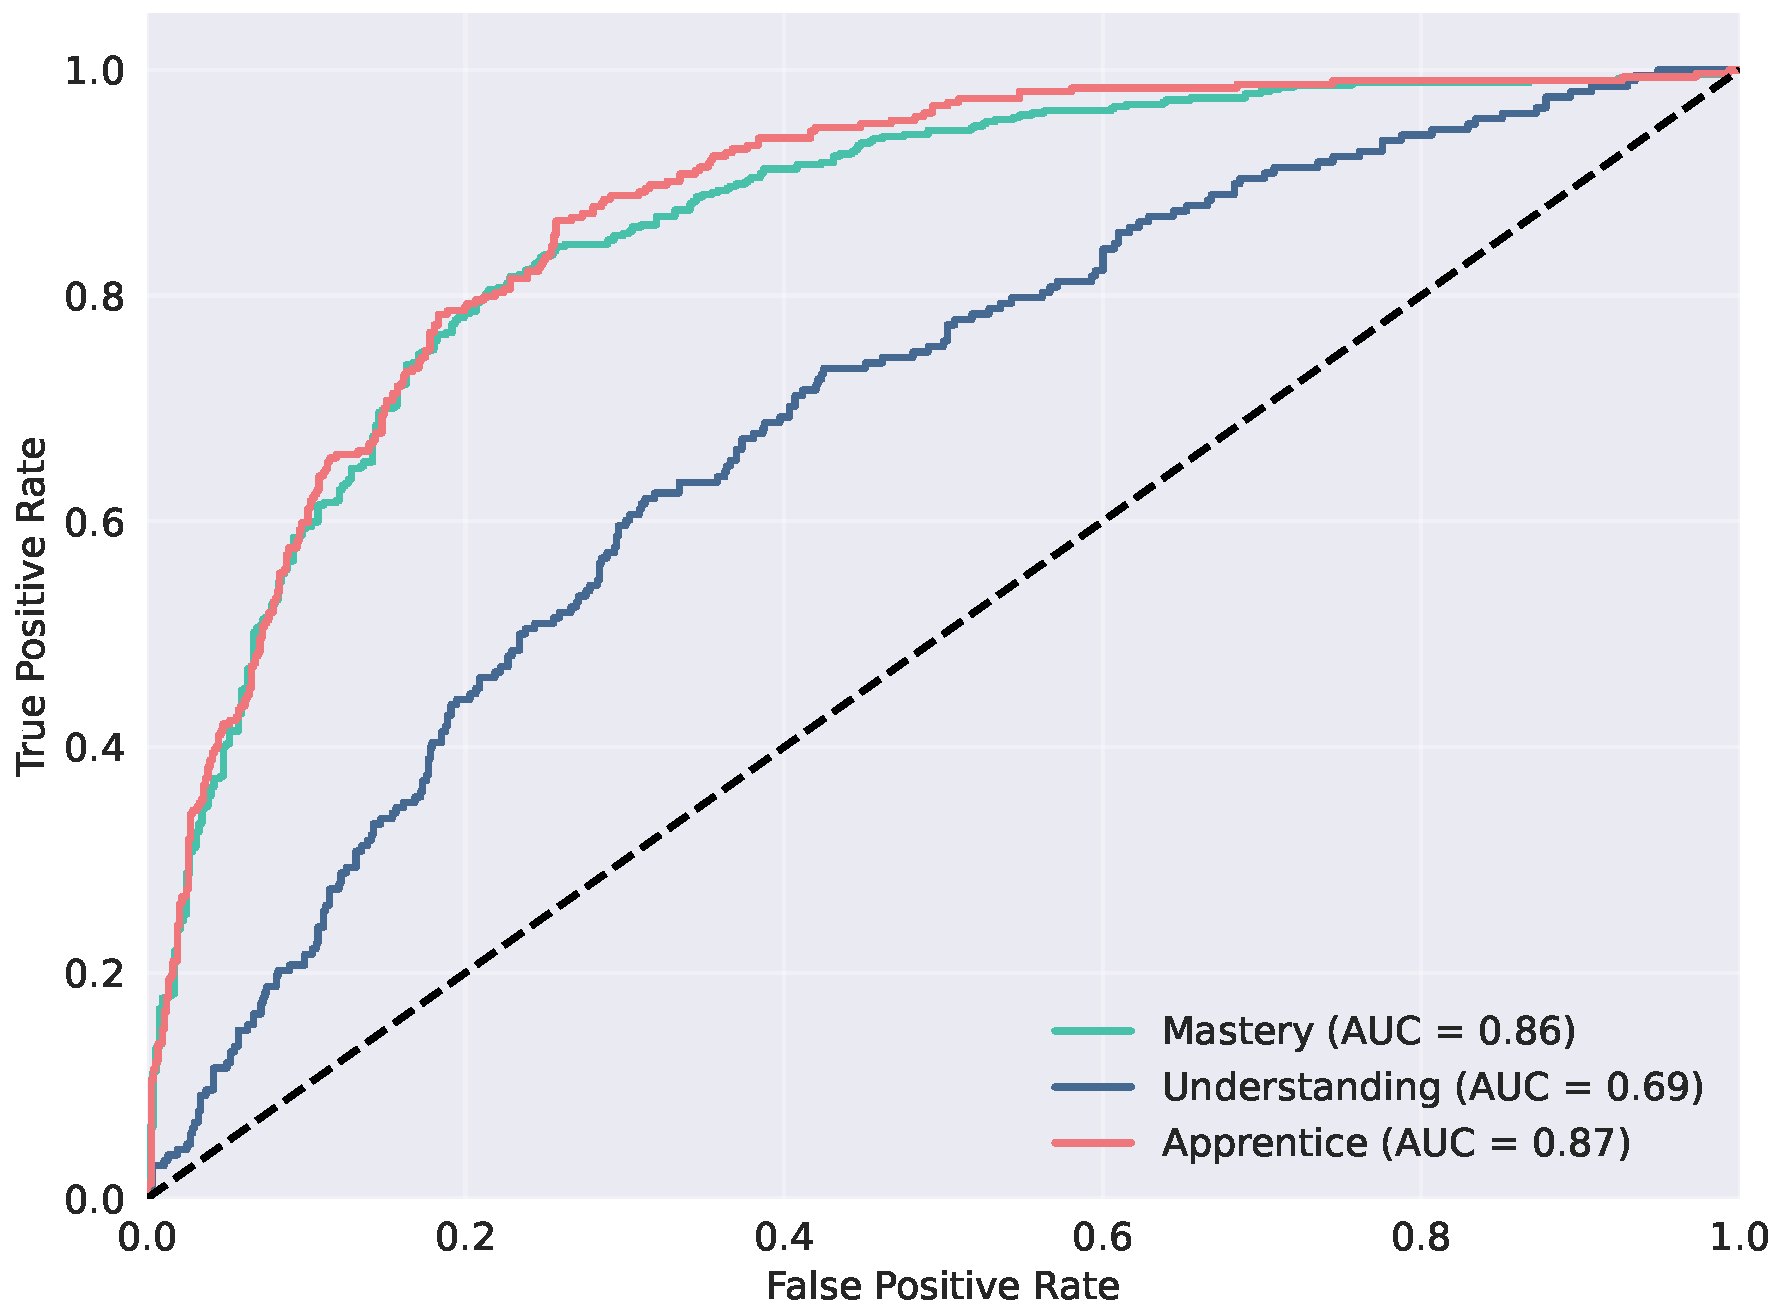
We evaluated the framework’s discriminative capability using ROC analysis with the One-vs.-Rest approach. The ensemble achieved a macro-average ROC-AUC of 0.8071, demonstrating strong overall performance across all cognitive levels. This macro-average, which summarizes the model’s overall discriminative ability, is the arithmetic mean of the class-specific AUCs: mastery (0.86), understanding (0.69), and apprentice (0.87). All values are significantly above the random baseline of 0.500.
As shown in Figure 8, the ROC curves indicate excellent separation for mastery and apprentice classes, while the understanding class presented the greatest challenge, yet still achieved a respectable ROC-AUC of 0.69.
Figure 8.
ROC curves for DWHE. Curves were generated using the One-vs.-Rest approach on a single hold-out test set (20% of data). They show the ensemble model’s discriminative ability for each class. Area under the curve (AUC) values: apprentice (0.87), mastery (0.86), and understanding (0.69). Performance is excellent for mastery and apprentice classes, while challenging for the understanding class.
Error analysis revealed that the understanding class had the highest error rate (48.56%), with primary confusion between mastery and understanding classes: about 24.43% of mastery samples were misclassified as understanding, and 25.00% of understanding samples were misclassified as mastery. This phenomenon may indicate either fundamental feature overlap or potential inconsistencies in the annotation criteria for intermediate cognitive states.
The maintained discriminative capability for the challenging understanding class validates the effectiveness of the dynamic weighting strategy and heterogeneous ensemble approach. The model’s balanced performance makes it suitable for real-world educational applications requiring reliable identification of all cognitive levels.
5.2.6. Fine-Grained Error Analysis and Feature Refinement Directions
To address the critical challenge of classifying the understanding class, we conducted a detailed error analysis. This investigation provides essential insights into the model’s limitations and establishes a clear path for future feature enhancement. The analysis leverages both the normalized confusion matrix and per-class precision–recall curves to dissect the model’s performance at a granular level.
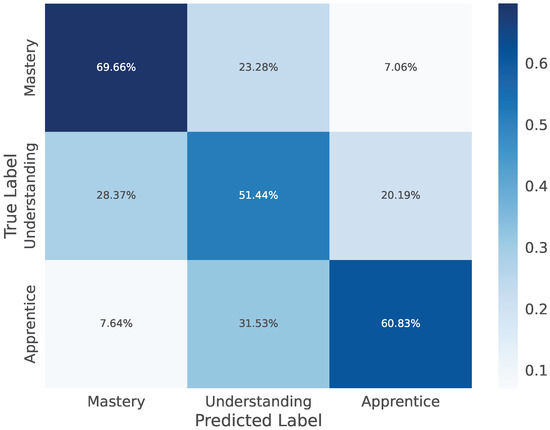
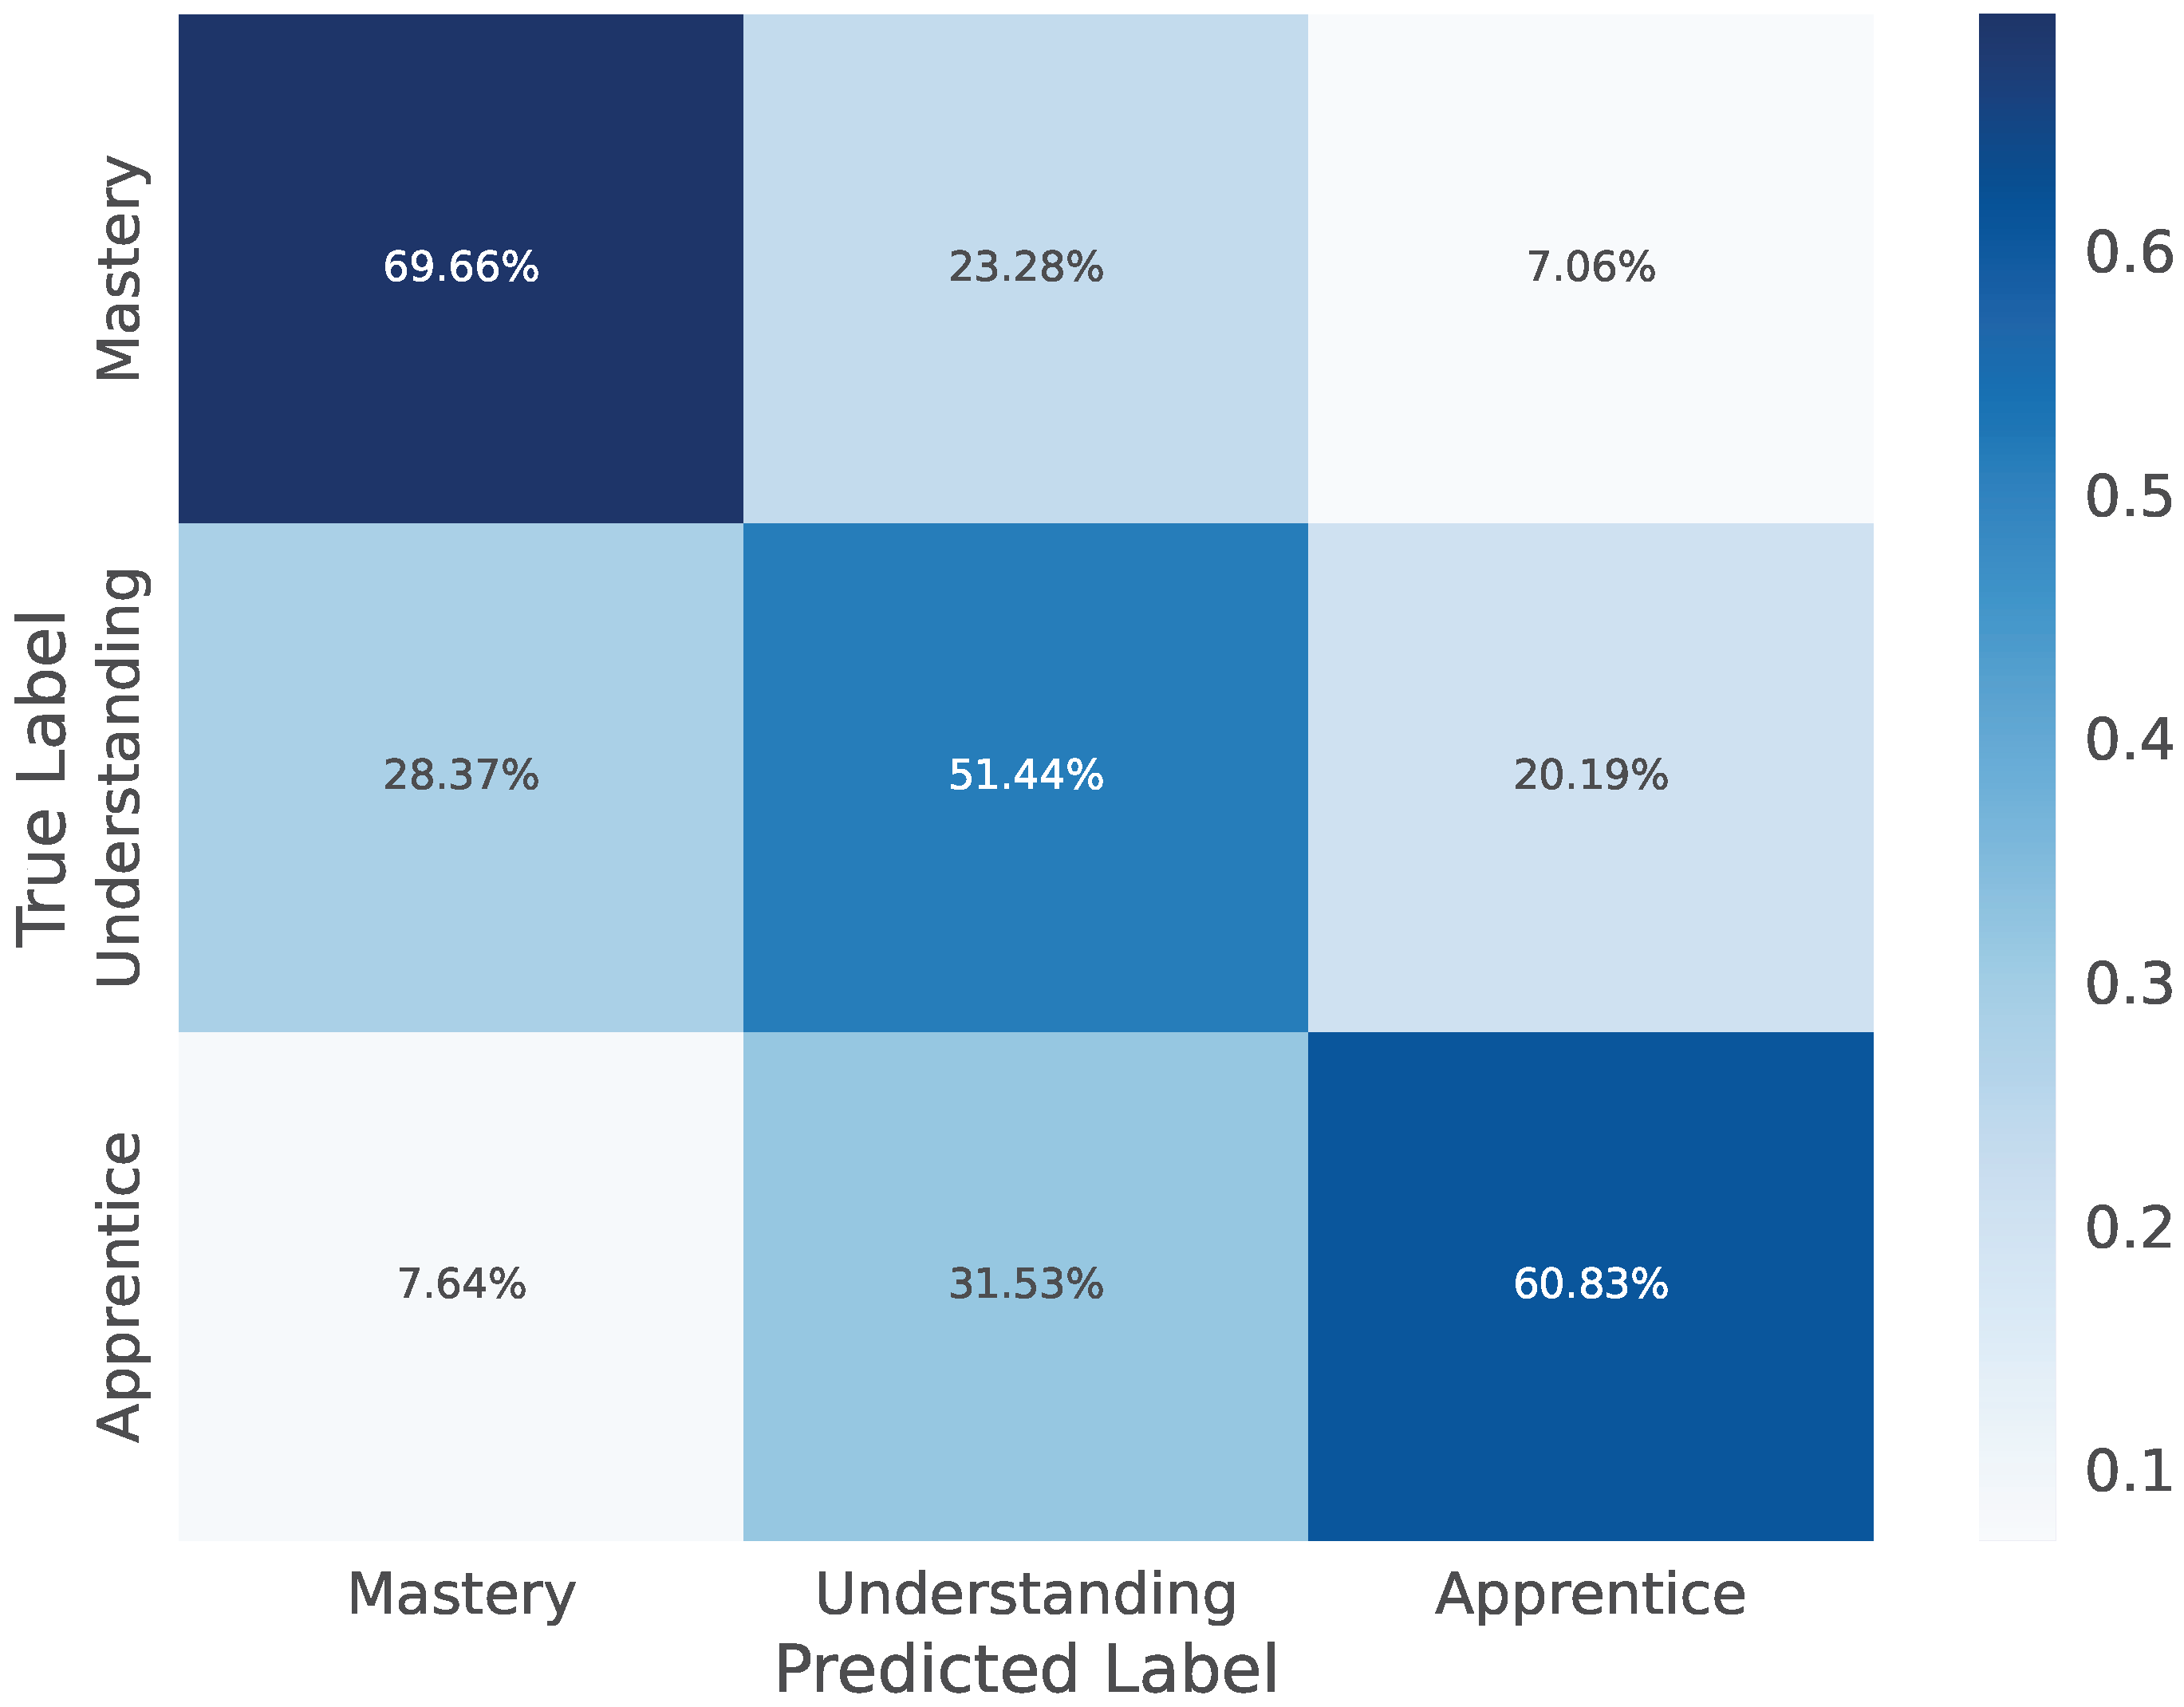
The normalized confusion matrix, presented in Figure 9, reveals the most significant classification challenge: a pronounced bidirectional confusion between the mastery and understanding classes. We observe that 23.28% of true mastery dialogues are misclassified as understanding. Conversely, 28.37% of true understanding dialogues are incorrectly predicted as mastery. This pattern indicates a substantial feature space overlap between these two cognitive levels. In particular, the high confusion between mastery and understanding directly suggests inherent ambiguity in labeling the transitional understanding class, as its distinction from stable mastery can be subtle and context-dependent in dialogue. The current feature set appears insufficient to capture the subtle distinctions that separate a student who has fully mastered a concept from one who is in a transitional state of understanding. This overlap likely stems from similar linguistic patterns and interaction dynamics exhibited by students at these adjacent cognitive stages.
Figure 9.
Normalized confusion matrix (highlighting the confusion between mastery and understanding classes), showing percentage of true labels predicted as each class. Key confusion patterns: 23.28% of mastery samples misclassified as understanding, and 28.37% of understanding samples misclassified as mastery. Overall accuracy: 69.66% for mastery, 51.44% for understanding, and 60.83% for apprentice.
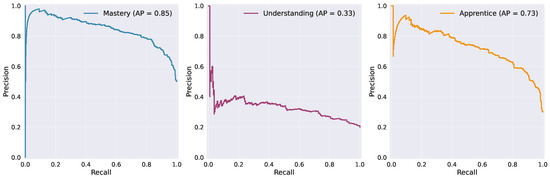
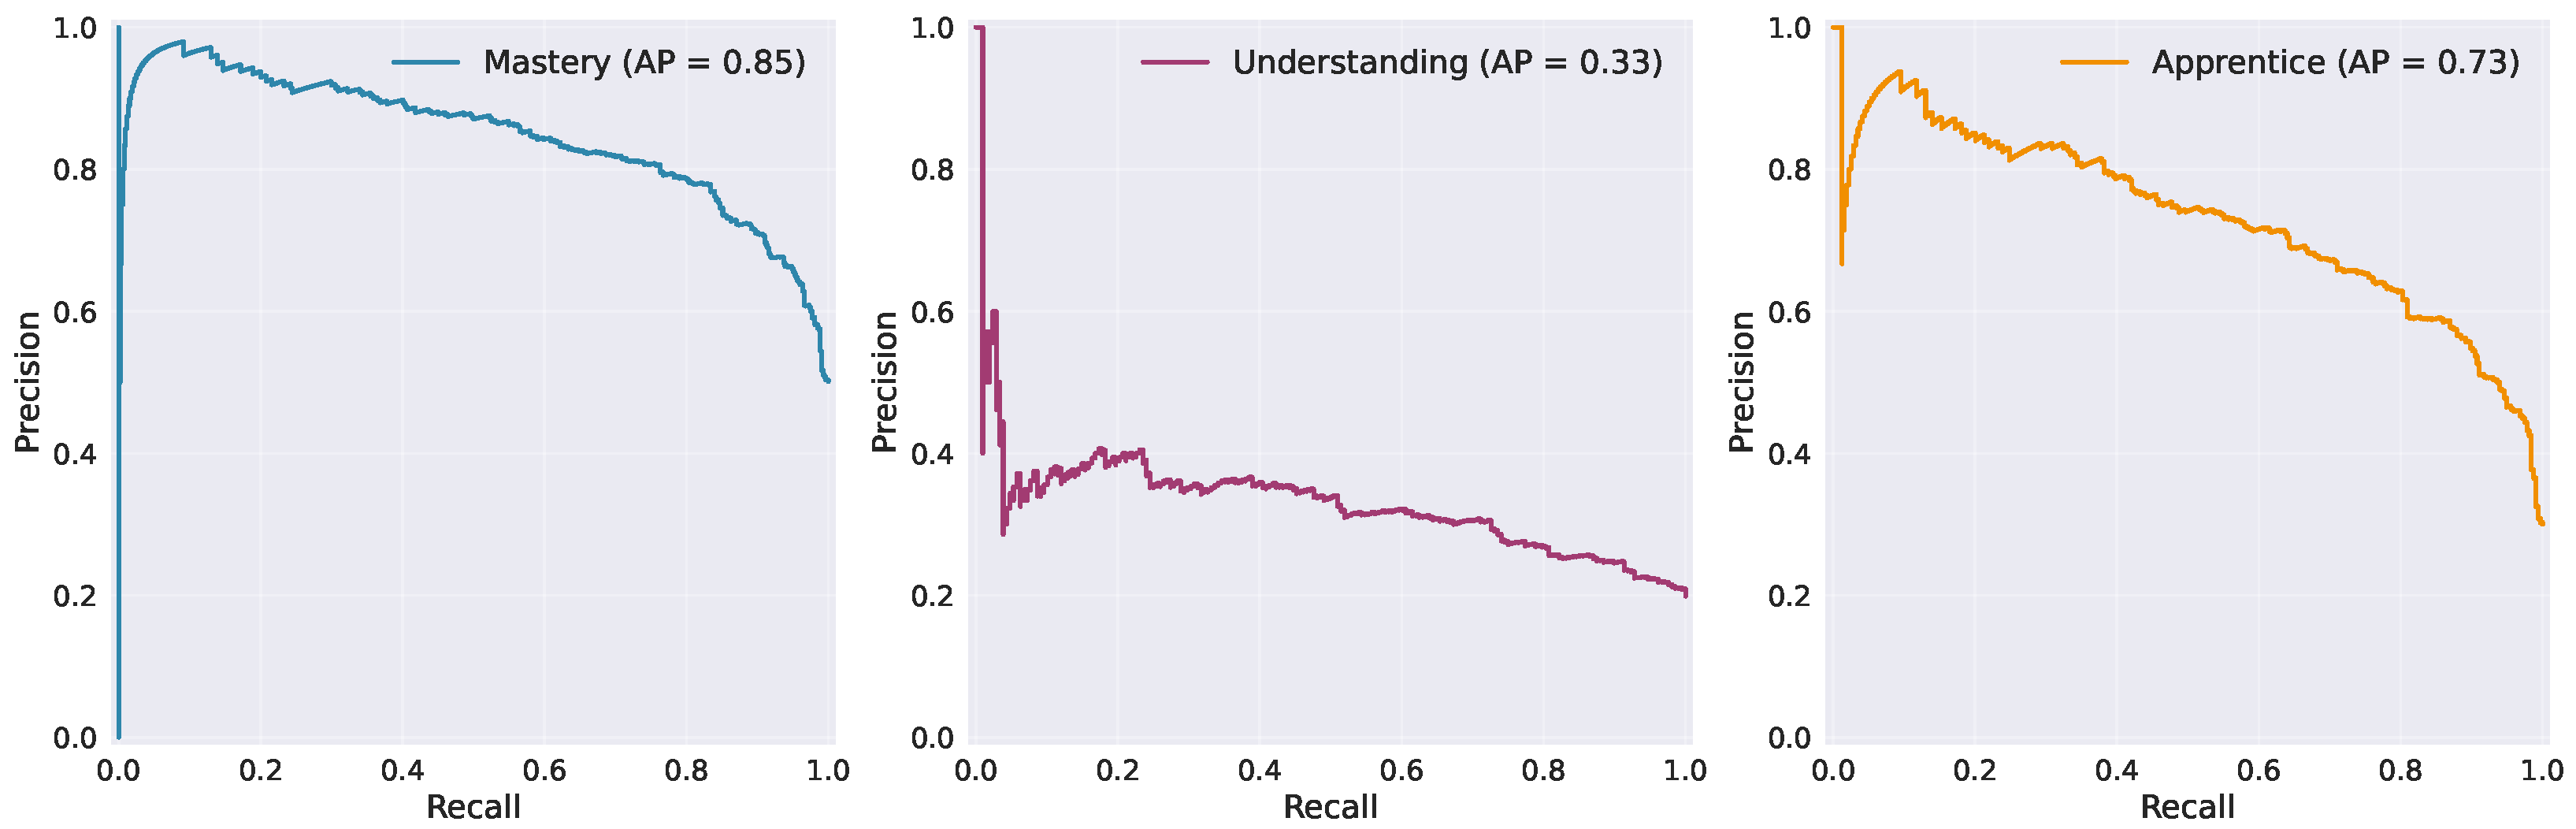
Further evidence of this difficulty is provided by the per-class precision–recall curves in Figure 10. The understanding class achieves an AP of only 0.33. This value is substantially lower than the AP for mastery (0.85) and apprentice (0.73). The low AP score quantitatively confirms the model’s struggle to reliably identify the understanding class. The shape of the precision–recall curve for understanding shows rapid performance decay, meaning the model cannot maintain high precision as it attempts to recall more instances of this class. This behavior is characteristic of a minority class that is not well-separated from others, aligning perfectly with the confusion matrix results.
Figure 10.
Precision—recall curves (with AP) by cognitive level. Curves were generated from a single hold-out test set (20% of data). They show the trade-off between precision and recall for each class. AP scores: mastery (0.85), apprentice (0.73), and understanding (0.33). The understanding class shows rapid performance decay, characteristic of a poorly separated minority class.
Beyond the quantitative analysis, we performed a qualitative examination of misclassified samples. This review identified recurring scenarios that contribute to errors. A dominant pattern is teacher dominance, where extended teacher monologues overshadow student contributions, thereby suppressing the linguistic cues necessary for accurate cognitive level assessment. Another common issue is Topic Shift, where an abrupt change in the dialogue’s subject disrupts the contextual flow, making it difficult to evaluate the depth of student understanding coherently. These observations, combined with the quantitative data, suggest that the existing features, while effective for the mastery and apprentice classes, lack the sensitivity needed to isolate the understanding class.
The insights from this analysis directly inform our strategy for feature refinement. To better disentangle the mastery and understanding classes, we will develop more nuanced features. Promising directions include creating a feature that quantifies the ratio of exploratory to declarative language in student responses, which may better capture the transitional nature of understanding. Additionally, implementing a turn-level analysis of time entropy could mitigate the effects of teacher dominance by highlighting local balances of interaction. Finally, a dedicated dialogue coherence metric, tracking semantic similarity across consecutive utterances, could help the model remain robust against topic shifts. These targeted enhancements are expected to improve the model’s discriminative power, particularly for the most challenging understanding class, leading to more robust and accurate cognitive level assessment.
6. Discussion
6.1. Experimental Validation and Core Advantages of the DWHE Framework
This study systematically validates the effectiveness of the proposed DWHE framework for cognitive level classification in instructional dialogues through experiments. Its main advantages are:
Effectiveness of dynamic features: The introduction of dynamic features such as time entropy and semantic richness significantly enhances the model’s perception of teaching style.
Innovativeness of the ensemble strategy: The dynamic weight adjustment mechanism effectively integrates the advantages of XGBoost and LightGBM, balancing class imbalance [36] and model diversity.
Strong generalization ability: The framework demonstrated stable performance in five-fold cross-validation, as evidenced by the low standard deviation of the macro-F1 score (), and maintained effective discrimination across all classes, achieving a macro-average ROC-AUC of 0.8071 in a multi-class imbalanced scenario.
Implications for Teaching Practice. The findings of this study offer valuable insights for both educators and intelligent tutoring system designers. The strong correlation between time entropy, teaching style, and cognitive outcomes provides empirical support for the educational theory of cognitive engagement, which posits that active student participation is crucial for deep learning. This suggests that teachers can be trained to monitor and adjust their speaking time distribution consciously. For instance, reducing teacher-dominated talk (low entropy) in favor of more balanced or inquiry-based styles (high entropy) could promote deeper cognitive engagement, especially among apprentice-class students. Furthermore, the proposed framework can be integrated into real-time teaching assistants, providing immediate feedback to teachers on their interaction style and predicted student comprehension, thereby enabling just-in-time pedagogical adjustments. The dynamic weighting mechanism also illustrates a path toward adaptive educational AI [37] that tailors its reasoning process based on the observed classroom dynamics, moving beyond static one-model-fits-all solutions.
6.2. Implications and Implementation Paths of Teaching Practice
The implementation of this framework in a real educational environment can be achieved through the following paths:
Teacher teaching feedback tool: Integrate the framework into teaching software to provide teachers with reports after class that include time entropy, teaching models, and predicted cognitive level distribution. For instance, when the report consistently shows that the teaching mode leans towards the “indoctrination style” and is associated with a lower cognitive level, it can prompt teachers to adjust the structure of the dialogue between teachers and students, increase heuristic questioning and opportunities for students to express themselves.
Adaptive learning system intervention module: In the online learning platform, the framework is used to make real-time or quasi-real-time inferences about students’ cognitive levels. For instance, the system can dynamically adjust subsequent dialogue strategies or the difficulty of learning content based on the cognitive level that students are continuously at. For example, it can provide more explanatory materials for students at the apprentice level or pose challenging questions to those approaching the mastery level.
Educational quality assessment indicators: The educational administrative department can anonymously summarize and analyze the interaction quality score, teaching models and other indicators of multiple classrooms. For instance, by comparing the distribution of teaching models and the quality of interaction among different schools or regions, effective teaching practices can be identified, and empirical evidence can be provided for the design of teacher professional development programs.
7. Conclusions
This study addresses the critical challenge of cognitive level classification in instructional dialogues by proposing a novel framework that integrates dynamic temporal features and a dynamically weighted heterogeneous ensemble learning method. The enhanced MCD-temporal dataset, with its new time entropy and semantic richness features, provides a more comprehensive representation of teaching style. The proposed ensemble learner effectively combines the strengths of XGBoost and LightGBM, incorporating an adaptive weighting strategy that responds to class imbalance conditions.
Experimental results validate the superiority of the proposed DWHE framework (), demonstrating statistically significant improvements over key baselines. The method demonstrates superior performance on the minority understanding class (F1 score of 0.4044), while maintaining competitive performance on the majority mastery and apprentice classes (ROC-AUC > 0.86).
Despite the promising results, this study has several limitations that point to future research directions. First, the model was trained and validated primarily on dialogues from a specific academic subject (mathematics), which may limit its immediate generalizability to other disciplines with distinct pedagogical patterns. Future work will involve validating the framework on interdisciplinary dialogue datasets to enhance its robustness. Second, the significant confusion between mastery and understanding classes highlights the challenge of annotation ambiguity for intermediate cognitive states. To address this, a key future direction is to develop a fine-grained annotation rubric with concrete examples (e.g., defining specific linguistic markers that distinguish ’proficient application’ from ’initial comprehension’) to guide and standardize the labeling process. Third, the current feature set is derived solely from textual and temporal metadata. Incorporating multimodal data, such as audio prosody and visual cues of engagement, could provide a more holistic understanding of cognitive states. Finally, exploring the framework’s adaptability for real-time cognitive state inference in live classroom settings represents a critical step towards practical application.
Author Contributions
Conceptualization, Y.W., L.Z., B.L., and W.Z.; methodology, Y.W.; software, Y.W.; validation, Y.W.,L.Z., B.L., and W.Z.; formal analysis, Y.W.; investigation, Y.W.; resources, L.Z., B.L., and W.Z.; data curation, Y.W.; writing—original draft preparation, Y.W.; writing—review and editing, Y.W., L.Z., B.L., and W.Z.; visualization, Y.W.; supervision, L.Z., B.L., and W.Z.; project administration, L.Z., B.L., and W.Z.; funding acquisition, W.Z. All authors have read and agreed to the published version of the manuscript.
Funding
This work was supported by The 2024 Education and Teaching Reform Research Project of Xinjiang Uygur Autonomous Region (XJGXJGZH-2024043).
Institutional Review Board Statement
Not applicable.
Informed Consent Statement
Not applicable.
Data Availability Statement
The dataset and code used in this study are publicly available in the Gitee repository: https://gitee.com/WStui/MCD-Temporal (accessed on 23 November 2025).
Acknowledgments
The authors would like to thank the developers of the original MCD dataset and the open-source community for their valuable tools and libraries. During the preparation of this manuscript, the author used Python programming language and related machine learning libraries for data processing, modeling, and visualization. The author has reviewed and edited the output and takes full responsibility for the content of this publication.
Conflicts of Interest
The authors declare no conflicts of interest.
Abbreviations
The following abbreviations are used in this manuscript:
| MCD | Multi-turn Classroom Dialogue |
| DWHE | Dynamic Weighted Heterogeneous Ensemble |
| TF-IDF | Term Frequency-Inverse Document Frequency |
| SVD | Singular Value Decomposition |
| XGBoost | Extreme Gradient Boosting |
| LightGBM | Light Gradient Boosting Machine |
| SMOTE | Synthetic Minority Over-Sampling Technique |
| ROC-AUC | Receiver Operating Characteristic-Area Under Curve |
Appendix A. Summary of Limitations and Proposed Solutions
This appendix provides a structured summary of the key methodological limitations in existing approaches to cognitive level classification and the corresponding solutions proposed in our MCD-temporal framework. This high-level comparison offers a concise overview of how our work addresses the identified research gaps, complementing the detailed experimental validation in the main text. These points are summarized in Table A1.
Table A1.
Summary of Research Gaps in Prior Work and Our Contributions.
Appendix B. Hyperparameter Tuning Details for DWHE Base Learners
This appendix provides detailed information about the hyperparameter optimization process for the base learners (XGBoost and LightGBM) within the DWHE framework.
Appendix B.1. Hyperparameter Search Space and Optimization Methodology
To determine the optimal hyperparameter configurations for the base learners, we conducted a comprehensive grid search over a predefined parameter space (Table A2) using stratified three-fold cross-validation on the MCD-temporal dataset. The macro-F1 score served as the primary evaluation metric due to its suitability for imbalanced multi-class problems [38]. The optimization process aimed to maximize the predictive performance of each learner individually before their integration into the dynamic ensemble.
Table A2.
Hyperparameter Search Space for XGBoost and LightGBM.
Appendix B.2. Top-Performing Configurations and Analysis
The grid search evaluated numerous parameter combinations for each algorithm. The top 10 performing configurations for XGBoost and LightGBM, ranked by macro-F1 score, are presented in Table A3 and Table A4, respectively.
Table A3.
Top ten XGBoost hyperparameter combinations by macro-F1 score.
Table A4.
Top ten LightGBM hyperparameter combinations by macro-F1 score.
Appendix B.3. Key Findings from Hyperparameter Optimization
Appendix B.3.1. XGBoost Configuration Analysis
The best performing XGBoost configurations consistently used max_depth = 4, n_estimators = 10, learning_rate = 0.1, colsample_bytree = 0.9, and reg_alpha = 1.0 or 0.1. The optimal scale_pos_weight value showed robustness within the range of 1.0 to 5.0, with all values achieving the same top F1 score of 0.6121 when combined with other optimal parameters. subsample = 0.8 and reg_lambda = 0.1 were also prevalent among the top models. The prevalence of shallower trees (max_depth = 4) and moderate n_estimators suggests that a simpler model structure with specific regularization and sampling settings was optimal for this task, effectively mitigating overfitting risks.
Appendix B.3.2. LightGBM Configuration Analysis
The top LightGBM configurations overwhelmingly utilized class_weight = ’balanced’, effectively addressing the class imbalance. The best model employed deeper trees (max_depth = 10), more estimators (n_estimators = 300), and a smaller learning_rate = 0.01, suggesting a need for a more complex and gradually learned model compared to XGBoost for this dataset. Lower regularization values (reg_alpha = 0.1, reg_lambda = 0.1) and specific feature/row sampling rates (colsample_bytree = 0.7, subsample = 0.7/0.8/0.9) were characteristic of the best performers. LightGBM achieved a notably higher best F1 score (0.6338) than XGBoost (0.6121) under this tuning configuration, highlighting its potential effectiveness for this particular problem.
The hyperparameter optimization process successfully identified distinct optimal configurations for XGBoost and LightGBM, reflecting their different algorithmic characteristics and strengths. The chosen parameters for the DWHE base learners are directly based on these top-performing configurations, ensuring each learner operates near its peak performance before dynamic integration.
Appendix C. Dynamic Weight Threshold Analysis
Appendix C.1. Empirical Threshold Determination
The dynamic threshold was optimized through five-fold cross-validation analysis:
Table A5.
Fold-wise Threshold Calculations ().
Appendix C.2. Statistical Summary
Table A6.
Threshold Statistical Analysis.
Appendix C.3. Parameter Selection Rationale
The key parameters in the dynamic weight threshold are comprehensively set based on preliminary experimental observations, the characteristics of educational data, and practical experience. The specific basis is as follows:
Quantile : Based on training set analysis, we found the 15th-percentile effectively identifies scenarios with scarce understanding class samples, triggering targeted minority class reinforcement. This level balances sensitivity to class imbalance with stable weight adjustment frequency.
8% Conservative Adjustment: To prevent drastic weight fluctuations across training iterations, we apply an 8% reduction (multiplier 0.92). This smoothing factor maintains distribution responsiveness while preventing oscillations from minor data variations, ensuring robust performance.
Minimum Threshold 0.12: We set a 0.12 lower bound to ensure reasonable behavior under extreme imbalance. This protects against unreasonable weight distributions when understanding class samples are too sparse for effective pattern learning, maintaining prediction consistency.
Overall consideration of parameter setting: These parameters, determined through preliminary experiments and empirical judgment rather than extensive grid search, balance recognition accuracy with model stability while maintaining method simplicity and interpretability for practical applications.
Appendix C.4. Reproduction Specification
For exact reproduction of Algorithm 2:
| Recommended: | r_threshold = 0.1826 |
| Parameters: | ± = 0.15, adjustment = 0.92, min_threshold = 0.12 |
References
- Geethanjali, K.S.; Umashankar, N. Enhancing Educational Outcomes with Explainable AI: Bridging Transparency and Trust in Learning Systems. In Proceedings of the 2025 International Conference on Emerging Systems and Intelligent Computing (ESIC), Bhubaneswar, India, 8–9 February 2025; pp. 325–328. [Google Scholar] [CrossRef] [Scilit]
- Antoniol, G.; Hayes, J.H.; Gueheneuc, Y.G.; di Penta, M. Reuse or Rewrite: Combining Textual, Static, and Dynamic Analyses to Assess the Cost of Keeping a System up-to-Date. In Proceedings of the 2008 IEEE International Conference on Software Maintenance, Beijing, China, 28 September–4 October 2008; pp. 147–156. [Google Scholar] [CrossRef] [Scilit]
- Fatalian, A.; Nayeri, Z.A.; Azadnia, M. Impact of Using Semantic Social Networks on Organizations. In Proceedings of the 2009 International Conference on Advances in Social Network Analysis and Mining, Athens, Greece, 20–22 July 2009; pp. 47–52. [Google Scholar] [CrossRef] [Scilit]
- Moazeni, S.; Pourmohammadi, H. Smart Teaching Quantitative Topics through the VARK Learning Styles Model. In Proceedings of the 2013 IEEE Integrated STEM Education Conference (ISEC), Princeton, NJ, USA, 9 March 2013; pp. 1–7. [Google Scholar] [CrossRef] [Scilit]
- Escudero-Viñolo, M.; López-Cifuentes, A. CCL: Class-Wise Curriculum Learning for Class Imbalance Problems. In Proceedings of the 2022 IEEE International Conference on Image Processing (ICIP), Bordeaux, France, 16–19 October 2022; pp. 1476–1480. [Google Scholar] [CrossRef] [Scilit]
- Chen, J.; Liu, Z.; Hou, M.; Zhao, X.; Luo, W. Multi-Turn Classroom Dialogue Dataset: Assessing Student Performance from Oneon- one Conversations. In Proceedings of the 33rd ACM International Conference on Information and Knowledge Management, Boise, ID, USA, 21–25 October 2024; pp. 5333–5337. [Google Scholar] [CrossRef] [Scilit]
- Wang, D.; Yang, J.; Zhou, Y. Human Action Recognition Based on Multi-Mode Spatial-Temporal Feature Fusion. In Proceedings of the 2019 22th International Conference on Information Fusion (FUSION), Ottawa, ON, Canada, 2–5 July 2019; pp. 1–7. [Google Scholar] [CrossRef] [Scilit]
- Bertocco, M.; Giorgi, G.; Narduzzi, C. Innovation-Based Timestamp Validation for Reliable Sensor Network Synchronization. In Proceedings of the 2013 IEEE International Instrumentation and Measurement Technology Conference (I2MTC), Minneapolis, MN, USA, 6–9 May 2013; pp. 784–789. [Google Scholar] [CrossRef] [Scilit]
- Zhao, F. A Resource Sharing System for Music Education Using the Entropy Technology. Mob. Inf. Syst. 2022, 2022, 3382742. [Google Scholar] [CrossRef] [Scilit]
- Zhang, Y.; Mariano, V.Y.; Bringula, R.P. Prediction of Student’s Grade by Combining Educational Knowledge Graph and Collaborative Filtering. IEEE Access 2024, 12, 68382–68392. [Google Scholar] [CrossRef] [Scilit]
- Sun, L. Application and Improvement of Xgboost Algorithm Based on Multiple Parameter Optimization Strategy. In Proceedings of the 2020 5th International Conference on Mechanical, Control and Computer Engineering (ICMCCE), Harbin, China, 25–27 December 2020; pp. 1822–1825. [Google Scholar] [CrossRef] [Scilit]
- Cai, Z.; Huang, H.; Sun, G.; Li, Z.; Ouyang, C. Advancing Predictive Models: Unveiling LightGBM Machine Learning for Data Analysis. In Proceedings of the 2023 4th International Conference on Computer, Big Data and Artificial Intelligence (ICCBD+AI), Guiyang, China, 15–17 December 2023; pp. 109–112. [Google Scholar] [CrossRef] [Scilit]
- Yadav, S.; Shukla, S. Analysis of K-Fold Cross-Validation over Hold-Out Validation on Colossal Datasets for Quality Classification. In Proceedings of the 2016 IEEE 6th International Conference on Advanced Computing (IACC), Bhimavaram, India, 27–28 February 2016; pp. 78–83. [Google Scholar] [CrossRef] [Scilit]
- Kobayashi, S.; Fujita, D.; Shibutani, H.; Gohara, S.; Kobashi, S. ESWL Outcome Prediction with SMOTE and Stratified Sampling. In Proceedings of the 2024 Joint 13th International Conference on Soft Computing and Intelligent Systems and 25th International Symposium on Advanced Intelligent Systems (SCIS&ISIS), Himeji, Japan, 9–12 November 2024; pp. 1–2. [Google Scholar] [CrossRef] [Scilit]
- Özbey, C.; Ülgen, E.K. Distribution of High-Frequency Words: An Analytical Investigation. In Proceedings of the 2023 11th International Symposium on Digital Forensics and Security (ISDFS), Chattanooga, TN, USA, 11–12 May 2023; pp. 1–6. [Google Scholar] [CrossRef] [Scilit]
- Jing, C.; Jing, X.; Dongbo, W.; Jianming, Z. Analyzing Syntactic Features of Chinese Structures Base on the Statistics of Tsinghua Treebank. In Proceedings of the 2012 IEEE International Conference on Computer Science and Automation Engineering (CSAE), Zhangjiajie, China, 25–27 May 2012 ; Volume 2, pp. 121–125. [Google Scholar] [CrossRef] [Scilit]
- Bhattacharjee, I.; Bhattacharja, P. Stock Price Prediction: A Comparative Study between Traditional Statistical Approach and Machine Learning Approach. In Proceedings of the 2019 4th International Conference on Electrical Information and Communication Technology (EICT), Khulna, Bangladesh, 20–22 December 2019; pp. 1–6. [Google Scholar] [CrossRef] [Scilit]
- Tam, V.; Lam, E.Y.; Fung, S.T.; Fok, W.W.T.; Yuen, A.H.K. Enhancing Educational Data Mining Techniques on Online Educational Resources with a Semi-Supervised Learning Approach. In Proceedings of the 2015 IEEE International Conference on Teaching, Assessment, and Learning for Engineering (TALE), Zhuhai, China, 10–12 December 2015; pp. 203–206. [Google Scholar] [CrossRef] [Scilit]
- Santoni, M.M.; Basaruddin, T.; Junus, K.; Lawanto, O. Automatic Detection of Students’ Engagement During Online Learning: A Bagging Ensemble Deep Learning Approach. IEEE Access 2024, 12, 96063–96073. [Google Scholar] [CrossRef] [Scilit]
- Yang, B.; Gao, H.x.; Chen, Z. Efficient Sampling Strategies for Large-Scale Complex Networks. In Proceedings of the 2008 International Conference on Management Science and Engineering 15th Annual Conference Proceedings, Long Beach, CA, USA, 10–12 September 2008; pp. 334–339. [Google Scholar] [CrossRef] [Scilit]
- Xu, H. Hierarchical Cost-Sensitive Techniques for Class Imbalance Learning. In Proceedings of the 2021 4th International Conference on Artificial Intelligence and Big Data (ICAIBD), Chengdu, China, 28–31 May 2021; pp. 604–609. [Google Scholar] [CrossRef] [Scilit]
- Möller, S.; Köster, F.; Weiss, B. Modelling Speech Service Quality: From Conversational Phases to Communication Quality and Service Quality. In Proceedings of the 2017 Ninth International Conference on Quality of Multimedia Experience (QoMEX), Erfurt, Germany, 31 May–2 June 2017; pp. 1–3. [Google Scholar] [CrossRef] [Scilit]
- Stach, W.; Kurgan, L.A.; Pedrycz, W. Numerical and Linguistic Prediction of Time Series with the Use of Fuzzy Cognitive Maps. IEEE Trans. Fuzzy Syst. 2008, 16, 61–72. [Google Scholar] [CrossRef] [Scilit]
- Jain, S.; Jain, S.K.; Vasal, S. An Effective TF-IDF Model to Improve the Text Classification Performance. In Proceedings of the 2024 IEEE 13th International Conference on Communication Systems and Network Technologies (CSNT), Jabalpur, India, 6–7 April 2024; pp. 1–4. [Google Scholar] [CrossRef] [Scilit]
- Cottrell-Boyce, A. Banking and Debunking: Applying Freirean Theory to the Educational Challenges of Conspiracy Culture. J. Philos. Educ. 2024, 58, 562–581. [Google Scholar] [CrossRef] [Scilit]
- Cai, L.; Msafiri, M.M.; Kangwa, D. Exploring the Impact of Integrating AI Tools in Higher Education Using the Zone of Proximal Development. Educ. Inf. Technol. 2025, 30, 7191–7264. [Google Scholar] [CrossRef] [Scilit]
- Nguyen, V.H.; Halpin, R.; Joy-Thomas, A.R. Guided Inquiry-Based Learning to Enhance Student Engagement, Confidence, and Learning. J. Dent. Educ. 2024, 88, 1040–1047. [Google Scholar] [CrossRef] [Scilit] [PubMed]
- Stoltz, T.; Weger, U.; da Veiga, M. Consciousness and Education: Contributions by Piaget, Vygotsky and Steiner. Front. Psychol. 2024, 15. [Google Scholar] [CrossRef] [Scilit] [PubMed]
- Wei, Z.; Narin, A.B.; Mukherjee, S. Multidimensional Population Health Modeling: A Data-Driven Multivariate Statistical Learning Approach. IEEE Access 2022, 10, 22737–22755. [Google Scholar] [CrossRef] [Scilit]
- Tan, C.; Wei, Z.; Wu, Z.; Chen, Y.; Gu, J. Parallel Optimization of K-SVD Algorithm for Image Denoising Based on Spark. In Proceedings of the 2016 IEEE 13th International Conference on Signal Processing (ICSP), Chengdu, China, 6–10 November 2016; pp. 820–825. [Google Scholar] [CrossRef] [Scilit]
- Chirila, C.B.; Şora, I. The Optimization of a Page Rank Based Key Classes Classifier Using Simulated Annealing with ROC-AUC and Recall Metrics. In Proceedings of the 2019 IEEE 13th International Symposium on Applied Computational Intelligence and Informatics (SACI), Timișoara, Romania, 29–31 May 2019; pp. 21–26. [Google Scholar] [CrossRef] [Scilit]
- Yuan, D.; Huang, J.; Yang, X.; Cui, J. Improved Random Forest Classification Approach Based on Hybrid Clustering Selection. In Proceedings of the 2020 Chinese Automation Congress (CAC), Shanghai, China, 6–8 November 2020; pp. 1559–1563. [Google Scholar] [CrossRef] [Scilit]
- Ambesange, S.; A, V.; Uppin, R.; Patil, S.; Patil, V. Optimizing Liver Disease Prediction with Random Forest by Various Data Balancing Techniques. In Proceedings of the 2020 IEEE International Conference on Cloud Computing in Emerging Markets (CCEM), Bengaluru, India, 4–7 November 2020; pp. 98–102. [Google Scholar] [CrossRef] [Scilit]
- Luo, L.; Lv, W.; Zhang, R. An Empirical Study on Balance of Trade in China Based on Random Forest Regression Model. In Proceedings of the 2010 5th International Conference on Computer Science & Education, Hefei, China, 24–27 August 2010; pp. 561–564. [Google Scholar] [CrossRef] [Scilit]
- Bhavani, R.; Balamanigandan, R.; Priscilla, A.A. Analyzing the Performance of Novel Logistic Regression over Linear Regression Algorithms for Predicting Fake Job with Improved Accuracy. In Proceedings of the 2024 5th International Conference on Electronics and Sustainable Communication Systems (ICESC), Coimbatore, India, 7–9 August 2024; pp. 1728–1732. [Google Scholar] [CrossRef] [Scilit]
- Kharis, M. Crafting AI-Driven Open Educational Resources (OER) Videos for Enhanced German Language Learning. In Proceedings of the 2024 IEEE International Symposium on Consumer Technology (ISCT), Bali, Indonesia, 13–16 August 2024; pp. 137–141. [Google Scholar] [CrossRef] [Scilit]
- Luo, D.; Zheng, Y. The Research of Online Teaching Pattern Based on MOOC. In Proceedings of the 2015 International Symposium on Educational Technology (ISET), Wuhan, China, 27–29 July 2015; pp. 120–124. [Google Scholar] [CrossRef] [Scilit]
- Li, H.; Zou, P.; Han, W.; Xia, R. A Combination Method for Multi-class Imbalanced Data Classification. In Proceedings of the 2013 10th Web Information System and Application Conference, Yangzhou, China, 10–15 November 2013; pp. 365–368. [Google Scholar] [CrossRef] [Scilit]

Disclaimer/Publisher’s Note: The statements, opinions and data contained in all publications are solely those of the individual author(s) and contributor(s) and not of MDPI and/or the editor(s). MDPI and/or the editor(s) disclaim responsibility for any injury to people or property resulting from any ideas, methods, instructions or products referred to in the content. |
© 2025 by the authors. Licensee MDPI, Basel, Switzerland. This article is an open access article distributed under the terms and conditions of the Creative Commons Attribution (CC BY) license (https://creativecommons.org/licenses/by/4.0/).