


Abstract
Background: Evidence on the association between recreational screen time and emotional and behavioral difficulties in Spanish children remains limited. Objective: To examine this association, including potential nonlinearity and differences across Strengths and Difficulties Questionnaire (SDQ) domains. Methods: This cross-sectional study used data from the 2023 Spanish Health Survey. Of 2920 children aged 4–14 years, 2596 were included in the fully adjusted analysis. Recreational screen time was estimated from weekday and weekend reports. Weighted linear regression with robust standard errors assessed associations with the SDQ Total Difficulties Score, adjusting for demographic, socioeconomic, behavioral, family, and health-related factors. Restricted cubic splines assessed nonlinearity. Results: Each additional hour/day of screen time was associated with a 0.356-point higher SDQ Total Difficulties Score (95% CI, 0.127–0.586; p = 0.002). The association was nonlinear (p = 0.004). Compared with <1 h/day, ≥3 h/day was associated with a 0.787-point higher score (95% CI, 0.036–1.539; p = 0.040). Positive associations were observed for hyperactivity/inattention, emotional symptoms, and conduct problems after correction for multiple comparisons, but not for peer problems or prosocial behavior. Conclusions: Greater recreational screen time was associated with modestly higher emotional and behavioral difficulties, particularly at higher exposure levels. The cross-sectional findings do not establish causality or a specific screen-time threshold.
1. Introduction
Mental health and emotional well-being are fundamental components of healthy development during childhood. Mental disorders affect a substantial proportion of children and adolescents worldwide, with a pooled prevalence estimated at approximately 13% [1]. Importantly, many mental disorders emerge early in life; a large-scale meta-analysis reported that approximately one-third of individuals with a mental disorder experienced its onset before the age of 14 years [2]. Emotional and behavioral difficulties during childhood are therefore relevant not only as indicators of current well-being but also as potential markers of later psychosocial and mental health problems. The Strengths and Difficulties Questionnaire (SDQ) is a widely used instrument for assessing these difficulties at the population level, encompassing emotional symptoms, conduct problems, hyperactivity/inattention, peer relationship problems, and prosocial behavior [3].
At the same time, screen-based activities have become an integral part of children’s everyday lives. Screen exposure encompasses an increasingly diverse range of activities involving televisions, computers, tablets, smartphones, video games, and other digital devices. Concerns have consequently emerged regarding the potential relationship between prolonged recreational screen exposure and children’s emotional and behavioral health. The World Health Organization’s 2019 guidelines for children under 5 years of age recommend no more than 1 h/day of sedentary screen time for children aged 3–4 years [4]. For children and adolescents aged 5–17 years, the 2020 WHO guidelines recommend limiting sedentary behavior, particularly recreational screen time, without specifying a universal daily screen-time threshold [5,6]. The certainty of evidence linking sedentary behavior with several health outcomes remains limited [4,5]. Importantly, screen time should not be considered equivalent to sedentary behavior as a whole, because sedentary activities differ substantially in their context, content, and potential developmental implications [6].
Accumulating evidence suggests that greater screen exposure is associated with emotional and behavioral difficulties in children, although the magnitude of these associations is generally modest and their interpretation remains complex. A systematic review and meta-analysis including 87 studies and 159,425 children found small but statistically significant associations between greater screen time and both externalizing and internalizing problems [7]. More recent longitudinal evidence also supports associations between electronic screen use and subsequent socioemotional problems, while simultaneously suggesting that the relationship may be bidirectional—that is, greater screen use may precede emotional or behavioral difficulties, but children experiencing such difficulties may also subsequently engage in more screen use [8]. A 2025 meta-analysis similarly reported small associations between screen exposure and poorer social-emotional competence and greater problem behaviors [9]. These findings highlight the need for cautious interpretation and reinforce the importance of accounting for other characteristics of children’s daily lives and social environments.
Screen exposure does not occur in isolation. It is embedded within a broader pattern of daily behaviors that includes physical activity and sleep, both of which may be related to emotional and behavioral health. WHO evidence reviews have noted associations between greater recreational screen exposure and shorter sleep duration as well as unfavorable behavioral outcomes [5,6]. In Spanish children, adherence to combinations of physical activity, recreational screen-time, and sleep recommendations has previously been associated with fewer socioemotional behavioral problems [10]. More recently, an analysis of the 2023 Spanish Health Survey found a graded association between greater leisure-time physical activity frequency and a lower probability of emotional and behavioral difficulties among Spanish children aged 6–14 years [11]. Consequently, examining screen exposure without simultaneously considering physical activity and sleep may provide an incomplete picture of its relationship with children’s emotional and behavioral health.
Previous Spanish population-based research provides particularly relevant evidence. Using 4073 children aged 4–14 years from the 2017 Spanish National Health Survey, Cartanyà-Hueso et al. found that children with three or more hours per day of leisure screen time had a higher prevalence of overall emotional and behavioral difficulties, as well as emotional symptoms, conduct problems, peer problems, and poorer prosocial behavior, compared with children reporting less than one hour per day [12]. This study established an important national reference; however, several questions remain relevant. Screen exposure and children’s behavioral environments continue to evolve, the relationship between screen duration and emotional and behavioral difficulties may not be strictly linear, and screen time needs to be interpreted alongside physical activity, sleep, socioeconomic and family circumstances, and underlying health conditions. Furthermore, examining continuous SDQ difficulties scores in addition to categorical classifications may provide complementary information about differences across the full distribution of emotional and behavioral difficulties.
The 2023 Spanish Health Survey provides an opportunity to examine these questions using recent population-based data from children across Spain. Accordingly, the primary objective of this study was to examine the association between recreational screen time and emotional and behavioral difficulties among children aged 4–14 years in Spain. Secondary objectives were to investigate whether the association between screen time and total difficulties was nonlinear, to examine associations across specific SDQ domains, and to assess the robustness of the findings after accounting for sociodemographic and socioeconomic characteristics, physical activity, sleep duration, family characteristics, and physical morbidity. We hypothesized that greater recreational screen time would be associated with higher levels of emotional and behavioral difficulties independently of these factors.
2. Materials and Methods
2.1. Study Design and Data Source
This cross-sectional, population-based study used data from the 2023 Spanish Health Survey (Encuesta de Salud de España, ESdE 2023), conducted jointly by the Spanish National Statistics Institute (Instituto Nacional de Estadística, INE, Madrid, Spain) and the Spanish Ministry of Health. The ESdE 2023 was designed to provide health information representative of the population residing in private households in Spain at both national and regional levels. Data collection was conducted over a 12-month period, from September 2023 to August 2024 [13].
The ESdE 2023 used a three-stage sampling design with stratification of first-stage units. Census sections constituted the first-stage units, and main family dwellings constituted the second-stage units. Within each household, one individual aged ≥15 years was selected to complete the Adult Questionnaire and, when children were present, one child aged 0–14 years was selected to complete the Child Questionnaire [13].
The present study used the anonymized public-use Child and Household microdata files for the primary analyses. Child records were linked to household information using the household identifier to obtain household-level socioeconomic and family characteristics. The Adult microdata file was additionally linked by household identifier for exploratory sensitivity analyses of adult educational attainment and mental-health indicators. Individual identifiers were used to determine whether the selected adult coincided with the child-questionnaire informant. All regression analyses incorporated the child-specific weighting factor. The official ESdE methodology states that weighting procedures were designed to produce representative estimates and that the survey has national and autonomous-community representativeness [13]. The original ESdE 2023 variable codes used in this study are listed in Supplementary Table S1.
2.2. Study Population
The public-use Child file contained 3641 children aged 0–14 years. The analytical population was restricted to children aged 4–14 years, because the mental-health module containing the Strengths and Difficulties Questionnaire (SDQ) is administered only to children aged ≥4 years [13,14].
A total of 2920 children aged 4–14 years met the age eligibility criterion. Of these, 2731 had sufficient information to derive the SDQ Total Difficulties Score. Analyses were conducted using participants with complete information for the variables required in each model; consequently, the analytical sample size is reported for each multivariable analysis.
Because a recent study using the ESdE 2023 examined SDQ difficulties among children aged 6–14 years [10], the primary analyses were additionally repeated after restriction to this age range as a sensitivity analysis.
2.3. Emotional and Behavioral Difficulties
Emotional and behavioral difficulties were assessed using the Strengths and Difficulties Questionnaire (SDQ). The ESdE 2023 administers the 25-item SDQ to children aged 4–14 years, with responses provided by an adult informant based on the child’s behavior during the preceding 6 months [13,14]. The informant’s relationship to the child was identified using the child questionnaire’s informant identifier and household relationship variables. In the primary analytical sample (N = 2596), the informant was the mother for 1593 children (60.92% weighted), the father for 839 (32.41% weighted), and another person for 164 (6.67% weighted). Informant type was not included in the prespecified primary model but was examined as an additional covariate in an exploratory sensitivity analysis, categorized as mother, father, or other informant.
The SDQ comprises five five-item domains: emotional symptoms, conduct problems, hyperactivity/inattention, peer relationship problems, and prosocial behavior [3]. Each domain ranges from 0 to 10. The Total Difficulties Score, the primary outcome of the present study, was obtained by summing the first four difficulty domains, excluding the prosocial scale, and therefore ranged from 0 to 40, with higher scores indicating greater emotional and behavioral difficulties [3]. The continuous score was selected as the primary outcome because the SDQ Total Difficulties Score can validly be interpreted dimensionally across its distribution [15].
The five SDQ domain scores were examined separately as secondary outcomes. These analyses were considered secondary and domain-specific rather than independent primary tests of the study hypothesis.
2.4. Screen-Time Exposure
The primary exposure was daily recreational screen time. The ESdE 2023 Child Questionnaire asks how much time the selected child usually spends in leisure time in front of a screen, explicitly including computers, tablets, television, videos, video games, and mobile-phone screens [14]. Exposure is assessed separately for a weekday (Monday–Friday) and for a weekend day (Saturday or Sunday).
For both periods, the questionnaire distinguishes among “none or almost none”, “less than one hour”, and “one hour or more”. When ≥1 h/day is reported, the corresponding number of daily hours is recorded [14].
To estimate average daily recreational screen time across a typical week, weekday and weekend screen time were combined using a weighted average, with five weekdays and two weekend days:
Average daily screen time = [(5 × weekday screen time) + (2 × weekend screen time)]/7.
For both weekday and weekend responses, “none or almost none” was assigned a value of 0 h/day and “less than one hour” was assigned 0.5 h/day, representing the midpoint of this interval. When screen time was reported as ≥1 h/day, the number of hours reported by the informant was used directly. Because the exact duration within the “less than one hour” category was unknown, alternative values of 0.25 and 0.75 h/day were examined in sensitivity analyses. Reported durations were recorded in whole hours when exposure was at least 1 h/day, resulting in heaping at integer values. Values coded as 99 were treated as missing, and reported durations of 24 h/day or more were excluded as invalid. No additional upper-end truncation or winsorization was applied to valid reported durations. An explicit top-coding threshold could not be established from the available public-use data.
Average daily screen time was analyzed as a continuous variable (h/day) in the primary analysis. As a complementary secondary analysis, it was also categorized as <1, 1–<2, 2–<3, and ≥3 h/day to facilitate comparison with previous Spanish population-based research [12].
2.5. Physical Activity and Sleep
Usual sleep duration was assessed by asking approximately how many hours the child usually slept per day, explicitly including daytime naps [14]. Sleep duration was analyzed continuously in hours/day.
Leisure-time physical activity was classified according to the four original response categories of the ESdE 2023 questionnaire: (1) no exercise and almost completely sedentary leisure time; (2) occasional physical or sporting activity; (3) physical activity several times per month; and (4) sports or physical training several times per week [13].
The original categorical structure was retained rather than imposing a linear numerical relationship between categories. Physical activity was included as a behavioral covariate because recent analysis of ESdE 2023 demonstrated a graded association between leisure-time physical activity frequency and emotional/behavioral difficulties in Spanish children [11].
2.6. Socioeconomic, Demographic, and Family Characteristics
Age and sex were obtained directly from the Child file. Country of birth was classified as Spain or foreign-born, following the original ESdE question, which distinguishes Spain (code 1), foreign country (code 2), and unknown/non-response (code 9) [14].
Household socioeconomic and composition variables were obtained from the linked Household file. Monthly net household income was used as the primary indicator of socioeconomic position and categorized according to the five income bands available in the ESdE 2023 data: <EUR 1100; EUR 1100–<1650; EUR 1650–<2300; EUR 2300–<3800; and ≥EUR 3800 per month. Non-response was treated as missing.
Occupational social class was evaluated as an alternative socioeconomic indicator in sensitivity analyses rather than simultaneously included with household income in the primary model.
Household composition was characterized using the number of adults and minors residing in the household. A single-adult household indicator was derived from the household composition variables and included as a family-level covariate.
2.7. Physical Morbidity and Other Health Conditions
The ESdE 2023 Child Questionnaire asks whether the child has ever experienced a predefined set of chronic diseases or health problems, whether each condition was present during the preceding 12 months, and whether it had been medically diagnosed [14].
For the primary analysis, physical chronic morbidity was defined using medically diagnosed physical conditions recorded in the survey, including chronic allergy, asthma, diabetes, malignant tumors, epilepsy, and permanent injuries or defects resulting from an accident.
Behavioral disorders including hyperactivity, mental disorders including depression or anxiety, and autism spectrum disorders were deliberately not included in the primary physical-morbidity covariate because these conditions overlap conceptually with the SDQ outcome. The official questionnaire records these conditions separately from the physical conditions [14]. Additional adjustment for these neurodevelopmental, behavioral, or mental-health conditions was therefore reserved for a sensitivity analysis.
Health-related functional limitation was defined from the question asking whether, for at least the previous 6 months, the child had been severely limited, limited but not severely, or not limited in activities usually performed by children because of a health problem [14]. Because functional limitation may lie close to the pathway linking morbidity and emotional/behavioral functioning, it was also examined in sensitivity rather than primary adjustment.
2.8. Statistical Analysis
Participant characteristics were summarized using unweighted sample sizes together with estimates incorporating the ESdE child weighting factor. Continuous variables were summarized using appropriate measures of central tendency and dispersion, and categorical variables using frequencies and weighted percentages.
The primary outcome was the continuous SDQ Total Difficulties Score (0–40). Associations with screen time were estimated using weighted linear regression, incorporating he child-specific survey weight. Because the public-use files do not provide all information required to reproduce every component of the original complex sampling design, the analyses are not described as full survey-design-based variance estimation. Heteroskedasticity-robust standard errors were used, and results are presented as regression coefficients (β), 95% confidence intervals (CIs), and two-sided p-values.
Regression coefficients for continuous screen time represent the adjusted mean difference in SDQ Total Difficulties Score associated with each additional hour/day of average screen exposure.
Covariates were selected a priori on conceptual grounds and previous evidence, rather than through automated significance-based variable selection. Sequential models were specified to assess the stability of the screen-time association after progressive adjustment:
Model 1 included age and sex.
Model 2 additionally included household income.
Model 3 additionally included leisure-time physical activity and sleep duration.
Model 4 (primary fully adjusted model) additionally included physical chronic morbidity, single-adult household status, and country of birth.
This sequential approach was intended to show how the screen-time coefficient changed after accounting for socioeconomic, behavioral, family, and health-related characteristics, rather than to identify a statistically “optimal” model.
An unadjusted model was also estimated. To ensure comparability of the screen-time coefficients across models, the crude model and all four sequentially adjusted models were fitted using the same complete-case analytical sample as the fully adjusted primary model (N = 2596). Weighted least-squares regression with heteroskedasticity-robust (HC0) standard errors was used throughout.
2.8.1. Assessment of Nonlinearity
Because categorizing a continuous exposure can result in loss of information and may conceal the shape of an exposure–outcome association, screen time was retained continuously in the primary analysis and potential departure from linearity was additionally examined using restricted cubic spline regression [15]. Restricted cubic splines permit flexible modeling of continuous exposure–outcome relationships without imposing a single linear slope across the full exposure range [16].
The spline model used the same covariate adjustment set as the primary fully adjusted model. Four knots were placed at the weighted 5th, 35th, 65th, and 95th percentiles of the screen-time distribution. Adjusted predicted SDQ Total Difficulties scores and 95% CIs across the observed screen-time distribution were used to graphically represent the association. Evidence of nonlinearity was assessed using a joint Wald test of the nonlinear spline terms. The overall screen-time association and evidence for nonlinearity were evaluated separately; consequently, the shape of the curve was not interpreted solely on the basis of an arbitrarily selected screen-time threshold.
2.8.2. Secondary and Sensitivity Analyses
Secondary analyses examined associations with each SDQ domain separately. Because these domain analyses involved multiple related secondary outcomes, multiplicity was addressed using the Benjamini–Hochberg false discovery rate procedure [17], while unadjusted effect estimates and 95% CIs were retained to facilitate interpretation. Given the asymmetric distributions and floor effects observed in several SDQ domains, we additionally examined the internalizing composite (emotional symptoms plus peer problems) and externalizing composite (conduct problems plus hyperactivity/inattention), each ranging from 0 to 20 points. These exploratory composite outcomes were analyzed using separate survey-weighted multivariable linear regression models with the same covariates and robust standard errors as the primary model. Each domain-specific or composite model used the available complete cases for its respective outcome, screen-time exposure, and adjustment variables; consequently, its analytical sample could be larger than that of the primary Total Difficulties model. Exploratory weighted Poisson models with a log link and robust standard errors were also fitted to the individual SDQ domains and the two composites to examine the consistency of the associations under an alternative mean-model specification. To facilitate interpretation of effect magnitude, the adjusted screen-time coefficients and their confidence intervals were also expressed in standard-deviation units by dividing them by the weighted standard deviation of the SDQ Total Difficulties Score in the primary analytical sample. As an additional exploratory analysis, the SDQ Total Difficulties Score was dichotomized using the conventional parent-report abnormal threshold of ≥17 points. Associations with screen-time categories were examined using weighted Poisson regression with a log link and robust standard errors to estimate adjusted prevalence ratios, retaining the same covariates and complete-case sample as the primary model. This fixed cut-off analysis was intended to complement the continuous-score results; it was not considered an exact replication of the percentile-based SDQ classification used by Cartanyà-Hueso et al. [12].
Prespecified sensitivity analyses comprised: restriction to children aged 6–14 years; alternative coding assumptions for the “less than one hour” screen-time category; replacement of household income by occupational social class as the socioeconomic indicator; and additional adjustment for neurodevelopmental/behavioral/mental-health conditions and health-related functional limitation. In response to concerns about potential reverse causation, an additional sensitivity analysis excluded children with reported medically diagnosed hyperactivity/behavioral disorders, mental-health disorders, or autism spectrum disorders. The primary fully adjusted model was then refitted in the remaining children using the same covariates, child-specific weights, and HC0 robust standard errors.
A screen-time × household-income interaction was examined as an exploratory analysis and evaluated jointly rather than by interpreting individual interaction coefficients.
Additional exploratory effect-modification analyses examined interactions between screen time and age (modeled continuously), sex, and age group (4–5, 6–10, and 11–14 years). Age-stratified fully adjusted models were also estimated. Interaction terms were evaluated using robust Wald tests. All analyses used the complete-case sample from the primary fully adjusted model.
Additional exploratory sensitivity analyses incorporated autonomous-community and sampling-stratum fixed effects into the fully adjusted model, separately and jointly, using the same complete-case sample (N = 2596). Sampling stratum was considered an approximate indicator of municipality size, recognizing that the classification also distinguishes provincial capitals. The public-use household dataset contained a sampling-stratum variable and an autonomous-community identifier, but no explicit primary sampling unit identifier was identified in the available files. Consequently, the original multistage survey design could not be fully reconstructed for design-based variance estimation. To examine the sensitivity of statistical inference to alternative variance estimators, the primary weighted regression was additionally evaluated using HC3 heteroskedasticity-robust standard errors and, separately, standard errors clustered by autonomous community. Regional clustering was treated as an exploratory approximation rather than a reconstruction of the original sampling clusters. Both analyses retained the original covariate specification, child-specific survey weights, and complete-case sample (N = 2596).
Educational attainment of the household reference person and the child-questionnaire informant was examined in separate exploratory analyses using linked household-member records. Because educational information was unavailable for many participants, the primary model was refitted within each education-available subsample before and after adding educational attainment, allowing comparisons on identical analytical samples. Additional analyses linked the Adult microdata to examine the educational attainment and psychological well-being of the selected adult. Depressive symptom severity was examined as an alternative adult mental-health indicator. Analyses were performed both for children with linked adult data and for the subset in which the selected adult coincided with the child-questionnaire informant. Within each complete-data subsample, the primary fully adjusted model was refitted before adding adult education, the relevant mental-health indicator, autonomous-community fixed effects, and sampling-stratum fixed effects. These comparisons were exploratory because the selected adult was not necessarily a parent and the linked subsamples differed from the primary analytical population.
To assess potential selection bias due to missing data, children included in the primary fully adjusted model were compared with age-eligible children excluded from that model. Weighted descriptive comparisons included age, sex, recreational screen time, SDQ Total Difficulties Score, and sleep duration, using available observations for each characteristic. Missingness was assessed for the outcome, exposure, and model covariates. As an exploratory multiple-imputation sensitivity analysis, missing household-income and leisure-time physical-activity categories were imputed among children with observed SDQ and screen-time measurements. Forty imputed datasets were generated using multinomial logistic models with observed SDQ score, screen time, age, sex, sleep duration, physical chronic morbidity, household composition, country of birth, autonomous community, and the logarithm of the child-specific survey weight as predictors. To reflect uncertainty in the fitted imputation models, independent Bayesian-bootstrap (exponential) likelihood weights were used when refitting each multinomial model, followed by stochastic draws from the predicted category probabilities. The primary weighted regression was refitted in each completed dataset with HC0 robust standard errors, and the screen-time coefficients and variances were pooled using Rubin’s rules. Missing SDQ outcomes and screen-time exposures were not imputed; therefore, this exploratory analysis does not address selection arising from their missingness.
All analyses were two-sided. A p-value < 0.05 was used as the conventional threshold for statistical evidence in primary analyses, while effect estimates and 95% CIs were emphasized in interpretation. Given the cross-sectional design, all estimates were interpreted as associations and not as causal effects.
The additional regression and variance-estimation sensitivity analyses were conducted in Python using statsmodels (version 0.14.6), pandas (version 2.2.3), NumPy (version 2.3.5), and SciPy (version 1.17.0). The exploratory multiple-imputation analysis additionally used scikit-learn (version 1.8.0).
2.9. Ethical Considerations
The study was a secondary analysis of anonymized public-use ESdE 2023 microdata. The official survey methodology states that express consent was requested for collection of the individual health questionnaires and describes the confidentiality and statistical procedures governing the survey [13].
The analysis was based exclusively on publicly available, anonymized survey data and involved no direct participant contact, intervention, or collection of identifiable information.
3. Results
3.1. Study Population and Participant Characteristics
The ESdE 2023 Child microdata file included 3641 children aged 0–14 years. After restricting the study population to children aged 4–14 years, 2920 participants were eligible for the present analysis. A valid SDQ Total Difficulties Score was available for 2731 children (93.5% of the age-eligible sample), while average daily recreational screen time could be derived for 2859 children (97.9%). The fully adjusted primary model included 2596 children with complete information on the outcome, exposure, and all prespecified covariates.
The weighted mean age of the eligible population was 9.26 years (SD 3.14), and 48.0% were girls. Mean recreational screen exposure was 1.85 h/day (SD 1.28) and mean sleep duration was 9.00 h/day (SD 1.15). The weighted mean SDQ Total Difficulties Score was 7.34 (SD 5.39).
Regarding screen exposure, 30.8% of children accumulated <1 h/day, 21.1% accumulated 1–<2 h/day, 27.4% accumulated 2–<3 h/day, and 20.8% accumulated ≥3 h/day. Overall, approximately 51.9% of children reported less than 2 h/day of recreational screen time, a commonly used descriptive benchmark for school-aged children rather than a universal threshold specified by the 2020 WHO guidelines. Average daily recreational screen time could be calculated for 2859 children and ranged from 0 to 10.57 h/day. The original weekday and weekend duration responses were recorded in whole hours for reported exposure of at least 1 h/day, indicating heaping at integer values. Among children with calculable average daily screen time, 43 had values exceeding 5 h/day, five exceeded 8 h/day, and two exceeded 10 h/day. The maximum reported weekday and weekend durations were 10 and 12 h/day, respectively. Children in the highest screen-time category were older on average than those in the lowest category (weighted mean age, 10.80 vs. 8.04 years) and slept fewer hours per day (8.62 vs. 9.29 h/day). Their weighted mean SDQ Total Difficulties Score was also higher (7.85 vs. 7.26).
With respect to leisure-time physical activity, weighted proportions were 11.0% for no exercise/almost completely sedentary leisure time, 21.9% for occasional physical activity, 28.3% for physical activity several times per month, and 38.8% for sports or physical training several times per week. Physical chronic morbidity was present in 14.4% of the weighted study population, 10.7% lived in a single-adult household, and 12.2% were foreign-born.
The socioeconomic distribution also differed across screen-time groups. The proportion in the highest household-income category decreased from 39.1% among children with <1 h/day of screen time to 24.0% among those with ≥3 h/day, whereas the proportion in the lowest income category increased from 10.3% to 16.0%, respectively (Table 1).
Table 1.
Characteristics of children aged 4–14 years overall and according to average daily recreational screen time.
3.2. Screen Time and SDQ Total Difficulties
To ensure comparability across sequential models, all analyses were conducted using the same complete-case sample of 2596 children (Table 2).
Table 2.
Association between recreational screen time and SDQ Total Difficulties Score: crude and sequentially adjusted weighted linear regression models.
In the crude, unadjusted model, each additional hour/day of recreational screen time was associated with a 0.257-point higher SDQ Total Difficulties Score (95% CI: 0.031–0.482; p = 0.026). After adjustment for age and sex (Model 1), the association increased to β = 0.452 (95% CI: 0.211–0.693; p < 0.001).
Additional adjustment for household income (Model 2) yielded β = 0.408 (95% CI: 0.171–0.645; p < 0.001). After further adjustment for leisure-time physical activity and sleep duration (Model 3), the coefficient was β = 0.373 (95% CI: 0.143–0.604; p = 0.002).
In the fully adjusted primary model (Model 4), which additionally included physical chronic morbidity, single-adult household status, and country of birth, each additional hour/day of recreational screen time was associated with a 0.356-point higher SDQ Total Difficulties Score (95% CI: 0.127–0.586; p = 0.002).
Because all models were estimated using an identical analytical sample, differences in the screen-time coefficients reflect changes in covariate adjustment rather than changes in sample composition. The positive association remained statistically significant across all models.
3.3. Other Factors Associated with Total Difficulties
In the fully adjusted model, lower SDQ Total Difficulties Scores were associated with female sex, older age, and longer sleep duration, whereas the presence of a medically diagnosed physical chronic condition was associated with higher scores (Table 3).
Table 3.
Fully adjusted weighted linear regression model for SDQ Total Difficulties Score among children aged 4–14 years.
Regarding physical activity, participation in sports or physical training several times per week was associated with lower Total Difficulties Scores than the sedentary reference category, whereas occasional activity was associated with higher scores. Activity several times per month showed no clear association. We verified the ordering and labels of the original physical-activity categories against the official ESdE 2023 child questionnaire and confirmed that the regression used the sedentary category as the reference, with occasional activity as the second category. Thus, the unexpected positive association for occasional activity was not attributable to reversed category coding or an incorrect reference group. This nonmonotonic pattern should be interpreted cautiously and does not establish a linear dose–response relationship between physical activity frequency and emotional or behavioral difficulties.
Household income showed no consistent monotonic gradient (overall Wald test, p = 0.063). Neither single-adult household status nor foreign-born status showed clear independent associations after full adjustment. Complete regression estimates are provided in Table 3.
3.4. Categorical Screen-Time Analysis
When screen time was analyzed categorically, the adjusted results suggested that the association was concentrated at higher exposure levels. Compared with children accumulating <1 h/day, there was essentially no difference in adjusted SDQ Total Difficulties scores among those with 1–<2 h/day (β = 0.058; 95% CI, −0.678–0.794; p = 0.877) or 2–<3 h/day (β = 0.049; 95% CI, −0.620–0.717; p = 0.886).
In contrast, children with ≥3 h/day had a 0.787-point higher adjusted Total Difficulties Score than those with <1 h/day (95% CI, 0.036–1.539; p = 0.040).
These findings were consistent with departure from a strictly linear exposure–outcome relationship; however, the ≥3 h/day category should not be interpreted as establishing a biological or clinical threshold.
In an exploratory secondary analysis using an SDQ Total Difficulties Score ≥ 17 to define abnormal scores, 168 of the 2596 children in the primary analytical sample met this criterion (weighted prevalence, 6.26%). The weighted prevalence was 6.15% among children with <1 h/day of recreational screen time and 7.43% among those with ≥3 h/day. In the fully adjusted weighted Poisson model with robust standard errors, the prevalence ratio comparing ≥3 with <1 h/day was 1.00 (95% CI, 0.65–1.53; p = 0.992). Thus, the positive association observed for the continuous SDQ Total Difficulties Score was not clearly reproduced when using this dichotomous outcome.
3.5. Nonlinear Association Between Screen Time and Total Difficulties
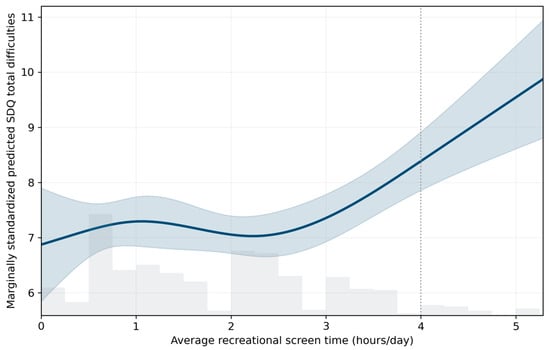
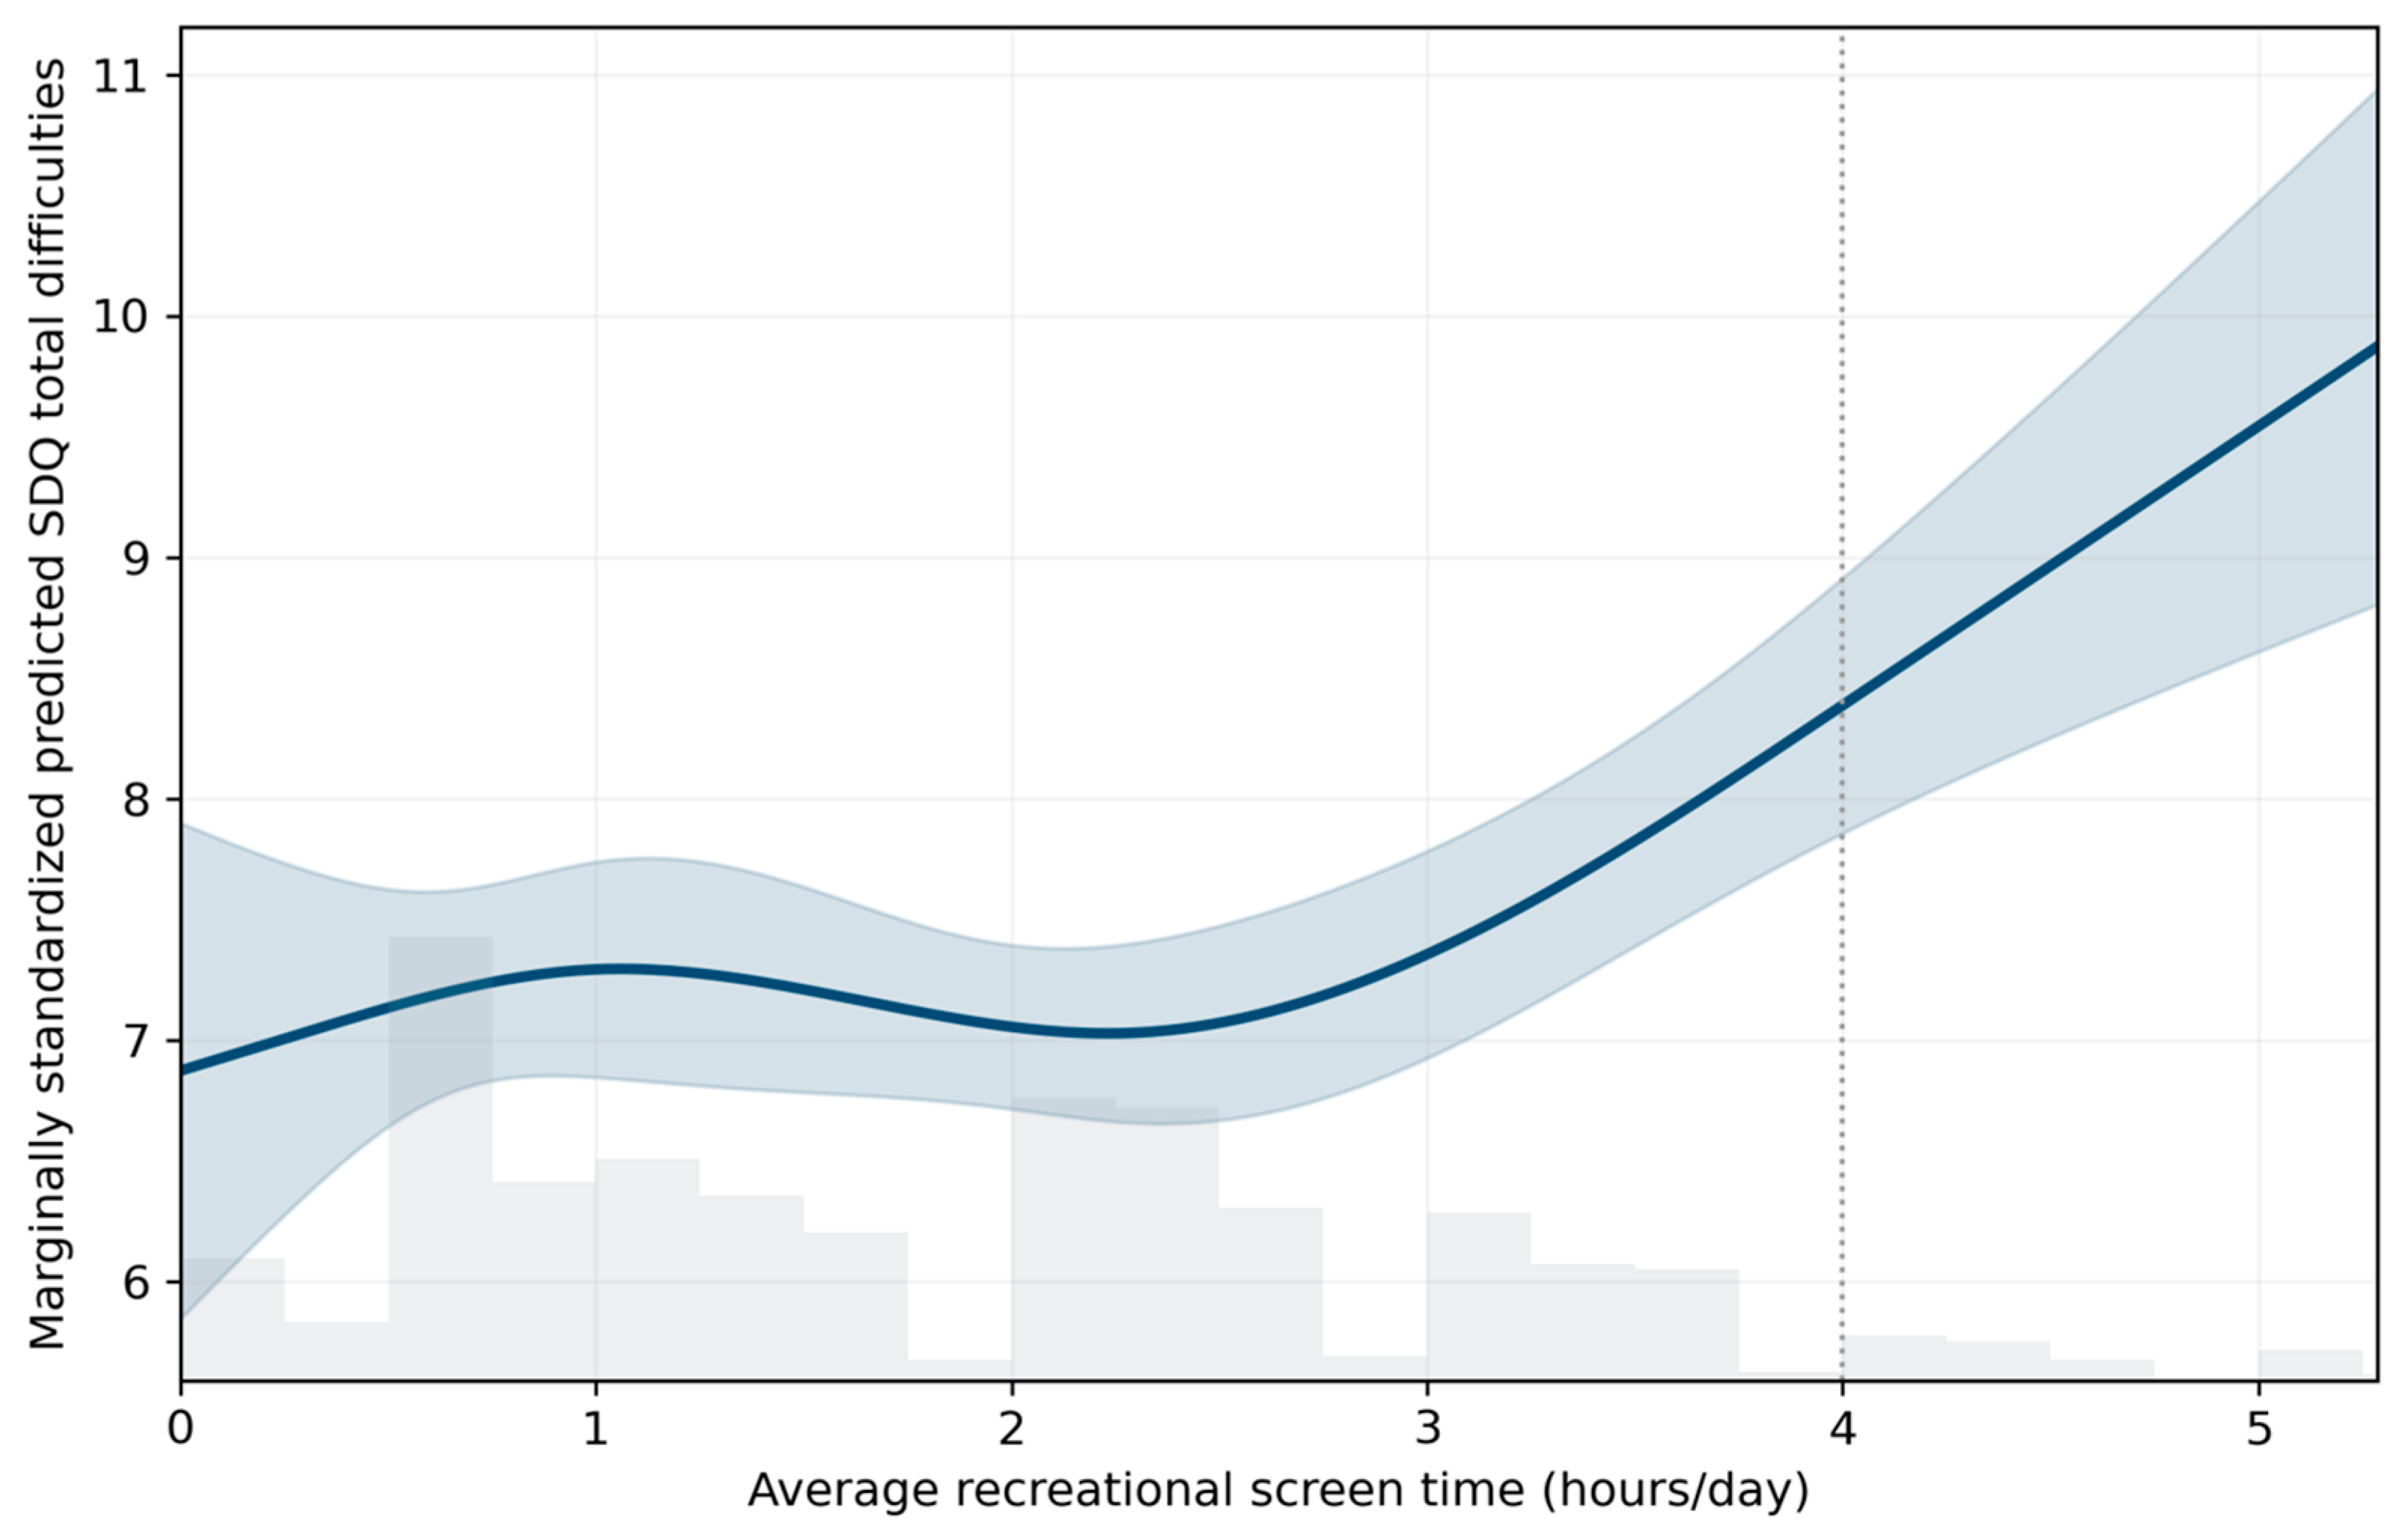
Restricted cubic spline analysis provided evidence of a nonlinear association between recreational screen time and SDQ Total Difficulties Score (joint Wald test of nonlinear spline components, p = 0.004). Four knots were placed at the weighted 5th, 35th, 65th, and 95th percentiles of the screen-time distribution, corresponding to approximately 0.29, 1.00, 2.29, and 4.00 h/day, respectively.
Marginally standardized adjusted predictions indicated relatively little variation in SDQ Total Difficulties Scores across low-to-moderate screen-time exposure levels, followed by a more pronounced increase at higher exposure durations. Predicted scores were approximately 6.87 at 0 h/day, 7.06 at 2 h/day, 8.39 at 4 h/day, and 9.87 at 5.29 h/day.
To avoid overemphasizing the sparsely populated upper tail, Figure 1 displays predictions over the weighted 1st–99th percentile range of recreational screen time (approximately 0–5.29 h/day), together with the observed exposure distribution. Confidence intervals were wider at higher exposure levels, reflecting greater uncertainty where observations were less frequent.
Figure 1.
Adjusted nonlinear association between average daily recreational screen time and SDQ Total Difficulties Score among children aged 4–14 years in Spain.
These findings support a nonlinear association between recreational screen time and emotional and behavioral difficulties, without establishing a specific biological or clinical threshold.
The solid line represents marginally standardized adjusted predicted Strengths and Difficulties Questionnaire (SDQ) Total Difficulties Scores, and the shaded area represents the 95% confidence interval. Predictions were obtained from a weighted restricted cubic spline regression model adjusted for age, sex, household income, leisure-time physical activity, sleep duration, physical chronic morbidity, single-adult household status, and country of birth (N = 2596). Vertical dotted lines indicate the four spline knots, located at the weighted 5th, 35th, 65th, and 95th percentiles of the screen-time distribution (0.29, 1.00, 2.29, and 4.00 h/day, respectively). The displayed exposure range was restricted to the weighted 1st–99th percentiles (approximately 0–5.29 h/day). The distribution of observed screen time is shown below the curve. The joint test for nonlinearity was statistically significant (p = 0.004).
3.6. Associations with Individual SDQ Domains
The association with screen exposure was not homogeneous across the individual dimensions of the SDQ.
After the same multivariable adjustment used for the primary model, each additional hour/day of screen exposure was associated with higher emotional symptoms scores (β = 0.114; p = 0.006), higher conduct problems scores (β = 0.069; p = 0.026), and higher hyperactivity/inattention scores (β = 0.175; p < 0.001).
The largest domain-specific association was observed for hyperactivity/inattention. By contrast, there was no evidence of an association with peer problems (β = 0.005; p = 0.850) or prosocial behavior (β = −0.030; p = 0.375).
After Benjamini–Hochberg correction across the five domain analyses, the associations remained statistically supported for emotional symptoms (FDR-adjusted p = 0.014), conduct problems (FDR-adjusted p = 0.044), and hyperactivity/inattention (FDR-adjusted p < 0.001), but not for peer problems or prosocial behavior. The individual SDQ domains showed asymmetric distributions, with substantial proportions of zero scores for emotional symptoms (41.9%), conduct problems (38.2%), and peer problems (51.3%). As an additional exploratory analysis, we examined the SDQ internalizing composite (emotional symptoms plus peer problems) and externalizing composite (conduct problems plus hyperactivity/inattention). In fully adjusted weighted linear models, screen time was positively associated with externalizing difficulties (β = 0.245; 95% CI, 0.118–0.373; p < 0.001; N = 2692), whereas the association with internalizing difficulties was less precise (β = 0.109; 95% CI, −0.014–0.233; p = 0.082; N = 2624). Domain-specific sample sizes exceeded the primary model sample size (N = 2596) because each secondary model included children with complete information for the corresponding domain and covariates, even when another SDQ domain required to calculate the Total Difficulties Score was unavailable. The adjusted associations between recreational screen time and each of the five individual SDQ domains are presented in Table 4.
Table 4.
Adjusted associations between screen time and individual SDQ domains.
3.7. Sensitivity Analyses
The main association was robust across the prespecified sensitivity analyses. Additional exploratory analyses assessed the influence of unusually high reported screen-time values. Excluding children with average recreational screen time exceeding 10 h/day yielded an adjusted coefficient of β = 0.328 (95% CI: 0.099–0.557; p = 0.005; N = 2594). Excluding values exceeding 8 h/day yielded β = 0.263 (95% CI: 0.050–0.477; p = 0.016; N = 2592), while excluding values exceeding 5 h/day yielded β = 0.227 (95% CI: 0.002–0.452; p = 0.048; N = 2560). The association remained positive in all three analyses, although its magnitude decreased with progressively more restrictive exposure limits, indicating some sensitivity to high reported durations.
When the population was restricted to children aged 6–14 years (N = 2216), each additional hour/day of screen time remained associated with a higher Total Difficulties Score (β = 0.335; 95% CI, 0.086–0.583; p = 0.008). Thus, the main result did not depend on the inclusion of children aged 4–5 years.
Replacing household income with occupational social class produced a similar screen-time estimate (N = 2620; β = 0.371; 95% CI, 0.144–0.599; p = 0.001). None of the occupational-class categories differed clearly from the reference category after adjustment (all p > 0.5), supporting the decision not to characterize the findings as a generalized socioeconomic gradient.
Additional adjustment for neurodevelopmental/behavioral/mental-health diagnoses and health-related functional limitation also had little influence on the screen-time coefficient (N = 2596; β = 0.350; 95% CI, 0.127–0.573; p = 0.002). As expected given their conceptual proximity to the outcome, the presence of a neurodevelopmental, behavioral, or mental-health condition was strongly associated with higher Total Difficulties (β = 7.083; p < 0.001), as was health-related functional limitation (β = 1.727; p = 0.001). These variables were therefore retained as sensitivity adjustments rather than incorporated into the primary model. In an additional sensitivity analysis, 124 children with reported medically diagnosed neurodevelopmental, behavioral, or mental-health conditions were excluded. After refitting the primary fully adjusted model in the remaining 2472 children, the association between recreational screen time and SDQ Total Difficulties remained positive (β = 0.325; 95% CI, 0.094–0.555; p = 0.006). This finding suggests that the association was not driven exclusively by children with these recorded diagnoses, although reverse causation cannot be ruled out.
Results were also robust to the assumption used to represent the questionnaire response “less than one hour”. Assigning this category 0.25 h/day yielded β = 0.330 (95% CI, 0.109–0.551; p = 0.003); the prespecified midpoint of 0.50 h/day yielded β = 0.356 (95% CI, 0.127–0.586; p = 0.002); and assigning 0.75 h/day yielded β = 0.382 (95% CI, 0.145–0.620; p = 0.002).
Finally, there was no evidence that the association between screen time and Total Difficulties differed according to household-income category (joint screen time × household income interaction, p = 0.552).
Additional exploratory analyses examined whether the association between recreational screen time and SDQ Total Difficulties Score varied by age or sex. In the fully adjusted model, the interaction between screen time and age modeled continuously was borderline statistically significant (interaction coefficient = 0.062 per year; p = 0.049), whereas the screen time × sex interaction was not statistically significant (p = 0.443).
In age-stratified analyses, the adjusted association was positive among children aged 4–5 years (β = 0.643; 95% CI: 0.112–1.174; n = 380) and 11–14 years (β = 0.646; 95% CI: 0.333–0.959; n = 1138), but not among those aged 6–10 years (β = −0.015; 95% CI: −0.374–0.344; n = 1078). Nevertheless, the joint screen time × age-group interaction test was not statistically significant (p = 0.125). These exploratory findings suggest possible age-related variation but do not establish robust differences between age groups. Detailed age-stratified results are presented in Supplementary Table S2.
Additional geographic sensitivity analyses yielded screen-time coefficients of β = 0.414 (95% CI: 0.181–0.648; p < 0.001) after adjustment for autonomous-community fixed effects, β = 0.386 (95% CI: 0.159–0.613; p < 0.001) after adjustment for sampling-stratum fixed effects, and β = 0.435 (95% CI: 0.203–0.667; p < 0.001) after joint adjustment for both; all three analyses included 2596 children. Sampling stratum was used as an approximate indicator of municipality size rather than a direct measure of municipal population.
Additional variance-estimation sensitivity analyses were performed using the original fully adjusted model and complete-case sample (N = 2596). With HC3 heteroskedasticity-robust standard errors, the screen-time association remained positive (β = 0.356; 95% CI: 0.122–0.591; p = 0.003), compared with the original HC0 estimate (β = 0.356; 95% CI: 0.127–0.586; p = 0.002). When standard errors were clustered by autonomous community, the association also remained positive (β = 0.356; 95% CI: 0.048–0.665; p = 0.024), although the confidence interval was wider. Because autonomous communities do not identify the original primary sampling units, this regional clustering analysis was considered exploratory and does not replace design-based variance estimation.
An additional sensitivity analysis assessed the influence of informant type. After adjusting for whether the child questionnaire was completed by the mother, father, or another informant, the screen-time coefficient was β = 0.363 (95% CI: 0.134–0.593; p = 0.002; N = 2596), compared with β = 0.356 (95% CI: 0.127–0.586; p = 0.002) in the primary model. Thus, adjustment for informant type had little influence on the estimated association.
Exploratory educational analyses were limited by missing information. Among 1328 children with available educational data for the household reference person, the screen-time coefficient was β = 0.133 (95% CI: −0.158–0.424) before and β = 0.139 (95% CI: −0.157–0.434) after adding education. Among 900 children with available educational data for the child-questionnaire informant, the corresponding coefficients were β = 0.422 (95% CI: 0.002–0.842) and β = 0.408 (95% CI: −0.004–0.820) after adding education. These analyses involved selected subsamples and do not establish whether parental education confounds the association in the full analytical population.
The Adult microdata could be linked to 2567 children in the primary analytical sample, and the selected adult coincided with the child-questionnaire informant for 1853 children. Among children with complete adult education and psychological well-being data (N = 2510), the screen-time coefficient was β = 0.350 (95% CI: 0.116–0.585) in the primary model refitted within this subsample and β = 0.381 (95% CI: 0.145–0.616) after additional adjustment for adult education, psychological well-being, autonomous community, and sampling stratum. In the subset in which the selected adult was also the child-questionnaire informant (N = 1820), the corresponding coefficients were β = 0.313 (95% CI: 0.061–0.565) and β = 0.289 (95% CI: 0.041–0.537). When depressive symptom severity replaced psychological well-being, the additionally adjusted coefficients were β = 0.413 (95% CI: 0.175–0.652; N = 2463) in the selected-adult sample and β = 0.305 (95% CI: 0.057–0.554; N = 1786) in the informant-matched sample. The association remained positive in these exploratory analyses, although the selected adult was not necessarily a parent and the restricted analytical samples limit generalizability.
Missing-data sensitivity analyses were performed to assess possible selection bias (Supplementary Table S3). Of 2920 age-eligible children, 2596 (88.9%) were included in the primary complete-case model and 324 (11.1%) were excluded. Included and excluded children had similar observed weighted mean ages (9.26 versus 9.29 years), proportions of girls (47.7% versus 50.9%), recreational screen time (1.84 versus 1.90 h/day), SDQ Total Difficulties Scores (7.34 versus 7.36), and sleep duration (9.02 versus 8.88 h/day). Among the 324 excluded children, SDQ scores were observed for 135 and screen time for 263; thus, comparisons for these variables are based on available cases only. Overall, 2693 children had both observed SDQ and screen-time measurements, of whom 97 were excluded from the primary complete-case model; 94 of these had missing household income and three had missing physical activity. In an exploratory multiple-imputation sensitivity analysis of missing covariates using 40 completed datasets (N = 2693), the pooled screen-time coefficient was β = 0.341 (95% CI: 0.124–0.557; p = 0.002), compared with β = 0.356 (95% CI: 0.127–0.586; p = 0.002) in the complete-case model. The association was similar in magnitude, although the imputation analysis did not address missing outcome or exposure data. A summary of the main sensitivity analyses, including alternative population restrictions, covariate adjustments, and alternative assumptions regarding screen-time exposure, is presented in Table 5.
Table 5.
Sensitivity analyses for the association between screen time and SDQ Total Difficulties.
4. Discussion
4.1. Principal Findings
In this population-based study of children aged 4–14 years in Spain, greater recreational screen time was associated with higher SDQ Total Difficulties Scores after adjustment for demographic, socioeconomic, behavioral, family, and physical-health characteristics. Each additional hour/day of screen time was associated with a 0.356-point higher score, corresponding to 0.066 standard deviations (95% CI, 0.023–0.108). The adjusted difference between children reporting ≥3 and <1 h/day was 0.787 points, equivalent to 0.146 standard deviations (95% CI, 0.007–0.285). These associations were small, and their clinical significance for individual children remains uncertain. The principal association remained positive across sensitivity analyses, although it attenuated when screen durations exceeding 5 h/day were excluded (β = 0.227; 95% CI, 0.002–0.452; p = 0.048).
The relationship was nonlinear. Restricted cubic spline analysis suggested relatively little variation in predicted difficulties across lower-to-moderate screen durations, followed by a more pronounced increase at higher exposure levels. The categorical analysis showed a similar pattern, with the clearest adjusted difference observed among children reporting ≥3 h/day. This pattern does not establish a biological or clinical threshold at 3 h/day or any other duration.
At the domain level, associations were observed for hyperactivity/inattention, emotional symptoms, and conduct problems, including after false discovery rate correction. No clear associations were identified for peer relationship problems or prosocial behavior.
4.2. Comparison with Previous Evidence
Our findings are broadly consistent with previous research. In a meta-analysis of 87 studies involving 159,425 children aged 12 years or younger, Eirich et al. identified small associations between screen time and internalizing and externalizing behavior problems [7]. A more recent longitudinal meta-analysis by Vasconcellos et al. reported small prospective associations in both directions, suggesting that screen use and socioemotional difficulties may influence one another over time [8].
Our results also extend earlier population-based evidence from Spain. Using the 2017 Spanish National Health Survey, Cartanyà-Hueso et al. reported a higher prevalence of emotional and behavioral difficulties among children aged 4–14 years with ≥3 h/day of leisure screen exposure than among those with <1 h/day [12]. Our continuous-score results showed a similar direction of association. However, an exploratory analysis using abnormal SDQ Total Difficulties (≥17) as a binary outcome did not identify a clear adjusted prevalence difference between these groups (prevalence ratio, 1.00; 95% CI, 0.65–1.53; p = 0.992). This secondary finding is not directly comparable with the earlier study because of differences in outcome classification, survey period, exposure assessment, and analytical methods. Dichotomization also reduces information, and the confidence interval remains compatible with differences in either direction.
The present study adds more recent ESdE 2023 data, continuous exposure modeling, restricted cubic spline analysis, and examination of individual SDQ domains. The nonlinear findings suggest that predefined exposure categories may conceal variation within the screen-time distribution, although estimates at the highest durations were less precise.
4.3. Differences Across Emotional and Behavioral Domains
Hyperactivity/inattention showed the strongest domain-specific association with screen time, followed by emotional symptoms and conduct problems. This pattern is compatible with previous evidence linking screen exposure to both externalizing and internalizing difficulties [7]. It differs partly from the earlier Spanish study, which also identified associations with peer problems and prosocial behavior [12]. Differences in exposure assessment, outcome definitions, covariate adjustment, and statistical methods may contribute to these discrepancies.
The prominence of hyperactivity/inattention is of particular interest given longitudinal evidence of reciprocal relationships between screen use and socioemotional problems [8]. Nevertheless, total screen duration provides limited information about the activities involved. A systematic review and meta-analysis of screen-use contexts in young children found that content, background television, caregiver screen use, and co-use were associated differently with developmental outcomes [18]. Research on social media use has likewise identified variation according to patterns of use and potential roles for sleep, social comparison, exercise, and social support [19]. These findings underscore the importance of distinguishing the duration of exposure from its content and context.
4.4. Screen Time Within the Broader Behavioral Context
Screen exposure is embedded in daily patterns of sleep, physical activity, and other behaviors. Previous Spanish research has linked combinations of movement, screen-time, and sleep behaviors with socioemotional outcomes [10], while an ESdE 2023 analysis reported associations between leisure-time physical activity frequency and emotional or behavioral difficulties [11].
In our study, the screen-time coefficient was modestly attenuated after adjustment for physical activity and sleep duration. Longer sleep was associated with lower Total Difficulties Scores, and participation in sports or physical training several times per week was associated with fewer difficulties than the sedentary reference category. However, the physical-activity pattern was not monotonic, consistent with the results reported in Table 3.
Sleep and physical activity may represent confounding factors, potential mediators, or both. The screen-time coefficient was 0.408 points per additional hour/day in Model 2, before adjustment for these behaviors, compared with 0.356 points in the fully adjusted Model 4. This difference is compatible with several explanations, including shared behavioral pathways, but the available data cannot distinguish among them.
4.5. Socioeconomic and Family Context
Children with greater screen exposure were less frequently represented in the highest household-income category and more frequently represented in the lowest category. Nevertheless, household income showed no consistent monotonic association with Total Difficulties after multivariable adjustment (overall Wald test, p = 0.063). Substituting occupational social class for income did not reveal clear adjusted differences, and there was no evidence of interaction between screen time and household income.
Neither single-adult household status nor foreign-born status showed clear independent associations in the fully adjusted model. These results indicate that the measured socioeconomic and family variables did not explain the principal screen-time association, although they do not capture the full complexity of children’s family and social environments.
4.6. Interpretation and Potential Mechanisms
Several mechanisms could contribute to the observed association. Recreational screen use may displace sleep, physical activity, or face-to-face interaction. Different digital activities—including passive viewing, gaming, communication, social media, and educational use—may also have distinct implications for emotional and behavioral functioning. Conversely, children experiencing attentional, emotional, or behavioral difficulties may engage more frequently in screen activities or be offered screens more often.
Conventional measures of total screen duration cannot distinguish these possibilities. Beynon et al. have highlighted limitations of proxy- and self-reported screen-time measures and described complementary approaches such as diaries, direct observation, device-based logging, and contextual assessment [20].
Experimental research provides additional context. In a secondary analysis of a randomized clinical trial, Schmidt-Persson et al. reported improvements in mental-health symptoms following a short-term family-based screen-media reduction intervention [21]. Although this supports further investigation of modifiable screen-use behaviors, differences in design, population, and intervention prevent direct translation of those findings into an expected effect size for the present study.
Overall, the evidence supports considering both the amount and the nature of screen exposure. Our findings indicate an association with duration, particularly at higher levels, while the activities and circumstances underlying that association remain to be clarified [8].
4.7. Strengths and Limitations
This study used recent data from a large national population-based survey and incorporated the child-specific weighting factor. Screen exposure was estimated from separate weekday and weekend reports, modeled continuously in the primary analysis, and examined for nonlinearity using restricted cubic splines. The analyses considered multiple demographic, socioeconomic, behavioral, family, and health-related factors, examined individual SDQ domains with false discovery rate correction, and included several sensitivity analyses.
The principal limitation is the cross-sectional design, which prevents determination of temporal sequence or causal direction. Greater screen exposure could precede emotional and behavioral difficulties, result partly from those difficulties, or share common determinants with them. Longitudinal evidence of bidirectional associations reinforces this concern [8]. The positive association persisted after excluding children with recorded neurodevelopmental, behavioral, or mental-health diagnoses, but this does not exclude reverse causation involving undiagnosed or subclinical difficulties.
Screen exposure was informant-reported rather than objectively measured and may be affected by recall or reporting error [20]. The ESdE measure also combines different screen activities and does not adequately characterize content, purpose, timing, social context, co-use, or simultaneous device use. These distinctions may be relevant to developmental and mental-health outcomes [8,18,19]. In addition, durations reported as less than 1 h/day required an assigned midpoint of 0.5 h/day, although alternative assignments of 0.25 and 0.75 h/day produced similar estimates.
The SDQ was also informant-reported and is a screening measure rather than a clinical psychiatric diagnosis. In an exploratory analysis additionally adjusting for whether the informant was the mother, father, or another person, the screen-time association was similar to the primary estimate (β = 0.363 versus 0.356 points per hour/day). Nevertheless, shared-informant reporting bias cannot be excluded. Accordingly, the findings concern differences in reported emotional and behavioral difficulties, not diagnosed mental disorders.
Residual confounding remains possible. Exploratory analyses using linked household and Adult microdata permitted additional adjustment for educational attainment and indicators of adult psychological well-being or depressive symptoms, and the screen-time association remained positive. However, the linked adult was not necessarily a parent, missing information restricted the analytical samples, and these measures could not represent the education or mental health of both parents. Adjustment for autonomous-community and sampling-stratum fixed effects likewise could not eliminate unmeasured family or local contextual influences. Parenting practices, family functioning, screen content, and social relationships were not fully captured.
Missing data may also have introduced selection bias. The primary complete-case analysis included 2596 of 2920 age-eligible children (88.9%). Included and excluded children were broadly similar on observed characteristics, but missing outcome and exposure data limited these comparisons, and household income accounted for most exclusions among children with valid SDQ and screen-time measurements. An exploratory multiple-imputation analysis of missing covariate information yielded a similar association, although it depended on assumptions about missingness and did not recover children lacking outcome or exposure measurements.
Finally, while the analyses used the ESdE child weighting factor and heteroskedasticity-robust standard errors, the public-use data did not contain all variables required to reproduce the full complex sampling design. The precision estimates therefore do not represent full survey-design-based variance estimation.
4.8. Implications and Future Research
The findings suggest that recreational screen exposure should be considered within the broader behavioral and social context of childhood emotional and behavioral health. The nonlinear pattern highlights the value of examining the full exposure distribution rather than relying exclusively on predefined categories. It should not, however, be translated into a specific clinical screen-time cutoff.
Future longitudinal research should use repeated assessments to investigate temporal and potentially reciprocal relationships. More detailed information on device type, content, purpose, timing, co-use, and social context, ideally complemented by objective measures, would help clarify which aspects of digital engagement are most relevant [8,18,20]. Examining what children do on screens, with whom, and which activities screen use may replace could provide more actionable evidence than total duration alone.
4.9. Conclusions
In this population-based study of children aged 4–14 years in Spain, greater recreational screen time was associated with higher emotional and behavioral difficulties after adjustment for demographic, socioeconomic, behavioral, family, and physical-health characteristics. The association was small and nonlinear, with more pronounced differences at higher screen durations. Associations were observed for hyperactivity/inattention, emotional symptoms, and conduct problems, but not clearly for peer relationship problems or prosocial behavior.
These findings identify a population-level association rather than a causal effect or a specific screen-time threshold. Longitudinal studies incorporating more detailed measures of screen-use content and context are needed to clarify the direction and implications of this relationship.
Supplementary Materials
The following supporting information can be downloaded at: https://www.mdpi.com/article/10.3390/children13111599/s1, Supplementary Table S1. Original ESdE 2023 variable codes and their use in the study. Supplementary Table S2. Association between recreational screen time and SDQ Total Difficulties Score, stratified by age group. Supplementary Table S3. Comparison of children included in and excluded from the primary fully adjusted model.
Author Contributions
Conceptualization, C.M.S., P.J.T.L. and Á.A.L.-G.; methodology, Á.A.L.-G., J.I.R.-M. and M.T.V.-H.; formal analysis, Á.A.L.-G. and J.D.P.; investigation, C.M.S., J.D.P. and J.I.R.-M.; data curation, M.T.V.-H.; writing—original draft preparation, C.M.S., P.J.T.L. and Á.A.L.-G.; writing—review and editing, all authors; visualization, M.T.V.-H., J.D.P. and Á.A.L.-G.; supervision, P.J.T.L. and J.I.R.-M.; project administration, P.J.T.L. All authors have read and agreed to the published version of the manuscript.
Funding
This research received no external funding.
Institutional Review Board Statement
This study was conducted using publicly available, anonymized secondary data from the Spanish National Health Survey (ENSE), carried out by the Spanish Ministry of Health in collaboration with the National Statistics Institute (INE). The data were provided in anonymized form, in accordance with the confidentiality provisions established under Spanish Law 12/1989 of 9 May on Public Statistical Functions. As the study involved only secondary analysis of anonymized data, without direct participant involvement or access to identifiable personal information, separate ethical approval was considered not to be required.
Informed Consent Statement
Patient consent was waived due to present secondary analysis of anonymized public-use data.
Data Availability Statement
The data presented in this study are available on request from the corresponding author. The data are not publicly available due to privacy and ethical reasons.
Conflicts of Interest
The authors declare no conflicts of interest.
References
- Polanczyk, G.V.; Salum, G.A.; Sugaya, L.S.; Caye, A.; Rohde, L.A. Annual research review: A meta-analysis of the worldwide prevalence of mental disorders in children and adolescents. J. Child Psychol. Psychiatry 2015, 56, 345–365. [Google Scholar] [CrossRef] [Scilit] [PubMed]
- Solmi, M.; Radua, J.; Olivola, M.; Croce, E.; Soardo, L.; de Pablo, G.S.; Shin, J.I.; Kirkbride, J.B.; Jones, P.; Kim, J.H.; et al. Age at onset of mental disorders worldwide: Large-scale meta-analysis of 192 epidemiological studies. Mol. Psychiatry 2022, 27, 281–295. [Google Scholar] [CrossRef] [Scilit] [PubMed] [PubMed Central]
- Goodman, R. The Strengths and Difficulties Questionnaire: A research note. J. Child Psychol. Psychiatry 1997, 38, 581–586. [Google Scholar] [CrossRef] [Scilit] [PubMed]
- World Health Organization. Guidelines on Physical Activity, Sedentary Behaviour and Sleep for Children Under 5 Years of Age; World Health Organization: Geneva, Switzerland, 2019. [Google Scholar]
- World Health Organization. WHO Guidelines on Physical Activity and Sedentary Behaviour; World Health Organization: Geneva, Switzerland, 2020. [Google Scholar]
- Chaput, J.-P.; Willumsen, J.; Bull, F.; Chou, R.; Ekelund, U.; Firth, J.; Jago, R.; Ortega, F.B.; Katzmarzyk, P.T. 2020 WHO guidelines on physical activity and sedentary behaviour for children and adolescents aged 5–17 years: Summary of the evidence. Int. J. Behav. Nutr. Phys. Act. 2020, 17, 141. [Google Scholar] [CrossRef] [Scilit] [PubMed]
- Eirich, R.; McArthur, B.A.; Anhorn, C.; McGuinness, C.; Christakis, D.A.; Madigan, S. Association of Screen Time With Internalizing and Externalizing Behavior Problems in Children 12 Years or Younger: A Systematic Review and Meta-analysis. JAMA Psychiatry 2022, 79, 393–405. [Google Scholar] [CrossRef] [Scilit] [PubMed] [PubMed Central]
- Vasconcellos, R.P.; Sanders, T.; Lonsdale, C.; Parker, P.; Conigrave, J.; Tang, S.; Cruz, B.d.P.; Biddle, S.J.H.; Taylor, R.; Innes-Hughes, C.; et al. Electronic screen use and children’s socioemotional problems: A systematic review and meta-analysis of longitudinal studies. Psychol. Bull. 2025, 151, 513–543. [Google Scholar] [CrossRef] [Scilit] [PubMed]
- Jia, W.; Deng, X.; Zeng, H. The association between screen exposure and social-emotional development in children and adolescents: A meta-analysis. Acta Psychol. 2025, 261, 105818. [Google Scholar] [CrossRef] [Scilit] [PubMed]
- López-Gil, J.F.; Roman-Viñas, B.; Aznar, S.; Tremblay, M.S. Meeting 24-h movement guidelines: Prevalence, correlates, and associations with socioemotional behavior in Spanish minors. Scand. J. Med. Sci. Sports 2022, 32, 881–891. [Google Scholar] [CrossRef] [Scilit] [PubMed] [PubMed Central]
- Salas-Gómez, D.; Denche-Zamorano, Á.; Chimento-Díaz, S.; Barrios-Fernandez, S. Leisure-Time Physical Activity Frequency and Emotional/Behavioral Difficulties: A Graded Pattern in Children and Adolescents from a National Health Survey. Child Indic. Res. 2026, 19, 2565–2579. [Google Scholar] [CrossRef] [Scilit]
- Cartanyà-Hueso, À.; Lidón-Moyano, C.; González-Marrón, A.; Martín-Sánchez, J.C.; Amigo, F.; Martínez-Sánchez, J.M. Association between Leisure Screen Time and Emotional and Behavioral Problems in Spanish Children. J. Pediatr. 2022, 241, 188–195.e3. [Google Scholar] [CrossRef] [Scilit] [PubMed]
- Instituto Nacional de Estadística. Encuesta de Salud de España 2023 (ESdE 2023): Metodología; Instituto Nacional de Estadística: Madrid, Spain, 2025. [Google Scholar]
- Ministerio de Sanidad; Instituto Nacional de Estadística. Encuesta de Salud de España 2023: Cuestionario de Menores; Ministerio de Sanidad: Madrid, Spain, 2023. [Google Scholar]
- Goodman, A.; Goodman, R. Strengths and difficulties questionnaire as a dimensional measure of child mental health. J. Am. Acad. Child Adolesc. Psychiatry 2009, 48, 400–403, Erratum in J. Am. Acad. Child Adolesc. Psychiatry 2009, 48, 581. [Google Scholar] [CrossRef] [Scilit] [PubMed]
- Discacciati, A.; Palazzolo, M.G.; Park, J.-G.; Melloni, G.E.M.; A Murphy, S.; Bellavia, A. Estimating and presenting non-linear associations with restricted cubic splines. Int. J. Epidemiol. 2025, 54, dyaf088. [Google Scholar] [CrossRef] [Scilit] [PubMed]
- Benjamini, Y.; Hochberg, Y. Controlling the false discovery rate: A practical and powerful approach to multiple testing. J. R. Stat. Soc. Ser. B Methodol. 1995, 57, 289–300. [Google Scholar] [CrossRef] [Scilit]
- Mallawaarachchi, S.; Burley, J.; Mavilidi, M.; Howard, S.J.; Straker, L.; Kervin, L.; Staton, S.; Hayes, N.; Machell, A.; Torjinski, M.; et al. Early Childhood Screen Use Contexts and Cognitive and Psychosocial Outcomes: A Systematic Review and Meta-analysis. JAMA Pediatr. 2024, 178, 1017–1026. [Google Scholar] [CrossRef] [Scilit] [PubMed] [PubMed Central]
- Saleem, N.; Young, P.; Yousuf, S. Exploring the Relationship Between Social Media Use and Symptoms of Depression and Anxiety Among Children and Adolescents: A Systematic Narrative Review. Cyberpsychol. Behav. Soc. Netw. 2024, 27, 771–797. [Google Scholar] [CrossRef] [Scilit] [PubMed]
- Beynon, A.; Hendry, D.; Rasmussen, C.L.; Rohl, A.L.; Eynon, R.; Thomas, G.; Stearne, S.; Campbell, A.; Harris, C.; Zabatiero, J.; et al. Measurement Method Options to Investigate Digital Screen Technology Use by Children and Adolescents: A Narrative Review. Children 2024, 11, 754. [Google Scholar] [CrossRef] [Scilit] [PubMed] [PubMed Central]
- Schmidt-Persson, J.; Rasmussen, M.G.B.; Sørensen, S.O.; Mortensen, S.R.; Olesen, L.G.; Brage, S.; Kristensen, P.L.; Bilenberg, N.; Grøntved, A. Screen Media Use and Mental Health of Children and Adolescents: A Secondary Analysis of a Randomized Clinical Trial. JAMA Netw. Open 2024, 7, e2419881. [Google Scholar] [CrossRef] [Scilit] [PubMed] [PubMed Central]

Disclaimer/Publisher’s Note: The statements, opinions and data contained in all publications are solely those of the individual author(s) and contributor(s) and not of MDPI and/or the editor(s). MDPI and/or the editor(s) disclaim responsibility for any injury to people or property resulting from any ideas, methods, instructions or products referred to in the content. |
© 2026 by the authors. Licensee MDPI, Basel, Switzerland. This article is an open access article distributed under the terms and conditions of the Creative Commons Attribution (CC BY) license.