


Abstract
Background: The bleomycin (BLM)-induced murine model is the most widely used experimental model of systemic sclerosis, yet fibrosis is conventionally verified only at sacrifice. We asked whether high-frequency ultrasonography (HFUS) can track dermal fibrosis in vivo and predict histopathology and whether the selective JAK1/2 inhibitor baricitinib is antifibrotic when started after fibrosis is established. Methods: Female C57BL/6 mice received subcutaneous BLM (10 mg/kg/day, five days weekly for four weeks) and were allocated to BLM alone, BLM plus baricitinib (10 mg/kg orally twice daily from day 14) or BLM plus vehicle (27 randomised; 23 completed the study). Dermal thickness was measured by HFUS on days 0, 14 and 28, and skin and lung histopathology and Col1a1/Col1a2 expression were assessed on day 28. Results: Day-28 HFUS correlated strongly with histopathological dermal thickness (r = 0.859, p < 0.001; partial r = 0.644 after controlling for group) with good intra-observer reliability (ICC 0.88). Baricitinib brought dermal thickness below the animals’ own baseline (−86.10 ± 81.55 µm) while it continued to rise in the other groups, and it reduced histopathological dermal thickness and modified Ashcroft scores. Conclusions: HFUS enables non-invasive longitudinal monitoring, and baricitinib reverses established dermal thickening.
1. Introduction
Systemic sclerosis (SSc) is a chronic autoimmune connective tissue disease defined by the triad of vasculopathy, immune dysregulation, and progressive fibrosis of the skin and internal organs [1,2,3]. Fibrosis is the principal determinant of morbidity and mortality, and SSc-associated interstitial lung disease (SSc-ILD) is now the leading cause of disease-related death [4,5]. No disease-modifying antifibrotic therapy has yet demonstrated unequivocal efficacy in randomised controlled trials, which sustains the need both for preclinical models that reproduce the human disease and for methods capable of measuring treatment response reliably within those models [6].
The bleomycin (BLM)-induced murine model remains the most widely used experimental system in scleroderma research [7]. Administered subcutaneously, BLM produces dermal sclerosis and concurrent pulmonary involvement through systemic toxicity [7,8]. This distribution mirrors the systemic character of human SSc more closely than intratracheal or oropharyngeal instillation, which deliver a direct airway insult. The tissue involvement generated by the subcutaneous route is, however, milder and more homogeneous than that produced by intensive local BLM application, which makes fibrosis correspondingly harder to detect.
An underaddressed limitation of the model is that fibrosis development cannot conventionally be verified in the living animal. Model establishment is demonstrated only at the end of the experiment, through sacrifice and histopathology. Three consequences follow. Additional animals must be sacrificed to confirm that the model has developed at intermediate time points. The moment of treatment initiation rests on assumption rather than observation. And nothing is learned about the trajectory of fibrosis or the speed of response. Each bears directly on the 3R principles of replacement, reduction and refinement.
High-frequency ultrasonography (HFUS) offers a plausible solution. In patients with SSc, skin ultrasonography shows low intra- and inter-observer variability, correlates with the modified Rodnan skin score, and detects subclinical dermal thickening in areas scored as uninvolved on palpation [9,10]. Ultrasound biomicroscopy has more recently been optimised for rodent organ imaging. In the murine BLM model, however, its use has been confined to single end-point measurements. Whether it can serve as a longitudinal monitoring tool, validated against histopathology, remains unestablished.
In parallel, the JAK/STAT pathway has emerged as a central mediator of SSc pathogenesis [11,12,13]. Phosphorylated JAK1, JAK2, JAK3, and STAT3 are elevated in SSc skin relative to healthy controls [14]. TGF-β, the master profibrotic cytokine, stimulates fibroblasts through Smad2/3 as well as STAT3 and MAPK; JAK2 is activated in SSc in a TGF-β-dependent manner and mediates the stimulatory effect of TGF-β on fibroblasts [15]. Pedroza and colleagues demonstrated the role of STAT3 in fibroblast-to-myofibroblast differentiation [16], and Chakraborty and colleagues showed that profibrotic signals converge on STAT3, whose fibroblast-specific deletion or pharmacological inhibition attenuates experimental skin fibrosis [17]. Baricitinib, a reversible and selective JAK1/2 inhibitor licensed for rheumatoid arthritis, is therefore an attractive candidate for drug repurposing [18,19,20].
This study addressed two complementary questions. First, it evaluates whether HFUS can track dermal fibrosis longitudinally in living animals and predict histopathological findings at sacrifice, with CT-histopathology concordance assessed in parallel for the lung. Second, it analyses whether baricitinib exerts an antifibrotic effect on skin and lung when initiated at day 14, after fibrosis had already begun to develop. Sampling and imaging were performed at least 1 cm from injection sites, isolating the systemic rather than the local effect of BLM and thereby testing the imaging method against milder dermal involvement.
2. Materials and Methods
2.1. Animals and Ethics
Female C57BL/6 mice aged 6–8 weeks and weighing 20–25 g were used. Animals were purpose-bred in-house at the Dokuz Eylul University Department of Laboratory Animal Science, where the colony is maintained under routine health surveillance. No animals were obtained from external suppliers or transported between facilities, and because breeding and experimentation took place in the same unit, no separate acclimatisation period was required. Mice were housed at no more than six per cage in standard conventional cages on corn cob bedding, with standard environmental enrichment, at 22 ± 2 °C and 50–60% relative humidity on a 12 h light/dark cycle, with food and water available ad libitum.
Humane endpoints were defined before the study and included body weight loss exceeding 20% of baseline, persistent distress or immobility, and signs of intercurrent infection. Animals were assessed against these criteria daily. One animal reached the weight-loss endpoint and was removed; three further animals died during follow-up, as detailed in Section 2.2. All procedures were approved by the Dokuz Eylul University Animal Experiments Local Ethics Committee and were designed in accordance with the 3R principles. The study was conducted at the Dokuz Eylul University Department of Laboratory Animal Science with the Departments of Radiology, Pathology, and Molecular Medicine.
2.2. Experimental Groups and Animal Flow
Twenty-seven mice were allocated by block randomisation to BLM alone (group I, n = 9), BLM plus baricitinib (group II, n = 10) and BLM plus vehicle (group III, n = 8). Group size was determined by an a priori power calculation performed in G*Power (v. 3.1.9.7; Heinrich-Heine University of Düsseldorf, Düsseldorf, Germany; https://www.gpower.hhu.de (accessed on 11 October 2026)) with the support of the university biostatistics unit, taking as the reference effect size the reduction in dermal thickness reported by Wang and colleagues in a tofacitinib model of scleroderma [14], with alphaset at 0.05 and power at 0.80. Four animals did not complete the study. In group I, one animal reached the predefined humane endpoint for weight loss and was removed on day 16, and one animal died on day 21. In group III, two animals died, on days 16 and 24. No animal was lost in group II. All four losses occurred before the day-28 assessment; data from these animals were excluded from the final analyses at every time point. Twenty-three animals completed the study and were analysed: 7, 10 and 6 in groups I, II and III, respectively.
Within this cohort, gene expression could be measured in a smaller subset (7, 6 and 5 animals), because not all samples yielded RNA of sufficient quantity and quality. The number of animals contributing to each analysis is stated in the corresponding Results section and figure legend.
Blinding was maintained throughout. All gavage preparations were made up by a clinician working in the same laboratory who had no other involvement in the study. The preparations were matched for colour, dispensed in identical syringes and assigned random numbers; the allocation code was recorded in a sealed record held in the laboratory filing system and was opened only after all experimental procedures and outcome assessments had been completed, for verification. Group allocation was therefore concealed from the investigators who administered bleomycin and the study drug, from the radiologist who performed and read the ultrasonographic and computed tomography examinations, from the pathologists and observers who assessed the tissue sections, and from the investigator who performed the statistical analysis.
Group III received the gavage vehicle on the same schedule as group II and served as a procedural control for the oral administration procedure and its solvent. Because every group was exposed to BLM, comparisons address the severity and trajectory of fibrosis rather than its presence or absence; model establishment was demonstrated by within-animal longitudinal change rather than by comparison with a naive group.
2.3. Bleomycin-Induced Scleroderma Model
The dorsal region was shaved with depilatory cream and the injection field was marked. The model was adapted from the sclerotic skin model originally described by Yamamoto and colleagues [21], modified for subcutaneous administration in order to target the systemic rather than the local effect of the drug [7,22]. Bleomycin (Kocak Farma, Istanbul, Turkey) was dissolved in 1 mL phosphate-buffered saline (PBS; Sigma-Aldrich, St. Louis, MO, USA) and injected subcutaneously at 10 mg/kg/day, five days per week for four weeks, into the marked area. Injection sites were kept at least 1 cm from all tissue sampling and imaging areas.
2.4. Baricitinib Treatment
Baricitinib (HY-15315, MedChemExpress, Monmouth Junction, NJ, USA) was dissolved in 10% dimethyl sulfoxide (DMSO; Sigma-Aldrich, St. Louis, MO, USA)/90% corn oil (Mazola; ACH Food Companies, Cordova, TN, USA) and given by oral gavage at 10 mg/kg twice daily for 14 days, beginning on day 14. Treatment was deliberately withheld until dermal thickening was already underway, so that the drug was tested against ongoing rather than incipient fibrosis. Group III received an equal volume of corn oil on the same schedule.
2.5. Longitudinal High-Frequency Ultrasonography
Dermal thickness was measured at three time points: day 0 (before the first injection), day 14 (before the first baricitinib dose), and day 28 (end of treatment, immediately before sacrifice). Under sedation, mice were positioned prone on a heated table. A B-mode ultrasound biomicroscope (Vevo 2100, Fujifilm VisualSonics, Toronto, ON, Canada) with a 55 MHz probe (MS550D; Fujifilm VisualSonics, Toronto, ON, Canada) was used; the principles of high-frequency ultrasound biomicroscopy in small rodents have been described previously [23]. Conductive gel was applied without additional pressure to avoid tissue compression. Dermal and total thickness were measured between the upper and lower boundaries corresponding to two hyperechoic bands.
To provide an anatomical reference unaffected by respiratory motion and remote from injection sites, measurements were obtained from the dorsum adjacent to the level at which the echogenicity of the twelfth thoracic vertebra was identified. Three measurements were averaged per animal. All imaging was performed by a single radiologist experienced in murine ultrasonography and blinded to group allocation. Intra-observer reliability was assessed by intraclass correlation coefficient (ICC).
2.6. Computed Tomography
Computed tomography was performed on day 28, before sacrifice, as an exploratory pilot assessment. Imaging was carried out on a conventional clinical scanner adapted for small-animal use, not a dedicated micro-CT system, under sevoflurane (Sevoflurane USP; Abbott Laboratories, Abbott Park, IL, USA) anaesthesia in the prone position with cardiac gating. Because the resolution of this configuration is insufficient for quantitative characterisation of rodent lung parenchyma, and because no validated quantitative threshold exists for rodent pulmonary fibrosis on conventional CT, lung involvement was scored only dichotomously: any ground-glass opacity, infiltration or fibrosis-related consolidation was recorded as involvement present. All scans were read by the same radiologist, blinded to group allocation.
Full acquisition parameters were not recorded prospectively for this pilot assessment. The CT data are therefore reported in the Supplementary Material as an exploratory observation and are not treated as an outcome measure.
2.7. Histopathology
Mice were sacrificed on day 28, immediately after the final imaging, by cervical dislocation under xylazine (Rompun; Bayer, Leverkusen, Germany) and ketamine (Ketalar; Pfizer, New York, NY, USA) anaesthesia. Dorsal skin taken at least 1 cm from injection sites and the upper two lobes of the right lung were fixed in 10% neutral-buffered formalin (Sigma-Aldrich, St. Louis, MO, USA). Four-micron paraffin sections were stained with H&E and Masson’s trichrome and assessed for inflammatory infiltration, dermal thickness, collagen deposition, and alveolar architecture.
Dermal thickness, measured from the dermo-epidermal junction to subcutaneous fat, was quantified in five regions per section using ImageJ (version 1.53t; National Institutes of Health, Bethesda, MD, USA) [24] by two independent blinded observers. Skin sections were evaluated by a dermatopathologist with more than 20 years of experience. Pulmonary fibrosis was graded with the modified Ashcroft score (0–8), as originally described by Ashcroft and colleagues [25] and subsequently standardised by Hübner and colleagues [26], across five high-power fields per animal by a pulmonary pathologist with more than 10 years of experience. Both pathologists were blinded to group allocation. Skin sections are displayed with the scale bar generated by the imaging software at acquisition. For the lung sections the calibration of the archived exports could not be verified retrospectively. All lung panels are displayed at identical magnification, and quantitative assessment of the lung relied on the modified Ashcroft score rather than on linear measurement.
2.8. Quantitative RT-PCR
Tissue placed in RNAlater (Qiagen, Hilden, Germany) was incubated overnight at +4 °C and stored at −20 °C until analysis. Samples were transferred to V-bottomed tubes with a steel bead and 700–1000 µL Qiazol (Qiagen, Hilden, Germany), homogenised for 1 min in a TissueLyser II (Qiagen, Hilden, Germany) and incubated for 5 min at room temperature.
Total RNA was extracted with the Aurum Total RNA Mini Kit (BioRad Laboratories, Hercules, CA, USA) according to the manufacturer’s protocol, including on-column DNase I digestion, and eluted in 40 µL elution solution. RNA was stored at −80 °C. Concentration and purity were determined spectrophotometrically NanoDrop (Thermo Fisher Scientific, Waltham, MA, USA); samples were accepted with an A260/A280 ratio between 1.8 and 2.0.
Complementary DNA was synthesised from 20 ng template RNA using the iScript cDNA Synthesis Kit (BioRad Laboratories, Hercules, CA, USA) in a 20 µL reaction containing 4 µL 5× iScript reaction mix and 1 µL iScript reverse transcriptase, on a Thermal Cycler (BioRad Laboratories, Hercules, CA, USA) at 25 °C for 5 min, 46 °C for 20 min and 95 °C for 1 min.
Quantitative PCR was performed on an Applied Biosystems 7500 Real-Time PCR System (Thermo Fisher Scientific, Waltham, MA, USA) running 7500 Software v2.0.6 with SsoAdvanced Universal Inhibitor-Tolerant SYBR Green Supermix (BioRad Laboratories, Hercules, CA, USA). Gene-specific primers (Table 1) were synthesised by Oligomer (Ankara, Türkiye) and optimised at an annealing temperature of 60 °C. GAPDH served as the reference gene. Cycling conditions were as follows: polymerase activation 98 °C for 3 min, then 45–50 cycles of denaturation at 98 °C for 15 s, and annealing and extension at 60 °C for 30 s and 70 °C for 30 s. Melting curve analysis was performed from 65 °C to 95 °C in 0.5 °C increments every 5 s, and product specificity was confirmed by a single melting peak for every assay.
Table 1.
Primer sequences used for quantitative RT-PCR.
Each sample was run in technical duplicate. For statistical analysis, technical replicates were averaged so that each animal contributed a single observation, avoiding treatment of technical replicates as independent samples. Results were analysed by the comparative threshold cycle (ΔΔCt) method [27], normalised to GAPDH and expressed as fold change. Only samples yielding RNA of sufficient quantity and quality were analysed, so gene expression was assessed in a smaller subset than histopathology (BLM n = 7, BLM + BAR n = 6, BLM + vehicle n = 5).
2.9. Statistical Analysis
Imaging and histopathological data were analysed in SPSS (v. 25.0; IBM, Armonk, NY, USA). Continuous variables are reported as mean (standard deviation) and non-normally distributed variables as median (minimum–maximum). Within-group change over time was assessed by general linear model repeated-measures ANOVA (Wilks’ lambda). Between-group comparisons used one-way ANOVA with the Brown–Forsythe robust statistic and post hoc testing (Bonferroni, Tukey HSD, Games–Howell), or the Kruskal–Wallis test (Monte Carlo) with Dunn’s post hoc test where distributions were non-normal. Categorical variables were compared with the Fisher–Freeman–Halton test (Monte Carlo).
Agreement between ultrasonographic and histopathological measurements was assessed by Pearson and Spearman correlation. Because histopathology reflects the sacrifice time point, correlations used the day-28 ultrasound measurement and the change from baseline; baseline measurements were not used as the reference variable for this purpose. Intra-observer reliability was assessed by ICC. Gene expression data were analysed in GraphPad Prism (v. 8.0; GraphPad Software, San Diego, CA, USA) using the Kolmogorov–Smirnov test for normality and the Kruskal–Wallis test with Dunn’s post-test. A p value below 0.05 was considered significant.
3. Results
All animals were monitored daily for body weight, physiological changes, opportunistic infection, and food and water intake. Body weight declined from the second week in bleomycin-exposed animals, consistent with the cachexia and reduced appetite expected with this agent.
The three groups then diverged (Figure S1; complete daily records available for 6, 7 and 5 animals, respectively). By day 28, body weight had fallen to 70.4% of the day-1 value in the BLM group and to 82.7% in the vehicle group, whereas the baricitinib group had recovered to 90.5%. In the baricitinib group weight reached its nadir on day 11, before treatment began, and rose thereafter; food and water intake followed the same pattern. Part of the difference between the two gavage groups and the BLM group is likely to reflect the corn oil carrier, since both gavage groups arrested their decline, but the recovery was greater with baricitinib than with vehicle.
Attrition also differed. Two animals were lost from the BLM group (one removed on day 16 at the weight-loss endpoint, one death on day 21) and two from the vehicle group (deaths on days 16 and 24), whereas no animal was lost from the baricitinib group. No overt toxicity or behavioural change attributable to baricitinib was observed at the dose used.
3.1. Longitudinal Ultrasonographic Monitoring of Dermal Thickness
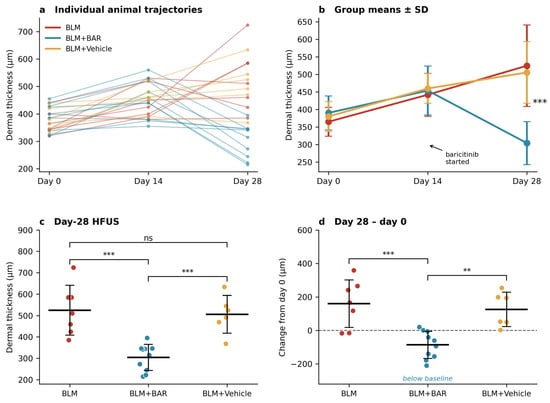
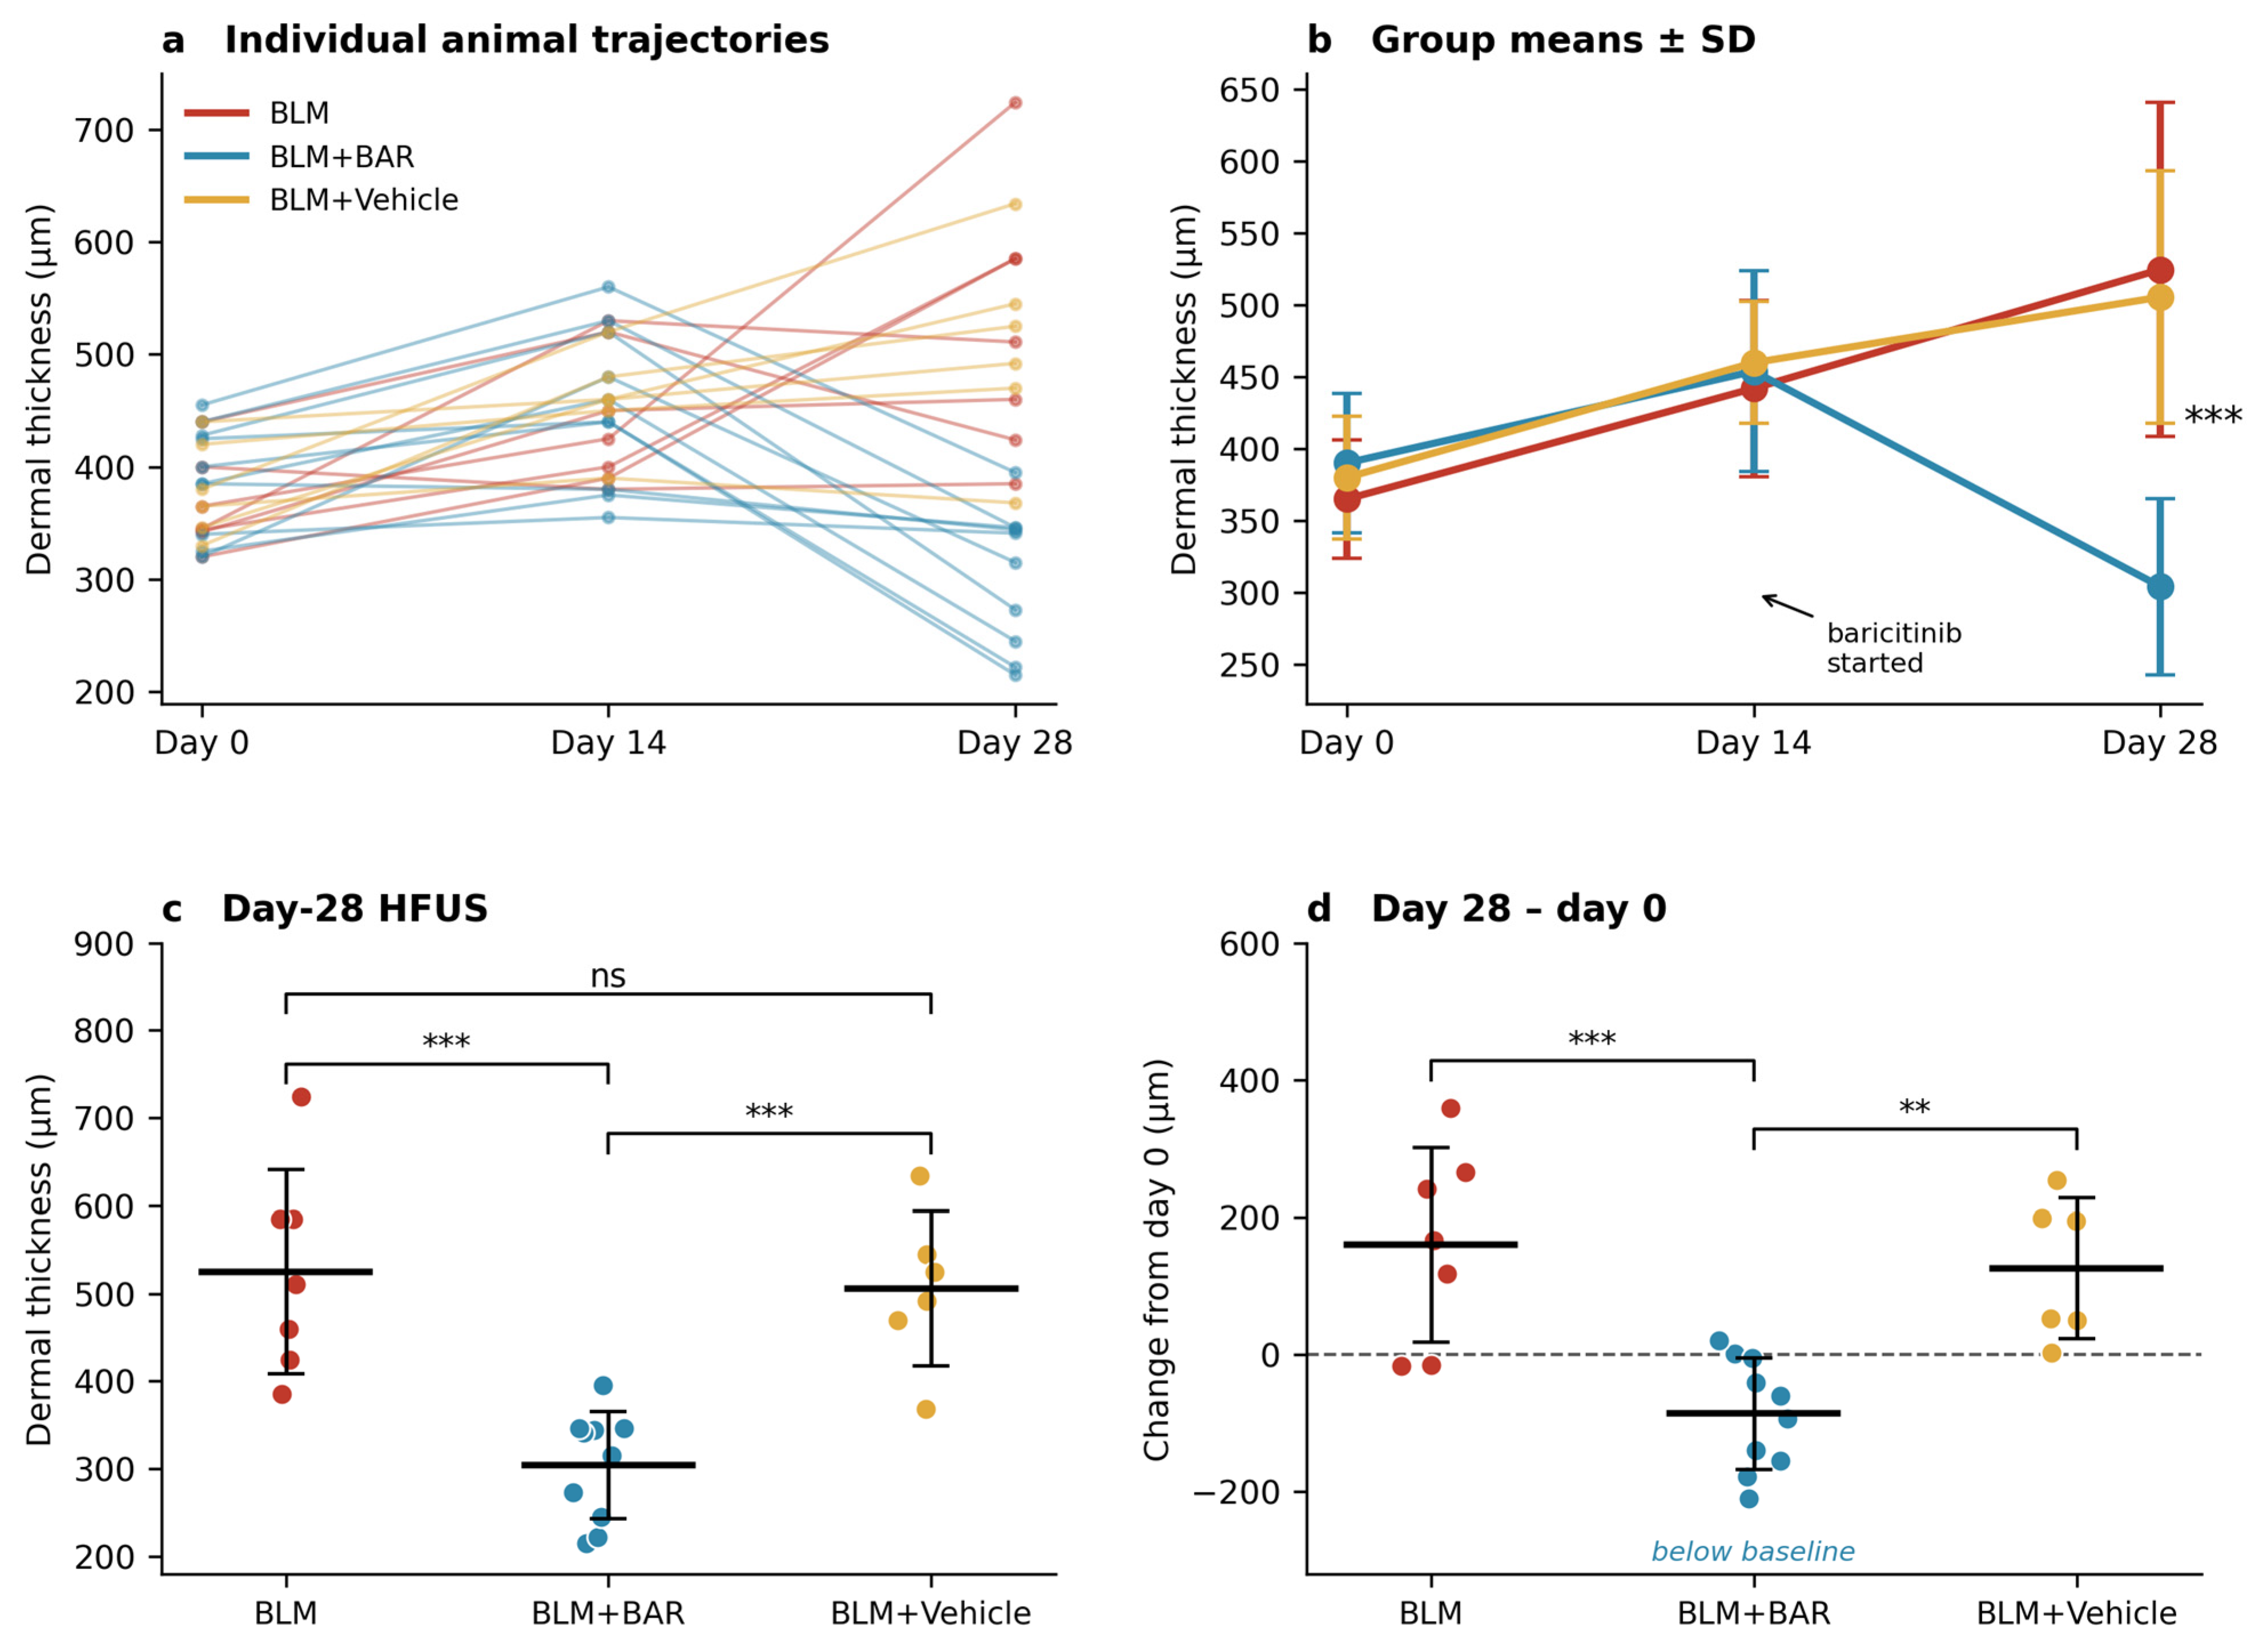
Ultrasonographic dermal thickness did not differ between groups on day 0 (365.14 ± 41.32, 390.30 ± 48.50 and 380.17 ± 42.62 µm; p = 0.521), confirming successful randomisation. Nor did it differ on day 14 (442.14 ± 61.23, 454.00 ± 69.91 and 460.00 ± 42.43 µm; p = 0.849). This was expected, since no group had yet received treatment and all had been exposed to BLM alone.
Within-animal analysis, however, showed significant thickening from day 0 to day 14 in the BLM (p = 0.049) and baricitinib (p = 0.009) groups. Fibrosis induction was therefore confirmed in the living animal, without sacrifice, before treatment began. The decision to initiate baricitinib on day 14 rested on this observation.
By day 28, the groups had diverged (524.86 ± 116.21, 304.20 ± 61.45 and 505.67 ± 88.09 µm; p < 0.001). Dermal thickness in the baricitinib group was lower than in both the BLM group (p < 0.001) and the vehicle group (p < 0.001). BLM and vehicle did not differ (p = 0.919), indicating that neither gavage nor the solvent influenced fibrosis independently.
The change analyses provide the most striking finding. Dermal thickness continued to increase from day 0 in the BLM (+159.71 ± 141.77 µm) and vehicle (+125.50 ± 102.81 µm) groups. In the baricitinib group, it fell below the animals’ own baseline (−86.10 ± 81.55 µm; overall p = 0.001; versus BLM p < 0.001, versus vehicle p = 0.003). Over the treatment interval itself, from day 14 to day 28, the baricitinib group regressed by 149.80 ± 89.21 µm while the other two groups continued to thicken (+82.71 ± 143.45 and +45.67 ± 48.25 µm; p = 0.001). Within-animal analysis confirmed a significant reduction between days 14 and 28 in the baricitinib group (p = 0.001), with no significant change over the same interval in the BLM group (p = 0.534).
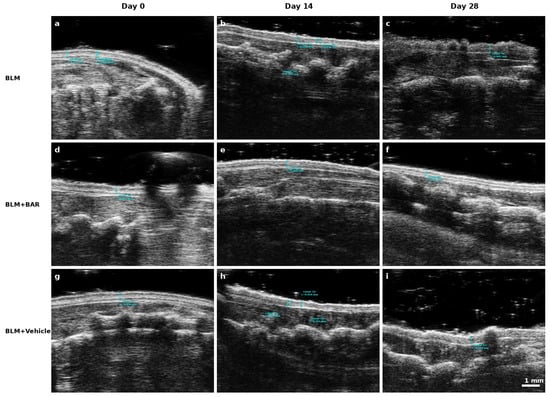
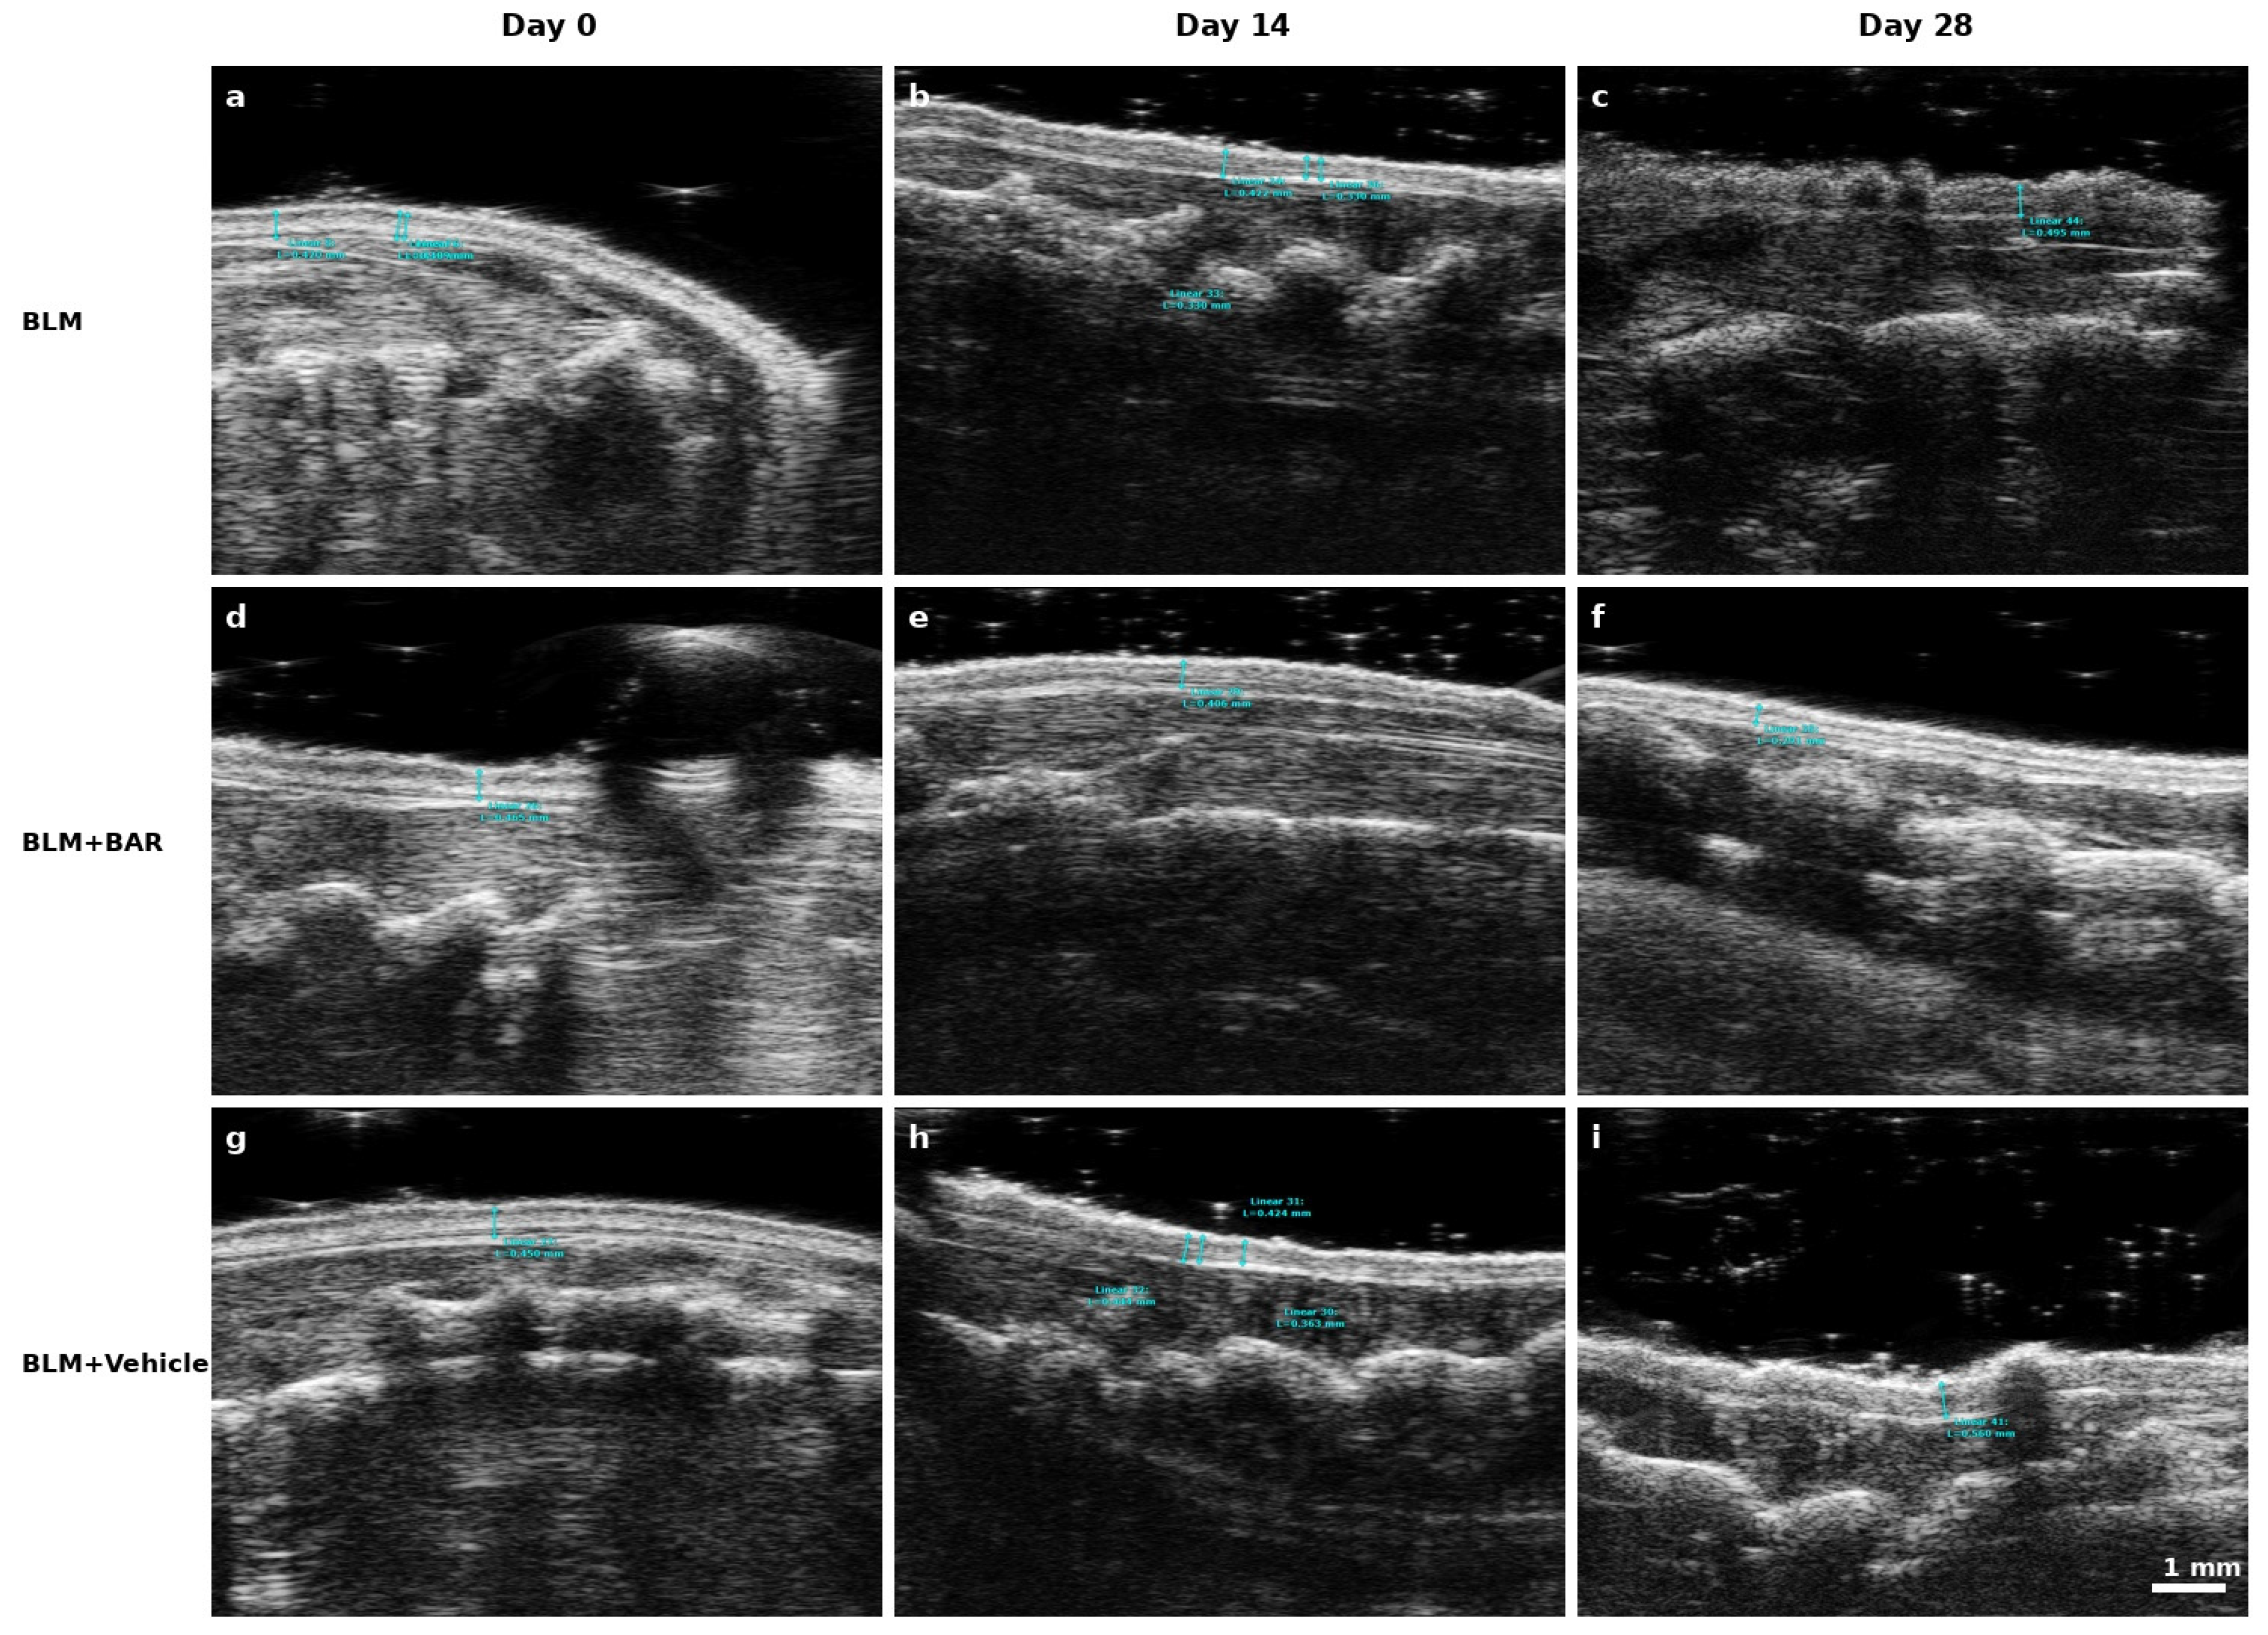
Representative HFUS images are shown in Figure 1, and individual animal trajectories, group means, day-28 values and change from baseline are shown in Figure 2. Taken together, these data indicate that baricitinib did not merely slow the progression of dermal fibrosis but reversed established dermal thickening.
Figure 1.
Representative high-frequency ultrasonographic images of dorsal skin on days 0, 14 and 28. Rows: BLM (a–c), BLM + baricitinib (d–f), BLM + vehicle (g–i). Cyan calipers show on-device dermal thickness measurements at the time of acquisition; dermal thickness was taken between the two hyperechoic bands. Note the progressive thickening in the BLM and vehicle rows and the reduction below baseline in the baricitinib row. All frames were acquired at identical depth settings (11.5 µm/pixel). Scale bar: 1 mm.
Figure 2.
Longitudinal ultrasonographic monitoring of dermal thickness. (a) Trajectories of individual animals across the three time points, each line representing one mouse (n = 7, 10 and 6); (b) group means ± SD, arrow marking initiation of baricitinib on day 14; (c) day-28 dermal thickness, each point one animal, with group mean ± SD; (d) change from day 0 to day 28, dashed line marking zero.** p < 0.01, *** p < 0.001; ns, not significant.
3.2. Histopathological Assessment of Skin
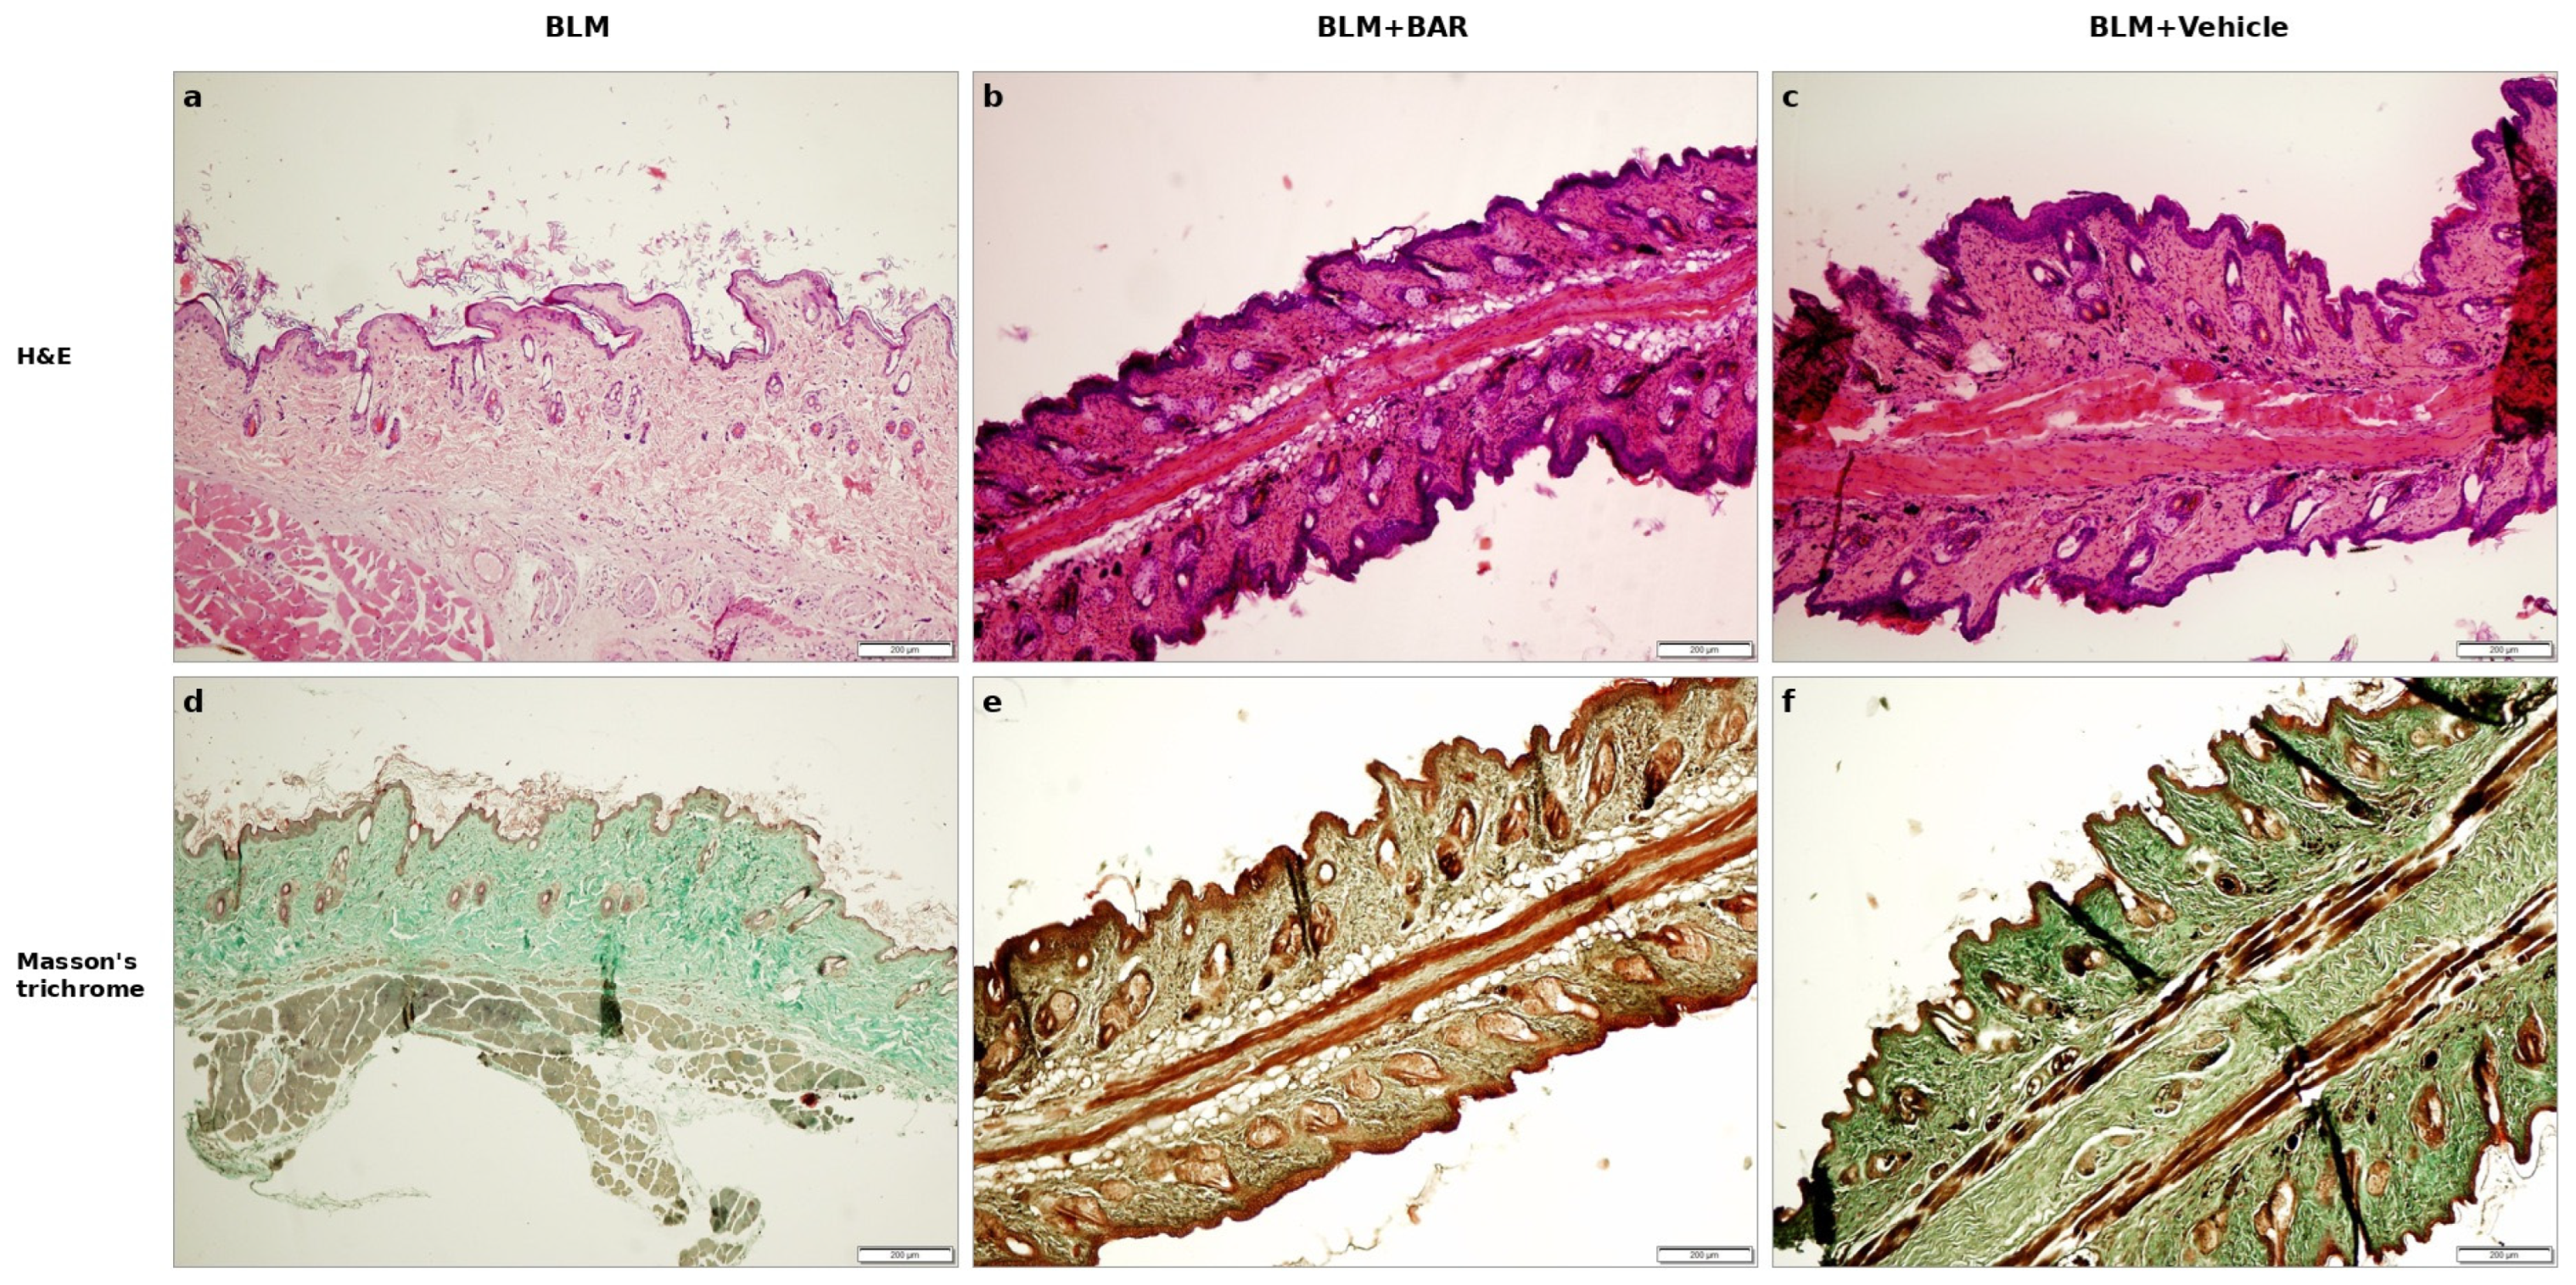
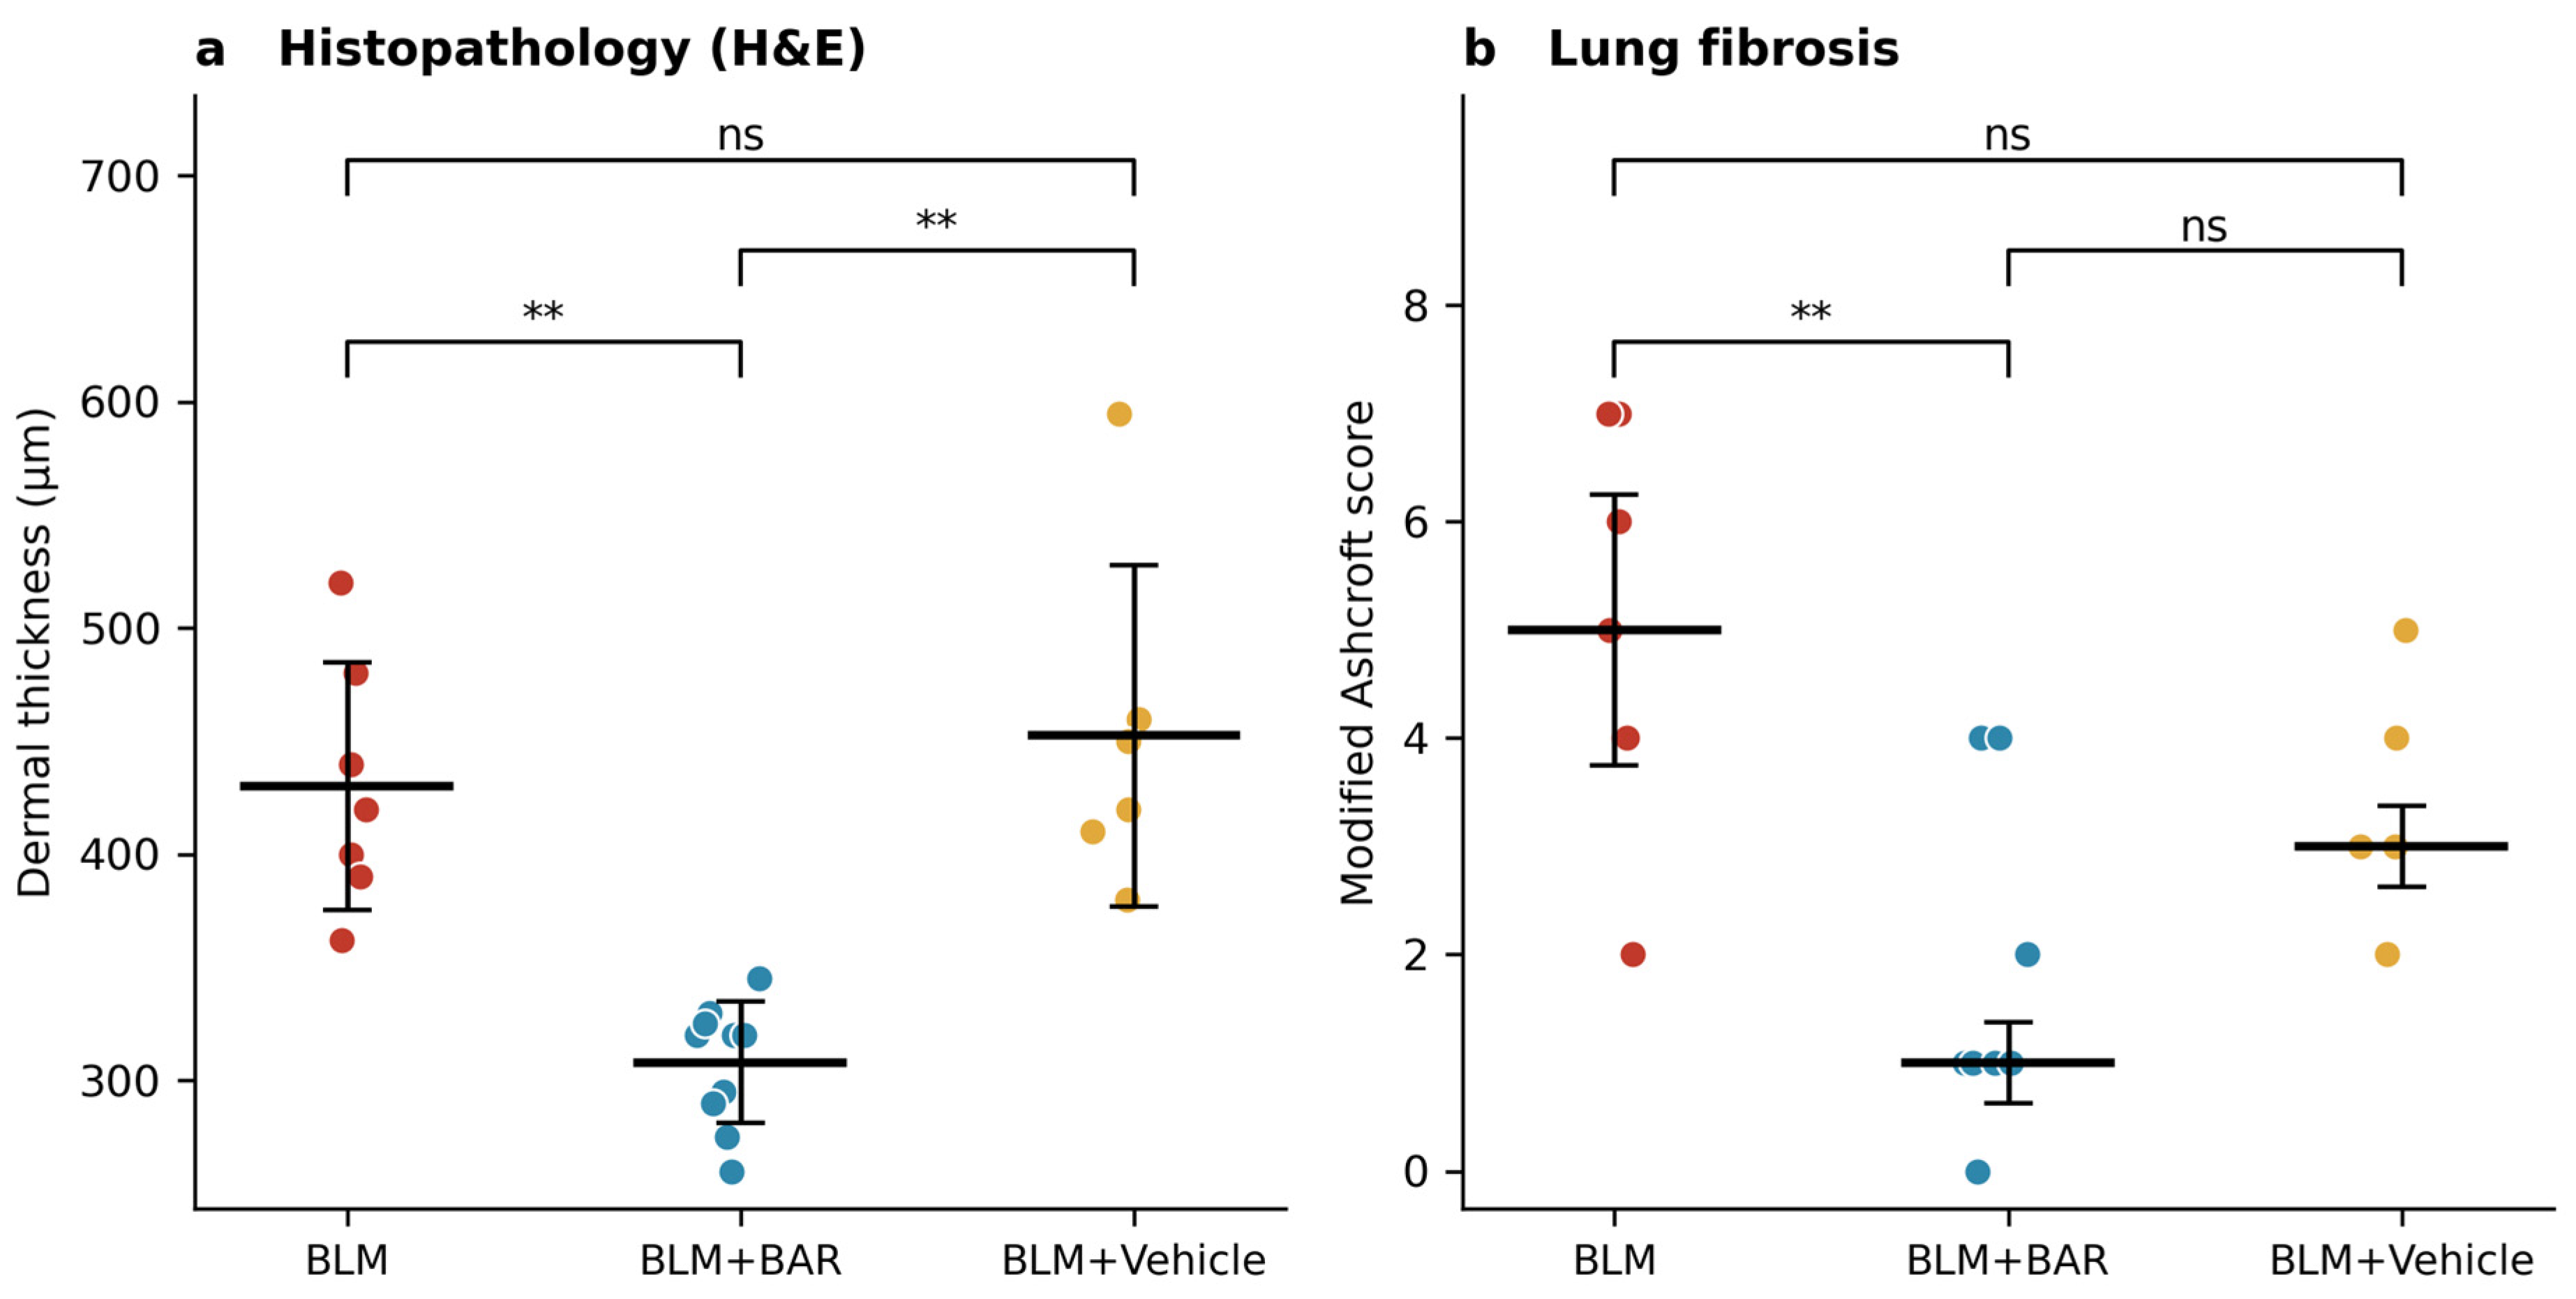
Dermal thickness measured on H&E sections differed significantly between groups (p = 0.001). The baricitinib group (308.00 ± 26.79 µm) was thinner than both the BLM group (430.29 ± 54.66 µm; p < 0.001) and the vehicle group (452.50 ± 75.48 µm; p < 0.001), which did not differ from each other (p = 0.721).
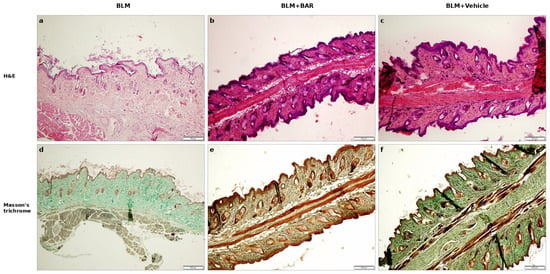
Masson’s trichrome staining showed a corresponding reduction in collagen deposition in baricitinib-treated animals. Dermal thickness and collagen accumulation were both markedly increased in BLM-exposed mice and markedly reduced when baricitinib was given. Loss of the subcutaneous adipose layer, a characteristic accompaniment of dermal fibrosis, was prominent in the BLM and vehicle groups and substantially attenuated with baricitinib. Representative sections are shown in Figure 3.
Figure 3.
Representative skin sections at ×10 magnification. (a–c) Haematoxylin and eosin; (d–f) Masson’s trichrome. Columns: BLM (a,d), BLM + baricitinib (b,e), BLM + vehicle (c,f). In the haematoxylin and eosin panels nuclei appear blue–purple and the cytoplasm and dermal collagen pink; in the Masson’s trichrome panels collagen appears blue, muscle and cytoplasm red, and nuclei dark brown to black. Note the reduced dermal thickness, decreased collagen deposition and preservation of the subcutaneous adipose layer in baricitinib-treated animals. Scale bar: 200 µm.
3.3. Histopathological Assessment of Lung
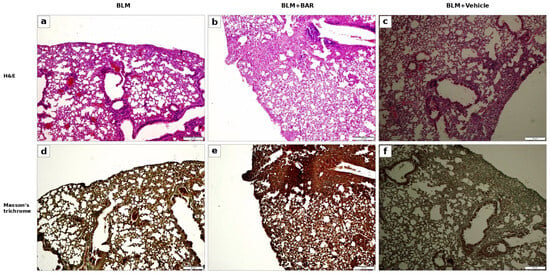
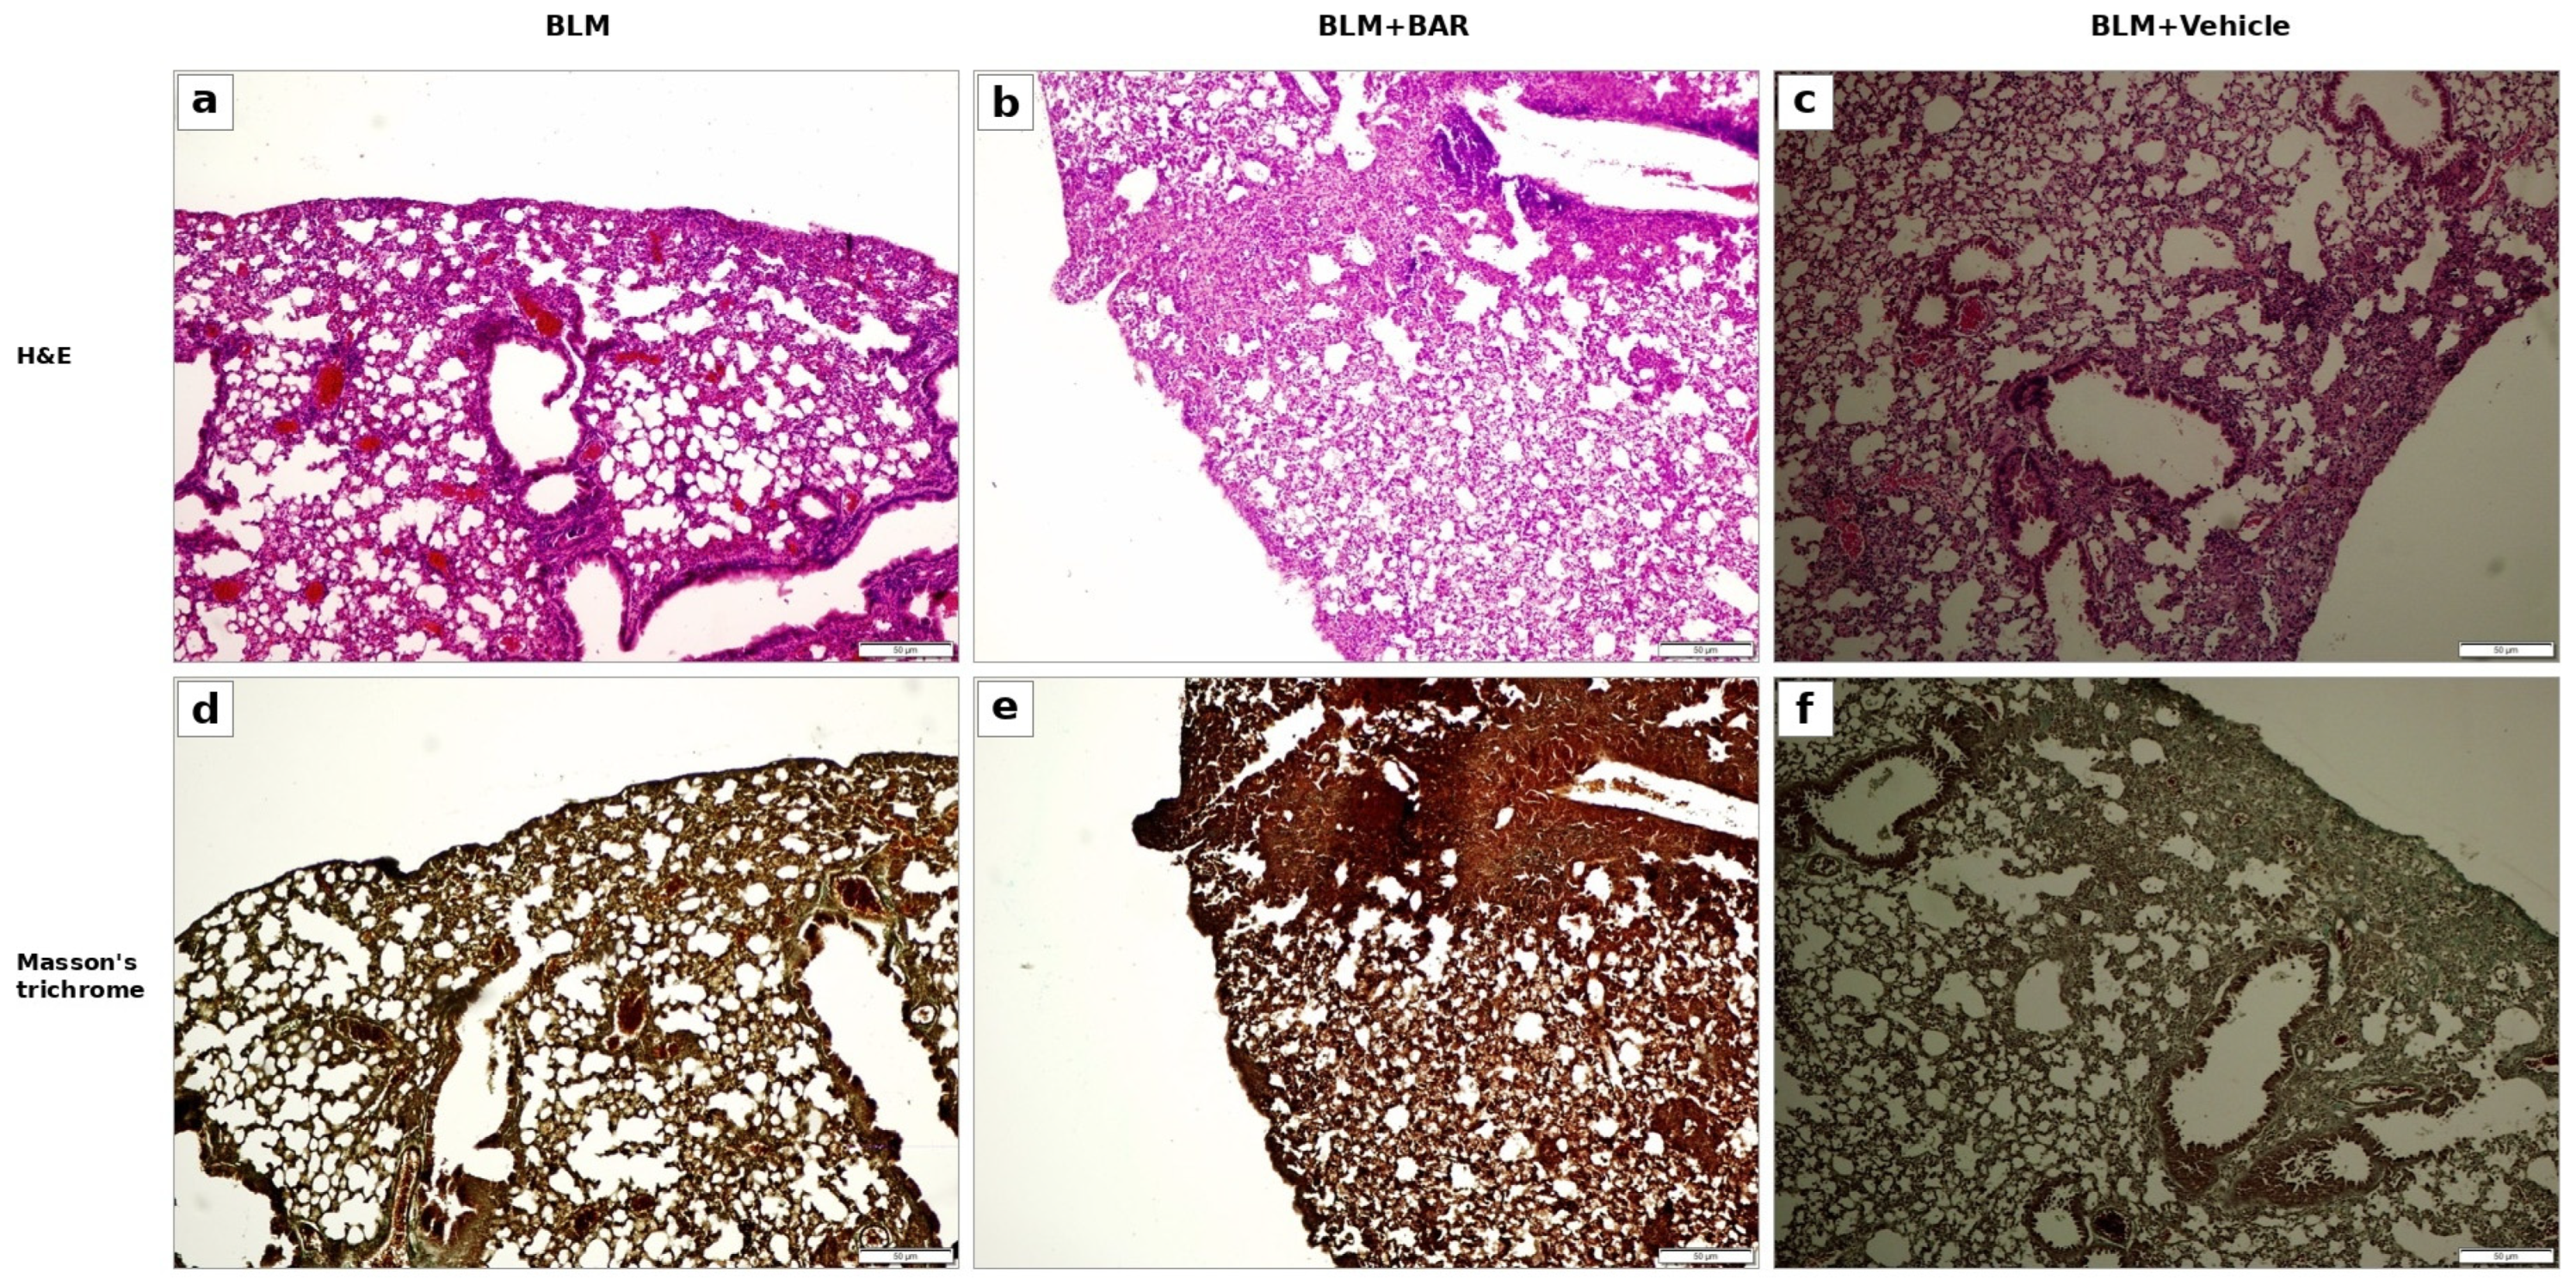
Subcutaneous BLM produced clear pulmonary pathology. Fibrotic foci were located predominantly in the subpleural region and were accompanied by inflammatory cell migration together with sparse perivascular and interstitial fibrosis. This distribution reflects systemic BLM toxicity and differs from the bronchocentric, heterogeneous, and more severe fibrosis produced by intratracheal or oropharyngeal instillation. Representative lung sections are shown in Figure 4.
Figure 4.
Representative lung sections from animals that completed the study. (a–c) Haematoxylin and eosin; (d–f) Masson’s trichrome. Columns: BLM (a,d), BLM + baricitinib (b,e), BLM + vehicle (c,f). Staining colours are as described for Figure 3. Fibrotic foci are predominantly subpleural, with sparse perivascular and interstitial involvement. All panels are shown at identical magnification. A scale bar is not given because the calibration of the archived exports could not be verified retrospectively; all quantitative assessment of the lung relied on the modified Ashcroft score. Modified Ashcroft scores differed between groups (p = 0.001). The baricitinib group had a median score of 1 (0–4), significantly lower than the BLM group (5 [2–7]; p = 0.002). Compared with the vehicle group (3 [2–5]) the reduction was numerically clear but did not survive correction for multiple comparisons (Dunn p = 0.176; uncorrected pairwise p = 0.025). BLM and vehicle groups did not differ (p = 0.630). Scale bar: 50 µm.
3.4. Computed Tomography Findings
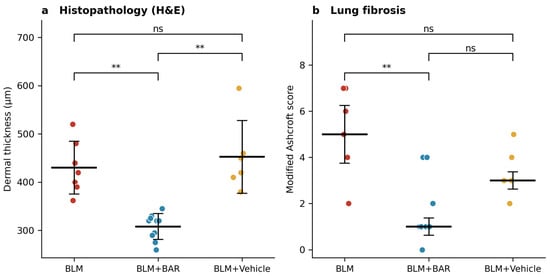
Histopathological endpoints are summarised in Figure 5. The exploratory computed tomography observations are reported in the Supplementary Material (Table S1) and are not treated as an outcome measure.
Figure 5.
Endpoint measures of fibrosis in the 23 animals that completed the study. (a) Histopathological dermal thickness, each point one animal, with group mean ± SD; (b) modified Ashcroft score for pulmonary fibrosis, with median ± interquartile range. Group sizes were BLM n = 7, BLM + baricitinib n = 10 and BLM + vehicle n = 6. Between-group comparisons by one-way ANOVA with post hoc testing (a) and Kruskal–Wallis with Dunn’s post hoc test (b). ** p < 0.01; ns, not significant.
3.5. Concordance Between Imaging and Histopathology
Intra-observer reliability for ultrasonographic measurements was good to excellent (ICC 0.88).
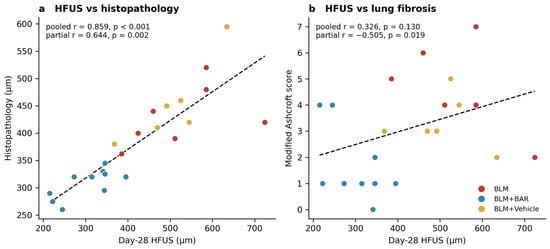
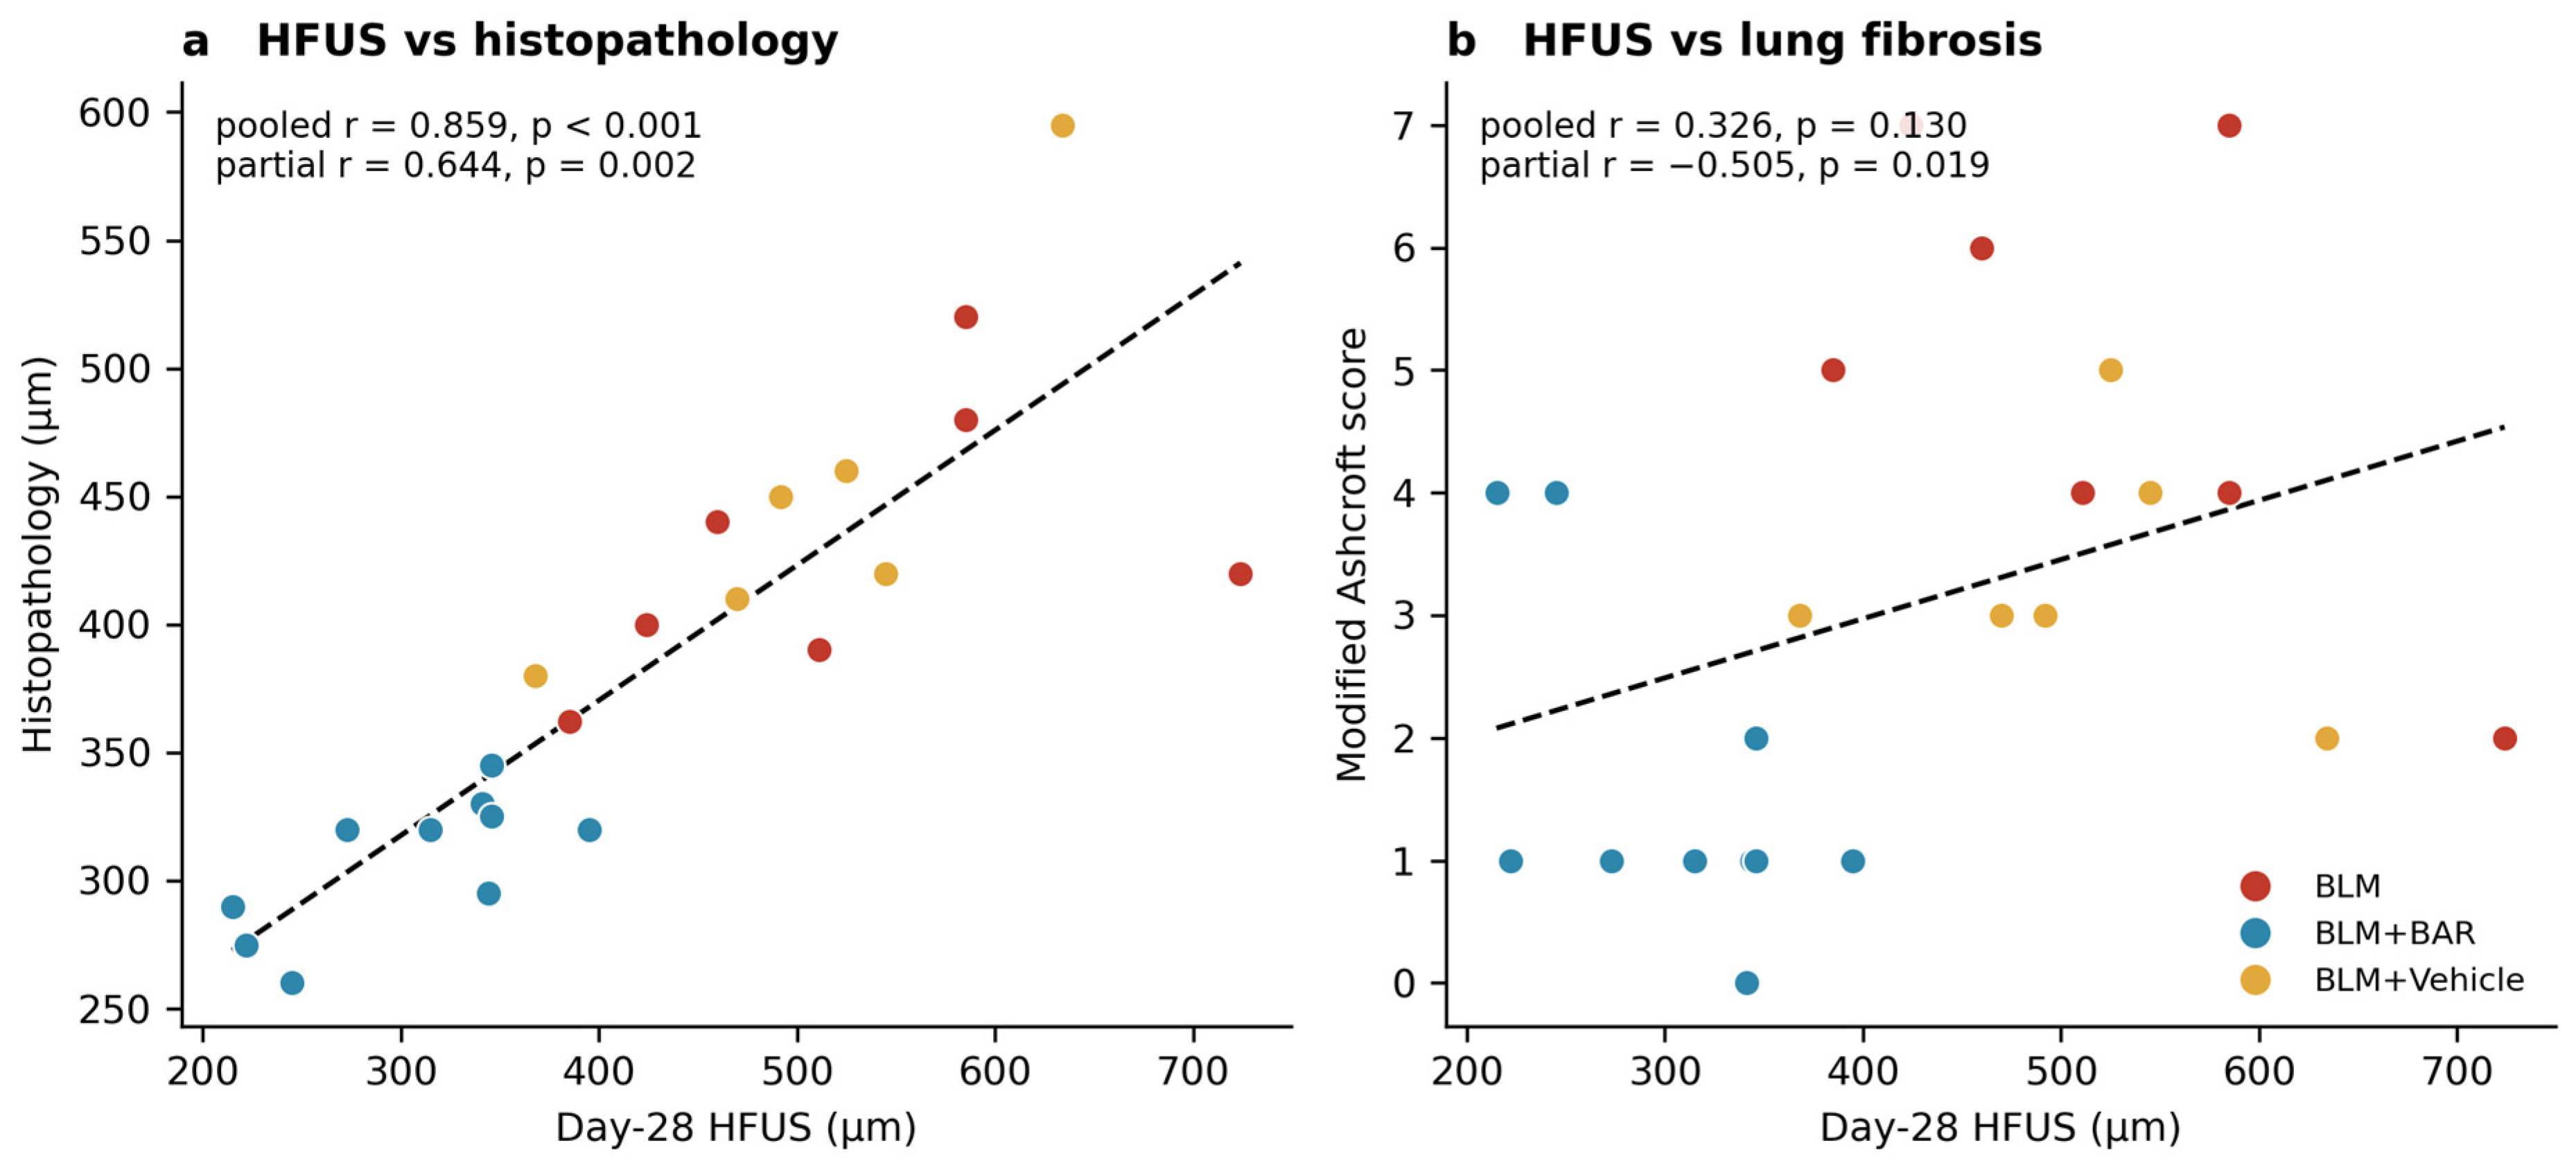
Day-28 ultrasonographic dermal thickness correlated strongly with histopathological dermal thickness across the whole cohort (Pearson r = 0.859, 95% CI 0.69–0.94, p < 0.001; Spearman ρ = 0.915, p < 0.001). The change in ultrasonographic thickness from baseline correlated similarly (r = 0.828, p < 0.001).
To determine whether this reflected a genuine animal-level association rather than separation between treatment groups, a partial correlation controlling for group was calculated. The association persisted (partial r = 0.644, 95% CI 0.29–0.84, p = 0.002). Within groups, the correlation remained significant in the baricitinib (r = 0.712, p = 0.021) and vehicle (r = 0.863, p = 0.027) groups; in the BLM group, the relationship was in the same direction but did not reach significance (r = 0.495, p = 0.259), most plausibly because of the small group size. Ultrasonography therefore tracked dermal thickness differences between individual animals within a group, not merely between groups.
Absolute ultrasonographic values exceeded histopathological values, as expected: formalin fixation and paraffin embedding cause tissue shrinkage, precluding exact numerical equivalence. Agreement was therefore evaluated by correlation rather than by absolute value.
The relationship between skin and lung showed a different pattern. In the pooled cohort, histopathological dermal thickness correlated with the modified Ashcroft score (r = 0.446, p = 0.033; Spearman ρ = 0.506, p = 0.014), and day-28 ultrasonographic thickness showed a borderline association (Spearman ρ = 0.424, p = 0.044; Pearson r = 0.326, p = 0.130). Once group was controlled for, however, these associations disappeared or reversed: the partial correlation between ultrasonographic thickness and Ashcroft score was negative (r = −0.505, p = 0.019), and that between histopathological dermal thickness and Ashcroft score was null (r = −0.130, p = 0.575). No group showed a positive within-group association (ultrasonography versus Ashcroft: BLM r = −0.621, baricitinib r = −0.590, vehicle r = −0.111; all p > 0.05). Consistent with this, the discriminative ability of ultrasonographic dermal thickness for high-grade pulmonary fibrosis (Ashcroft ≥ 4) was poor (AUC 0.63).
Correlation analyses are shown in Figure 6.
Figure 6.
Validation of high-frequency ultrasonography against histopathology (n = 23). (a) Day-28 HFUS dermal thickness versus histopathological dermal thickness; the association persists after controlling for treatment group. (b) The same HFUS measure versus modified Ashcroft score; the pooled positive slope disappears and reverses once group is controlled for, showing that it reflects group separation rather than an animal-level relationship. Points are coloured by group and dashed lines show the pooled regression. Correlations by Pearson and Spearman coefficients; partial correlations computed on residuals after removing the group term.
3.6. Col1a1 and Col1a2 Expression
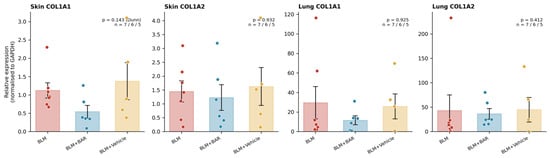
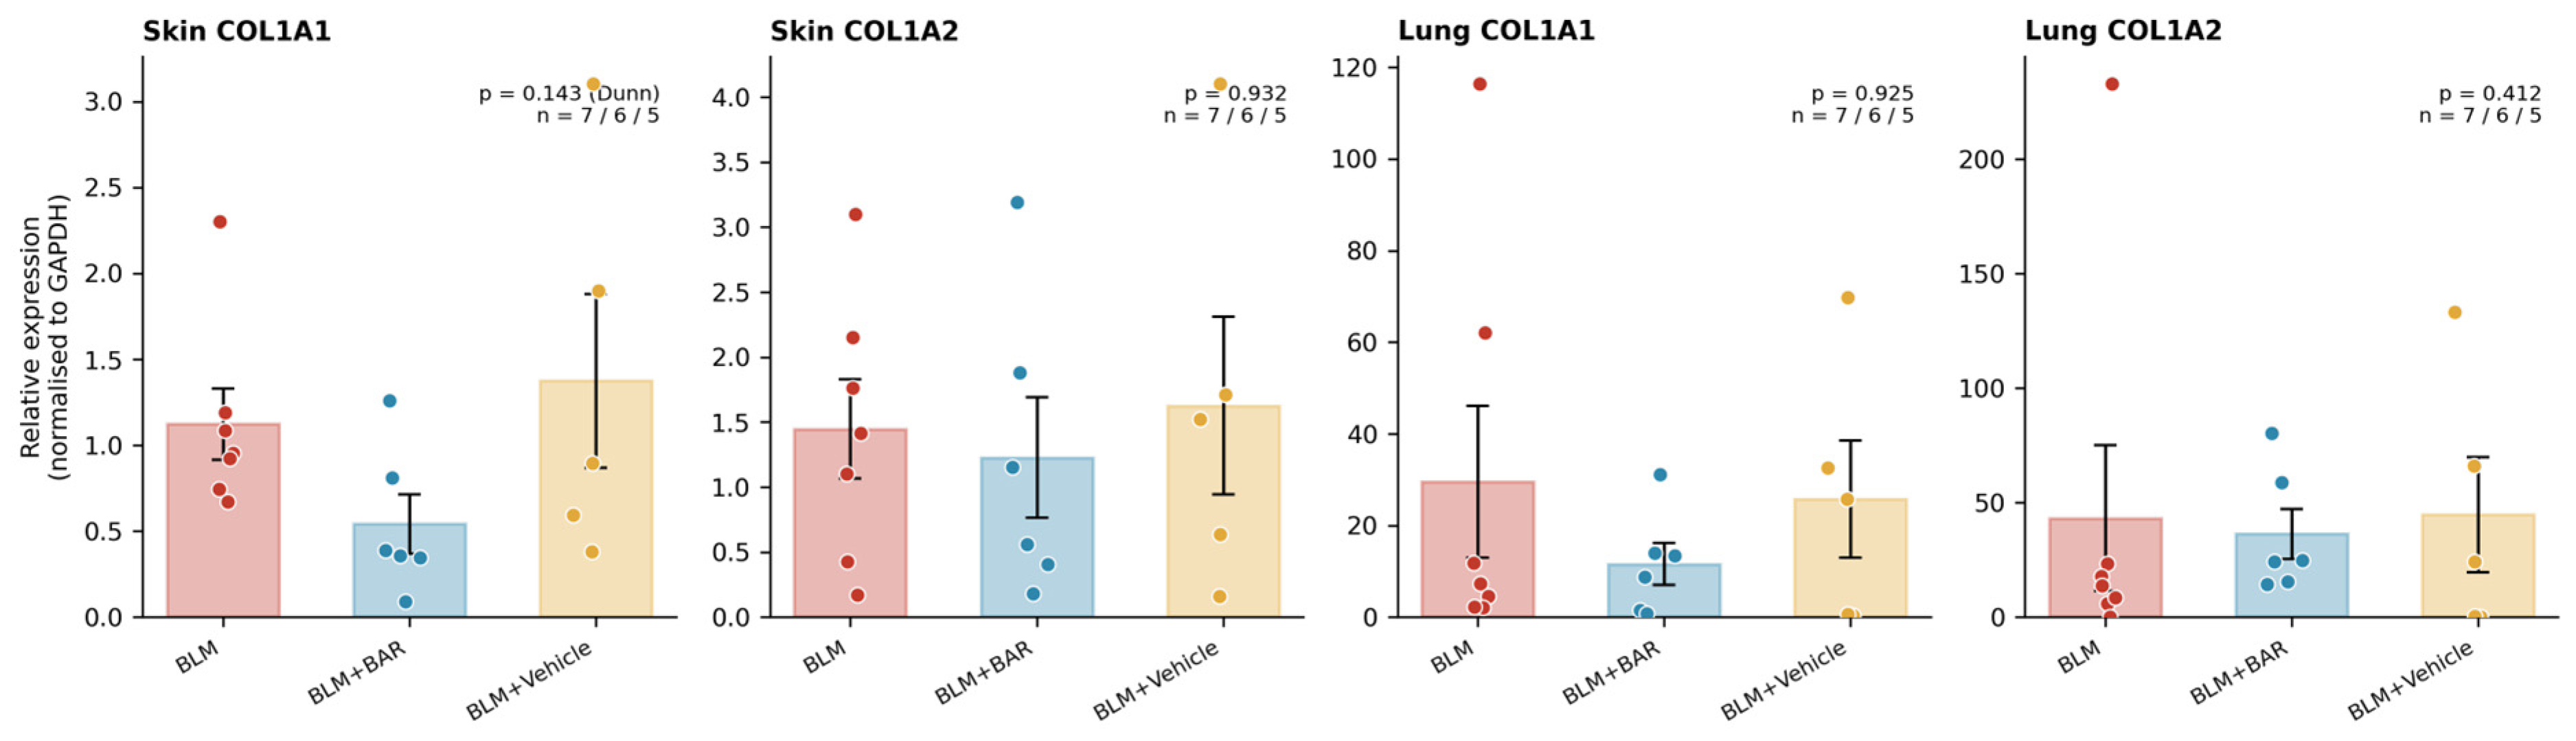
Gene expression was analysed at the level of the animal after averaging technical duplicates (BLM n = 7, BLM + BAR n = 6, BLM + vehicle n = 5; Figure 7).
Figure 7.
Relative Col1a1 and Col1a2 expression normalised to GAPDH in skin and lung tissue. Each point represents one animal (technical duplicates averaged); bars show mean ± SEM. Group sizes were BLM n = 7, BLM + baricitinib n = 6 and BLM + vehicle n = 5. Kruskal–Wallis test with Dunn’s post-test.
In skin, Col1a1 expression in baricitinib-treated animals was approximately 52% lower than in the BLM group (0.54 ± 0.17 versus 1.12 ± 0.21, mean ± SEM). The direction and magnitude of this reduction accord with the histopathological findings, but it did not reach statistical significance (Kruskal–Wallis p = 0.115; Dunn’s post-test versus BLM p = 0.143). Values in the vehicle group resembled those in the BLM group (1.37 ± 0.50).
Cutaneous Col1a2 expression did not differ between groups (1.45 ± 0.38, 1.23 ± 0.47, and 1.63 ± 0.68; p = 0.932). In lung tissue, neither Col1a1 (29.54 ± 16.57, 11.60 ± 4.53, and 25.83 ± 12.78; p = 0.925) nor Col1a2 (43.23 ± 31.76, 36.33 ± 11.01, and 44.80 ± 25.13; p = 0.412) differed between groups; within-group dispersion in lung was wide, consistent with the mild and patchy fibrosis produced by the subcutaneous route and with sampling variability.
4. Discussion
This study addressed two questions in a single cohort: whether HFUS can monitor dermal fibrosis in vivo and predict histopathology, and whether baricitinib is antifibrotic when given after fibrosis has become established. The findings support both.
4.1. Validity of Non-Invasive Monitoring
Two results support HFUS as a monitoring tool. Intra-observer reliability was good to excellent (ICC 0.88), and day-28 measurements correlated strongly with histopathological dermal thickness (r = 0.859). The correlation persisted separately in treated and untreated groups, indicating that ultrasonography captures not only disease severity but also treatment-related regression.
The value of this result is increased by our model design. In most published work, BLM is applied intensively to a small area of skin, producing thick and readily detectable dermal fibrosis. Ultrasonographic detection is comparatively easy under such conditions. Injection-related oedema, depilation-induced irritation and local inflammation may also confound both ultrasonographic and histological findings. We instead targeted the systemic effect of BLM, sampling and imaging at least 1 cm from injection sites, which produced thinner and milder dermal involvement. That ultrasonography nevertheless correlated strongly with histopathology under these more demanding conditions argues for the robustness of the method.
Discordance between absolute ultrasonographic and histological values is expected. Histology remains the standard for assessing skin layers, but it requires sacrifice. Fixation and embedding also introduce shrinkage and distortion that alter measured thickness. Because all tissues were processed identically, this effect is systematic and does not prevent correlation.
The implications for the 3Rs are concrete. In a conventional design, demonstrating that the model had developed by day 14 would have required sacrificing a separate cohort at that time point. Here, the same confirmation was obtained by comparing animals with their own baselines, without additional animals (p = 0.049 in the BLM group and p = 0.009 in the baricitinib group). The timing of treatment was therefore anchored to an observation rather than an assumption.
One point deserves emphasis. No between-group difference was present on day 14 (p = 0.849). This does not indicate failure of the model; it is the expected result, because at that time all groups had received BLM alone and none had received treatment. The evidence of model establishment is the within-animal comparison. This distinction is central to a design without a naive control group.
4.2. Radiological and Pathological Assessment of the Lung
High-resolution CT in SSc-ILD demonstrates new bilateral ground-glass abnormality, or reticulation and honeycombing with superimposed consolidation in a UIP pattern. Its application in rodents is constrained by resolution. We used a conventional scanner rather than a dedicated micro-CT system and therefore scored involvement dichotomously rather than quantitatively. Alveolitis could not be distinguished from fibrosis on our images, and peripheral lung injury was difficult to separate from adjacent chest wall. Because radiation exposure could affect animal welfare and the progression of fibrosis itself, imaging was performed only once, before sacrifice.
We therefore regard the computed tomography data as an exploratory pilot observation rather than as an outcome measure and report them only in the Supplementary Material. Quantitative pulmonary imaging in this model requires micro-CT with Hounsfield unit histogram analysis and prospectively recorded acquisition parameters; we did not have access to such a system, and the conclusions of the present study rest on the ultrasonographic, histopathological and molecular data.
Conventional fibrosis assessment relies on invasive ex vivo measurement. Such methods yield robust and reproducible data but are vulnerable to sampling bias. Ashcroft scoring and collagen quantification represent only a small proportion of total lung tissue, whereas imaging can characterise the whole organ.
The pulmonary involvement produced by the subcutaneous route differs unavoidably from that produced by instillation. In intratracheal delivery, the solution is driven under constant pressure and may reach either lung at random. The result is a bronchocentric, heterogeneous distribution with severe fibrosis from direct airway injury. With subcutaneous administration, the systemic toxicity of BLM generates milder, more homogeneous inflammation and fibrosis in subpleural regions. This pattern is arguably a closer analogue of the early peripheral involvement seen in human SSc-ILD.
We also examined the relationship between skin and lung, and encountered an instructive statistical pattern. In the pooled cohort, histopathological dermal thickness correlated significantly with the Ashcroft score (r = 0.446, p = 0.033). Controlling for group abolished this association (partial r = −0.130, p = 0.575) and reversed it for ultrasonographic thickness (partial r = −0.505, p = 0.019); no group showed a positive within-group relationship.
This is a textbook instance of Simpson’s paradox. The pooled positive correlation arises from group separation, not from any animal-level association. Baricitinib-treated animals had low values in both compartments, and the other groups had high values in both. Analysing the groups together therefore manufactures an apparent relationship. Compared within a group, dermal thickness carried no information about the severity of pulmonary fibrosis, and the discriminative ability of ultrasonographic thickness for high-grade fibrosis was poor (AUC 0.63).
The following point deserves explicit statement: skin ultrasonography is a valid tool for monitoring dermal fibrosis but cannot substitute for direct assessment of the lung. Although both organs are affected by the same systemic process, their severities vary independently in the individual animal. This is consistent with the limited relationship between skin score and lung involvement in human SSc, and it reinforces the need to evaluate the lung separately. The finding also carries a broader caution for preclinical fibrosis studies. Correlations computed across treatment groups can be driven entirely by the treatment effect and should be verified within groups before being read as biological associations.
4.3. Antifibrotic Effect of Baricitinib
Baricitinib significantly reduced fibrosis in both compartments. Dermal thickness and trichrome-detected collagen deposition were lower than in both the BLM and vehicle groups (p < 0.001), and modified Ashcroft scores were lower than in the BLM group (p = 0.002), though the comparison with vehicle did not survive correction (p = 0.176).
The longitudinal ultrasonographic data yield information that is unobtainable from end-point histopathology. In the baricitinib group, dermal thickness fell during treatment, between days 14 and 28, and by day 28 it lay below the animals’ own baseline (−86.10 µm), while thickening continued in the other groups. Since treatment began on day 14, after fibrosis had become established, this suggests that baricitinib can regress existing dermal thickening rather than merely prevent its development. In most comparable studies treatment is started concurrently with BLM, so the effect is characterised as prophylactic; our finding extends that evidence.
At the molecular level, cutaneous Col1a1 expression was roughly halved in baricitinib-treated animals. This is the same direction as the histological reduction in dermal thickness and trichrome-detected collagen, but at the animal level it did not reach statistical significance (p = 0.143). Limited power is the most likely explanation. Gene expression could be assessed in only 7, 6 and 5 animals, respectively, and an effect of this size is not reliably detectable at that sample size. The result should therefore be read as a trend supporting, rather than independently establishing, suppression of fibroblast-derived collagen synthesis.
That Col1a2 showed no change in either direction suggests that the two collagen genes are subject to different transcriptional regulation, or that their promoters differ in sensitivity to JAK/STAT blockade. The absence of differences in lung gene expression may reflect the mild, peripheral nature of the fibrosis produced by subcutaneous BLM. A tissue block that under-represents subpleural foci would dilute molecular differences, and within-group dispersion in the lung data was indeed wide.
Our findings align with a growing body of evidence for JAK/STAT inhibition as an antifibrotic strategy [28,29]. Wang and colleagues showed that baricitinib alleviated skin and lung fibrosis in a BLM-induced SSc-ILD model through the JAK2/TGF-β1 axis, reducing dermal and alveolar septal thickening and suppressing fibroblast transformation and collagen accumulation [30]. Gu and colleagues reported a comparable effect on bleomycin-induced pulmonary fibrosis, again mediated by inhibition of TGF-β1 signalling [31]. Hou and colleagues compared selective JAK inhibitors in BLM-induced skin fibrosis and found the most pronounced antifibrotic effect with JAK2 inhibition, which reduced dermal thickness by 37.5%, attenuated Col1a1 upregulation, and reduced capillary loss [19]. The particular efficacy of JAK2 blockade has been attributed to TGF-β1-induced JAK2 phosphorylation and downstream STAT3 activation [15,17] and to the unique capacity of JAK2 among family members to pair with itself.
Clinical data are supportive. In the same report, Hou and colleagues treated ten patients with diffuse cutaneous SSc with baricitinib and observed a mean reduction in the modified Rodnan skin score of 8.3 points at week 12 and 11.7 points at week 24, with healing of digital ulcers [19]. Comparable cutaneous responses have been reported with tofacitinib in real-world multicentre data [32] and in SSc-associated ILD [33], and JAK inhibition has also been effective in localised scleroderma and morphea [34,35,36,37,38]. That baricitinib is already licensed for rheumatoid arthritis, with a known human safety profile, makes repurposing a clinically tractable strategy [39].
The dose used here nevertheless requires comment, since it exceeds the clinical dose on a milligram-per-kilogram basis. A 4 mg daily dose in a 60 kg adult corresponds to 0.067 mg/kg; applying the conventional body-surface-area conversion factor for the mouse (Km ratio 37/3) gives an allometrically equivalent murine dose of approximately 0.8 mg/kg/day. Our regimen of 10 mg/kg twice daily delivers 20 mg/kg/day and is therefore roughly 24-fold above that equivalent. The margin reflects the substantially faster elimination of baricitinib in rodents, which is also why twice-daily administration was used. It remains a genuine barrier to clinical extrapolation, and dose-ranging studies at exposures closer to the human equivalent, combined with treatment periods longer than the 14 days used here, are required before any clinical inference is drawn. We also note that formal toxicology was not performed: the absence of overt toxicity and the absence of attrition in the treated group do not exclude effects that might emerge with prolonged exposure.
4.4. Limitations
The study has no healthy control group, so the absolute increase in fibrosis relative to normal tissue could not be quantified; model establishment rests on within-animal longitudinal change. Twenty-seven animals were randomised and 23 completed the study, leaving unequal final group sizes of 7, 10 and 6; gene expression could be measured in a smaller subset still (7, 6 and 5). This may explain why the Ashcroft comparison against vehicle and the reduction in cutaneous Col1a1 did not reach significance. Attrition was confined to the two groups that did not receive baricitinib, so the treated group is the one least affected by loss. A conventional scanner rather than a dedicated micro-CT system limited quantitative pulmonary analysis, and bronchoalveolar lavage was not performed. Collagen deposition was assessed qualitatively on Masson’s trichrome sections but was not quantified morphometrically, and no collagen-specific immunohistochemistry was performed; the reduction in collagen deposition we describe therefore rests on dermal thickness and qualitative staining rather than on a direct quantitative measure of collagen. Finally, only one baricitinib dose regimen was tested.
5. Conclusions
In a subcutaneous BLM-induced murine scleroderma model, high-frequency ultrasonography proved a valid and reproducible method for longitudinal in vivo monitoring of dermal fibrosis, with good to excellent intra-observer reliability (ICC 0.88) and strong correlation with histopathological dermal thickness (r = 0.859). It allowed model establishment to be confirmed by within-animal comparison without sacrificing additional animals and permitted the timing of treatment to be based on observation, in keeping with the 3Rs.
The apparent relationship between dermal thickness and pulmonary fibrosis severity disappeared once group was controlled for, indicating that skin ultrasonography cannot serve as a surrogate for lung assessment.
Baricitinib, initiated after fibrosis had become established, reduced dermal thickness and collagen deposition, brought ultrasonographic thickness below baseline during treatment, lowered modified Ashcroft scores, and produced a reduction in cutaneous Col1a1 expression that did not reach significance in the smaller subset available. These findings support JAK1/2 inhibition as a promising antifibrotic strategy in systemic sclerosis. They also offer a methodological framework for future preclinical work: longitudinal ultrasonographic monitoring, combined with multimodal confirmation and molecular assessment.
Supplementary Materials
The following supporting information can be downloaded at: https://www.mdpi.com/article/10.3390/biomedicines14112468/s1, Figure S1, Daily monitoring across the 28-day study; Table S1, Exploratory computed tomography observations on day 28.
Author Contributions
Conceptualisation, S.G. and M.B. (Merih Birlik); methodology, S.G., O.Y. and A.Ç.; software, S.G.; validation, M.B. (Mustafa Barış), B.L. and Ç.U.; formal analysis, S.G.; investigation, S.G., O.Y., M.B. (Mustafa Barış), B.L., Ç.U., D.H. and A.Ç.; resources, O.Y. and A.Ç.; data curation, S.G.; writing—original draft preparation, S.G.; writing—review and editing, M.B. (Merih Birlik) and O.Y.; visualisation, S.G.; supervision, O.Y. and M.B. (Merih Birlik); project administration, S.G.; funding acquisition, S.G. All authors have read and agreed to the published version of the manuscript.
Funding
This research was funded by the Turkish Society of Rheumatology, grant number TRD-AD/140.
Institutional Review Board Statement
The animal study protocol was approved by the Animal Experiments Local Ethics Committee of Dokuz Eylul University (protocol code 39/2020, approved 9 December 2020). All procedures were performed in accordance with the ARRIVE guidelines and the 3Rs principles.
Informed Consent Statement
Not applicable.
Data Availability Statement
The data presented in this study are available on request from the corresponding author. The data are not publicly available because they were generated as part of an MSc thesis archived at the Institute of Health Sciences of Dokuz Eylul University and have not been deposited in a public repository.
Conflicts of Interest
The authors declare no conflicts of interest.
Abbreviations
The following abbreviations are used in this manuscript:
| BLM | bleomycin |
| CT | computed tomography |
| HFUS | high-frequency ultrasonography |
| H&E | haematoxylin and eosin |
| ICC | intraclass correlation coefficient |
| JAK | Janus kinase |
| SSc | systemic sclerosis |
| SSc-ILD | systemic sclerosis-associated interstitial lung disease |
| STAT | signal transducer and activator of transcription |
| TGF-β | transforming growth factor beta |
References
- Jin, W.; Zheng, Y.; Zhu, P. T Cell Abnormalities in Systemic Sclerosis. Autoimmun. Rev. 2022, 21, 103185. [Google Scholar] [CrossRef] [Scilit] [PubMed]
- Liu, M. The Immune Landscape of Systemic Sclerosis: From Pathogenic Mechanisms to Precision Therapeutic Breakthroughs. Front. Immunol. 2026, 17, 1713221. [Google Scholar] [CrossRef] [Scilit] [PubMed]
- Nagib, L.; Kumar, A.S.; Stratton, R. Understanding the Role of Epithelial Cells in the Pathogenesis of Systemic Sclerosis. Cells 2025, 14, 962. [Google Scholar] [CrossRef] [Scilit] [PubMed]
- Tyndall, A.J.; Bannert, B.; Vonk, M.; Airò, P.; Cozzi, F.; Carreira, P.E.; Bancel, D.F.; Allanore, Y.; Müller-Ladner, U.; Distler, O.; et al. Causes and Risk Factors for Death in Systemic Sclerosis: A Study from the EULAR Scleroderma Trials and Research (EUSTAR) Database. Ann. Rheum. Dis. 2010, 69, 1809–1815. [Google Scholar] [CrossRef] [Scilit] [PubMed]
- Steen, V.D.; Medsger, T.A. Changes in Causes of Death in Systemic Sclerosis, 1972–2002. Ann. Rheum. Dis. 2007, 66, 940–944. [Google Scholar] [CrossRef] [Scilit] [PubMed]
- Vaskeikina, M.; Ugolkov, Y.; Kireev, B.; Peskov, K.; Volkova, A. Systematic Review and Model-Based Meta-Analysis of Targeted Drugs for Systemic Sclerosis. Pharmaceutics 2026, 18, 250. [Google Scholar] [CrossRef] [Scilit] [PubMed]
- Christner, P.J.; Jimenez, S.A. Animal Models of Systemic Sclerosis: Insights into Systemic Sclerosis Pathogenesis and Potential Therapeutic Approaches. Curr. Opin. Rheumatol. 2004, 16, 746–752. [Google Scholar] [CrossRef] [Scilit] [PubMed]
- Watanabe, T.; Nishimoto, T.; Mlakar, L.; Heywood, J.; Malaab, M.; Hoffman, S.; Feghali-Bostwick, C. Optimization of a Murine and Human Tissue Model to Recapitulate Dermal and Pulmonary Features of Systemic Sclerosis. PLoS ONE 2017, 12, e0179917. [Google Scholar] [CrossRef] [Scilit] [PubMed]
- Kaloudi, O.; Bandinelli, F.; Filippucci, E.; Conforti, M.L.; Miniati, I.; Guiducci, S.; Porta, F.; Candelieri, A.; Conforti, D.; Grassiri, G.; et al. High Frequency Ultrasound Measurement of Digital Dermal Thickness in Systemic Sclerosis. Ann. Rheum. Dis. 2010, 69, 1140–1143. [Google Scholar] [CrossRef] [Scilit] [PubMed]
- Sulli, A.; Ruaro, B.; Smith, V.; Paolino, S.; Pizzorni, C.; Pesce, G.; Cutolo, M. Subclinical Dermal Involvement Is Detectable by High Frequency Ultrasound Even in Patients with Limited Cutaneous Systemic Sclerosis. Arthritis Res. Ther. 2017, 19, 61. [Google Scholar] [CrossRef] [Scilit] [PubMed]
- Talotta, R. The Rationale for Targeting the JAK/STAT Pathway in Scleroderma-Associated Interstitial Lung Disease. Immunotherapy 2021, 13, 241–256. [Google Scholar] [CrossRef] [Scilit] [PubMed]
- Bryon, J.; Wasson, C.W.; Koeppen, K.; Chandler, F.; Willis, L.F.; Di Donato, S.; Klein, E.; Zeqiraj, E.; Ross, R.L.; Del Galdo, F. Systemic Sclerosis Dermal Fibroblast Exosomes Trigger Type 1 Interferon Responses in Keratinocytes via a TBK/JAK/STAT Signaling Axis. Arthritis Rheumatol. 2025, 77, 322–334. [Google Scholar] [CrossRef] [Scilit] [PubMed]
- Kitanaga, Y.; Imamura, E.; Nakahara, Y.; Fukahori, H.; Fujii, Y.; Kubo, S.; Nakayamada, S.; Tanaka, Y. In Vitro Pharmacological Effects of Peficitinib on Lymphocyte Activation: A Potential Treatment for Systemic Sclerosis with JAK Inhibitors. Rheumatology 2020, 59, 1957–1968. [Google Scholar] [CrossRef] [Scilit] [PubMed]
- Wang, W.; Bhattacharyya, S.; Marangoni, R.G.; Carns, M.; Dennis-Aren, K.; Yeldandi, A.; Wei, J.; Varga, J. The JAK/STAT Pathway Is Activated in Systemic Sclerosis and Is Effectively Targeted by Tofacitinib. J. Scleroderma Relat. Disord. 2020, 5, 40–50. [Google Scholar] [CrossRef] [Scilit] [PubMed]
- Dees, C.; Tomcik, M.; Palumbo-Zerr, K.; Distler, A.; Beyer, C.; Lang, V.; Horn, A.; Zerr, P.; Zwerina, J.; Gelse, K.; et al. JAK-2 as a Novel Mediator of the Profibrotic Effects of Transforming Growth Factor β in Systemic Sclerosis. Arthritis Rheum. 2012, 64, 3006–3015. [Google Scholar] [CrossRef] [Scilit] [PubMed]
- Pedroza, M.; Le, T.T.; Lewis, K.; Karmouty-Quintana, H.; To, S.; George, A.T.; Blackburn, M.R.; Tweardy, D.J.; Agarwal, S.K. STAT-3 Contributes to Pulmonary Fibrosis through Epithelial Injury and Fibroblast-Myofibroblast Differentiation. FASEB J. 2016, 30, 129–140. [Google Scholar] [CrossRef] [Scilit] [PubMed]
- Chakraborty, D.; Šumová, B.; Mallano, T.; Chen, C.-W.; Distler, A.; Bergmann, C.; Ludolph, I.; Horch, R.E.; Gelse, K.; Ramming, A.; et al. Activation of STAT3 Integrates Common Profibrotic Pathways to Promote Fibroblast Activation and Tissue Fibrosis. Nat. Commun. 2017, 8, 1130, Correction in Nat. Commun. 2021, 12, 7259. [Google Scholar] [CrossRef] [Scilit] [PubMed]
- Deverapalli, S.C.; Rosmarin, D. The Use of JAK Inhibitors in the Treatment of Progressive Systemic Sclerosis. J. Eur. Acad. Dermatol. Venereol. 2018, 32, e328. [Google Scholar] [CrossRef] [Scilit] [PubMed]
- Hou, Z.; Su, X.; Han, G.; Xue, R.; Chen, Y.; Chen, Y.; Wang, H.; Yang, B.; Liang, Y.; Ji, S. JAK1/2 Inhibitor Baricitinib Improves Skin Fibrosis and Digital Ulcers in Systemic Sclerosis. Front. Med. 2022, 9, 859330, Correction in Front. Med. 2023, 9, 1125836. [Google Scholar] [CrossRef] [Scilit] [PubMed]
- You, H.; Xu, D.; Zhao, J.; Li, J.; Wang, Q.; Tian, X.; Li, M.; Zeng, X. JAK Inhibitors: Prospects in Connective Tissue Diseases. Clin. Rev. Allergy Immunol. 2020, 59, 334–351. [Google Scholar] [CrossRef] [Scilit] [PubMed]
- Yamamoto, T.; Takagawa, S.; Katayama, I.; Yamazaki, K.; Hamazaki, Y.; Shinkai, H.; Nishioka, K. Animal Model of Sclerotic Skin. I: Local Injections of Bleomycin Induce Sclerotic Skin Mimicking Scleroderma. J. Investig. Dermatol. 1999, 112, 456–462. [Google Scholar] [CrossRef] [Scilit] [PubMed]
- Yamamoto, T.; Nishioka, K. Animal Model of Sclerotic Skin. IV: Induction of Dermal Sclerosis by Bleomycin Is T Cell Independent. J. Investig. Dermatol. 2001, 117, 999–1001. [Google Scholar] [CrossRef] [Scilit] [PubMed][Green Version]
- Foster, F.S.; Zhang, M.Y.; Zhou, Y.Q.; Liu, G.; Mehi, J.; Cherin, E.; Harasiewicz, K.A.; Starkoski, B.G.; Zan, L.; Knapik, D.A.; et al. A New Ultrasound Instrument for In Vivo Microimaging of Mice. Ultrasound Med. Biol. 2002, 28, 1165–1172. [Google Scholar] [CrossRef] [Scilit] [PubMed]
- Schneider, C.A.; Rasband, W.S.; Eliceiri, K.W. NIH Image to ImageJ: 25 Years of Image Analysis. Nat. Methods 2012, 9, 671–675. [Google Scholar] [CrossRef] [Scilit] [PubMed]
- Ashcroft, T.; Simpson, J.M.; Timbrell, V. Simple Method of Estimating Severity of Pulmonary Fibrosis on a Numerical Scale. J. Clin. Pathol. 1988, 41, 467–470. [Google Scholar] [CrossRef] [Scilit] [PubMed]
- Hübner, R.H.; Gitter, W.; El Mokhtari, N.E.; Mathiak, M.; Both, M.; Bolte, H.; Freitag-Wolf, S.; Bewig, B. Standardized Quantification of Pulmonary Fibrosis in Histological Samples. Biotechniques 2008, 44, 507–517. [Google Scholar] [CrossRef] [Scilit] [PubMed]
- Livak, K.J.; Schmittgen, T.D. Analysis of Relative Gene Expression Data Using Real-Time Quantitative PCR and the 2–ΔΔCT Method. Methods 2001, 25, 402–408. [Google Scholar] [CrossRef] [Scilit] [PubMed]
- Karatas, A.; Oz, B.; Celik, C.; Akar, Z.A.; Akkoc, R.F.; Etem, E.O.; Dagli, A.F.; Koca, S.S. Tofacitinib and Metformin Reduce the Dermal Thickness and Fibrosis in Mouse Model of Systemic Sclerosis. Sci. Rep. 2022, 12, 2553. [Google Scholar] [CrossRef] [Scilit] [PubMed]
- Bellamri, N.; Lelong, M.; Joannes, A.; Le Tallec, E.; Jouneau, S.; Vernhet, L.; Lescoat, A.; Lecureur, V. Effects of Ruxolitinib on Fibrosis in Preclinical Models of Systemic Sclerosis. Int. Immunopharmacol. 2023, 116, 109723. [Google Scholar] [CrossRef] [Scilit] [PubMed]
- Wang, D.; Wei, Y.; Xu, L.; Zhang, J. Crosstalk between the JAK2 and TGF-β1 Signaling Pathways in Scleroderma-Related Interstitial Lung Disease Targeted by Baricitinib. Adv. Rheumatol. 2023, 63, 22. [Google Scholar] [CrossRef] [Scilit] [PubMed]
- Gu, S.; Liang, J.; Zhang, J.; Liu, Z.; Miao, Y.; Wei, Y.; Li, S.; Gu, J.; Cui, Y.; Xiao, T.; et al. Baricitinib Attenuates Bleomycin-Induced Pulmonary Fibrosis in Mice by Inhibiting TGF-β1 Signaling Pathway. Molecules 2023, 28, 2195. [Google Scholar] [CrossRef] [Scilit] [PubMed]
- Huang, H.; Hui, M.; Yuan, L.; Xu, S.; Zhou, J.; Duan, X.; Luo, H.; Li, M.; Zeng, X.; Xu, D. Real-World Efficacy and Safety of Tofacitinib on the Progression of Skin Sclerosis in Patients with Systemic Sclerosis: An Analysis of National Multicenter Data from the Chinese Rheumatism Data Center. J. Am. Acad. Dermatol. 2026, 95, 507–509. [Google Scholar] [CrossRef] [Scilit] [PubMed]
- Zhou, J.; Gao, M.; Zhang, S.; Lu, X.; Lei, Z.; Cheng, T.; Liu, Y.; Chu, T.; Shi, L. Retrospective Comparative Study of the Efficacy of JAK Inhibitor (Tofacitinib) in the Treatment of Systemic Sclerosis-Associated Interstitial Lung Disease. Clin. Rheumatol. 2023, 42, 2823–2832. [Google Scholar] [CrossRef] [Scilit] [PubMed]
- Labrandero Hoyos, C.; Peñuelas Leal, R.; Echevarría, A.G.; Lorca Spröhnle, J.; Magdaleno Tapial, J.; Finello, M.; Imbernon, D.B.; Pérez Ferriols, A.; Zaragoza Ninet, V. JAK–STAT Pathway Is Involved in Cutaneous Sclerosis Processes: Generalized Morphea Successfully Treated with Baricitinib. J. Dermatol. 2023, 50, e424–e425. [Google Scholar] [CrossRef] [Scilit] [PubMed]
- Şener, S.; Şener, Y.Z.; Batu, E.D.; Sarı, A.; Akdoğan, A. Janus Kinase Inhibitors in Localized Scleroderma: A Systematic Literature Review. Turk. J. Med. Sci. 2025, 55, 533–539. [Google Scholar] [CrossRef] [Scilit] [PubMed]
- Damsky, W.; Patel, D.; Garelli, C.J.; Garg, M.; Wang, A.; Dresser, K.; Deng, A.; Harris, J.E.; Richmond, J.; King, B. Jak Inhibition Prevents Bleomycin-Induced Fibrosis in Mice and Is Effective in Patients with Morphea. J. Investig. Dermatol. 2020, 140, 1446–1449.e4. [Google Scholar] [CrossRef] [Scilit] [PubMed]
- Sassetti, C.; Borrelli, C.; Mazuy, M.; Guerriero, C.; Rigante, D.; Esposito, S. New Challenging Systemic Therapies for Juvenile Scleroderma: A Comprehensive Review. Pharmaceuticals 2025, 18, 643. [Google Scholar] [CrossRef] [Scilit] [PubMed]
- Stein, T.; Cieplewicz-Guźla, P.; Iżykowska, K.; Pieniawska, M.; Żaba, R.; Dańczak-Pazdrowska, A.; Polańska, A. What Is New in Morphea—Narrative Review on Molecular Aspects and New Targeted Therapies. J. Clin. Med. 2024, 13, 7134. [Google Scholar] [CrossRef] [Scilit] [PubMed]
- Gremese, E.; Alivernini, S.; Tolusso, B.; Zeidler, M.P.; Ferraccioli, G. JAK Inhibition by Methotrexate (and csDMARDs) May Explain Clinical Efficacy as Monotherapy and Combination Therapy. J. Leukoc. Biol. 2019, 106, 1063–1068. [Google Scholar] [CrossRef] [Scilit] [PubMed]

Disclaimer/Publisher’s Note: The statements, opinions and data contained in all publications are solely those of the individual author(s) and contributor(s) and not of MDPI and/or the editor(s). MDPI and/or the editor(s) disclaim responsibility for any injury to people or property resulting from any ideas, methods, instructions or products referred to in the content. |
© 2026 by the authors. Licensee MDPI, Basel, Switzerland. This article is an open access article distributed under the terms and conditions of the Creative Commons Attribution (CC BY) license.