


Abstract
Background/Objectives: Blue-light photobiomodulation (PBM) modulates inflammation and tissue repair, but its effects on cutaneous neuroimmune interactions remain unclear. We assessed marker co-expression in mast cells (MCs) and NSE-positive profiles, together with their spatial relationship, during acute wound healing. Methods: Fifteen male CD1 mice each received two dorsal wounds: one was treated once with blue light (410–430 nm, 20.6 J/cm2) (TW), while the other was shielded from irradiation and served as the untreated wound (UTW). Unwounded control skin (CTRL) was obtained from five separate mice. Immunofluorescence was used to assess marker co-expression in avidin-positive MCs and NSE-positive profiles at 24, 48 and 144 h. Measurements from two microscopic fields were averaged for each animal and tissue condition (n = 5 mice per time point, with paired TW and UTW samples; n = 5 separate CTRL mice). TW–UTW data were analysed by two-way repeated-measures ANOVA with Sidak’s test; CTRL comparisons were analysed by two-tailed, unpaired Mann–Whitney U tests. Results: At all time points, TWs showed significantly higher MC marker positivity for CGRP, NKA, NPY, NSE, PGP9.5 and SP than UTWs; VIP was lower at 24 h, and NGF higher at 144 h. The percentages of NSE-positive profiles co-expressing each of the eight markers were significantly higher in TWs than in UTWs at 24 h; no TW–UTW differences were detected at 48 or 144 h. Compared with CTRL, six MC markers were higher in TWs at 24 and 48 h and five at 144 h; all eight neuronal markers were higher in TWs at 24 h, with later CTRL differences being marker-specific. MC–neuronal distances were numerically shorter in TWs at all time points, but the difference was significant only at 24 h. Conclusions: Blue-light PBM was associated with differences in MC marker co-expression at all assessed time points, whereas differences in NSE-positive profiles were detected only at 24 h. These findings support PBM-associated remodelling of the cutaneous neuroimmune profile.
1. Introduction
Wound healing represents a complex and finely coordinated process in which haemostasis, inflammation, cell proliferation and tissue remodelling are integrated upon continuous cellular and molecular crosstalk [1]. In recent years, increasing attention has been devoted to photobiomodulation (PBM) as a non-invasive approach capable of modulating cellular metabolism, inflammatory responses, tissue repair and pain [2,3,4,5,6]. Our previous studies [7,8,9,10,11] contributed to defining the biological effects of blue-light PBM (410–430 nm) in the early phases of cutaneous wound healing. In vitro studies have shown that blue light affects fibroblast and keratinocyte metabolism and proliferation in a dose- and cell-dependent manner. In murine models of acute wounds, blue-light PBM has been associated with changes in inflammatory-cell recruitment, MC activation, vascular responses, platelet-derived growth factor (PDGF) expression and collagen deposition.
A growing body of evidence suggests that wound healing should not be interpreted solely as an inflammatory and stromal process involving skin-resident cells, but also as a neuroimmune event in which cutaneous innervation actively participates, giving rise to a complex cutaneous neuroimmune network [12,13,14,15]. Indeed, the skin is a densely innervated immune organ in which sensory and autonomic nerve fibres interact with keratinocytes, fibroblasts, endothelial cells and resident or recruited immune cells. After injury, peripheral nerve endings release several neuropeptides, including substance P (SP), calcitonin gene-related peptide (CGRP), neurokinin A (NKA), neuropeptide Y (NPY) and vasoactive intestinal peptide (VIP), which are involved in vasodilation, vascular permeability, immune-cell recruitment, pain, angiogenesis, fibroblast activity and epithelial repair [16,17,18]. On the other hand, immune and stromal cells release cytokines, chemokines, growth factors and inflammatory mediators that influence nerve excitability, neuropeptide expression and local neural remodelling [12,13,15].
In this context, cutaneous neuronal structures represent an active component of the wound microenvironment rather than a passive anatomical compartment. The skin contains a complex network of sensory and autonomic nerve fibres, including free nerve endings, perivascular fibres and nerve fibres associated with adnexal structures, which participate in neurogenic inflammation and tissue repair [19,20]. Sensory neuropeptides such as SP, CGRP and NKA contribute to vascular responses, immune-cell recruitment and pain signalling, whereas NPY is mainly associated with autonomic neuroimmune regulation [16,18,21]. At the same time, PGP9.5 represents a widely used marker of peripheral nerve fibres and neural remodelling [22], while nerve growth factor (NGF) acts as a key neurotrophic mediator involved in nerve survival, as well as in the neuroimmune communication, through its effect on immune cells, including MCs [23,24]. Analysis of these neural-associated markers and mediators may help characterize the neural component of the cutaneous response to PBM during wound healing. MCs are well-positioned to act as intermediaries between the wound microenvironment and neuroimmune signalling. Indeed, they are abundant in the dermis and are strategically located in close proximity to blood vessels and peripheral nerve fibres, where they can rapidly respond to physical, chemical, immune and neuronal stimuli [25,26,27]. Once activated, MCs release preformed mediators, such as histamine, heparin and proteases, together with newly synthesised cytokines, chemokines, lipid mediators and growth factors, thereby contributing to vascular permeability, leukocyte recruitment, fibroblast activity, angiogenesis, extracellular matrix remodelling and re-epithelialization [28,29]. In addition to these classical mediators, MCs may also participate in local nitric oxide signalling. In experimental models of tissue injury, inducible nitric oxide synthase (iNOS/NOS2) expression has been localized to MCs and associated with the modulation of inflammatory, vascular and reparative responses. Together, these studies support a potential role for MC-associated NO signaling in tissue repair [30,31]. Notably, iNOS expression has also been documented in NSE-positive neuronal structures within chronic cutaneous wounds and was enhanced after photodynamic treatment, supporting the potential involvement of neuronal nitrosative signalling in the neuroimmune regulation of wound healing [32]. Moreover, MCs express receptors for several neuropeptides and can be activated by neuronal signals, while MC-derived mediators can in turn modulate nerve activity and neurogenic inflammation [27,33,34].
On the basis of our previous evidence, showing that blue light PBM modulates inflammatory response and tissue repair in wound healing [7,9,35], and considering the established reciprocal crosstalk between MCs and cutaneous nerve fibres in neurogenic inflammation [21,26,36,37], we hypothesized that PBM could affect the immunophenotypes of MCs and local neuronal structures in injured skin. We therefore used immunofluorescence to assess selected markers in avidin-positive MCs and NSE-positive profiles in treated wounds (TWs) and untreated wounds (UTWs) at defined time points after injury. We also evaluated the spatial relationship between these compartments.
2. Materials and Methods
2.1. Animal Model of Acute Wounds and Irradiation Procedure
The present study used archived skin samples collected during the original animal experiments conducted within the project “LED Technology in Photo Haemostasis” (LighTPatcH). The original project was authorized by the Italian Ministry of Health (authorization no. 791/2016-PR, issued on 8 August 2016) under Article 31 of Italian Legislative Decree no. 26/2014. The present investigation involved additional analyses of previously collected tissue samples; no additional live animal procedures were performed for these analyses. The animal procedures followed the authorized experimental protocol and are briefly summarized below; further details have been reported previously [35].
Twenty healthy male CD1 mice (Mus musculus), three weeks of age and weighing 15–20 g (Envigo, Udine, Italy), were used in the original experiments conducted at the Centro di Stabulazione Animali di Laboratorio (CeSAL), University of Florence, Florence, Italy. The animals were not genetically modified and had not undergone any previous experimental procedures. Eligibility criteria were physiological health and an age-appropriate body weight. No additional animal exclusion criteria were specified, and no animals were excluded from any experimental group during the original experiments. Upon arrival at CeSAL, animals underwent a one-week quarantine and acclimatization period before the experimental procedures. Housing conditions followed CeSAL procedures and included a 12 h light/dark cycle, controlled ambient temperature, ad libitum access to water and standard rodent pellets, and cotton nesting material. Animals were randomized, weighed and anesthetized by intraperitoneal administration of ketamine (80–100 mg/kg) and xylazine (10 mg/kg). During weighing, animals were individually numbered using a marker on the tail, and their identification numbers were recorded together with the corresponding cage numbers. After the dorsal skin was shaved with an electric clipper, two spatially separated circular areas, each 1 cm in diameter, were delineated in the rostral and caudal regions. A mechanical abrasor was used to create a superficial wound confined to the papillary dermis in each of the two marked areas. Before wound induction, the rostral or caudal site was randomly assigned to blue-light treatment by drawing lots, performed by the investigator responsible for the experiments. Allocation preceded wound induction to prevent wound appearance from influencing treatment assignment. One wound in each animal was irradiated (TW), while the other one was shielded from light exposure and served as the untreated wound (UTW), providing a within-animal comparison. The order of procedures across time-point groups was determined by the scheduled tissue-collection times.
Blue light was delivered to the TW using a specific prototype device [38,39,40,41] at 410–430 nm, with an irradiance of 0.69 W/cm2 and a treatment duration of 30 s, corresponding to a dose of 20.6 J/cm2. The fiber tip was kept in continuous slow motion over the wound surface. The UTW was covered with sterile gauze during irradiation. Following treatment, topical antibiotic powder (Streptosil, Cheplapharm Arzneimittel GmbH, Greifswald, Germany) was applied to the wound, and Carprofen (5 mg/kg) was administered subcutaneously for analgesia. Following the procedures, animals were monitored on a heating pad maintained at 37 °C until recovery from anesthesia, assessed by checking paw withdrawal reflexes. Animals were then returned to cages organized by observation time point, without exceeding the permitted housing density.
Unwounded control skin (CTRL) was obtained from a separate experimental group of physiologically healthy mice. These animals underwent anesthesia and dorsal shaving, and two circular areas of the same dimensions were delineated without inducing wounds. One area was exposed to blue light using the same device, treatment procedures and irradiation parameters as in the wounded group, while the other remained unirradiated. Only intact skin from the non-irradiated area was used as CTRL in the present study.
Five wounded animals were sacrificed at each observation time point (24, 48 and 144 h). Five separate unwounded animals provided CTRL samples, giving a total of 20 animals. Each wounded animal provided TW and UTW samples, whereas each unwounded animal provided non-irradiated intact skin as CTRL.
Archived samples were subsequently used for immunofluorescence analyses described in Section 2.2. Immunofluorescence quantification was performed by a trained operator blinded to treatment allocation, as detailed in Section 2.2. The individual wound was the experimental unit for allocation of blue light treatment, with the animal serving as a block. TW and UTW samples were paired within animals, whereas CTRL samples originated from separate animals. Microscopic fields represented subsamples within each tissue sample.
2.2. Immunofluorescence Protocol
Skin biopsies were embedded in Tissue-Tek (Killik, Bio Optica, Milan, Italy), rapidly frozen at −80 °C and sectioned at 7 µm using a cryostat (Thermo HM 525, Bio-Optica, Florence, Italy). For immunofluorescence, tissue sections were incubated with primary antibodies against CGRP, iNOS, VIP, NKA (all from Abcam, Cambridge, UK; diluted 1:50). Additional primary antibodies were directed against NGF and PGP9.5 (Abcam, Cambridge, UK, 1:250), NPY (Genetex, Irvine, CA, USA, prediluted) and substance P (SP) (Abcam, Cambridge, UK, 1:100). MCs were labelled by rhodamine-conjugated avidin staining (1:400; Sigma-Aldrich, Milan, Italy). Avidin-positive MCs were analysed for co-expression of CGRP, NKA, NPY, NSE, PGP9.5, SP, VIP and NGF. Neuronal structures were identified by neuron-specific enolase (NSE) immunoreactivity (Abcam, Cambridge, UK, 1:150) and analysed for co-expression of CGRP, NKA, NPY, iNOS, PGP9.5, SP, NGF and VIP.
All primary antibodies were used according to the manufacturer’s instructions. Appropriate fluorescein isothiocyanate (FITC) and tetramethylrhodamine isothiocyanate (TRITC)-conjugated secondary antibodies (1:32; Sigma-Aldrich, Milan, Italy) were used for detection. Primary antibodies were incubated overnight at 4 °C, followed by incubation with the appropriate secondary antibodies for 2 h at 37 °C. The omission of the primary antibody and substitution with an irrelevant one were used as negative controls for the immunofluorescence reactions.
Immunostained sections were examined individually, and non-overlapping fields of the dermis were photographed at 40× magnification. Epifluorescence images were captured by a Zeiss Axioskop microscope equipped with a digital camera (Zeiss, Jena, Germany) and connected to a PC (ED, Rome, Italy) running Axiovision 4 software (Zeiss, Jena, Germany). For each marker, image acquisition settings were established before image collection and kept constant across all experimental groups and time points. The same criteria for identifying positive cells or neuronal profiles and assessing co-localization were applied throughout by an investigator blinded to treatment allocation and sampling time point. For each animal and tissue condition, two non-overlapping microscopic fields with the highest cell density were selected for analysis. For MC analysis, the percentage of double-positive cells was calculated as the number of marker-positive, avidin-positive MCs divided by the total number of avidin-positive MCs in the field, multiplied by 100. For neuronal-profile analysis, the percentage was calculated for each field as the number of NSE-positive profiles co-expressing the marker of interest divided by the total number of NSE-positive profiles, multiplied by 100. For each marker and tissue condition, the percentages from the two fields were averaged to obtain one animal-level value. MCs were identified based on their tissue localization, characteristic morphology, and typical cytoplasmic granules. NSE-labelled neuronal structures were identified by the presence of a nucleated cell body and filamentous processes consistent with neurites. These cells were distinguishable from other structures typically found in the dermis, such as Merkel cells, nerve fibers, or hair follicles.
Experiments and sample quantification were performed by a trained operator blinded to treatment allocation and sampling time point. Allocation information was known only to the investigator responsible for the animal experiments and the technical specialist responsible for the irradiation device, neither of whom participated in the biological analyses.
2.3. Measurement of the Distance Between Mast Cells and Neuronal Structures
The distance between MCs and neuronal structures was assessed as previously described [42]. Briefly, images from TWs and UTWs were analysed separately. For each animal, the mean of the two field-level distance measurements was used to obtain one value per wound condition. MCs were identified by avidin-rhodamine staining, whereas neuronal structures were identified by NSE immunoreactivity. Digital images were analysed using ImageJ/Fiji version 1.54p [43] after spatial calibration. Within each field, the centre-to-centre distance from each avidin-positive MC to the nearest NSE-positive profile was measured as a straight line in the two-dimensional image plane and expressed in micrometres.
2.4. Statistical Analyses
Statistical analyses were performed using GraphPad Prism version 8.0.2 (GraphPad Software, San Diego, CA, USA). The individual wound was the experimental unit for the allocation of blue-light treatment, with the animal serving as a block. TW and UTW samples were paired within animals, whereas CTRL samples originated from separate animals. The analyses included five wounded animals per time point (24, 48 and 144 h), each providing paired TW and UTW samples, and five separate unwounded animals providing CTRL skin. The same five CTRL animals were used as the reference group for comparisons at all three time points. Microscopic fields represented subsamples within each tissue sample. For MC analysis, the percentage of double-positive cells was calculated as the number of marker-positive, avidin-positive MCs divided by the total number of avidin-positive MCs in the field, multiplied by 100. For neuronal-profile analysis, the percentage was calculated as the number of NSE-positive profiles co-expressing the marker of interest divided by the total number of NSE-positive profiles in the field, multiplied by 100. The percentages from the two fields were averaged to obtain one animal-level value for each marker and tissue condition. Microscopic fields were treated as subsamples, not as independent experimental replicates. For each marker and for animal-level MC–neuronal distances, TW and UTW data were analysed by two-way repeated-measures ANOVA, with wound condition (TW vs. UTW) as the within-animal factor and time (24, 48 and 144 h) as the between-animal factor. Sidak’s multiple-comparisons test was used to compare TW and UTW at each time point; Sidak-adjusted p-values < 0.05 were considered statistically significant. CTRL was compared separately with each TW and UTW group at each time point using two-tailed, unpaired Mann–Whitney U tests. These comparisons were exploratory, and were not adjusted for multiple testing; the resulting p-values are therefore nominal and were not interpreted as confirmatory evidence. Data are presented as mean ± SD, with individual animal values shown in the paired TW–UTW plots.
3. Results
3.1. PBM Modulates the Mast Cell Phenotype During Wound Healing
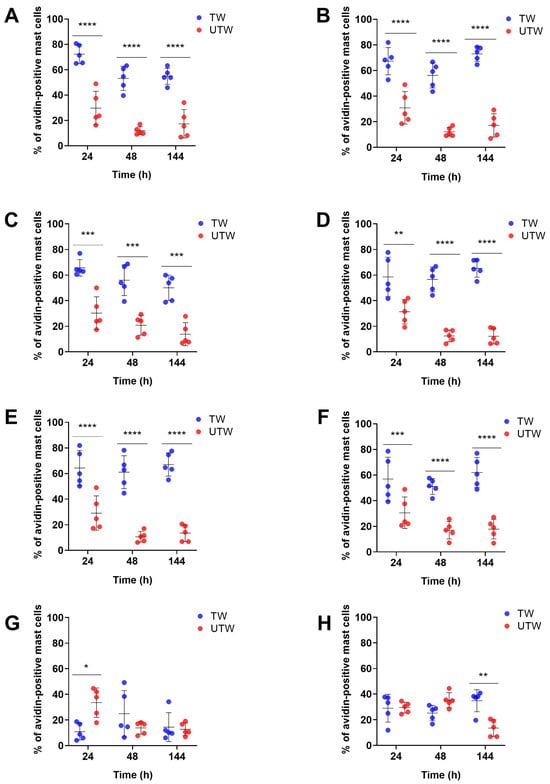
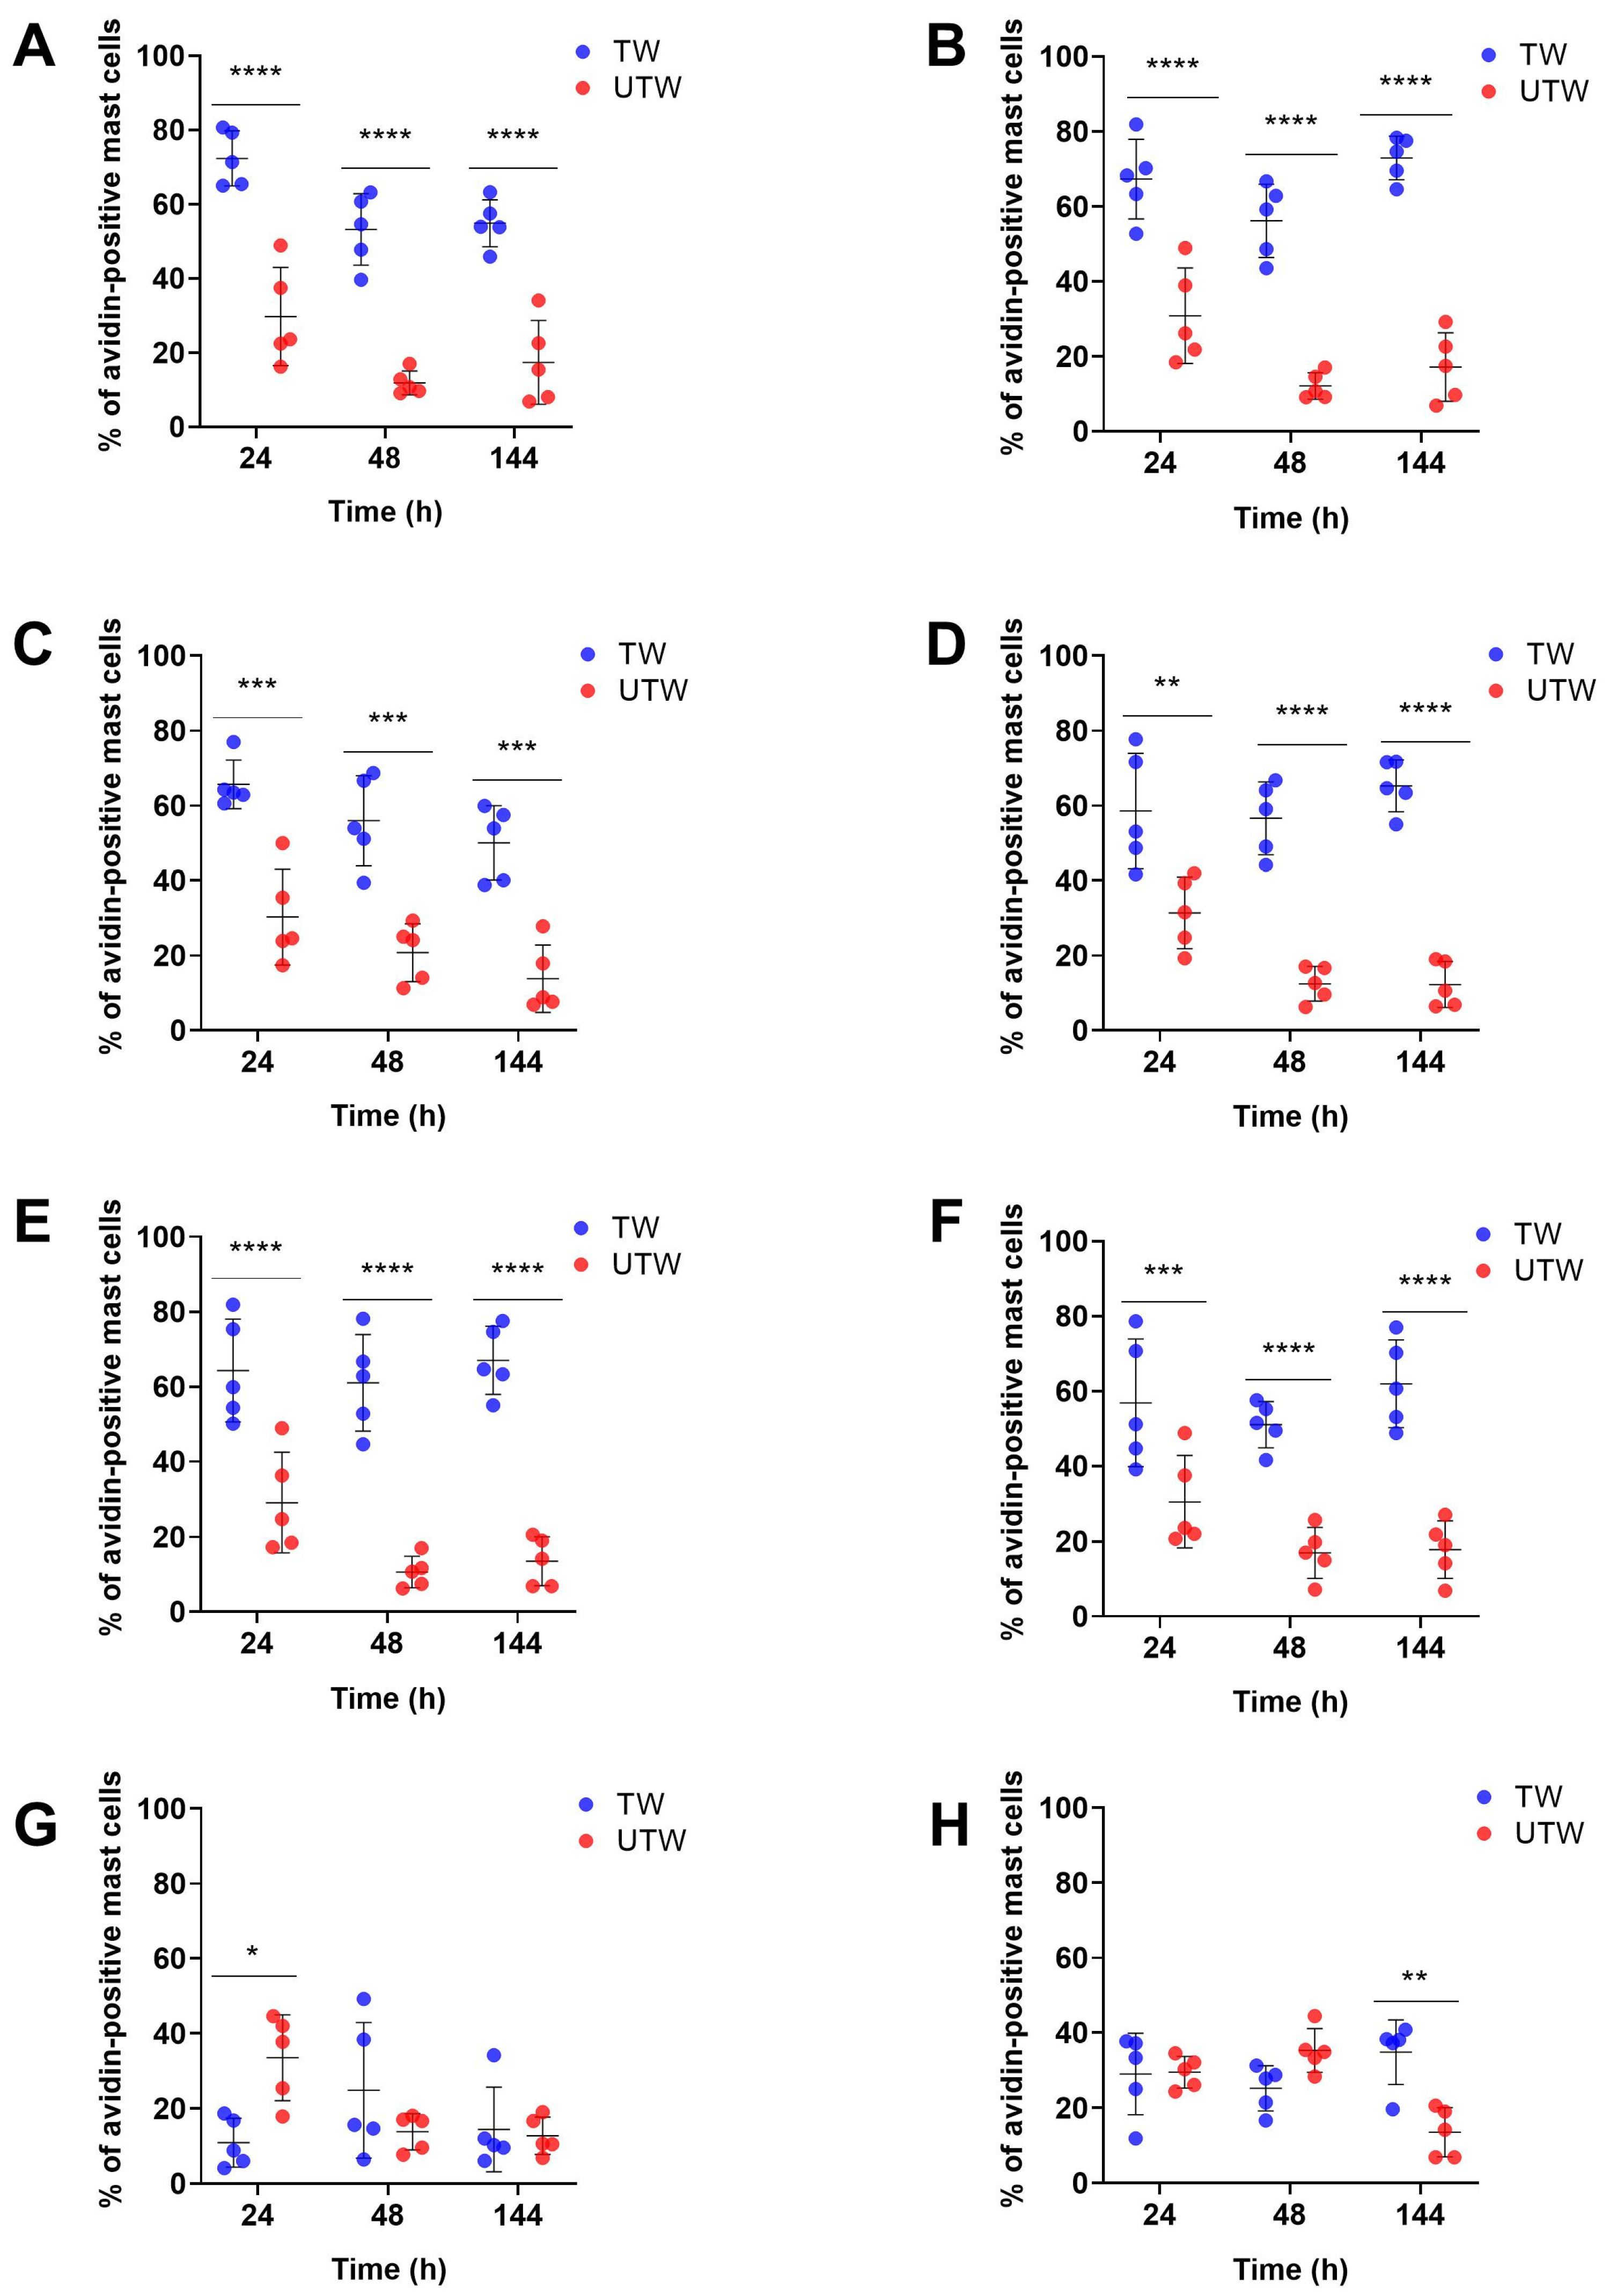
Paired comparisons showed significantly higher percentages of avidin-positive MCs co-expressing CGRP, NKA, NPY, NSE, PGP9.5 or SP in TWs than in UTWs at 24, 48 and 144 h (Figure 1). At 24 h, the percentage of VIP-positive MCs was significantly lower in TWs than in UTWs, whereas avidin+/NGF-positive cells did not differ significantly between the two wound conditions. No statistically significant TW–UTW differences were detected for VIP or NGF at 48 h. At 144 h, the percentage of NGF-positive MCs was significantly higher in TWs than in UTWs, while VIP did not differ significantly between the wound conditions.
Figure 1.
Animal-level comparison of avidin+/marker+ cells in TW (blue) and UTW (red). The graphs show the percentages of avidin-positive MCs positive for each marker at 24, 48 and 144 h after injury: (A) CGRP, (B) NKA, (C) NPY, (D) NSE, (E) PGP9.5, (F) SP, (G) VIP and (H) NGF. Each point represents one mouse-level value, obtained by averaging the measurements from two microscopic fields per animal (n = 5 animals per time point); TW and UTW values from the same animal were paired. Data are shown as mean ± SD. Statistical analysis was performed using two-way repeated-measures ANOVA, with wound condition as the within-subject factor and time as the between-subject factor, followed by Sidak’s multiple-comparisons test. * p < 0.05, ** p < 0.01, *** p < 0.001, **** p < 0.0001.
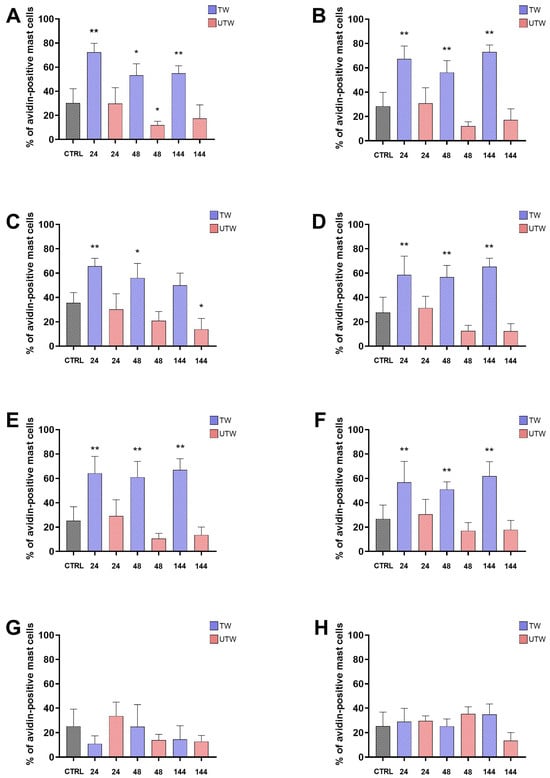
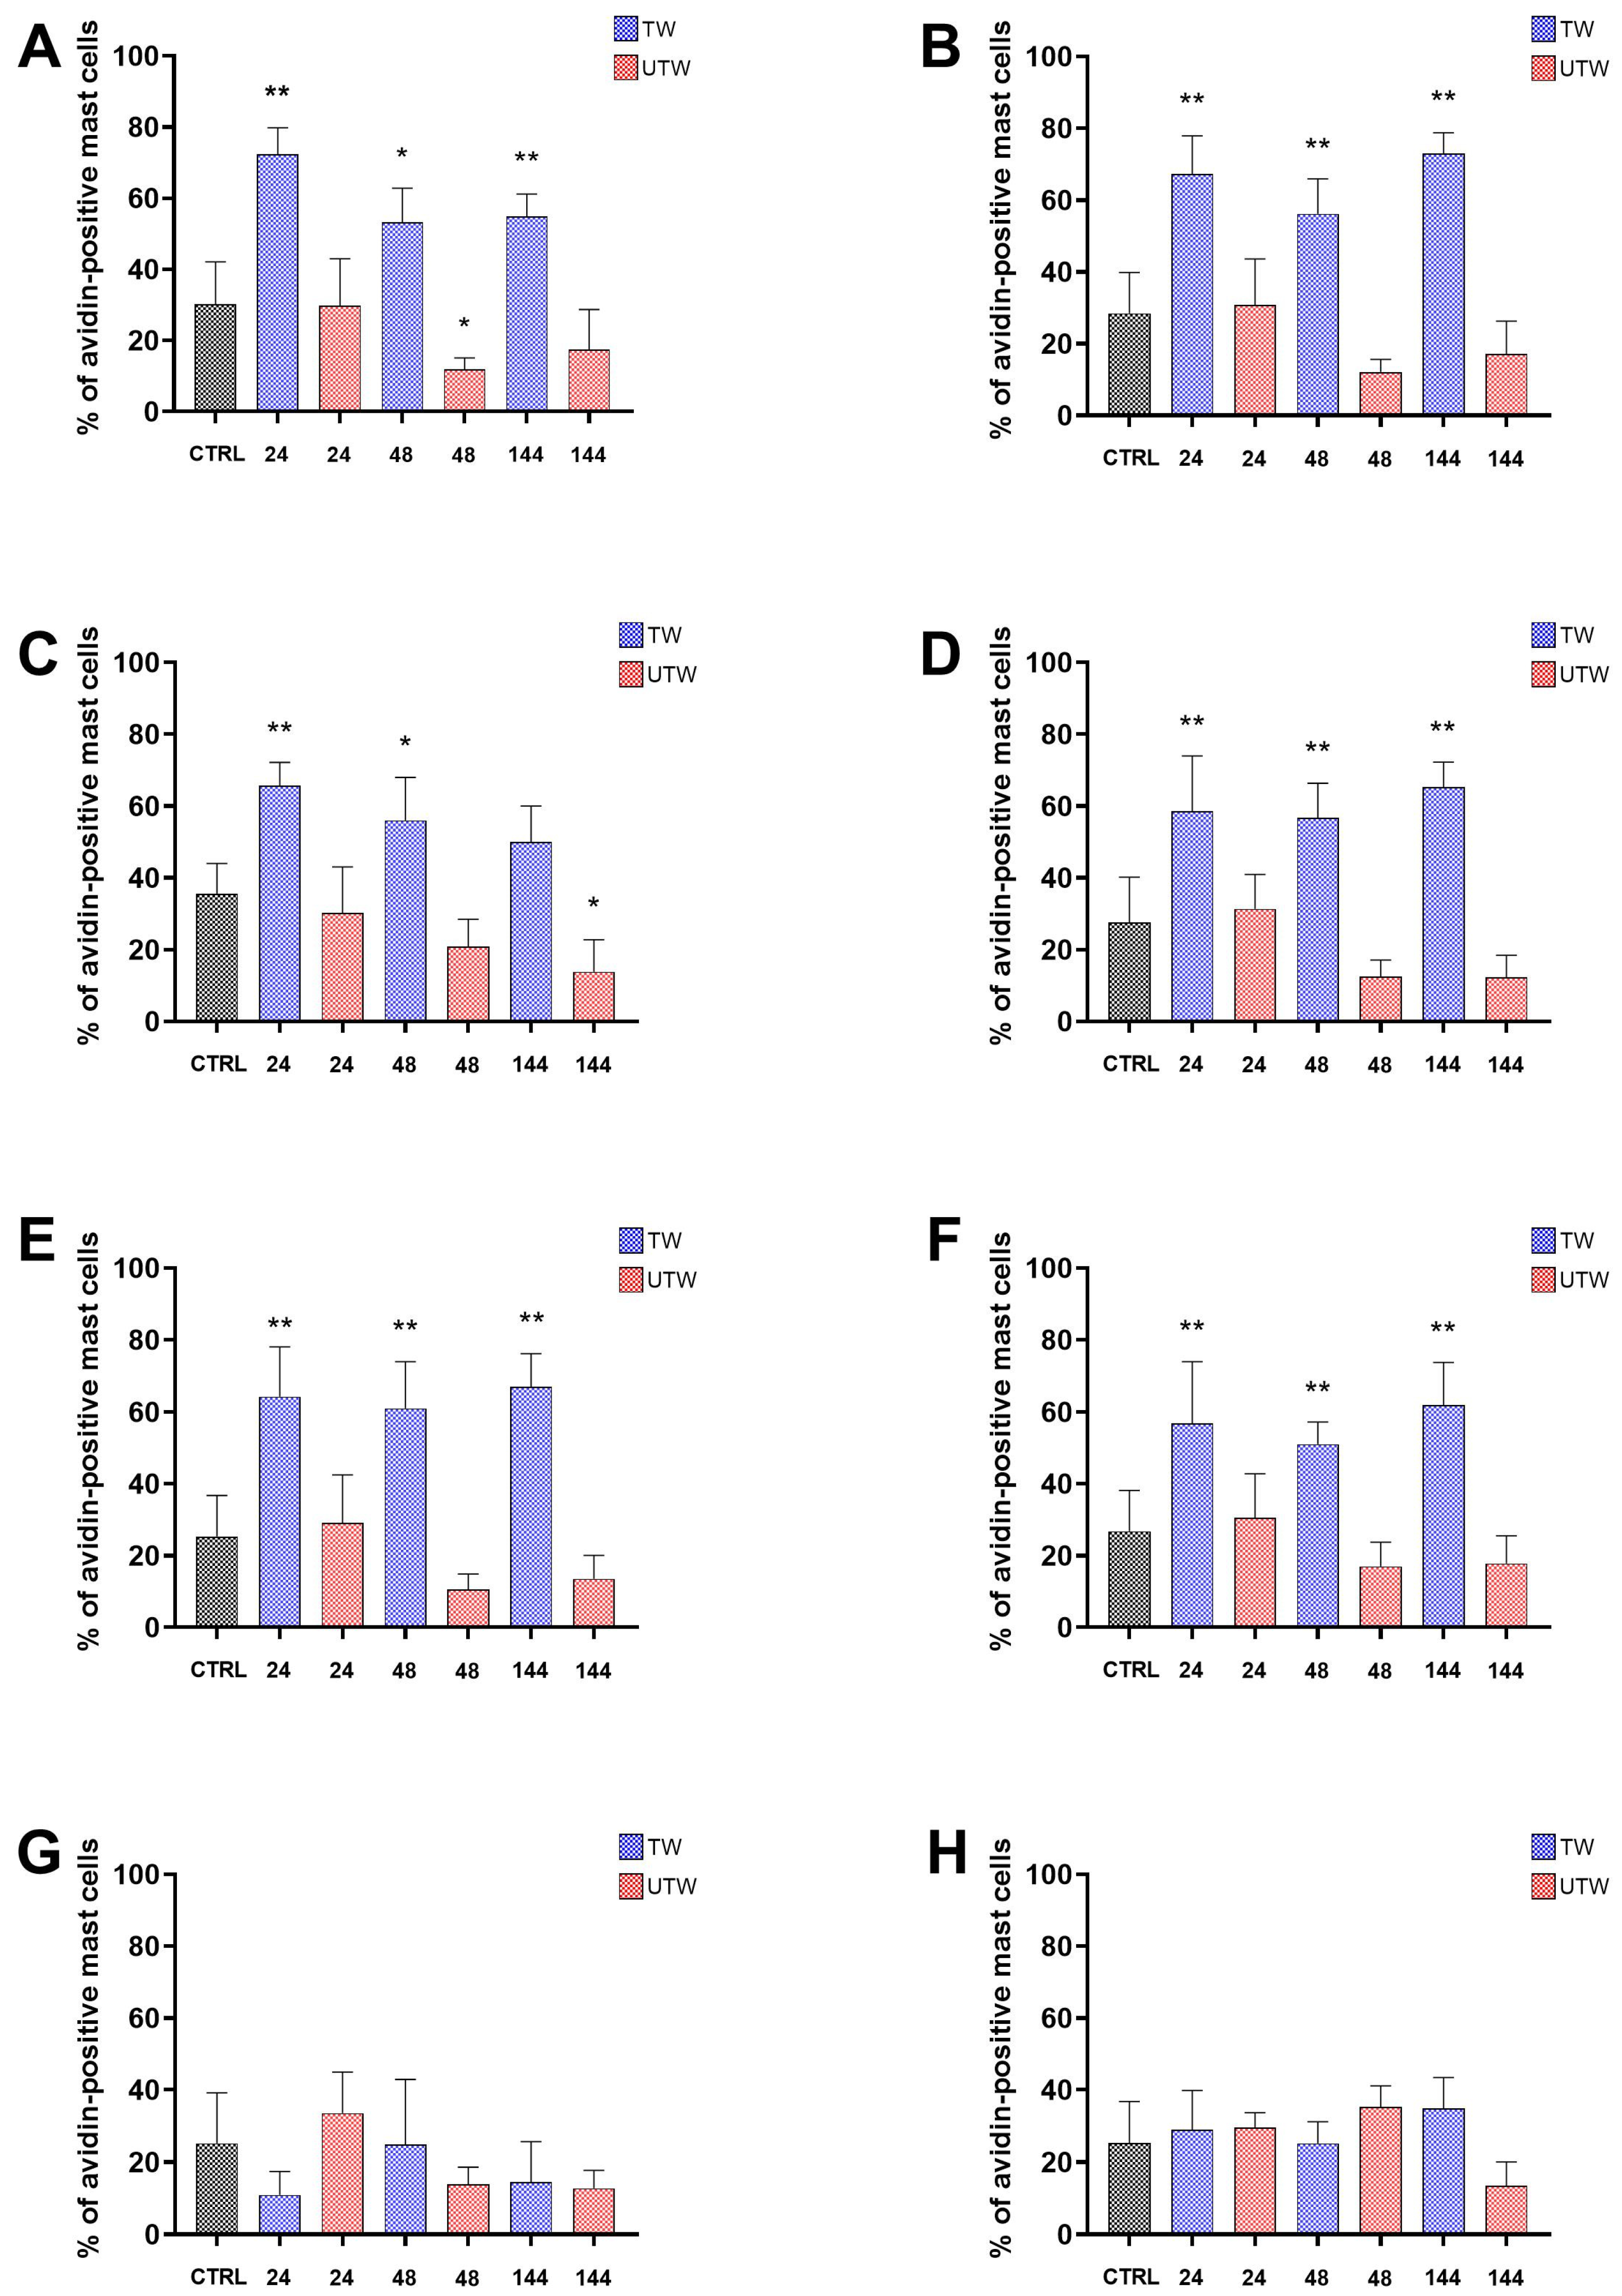
Exploratory comparisons with CTRL are shown in Figure 2. At 24 h, the percentages of avidin-positive MCs co-expressing CGRP, NKA, NPY, NSE, PGP9.5 or SP were higher in TWs than in CTRL, with nominal p < 0.05; none of the corresponding UTW–CTRL comparisons reached nominal significance. At 48 h, the same six markers were higher in TWs than in CTRL, with nominal p < 0.05. In UTWs, CGRP was lower than in CTRL, with nominal p < 0.05, whereas the remaining comparisons yielded p ≥ 0.05. At 144 h, CGRP, NKA, NSE, PGP9.5 and SP were higher in TWs than in CTRL, with nominal p < 0.05. NPY was lower than CTRL in UTWs, with nominal p < 0.05, whereas the TW–CTRL comparison for NPY was not significant. Comparisons with CTRL for VIP and NGF were not significant in either wound condition at any time point.
Figure 2.
Comparison of avidin+/marker+ cells in TW (blue) and UTW (red) with unwounded control skin (black). The graphs show the percentages of avidin-positive MCs positive for each marker in CTRL skin and in TW and UTW samples collected at 24, 48 and 144 h after injury: (A) CGRP, (B) NKA, (C) NPY, (D) NSE, (E) PGP9.5, (F) SP, (G) VIP and (H) NGF. Two microscopic fields were averaged for each animal; bars show mean ± SD (n = 5 animals per group). The five CTRL animals were distinct from the wounded animals, and the same CTRL group was used for comparisons at all three time points. CTRL was compared separately with each TW and UTW group at each time point using unpaired Mann–Whitney tests. * p < 0.05, ** p < 0.01.
3.2. PBM-Associated Differences in Marker Co-Expression in NSE-Positive Profiles
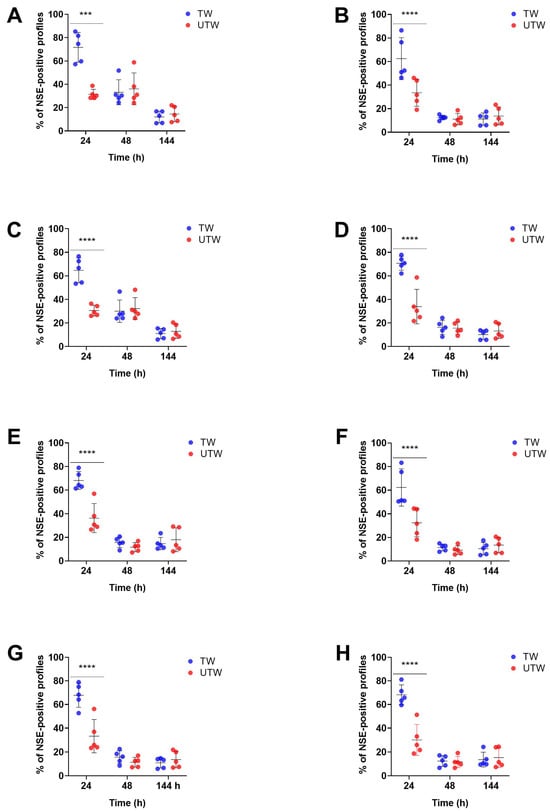
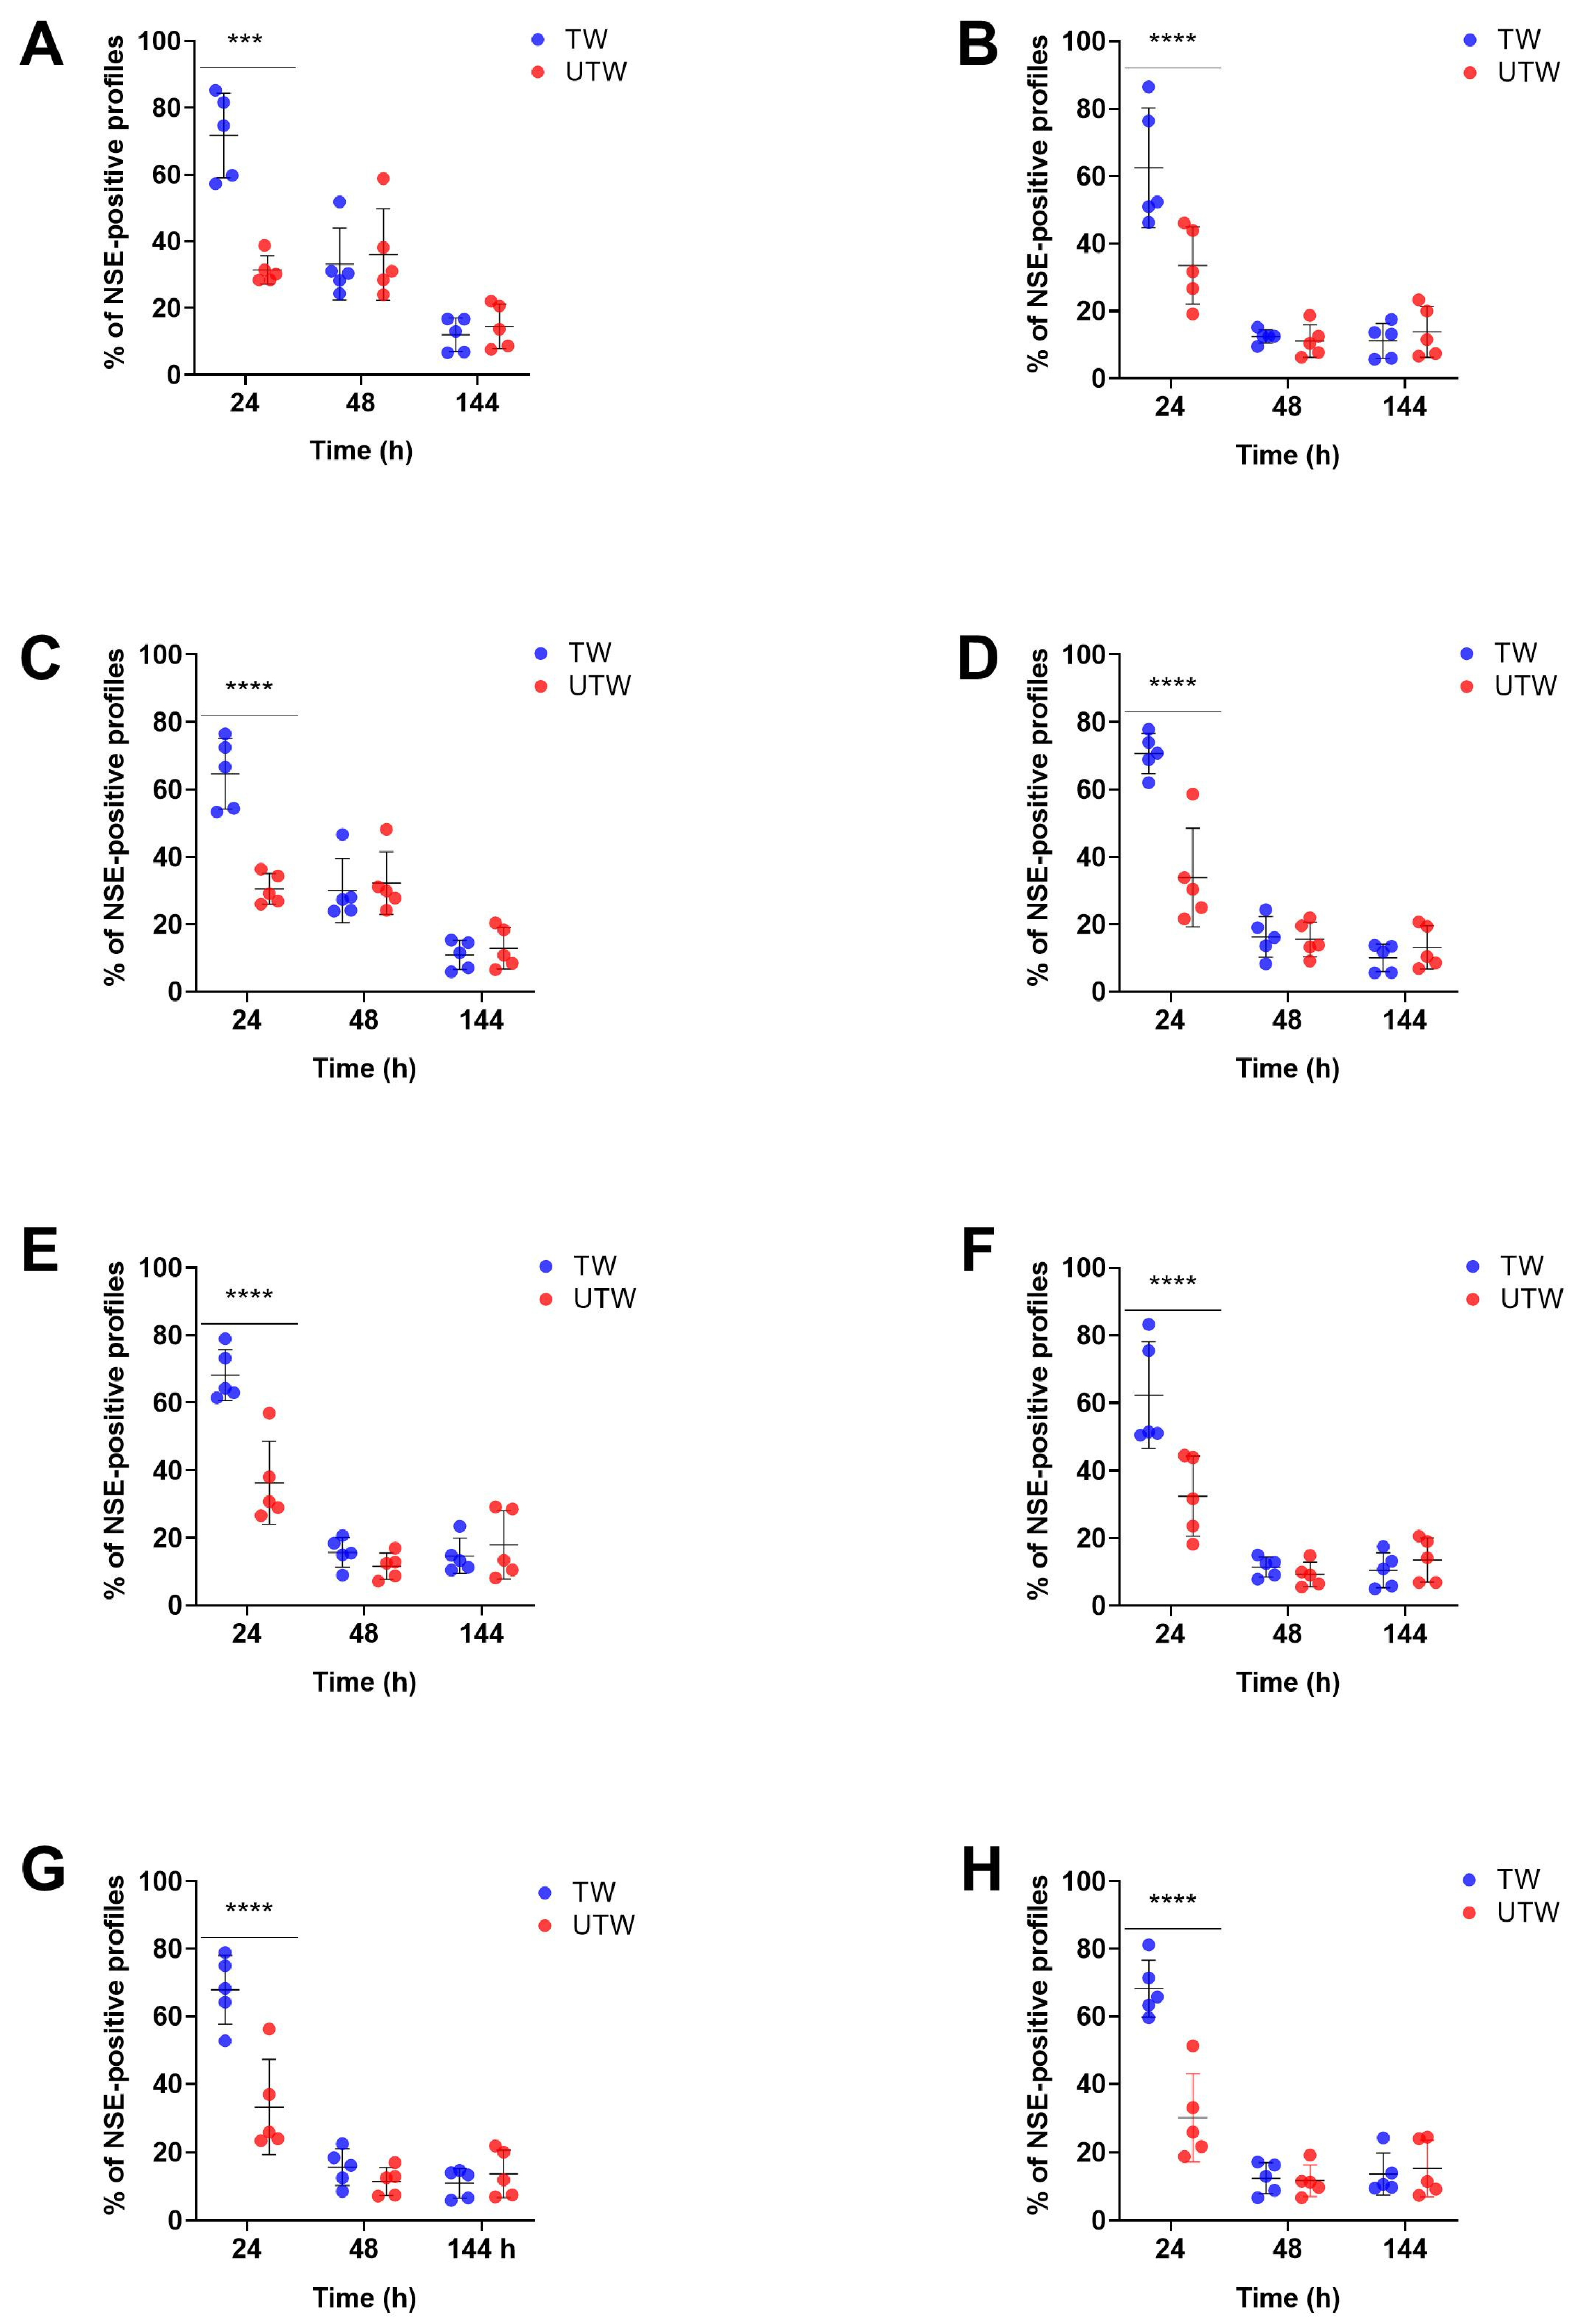
Paired animal-level comparisons showed significantly higher percentages of NSE-positive profiles co-expressing CGRP, NKA, NPY, PGP9.5, SP, NGF, iNOS or VIP in TWs than in UTWs at 24 h after injury (Figure 3). No statistically significant TW–UTW differences were detected for any of the analysed markers at 48 or 144 h.
Figure 3.
Animal-level comparison of neuronal marker expression in TW (blue) and UTW (red). Percentages of NSE+ neuronal structures co-expressing (A) CGRP, (B) NKA, (C) NPY, (D) PGP9.5, (E) SP, (F) NGF, (G) iNOS and (H) VIP at 24, 48 and 144 h after injury. Each dot represents one animal-level value, obtained by averaging the measurements from two microscopic fields per mouse (n = 5 mice per time point). TW and UTW values from the same mouse were paired. Data are shown as mean ± SD. Comparisons were performed by two-way repeated-measures ANOVA, with wound condition as the within-subject factor and time as the between-subject factor, followed by Sidak’s multiple-comparisons test. *** p < 0.001, **** p < 0.0001.
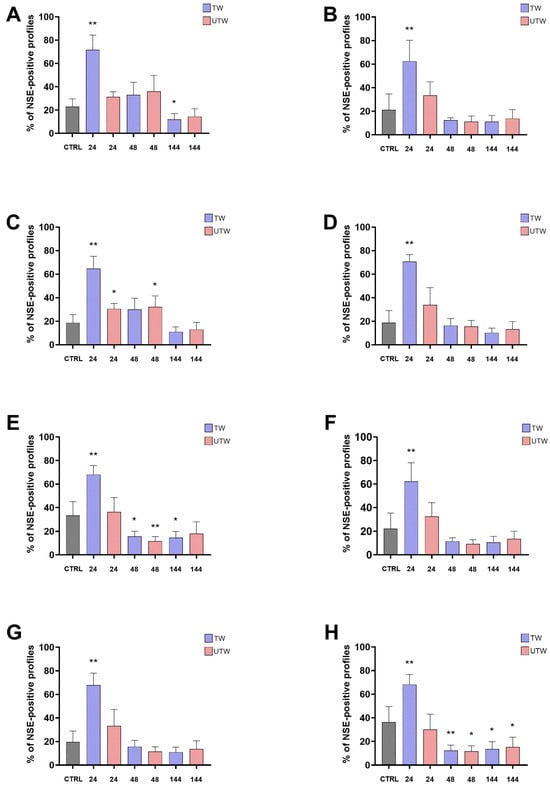
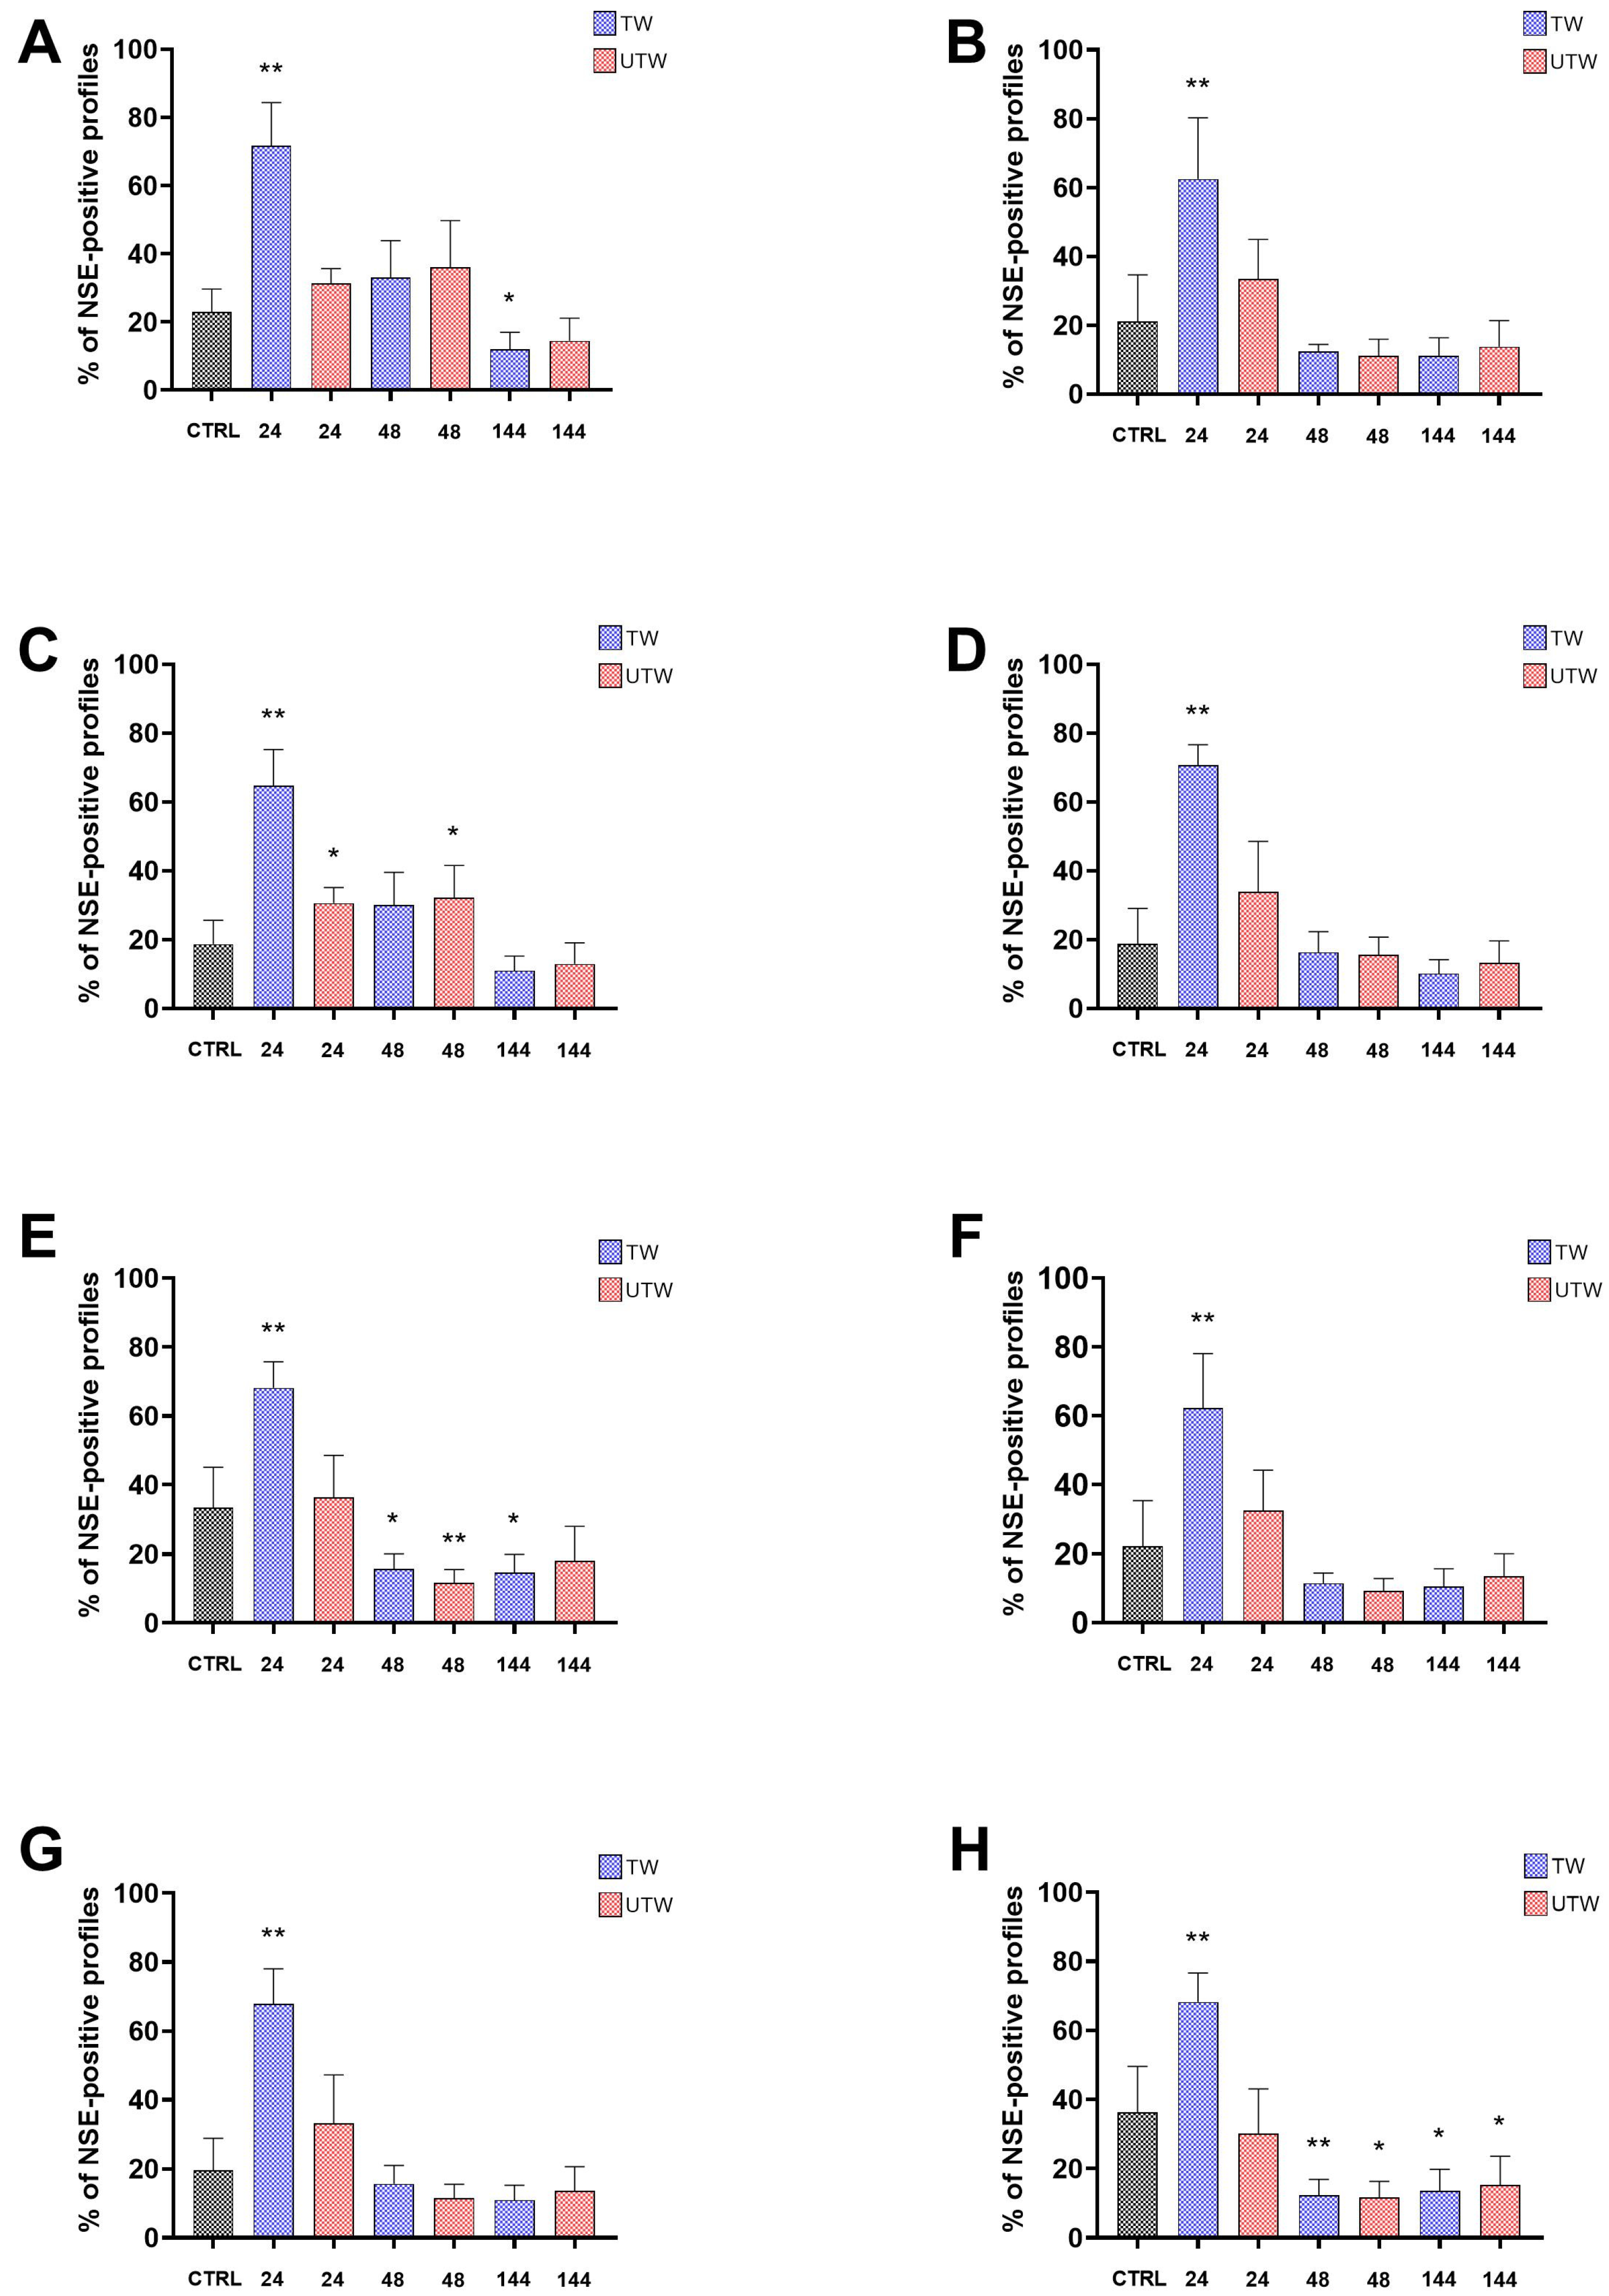
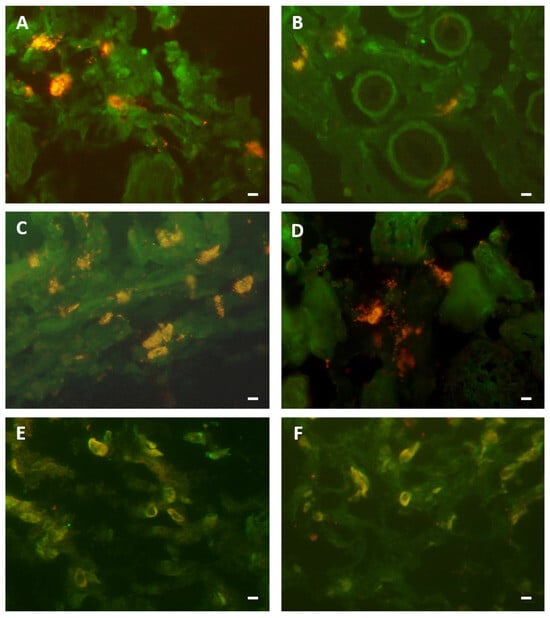
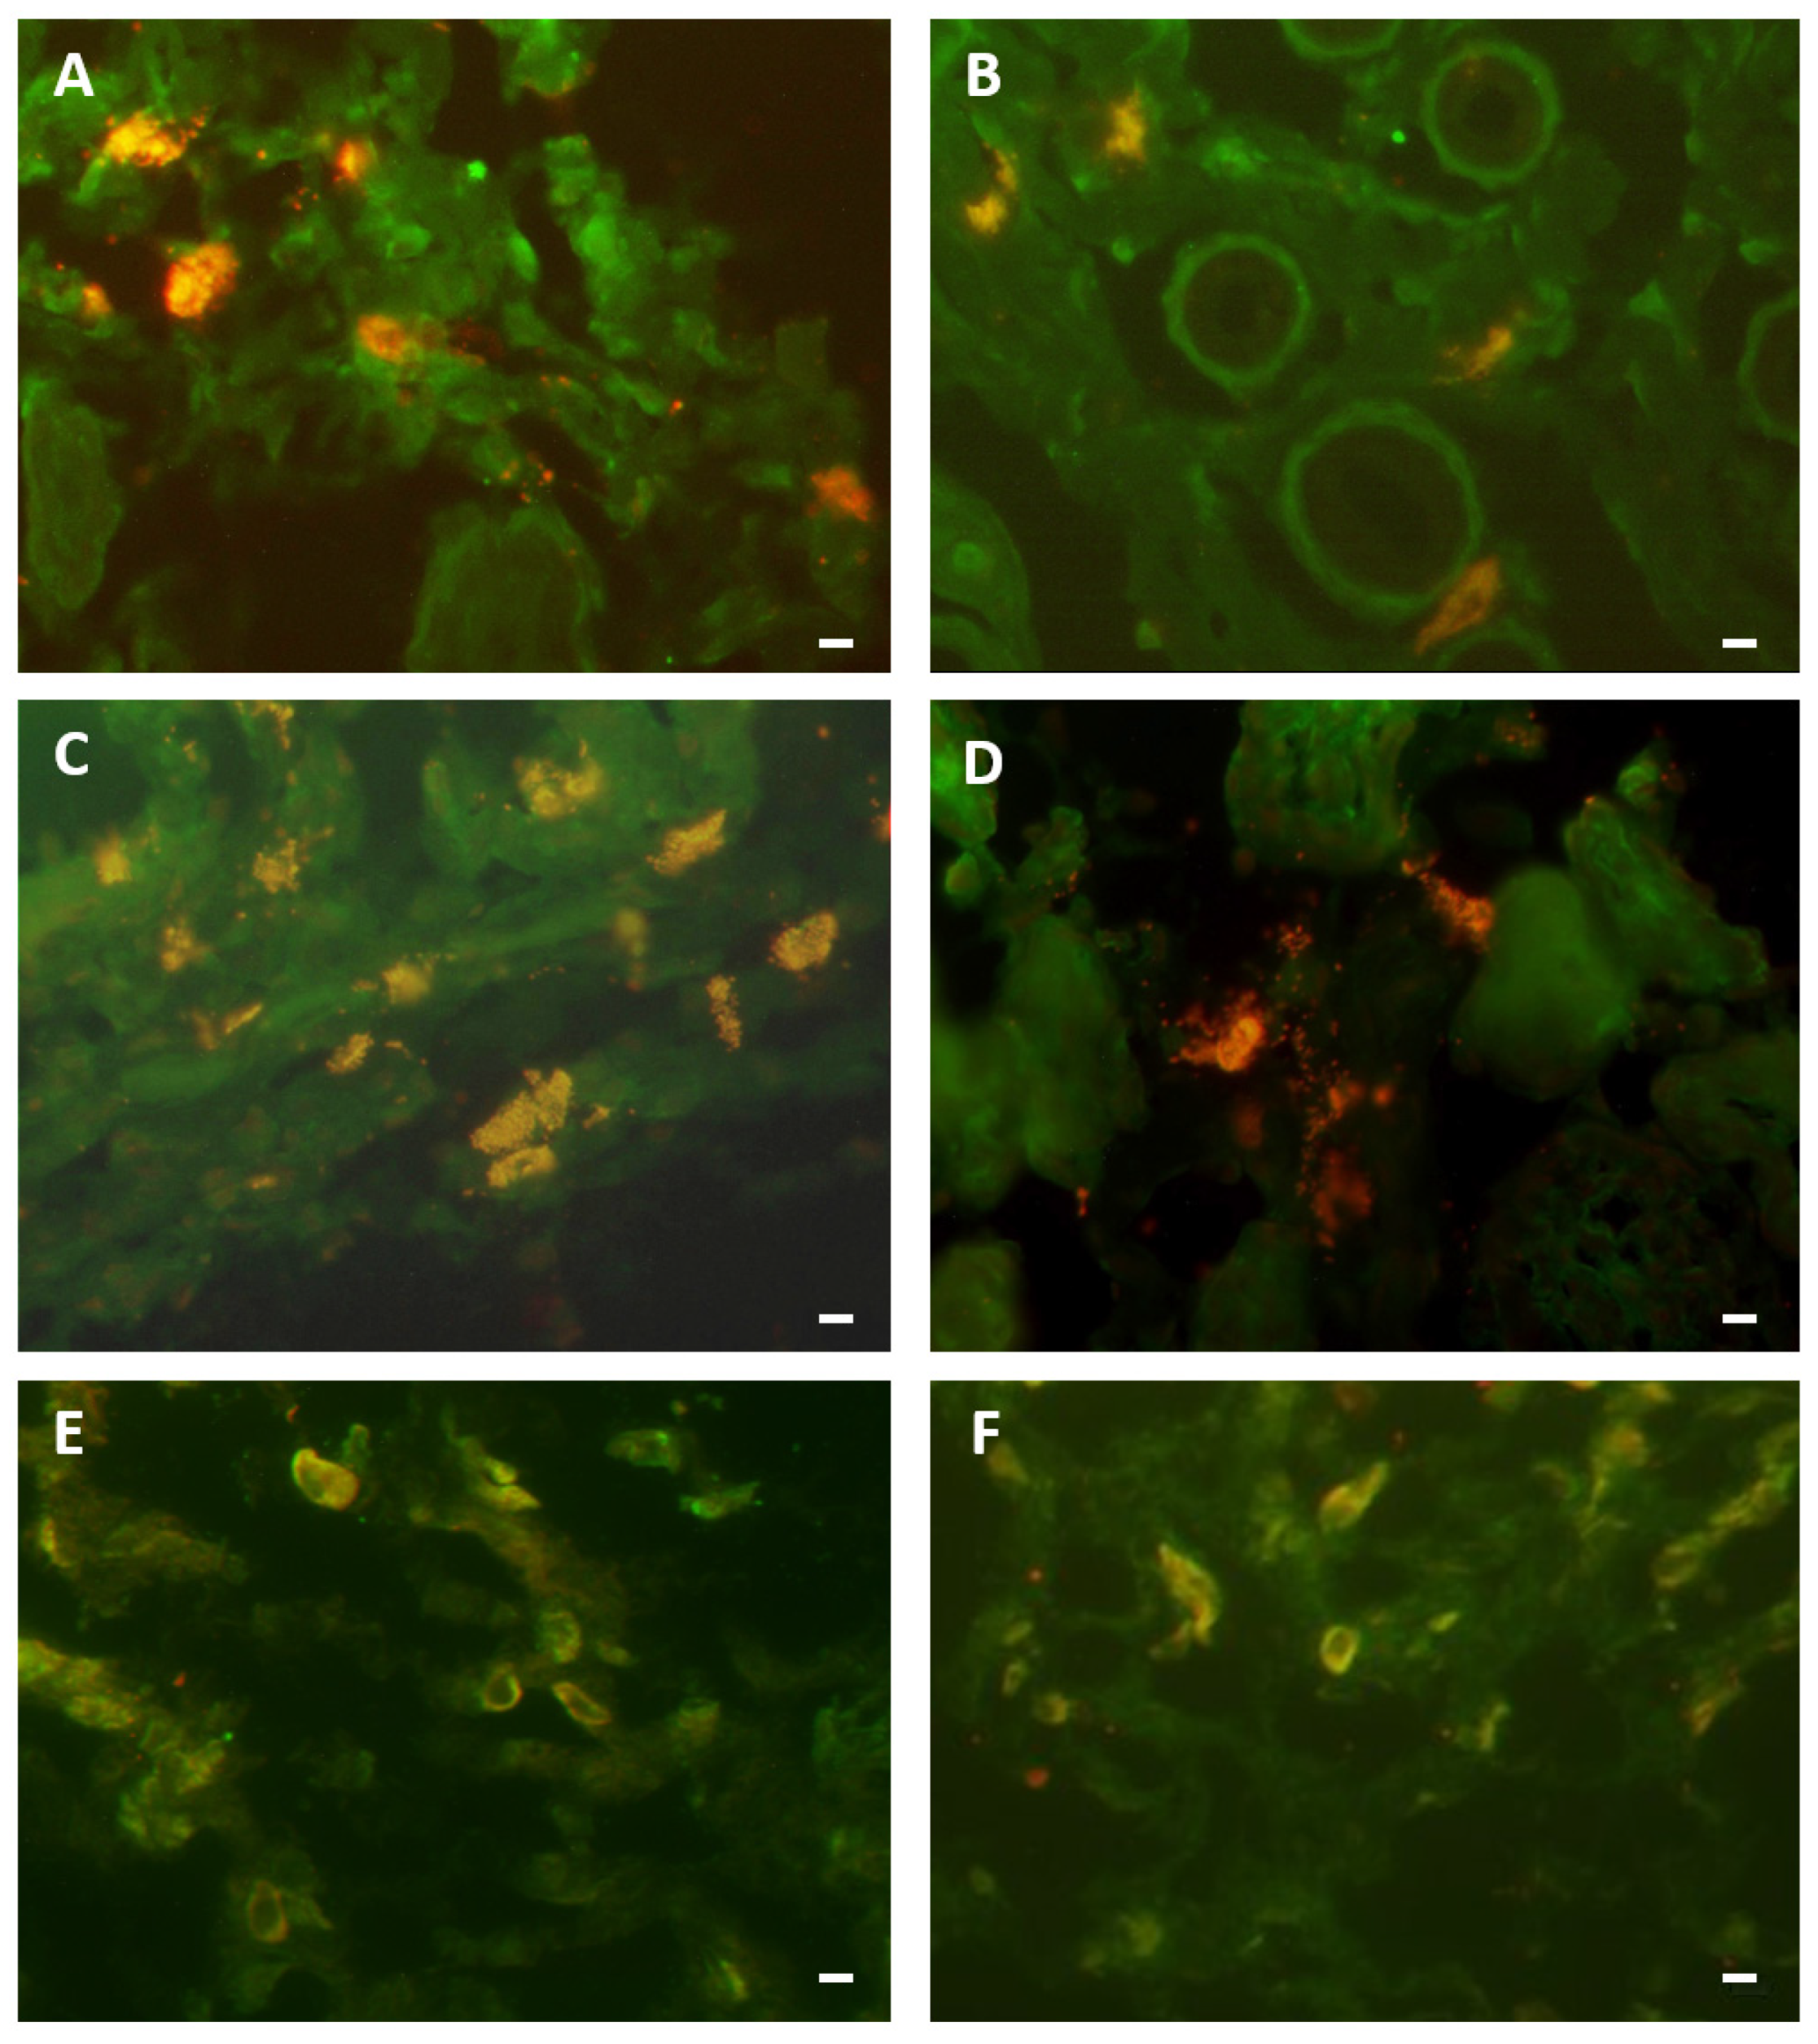
In exploratory comparisons with CTRL (Figure 4), at 24 h, the percentages of NSE-positive profiles co-expressing each of the eight markers were higher in TWs, with nominal p < 0.05 for all eight comparisons. Among UTWs, only NPY was higher than CTRL with nominal p < 0.05. At 48 h, NPY was higher than CTRL in UTWs, whereas SP and VIP were lower than CTRL in both TWs and UTWs, with nominal p < 0.05 for these comparisons. All other comparisons with CTRL at 48 h yielded p ≥ 0.05. At 144 h, CGRP and SP were lower than CTRL in TWs, and VIP was lower than CTRL in both wound conditions, with nominal p < 0.05 for these comparisons. All other comparisons with CTRL at 144 h yielded p ≥ 0.05. Representative immunofluorescence images of selected markers are shown in Figure 5.
Figure 4.
Comparison of neuronal marker expression in TW (blue) and UTW (red) with unwounded control skin (black). Percentages of NSE+ neuronal structures co-expressing (A) CGRP, (B) NKA, (C) NPY, (D) PGP9.5, (E) SP, (F) NGF, (G) iNOS and (H) VIP in CTRL skin and in TW and UTW samples collected at 24, 48 and 144 h after injury. Two microscopic fields were averaged for each mouse; bars show mean ± SD (n = 5 mice per group). The five CTRL animals were distinct from the wounded animals, and the same CTRL group was used for comparisons at all three time points. Each TW or UTW group was compared separately with CTRL using an unpaired Mann–Whitney test. * p < 0.05, ** p < 0.01.
Figure 5.
(A,C,E) show TW, whereas (B,D,F) show UTW. Double labelling is shown for avidin and NSE (A,B), avidin and CGRP (C,D), and NSE and iNOS (E,F). All images were acquired 144 h after injury. Scale bar: 10 µm. (Courtesy of co-author, Stefano Bacci).
3.3. MC–Neuronal Distance in Treated and Untreated Wounds
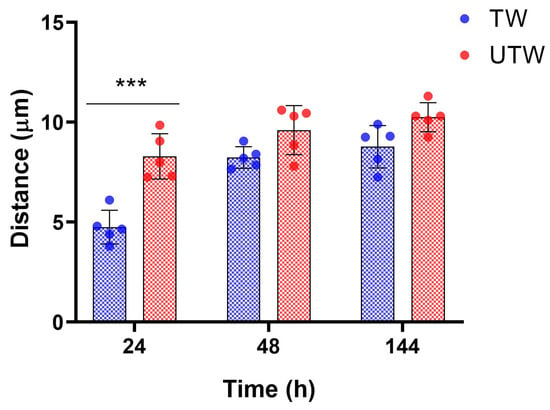
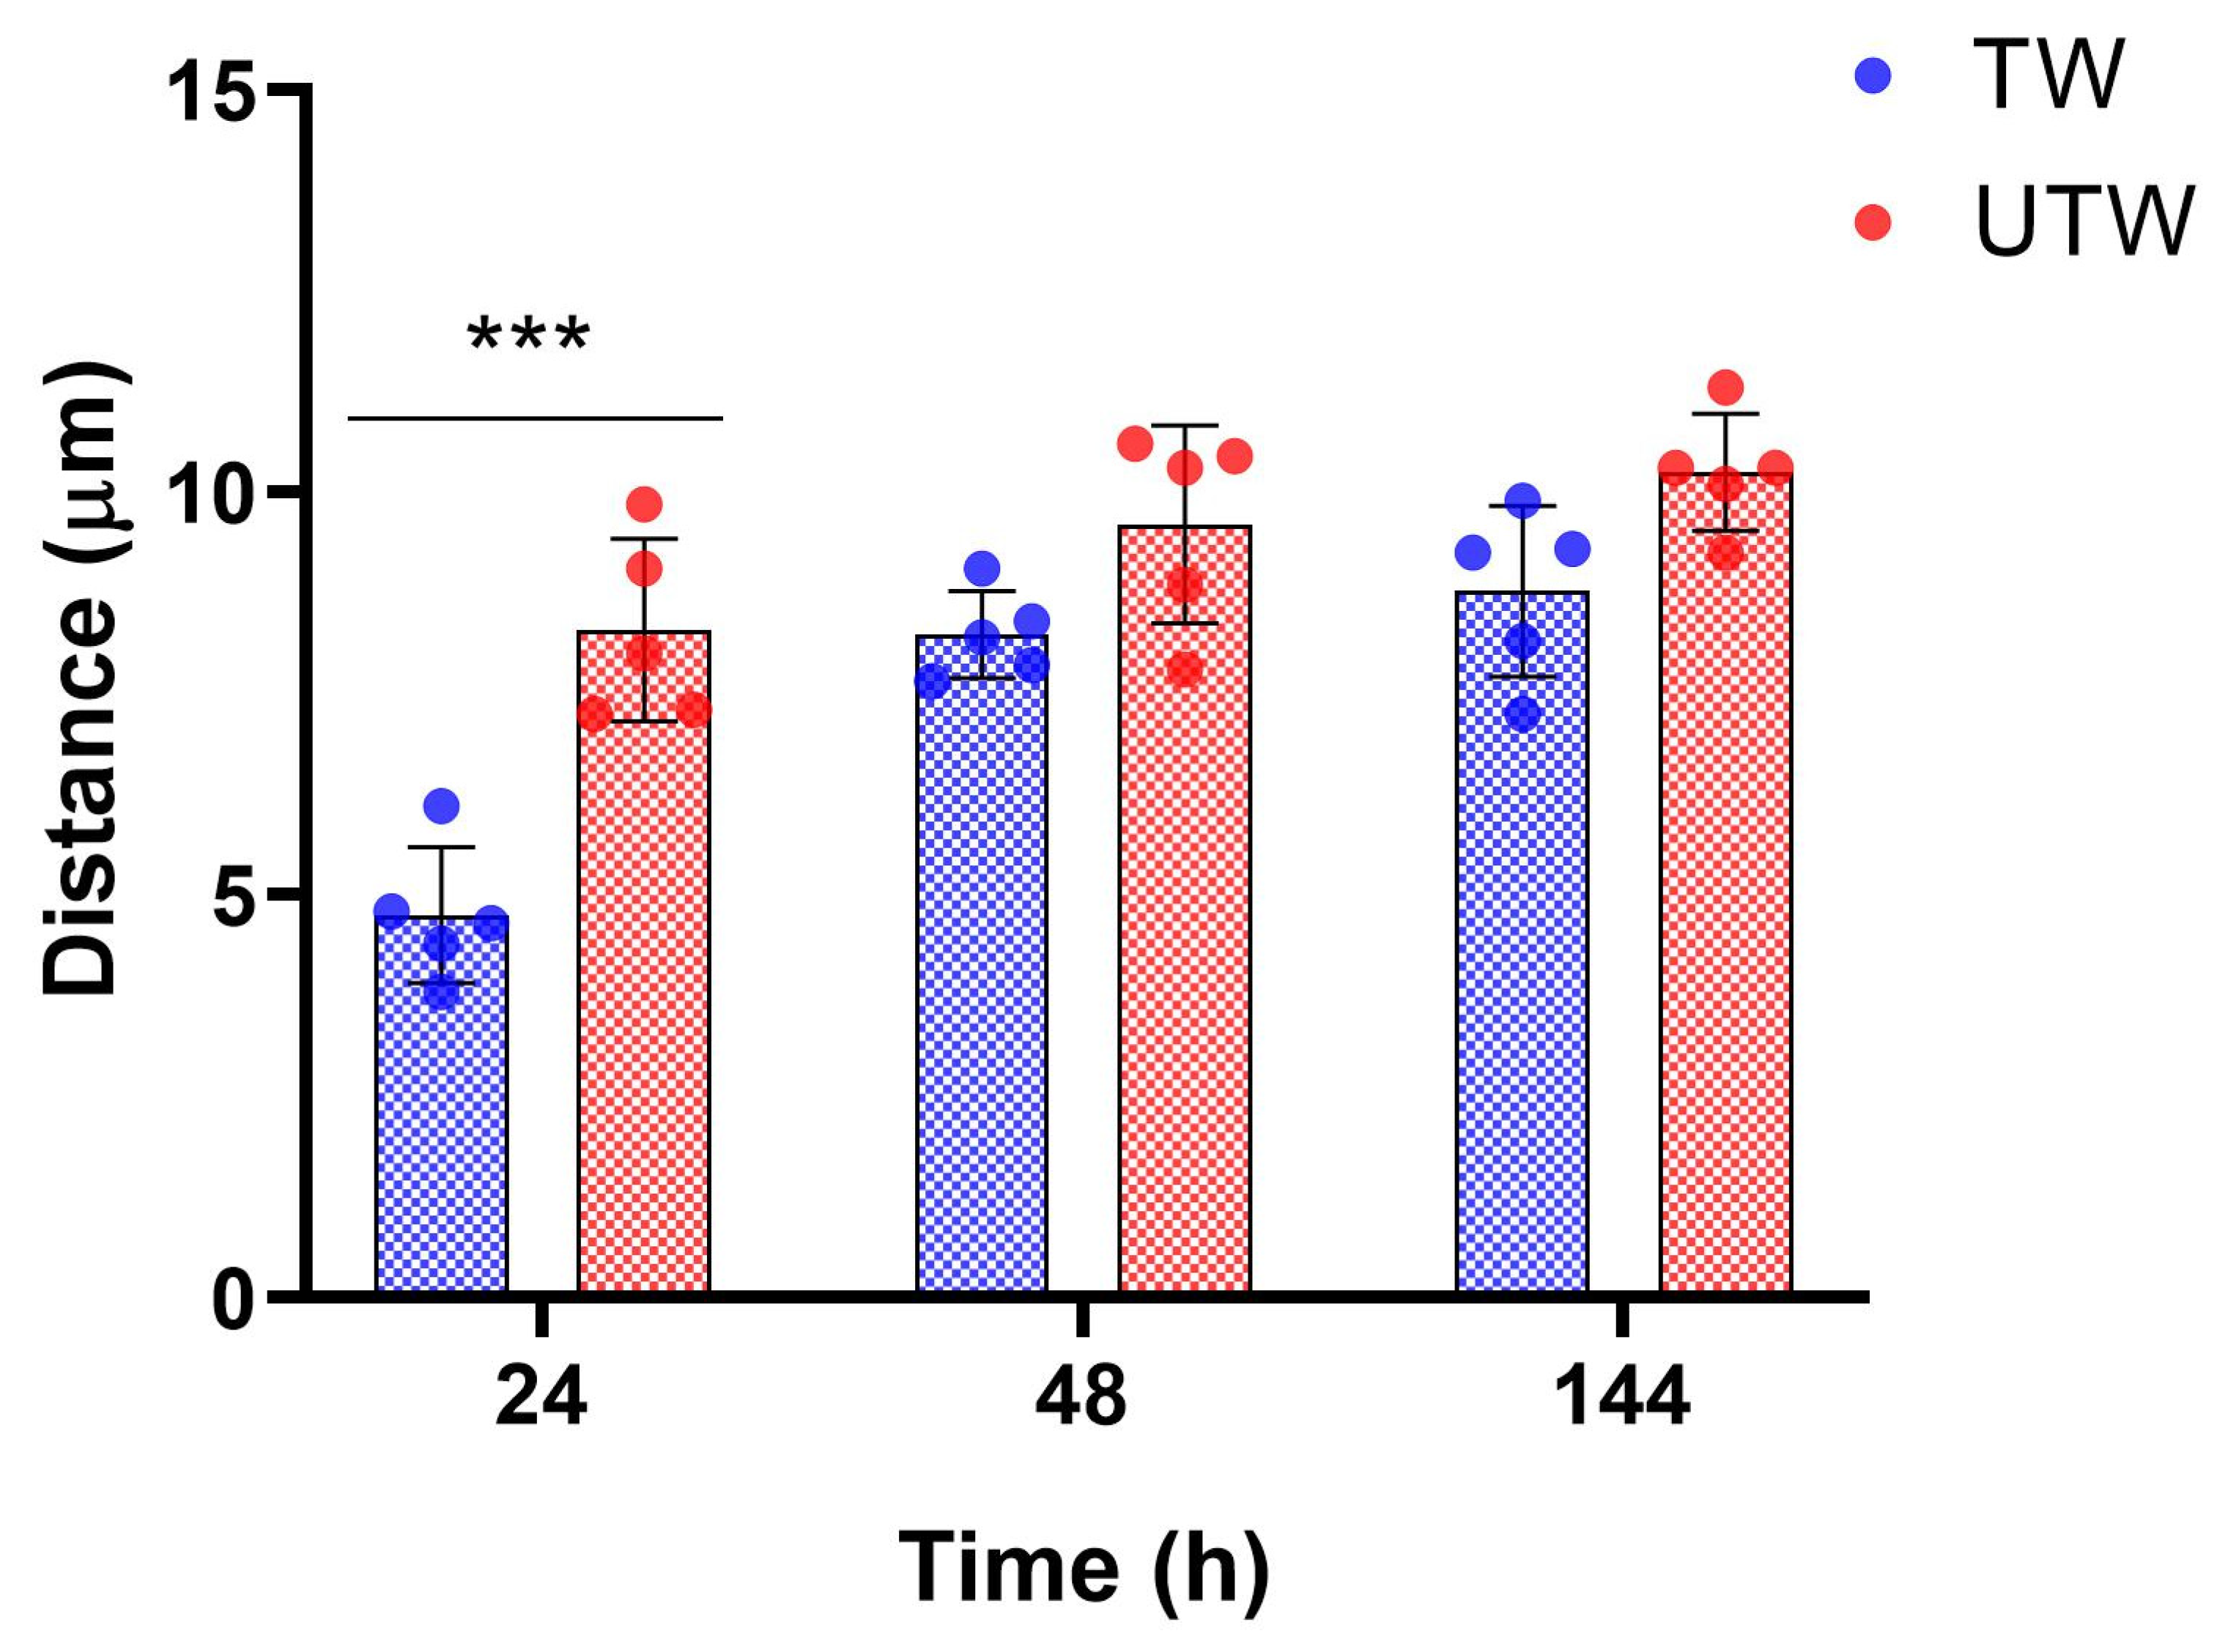
The mean centre-to-centre distance between avidin-positive MCs and the nearest NSE-positive profiles was numerically shorter in TWs than in paired UTWs at all three time points, with a statistically significant difference only at 24 h (Figure 6). At 24 h, distances were 4.75 ± 0.85 µm in TWs and 8.29 ± 1.14 µm in UTWs; this difference was significant after Sidak correction (p < 0.001). At 48 h (8.23 ± 0.54 vs. 9.60 ± 1.23 µm) and 144 h (8.77 ± 1.06 vs. 10.25 ± 0.73 µm), TW values were numerically lower, but the pairwise differences were not significant.
Figure 6.
Mean centre-to-centre distance between avidin-positive MCs and the nearest NSE-positive neuronal structures in treated wounds (TW) and paired untreated wounds (UTW) at 24, 48 and 144 h after injury. Each point represents an animal-level mean calculated from two microscopic fields (n = 5 animals per time point); bars show mean ± SD. TW and UTW were compared within animals using two-way repeated-measures ANOVA, with wound condition as the within-animal factor and time as the between-animal factor, followed by Sidak’s multiple-comparisons test. The 24 h comparison was significant after Sidak correction (*** p < 0.001); the 48 and 144 h comparisons were not significant.
4. Discussion
The present study extends our previous observations [8,9,11,35,38] on blue-light PBM (410–430 nm) in cutaneous wound healing. In previous in vivo studies performed in the same experimental model, a light dose of 20.6 J/cm2 was shown to modulate both the early mast cell response and the subsequent inflammatory and stromal phases of tissue repair [8,35]. Here, we show that the same single dose of blue-light PBM was associated with differences in MC and NSE-positive profile immunophenotypes and in their spatial relationship. To address this purpose, we assessed marker co-expression in MCs and NSE-positive profiles at 24, 48 and 144 h after injury in TWs, UTWs and unwounded control skin. We also compared MC–neuronal distances between TWs and UTWs. Overall, the data reveal time- and compartment-dependent PBM-associated differences in marker co-expression and mast cell–neuronal spatial proximity [19,28,33].
The first relevant finding concerns the MC compartment and should be interpreted within the temporal framework established by our previous studies. Previously, we observed an early and transient increase in MC activity after blue LED light treatment, with the MC degranulation index reaching its maximum difference between TWs and UTWs at 3 h [8]. In a subsequent study using the same wound healing model, blue-light PBM was associated with modulation of the inflammatory and stromal response during the later phases of skin recovery [35]. The present study begins at 24 h, after the early degranulation response described in our previous work, and demonstrates that at 24 h, TWs and UTWs already differed in the co-expression of several markers by MCs, and these differences were also observed at later time points (Figure 1). Taken together, these findings are consistent with a temporal evolution of the MC response to PBM, from the early change in secretory activity reported previously to a later, sustained change in the MC immunophenotypic profile.
This temporal sequence raises the question of whether the early increase in MC degranulation may be initiated, at least in part, by a direct response of MCs to the blue light stimulus. Recent evidence supports the intrinsic photosensitivity of MCs, although the functional outcomes appear to be context dependent. In an in vivo rat model, violet LED irradiation (405 ± 10 nm) induced an immediate increase in MC degranulation in oral tissues [44]. More recently, Yamamoto et al. [45] demonstrated that RBL-2H3 MCs express the photoreceptor opsin 3 (OPN3) and that visible light exposure induces β-hexosaminidase release, with the strongest response occurring at approximately 460 nm. Importantly, OPN3 silencing significantly reduced this response, providing a mechanistic basis for direct light sensing by MCs. However, the effect of blue light on MC degranulation varies across experimental conditions. Siiskonen et al. [46] reported that fresh and cultured human skin MCs express several photoreceptors, including CRY1 and OPN1-3, but exposure to 453 nm blue light at 2 or 30 J/cm2 produced a dose-dependent reduction in degranulation induced through IgE/anti-IgE or MRGPRX2-related degranulation. Thus, current evidence supports the intrinsic photosensitivity of MCs, but also indicates that its functional outcome may vary. The experimental conditions of these studies differ substantially in terms of species, MC sources, tissue context, activation state, wavelength, radiant exposure, and method and timing of degranulation assessment. In the present model, MCs are located within an acutely injured dermal microenvironment exposed to endogenous danger and inflammatory signals. Accordingly, OPN3—or other photoreceptors—may represent plausible candidates for the early PBM response, but their involvement cannot be demonstrated from the present data.
Accordingly, the marker data collected from 24 h onward should not be interpreted as evidence of the event that initiated the earlier degranulation response. Rather, they describe the subsequent MC immunophenotype. In the animal-level paired analysis, the percentages of avidin-positive MCs co-expressing CGRP, NKA, NPY, NSE, PGP9.5, or SP were significantly higher in TWs than in paired UTWs at all three time points (Figure 1). VIP co-expression was significantly lower in TWs than in UTWs only at 24 h, whereas NGF co-expression was significantly higher in TWs only at 144 h. These findings indicate persistent but marker-specific differences between wound conditions. Thus, the effect of PBM on the MC compartment is not restricted to the earliest hours after injury, but remains detectable over the observation period. Since MCs can regulate vascular permeability, inflammatory-cell recruitment, stromal-cell activity, angiogenesis and matrix remodelling, this sustained phenotypic modulation may be relevant for the progression from inflammation to tissue formation [28,33].
Among the analysed markers, CGRP is particularly relevant, because its co-expression in avidin-positive MCs was significantly higher in TWs than in paired UTWs at all three time points, including 24 h (Figure 1). CGRP has established vascular, inflammatory, and reparative functions, and experimental evidence indicates that the disruption of CGRP signalling can impair angiogenesis and wound closure [47]. Notably, the present data do not establish a causal relationship between the degranulation peak observed at 3 h and the subsequent increase in CGRP-positive MCs. Rather, CGRP appears to mark the phenotypic state that emerges when the initial phase of increased MC activity has already occurred.
The broader MC profile supports the idea of a PBM-sensitive neuroimmune phenotype. NKA, NPY and SP were also strongly represented in TWs. CGRP and SP are major sensory neuropeptides involved in vascular responses, immune cell recruitment, keratinocyte and fibroblast behaviour, and tissue repair [47,48]. NKA may contribute to tachykinin-mediated responses, while NPY is more closely linked to autonomic and immune modulation. Higher percentages of MCs positive for these markers do not imply a shared functional effect, but suggest differences in the MC-associated marker profile. NSE and PGP9.5 immunoreactivity was assessed specifically in avidin-positive MCs. Because these proteins are commonly used as neuronal markers, their detection in avidin-positive cells should be interpreted as co-expression within the MC compartment under the present assay conditions; it does not identify these cells as neuronal or establish a specific functional role for either marker in MCs.
Exploratory comparisons with unwounded skin showed significantly higher proportions of MCs co-expressing CGRP, NKA, NPY, NSE, PGP9.5, and SP in TWs at both 24 and 48 h (Figure 2). At 144 h, TW values remained significantly higher than CTRL for CGRP, NKA, NSE, PGP9.5, and SP, whereas NPY did not differ significantly. In UTWs, most comparisons with CTRL were not significant; the exceptions were lower CGRP co-expression at 48 h and lower NPY co-expression at 144 h. VIP and NGF did not differ significantly from CTRL at any time point. VIP and NGF showed distinct patterns in MCs. VIP co-expression differed significantly between TWs and UTWs only at 24 h, with a lower proportion of VIP-positive MCs in TWs; no significant difference was observed at 48 or 144 h. Neither wound condition differed significantly from CTRL for VIP at any time point. NGF co-expression was comparable between TWs and UTWs at 24 and 48 h, and was significantly higher in TWs only at 144 h. However, neither TWs nor UTWs differed significantly from CTRL at any time point. Thus, the 144 h result represents a relative difference between the two wound conditions, not evidence of an increase above unwounded levels or of increased NGF production or release. NGF is involved in peripheral nerve maintenance, axonal growth, sensory modulation, keratinocyte and fibroblast activity, granulation tissue formation, and collagen organization [23,49]. Experimental studies have shown that NGF is produced at the wound site by epithelial cells and fibroblasts and that its topical application [50] accelerates cutaneous wound closure, including in impaired-healing models [23]. In this context, the late difference in NGF co-expression between TWs and UTWs may reflect a time-dependent change in MC-associated NGF immunoreactivity, but the present data do not establish its functional significance. Given NGF’s reparative and neurosensory roles, including its potential contribution to sensitization and inflammatory pain [51], this finding does not by itself indicate a univocal pro-inflammatory or pro-healing effect.
Analysis of NSE-positive profiles revealed a marked early difference between wound conditions (Figure 3). At 24 h, the percentages of NSE-positive structures co-expressing each of the eight analysed markers—CGRP, NKA, NPY, PGP9.5, SP, NGF, iNOS and VIP—were significantly higher in TWs than in paired UTWs. At 48 and 144 h, none of the TW-UTW comparisons reached statistical significance. Although the plotted values were generally lower at later time points, this pattern is descriptive and does not establish a statistically significant decline over time.
Comparisons with the separate CTRL group showed significantly higher TW values at 24 h for all eight neuronal markers (Figure 4). At this time point, UTWs differed significantly from CTRL only for NPY, which was higher. At 48 h, UTW NPY was higher than CTRL, whereas SP and VIP co-expression were lower in both TWs and UTWs. At 144 h, CGRP and SP co-expression were lower in TWs, and VIP co-expression was lower in both wound conditions, compared with CTRL. No other wound-versus-control comparisons were statistically significant. Thus, the differences from unwounded skin varied by marker and wound condition. In NSE-positive profiles, NGF co-expression was significantly higher in TWs than in paired UTWs at 24 h, but not at 48 or 144 h.
NGF co-expression in NSE-positive profiles was higher in TWs than in CTRL at 24 h, with nominal p < 0.05, whereas the comparisons at 48 and 144 h yielded p ≥ 0.05. In MCs, NGF co-expression was significantly higher in TWs than in UTWs only at 144 h, while neither wound condition differed significantly from CTRL. These findings point to different temporal patterns of NGF immunoreactivity across the two compartments. However, they do not establish changes in total NGF abundance, transfer of NGF between cells, or direct communication between MCs and neuronal structures.
The spatial analysis showed that the mean distance between avidin-positive MCs and the nearest NSE-positive neuronal structures was shorter in TWs than in paired UTWs at 24 h (Figure 6). Closer spatial proximity may facilitate local interactions involving neuropeptides, growth factors and inflammatory mediators [26,33]. However, distance measurements alone do not demonstrate direct cellular contact, mediator exchange or functional communication.
The PBM-associated differences in marker co-expression and the shorter MC–neuronal distances at 24 h support further investigation of the mast cell–neuronal interface. Given the recognized roles of MC mediators and sensory neuropeptides in the regulation of inflammation and tissue repair, modulation of this interface may contribute to PBM-associated changes in the wound microenvironment [28,33,47,48]. The involvement of sensory mediators such as CGRP and SP also makes a potential link with wound-associated pain biologically plausible. However, the present study does not provide direct evidence of mediator release or functional communication between MCs and neuronal structures, and pain-related outcomes were not assessed. Therefore, any contribution of mast cell-neuronal interactions to the effects of PBM on inflammation, tissue repair, or pain remains speculative. Furthermore, findings obtained in an acute murine wound model cannot be directly extrapolated to human chronic wounds and require validation in clinically relevant settings.
Several limitations should be acknowledged. First, this study was specifically designed to investigate blue LED-PBM-associated neuroimmune modulation in a healthy acute wound model and was not powered to assess sex-related differences or the influence of comorbidities known to affect wound healing. Second, although murine models provide valuable mechanistic insights, they do not fully recapitulate the biological complexity and heterogeneity of human wounds, which are frequently associated with underlying pathological conditions. Third, because TWs and UTWs were generated within the same animal, both wound types shared the same systemic environment. Consequently, systemic cross-talk between wounds cannot be completely excluded. Nevertheless, previous studies using the same experimental model consistently demonstrated faster healing in TWs compared with UTWs [7,8]. Furthermore, comparisons with unwounded CTRL skin were exploratory and were not adjusted for multiple testing, providing contextual information, whereas the main focus of the study was the paired TW–UTW comparison. As a last observation, all these experimental findings cannot exclude a photothermal activation of some biological trigger, together with a photochemical effect. Taken together, these limitations highlight the need for further studies aimed at confirming the functional significance of mast cell-neuronal interactions and evaluating the translational relevance of these findings in clinically representative wound models.
5. Conclusions
Overall, our findings indicate that blue-light PBM (410–430 nm) modulates the cutaneous response to acute wounding, with mast cells representing a prominent PBM-responsive component. Changes in neuronal immunophenotype and in the spatial organization of the mast cell–neuronal interface accompany this response, suggesting the local neuroimmune environment as part of the tissue response to PBM.
Author Contributions
Conceptualization, S.B.; methodology, S.B. and G.M.; validation, G.M., and F.R.; formal analysis, S.B., and G.M.; resources, F.R., and S.C.; writing—original draft preparation, G.M.; writing—review and editing, S.B., F.R. and S.C., project administration, S.C., and F.R. All authors have read and agreed to the published version of the manuscript.
Funding
This research received no external funding.
Institutional Review Board Statement
The original animal experiments were authorized by the Italian Ministry of Health (authorization no. 791/2016-PR, issued on 8 August 2016). The present study involved additional analyses of archived tissue samples and required no additional live animal procedures.
Informed Consent Statement
Not applicable.
Data Availability Statement
The data presented in this study are available on request from the corresponding author. Public access is restricted because some of the data are related to experiments that are still ongoing.
Acknowledgments
The authors would like to thank Gaetano De Siena of the University of Florence, for his expertise in animal husbandry and his valuable assistance throughout the study. The authors wish to thank Patrizia Nardini of the Imaging Platform, Department of Experimental and Clinical Medicine, University of Florence, for her valuable support and assistance. Furthermore, the authors would like to thank Arianna Pellicci, Aurora Benigni, Costanza Miceli, Lisa Omarini, Margherita Romiti, Nicola Aldo Scarano, Niccolò Cuccuini, Rebecca Sansoni, Sara Martelli, Selin Tavakoli, Silvia Ullo for their valuable assistance with the laboratory activities related to this study, performed under the supervision of experienced research personnel. During the preparation of this manuscript, the authors used Microsoft 365 Copilot, based on the GPT-5 Chat model (Microsoft Corporation, Redmond, WA, USA) to support the design and refinement of the graphical abstract, including the organization of visual elements, layout optimization, and concise wording. The authors have reviewed and edited the output and take full responsibility for the content of this publication.
Conflicts of Interest
The authors declare no conflicts of interest.
References
- Mamun, A.A.; Shao, C.; Geng, P.; Wang, S.; Xiao, J. Recent Advances in Molecular Mechanisms of Skin Wound Healing and Its Treatments. Front. Immunol. 2024, 15, 1395479. [Google Scholar] [CrossRef] [Scilit] [PubMed]
- Shi, G.; Wei, K.; Wang, R.; Wang, Y.; Wang, X.; Gao, L.; Li, S.; Yang, B.; Tuerxunaili, L.; Jiao, Y. Mechanisms of Action and Clinical Research Progress of Photobiomodulation. J. Photochem. Photobiol. B 2026, 282, 113529. [Google Scholar] [CrossRef] [Scilit] [PubMed]
- Carroll, J. Treatment Parameters and Safety of Photobiomodulation in Wound Care. Br. J. Nurs. 2026, 35, S8–S10. [Google Scholar] [CrossRef] [Scilit] [PubMed]
- Yadav, D.; Gupta, A. Photobiomodulation Therapy in the Management of Chronic Wounds: From Molecular Mechanisms to Translational Clinical Evidence. Biochimie 2026, 250, 1–16. [Google Scholar] [CrossRef] [Scilit] [PubMed]
- Passarella, S.; Karu, T. Absorption of Monochromatic and Narrow Band Radiation in the Visible and near IR by Both Mitochondrial and Non-Mitochondrial Photoacceptors Results in Photobiomodulation. J. Photochem. Photobiol. B Biol. 2014, 140, 344–358. [Google Scholar] [CrossRef] [Scilit] [PubMed]
- Karu, T.I. Cellular and Molecular Mechanisms of Photobiomodulation (Low-Power Laser Therapy). IEEE J. Sel. Top. Quantum Electron. 2014, 20, 7000306. [Google Scholar] [CrossRef] [Scilit]
- Cicchi, R.; Rossi, F.; Alfieri, D.; Bacci, S.; Tatini, F.; De Siena, G.; Paroli, G.; Pini, R.; Pavone, F.S. Observation of an Improved Healing Process in Superficial Skin Wounds after Irradiation with a Blue-LED Haemostatic Device. J. Biophotonics 2016, 9, 645–655. [Google Scholar] [CrossRef] [Scilit] [PubMed]
- Magni, G.; Tatini, F.; Bacci, S.; Paroli, G.; De Siena, G.; Cicchi, R.; Pavone, F.S.; Pini, R.; Rossi, F. Blue LED Light Modulates Inflammatory Infiltrate and Improves the Healing of Superficial Wounds. Photodermatol. Photoimmunol. Photomed. 2020, 36, 166–168. [Google Scholar] [CrossRef] [Scilit] [PubMed]
- Rossi, F.; Magni, G.; Tatini, F.; Banchelli, M.; Cherchi, F.; Rossi, M.; Coppi, E.; Pugliese, A.M.; Rossi degl’Innocenti, D.; Alfieri, D.; et al. Photobiomodulation of Human Fibroblasts and Keratinocytes with Blue Light: Implications in Wound Healing. Biomedicines 2021, 9, 41. [Google Scholar] [CrossRef] [Scilit] [PubMed]
- Magni, G.; Tatini, F.; Bacci, S.; Rossi, F. Blue LED Light Affects Mitochondria and Modulates Reactive Oxygen Species: Preliminary in Vitro Results. In Proceedings of the Translational Biophotonics: Diagnostics and Therapeutics III, Munich, Germany, 25–29 June 2023; SPIE: Bellingham, WA, USA, 2023; Volume 12627, pp. 107–110. [Google Scholar]
- Magni, G.; Cherchi, F.; Banchelli, M.; Tatini, F.; Nardini, P.; Guasti, D.; Coppi, E.; Pugliese, A.M.; Fraccalvieri, M.; Bacci, S.; et al. Effects of Short-Wavelength Blue Light on Fibroblasts, Experimental Evidence in Wound Healing and Cutaneous Fibrosis. Med. Sci. Forum 2023, 21, 27. [Google Scholar] [CrossRef] [Scilit]
- Ansel, J.C.; Armstrong, C.A.; Song, I.; Quinlan, K.L.; Olerud, J.E.; Caughman, S.W.; Bunnett, N.W. Interactions of the Skin and Nervous System. J. Investig. Dermatol. Symp. Proc. 1997, 2, 23–26. [Google Scholar] [CrossRef] [Scilit] [PubMed]
- da Silva, L.; Carvalho, E.; Cruz, M.T. Role of Neuropeptides in Skin Inflammation and Its Involvement in Diabetic Wound Healing. Expert. Opin. Biol. Ther. 2010, 10, 1427–1439. [Google Scholar] [CrossRef] [Scilit] [PubMed]
- Scholzen, T.; Armstrong, C.A.; Bunnett, N.W.; Luger, T.A.; Olerud, J.E.; Ansel, J.C. Neuropeptides in the Skin: Interactions between the Neuroendocrine and the Skin Immune Systems. Exp. Dermatol. 1998, 7, 81–96. [Google Scholar] [CrossRef] [Scilit] [PubMed]
- Klose, C.S.N.; Veiga-Fernandes, H. Neuroimmune Interactions in Peripheral Tissues. Eur. J. Immunol. 2021, 51, 1602–1614. [Google Scholar] [CrossRef] [Scilit] [PubMed]
- Xing, L.; Chen, B.; Qin, Y.; Li, X.; Zhou, S.; Yuan, K.; Zhao, R.; Qin, D. The Role of Neuropeptides in Cutaneous Wound Healing: A Focus on Mechanisms and Neuropeptide-Derived Treatments. Front. Bioeng. Biotechnol. 2024, 12, 1494865. [Google Scholar] [CrossRef] [Scilit] [PubMed]
- Kim, Y.J.; Granstein, R.D. Roles of Calcitonin Gene-Related Peptide in the Skin, and Other Physiological and Pathophysiological Functions. Brain Behav. Immun.—Health 2021, 18, 100361. [Google Scholar] [CrossRef] [Scilit] [PubMed]
- Suvas, S. Role of Substance P Neuropeptide in Inflammation, Wound Healing, and Tissue Homeostasis. J. Immunol. 2017, 199, 1543–1552. [Google Scholar] [CrossRef] [Scilit] [PubMed]
- Choi, J.E.; Di Nardo, A. Skin Neurogenic Inflammation. Semin. Immunopathol. 2018, 40, 249–259. [Google Scholar] [CrossRef] [Scilit] [PubMed]
- Ashrafi, M.; Baguneid, M.; Bayat, A. The Role of Neuromediators and Innervation in Cutaneous Wound Healing. Acta Derm.-Venereol. 2016, 96, 587–594. [Google Scholar] [CrossRef] [Scilit]
- Marek-Jozefowicz, L.; Nedoszytko, B.; Grochocka, M.; Żmijewski, M.A.; Czajkowski, R.; Cubała, W.J.; Slominski, A.T. Molecular Mechanisms of Neurogenic Inflammation of the Skin. Int. J. Mol. Sci. 2023, 24, 5001. [Google Scholar] [CrossRef] [Scilit] [PubMed]
- Mehta, A.S.; Teymoori, S.; Recendez, C.; Fregoso, D.; Gallegos, A.; Yang, H.-Y.; Aslankoohi, E.; Rolandi, M.; Isseroff, R.R.; Zhao, M.; et al. Quantifying Innervation Facilitated by Deep Learning in Wound Healing. Sci. Rep. 2023, 13, 16885. [Google Scholar] [CrossRef] [Scilit] [PubMed]
- Matsuda, H.; Koyama, H.; Sato, H.; Sawada, J.; Itakura, A.; Tanaka, A.; Matsumoto, M.; Konno, K.; Ushio, H.; Matsuda, K. Role of Nerve Growth Factor in Cutaneous Wound Healing: Accelerating Effects in Normal and Healing-Impaired Diabetic Mice. J. Exp. Med. 1998, 187, 297–306. [Google Scholar] [CrossRef] [Scilit] [PubMed]
- Leon, A.; Buriani, A.; Dal Toso, R.; Fabris, M.; Romanello, S.; Aloe, L.; Levi-Montalcini, R. Mast Cells Synthesize, Store, and Release Nerve Growth Factor. Proc. Natl. Acad. Sci. USA 1994, 91, 3739–3743. [Google Scholar] [CrossRef] [Scilit] [PubMed]
- Komi, D.E.A.; Khomtchouk, K.; Santa Maria, P.L. A Review of the Contribution of Mast Cells in Wound Healing: Involved Molecular and Cellular Mechanisms. Clin. Rev. Allerg. Immunol. 2020, 58, 298–312. [Google Scholar] [CrossRef] [Scilit] [PubMed]
- Siiskonen, H.; Harvima, I. Mast Cells and Sensory Nerves Contribute to Neurogenic Inflammation and Pruritus in Chronic Skin Inflammation. Front. Cell. Neurosci. 2019, 13, 422. [Google Scholar] [CrossRef] [Scilit] [PubMed]
- Bacci, S. Fine Regulation during Wound Healing by Mast Cells, a Physiological Role Not Yet Clarified. Int. J. Mol. Sci. 2022, 23, 1820. [Google Scholar] [CrossRef] [Scilit] [PubMed]
- Guth, C.; Limjunyawong, N.; Pundir, P. The Evolving Role of Mast Cells in Wound Healing: Insights from Recent Research and Diverse Models. Immunol. Cell Biol. 2024, 102, 878–890. [Google Scholar] [CrossRef] [Scilit] [PubMed]
- Tellechea, A.; Leal, E.C.; Kafanas, A.; Auster, M.E.; Kuchibhotla, S.; Ostrovsky, Y.; Tecilazich, F.; Baltzis, D.; Zheng, Y.; Carvalho, E.; et al. Mast Cells Regulate Wound Healing in Diabetes. Diabetes 2016, 65, 2006–2019. [Google Scholar] [CrossRef] [Scilit] [PubMed]
- Messina, A.; Knight, K.R.; Dowsing, B.J.; Zhang, B.; Phan, L.H.; Hurley, J.V.; Morrison, W.A.; Stewart, A.G. Localization of Inducible Nitric Oxide Synthase to Mast Cells During Ischemia/Reperfusion Injury of Skeletal Muscle. Lab. Investig. 2000, 80, 423–431. [Google Scholar] [CrossRef] [Scilit] [PubMed]
- Furuta, S.; Vadiveloo, P.; Romeo-Meeuw, R.; Morrison, W.; Stewart, A.; Mitchell, G. Early Inducible Nitric Oxide Synthase 2 (NOS 2) Activity Enhances Ischaemic Skin Flap Survival. Angiogenesis 2004, 7, 33–43. [Google Scholar] [CrossRef] [Scilit] [PubMed]
- Nardini, P.; Notari, L.; Magazzini, M.; Mariani, B.; Rossi, F.; Rossi, S.; Van Aardt, E.; Marszalek, K.; Grandi, V.; Corsi, A.; et al. Neuroimmunomodulatory Effect of Nitric Oxide on Chronic Wound Healing after Photodynamic Therapy. Photodiagn. Photodyn. Ther. 2024, 47, 104078. [Google Scholar] [CrossRef] [Scilit] [PubMed]
- Xu, H.; Shi, X.; Li, X.; Zou, J.; Zhou, C.; Liu, W.; Shao, H.; Chen, H.; Shi, L. Neurotransmitter and Neuropeptide Regulation of Mast Cell Function: A Systematic Review. J. Neuroinflamm. 2020, 17, 356. [Google Scholar] [CrossRef] [Scilit] [PubMed]
- Benyon, R.C.; Lowman, M.A.; Church, M.K. Human Skin Mast Cells: Their Dispersion, Purification, and Secretory Characterization. J. Immunol. 1987, 138, 861–867. [Google Scholar] [CrossRef] [Scilit]
- Magni, G.; Tatini, F.; Siena, G.D.; Pavone, F.S.; Alfieri, D.; Cicchi, R.; Rossi, M.; Murciano, N.; Paroli, G.; Vannucci, C.; et al. Blue-LED-Light Photobiomodulation of Inflammatory Responses and New Tissue Formation in Mouse-Skin Wounds. Life 2022, 12, 1564. [Google Scholar] [CrossRef] [Scilit] [PubMed]
- Gupta, K.; Harvima, I.T. Mast Cell-Neural Interactions Contribute to Pain and Itch. Immunol. Rev. 2018, 282, 168–187. [Google Scholar] [CrossRef] [Scilit] [PubMed]
- Zhang, S.; Sumpter, T.L.; Kaplan, D.H. Neuron—Mast Cell Cross-Talk in the Skin. J. Investig. Dermatol. 2022, 142, 841–848. [Google Scholar] [CrossRef] [Scilit] [PubMed]
- Magni, G.; Banchelli, M.; Cherchi, F.; Coppi, E.; Fraccalvieri, M.; Pugliese, A.M.; Pedata, F.; Mangia, A.; Gasperini, S.; Pavone, F.S.; et al. Human Keloid Cultured Fibroblasts Irradiated with Blue LED Light: Evidence from an in Vitro Study. In Proceedings of the Medical Laser Applications and Laser-Tissue Interactions IX, Munich, Germany, 23–25 June 2019; Optica Publishing Group: Washington, DC, USA, 2019; p. 11079_31. [Google Scholar]
- Rossi, F.; Cicchi, R.; Magni, G.; Tatini, F.; Bacci, S.; Paroli, G.; Alfieri, D.; Tripodi, C.; De Siena, G.; Pavone, F.; et al. Blue LED Induced Thermal Effects in Wound Healing: Experimental Evidence in an in Vivo Model of Superficial Abrasions. In Proceedings of the Energy-Based Treatment of Tissue and Assessment IX, San Francisco, CA, USA, 22 February 2017; SPIE: Bellingham, WA, USA, 2017; Volume 10066, p. 100660B. [Google Scholar]
- Rossi, F.; Cicchi, R.; Magni, G.; Tatini, F.; Bacci, S.; Paroli, G.; Alfieri, D.; Tripodi, C.; De Siena, G.; Pavone, F.S.; et al. In-Vivo Wound Healing Modulation after Irradiation with a Blue LED Photocoagulator. In Proceedings of the Medical Laser Applications and Laser-Tissue Interactions VIII, San Francisco, CA, USA, 1 August 2017; Lilge, L.D., Sroka, R., Eds.; SPIE: Bellingham, WA, USA, 2017; Volume Part F61-E, p. 501. [Google Scholar]
- Rossi, F.; Pini, R.; De Siena, G.; Massi, D.; Pavone, F.; Alfieri, D.; Cannarozzo, G. A Blue-LED-Based Device for Selective Photocoagulation of Superficial Abrasions: Theoretical Modeling and in Vivo Validation. In Proceedings of the Photonic Therapeutics and Diagnostics VI, San Francisco, CA, USA, 11 February 2010; SPIE: Bellingham, WA, USA, 2010; Volume 7548, p. 754807. [Google Scholar]
- Paroli, G.; Murciano, N.; Mancini, C.; Soldaini, M.; Rijli, S.; DeSiena, G.; Bacci, S. The Role of Mast Cells in Cellular Modifications Evoked by Exendin-4 in Treated Wounds: A Preclinical Study. J. Wound Care 2022, 31, 701–708. [Google Scholar] [CrossRef] [Scilit] [PubMed]
- Schindelin, J.; Arganda-Carreras, I.; Frise, E.; Kaynig, V.; Longair, M.; Pietzsch, T.; Preibisch, S.; Rueden, C.; Saalfeld, S.; Schmid, B.; et al. Fiji: An Open-Source Platform for Biological-Image Analysis. Nat. Methods 2012, 9, 676–682. [Google Scholar] [CrossRef] [Scilit] [PubMed]
- Araújo, G.L.B.; Soares, L.G.P.; Santos, A.S.; Cangussú, M.C.T.; dos Santos, J.N.; Pinheiro, A.L.B. Effects of Violet and IR LED Light on Mast Cell Degranulation: In Vivo Study in a Murine Model. Lasers Med. Sci. 2023, 38, 159. [Google Scholar] [CrossRef] [Scilit] [PubMed]
- Yamamoto, H.; Kiryu, M.; Sawaguchi, Y.; Yamada, T. Opsin 3-Mediated Regulation of Blue Light-Induced β-Hexosaminidase Release from Mast Cells. Drug Discov. Ther. 2025, 19, 184–188. [Google Scholar] [CrossRef] [Scilit] [PubMed]
- Siiskonen, H.; Fok, J.S.; Buscone, S.; Castellano Pellicena, I.; Uzunbajakava, N.; Botchkareva, N.; Maurer, M.; Scheffel, J. Human Skin Mast Cells Express Photoreceptors. J. Eur. Acad. Dermatol. Venereol. 2024, 38, e629–e631. [Google Scholar] [CrossRef] [Scilit] [PubMed]
- Toda, M.; Suzuki, T.; Hosono, K.; Kurihara, Y.; Kurihara, H.; Hayashi, I.; Kitasato, H.; Hoka, S.; Majima, M. Roles of Calcitonin Gene-Related Peptide in Facilitation of Wound Healing and Angiogenesis. Biomed. Pharmacother. 2008, 62, 352–359. [Google Scholar] [CrossRef] [Scilit] [PubMed]
- Chéret, J.; Lebonvallet, N.; Buhé, V.; Carre, J.L.; Misery, L.; Gall-Ianotto, C.L. Influence of Sensory Neuropeptides on Human Cutaneous Wound Healing Process. J. Dermatol. Sci. 2014, 74, 193–203. [Google Scholar] [CrossRef] [Scilit] [PubMed]
- Liu, Z.; Wu, H.; Huang, S. Role of NGF and Its Receptors in Wound Healing (Review). Exp. Ther. Med. 2021, 21, 599. [Google Scholar] [CrossRef] [Scilit] [PubMed]
- Bernabei, R.; Landi, F.; Bonini, S.; Onder, G.; Lambiase, A.; Pola, R.; Aloe, L. Effect of Topical Application of Nerve-Growth Factor on Pressure Ulcers. Lancet 1999, 354, 307. [Google Scholar] [CrossRef] [Scilit] [PubMed]
- Barker, P.A.; Mantyh, P.; Arendt-Nielsen, L.; Viktrup, L.; Tive, L. Nerve Growth Factor Signaling and Its Contribution to Pain. J. Pain Res. 2020, 13, 1223–1241. [Google Scholar] [CrossRef] [Scilit] [PubMed]
Disclaimer/Publisher’s Note: The statements, opinions and data contained in all publications are solely those of the individual author(s) and contributor(s) and not of MDPI and/or the editor(s). MDPI and/or the editor(s) disclaim responsibility for any injury to people or property resulting from any ideas, methods, instructions or products referred to in the content. |
© 2026 by the authors. Licensee MDPI, Basel, Switzerland. This article is an open access article distributed under the terms and conditions of the Creative Commons Attribution (CC BY) license.