


Featured Application
A deeper understanding of solvent diffusion and transient concentration gradients in conductive polymer nanocomposites provides new opportunities for improving the selectivity of chemo-resistive VOC sensors. By exploiting the different sorption and diffusion kinetics of volatile organic compounds, governed by both molecular size and intermolecular interactions, the proposed approach offers new discriminating features for the development of next-generation electronic noses.
Abstract
Conductive polymer nanocomposites (CPC) are widely investigated as chemo-resistive materials for the detection of volatile organic compounds (VOC). However, the physical mechanisms governing their transient electrical response remain only partially understood, limiting the development of predictive models and highly selective sensors. In this work, the chemo-resistive behaviour of carbon nanoparticle-filled poly(ethylene-co-ethyl acrylate) (EEA-CNP) was investigated through a multiphysics experimental approach combining simultaneous measurements of solvent uptake, dimensional changes, temperature and electrical resistance during toluene sorption and desorption. Thick specimens were deliberately employed to amplify transient diffusion phenomena and enable direct observation of the coupling between mass transport, polymer swelling and conductive network evolution. The results demonstrate that electrical resistance cannot be interpreted solely from the average solvent concentration within the material. Instead, the transient response is primarily governed by solvent concentration gradients, which continuously modify the connectivity of the conductive nanoparticle network during diffusion. This mechanism explains the pronounced hysteresis observed between sorption and desorption, the transient resistance overshoot during sorption, and the absence of a unique relationship between resistance and solvent content under dynamic conditions. A dedicated quasi-static desorption protocol was therefore developed to minimise concentration gradients and establish the intrinsic correlation between electrical resistivity and solvent fraction. The experiments further show that a solvent content of approximately 6 wt% is sufficient to completely disrupt the conductive percolation network. These findings provide new insights into the multiphysics mechanisms governing chemo-resistive sensing and establish an experimental basis for the development and validation of predictive models for conductive polymer nanocomposites. The proposed methodology is expected to contribute to the optimisation of next-generation VOC sensors and electronic noses with improved selectivity and predictive capability.
1. Introduction
Electrically conductive polymer nanocomposites (CPC) are increasingly employed as smart, stimuli-responsive materials owing to their unique combination of electrical functionality, mechanical compliance and ease of processing. They are produced by dispersing conductive nanoparticles (CNP) within one or more electrically insulating polymer matrices, thereby combining the advantages of polymeric materials with the electrical properties of conductive nanofillers [1]. Their high sensitivity to environmental stimuli, including mechanical deformation, temperature and chemical exposure, makes CPC particularly attractive for sensing applications. Consequently, CPC have been widely investigated for pressure and strain sensing [2,3,4,5,6,7,8], structural health monitoring of composite materials [9,10,11,12,13,14,15,16], temperature sensing [7,17,18,19,20], volatile organic compounds’ detection (VOC) [21,22,23,24,25,26,27], and resistive Joule heating [28,29,30,31,32,33].
One emerging application of CPC is the detection of volatile organic compounds emitted by the human body, collectively referred to as the volatolome, for the early diagnosis of a wide range of diseases [19,34,35,36,37,38,39,40,41]. In these chemo-resistive sensors, maintaining a stable and reproducible conductive network under dynamic operating conditions is essential to ensure reliable sensor performance.
Although these applications rely on different physicochemical mechanisms and involve CPC with diverse formulations, their electrical response originates from the disruption of the percolated conductive network. The associated transduction mechanism is governed by quantum tunnelling between neighbouring conductive nanoparticles at the nanoscale [42,43,44,45,46].
Most previous studies on chemo-resistive CPC have focused on evaluating sensor sensitivity and selectivity by analysing the influence of polymer chemistry, filler morphology and processing conditions on relative electrical resistance changes. In contrast, only a limited number of investigations, notably those of Carrillo et al. [47,48], have attempted to elucidate the underlying sensing mechanisms through the simultaneous monitoring of several coupled physical parameters, including electrical resistance and volume changes.
A major challenge in the development of CPC-based electronic noses (e-noses) is to improve sensor selectivity while reducing the number of transducers required for reliable VOC identification [49,50,51,52]. Another important objective is the development of predictive multiphysics models capable of describing and forecasting the chemo-resistive response of CPC sensors, a topic that will be addressed in a forthcoming publication. However, the small dimensions of practical quantum chemo-resistive vapour sensor (vQRS) transducers make it difficult to acquire the comprehensive experimental data required for model validation. Although thin sensing layers are ideally suited for practical devices, their short diffusion paths considerably limit the observation of transient transport phenomena.
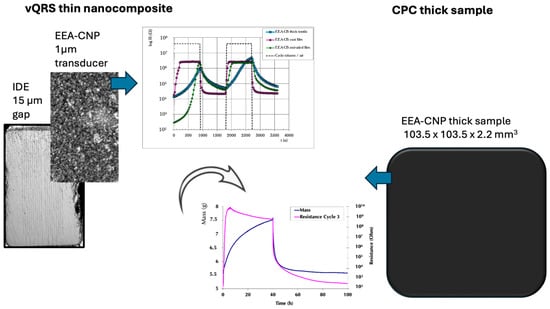
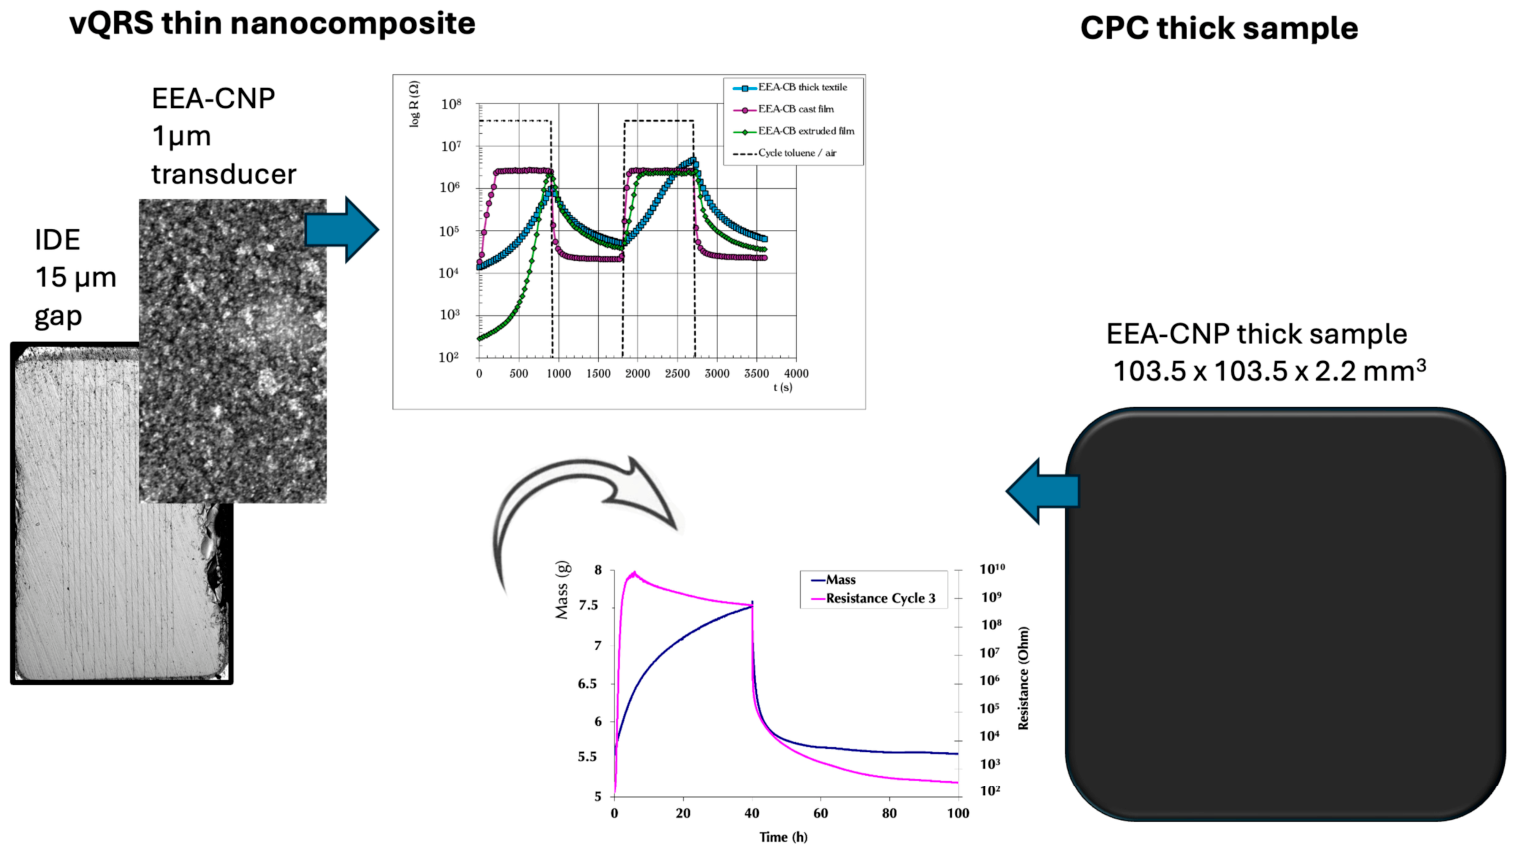
To overcome this limitation, a dedicated experimental methodology based on thicker laboratory specimens was developed. Increasing the diffusion length deliberately slows solvent transport, making it possible to simultaneously monitor the coupled phenomena governing the chemo-resistive response, namely solvent diffusion, polymer swelling, mass uptake, dimensional changes and electrical resistance. Figure 1 illustrates the conceptual analogy between the transient response previously observed in practical ultrathin CPC transducers (cast films, extruded films and textile sensors) [53], and that of the thick laboratory specimens investigated in the present work. Although the characteristic diffusion times differ by several orders of magnitude, both configurations are governed by the same transport mechanisms.
Figure 1.
Motivation of the study: understanding the origin of the chemo-resistive response of EEA-CNP-based CPC by studying the sorption/desorption behaviour of either ultrathin transducers (left) or much thicker samples (right).
Previous work demonstrated that solvent transport in these materials follows Fick’s second law of diffusion [54,55], allowing the diffusion coefficient to be estimated using Equation (1).
with t0.5 the half sorption time, and 2L the specimen thickness.
The influence of specimen thickness on diffusion kinetics is readily illustrated by the two inset graphs in Figure 1. Sorption equilibrium is reached after approximately 100 s for a 1 μm thick film, whereas a 2.2 mm thick specimen requires more than 40 h to reach equilibrium. This considerable increase in characteristic diffusion time provides sufficient temporal resolution to investigate the coupling between solvent transport, swelling and electrical response.
In the present study, a single polymer/solvent system was selected to investigate the fundamental mechanisms governing chemo-resistive sensing. Simultaneous measurements of mass, volume and electrical resistance were performed while monitoring heat and mass transfer within an ethylene-co-ethyl acrylate matrix filled with carbon nanoparticles at concentrations well above the electrical percolation threshold. The objective was to establish the relationships between solvent transport, polymer swelling and electrical response, thereby improving the understanding of the mechanisms controlling the chemo-resistive behaviour of CPC based transducers exposed to toluene vapour. The results provide new insights into the physical mechanisms governing VOC sensing and establish the experimental basis for future predictive multiphysics modelling of CPC-based electronic nose transducers [52,56,57,58,59].
2. Materials and Methods
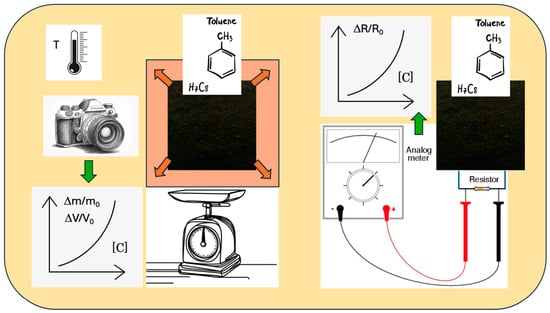
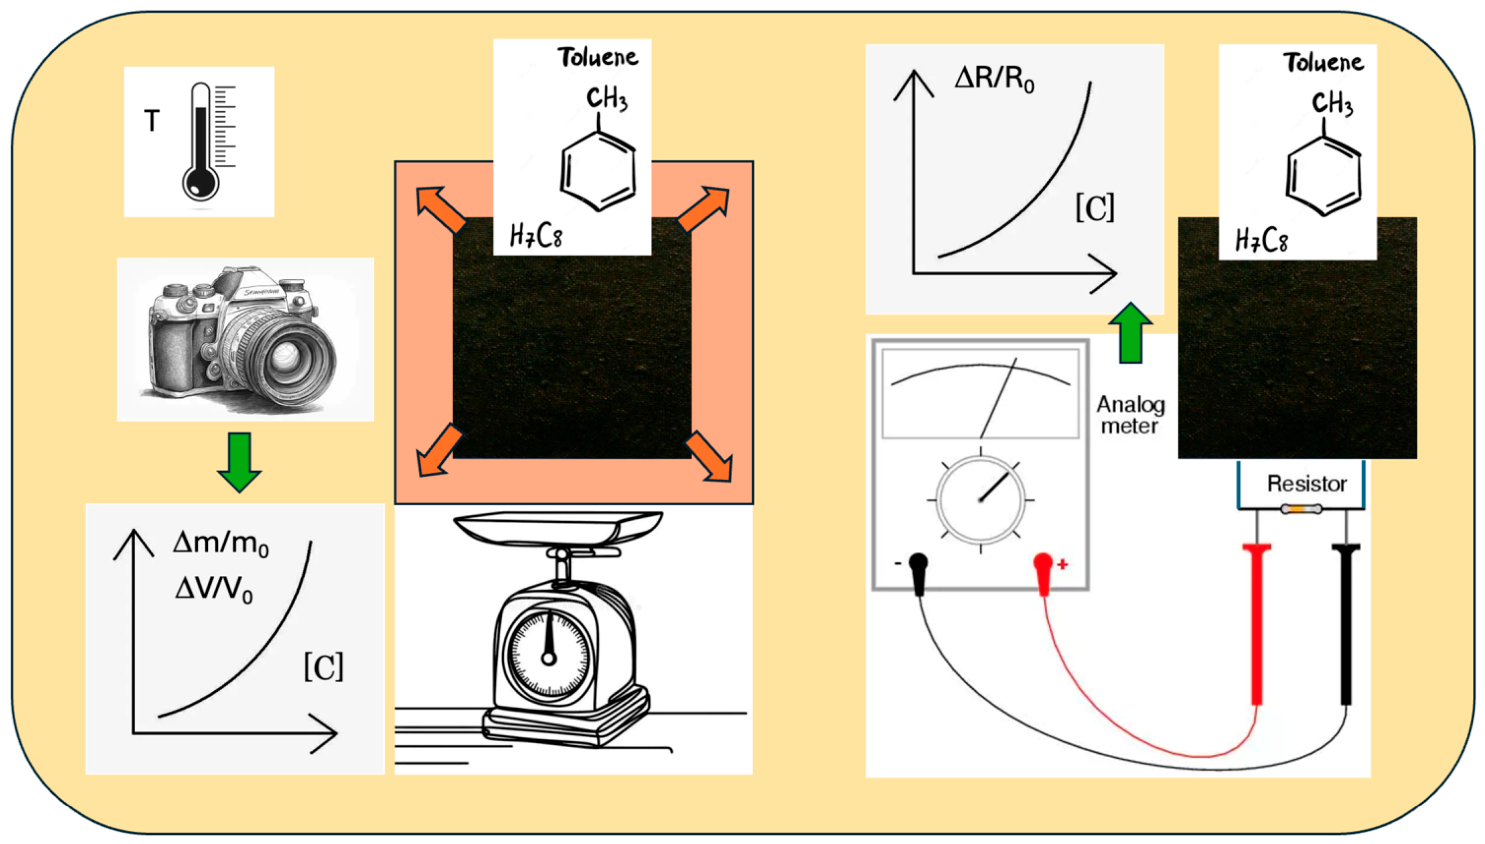
The experimental methodology was specifically developed to monitor, in real time, the coupled evolution of mass uptake, dimensional changes, temperature and electrical resistance during solvent sorption and desorption in thick poly (ethylene-co-ethyl acrylate)/carbon nanoparticle (EEA-CNP) specimens (Figure 2).
Figure 2.
Schematic representation of the experimental setup used for the simultaneous monitoring of mass uptake (Δm/m0), volume change (ΔV/V0) and relative electrical resistance (ΔR/R0) during solvent sorption and desorption under varying vapour concentrations.
2.1. Materials
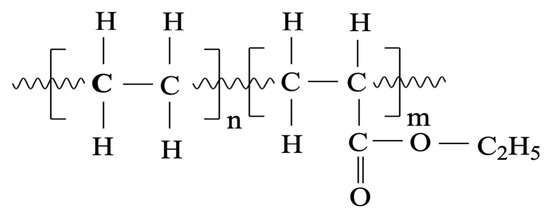
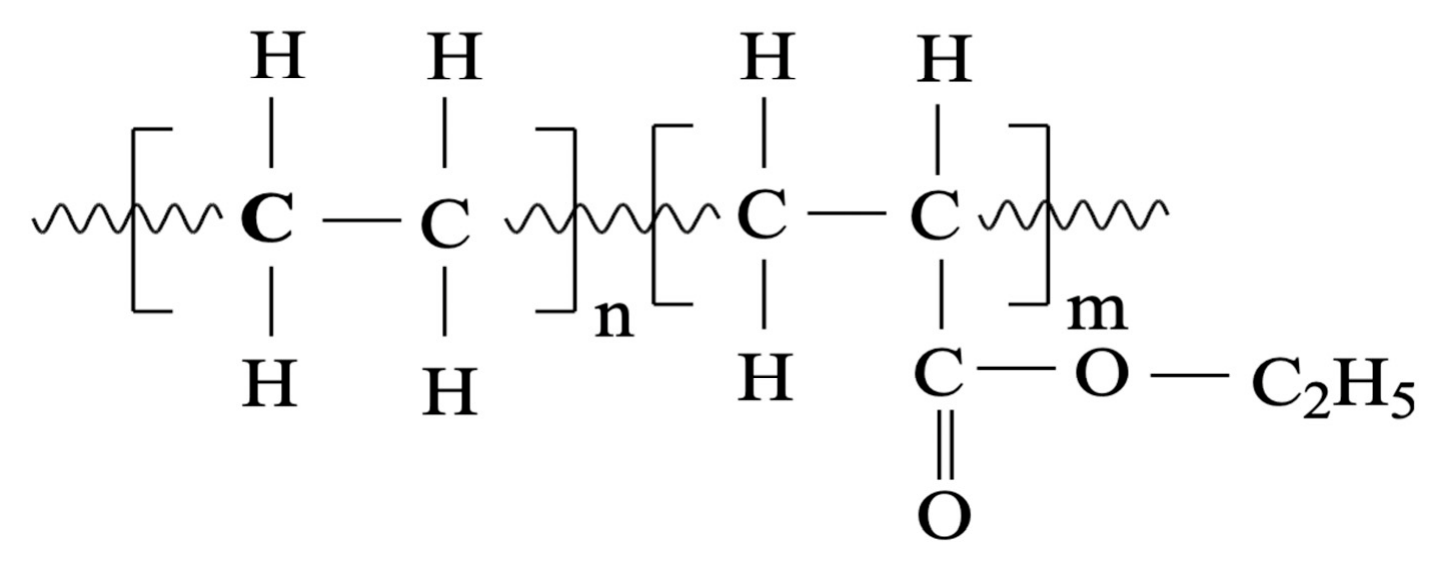
The poly(ethylene-co-methyl acrylate) (EEA) masterbatch used in this study, filled with 37% w/w (23% v/v) carbon nanoparticles (CNP), was the commercial grade LE 7704 supplied by Borealis (Zwijndrecht, Belgium). This formulation was selected because it is well above the electrical percolation threshold while remaining processable by compression moulding. EEA is a statistical copolymer produced via radical polymerization of ethylene and ethyl acrylate in a 0.86/0.14 ratio, as illustrated in Figure 3. Due to its low crystallinity (approximately 15% of that of low-density polyethylene, LDPE) EEA exhibits pronounced elastomeric properties [60,61]. Increasing the acrylate content reduces both the melting enthalpy and melting temperature, while the carbon nanoparticles act as nucleating agents, elevating the non-isothermal crystallisation temperature [62]. Additionally, CNP strongly influence the viscoelastic properties of the copolymer, exponentially increasing viscosity, energy dissipation, and Young’s modulus [63,64,65]. These modifications can have substantial implications for material processing.
Figure 3.
Chemical formula of poly(ethylene-co-alkyl acrylate) EEA, with molar composition of n = 0.86 and m = 0.14.
The carbon nanoparticles (CNP) used in this study were Vulcan XC72, supplied by Cabot (Lillebone, France). These carbon nanoparticles, commonly referred to as “carbon black” in the rubber industry, are produced through the incomplete combustion of heavy petroleum products in a controlled-atmosphere furnace. Their key characteristics include: a specific surface area of 174 m2.g−1 (measured by N2 adsorption), a pore volume of 110 cm3 per 100 g (determined by dibutyl phthalate absorption, DBP), an iodine number of 253 mg.g−1, and an average particle diameter ranging from 30 to 50 nm [48].
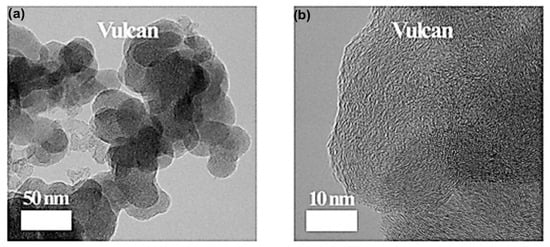
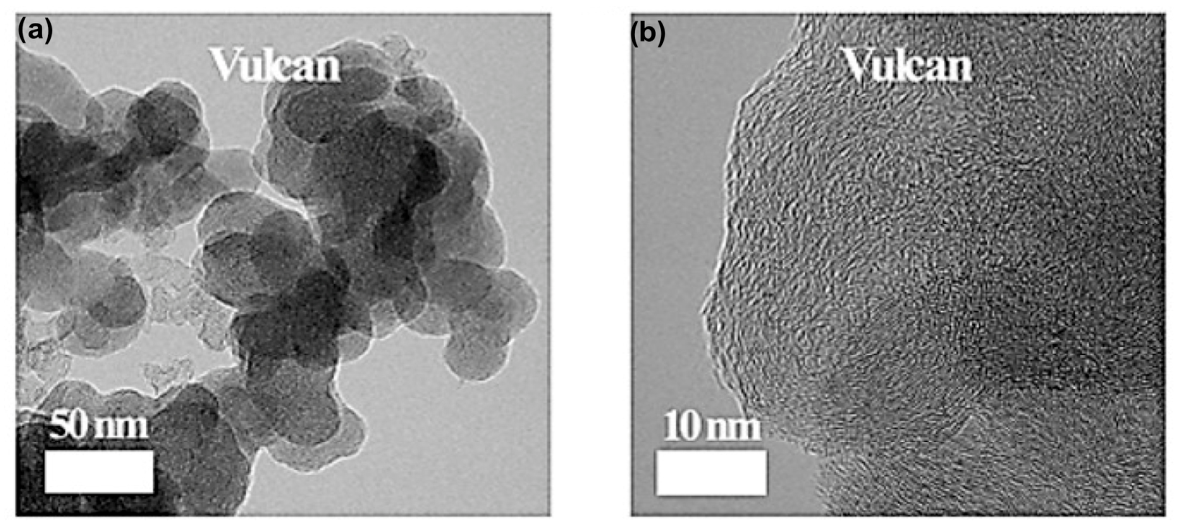
The structure of the CNP is illustrated in Figure 4, which shows (a) a highly structured primary aggregate of several hundred nanometres in size and (b) the average size of the elementary particles composing these aggregates. Due to these properties, Vulcan XC72 is well suited for developing conductive polymer nanocomposites for electrical applications, such as self-limiting heating and vapour sensing [55].
Figure 4.
Vulcan XC 72 CNP nanostructure observed by TEM, (a) primary aggregate of about 300 nm in length, (b) single particle of approximately 30 nm reproduced from Ref. [66].
Toluene obtained from Acros Organics (Ilkirch, France) was selected to study the chemo-resistive behaviour of EEA-CNP because of its good affinity for EEA, which provides sufficient solvent uptake to ensure accurate sorption measurements. According to a previous work [55], the theoretical Flory-Huggins intermolecular interaction parameter, between EEA and toluene, calculated from Equation (2) is κ12 = 0.016.
where the molar volume of the solvent (cm3.mol−1), T: the temperature (K), R = 8.314 J.mol−1, δ1: the solvent solubility (J1/2.cm−3/2), and δ2: the polymer solubility (J1/2.cm−3/2).
The experimental methodology requires the fabrication of large, homogeneous flat plates to ensure essentially one-dimensional heat and mass transfer through the specimen thickness (Figure 2). The specimen dimensions must also provide sufficient mass for accurate gravimetric measurements while allowing reliable determination of dimensional changes during sorption and desorption. Table 1 summarises some characteristics of EEA and toluene.
Table 1.
Relevant physicochemical properties of toluene and EEA-CNP.
2.2. Nanocomposites Samples’ Processing
Approximately 40 g of EEA-37CNP pellets were first homogenised in a Plasticorder internal mixer Model W EHT 50 (Brabender, Pousan, France) at a mixing temperature (Tmix) of 130 °C for 8 min. The rotational speed of the blades was gradually increased from 10 to 80 rpm.
The molten material was subsequently poured into an aluminium mould with dimensions of 105 × 105 × 20 mm3, placed between two 5 mm steel plates coated with PTFE to prevent adhesion. The material was then hot-pressed at 130 °C under a pressure of 2 MPa for 5 min. To ensure uniform thickness, the press was opened, and the mould was allowed to cool to room temperature (20 °C). If the sample dimensions were satisfactory, the plates were annealed for 1 min and 30 s at 150 °C under 2 MPa, followed by controlled cooling: first to 120 °C at a rate of 1 °C.min−1, and then to 80 °C at the same rate. The press was subsequently opened, and the sample was cooled in ambient air.
The cooling protocol was designed to rapidly quench the material below its non-isothermal crystallisation temperature before promoting controlled crystallisation during slow cooling. The resulting EEA-CNP plates exhibited a final square shape of 103.5 ± 1.5 mm and a thickness of 2.2 ± 0.2 mm. This geometry was fixed as it represents a good compromise between diffusion time, measurement accuracy, and experimental feasibility.
2.3. Experimental Setup
The experimental setup was designed to monitor simultaneously monitor the evolution of several representative physical quantities of the multiphysics behaviour of CPC tapes during the sorption and desorption phases: solvent content, temperature, volume, aand electrical resistance. Nevertheless, as the measurements of mass loss/uptake and electrical resistance on the same sample proved to be rather difficult because of electrical connection constraints, it was decided to solve this difficulty by using two nominally identical specimens (Figure 2).
One of the two specimens was equipped with electrical conductors to monitor changes in electrical resistance, while the second specimen was used to track mass uptake/loss and dimensional changes resulting from solvent diffusion.
To ensure identical experimental conditions, both specimens were positioned vertically in a Plexiglas™ chamber and simultaneously exposed to the natural convection of toluene vapour, with the concentration varying from zero to saturation. The specimens used for testing had a thickness of 2 mm and side lengths of 5 cm. These test specimens were cut from larger plates previously fabricated with dimensions of 105 × 105 × 2 mm3. Special care was taken to select pairs of specimens with highly similar characteristics.
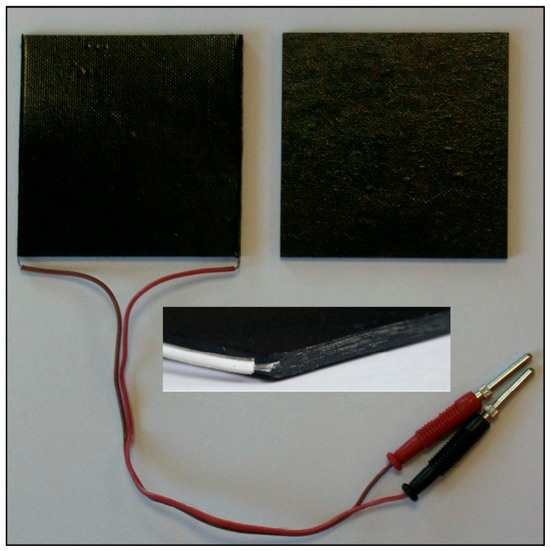
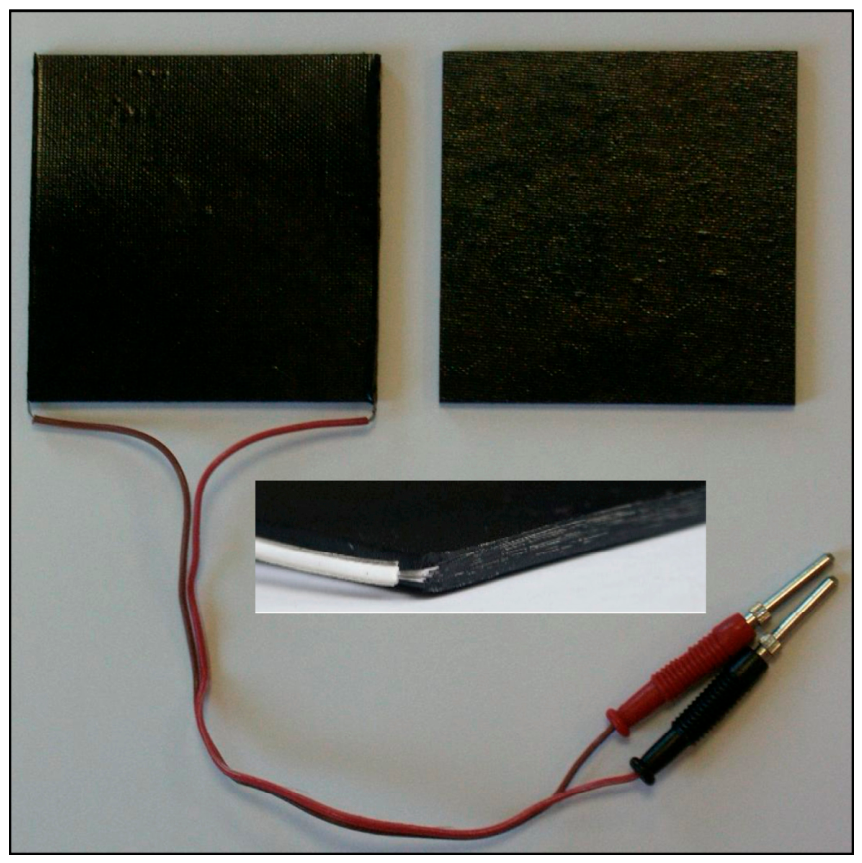
The selected specimens were further machined using a milling process to achieve nearly identical dimensions and then thermally treated to relieve any residual stress accumulated during processing. This protocol ensured that the resulting specimens exhibited very similar initial electrical resistances. Additionally, to ensure consistent electrical contact throughout the experiments, a bundle of seven parallel tin-plated copper wires (0.12 mm in diameter each) was embedded directly into the sample immediately after the compression processing step (Figure 5 left). This was achieved by locally melting the polymer around the wires using a soldering iron set to 180 °C (Figure 5 middle).
Figure 5.
Photographs of the two instrumented EEA-CNP specimens used for simultaneous multiphysics measurements. “Left” connected sample for chemo-resistive measurement, “middle” detail of electrodes integration in specimen thickness, “right” twin sample for weight measurement.
Specimen n°2 (Figure 5 right) weighing was performed using an Explorer Pro 613C from Ohaus (Parsippany, USA) scale with a milligram precision.
The electrodes located on both edges of the samples allowed for the measurement of the electrical resistance of specimen n°1 using a Keithley data acquisition system within the range of 0–120 MΩ, (Figure 2). The measurement accuracy of this device ranges from 10−3 Ω to 105 Ω for resistances between 100 Ω and 100 MΩ, respectively. Because the specimen resistance increased up to approximately 1011 Ω under saturated vapour conditions, a 100 MΩ shunt resistor (±1%) was incorporated into the measurement circuit to extend the accessible resistance range. Nevertheless, a global measurement uncertainty of approximately 0.1% was achieved for resistance values below 100 MΩ.
Ambient temperature (Text) near the specimens was monitored using a K-type thermocouple with a diameter of 0.25 mm. Additional thermocouples were inserted either at the specimen surface or within its core whenever local temperature measurements were required. Data display and recording were managed using a custom programme developed in Visual Basic© 16.9. The acquisition interval was typically set to 30 s for short-duration measurements and 1 min for long-duration monitoring.
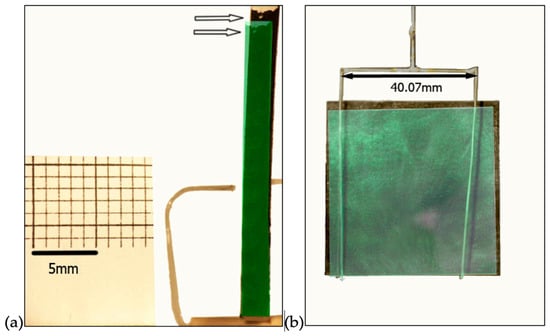
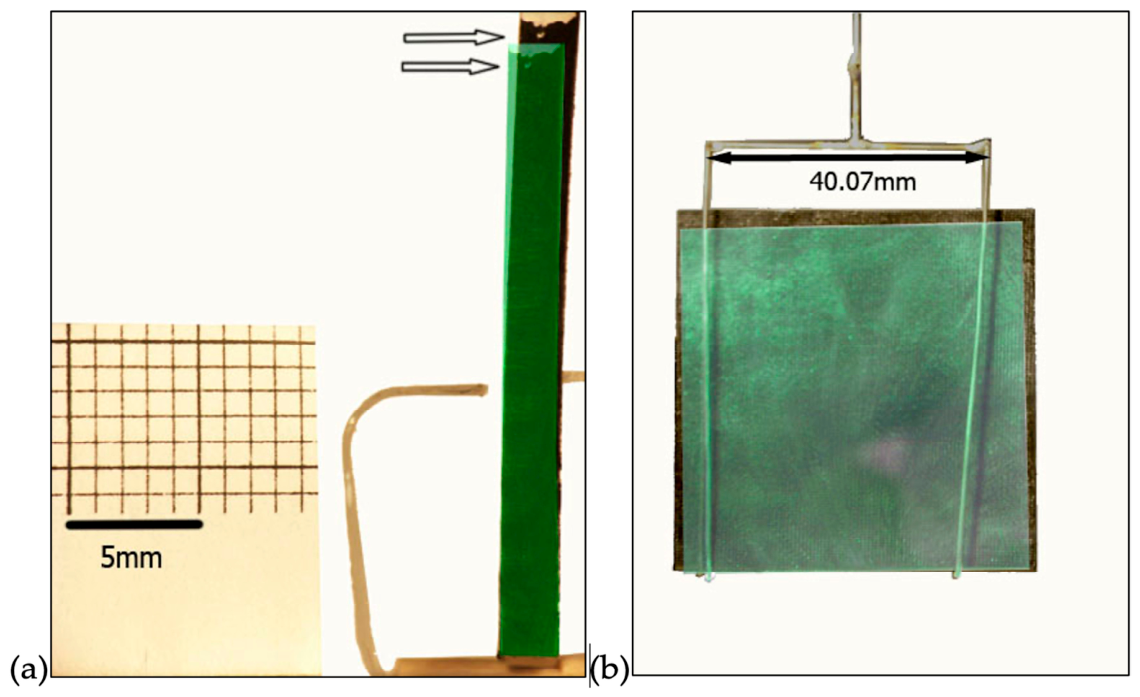
Volume changes were determined by digital image analysis using a programmable 5-megapixel camera. Photos were taken with a ×2.5 lens, allowing proper magnification of the edge of samples with a depth of field of about 1 mm. Figure 6 gives an idea of the level of expansion of the materials upon sorption, by overlaying the photos taken with EEA-37CNP tapes before and after toluene saturated vapour diffusion. Figure 6a is a side view and Figure 6b is a lateral view of samples combined with graph paper pieces placed aside and behind the samples, respectively. Volume changes were then derived from the two quantifiable dimensions, i.e., thickness and surface area, assuming that the former is uniform over the entire sample. The accuracies of the picture dimensions and focus distance were approximately 10 µm.pix−1 and 35 ± 5 µm.pix−1, respectively. The camera was positioned outside the cell to prevent any damage by the solvent.
Figure 6.
Superimposed images of an EEA-CNP specimen before and after exposure to saturated toluene vapour illustrating swelling in (a) side view, white arrows show the direction of curvature and (b) front view, the black arrow gives the specimen scale.
Table 2 gives a summary of the main geometric and resistive characteristics of the plates used. Three pairs of tapes were used in this study (A1&2, B1&2, C1&2), to check the experimental reproducibility. The resistance values are given before and after saturation of the sample with toluene (resp. for a solvent fraction of X = 0 and Xmax).
Table 2.
EEA-37CNP tapes characteristics, before and after saturation with toluene.
3. Results and Discussion
3.1. Toluene Vapour Desorption in Air
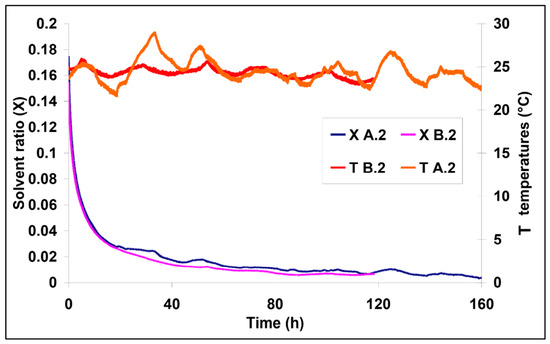
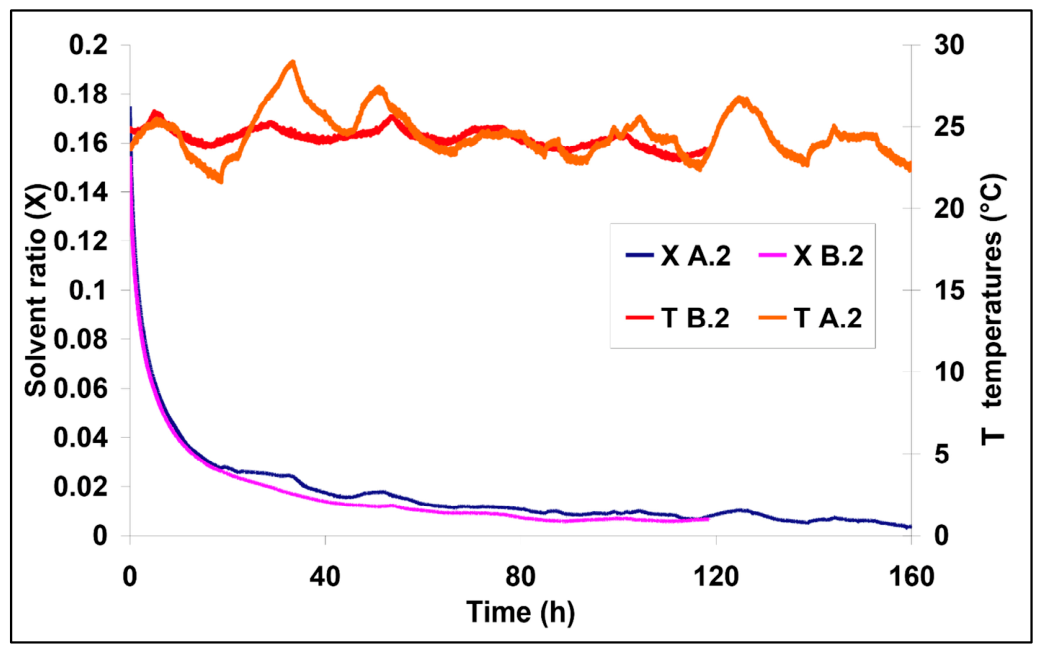
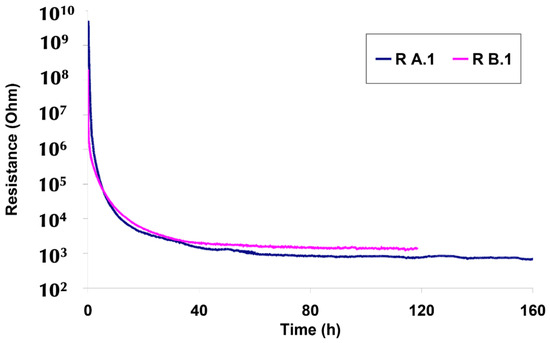
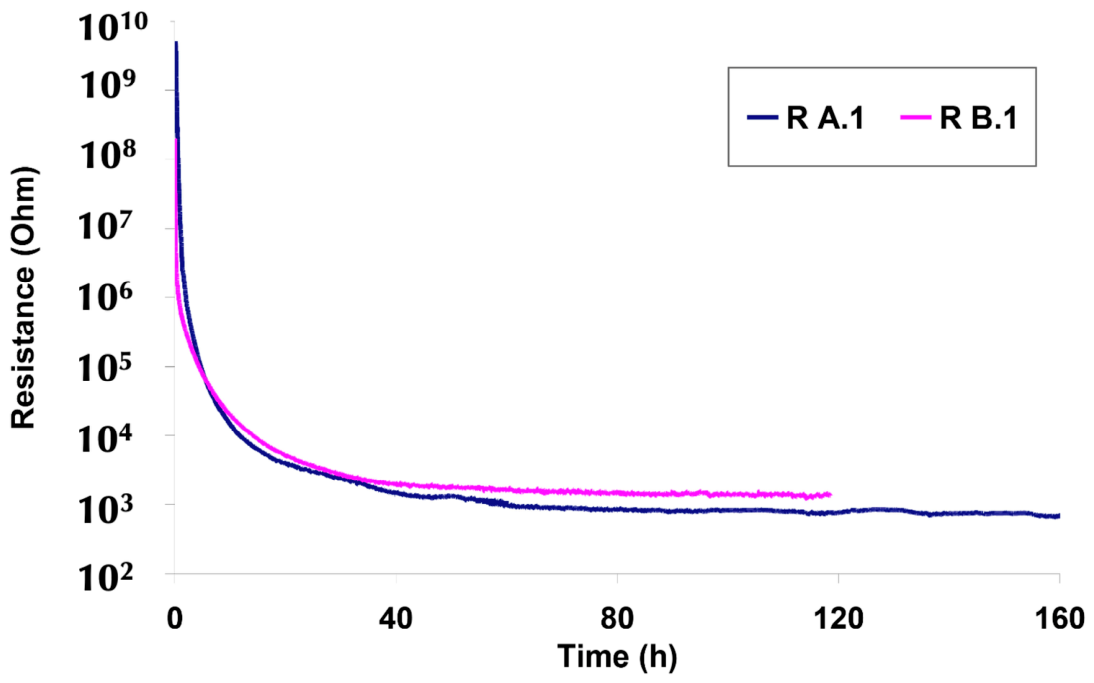
To investigate solvent desorption under ambient conditions, the specimens were first equilibrated for 96 h in a chamber saturated with toluene vapour before being exposed to open air. The subsequent evolution of solvent mass loss and electrical resistance is presented in Figure 7 and Figure 8 for the two independent pairs of EEA-37CNP specimens (A and B).
Figure 7.
Evolution of specimen mass and ambient temperature during desorption of EEA-37CNP specimens A2 and B2.
Figure 8.
Evolution of the electrical resistance of EEA-37CNP specimens A1 and B1 during desorption.
The desorption kinetics obtained for both specimen pairs are remarkably similar (Figure 7) demonstrating the excellent reproducibility of the experimental protocol. The solvent fraction decreased from an initial value of approximately 0.17 to less than 0.005 after about 120 h, with nearly identical desorption curves for both samples. Small fluctuations observed for specimen A2 during the first 20 h are attributed to ambient temperature variations (approximately ±2.5 °C around 25 °C), which slightly affected the balance response through the day/night temperature cycle. These fluctuations remained negligible compared with the overall desorption trend.
The corresponding electrical response is shown in Figure 8. During desorption, the electrical resistance decreased by more than six orders of magnitude while approximately 1 g of absorbed toluene was released. After approximately 120 h, the resistance reached a stable value close to 103 Ω, which remained significantly higher than the initial resistance measured before sorption (Table 2), i.e., 65 and 74 Ω. This irreversible increase is attributed to a partial reorganisation of the conductive carbon nanoparticle network caused by the large volumetric expansion experienced during solvent absorption. Such behaviour contrasts with that observed after thermal annealing, where structural relaxation generally improves inter-particle connectivity, resulting in a decrease in electrical resistance.
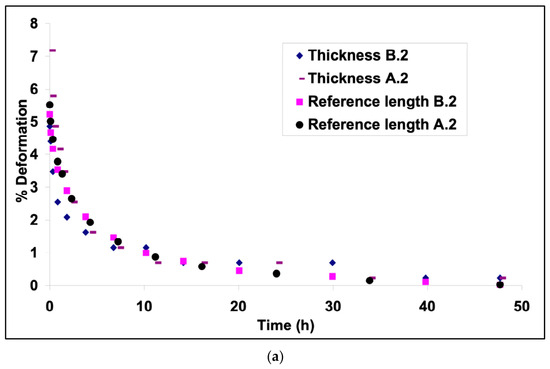
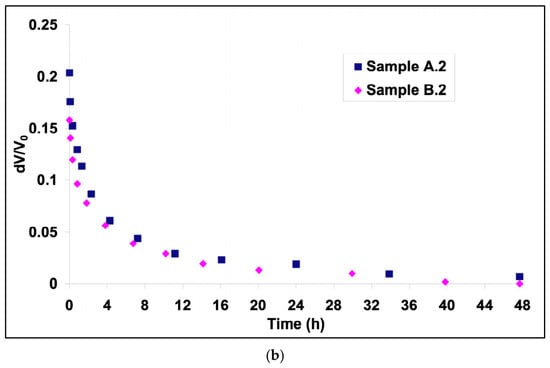
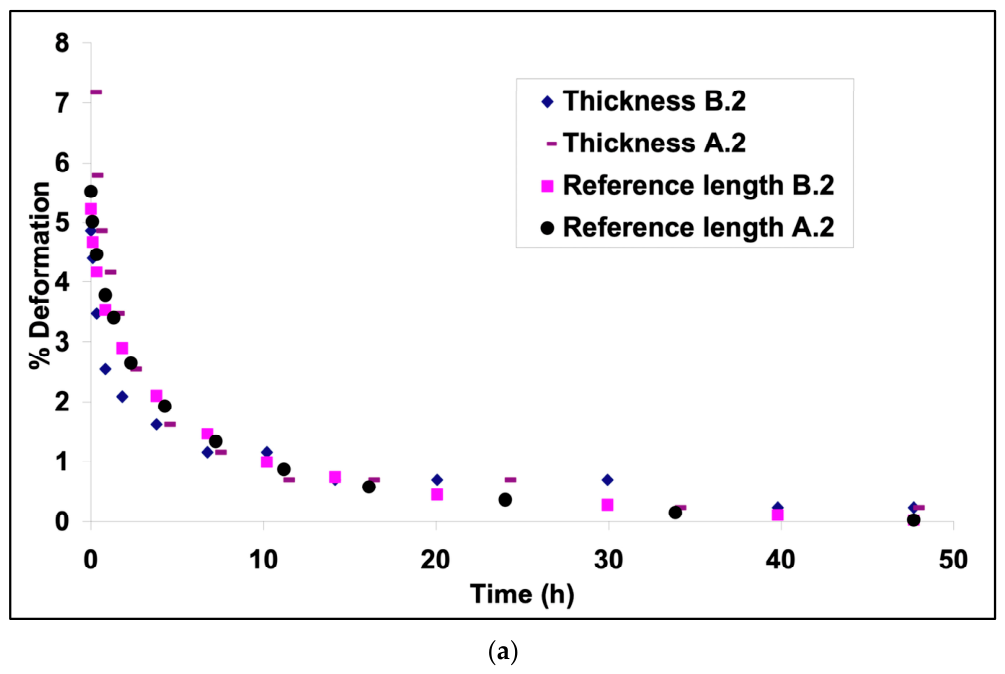
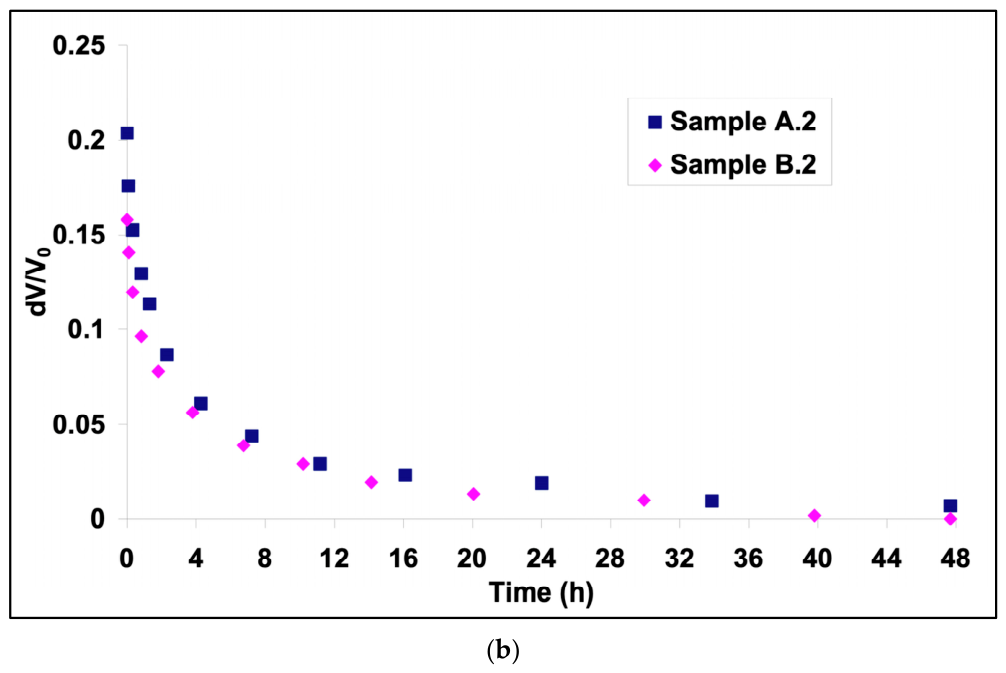
Dimensional changes determined by digital image analysis are presented in Figure 9. The nearly identical relative variations in specimen thickness and length Figure 9a, confirm that swelling and shrinkage can reasonably be considered isotropic throughout the experiment. This assumption was therefore used to calculate the relative volume variation shown in Figure 9b. The close agreement obtained for the two independent specimens further confirms the excellent repeatability of the measurements.
Figure 9.
Evolution of (a) specimen thickness and length and (b) relative volume during desorption of EEA-37CNP specimens A2 and B2.
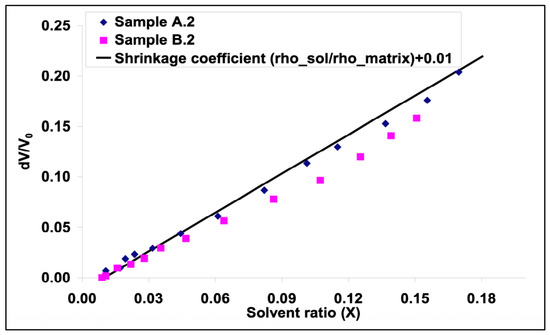
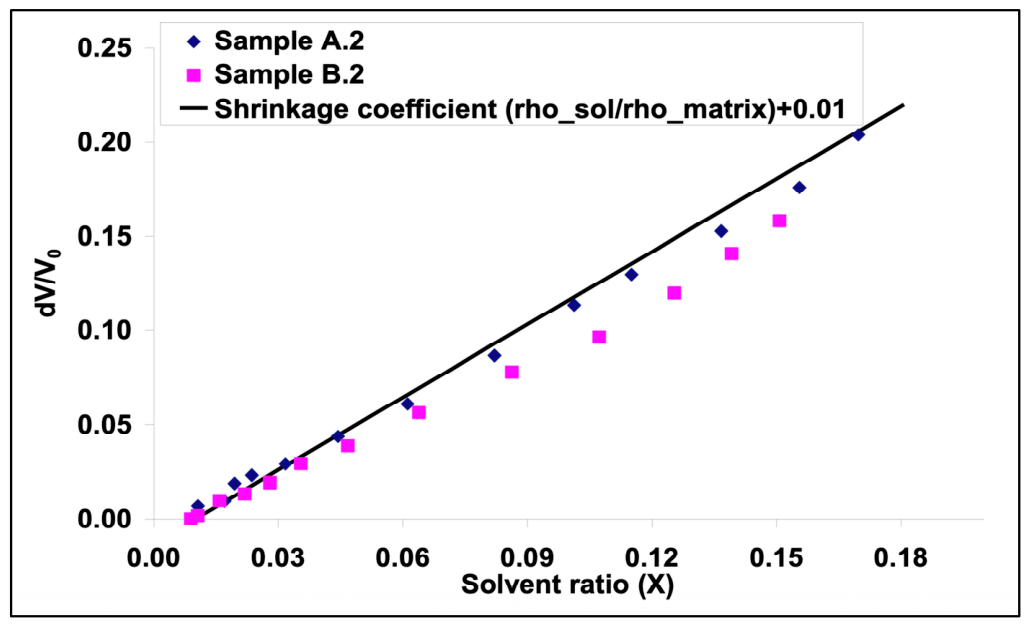
Figure 10 shows the relationship between the relative volume change and the solvent fraction during desorption. Over most of the investigated concentration range, the volume decreases almost linearly with solvent content, indicating that isotropic contraction provides an excellent approximation of the deswelling process. Only at very low solvent fractions (X < 0.01) do experimental uncertainties become comparable to the dimensional variations, leading to slight deviations from linear behaviour.
Figure 10.
Relative volume variation as a function of solvent fraction during desorption.
Taken together, these results reveal a strong correlation between solvent uptake, dimensional changes, and electrical response during desorption. However, the analysis also indicates that the average solvent content alone cannot fully explain the electrical behaviour of the nanocomposite. Because the solvent concentration remains spatially non-uniform throughout the specimen during transient diffusion, concentration gradients are expected to play a major role in the progressive reconnection of the conductive carbon nanoparticle network. This hypothesis is examined in the following sections through dedicated sorption/desorption experiments.
3.2. Sorption/Desorption Hysteresis
To investigate the coupling between solvent diffusion and the electrical response of the nanocomposite, the specimens were subjected to successive sorption/desorption cycles. During each sorption stage, toluene was continuously injected into the sealed chamber until the atmosphere approached saturation. Once the electrical resistance reached a stable value, the chamber was opened to initiate desorption under ambient conditions.
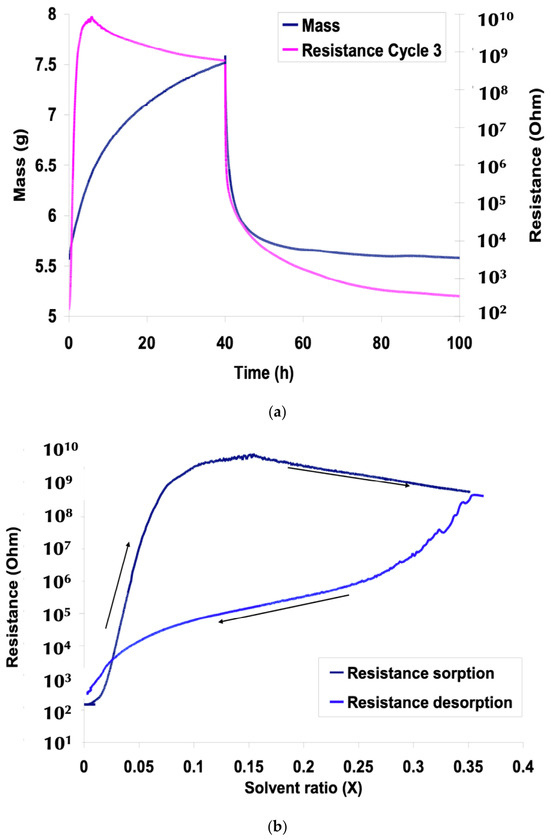
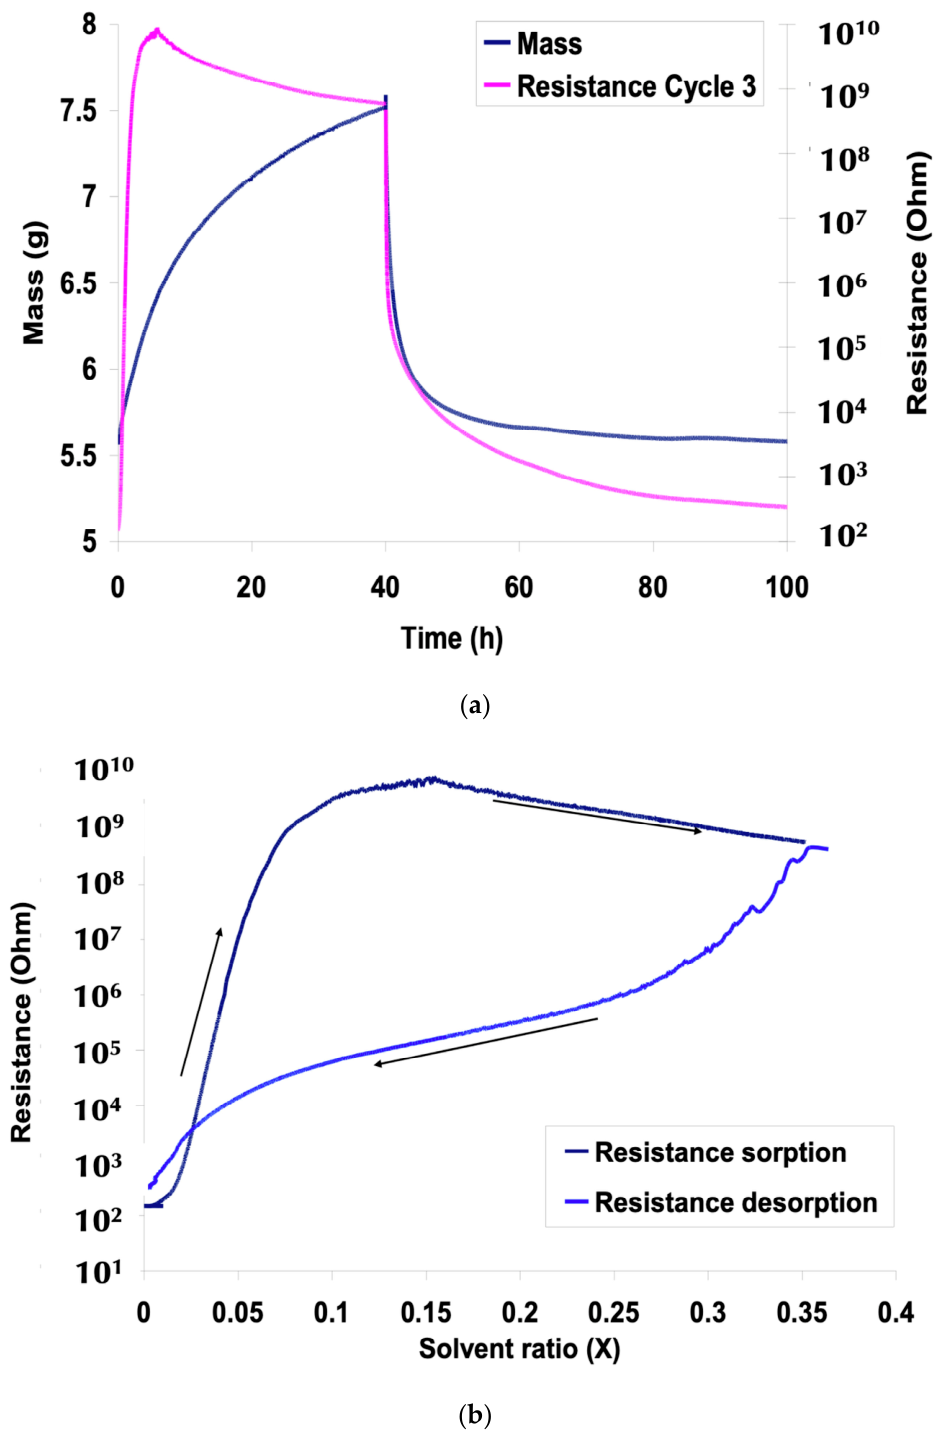
The simultaneous evolution of solvent uptake and electrical resistance during a representative cycle is presented in Figure 11a. The two measured quantities exhibit markedly different transient behaviours. Solvent uptake increases progressively throughout the experiment without reaching equilibrium within the investigated time, whereas the electrical resistance responds much more rapidly. During sorption, the resistance first increases sharply, reaches a pronounced maximum and subsequently decreases towards a lower plateau despite the continuous increase in solvent content. During desorption, the resistance decreases progressively until its initial value is recovered.
Figure 11.
Representative sorption/desorption cycle for specimen C: (a) simultaneous evolution of solvent uptake and electrical resistance with time; (b) electrical resistance as a function of solvent fraction, highlighting the hysteresis between sorption and desorption.
These differences become more evident when electrical resistance is plotted as a function of the solvent fraction (Figure 11b). A pronounced hysteresis is observed between the sorption and desorption paths, demonstrating that the electrical response cannot be described solely by the average solvent concentration within the specimen.
This behaviour originates from the transient solvent concentration gradients established during diffusion. During sorption, solvent molecules first penetrate the outer regions of the specimen before progressively reaching the core. The conductive carbon nanoparticle network is therefore disconnected locally near the surfaces, while the central region remains comparatively unaffected. As diffusion proceeds, the disruption progressively extends through the specimen thickness until the electrical resistance reaches its maximum. Further solvent redistribution within the polymer then promotes partial structural relaxation of the conductive network, leading to the slight decrease in resistance observed before equilibrium is reached.
The opposite mechanism governs desorption. Solvent is first removed from the specimen surface, where evaporation is the most intense, allowing the conductive network to reconnect locally while the core remains highly swollen. The conductive pathways are therefore progressively restored from the surface towards the centre of the specimen as solvent continues to diffuse outward. Consequently, for an identical average solvent fraction, the internal solvent distribution differs significantly between sorption and desorption, leading to distinct electrical resistance values. An important result is that the electrical resistance measured at the end of the cycle is nearly identical to its initial value before sorption. This observation indicates that, despite the large temporary disruption of the conductive network, the overall conductive architecture remains essentially reversible under the experimental conditions investigated.
These experiments also highlight a fundamental difference between gravimetric and electrical measurements. Mass measurements provide only the average solvent content within the specimen and are therefore insensitive to spatial concentration gradients. In contrast, electrical resistance directly reflects the connectivity of the conductive nanoparticle network, making it highly sensitive to the local solvent distribution. This distinction explains the hysteresis observed in Figure 11b and demonstrates that transient concentration gradients constitute a key parameter governing the chemo-resistive response of conductive polymer nanocomposites.
3.2.1. Analysis of Sorption Mechanism
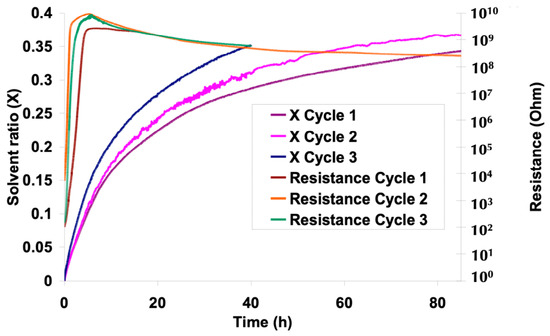
The sorption behaviour of specimen pair C was investigated over three successive sorption/desorption cycles to evaluate the reproducibility of the chemo-resistive response. The simultaneous evolution of the solvent fraction and electrical resistance during the sorption stages is presented in Figure 12.
Figure 12.
Evolution of solvent fraction and electrical resistance during the sorption stages of three successive cycles performed at different ambient temperatures.
Despite slight variations in the experimental conditions, all three cycles exhibit the same characteristic behaviour. During sorption, the electrical resistance increases rapidly, reaches a pronounced maximum, and subsequently decreases towards a stable plateau while solvent uptake continues to increase. The excellent repeatability of this characteristic response demonstrates that the resistance overshoot is an intrinsic feature of the sorption process rather than an experimental artefact.
The origin of this transient maximum is not fully addressed in the present study. Nevertheless, it is likely associated with structural relaxation of the swollen polymer matrix occurring at high solvent contents (typically above 5 wt%), as previously reported in the literature [67]. Further investigations will be required to quantify the respective contributions of solvent diffusion, polymer relaxation and conductive network reorganisation.
Some differences in sorption kinetics are observed between the three cycles (Figure 12), These variations can be partly attributed to the ambient temperatures at which the experiments were performed (22.5, 25.0 and 28.0 °C for Cycles 1, 2 and 3, respectively), since temperature directly affects both solvent diffusivity and vapour pressure. In addition, complete recovery of the initial state between successive cycles cannot be guaranteed because trace amounts of solvent may remain trapped within the polymer after desorption.
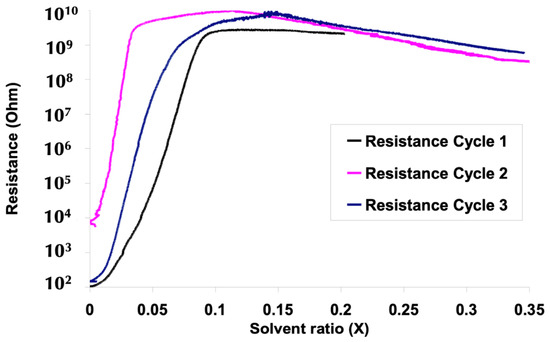
The influence of these initial conditions is more clearly illustrated in Figure 13, where electrical resistance is plotted as a function of the solvent fraction. Although the initial specimen masses differ by less than 0.2%, the initial electrical resistance measured before Cycle 2 is significantly higher than that of Cycle 1, and the resistance reaches its plateau value (approximately 1010 Ω) at a lower solvent fraction.
Figure 13.
Electrical resistance as a function of solvent fraction during the sorption stages of the three successive cycles.
This apparent discrepancy demonstrates the remarkable sensitivity of the conductive nanoparticle network to very small amounts of residual solvent. Even trace solvent concentrations remaining after desorption modify the initial solvent distribution within the specimen, thereby reducing the concentration gradients established during the subsequent sorption stage. Therefore, disruption of the conductive network propagates more rapidly through the specimen thickness, resulting in a faster increase in electrical resistance.
Following a more complete desorption, the behaviour observed during Cycle 3 approaches that of Cycle 1, although the electrical response remains slightly faster. This result indicates that achieving perfectly identical initial conditions over successive sorption cycles is experimentally challenging. Nevertheless, the overall response remains highly reproducible, confirming that the observed variations originate from the transient solvent distribution within the material rather than from experimental uncertainty.
These results further support the interpretation proposed in the previous section: the transient electrical response is primarily governed by the evolution of solvent concentration gradients rather than by the average solvent content alone. Consequently, electrical resistance provides information on the local state of the conductive network that cannot be inferred from gravimetric measurements alone.
3.2.2. Analysis of Desorption Mechanism
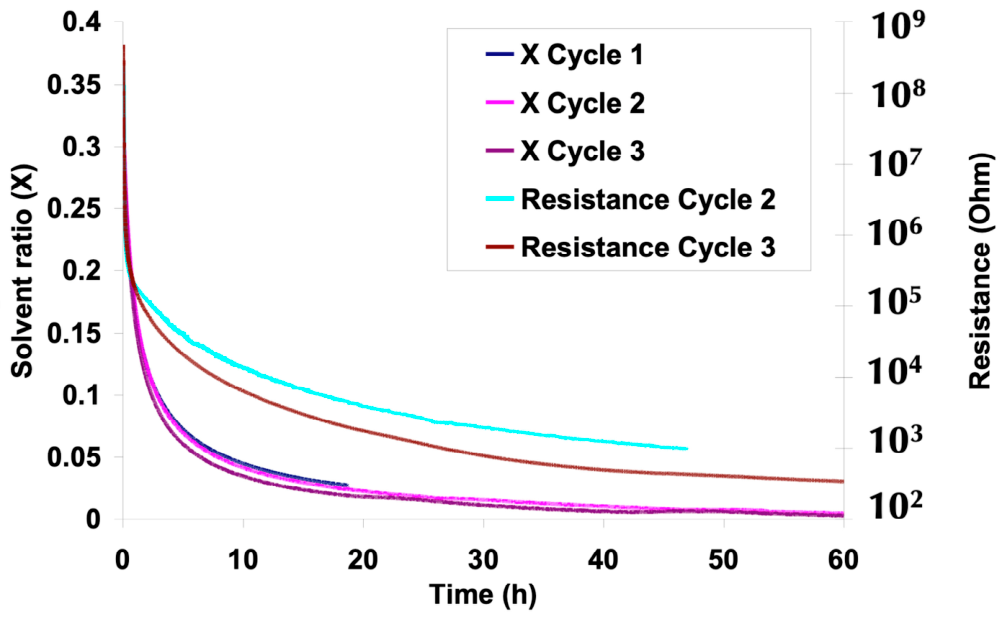
The desorption behaviour observed during the three successive cycles is compared in Figure 14. In contrast to the sorption stages, the mass loss kinetics exhibit only limited variations despite the different initial conditions encountered during the preceding sorption phases. This result suggests that solvent release is less sensitive to variations in the effective diffusion coefficient than solvent uptake. The desorption behaviour remains consistent with that previously observed during direct desorption in ambient air (Figure 7 and Figure 8) confirming the reproducibility of the experimental protocol.
Figure 14.
Evolution of solvent fraction and electrical resistance during the desorption stages of specimen C.
The electrical resistance recorded during Cycles 2 and 3 follows nearly identical trajectories throughout desorption. The absence of resistance data for Cycle 1 results from an acquisition system failure and does not affect the interpretation of the subsequent experiments.
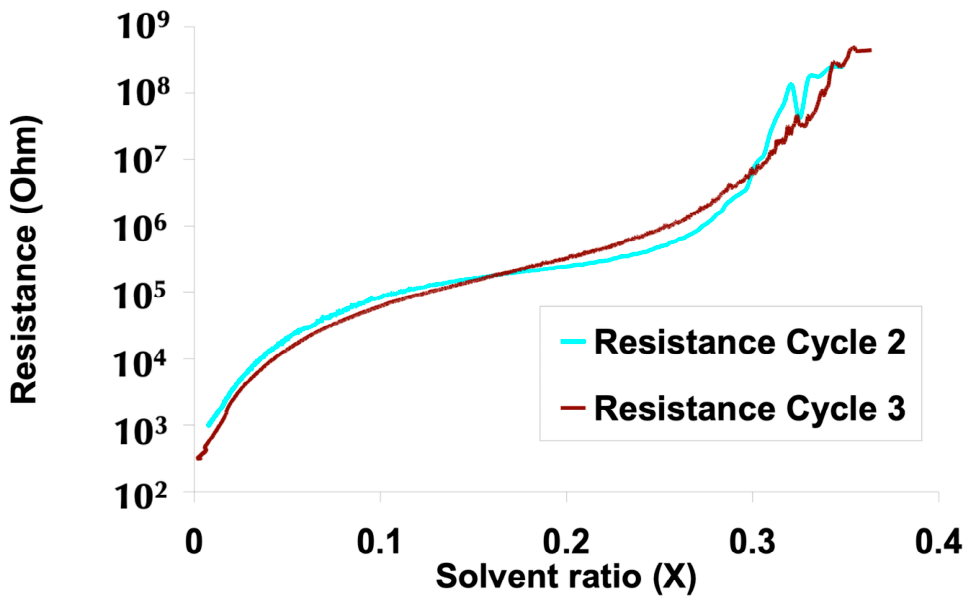
The relationship between electrical resistance and solvent fraction is presented in Figure 15. The excellent agreement between the two available desorption cycles confirms that the electrical response during solvent release is highly reproducible. More importantly, the desorption path differs markedly from the corresponding sorption path presented in Figure 11b, demonstrating once again that electrical resistance is not uniquely determined by the average solvent content.
Figure 15.
Electrical resistance as a function of solvent fraction during the desorption stages.
This apparent hysteresis originates from the evolution of solvent concentration gradients within the specimen. At the beginning of desorption (0.25 < X < 0.35), solvent evaporates rapidly from the specimen surface, while the core remains highly swollen. The resulting reconnection of the conductive carbon nanoparticle network therefore begins at the specimen surface, whereas the central region remains electrically insulating.
As desorption proceeds (0.075 < X < 0.25), solvent progressively diffuses from the specimen core towards the surface. This gradual redistribution continuously restores conductive pathways throughout the specimen thickness, leading to the progressive decrease in electrical resistance observed experimentally.
During the final desorption stage (X < 0.075), solvent concentration gradients become weak, and the conductive network is almost completely re-established. Consequently, the electrical resistance returns close to its initial value before sorption.
These observations reinforce the interpretation developed throughout this work: the transient electrical response is controlled primarily by the spatial distribution of the solvent rather than by its average concentration. While gravimetric measurements reflect the mean solvent uptake, electrical resistance directly probes the local connectivity of the conductive nanoparticle network and is therefore highly sensitive to transient concentration gradients established during diffusion.
The present observations are consistent with previous studies reported in the literature. Lewis et al. [68] reported comparable chemo-resistive behaviour during the swelling of carbon black-filled poly(ethylene-co-vinyl acetate) exposed to benzene. Subsequently, Feller et al. [27,69] described the transient response of conductive polymer nanocomposites containing either carbon nanotubes or carbon nanoparticles using the Langmuir–Henry–Clustering (LHC) model. This model, derived from the classical dual-mode sorption theory, represents the overall sorption process as the combination of three successive mechanisms: Langmuir adsorption at low solvent activity, Henry diffusion through the polymer matrix, and solvent clustering at high solvent contents. These three contributions are described by Equation (3) and provide a useful framework for interpreting the different diffusion regimes observed in conductive polymer nanocomposites.
where bL is the Langmuir affinity constant, f″ is the vapour fraction over which Langmuir’s diffusion is replaced by Henry’s diffusion, f is the solvent fraction, kH is Henry’s solubility coefficient, n′ the number of vapour molecules associated in clusters.
Although these experiments clearly demonstrate the dominant role of transient concentration gradients, they also reveal that conventional sorption/desorption tests cannot establish a unique relationship between electrical resistivity and solvent content. A dedicated quasi-static desorption protocol was therefore developed to minimise concentration gradients and determine the intrinsic relationship between these two quantities.
3.3. Corelation Between Electrical Resistivity and Solvent Fraction
The transient sorption and desorption experiments presented in the previous sections clearly demonstrate that electrical resistance cannot be uniquely related to the average solvent content within the specimen. As illustrated in Figure 11b identical solvent fractions may correspond to markedly different resistance values depending on the preceding diffusion history. This behaviour results from transient solvent concentration gradients that continuously modify the connectivity of the conductive nanoparticle network.
To determine the intrinsic relationship between solvent content and electrical resistivity, it was therefore necessary to minimise these concentration gradients. A dedicated quasi-static desorption protocol was consequently developed to establish successive equilibrium states between the solvent content in the polymer and the surrounding atmosphere.
3.3.1. Development of a Quasi-Static Desorption Protocol
The experimental procedure was specifically designed to maintain the specimen close to thermodynamic equilibrium throughout desorption. Unlike the previous experiments, only a limited quantity of toluene was introduced into the chamber, corresponding to a maximum solvent fraction below 20 wt%. This limitation prevented complete saturation of the conductive network while significantly reducing the duration of the experiments. After solvent injection, the chamber remained sealed throughout the test. The unavoidable leakage of the enclosure generated an extremely slow decrease in the solvent vapour concentration, progressively driving desorption over several hundred hours. Under these conditions, solvent transport was no longer primarily controlled by diffusion within the polymer but by the slow decrease in the surrounding vapour pressure. The specimen therefore passed through a succession of quasi-static equilibrium states in which solvent concentration gradients inside the material could reasonably be considered negligible. Several experiments were performed using desorption durations ranging from 150 to 600 h. Additional temperature measurements confirmed the absence of measurable thermal gradients within the specimen, while simultaneous image analysis verified the linear relationship previously established between specimen volume and solvent uptake.
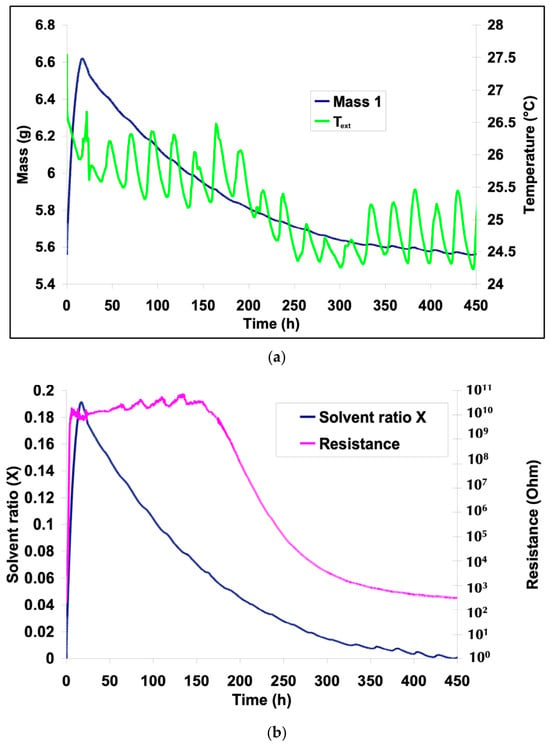
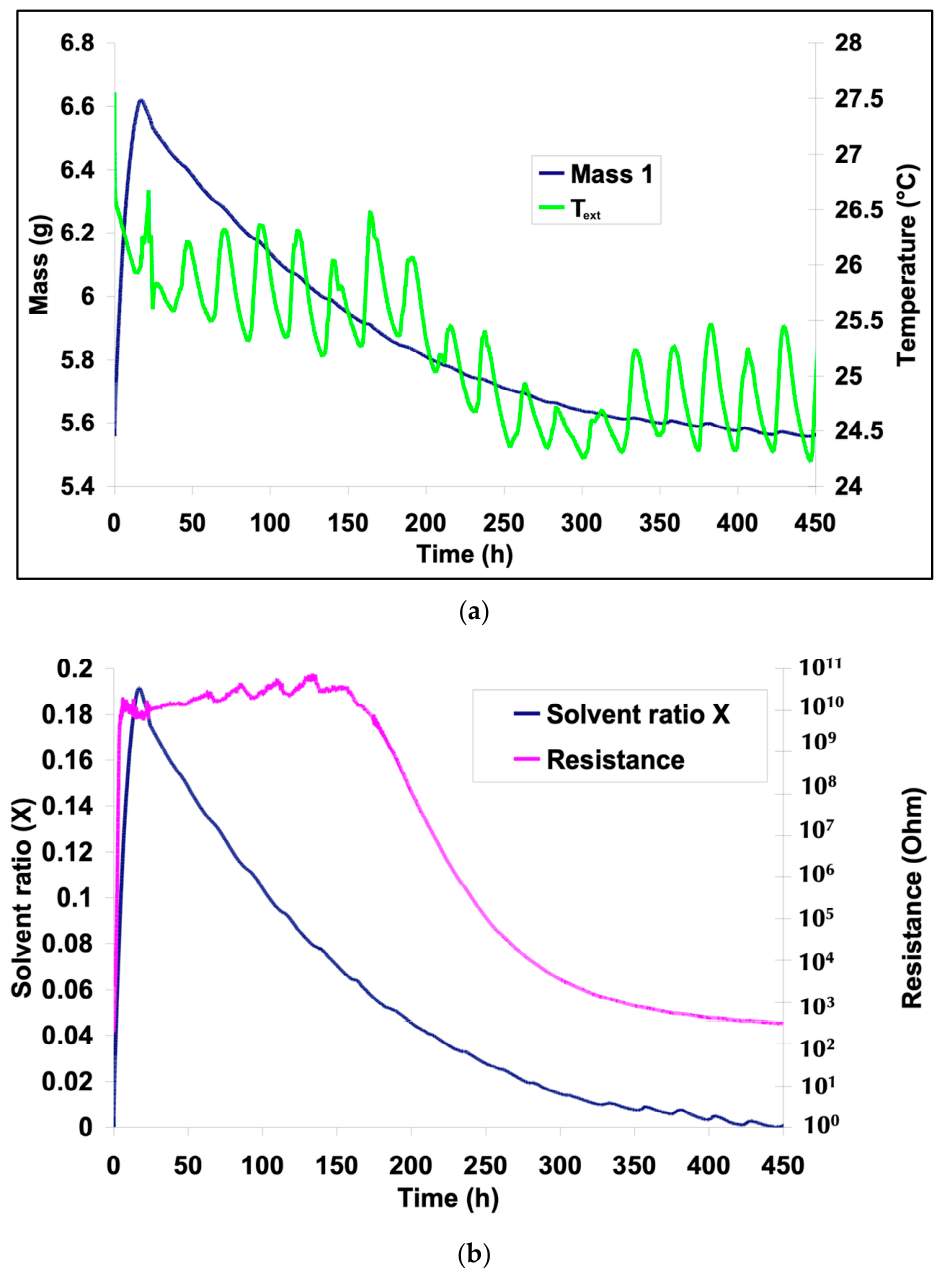
A representative experiment lasting approximately 450 h is presented in Figure 16. The electrical resistance remained close to its maximum value for more than 150 h despite the loss of over two-thirds of the absorbed solvent. During this period, the solvent fraction remained below 20 wt%, well below the equilibrium concentration obtained under saturated vapour conditions.
Figure 16.
Representative quasi-static desorption experiment showing (a) solvent mass and ambient temperature and (b) electrical resistance and solvent fraction as a function of time.
This observation illustrates the extreme sensitivity of the conductive network once electrical percolation has been completely disrupted. Above a solvent content of approximately 6 wt%, the measured resistance approaches that of the insulating EEA matrix, reaching values between approximately 2 × 10¹⁰ and 5 × 10¹⁰ Ω. Beyond this threshold, additional solvent uptake has only a limited influence on the measured electrical resistance because the conductive pathways have already been fully disconnected.
A gradual increase in resistance is nevertheless observed during the plateau region (between approximately 10 and 170 h). This behaviour is attributed primarily to ambient temperature fluctuations and possibly to the negative vapour coefficient (NVC) effect previously identified during sorption. Small oscillations superimposed on the resistance signal are most likely associated with measurement artefacts introduced by the shunt resistor used in the electrical circuit (Figure 2) together with the temperature sensitivity of the measurement system.
3.3.2. Correlation Between Resistivity and Solvent Fraction
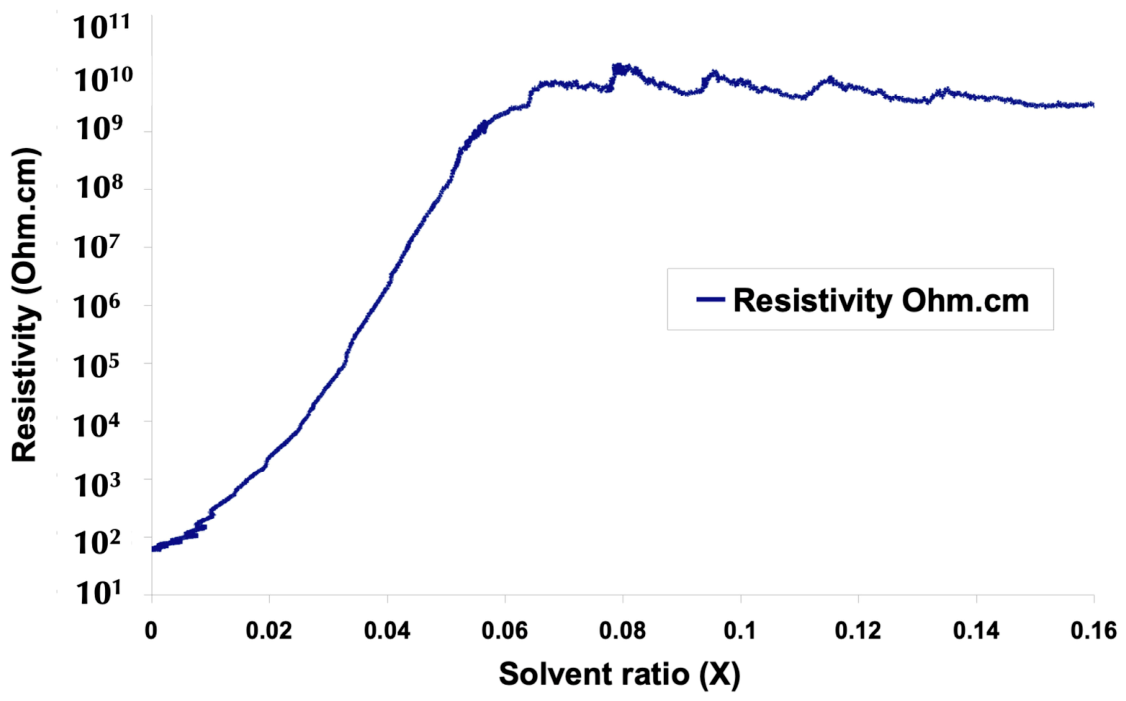
The quasi-static desorption protocol provides the experimental conditions required to determine the intrinsic relationship between electrical resistivity and solvent content. Because solvent concentration gradients are assumed to be negligible, the measured electrical resistance can be directly related to the average solvent fraction within the specimen. Electrical resistivity () was calculated from the measured resistance according to Equation (4).
where S is the specimen cross-sectional area and L is the distance between the electrical electrodes.
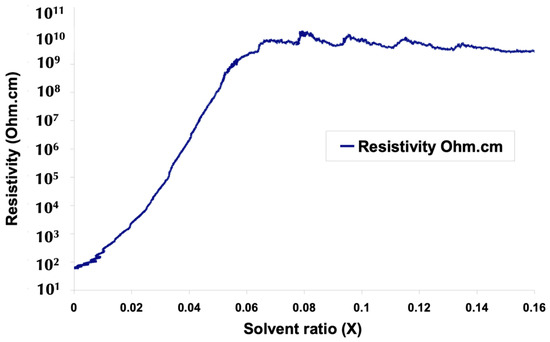
Although slight dimensional changes occur during desorption, both S and L were considered constant because their variations remain negligible compared with the several-orders-of-magnitude change observed in electrical resistance. The resulting relationship between resistivity and the solvent fraction is presented in Figure 17. The correlation confirms that electrical resistivity remains almost constant while the conductive nanoparticle network is fully disconnected, producing a broad resistive plateau at high solvent contents. As discussed previously, the fluctuations observed within this plateau probably arise from several superimposed effects, including the limited sensitivity of the electrical measurement system at very high resistances, ambient temperature variations and possible thermal effects acting on the disconnected conductive network.
Figure 17.
Resistivity as function of solvent ratio.
An additional source of uncertainty cannot be completely excluded. Although the quasi-static protocol substantially reduces solvent concentration gradients, it cannot be demonstrated experimentally that they vanish entirely throughout the specimen thickness. Consequently, the correlation presented in Figure 17 should be regarded as the best experimental approximation of the intrinsic relationship between electrical resistivity and solvent content under near-equilibrium conditions. Nevertheless, this protocol overcomes the principal limitation of conventional sorption/desorption experiments by largely suppressing the influence of transient diffusion gradients. It therefore provides the first direct experimental relationship between solvent content and electrical resistivity in the investigated EEA-37CNP nanocomposite and establishes the experimental basis required for the development and validation of future multiphysics chemo-resistive models.
4. Conclusions
This work investigated the chemo-resistive behaviour of carbon nanoparticle-filled poly(ethylene-co-ethyl acrylate) (EEA-CNP) through a comprehensive multiphysics experimental approach combining simultaneous measurements of solvent uptake, dimensional changes, temperature and electrical resistance during toluene sorption and desorption.
The experimental methodology developed in this study made it possible to analyse the coupling between mass transport, polymer swelling and the evolution of the conductive nanoparticle network. The results demonstrate that the swelling of the EEA matrix follows an approximately ideal behaviour over most of the investigated solvent concentration range, establishing a direct relationship between solvent uptake and volume expansion.
More importantly, the electrical response was shown to differ fundamentally from the gravimetric response. Whereas mass measurements provide access only to the average solvent content within the material, electrical resistance is governed by the local connectivity of the conductive nanoparticle network and is therefore highly sensitive to transient solvent concentration gradients. This behaviour explains the pronounced hysteresis observed between sorption and desorption, as well as the inability to establish a unique relationship between electrical resistance and the solvent content under transient diffusion conditions.
To overcome this limitation, a dedicated quasi-static desorption protocol was developed to minimise concentration gradients within the specimens. Under these near-equilibrium conditions, an intrinsic relationship between electrical resistivity and the solvent fraction could be established. The experiments further showed that a solvent content of approximately 6 wt% is sufficient to completely disrupt the conductive percolation network, beyond which the electrical resistance approaches that of the insulating polymer matrix.
The results also reveal a transient resistance overshoot during sorption together with a negative vapour coefficient (NVC) effect at high solvent contents. These observations strongly suggest that, in addition to solvent diffusion, polymer relaxation and conductive network reorganisation contribute to the overall chemo-resistive response. Although these mechanisms require further investigation, they provide valuable insight into the complex multiphysics behaviour of conductive polymer nanocomposites.
Overall, this work establishes an experimental framework for analysing the coupling between diffusion, swelling and electrical conduction in conductive polymer nanocomposites. The relationships identified here provide the experimental basis for the development and validation of predictive multiphysics models capable of describing the transient behaviour of thin chemo-resistive transducers operating under practical sensing conditions. Such models are expected to support the design and optimisation of next-generation VOC sensors and electronic noses with improved sensitivity, selectivity and predictive capability.
Author Contributions
Conceptualization, J.-F.F., P.G. and P.S.; methodology, S.T.; validation, J.-F.F., P.G. and P.S.; formal analysis, S.T.; investigation, S.T.; resources, J.-F.F. and P.G.; data curation, S.T.; writing—original draft preparation, S.T.; writing—review and editing, J.-F.F. and P.S.; supervision, J.-F.F., P.G. and P.S.; project administration, J.-F.F. and P.G.; funding acquisition, J.-F.F. and P.G. All authors have read and agreed to the published version of the manuscript.
Funding
This research was funded by the French Ministry of Research and Technology, grant number GLOKALPRE110.
Institutional Review Board Statement
Not applicable.
Informed Consent Statement
Not applicable.
Data Availability Statement
The original contributions presented in this study are included in the article. Further inquiries can be directed to the corresponding author.
Acknowledgments
The authors would like to thank Hervé Béllégou, Françoise Péresse, and Jean Costa, for their contribution to this study.
Conflicts of Interest
The authors declare no conflicts of interest.
Abbreviations
The following abbreviations are used in this manuscript:
| EEA | poly(ethyne-co-ethyl acrylate) |
| CPC | conductive polymer nanocomposite |
| vQRS | quantum resistive vapour sensor |
| NVC | negative vapour coefficient |
| CNP | carbon nanoparticle |
| LHC | Langmuir Henry Clustering Model of diffusion |
| VOC | volatile organic compound |
References
- Feller, J.F. 6.10 Electrically Conductive Nanocomposites. In Comprehensive Composite Materials II; Beaumont, P.W.R., Zweben, C.H., Eds.; Elsevier: Amsterdam, The Netherlands, 2018; pp. 248–314. [Google Scholar]
- Zhou, J.F.; Song, Y.H.; Zheng, Q.; Wu, Q.; Zhang, M.Q. Percolation Transition and Hydrostatic Piezoresistance for Carbon Black Filled Poly(Methylvinylsilioxane) Vulcanizates. Carbon 2008, 46, 679–691. [Google Scholar] [CrossRef] [Scilit]
- Bautista-Quijanoa, J.R.; Avilésa, F.; Aguilara, J.O.; Tapia, A. Strain Sensing Capabilities of a Piezoresistive MWCNT-Polysulfone Film. Sens. Actuators A Phys. 2010, 159, 135–140. [Google Scholar] [CrossRef] [Scilit]
- Bilotti, E.; Zhang, R.; Deng, H.; Baxendale, M.; Peijs, T. Fabrication and Property Prediction of Conductive and Strain Sensing TPU/CNT Nanocomposite Fibres. J. Mater. Chem. 2010, 20, 9449–9455. [Google Scholar] [CrossRef] [Scilit]
- Selvan, N.T.; Eshwaran, S.B.; Das, A.; Stöckelhuber, K.W.; Wießner, S.; Pötschke, P.; Nando, G.B.; Chervanyov, A.I.; Heinrich, G. Piezoresistive Natural Rubber-Multiwall Carbon Nanotube Nanocomposite for Sensor Applications. Sens. Actuators A Phys. 2016, 239, 102–113. [Google Scholar] [CrossRef] [Scilit]
- Zavickis, J.; Knite, M.; Podins, G.; Linarts, A.; Orlovs, R. Polyisoprene-Nanostructured Carbon Composite—A Soft Alternative for Pressure Sensor Application. Sens. Actuators A Phys. 2011, 171, 38–42. [Google Scholar] [CrossRef] [Scilit]
- Yang, L.; Chen, X.; Dutta, A.; Zhang, H.; Wang, Z.; Xin, M.; Du, S.; Xu, G.; Cheng, H. Thermoelectric Porous Laser-Induced Graphene-Based Strain-Temperature Decoupling and Self-Powered Sensing. Nat. Commun. 2025, 16, 792. [Google Scholar] [CrossRef] [Scilit] [PubMed]
- Parvin, N.; Joo, S.W.; Jung, J.H.; Mandal, T.K. Unlocking the Future: Carbon Nanotubes as Pioneers in Sensing Technologies. Chemosensors 2025, 13, 225. [Google Scholar] [CrossRef] [Scilit]
- Lemartinel, A.; Castro, M.; Feller, J.F. Core Monitoring of Thermoset Polymer Composites’ Curing with Embedded Nanocomposite Sensors: A Key Step towards Process 4.0. J. Compos. Sci. 2025, 9, 435. [Google Scholar] [CrossRef] [Scilit]
- Zha, J.-W.; Zhang, B.; Li, R.K.Y.; Dang, Z.-M. High-Performance Strain Sensors Based on Functionalized Graphene Nanoplates for Damage Monitoring. Compos. Sci. Technol. 2016, 123, 32–38. [Google Scholar] [CrossRef] [Scilit]
- Naghashpour, A.; Van Hoa, S. A Technique for Real-Time Detecting, Locating, and Quantifying Damage in Large Polymer Composite Structures Made of Carbon Fibers and Carbon Nanotube Networks. Struct. Health Monit. Int. J. 2015, 14, 35–45. [Google Scholar] [CrossRef] [Scilit]
- Bekas, D.G.; Paipetis, A.S. Damage Monitoring in Nanoenhanced Composites Using Impedance Spectroscopy. Compos. Sci. Technol. 2016, 134, 96–105. [Google Scholar] [CrossRef] [Scilit]
- Du, X.; Zhou, H.; Sun, W.; Liu, H.-Y.; Zhou, G.; Zhou, H.; Mai, Y.-W. Graphene/Epoxy Interleaves for Delamination Toughening and Monitoring of Crack Damage in Carbon Fibre/Epoxy Composite Laminates. Compos. Sci. Technol. 2017, 140, 123–133. [Google Scholar] [CrossRef] [Scilit]
- Gao, L.; Thostenson, E.T.; Zhang, Z.; Chou, T.W. Coupled Carbon Nanotube Network and Acoustic Emission Monitoring for Sensing of Damage Development in Composites. Carbon 2009, 47, 1381–1388. [Google Scholar] [CrossRef] [Scilit]
- Wang, Z.J.; Kwon, D.J.; Gu, G.Y.; Kim, H.S.; Kim, D.S.; Lee, C.S.; DeVries, K.L.; Park, J.M. Mechanical and Interfacial Evaluation of CNT/Polypropylene Composites and Monitoring of Damage Using Electrical Resistance Measurements. Compos. Sci. Technol. 2013, 81, 69–75. [Google Scholar] [CrossRef] [Scilit]
- Zhang, H.; Bilotti, E.; Peijs, T. The Use of Carbon Nanotubes for Damage Sensing and Structural Health Monitoring in Laminated Composites: A Review. Nanocomposites 2015, 1, 177–194. [Google Scholar] [CrossRef] [Scilit]
- Jiang, M.J.; Dang, Z.M.; Xu, H.P. Significant Temperature and Pressure Sensitivities of Electrical Properties in Chemically Modified Multiwall Carbon Nanotube/Methylvinyl Silicone Rubber Nanocomposites. Appl. Phys. Lett. 2006, 89, 182902. [Google Scholar] [CrossRef] [Scilit]
- Lee, J.H.; Kim, S.K.; Kim, N.H. Effects of the Addition of Multi-Walled Carbon Nanotubes on the Positive Temperature Coefficient Characteristics of Carbon-Black-Filled High-Density Polyethylene Nanocomposites. Scr. Mater. 2006, 55, 1119–1122. [Google Scholar] [CrossRef] [Scilit]
- Guo, H.; Lu, L.; Hatton, F.L.; Xu, L.; Yu, E.; Peijs, T.; Bilotti, E.; Zhang, H.; Liu, Y. Wearable Body Temperature Sensing with Autonomous Self-regulated Joule Heating and Passive Cooling for Healthcare Applications. Adv. Funct. Mater. 2025, 35, 2417961. [Google Scholar] [CrossRef] [Scilit]
- Graz, I.; Krause, M.; Bauer-Gogonea, S.; Bauer, S.; Lacour, S.P.; Ploss, B.; Zirkl, M.; Stadlober, B.; Wagner, S. Flexible Active-Matrix Cells with Selectively Poled Bifunctional Polymer-Ceramic Nanocomposite for Pressure and Temperature Sensing Skin. J. Appl. Phys. 2009, 106, 034503. [Google Scholar] [CrossRef] [Scilit]
- Li, J.R.; Xu, J.R.; Zhang, M.Q.; Rong, M.Z. Carbon Black/Polystyrene Composites as Candidates for Gas Sensing Materials. Carbon 2003, 41, 2353–2360. [Google Scholar] [CrossRef] [Scilit]
- Michael, E.K.; Robert, H.G.; Lewis, N.S. Properties of Vapor Detector Arrays Formed through Plasticization of Carbon Black−Organic Polymer Composites. Anal. Chem. 2002, 76, 1307–1315. [Google Scholar] [CrossRef] [PubMed]
- Gao, T.; Woodka, M.D.; Brunschwig, B.S.; Lewis, N.S. Chemiresistors for Array-Based Vapor Sensing Using Composites of Carbon Black with Low Volatility Organic Molecules. Chem. Mater. 2006, 18, 5193–5202. [Google Scholar] [CrossRef] [Scilit]
- Feller, J.F.; Lu, J.; Zhang, K.; Kumar, B.; Castro, M.; Gatt, N.; Choi, H.J. Novel Architecture of Carbon Nanotube Decorated Poly(Methyl Methacrylate) Microbead Vapour Sensors Assembled by Spray Layer by Layer. J. Mater. Chem. 2011, 21, 4142–4149. [Google Scholar] [CrossRef] [Scilit]
- Tomić, M.; Šetka, M.; Vojkůvka, L.; Vallejos, S. VOC Sensing by Metal Oxides, Conductive Polymers, and Carbon-Based Materials. Nanomaterials 2021, 11, 552. [Google Scholar] [CrossRef] [Scilit] [PubMed]
- Aghili, N.S.; Rasekh, M.; Karami, H.; Edriss, O.; Wilson, A.D.; Ramos, J. Aromatic Fingerprints: VOC Analysis with E-Nose and GC-MS for Rapid Detection of Adulteration in Sesame Oil. Sensors 2023, 23, 6294. [Google Scholar] [CrossRef] [Scilit] [PubMed]
- Bouvrée, A.; Feller, J.F.; Castro, M.; Grohens, Y.; Rinaudo, M. Conductive Polymer Nano-BioComposites (CPC): Chitosan-Carbon Nanoparticle a Good Candidate to Design Polar Vapour Sensors. Sens. Actuators B Chem. 2009, 138, 138–147. [Google Scholar] [CrossRef] [Scilit]
- Bin, Y.; Xu, C.; Zhu, D.; Matsuo, M. Electrical Properties of Polyethylene and Carbon Black Particle Blends Prepared by Gelation/Crystallization from Solution. Carbon 2002, 40, 195–199. [Google Scholar] [CrossRef] [Scilit]
- Fang, Y.; Zhao, J.; Zha, J.W.; Wang, D.R.; Dang, Z.M. Improved Stability of Volume Resistivity in Carbon Black/Ethylene-Vinyl Acetate Copolymer Composites by Employing Multi-Walled Carbon Nanotubes as Second Filler. Polymer 2012, 53, 4871–4878. [Google Scholar] [CrossRef] [Scilit]
- Zha, J.W.; Li, W.K.; Liao, R.J.; Bai, J.; Dang, Z.M. High Performance Hybrid Carbon Fillers/Binary–Polymer Nanocomposites with Remarkably Enhanced Positive Temperature Coefficient Effect of Resistance. J. Mater. Chem. A Mater. 2013, 1, 843–851. [Google Scholar] [CrossRef] [Scilit]
- Buinova, Y.; Kobyliukh, A.; Mamunya, Y.; Maruzhenko, O.; Korab, M.; Trzebicka, B.; Szeluga, U.; Godzierz, M. Heating and Strain Sensing Elements Based on Segregated Polyethylene/Carbon Black Composites in Polymer Welded Joints. Materials 2024, 17, 3776. [Google Scholar] [CrossRef] [Scilit] [PubMed]
- Lu, L.; Guo, H.; Wang, Y.; Liu, K.X.; Martin-Fabiani, I.; Peijs, T.; Bilotti, E.; Zhang, H.; Liu, Y. Dual Enhancement of Joule Heating and Positive Temperature Coefficient Behaviour in Biodegradable Nanocomposites via Hybrid Carbon Nanofiller Networks. Compos. Part A Appl. Sci. Manuf. 2025, 199, 109167. [Google Scholar] [CrossRef] [Scilit]
- Collado, I.; Vázquez-López, A.; Jiménez-Suárez, A.; Prolongo, S.G. Dual-Curing MWCNT Nanocomposites for Energy-Efficient Electroactive Shape Memory and in-Situ Processing. Chem. Eng. J. 2025, 515, 163471. [Google Scholar] [CrossRef] [Scilit]
- Sachan, A.; Castro, M.; Feller, J.F. Volatolomics for Anticipated Diagnosis of Cancers with Chemoresistive Vapour Sensors: A Review. Chemosensors 2025, 13, 15. [Google Scholar] [CrossRef] [Scilit]
- Barash, O.; Peled, N.; Tisch, U.; Bunn, P.A.; Hirsch, F.R.; Haick, H. Classification of Lung Cancer Histology by Gold Nanoparticle Sensors. Nanomedicine 2012, 8, 580–589. [Google Scholar] [CrossRef] [Scilit] [PubMed]
- Basu, S.; Sen, K. A Review on Graphene-Based Materials as Versatile Cancer Biomarker Sensors. Front. Mater. Sci. 2020, 14, 353–372. [Google Scholar] [CrossRef] [Scilit]
- Tran, A.T.T.; Hassan, K.; Tung, T.T.; Tripathy, A.; Mondal, A.; Losic, D. Graphene and Metal–Organic Framework Hybrids for High-Performance Sensors for Lung Cancer Biomarker Detection Supported by Machine Learning Augmentation. Nanoscale 2024, 16, 9084–9095. [Google Scholar] [CrossRef] [Scilit] [PubMed]
- Peng, G.; Trock, E.; Haick, H. Detecting Simulated Patterns of Lung Cancer Biomarkers by Random Network of Single-Walled Carbon Nanotubes Coated with Nonpolymeric Organic Materials. Nano Lett. 2008, 8, 3631–3635. [Google Scholar] [CrossRef] [Scilit] [PubMed]
- Lorwongtragool, P.; Sowade, E.; Watthanawisuth, N.; Baumann, R.R.; Kerdcharoen, T. A Novel Wearable Electronic Nose for Healthcare Based on Flexible Printed Chemical Sensor Array. Sensors 2014, 14, 19700–19712. [Google Scholar] [CrossRef] [Scilit] [PubMed]
- Shehada, N.; Brönstrup, G.; Funka, K.; Christiansen, S.; Leja, M.; Haick, H. Ultrasensitive Silicon Nanowire for Real-World Gas Sensing: Noninvasive Diagnosis of Cancer from Breath Volatolome. Nano Lett. 2015, 15, 1288–1295. [Google Scholar] [CrossRef] [Scilit] [PubMed]
- Zeng, Q.; Qi, X.; Shi, G.; Zhang, M.; Haick, H. Wound Dressing: From Nanomaterials to Diagnostic Dressings and Healing Evaluations. ACS Nano 2022, 16, 1708–1733. [Google Scholar] [CrossRef] [Scilit] [PubMed]
- Miyasaka, K.; Watanabe, K.; Jojima, E.; Aida, H.; Sumita, M.; Ishikawa, K. Electrical Conductivity of Carbon-Polymer Composites as a Function of Carbon Content. J. Mater. Sci. 1982, 17, 1610–1616. [Google Scholar] [CrossRef] [Scilit]
- Knite, M.; Teteris, V.; Kiploka, A.; Kaupuzs, J. Polyisoprene-Carbon Black Nanocomposites as Tensile Strain and Pressure Sensor Materials. Sens. Actuators A Phys. 2004, 110, 142–149. [Google Scholar] [CrossRef] [Scilit]
- Mouchet, A.; Ullmo, D. Chaos Gives Quantum Tunnelling a Hand. Phys. World 2001, 14, 24–26. [Google Scholar] [CrossRef] [Scilit][Green Version]
- Gong, S.; Zhu, Z.H.; Li, Z. Electron Tunnelling and Hopping Effects on the Temperature Coefficient of Resistance of Carbon Nanotube/Polymer Nanocomposites. Phys. Chem. Chem. Phys. 2017, 19, 5113–5120. [Google Scholar] [CrossRef] [Scilit] [PubMed]
- Ramachandran, L.; Lonjon, A.; Demont, P.; Dantras, E.; Lacabanne, C. Conduction Mechanisms in P(VDF-TrFE)/Gold Nanowire Composites: Tunnelling and Thermally-Activated Hopping Process near the Percolation Threshold. Mater. Res. Express 2016, 3, 085027. [Google Scholar] [CrossRef] [Scilit]
- Carrillo, A.; Martín-Domínguez, I.R.; Rosas, A.; Márquez, A. Numerical Method to Evaluate the Influence of Organic Solvent Absorption on the Conductivity of Polymeric Composites. Polymer 2002, 43, 6307–6313. [Google Scholar] [CrossRef] [Scilit]
- Carrillo, A.; Martín-Domínguez, I.R.; Márquez-Lucero, A. Modeling and Experimental Testing of the Effect of Solvent Absorption on the Electric Properties of Styrene Butadiene Rubber/Carbon Black Chemical Sensors. Sens. Actuators B Chem. 2006, 113, 477–486. [Google Scholar] [CrossRef] [Scilit]
- Castro, M.; Kumar, B.; Feller, J.F.; Haddi, Z.; Amari, A.; Bouchikhi, B. Novel E-Nose for the Discrimination of Volatile Organic Biomarkers with an Array of Carbon Nanotubes (CNT) Conductive Polymer Nanocomposites (CPC) Sensors. Sens. Actuators B Chem. 2011, 159, 213–219. [Google Scholar] [CrossRef] [Scilit]
- Sachan, A.; Castro, M.; Choudhary, V.; Feller, J.-F. Giant Chemo-Resistive Response of POSS Nano-Spacers in PS- and PMMA-Based Quantum Resistive Vapour Sensors (VQRS) Used for Cancer Biomarker Analysis. Chemosensors 2025, 13, 226. [Google Scholar] [CrossRef] [Scilit]
- Tisch, U.; Schlesinger, I.; Ionescu, R.; Nassar, M.; Axelrod, N.; Robertman, D.; Tessler, Y.; Azar, F.; Marmur, A.; Aharon-Peretz, J.; et al. Detection of Alzheimer’s and Parkinson’s Disease from Exhaled Breath Using Nanomaterial-Based Sensors. Nanomedicine 2013, 8, 43–56. [Google Scholar] [CrossRef] [Scilit] [PubMed]
- Tisch, U.; Haick, H. Nanomaterials for Cross-Reactive Sensor Arrays. MRS Bull. 2011, 35, 797–803. [Google Scholar] [CrossRef] [Scilit]
- Feller, J.F.; Langevin, D.; Marais, S. Influence of Processing Conditions on Sensitivity of Conductive Polymer Composites to Organic Solvent Vapours. Synth. Met. 2004, 144, 81–88. [Google Scholar] [CrossRef] [Scilit]
- Crank, J. The Mathematics of Diffusion, 2nd ed.; Oxford University Press: London, UK, 1979; ISBN 9780198534112. [Google Scholar]
- Feller, J.F.; Grohens, Y. Evolution of Electrical Properties of Some Conductive Polymer Composite Textiles with Organic Solvent Vapours Diffusion. Sens. Actuators B Chem. 2004, 97, 231–242. [Google Scholar] [CrossRef] [Scilit]
- Shurmer, H.V.; Gardner, J.W.; Corcoran, P. Intelligent Vapour Discrimination Using a Composite 12-Element Sensor Array. Sens. Actuators B Chem. 1990, 1, 256–260. [Google Scholar] [CrossRef] [Scilit]
- Gardner, J.W.; Bartlett, P.N. Electronic Noses. Principles and Applications. Meas. Sci. Technol. 2000, 11, 1087. [Google Scholar] [CrossRef] [Scilit]
- Freund, M.S.; Lewis, N.S. A Chemically Diverse Conducting Polymer-Based “Electronic Nose”. Proc. Natl. Acad. Sci. USA 1995, 92, 2652–2656. [Google Scholar] [CrossRef] [Scilit] [PubMed]
- Nagle, H.T.; Gutierrez-Osuna, R.; Schiffman, S.S. The How and Why of Electronic Noses. IEEE Spectr. 1998, 35, 22–31. [Google Scholar] [CrossRef] [Scilit]
- Jäger, K.M.; McQueen, D.H.; Tchmutin, I.A.; Ryvkina, N.G.; Klüppel, M. Electron Transport and Ac Electrical Properties of Carbon Black Polymer Composites. J. Phys. D Appl. Phys. 2001, 34, 2699–2707. [Google Scholar] [CrossRef] [Scilit]
- Jäger, K.M.; Dammert, R.C.; Sultan, B.-Å. Thermal Degradation Studies of Different Polar Polyethylene Copolymers. J. Appl. Polym. Sci. 2002, 84, 1465–1473. [Google Scholar] [CrossRef] [Scilit]
- Feller, J.F.; Linossier, I.; Pimbert, S.; Levesque, G. Carbon Black-Filled Poly(Ethylene-Co-Alkyl Acrylate) Composites: Calorimetric Studies. J. Appl. Polym. Sci. 2001, 79, 779–793. [Google Scholar] [CrossRef]
- Feller, J.F.; Linossier, I. Mechanical and Rheological Properties of Poly(Ethylene-Co-Ethyl Acrylate) as a Function of Carbon Black Content. Macromol. Symp. 2003, 203, 317–324. [Google Scholar] [CrossRef] [Scilit]
- Suhr, J.; Koratkar, N.; Keblinski, P.; Ajayan, P. Viscoelasticity in Carbon Nanotube Composites. Nat. Mater. 2005, 4, 134–137. [Google Scholar] [CrossRef] [Scilit] [PubMed]
- Wanjale, S.D.; Jog, J.P. Viscoelastic and Dielectric Behavior of Poly(1-butene)/Multiwalled Carbon Nanotube Nanocomposites. J. Macromol. Sci. Part B 2006, 45, 1053–1064. [Google Scholar] [CrossRef] [Scilit]
- Kim, Y.; Min, J.; Ko, K.; Sravani, B.; Chougule, S.S.; Choi, Y.; Choi, H.; Hong, S.Y.; Jung, N. Activity Quantification of Fuel Cell Catalysts via Sequential Poisoning by Multiple Reaction Inhibitors. Nanomaterials 2022, 12, 3800. [Google Scholar] [CrossRef] [Scilit] [PubMed]
- Feller, J.F.; Castro, M.; Kumar, B. Polymer CNT Conductive Nanocomposite for Sensing. In Polymer-Carbon Nanotube Composites; Mc Nally, T., Pötschke, P., Eds.; Whoodhead Ltd.: Cambridge, UK, 2011; pp. 760–803. ISBN 1845697618. [Google Scholar]
- Lonergan, M.C.; Severin, E.J.; Doleman, B.J.; Beaber, S.A.; Grubbs, R.H.; Lewis, N.S. Array-Based Vapor Sensing Using Chemically Sensitive, Carbon Black−polymer Resistors. Chem. Mater. 1996, 8, 2298–2312. [Google Scholar] [CrossRef] [Scilit]
- Kumar, B.; Feller, J.F.; Castro, M.; Lu, J. Conductive Bio-Polymer Nano-Composites (CPC): Chitosan-Carbon Nanotube Transducers Assembled via Spray Layer-by-Layer for Volatile Organic Compound Sensing. Talanta 2010, 81, 908–915. [Google Scholar] [CrossRef] [Scilit] [PubMed]

Disclaimer/Publisher’s Note: The statements, opinions and data contained in all publications are solely those of the individual author(s) and contributor(s) and not of MDPI and/or the editor(s). MDPI and/or the editor(s) disclaim responsibility for any injury to people or property resulting from any ideas, methods, instructions or products referred to in the content. |
© 2026 by the authors. Licensee MDPI, Basel, Switzerland. This article is an open access article distributed under the terms and conditions of the Creative Commons Attribution (CC BY) license.