Article

Novel Anthracene-Based Sensor for the Selective Detection of Cyanide Ion Using Relay Recognition, Logic Gate, Real-Sample Analysis and Bioimaging Application


by
Ganesan Punithakumari
1,*,
Govindhasamy Murugadoss
2,
Shaik Ashmath
3 and
Tae-Gwan Lee
4,*
1
Department of Chemistry, J. J. College of Engineering and Technology, Tiruchirappalli 620009, Tamil Nadu, India
2
Centre of Excellence for Energy Research, Sathyabama Institute of Science and Technology, Chennai 600119, Tamil Nadu, India
3
Department of Chemistry, Karpagam Academy of Higher Education, Coimbatore 641021, Tamil Nadu, India
4
Department of Environmental Engineering, Keimyung University, 1095 Dalgubeol-daero, Dalseo-gu, Daegu 42601, Republic of Korea
*
Authors to whom correspondence should be addressed.
Chemosensors 2026, 14(9), 194; https://doi.org/10.3390/chemosensors14090194
Submission received: 13 July 2026 / Revised: 13 August 2026 / Accepted: 17 August 2026 / Published: 27 August 2026
(This article belongs to the Section (Bio)chemical Sensing)

Abstract

A novel anthracene-based receptor was synthesized via a facile condensation method. The anion-sensing behavior of the receptor was systematically investigated using colorimetric analysis, UV–visible spectroscopy, photoluminescence studies, and binding constant calculations. The synthesized receptor exhibited effective and selective recognition of cyanide (CN−) ions, accompanied by a distinct visual color change from pale yellow to light pink, whereas other tested metal ions produced no appreciable color response. Notably, in the presence of CN− ions, the receptor displayed a pronounced and selective response toward Fe3+ ions, as evidenced by a subsequent color change from light pink to light yellow. Furthermore, the receptor enabled the construction of implication (IMP) and inhibition (INH) logic gates through the selective detection of CN− and Fe3+ ions. The detection limit for CN− ions was determined to be 7.3 × 10⁻⁷ M. The practical applicability of the receptor for CN− detection was further demonstrated using sprouted potato samples and optical sensing platforms. In addition, the receptor exhibited excellent sensing performance and was successfully applied for the fluorescence labeling and imaging of CN− ions in living biological cells.

1. Introduction

Anions play essential roles in a wide range of supramolecular and biological processes. Among various inorganic anions, cyanide (CN−) is particularly noteworthy because of its high toxicity toward living organisms [1]. Chemosensors have attracted considerable interest in supramolecular chemistry owing to their high sensitivity and selectivity toward specific analytes. Among the different analytes of environmental and biological significance, cyanide has received substantial attention because of its important roles in both biological and environmental systems. Cyanide-containing effluents are generated by several industrial activities, including plastic manufacturing, electroplating, nylon production, and other organic-processing industries, thereby posing significant risks to the environment. Even relatively small amounts of cyanide can enter the human body through inhalation, dermal exposure, and the gastrointestinal tract, resulting in symptoms, such as nausea, spasms, impaired perception, and, in severe cases, death [2]. Trace concentrations of CN− can interfere with cellular respiration and physiological processes by disrupting cytochrome-mediated electron transport, thereby posing serious health risks. Exposure to cyanide concentrations above the permissible limits can cause severe toxic effects in humans and other living organisms. Cyanide inhibits cellular respiration by interacting with the active site of cytochrome c oxidase, thereby blocking the mitochondrial electron-transport chain [3]. In addition, cyanide can interact with the Fe3+ center of heme-containing proteins, consequently interfering with oxygen utilization and transport [4]. Exposure to cyanide through the skin, respiratory tract, or gastrointestinal system can, therefore, result in severe or fatal toxicity [5]. Recent reports have indicated that the blood of cyanide-poisoned victims may contain approximately 20 μM CN− [6]. Despite its pronounced toxicity, the extensive use of cyanide cannot be completely avoided because of its important applications in gold mining, medicinal chemistry, electroplating, plastic production, and polymer manufacturing [7,8,9]. Therefore, the development of reliable and sensitive analytical methods capable of detecting low concentrations of CN− is essential for environmental monitoring and safety assessment.
Iron is another biologically important ion that plays crucial roles in numerous physiological processes. In particular, Fe3+ participates in mitochondrial respiratory processes and DNA synthesis as an essential enzymatic cofactor [10,11,12,13,14,15,16]. However, abnormal accumulation or elevated concentrations of Fe3+ can adversely affect biological systems and have been associated with hepatic and renal damage as well as diabetes mellitus [17,18]. Consequently, the selective and sensitive monitoring of both CN− and Fe3+ is of considerable importance in environmental and biological systems.
Veettil and co-workers reported the selective recognition of CN− using an anthracene-based thiosemicarbazone receptor [19]. Li and co-workers developed a phenothiazine-functionalized receptor exhibiting fluorescence-based recognition of CN− ions [20]. In addition, numerous colorimetric and fluorescent cyanide receptors have been developed based on different recognition mechanisms, including coordination interactions [21], hydrogen-bonding interactions [22], metal–anion affinity [23], and nucleophilic addition reactions [24]. Nevertheless, receptors based primarily on hydrogen bonding, coordination, or metal–anion interactions may exhibit limited selectivity because of interference from competing anions such as fluoride, phosphate, and acetate. Several previously reported cyanide sensors also suffer from limitations, including relatively slow response times, the requirement for elevated temperatures or basic conditions, high detection limits, inadequate selectivity, and poor performance in aqueous media. Furthermore, the irreversible nature of many reaction-based cyanide sensors can restrict their practical applicability under real-field conditions.
To date, numerous chemosensors have been developed for cyanide detection, and many anthracene-based sensors incorporate imidazole moieties as recognition sites. However, insufficient selectivity and limited dual-sensing capability remain important challenges in these systems. Moreover, simultaneous colorimetric detection accompanied by fluorescence enhancement has not been extensively demonstrated. To address these limitations, a novel anthracene-based receptor containing an imine functional group was designed and synthesized for the selective detection of CN− ions in the DMSO medium. The significance of the present system lies in its naked-eye colorimetric response and fluorescence enhancement, which are associated with the extended π-conjugated system of the imine-functionalized receptor. The proposed receptor was also investigated for cyanide detection in potato samples, which represent one of the most widely consumed and economically accessible staple foods worldwide [25,26]. More than one billion people are estimated to consume potatoes as part of their regular diet, and potatoes rank among the world’s major food crops in terms of human consumption.
Several analytical techniques have been reported for cyanide detection, including chromatographic methods [27], optical detection techniques [28], electrochemical methods [29], and flow injection analysis [30]. Although these techniques can provide reliable analytical information, they generally require sophisticated instrumentation, tedious sample preparation procedures, and trained personnel. In contrast, colorimetric sensing offers a simple and convenient approach because the recognition event can be readily monitored through a visible color change without the need for sophisticated instrumentation.
Anthracene is one of the most extensively employed fluorophores in the development of fluorescent chemosensors because of its strong fluorescence emission, excellent photostability, and facile structural functionalization [31]. Incorporation of appropriate recognition sites into the anthracene framework has led to the development of numerous receptors for selective cyanide detection. These sensing systems commonly contain functional groups, such as Schiff bases, dicyanovinylene derivatives, aldehydes, and other electron-deficient moieties. Cyanide recognition in such systems generally proceeds through nucleophilic addition or deprotonation processes, resulting in measurable changes in fluorescence emission or absorption spectra [32]. Although these probes have significantly contributed to the advancement of cyanide sensing, several reported systems continue to exhibit practical limitations. In particular, the sensing responses of some probes are affected by competing basic anions, such as fluoride and acetate, whereas others require solvent mixtures containing a high proportion of organic solvents or involve relatively complicated synthetic procedures [33]. Furthermore, several anthracene-based probes rely primarily on changes in single fluorescence emission intensity, which can be influenced by external experimental conditions and instrumental fluctuations [34]. Therefore, the development of anthracene-derived fluorescent receptors that combine facile synthesis, high selectivity, excellent sensitivity, rapid response, and reliable performance in real samples remains an important research objective. Continued development of such systems is expected to enhance the practical utility of anthracene-based fluorescent probes for environmental and biological cyanide monitoring [35].
To further evaluate the analytical performance of the present receptor, its sensing characteristics were compared with those of representative cyanide sensors reported in the recent literature [36,37,38,39]. The comparison considered key analytical parameters, including the sensing mechanism, detection limit (LOD), binding constant (Ka), sensing medium, aqueous compatibility, and practical applications, as summarized in Table 1. Although several previously reported probes demonstrate excellent sensing performance in aqueous or mixed-solvent systems, the present receptor enables highly sensitive cyanide recognition in pure DMSO through a deprotonation-assisted sensing mechanism. This comparative analysis provides an overall assessment of the advantages and existing limitations of the developed receptor and also highlights potential directions for future development, particularly toward achieving water-compatible cyanide sensing.
In this work, we designed a reversible colorimetric sensor that enables rapid, facile, and highly selective detection of CN− ions. The reaction of the receptor with CN− in the DMSO medium produces a rapid, highly selective, and reversible colorimetric response accompanied by fluorescence enhancement. In addition, the receptor exhibits relay recognition involving CN− and Fe3+ ions, providing a further functional sensing response. The present anthracene-based receptor, therefore, functions as a reversible colorimetric and fluorometric sensor for cyanide detection in the DMSO medium, offering potential advantages for reusable and on-site cyanide monitoring. Because high sensitivity is an essential requirement for practical sensing applications, the detection limit of the receptor was determined to be 7.3 × 10⁻⁷ M. The developed receptor exhibited enhanced sensitivity and selectivity toward CN− ions compared with previously reported cyanide sensors [40,41,42,43,44]. The interaction between the receptor and CN− ions was further confirmed by proton nuclear magnetic resonance (1H NMR) spectroscopy. In addition, the sensing response toward CN− was systematically evaluated using fluorescence emission spectroscopy, UV–visible absorption spectroscopy, and Job’s plot analysis. Furthermore, the practical applicability of the receptor was demonstrated through bioimaging studies and real-sample analysis.

2. Materials and Methods

2.1. Chemicals and Reagents Used for the Receptor Preparation

2-Aminoanthracene and 2-hydroxy-5-nitrobenzaldehyde were purchased from Sigma-Aldrich (Bengalore, India) and used as received without further purification. The tetrabutylammonium salts of cyanide (CN−), fluoride (F−), chloride (Cl−), bromide (Br−), iodide (I−), acetate (OAc−), dihydrogen phosphate (H2PO4−), hydrogen sulfate (HSO4−), and nitrate (NO3−) ions were obtained from commercial suppliers in Bangalore, India, and used without additional purification. The 1H and 13C NMR spectra were recorded on a Bruker 500 MHz NMR spectrometer (Billerica, MA, USA) using DMSO-d6 as the solvent. Tetramethylsilane (TMS) was employed as the internal standard for chemical-shift referencing in both 1H and 13C NMR measurements. FT-IR spectra were recorded using a Thermo Fisher FT-IR spectrometer (Bangalore, India) with KBr pellets as the sample matrix. UV–visible absorption spectra were measured using a Shimadzu UV-2600 spectrophotometer (Kyoto, Japan). All solutions were analyzed in quartz cuvettes. Fluorescence emission spectra were recorded using a Shimadzu RF-5301 PC spectrofluorometer (Kyoto, Japan) at an excitation wavelength of 390 nm. The excitation and emission slit widths were maintained at 5 nm, and the spectra were recorded over a range of 200–600 nm at a scan speed of 200–600 nm min−1. For all spectroscopic and analytical measurements, a 5.0 × 10⁻⁵ M solution of the receptor in DMSO was employed. Standard stock solutions of the anions (1.5 × 10⁻³ M in DMSO) and metal cations (1.5 × 10⁻³ M in H2O) were prepared and used for sensing and competitive inhibition studies. For the sensing experiments, the receptor solution (5.0 × 10⁻⁵ M in DMSO) and the corresponding anion solutions (1.5 × 10⁻³ M in DMSO) were prepared appropriately. During the titration experiments, the analytes were added incrementally in the range of 0.1–2.0 equivalents. All measurements were performed repeatedly to ensure the reproducibility and consistency of the obtained results.

2.2. Synthesis of Receptor

2-Aminoanthracene (0.096 g, 0.5 mmol) and 2-hydroxy-5-nitrobenzaldehyde (0.083 g, 0.5 mmol) were dissolved in ethanol (2.0 mL), followed by the addition of one drop of concentrated sulfuric acid. The resulting reaction mixture was stirred continuously for 12 h. The progress of the reaction was monitored by thin-layer chromatography (TLC) using a hexane/ethyl acetate mixture (8:3, v/v) as the eluent. Upon completion of the reaction, a yellow precipitate was formed. The precipitated solid was separated via filtration and washed three to four times with ethanol to remove residual impurities. The purified product was obtained as a bright-yellow solid in 85% yield, with a melting point of 264 °C. The synthesized receptor was characterized using FT-IR, 1H NMR, 13C NMR, UV–visible absorption, and photoluminescence spectroscopy. FT-IR (KBr, cm−1): 3400–3200 (br, O–H), 3060 (Ar–H), 1620 (C=N, azomethine), 1600–1500 (aromatic C=C).1H NMR (500 MHz, DMSO-d6, δ ppm): 7.28 (d, 2H, J = 8 Hz), 7.57 (t, 2H, J = 8 Hz), 7.86 (t, 2H, J = 6.5 Hz), 8.03 (d, 2H, J = 8 Hz), 8.13 (d, 2H, J = 8 Hz), 8.17 (t, 1H, J = 6.5 Hz), 9.40 (s, 1H, HC=N), 10.31 (s, 1H), 14.54 (s, 1H, OH). The 1H NMR spectrum is provided in Figure S2 (Supporting Information). 13C NMR (500 MHz, DMSO-d6, δ ppm): 164.41 (C=N), 157.24 (C–O), 148.20 (C–NO2), 138.92, 135.14, 133.52, 132.63, 132.14, 130.92, 129.79, 129.30, 128.67, 128.02, 126.85, 126.51, 124.90, 124.73, 122.62, 119.18, 112.87, 107.30. The 13C NMR spectrum is shown in Figure S3 (Supporting Information). The synthesized receptor was further investigated via UV–visible absorption spectroscopy and photoluminescence spectroscopy to evaluate its photophysical properties and sensing behavior.

3. Results

Scheme 1 illustrates the synthetic route employed for the preparation of the anthracene-based receptor. The receptor was synthesized through a condensation reaction between 2-aminoanthracene (0.096 g, 0.5 mmol) and 2-hydroxy-5-nitrobenzaldehyde (0.083 g, 0.5 mmol) in ethanol as the reaction medium. The structure of the synthesized receptor was confirmed by 1H and 13C NMR spectroscopic analyses. The colorimetric sensing behavior of the receptor was investigated toward a series of anions, including CN−, F−, Cl−, Br−, I−, OAc−, H2PO4−, HSO4−, and NO3−, which were employed as their corresponding tetrabutylammonium salts. Upon the addition of the various anions to the receptor solution, a distinct color change from yellow to pink was observed exclusively in the presence of CN− ions, whereas the addition of the other tested anions produced no noticeable visual response. The corresponding colorimetric responses are shown in Figure 1. These observations clearly demonstrate the selective interaction of the receptor with CN− ions over the other investigated anions.
The observed colorimetric response can be attributed to the intramolecular hydrogen-bonding interaction involving the phenolic –OH proton within the receptor. The presence of this strong intramolecular hydrogen bond influences the electronic properties of the chromophore. Interaction of the receptor with CN− perturbs this hydrogen-bonding environment, resulting in changes in the electronic structure of the receptor and consequently producing the distinct yellow-to-pink colorimetric response. Thus, the receptor exhibits a highly selective naked-eye response toward cyanide ions.

3.1. UV–Vis Spectral Changes in Receptor and Cyanide Ion

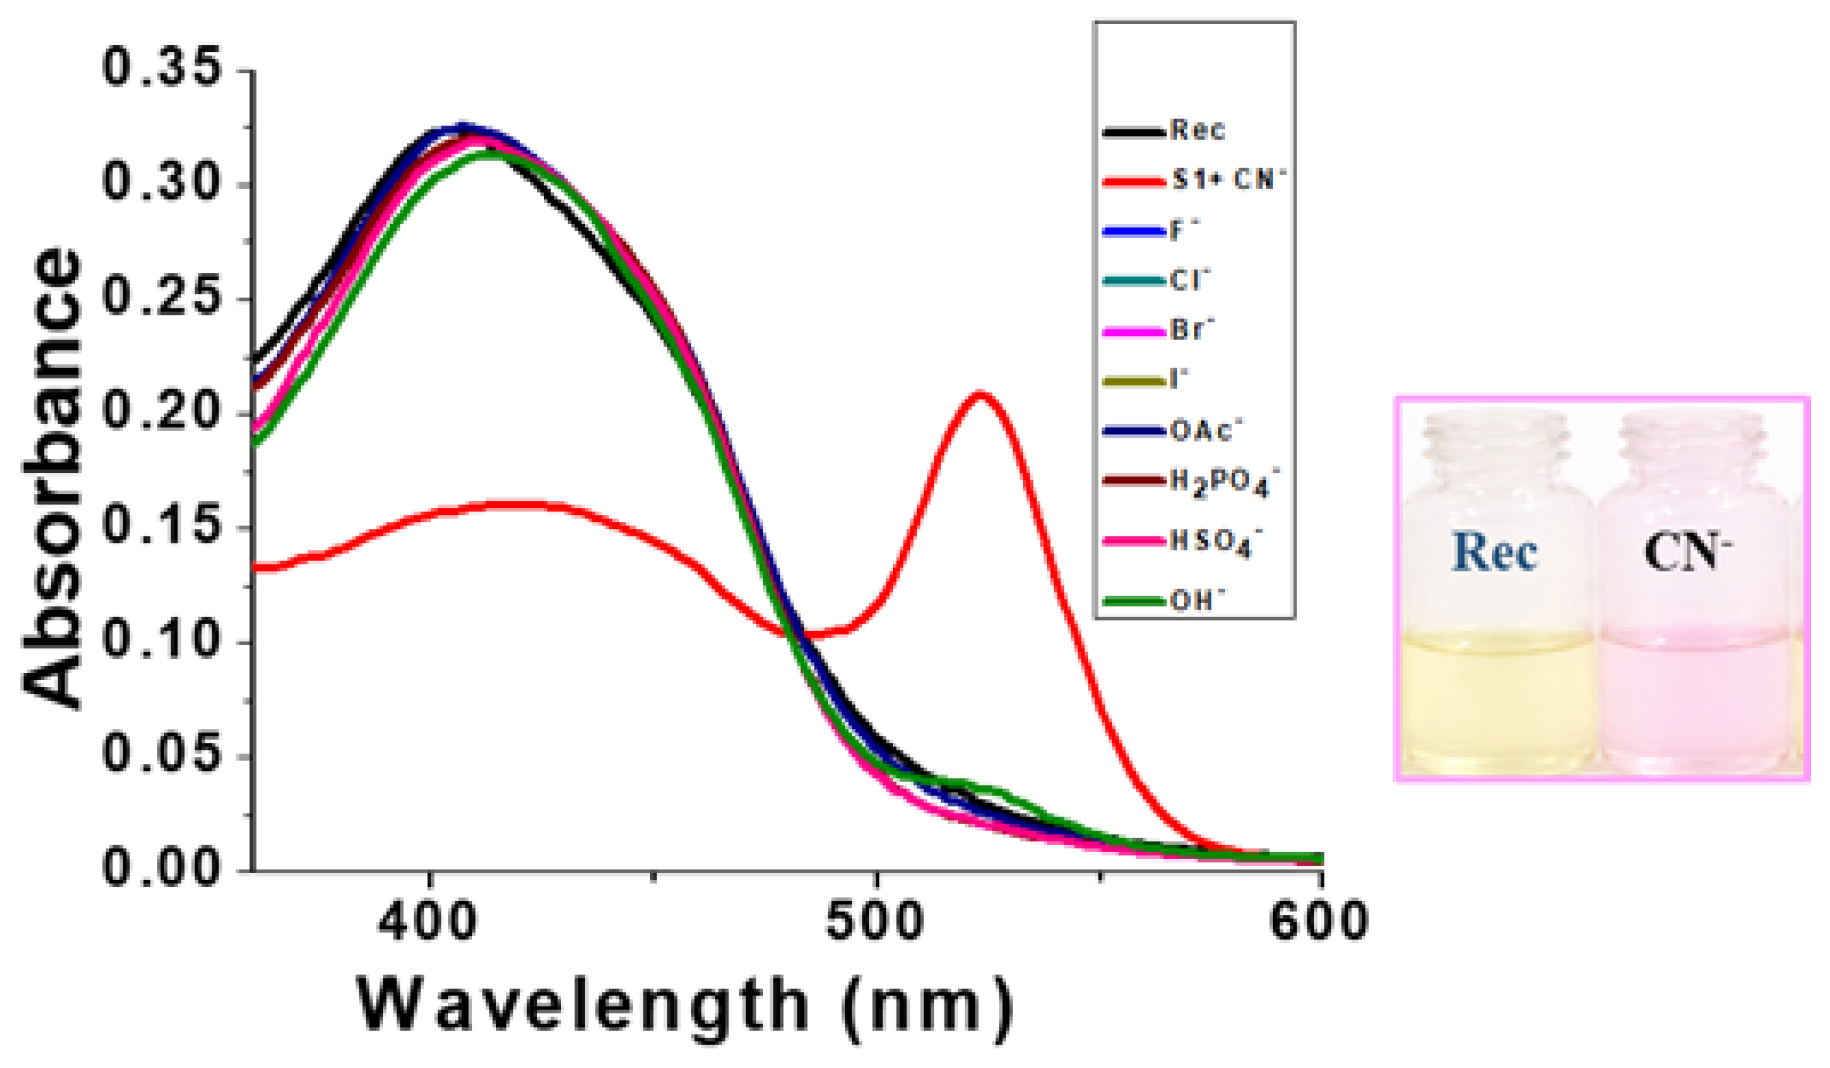
A receptor solution was prepared in DMSO at a concentration of 5 × 10⁻⁵ M, while the corresponding anion stock solutions were prepared at a concentration of 1.5 × 10⁻³ M in the same solvent. The interaction of the receptor with a series of anions was systematically investigated using UV–visible absorption spectroscopy. Among the investigated anions, CN− produced a distinct and selective spectral response. Upon the addition of CN−, a pronounced red shift in the absorption spectrum was observed, accompanied by the appearance of a new absorption band at 522 nm. The receptor exhibited a λ_max at 522 nm in the presence of CN−, which was accompanied by an instantaneous visual color change from yellow to pink in DMSO medium. In contrast, the addition of other tested anions, including F−, Cl−, Br−, I−, OAc−, H2PO4−, HSO4−, and NO3−, produced no significant alteration in the absorption maximum (λ_max) (Figure 2). These results demonstrate the pronounced and selective recognition of CN− by the receptor.
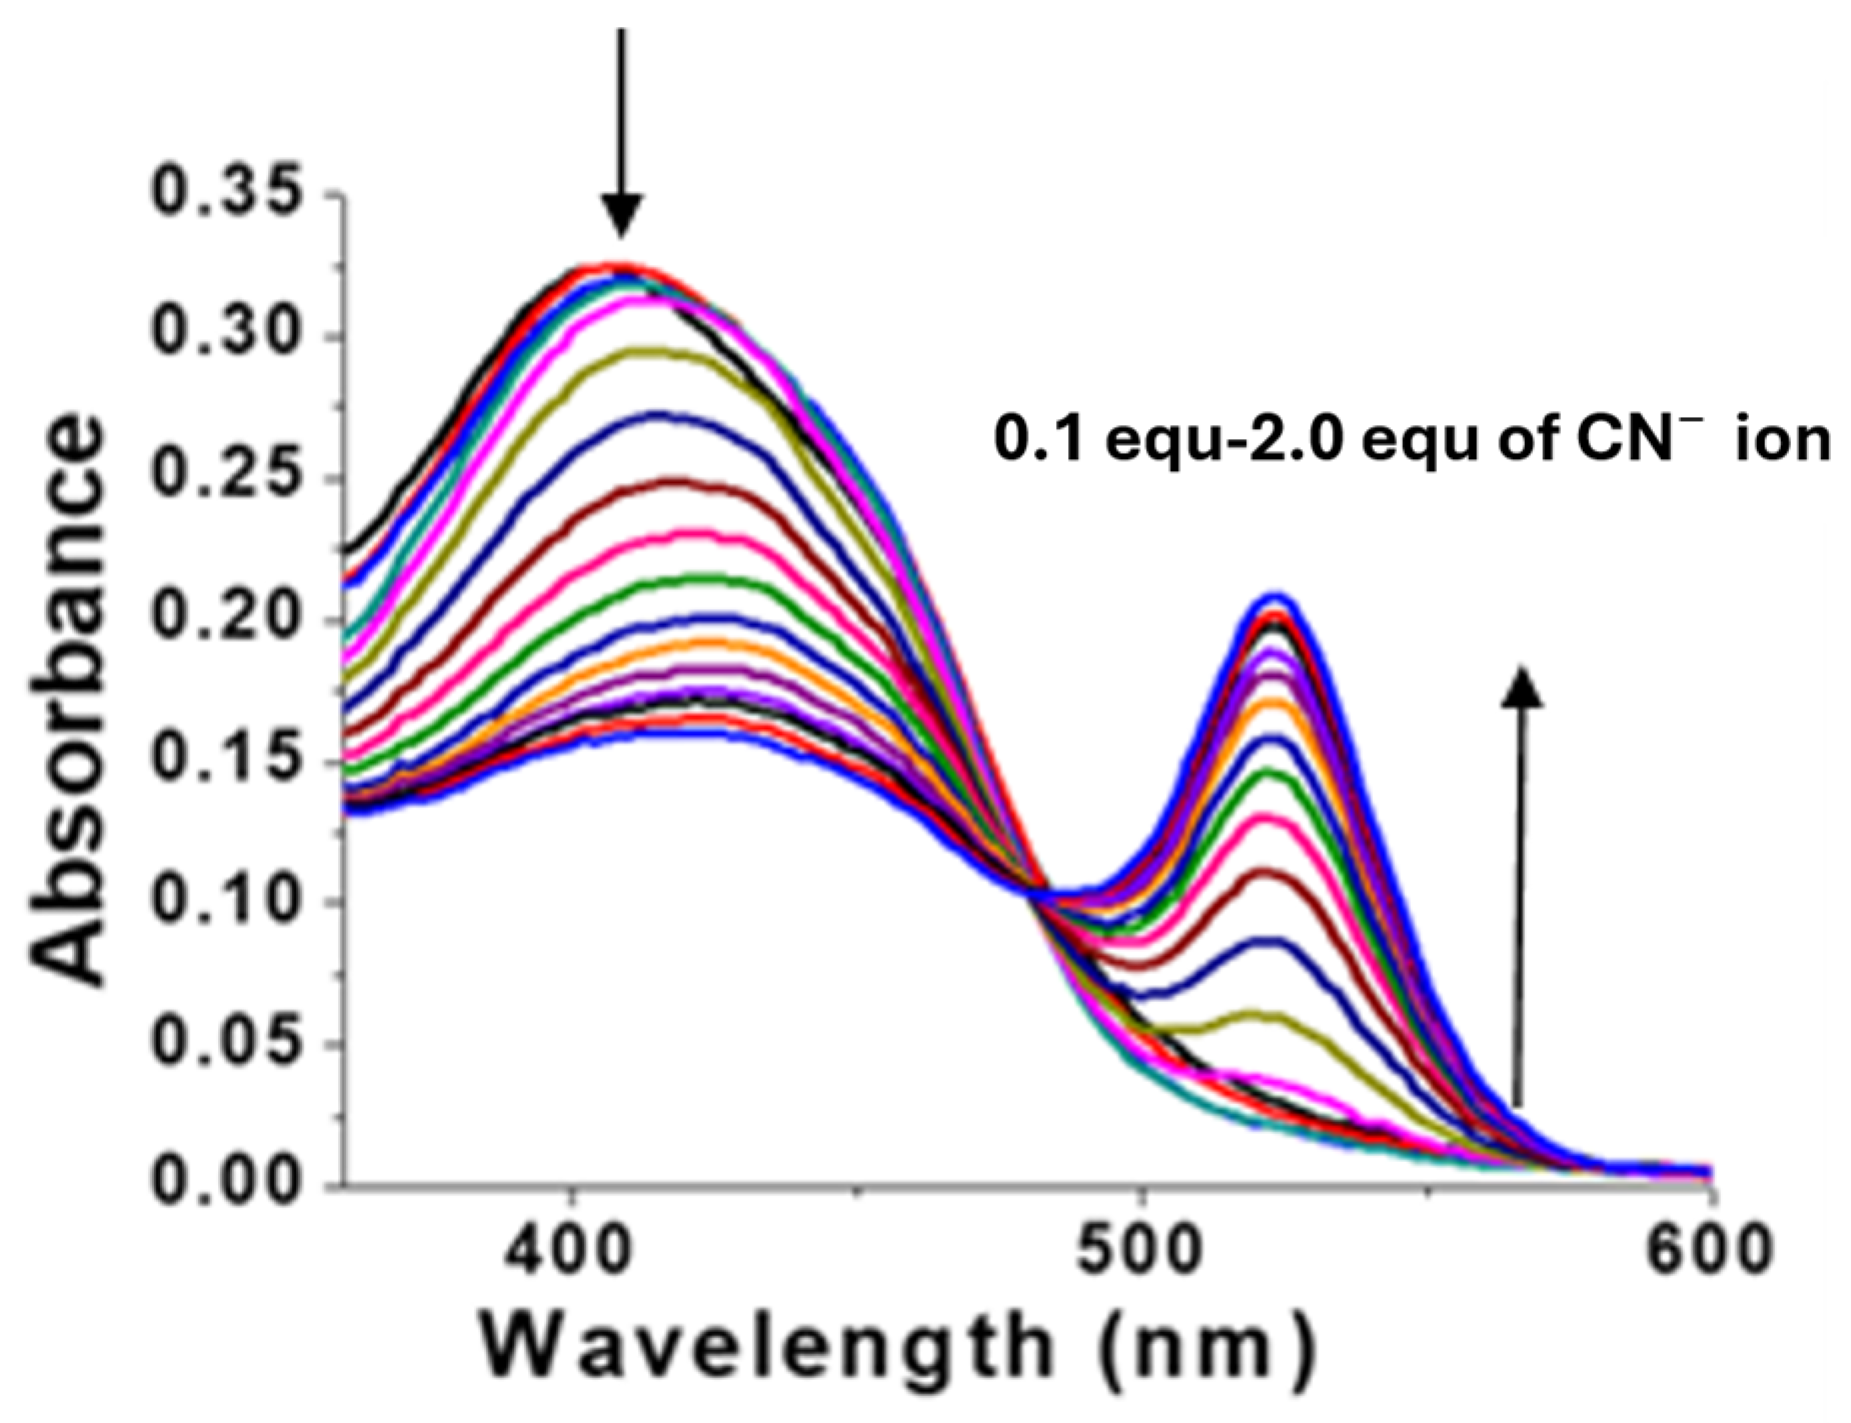
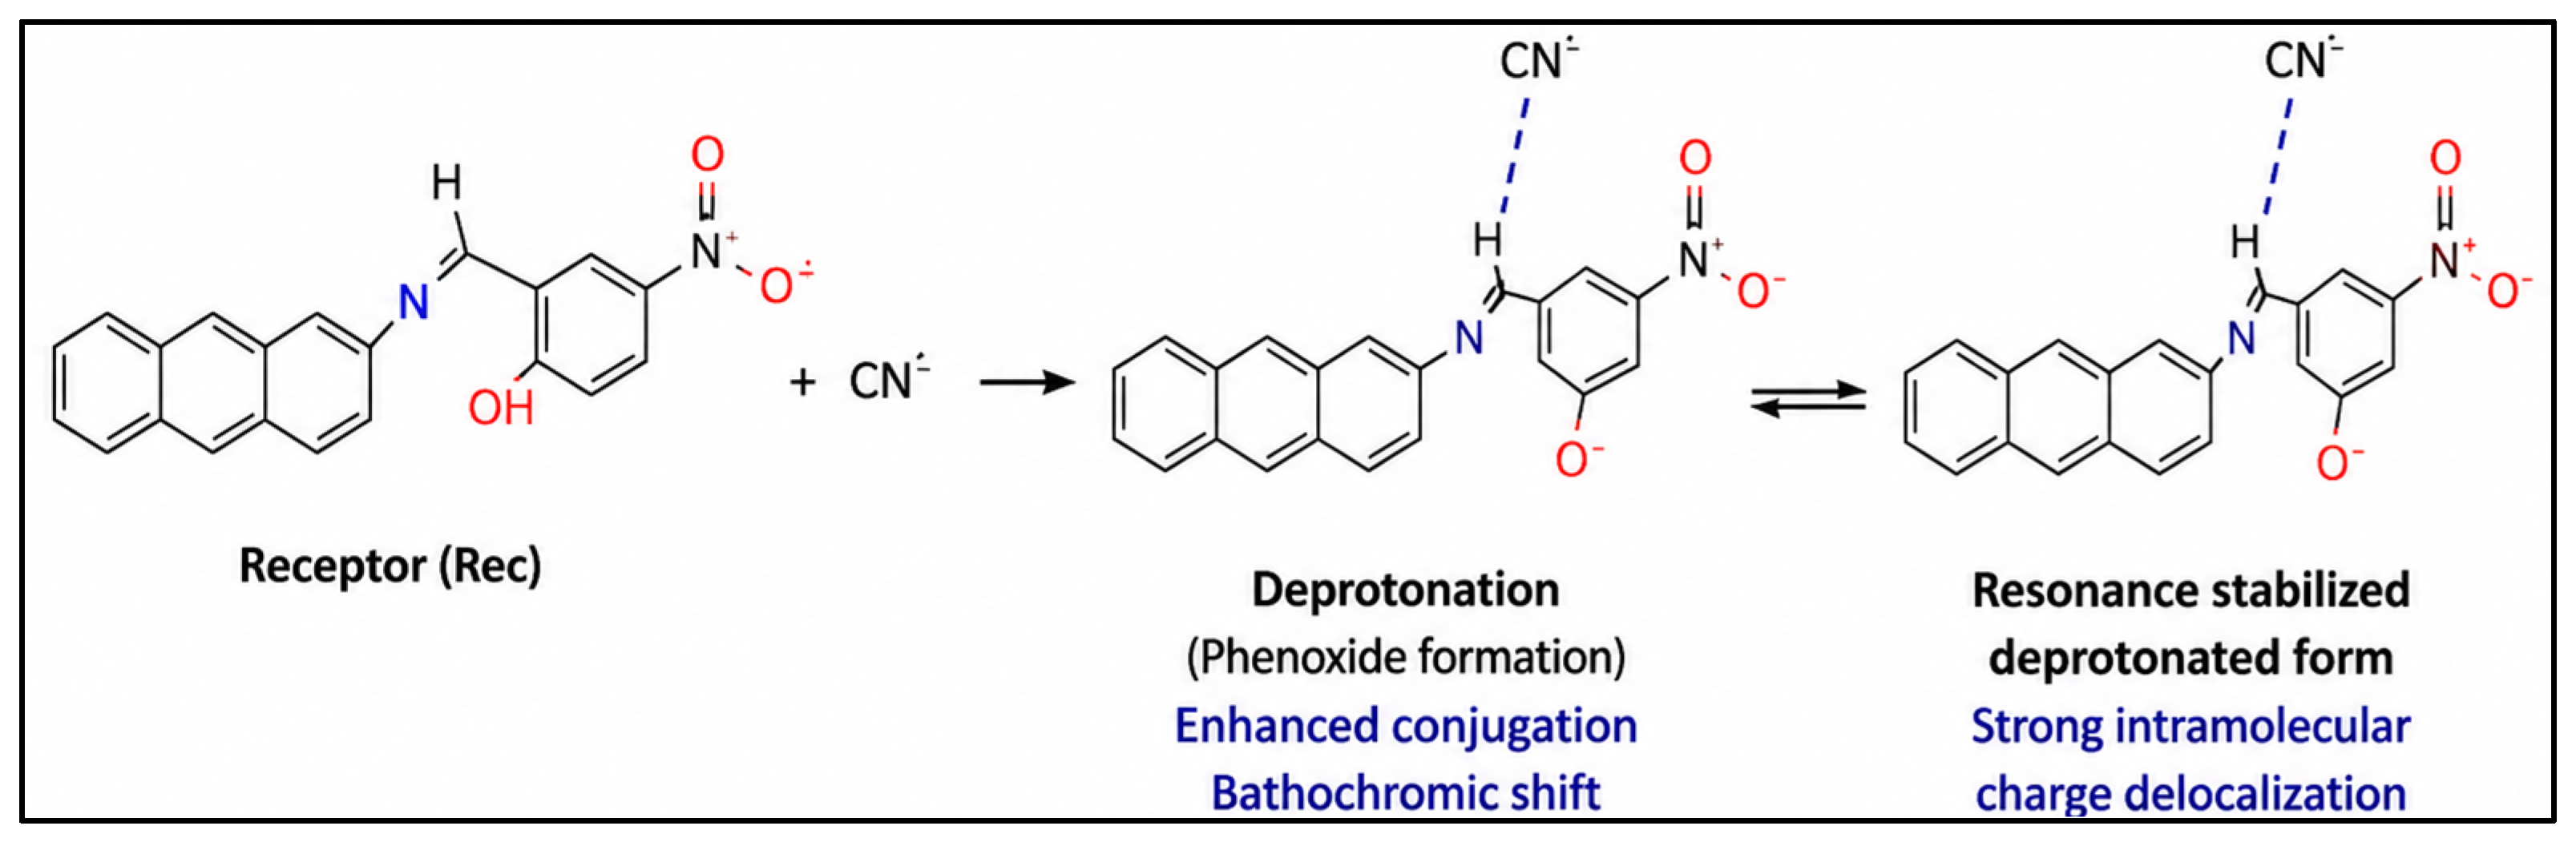
Upon the gradual addition of CN− ions to the receptor solution, the absorption band at 424 nm progressively decreased in intensity, accompanied by the appearance of a new absorption band at 522 nm, as shown in Figure 3. The emergence of the new absorption band can be attributed to an intramolecular charge-transfer (ICT) process between the receptor recognition site (>NH/CN−) and the benzene-based signaling unit. The observed bathochromic shift is likely associated with an ICT process induced by the deprotonation of the receptor upon interaction with CN− ions. The proposed binding mechanism between the receptor and CN− ions is illustrated in Scheme 2. Similar sensing behavior has been reported in the literature [45,46,47]. These results further confirm the selective interaction of the synthesized receptor with CN− ions.

3.2. Fluorescence Sensing Studies

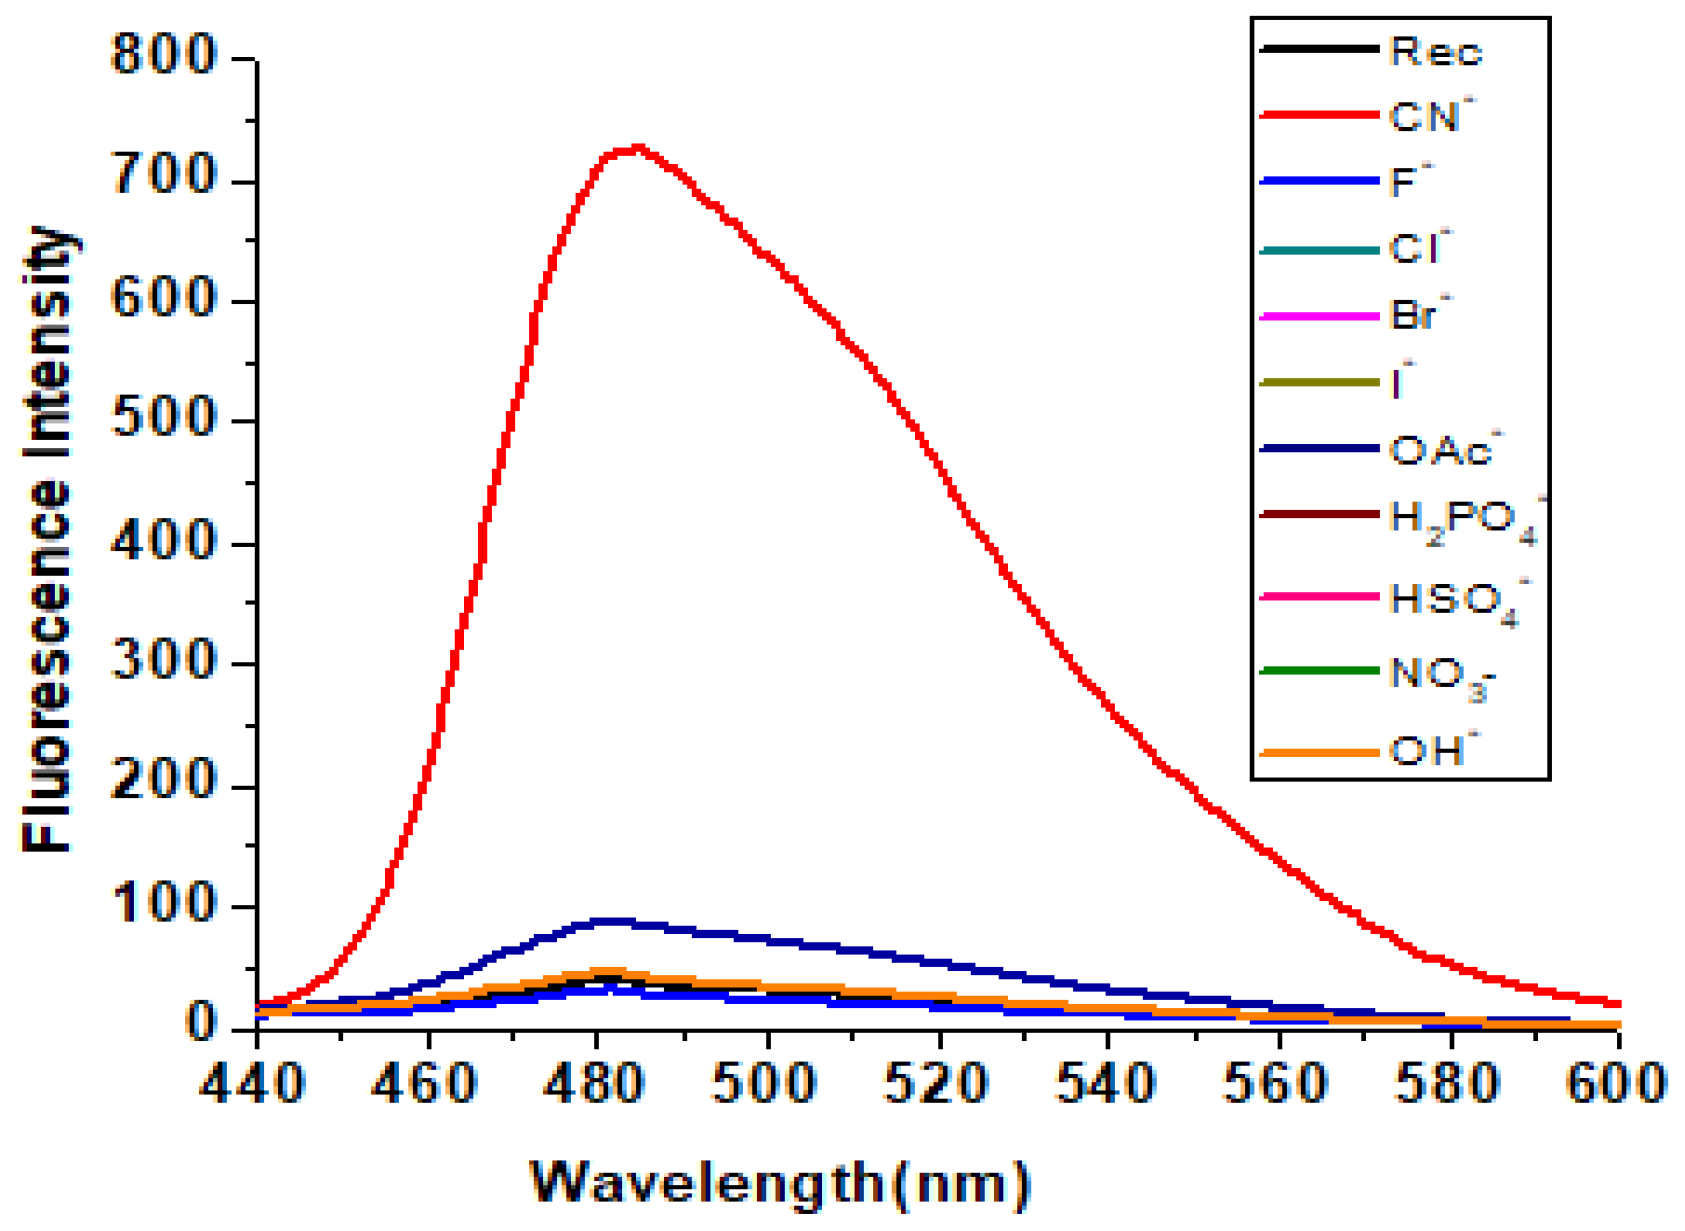
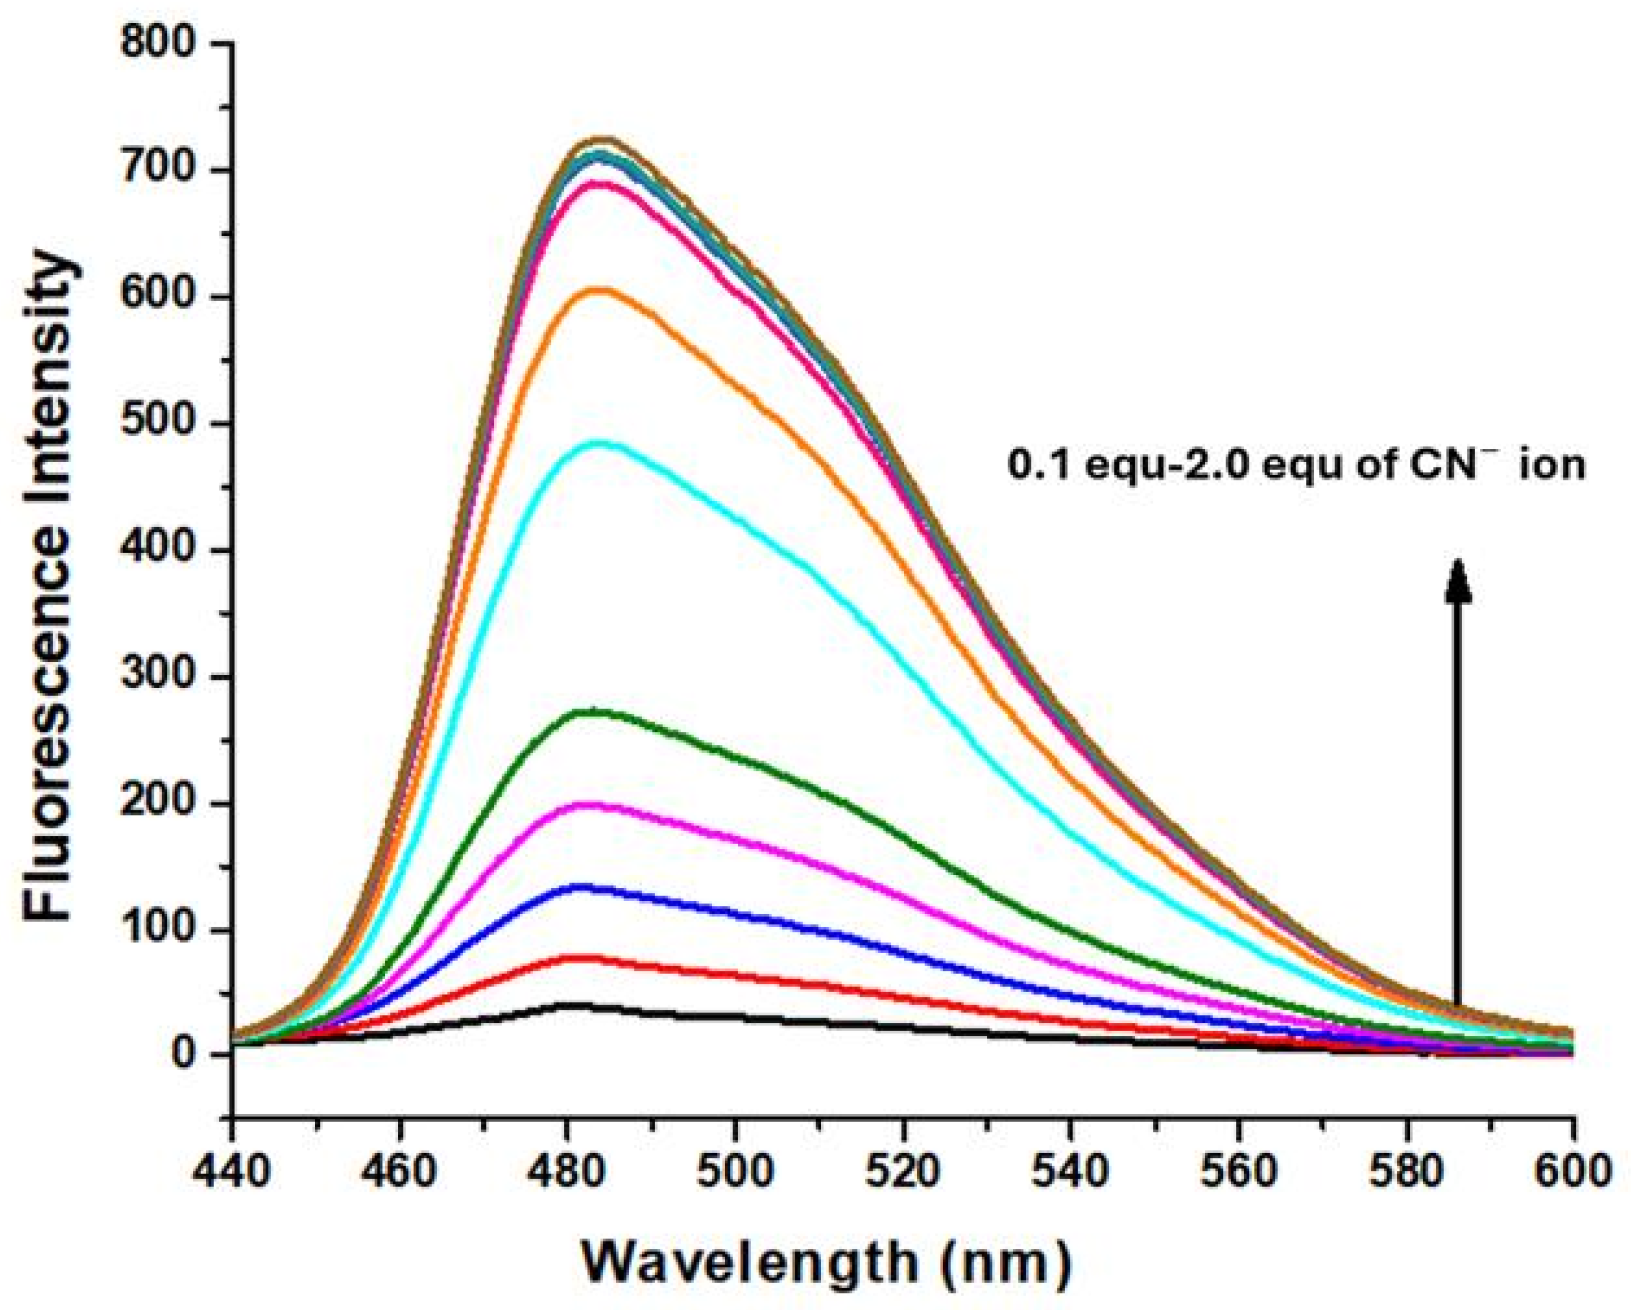
Fluorescence spectroscopy is a highly effective analytical technique for investigating molecular interactions and probing changes in the photophysical properties of fluorescent receptors. Anthracene derivatives are among the most widely investigated fluorophores owing to their excellent photostability, rigid π-conjugated framework, and high fluorescence quantum yields. Nevertheless, their emission properties are strongly dependent on molecular structure and solvent polarity. Unsubstituted or locally excited anthracene derivatives generally exhibit intense fluorescence, particularly in non-polar media. In contrast, donor–acceptor anthracene systems exhibiting intramolecular charge-transfer (ICT) characteristics may show diminished fluorescence in polar solvents because stabilization of the ICT excited state can promote non-radiative relaxation pathways, including internal conversion and, in certain systems, twisted intramolecular charge transfer (TICT). Consequently, the fluorescence intensity and quantum yield of anthracene derivatives are highly sensitive to their surrounding molecular environment, making them attractive platforms for the development of environmentally responsive fluorescent chemosensors [48,49,50]. The synthesized receptor exhibited a characteristic fluorescence emission band at 480 nm. Upon the addition of 2.0 equivalents of CN− ions to the receptor solution, a pronounced enhancement in fluorescence intensity was observed, accompanied by a slight red shift in the emission maximum from 480 to 495 nm (Figure 4). In addition to the spectroscopic response, a distinct visual fluorescence change was observed under UV illumination at 365 nm. The initially pink solution exhibited a cyan-colored fluorescence after the addition of CN− ions, which could be readily observed by the naked eye. In contrast, the addition of the other investigated anions produced no appreciable changes in the fluorescence emission of the receptor, further demonstrating its selective response toward CN− ions. The fluorescence titration experiment was subsequently performed by gradually adding CN− ions in the range of 0.1–2.0 equivalents to the receptor solution. As shown in Figure 5, the fluorescence intensity progressively increased with increasing concentrations of CN− ions. The observed fluorescence enhancement is attributed to the formation of a receptor–CN− adduct, followed by proton transfer from the phenolic –OH group of the receptor to the cyanide ion. This interaction alters the electronic environment of the receptor and consequently results in the pronounced enhancement of its fluorescence emission.

3.3. Interference and Selectivity Studies

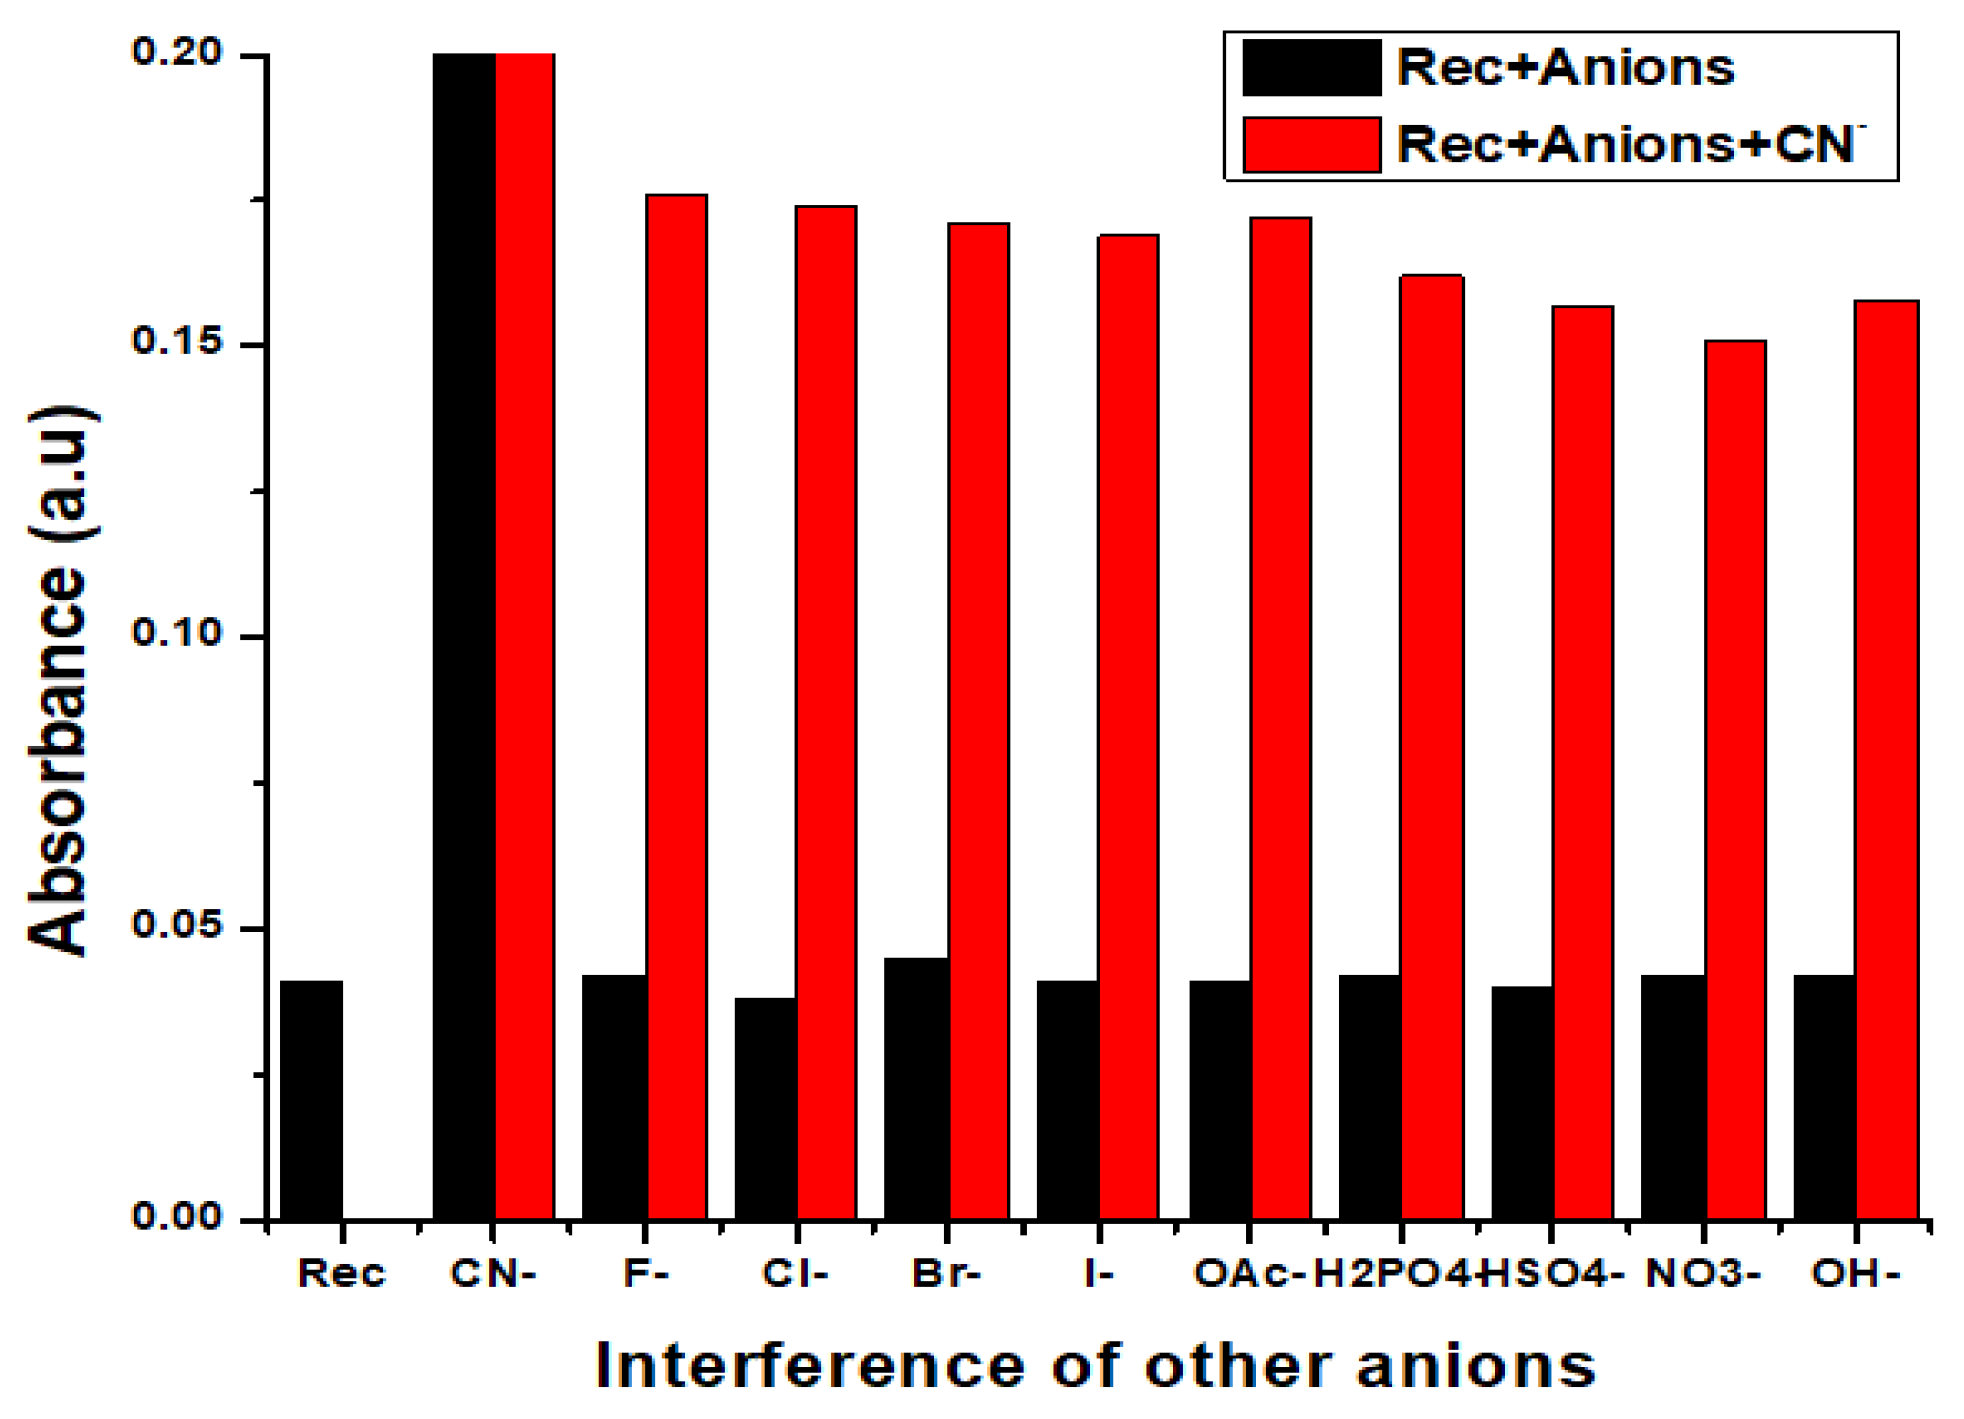
Interference studies were performed to evaluate the selectivity of the receptor toward CN− ions in the presence of potentially competing anions. A receptor solution (5.0 × 10⁻⁵ M in DMSO) was initially treated with various interfering anions (1.5 × 10⁻³ M in DMSO), followed by the addition of CN− ions at the same concentration (1.5 × 10⁻³ M). The corresponding spectral responses were monitored at 522 nm. As shown in Figure 6, the presence of the competing anions did not cause any significant alteration in the absorption intensity of the receptor–CN− complex. These results indicate that the receptor possesses excellent selectivity toward CN− ions and maintains a stable sensing response even in the presence of other potentially interfering anions.

3.4. Relay Recognition of Fe3+ in the Presence of Cyanide

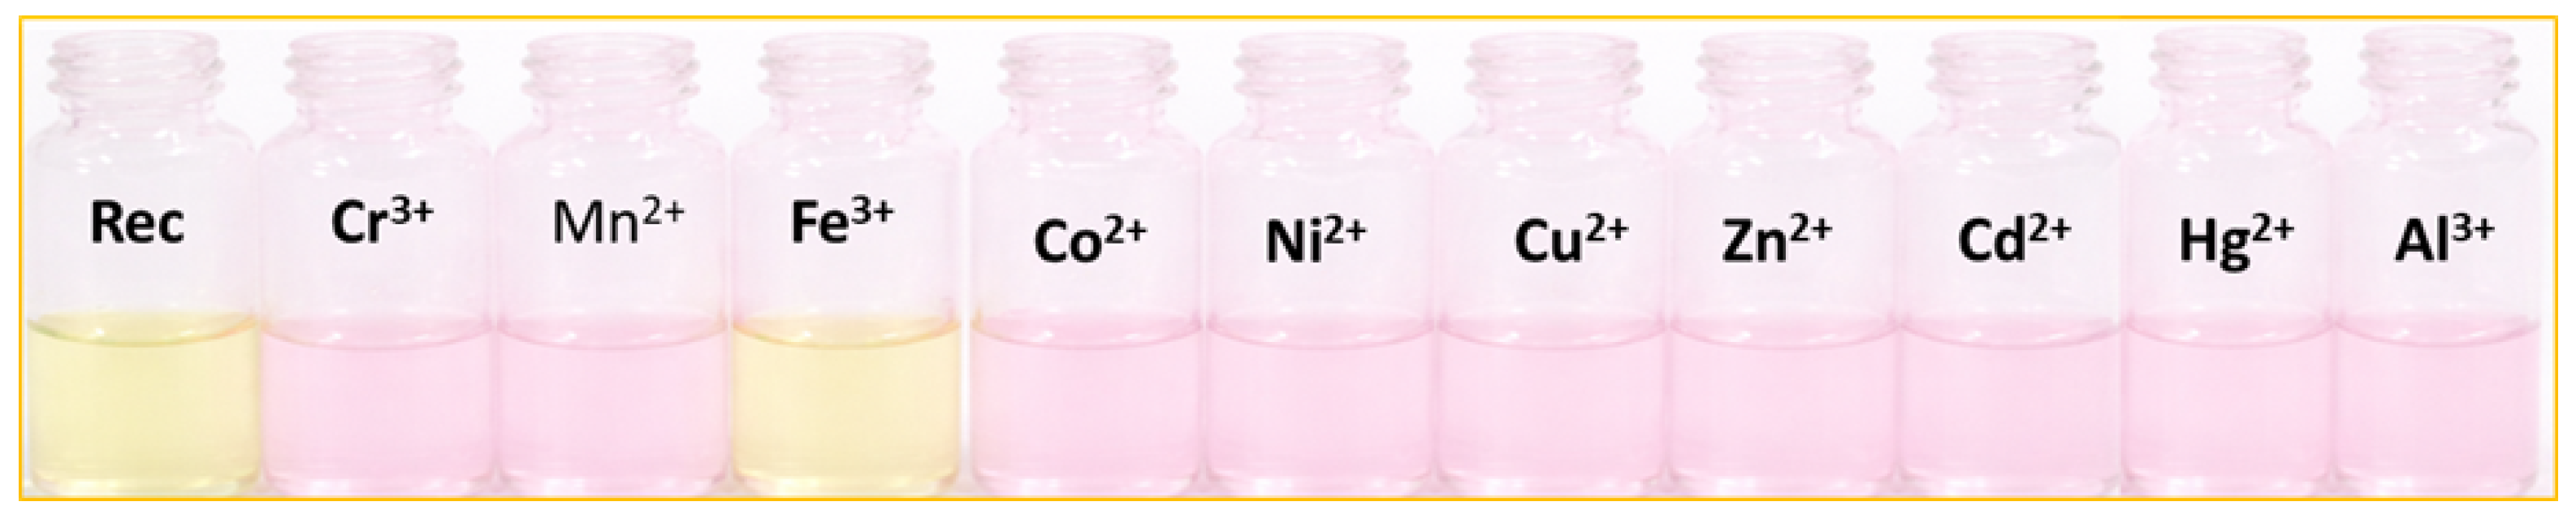
The influence of various metal cations, including Co2+, Mn2+, Cu2+, Zn2+, Cd2+, Hg2+, Ni2+, Cr3+, Fe3+, and Al3+, was investigated under identical solvent conditions. None of the investigated metal ions produced an appreciable visual color change or significant spectral response from the receptor. In contrast, the receptor exhibited a pronounced and selective response toward Fe3+ in the presence of CN− ions. For this study, the receptor solution (5.0 × 10⁻⁵ M) was prepared in DMSO, followed by the addition of 2.0 equivalents of CN− ions and subsequently 2.0 equivalents of the respective metal cations in aqueous medium. Interestingly, a distinct color change from pink to yellow was observed exclusively upon the addition of Fe3+, whereas the other tested cations produced no noticeable visual response in the presence of CN− (Figure 7).
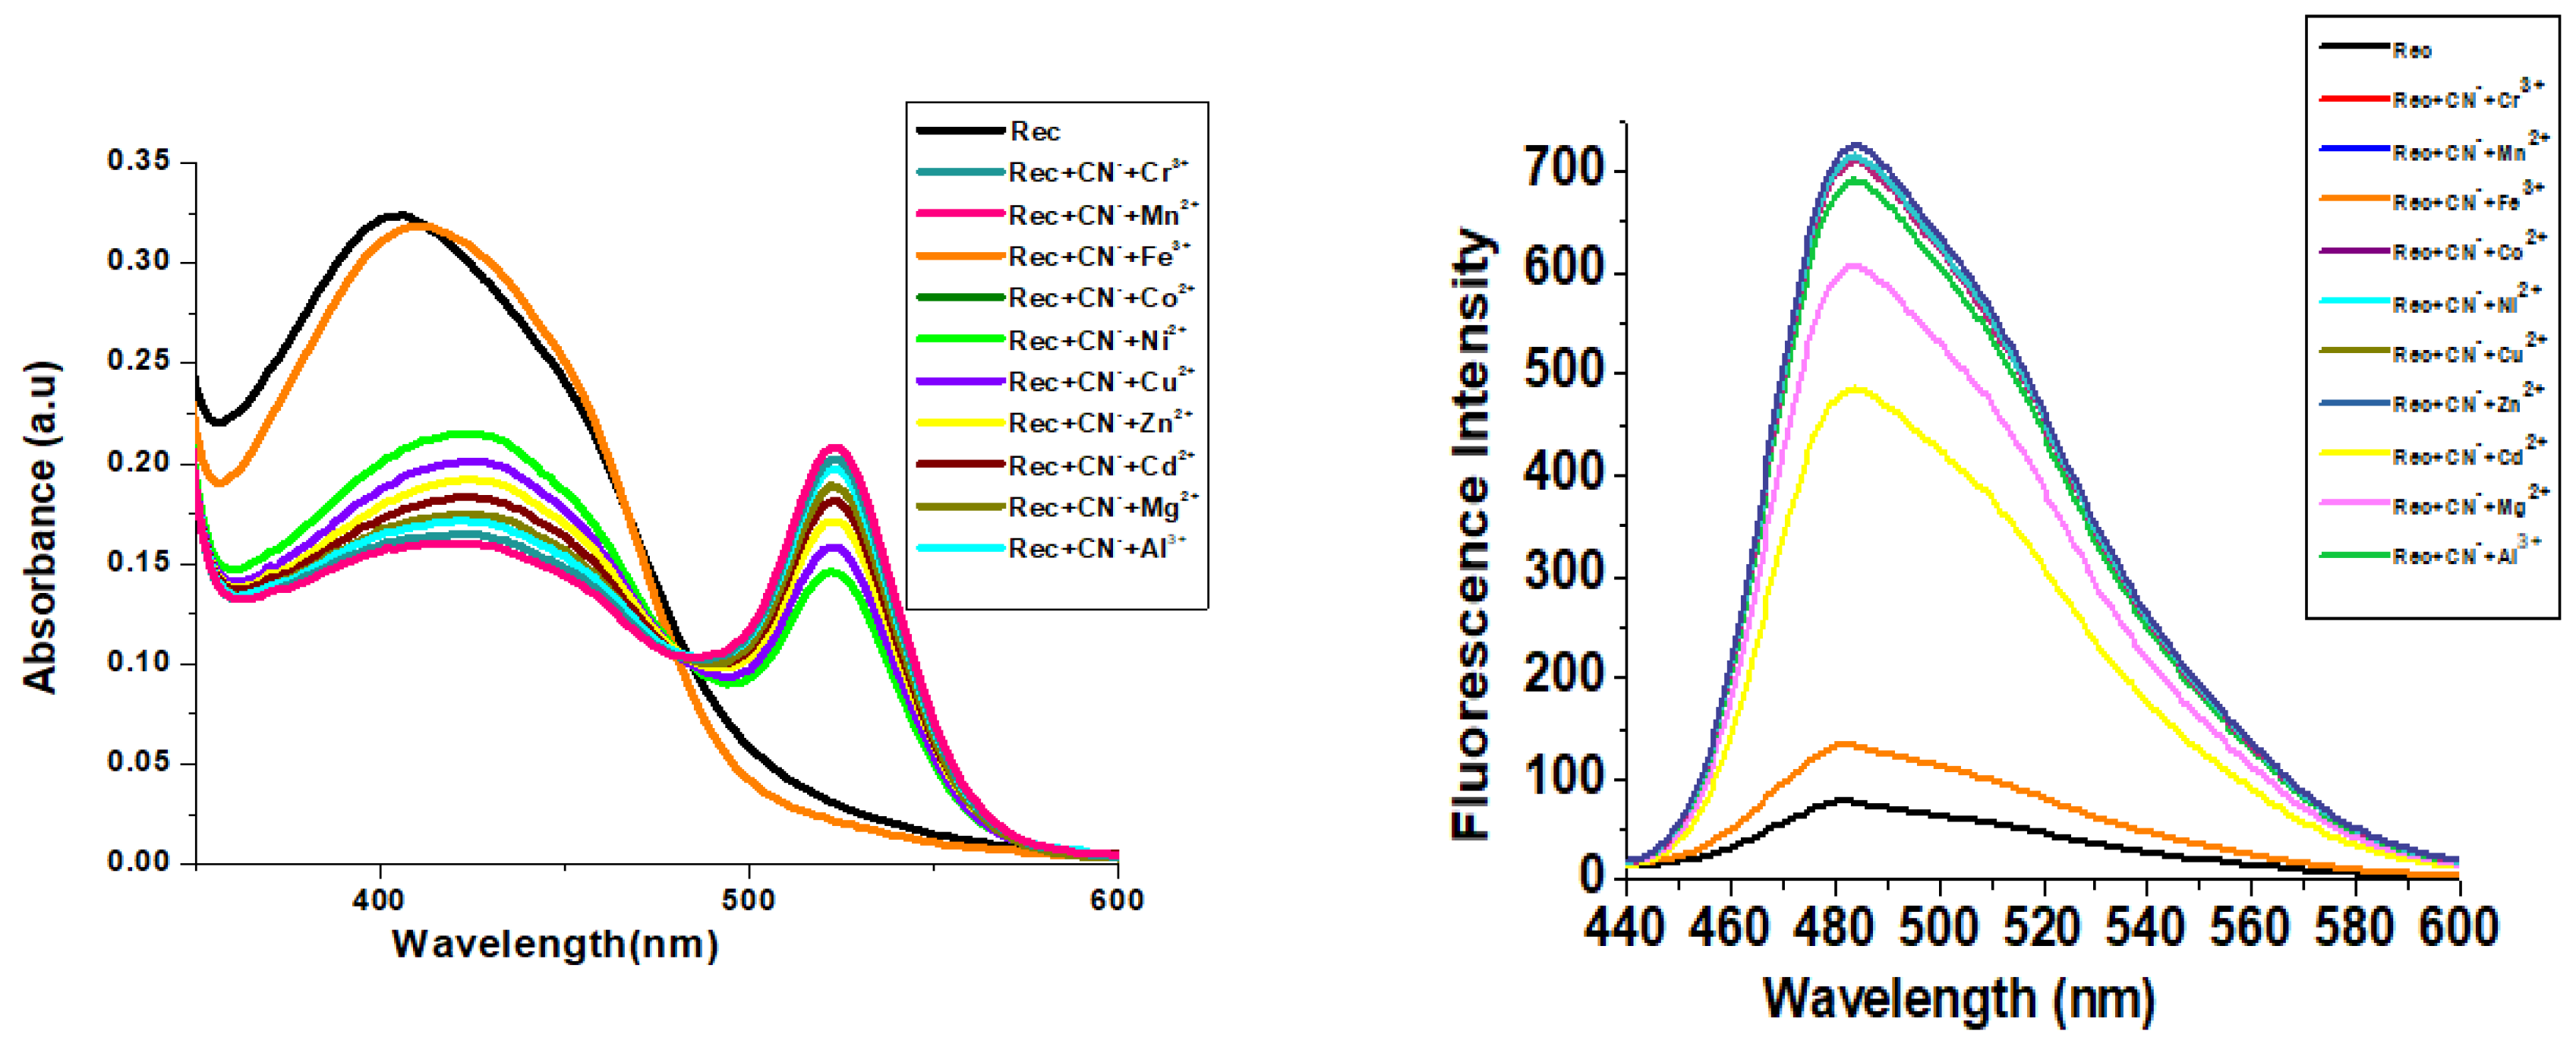
The proposed sequential sensing mechanism involves an initial interaction between CN− and the receptor through nucleophilic addition at the imine (C=N) carbon, leading to the formation of a receptor–CN− adduct. This reaction disrupts the extended π-conjugation of the receptor and results in a pronounced fluorescence enhancement through suppression of the photoinduced electron-transfer (PET) process. Upon subsequent addition of the investigated metal ions to the receptor–CN− complex, Fe3+ uniquely restores the optical properties of the free receptor, whereas the other metal ions, including Cr3+, Mn2+, Co2+, Ni2+, Cu2+, Zn2+, Cd2+, Hg2+, and Al3+, induce only negligible changes. The UV–visible absorption spectrum of the Rec + CN− + Fe3+ system closely resembles that of the free receptor, indicating substantial recovery of the original electronic structure. Similarly, a pronounced decrease in fluorescence intensity was observed only after the addition of Fe3+, whereas the other metal ions largely retained the enhanced fluorescence response of the receptor–CN− complex. The corresponding naked-eye experiment further confirmed this selective response: the pink color of the receptor–CN− solution reverted to pale yellow only in the presence of Fe3+, while the solutions containing the other metal ions remained pink. The selective recognition of Fe3+ can be attributed to its high Lewis acidity and strong coordination ability. Fe3+ can preferentially interact with the receptor through the phenolic oxygen and imine nitrogen donor sites, facilitating the formation of a stable Fe3+–receptor complex. At the same time, the strong affinity of Fe3+ toward cyanide may promote the removal or displacement of CN− from the receptor–CN− adduct, thereby facilitating regeneration of the original Schiff–base framework. Restoration of the extended conjugated electronic system consequently enables the PET process, resulting in fluorescence quenching and recovery of the initial absorption profile. Thus, the receptor operates as a relay sensing system involving two sequential recognition events: the first event corresponds to CN−-induced nucleophilic addition at the imine functionality, whereas the second involves Fe3+-mediated coordination and regeneration of the free receptor. This sequential recognition mechanism accounts for the pronounced selectivity observed in the UV–visible, fluorescence, and naked-eye sensing experiments (Figure 7). Consistent with these observations, significant changes in both the UV–visible absorption and fluorescence spectra were observed for the Rec + CN− + Fe3+ system (Figure 8). The observed spectral changes may be associated with the formation of the hexacyanoferrate species, [Fe(CN)6]3− [51].

3.5. Reaction Mechanism of the Receptor with Cyanide Ion

For CN− ions, the proposed sensing mechanism involves the nucleophilic addition of cyanide to the receptor. Specifically, the cyanide ion attacks the electrophilic carbon center of the imine (C=N) moiety, followed by the establishment of intramolecular hydrogen bonding, as illustrated in Scheme 2. These successive interactions induce a bathochromic shift in the absorption band toward the visible region [52].

3.6. Job’s Plot Studies

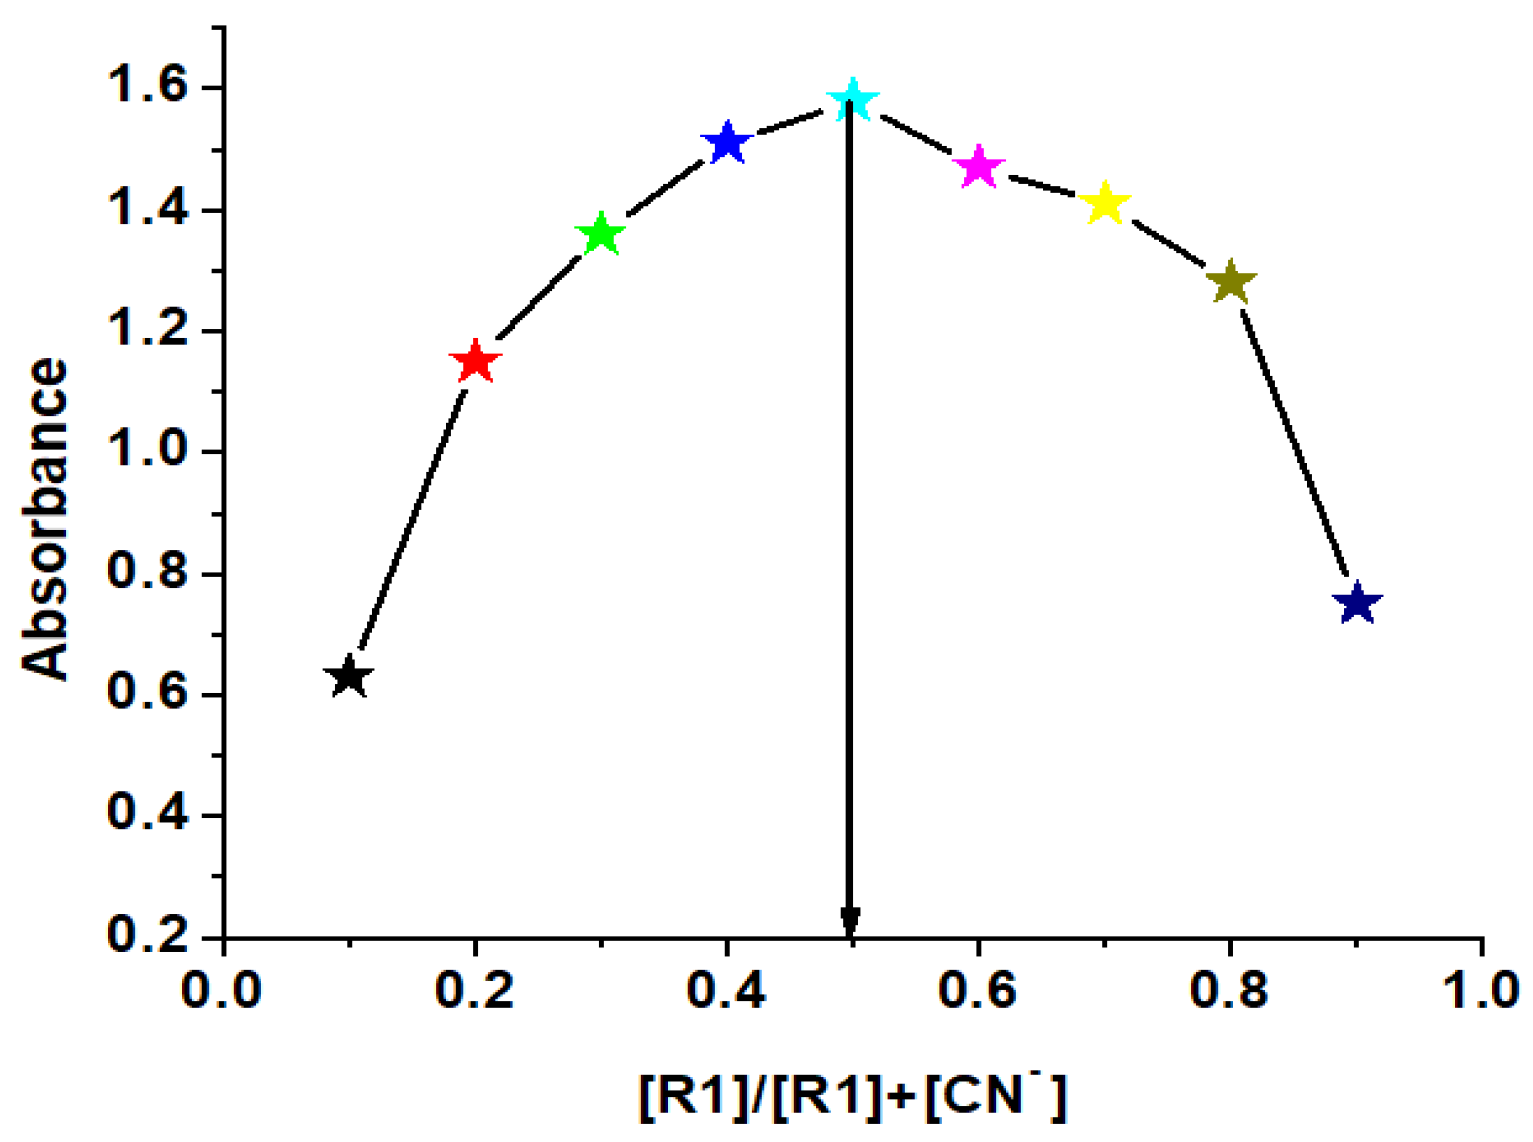
The binding interaction between the receptor and CN− ions was investigated using the continuous variation method (Job’s plot), as shown in Figure 9. A series of solutions was prepared by maintaining the total concentration of the receptor and CN− constant while systematically varying their mole fractions. The plot of ΔA (or ΔF) × mole fraction as a function of the receptor mole fraction displayed a maximum at 0.5, confirming a 1:1 binding stoichiometry between the receptor and CN− ions. It should be noted that this Job’s plot establishes only the stoichiometry of the receptor–CN− interaction and does not represent the stoichiometry of the subsequent receptor–Fe3+ relay process. The latter response can be attributed to competitive binding, in which Fe3+ effectively sequesters cyanide from the receptor–CN− complex, thereby promoting the formation of the thermodynamically stable ferricyanide species, [Fe(CN)6]3−. The association constant (Ka) for the receptor–CN− interaction was determined by fitting the fluorescence/absorption titration data to a 1:1 binding model using the Benesi–Hildebrand equation. The corresponding binding constant and detection limit calculations are presented in Figures S4 and S5 in the Supporting Information, respectively. The receptor exhibited a binding constant of 1.8 × 10⁵ M−1 toward CN−, indicating a strong receptor–anion interaction. The detection limit (LOD) was calculated using the following equation, LOD = 3σ/k, where σ represents the standard deviation of the blank measurements, obtained from repeated measurements of the receptor solution in the absence of CN−, and k denotes the slope of the corresponding calibration curve obtained by plotting the fluorescence intensity (or absorbance) against the CN− concentration. Based on this calculation, the receptor exhibited a detection limit of 7.3 × 10⁻⁷ M for CN−. This value represents the minimum concentration of cyanide that can be reliably distinguished from the blank response under the experimental conditions employed. A comparative analysis of the reported cyanide sensors was performed by considering key analytical parameters, including the sensing mechanism, detection limit (LOD), association constant (Ka), sensing medium, aqueous compatibility, and practical applicability. The relevant comparison is summarized in Table 1.
Table 1. Comparison of reported anthracene-based fluorescent probes for cyanide (CN−) detection, including sensing mechanism, sensing medium, detection limit (LOD), binding constant (K), bioimaging capability, and practical applications.
ProbeSensing MechanismMediumLODBinding Constant (Ka)Aqueous CompatibilityApplicationReference
Sensor 1Hydrogen bonding/DeprotonationDMSO/H2O2.89 × 10−7 M1.95 × 104 M−1YesWater analysisRef [36]
Sensor 2Nucleophilic additionCH3CN3.42 × 10−7 M~104–105PartialTest stripsRef [53]
Sensor 3ICT modulationDMSO/H2O10−6–10−7 M~104–105YesBioimagingRef [54]
Present workDeprotonation of phenolic –OH followed by electronic redistributionPure DMSO7.3 × 10−7 M1.8 × 105 M−1,NoSilica sensor, sprouted potato (qualitative), BioimagingThis work
Figure 9. Job’s plot measurement of receptor with cyanide ion.
Chemosensors 14 00194 g009

3.7. NMR Titration Studies

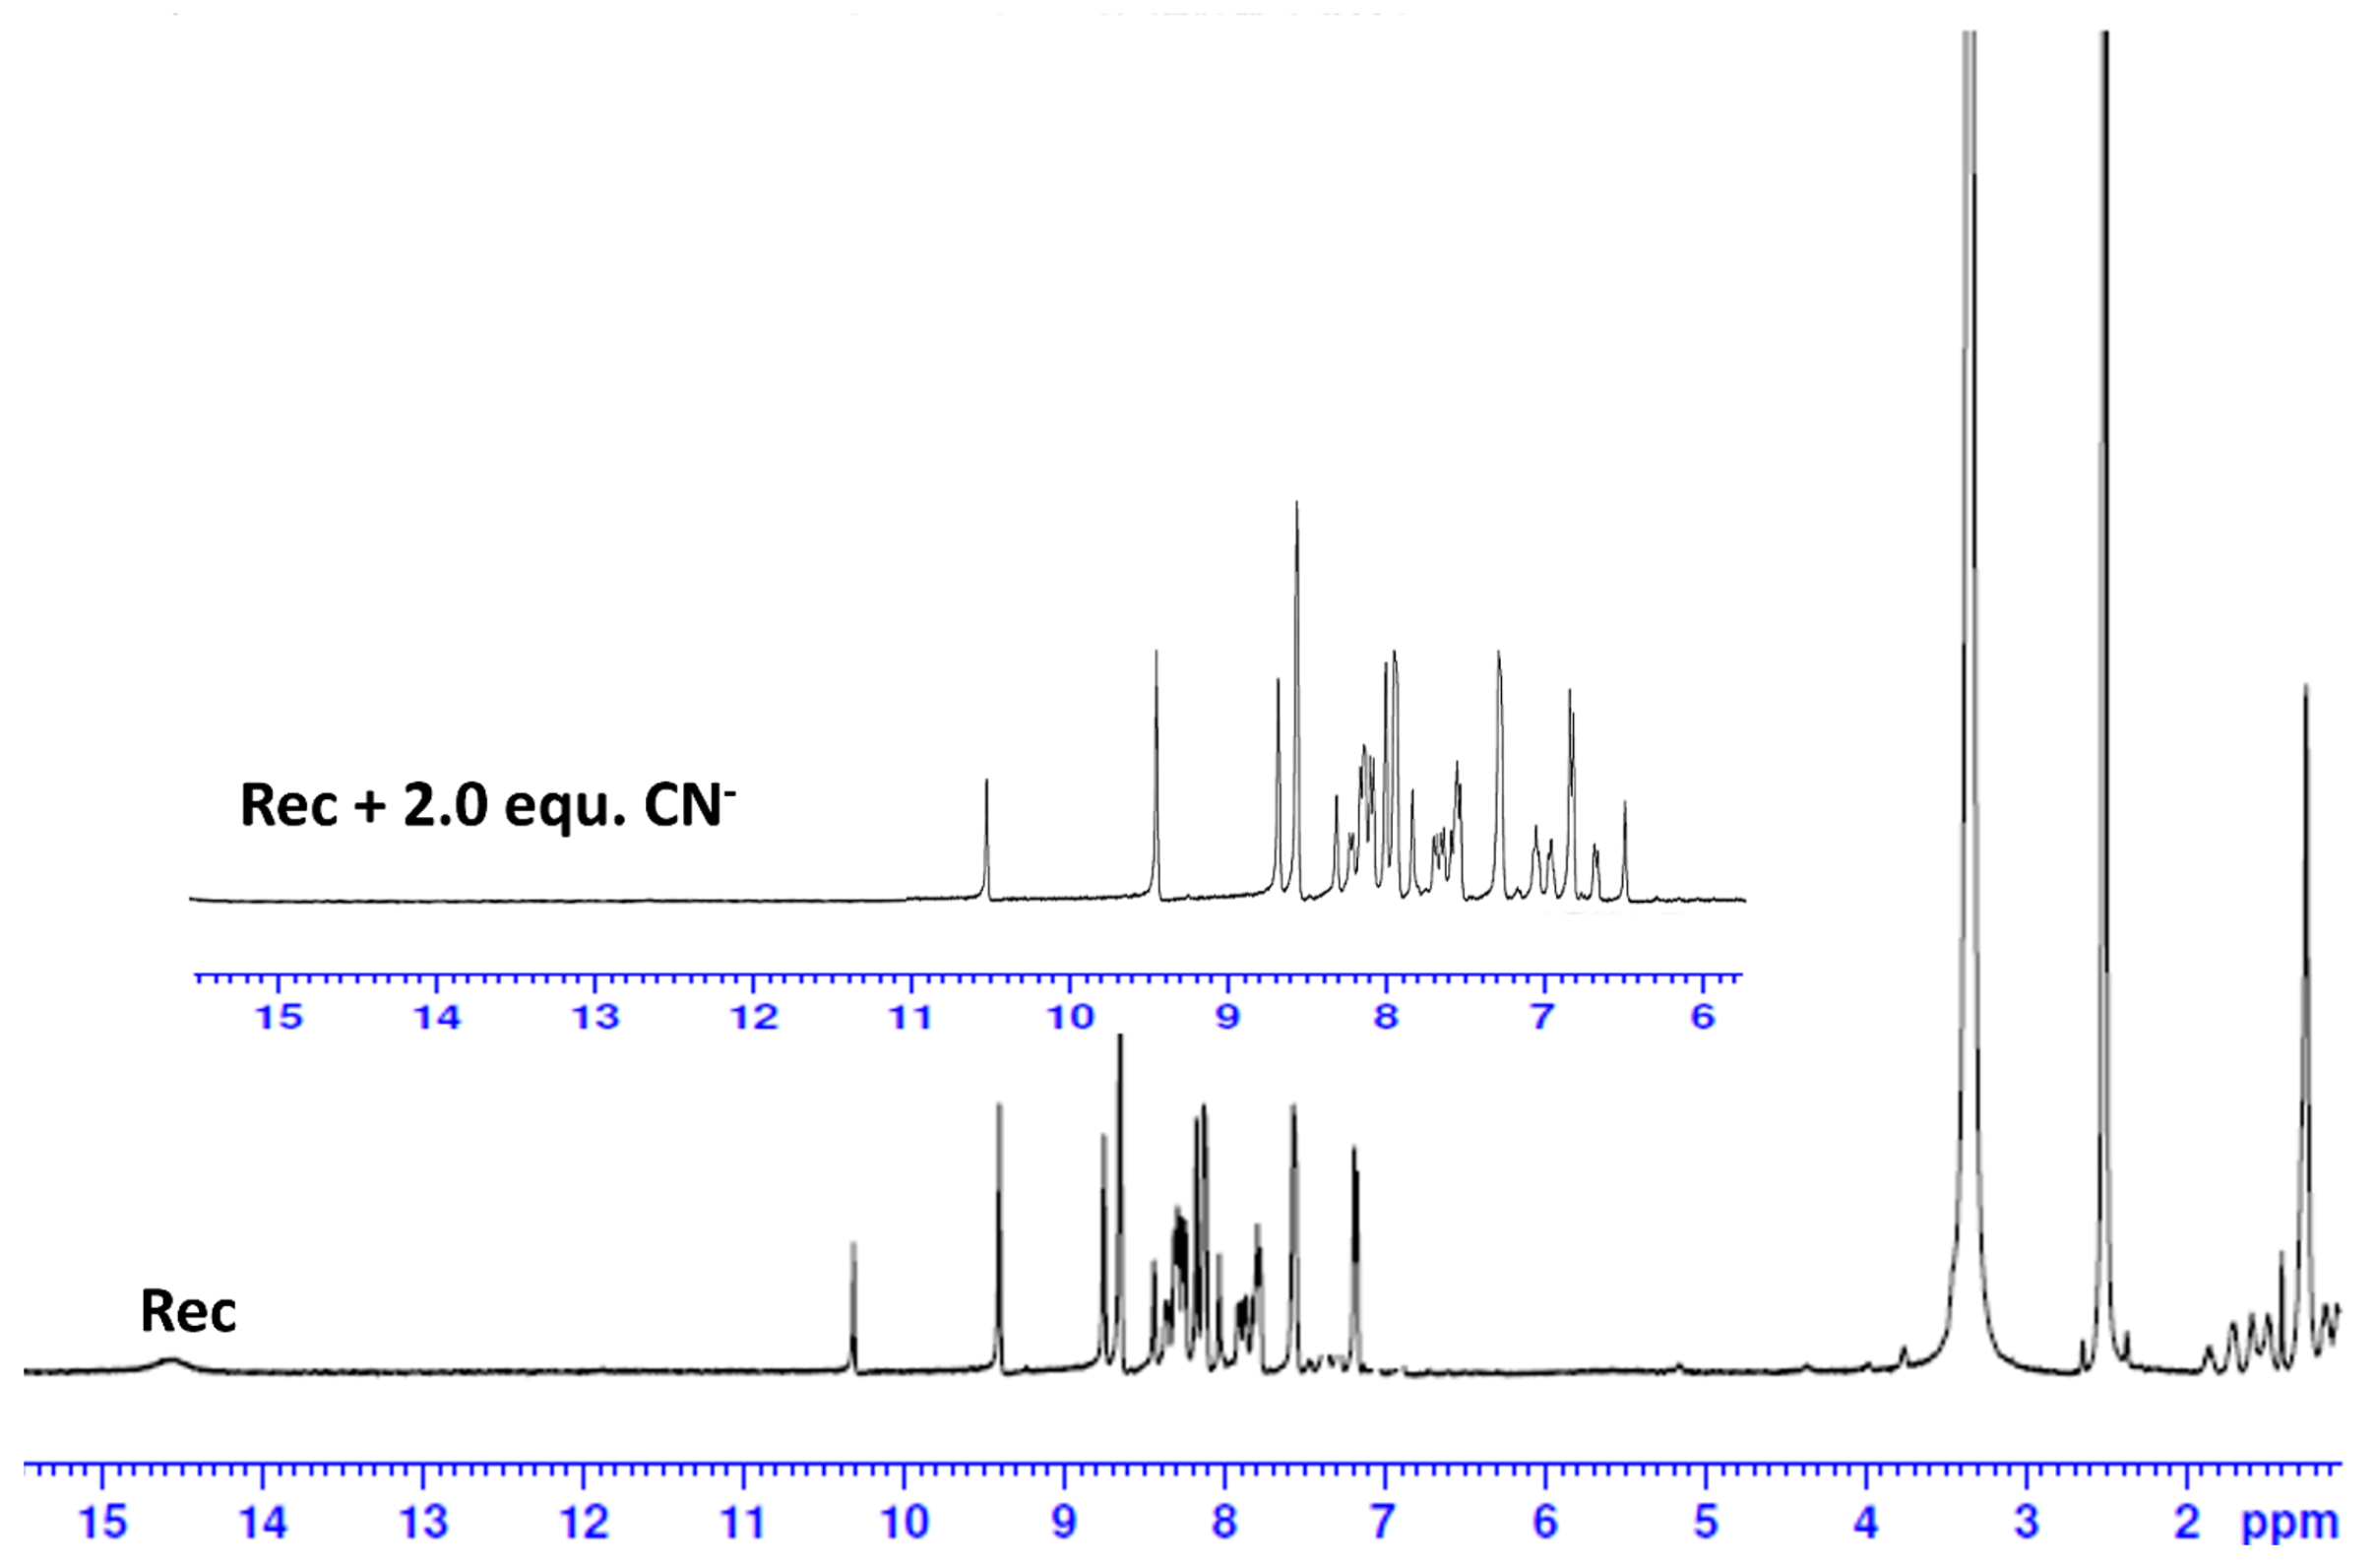
1H NMR titration experiments were performed to investigate the interaction between the receptor and CN− ions. The titration was conducted using the receptor (1.2 × 10⁻² M) and tetrabutylammonium cyanide (2.76 × 10⁻² M) in DMSO-d6. The 1H NMR spectrum of the free receptor (Figure 10) exhibited a distinct O–H proton resonance at δ 14.54 ppm, which was assigned to the phenolic hydroxyl proton. Upon the addition of 2.0 equiv. of CN−, the O–H resonance at δ 14.54 ppm disappeared completely, accompanied by upfield shifts in the imine and aromatic proton signals. These pronounced spectral changes provide evidence for the deprotonation of the phenolic hydroxyl group upon interaction with CN−, followed by enhanced intramolecular hydrogen-bonding interactions within the receptor framework. In particular, the complete disappearance of the phenolic O–H signal at δ 14.54 ppm after the addition of 2.0 equiv. of CN− strongly supports deprotonation as the predominant initial interaction between the receptor and cyanide ions. The resulting phenoxide species facilitates greater electron delocalization across the conjugated molecular framework, thereby accounting for the observed bathochromic shift in the optical response. Thus, the 1H NMR titration results are consistent with a deprotonation-dominated sensing mechanism for CN−.

3.8. Logic Gate Operations

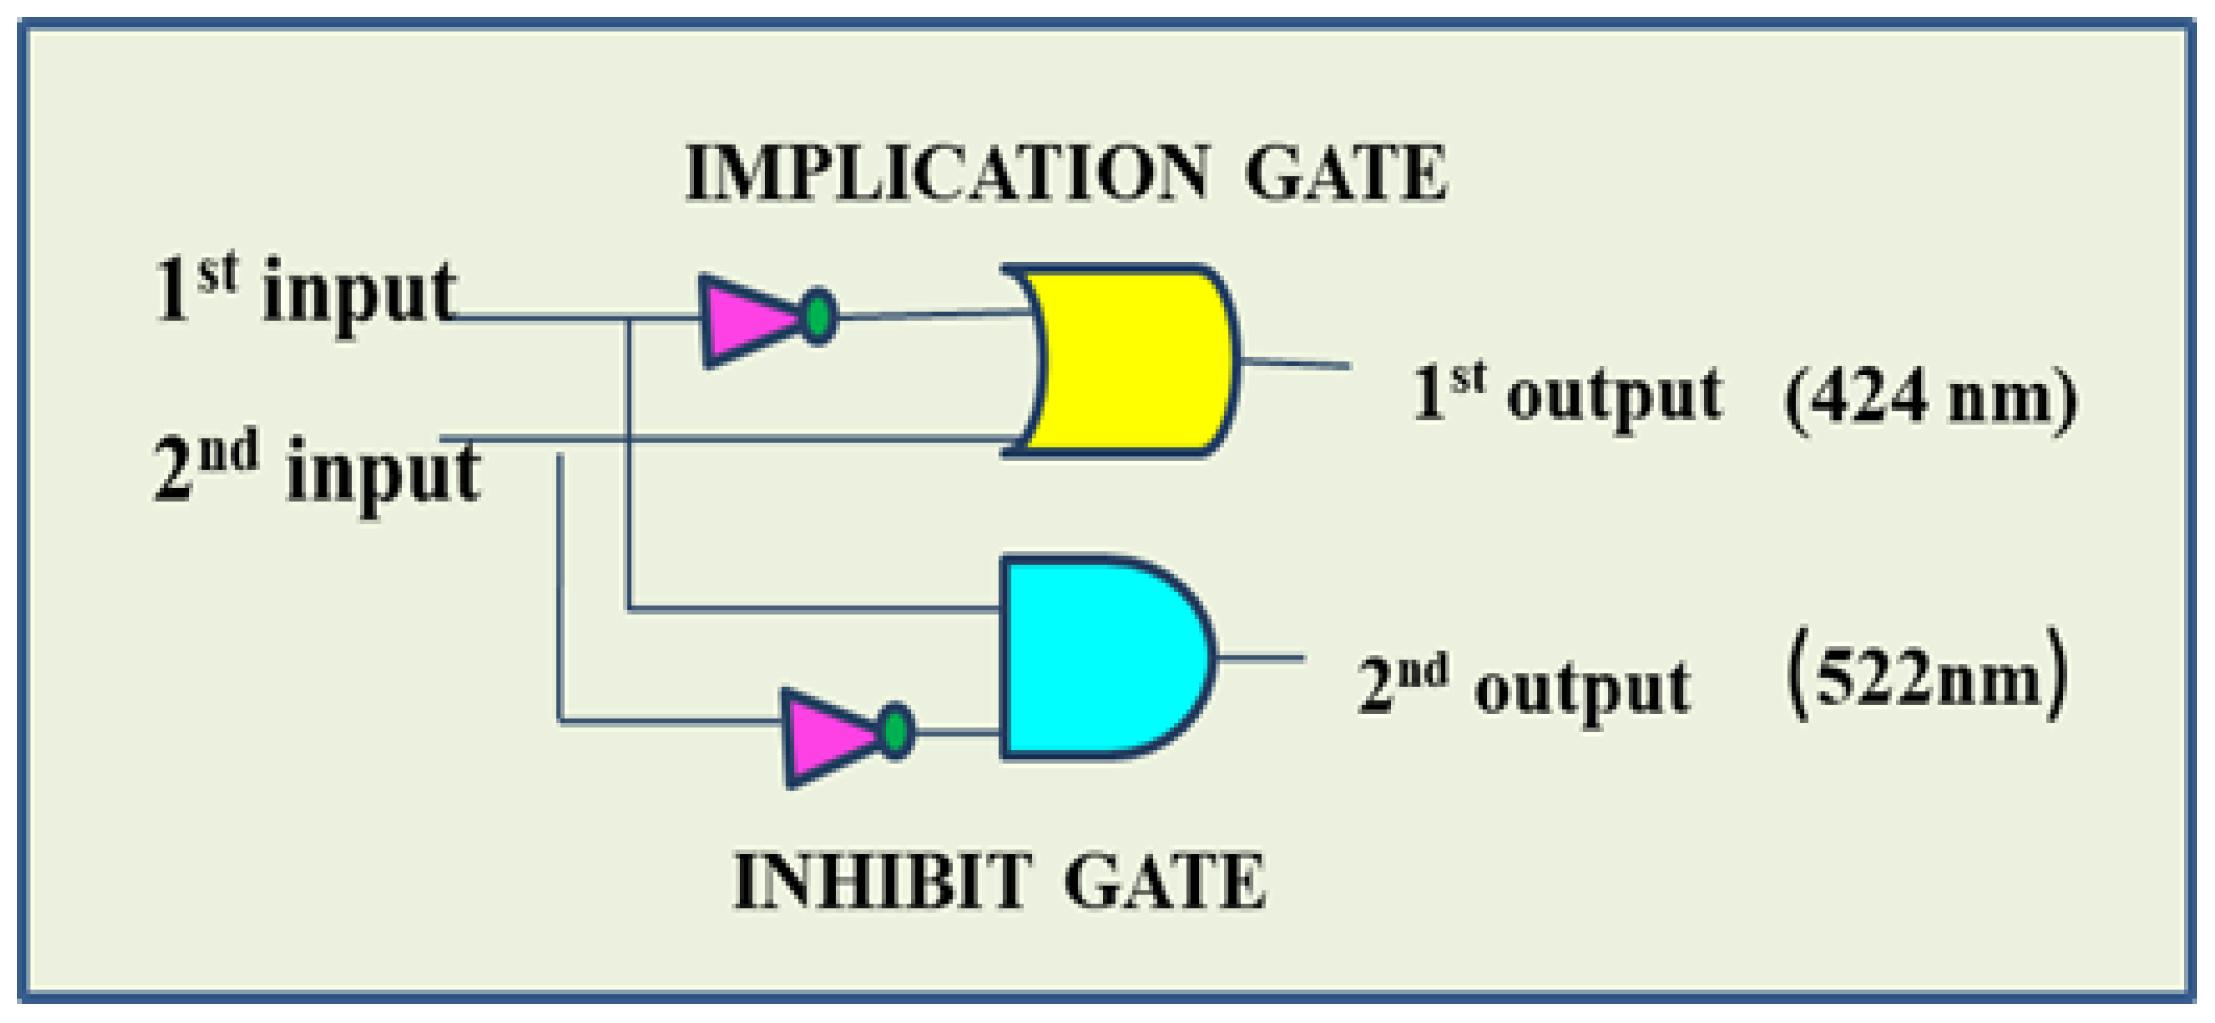
The synthesized probe demonstrates the ability to construct implication (IMP) and inhibition (INH) molecular logic gates based on the selective optical responses toward CN− and Fe3+ ions. Two distinct absorption bands were identified at 424 and 522 nm, which function as the corresponding output signals. The absorption response at 424 nm represents the “ON” state of the IMP gate and the “OFF” state of the INH gate, whereas the absorption response at 522 nm corresponds to the “ON” state of the INH gate and the “OFF” state of the IMP gate. In this molecular logic system, CN− and Fe3+ ions are employed as Input 1 and Input 2, respectively, while the absorbance responses at 424 and 522 nm are assigned as Output 1 and Output 2, respectively. The corresponding truth table and logic operations are summarized in Table 2.
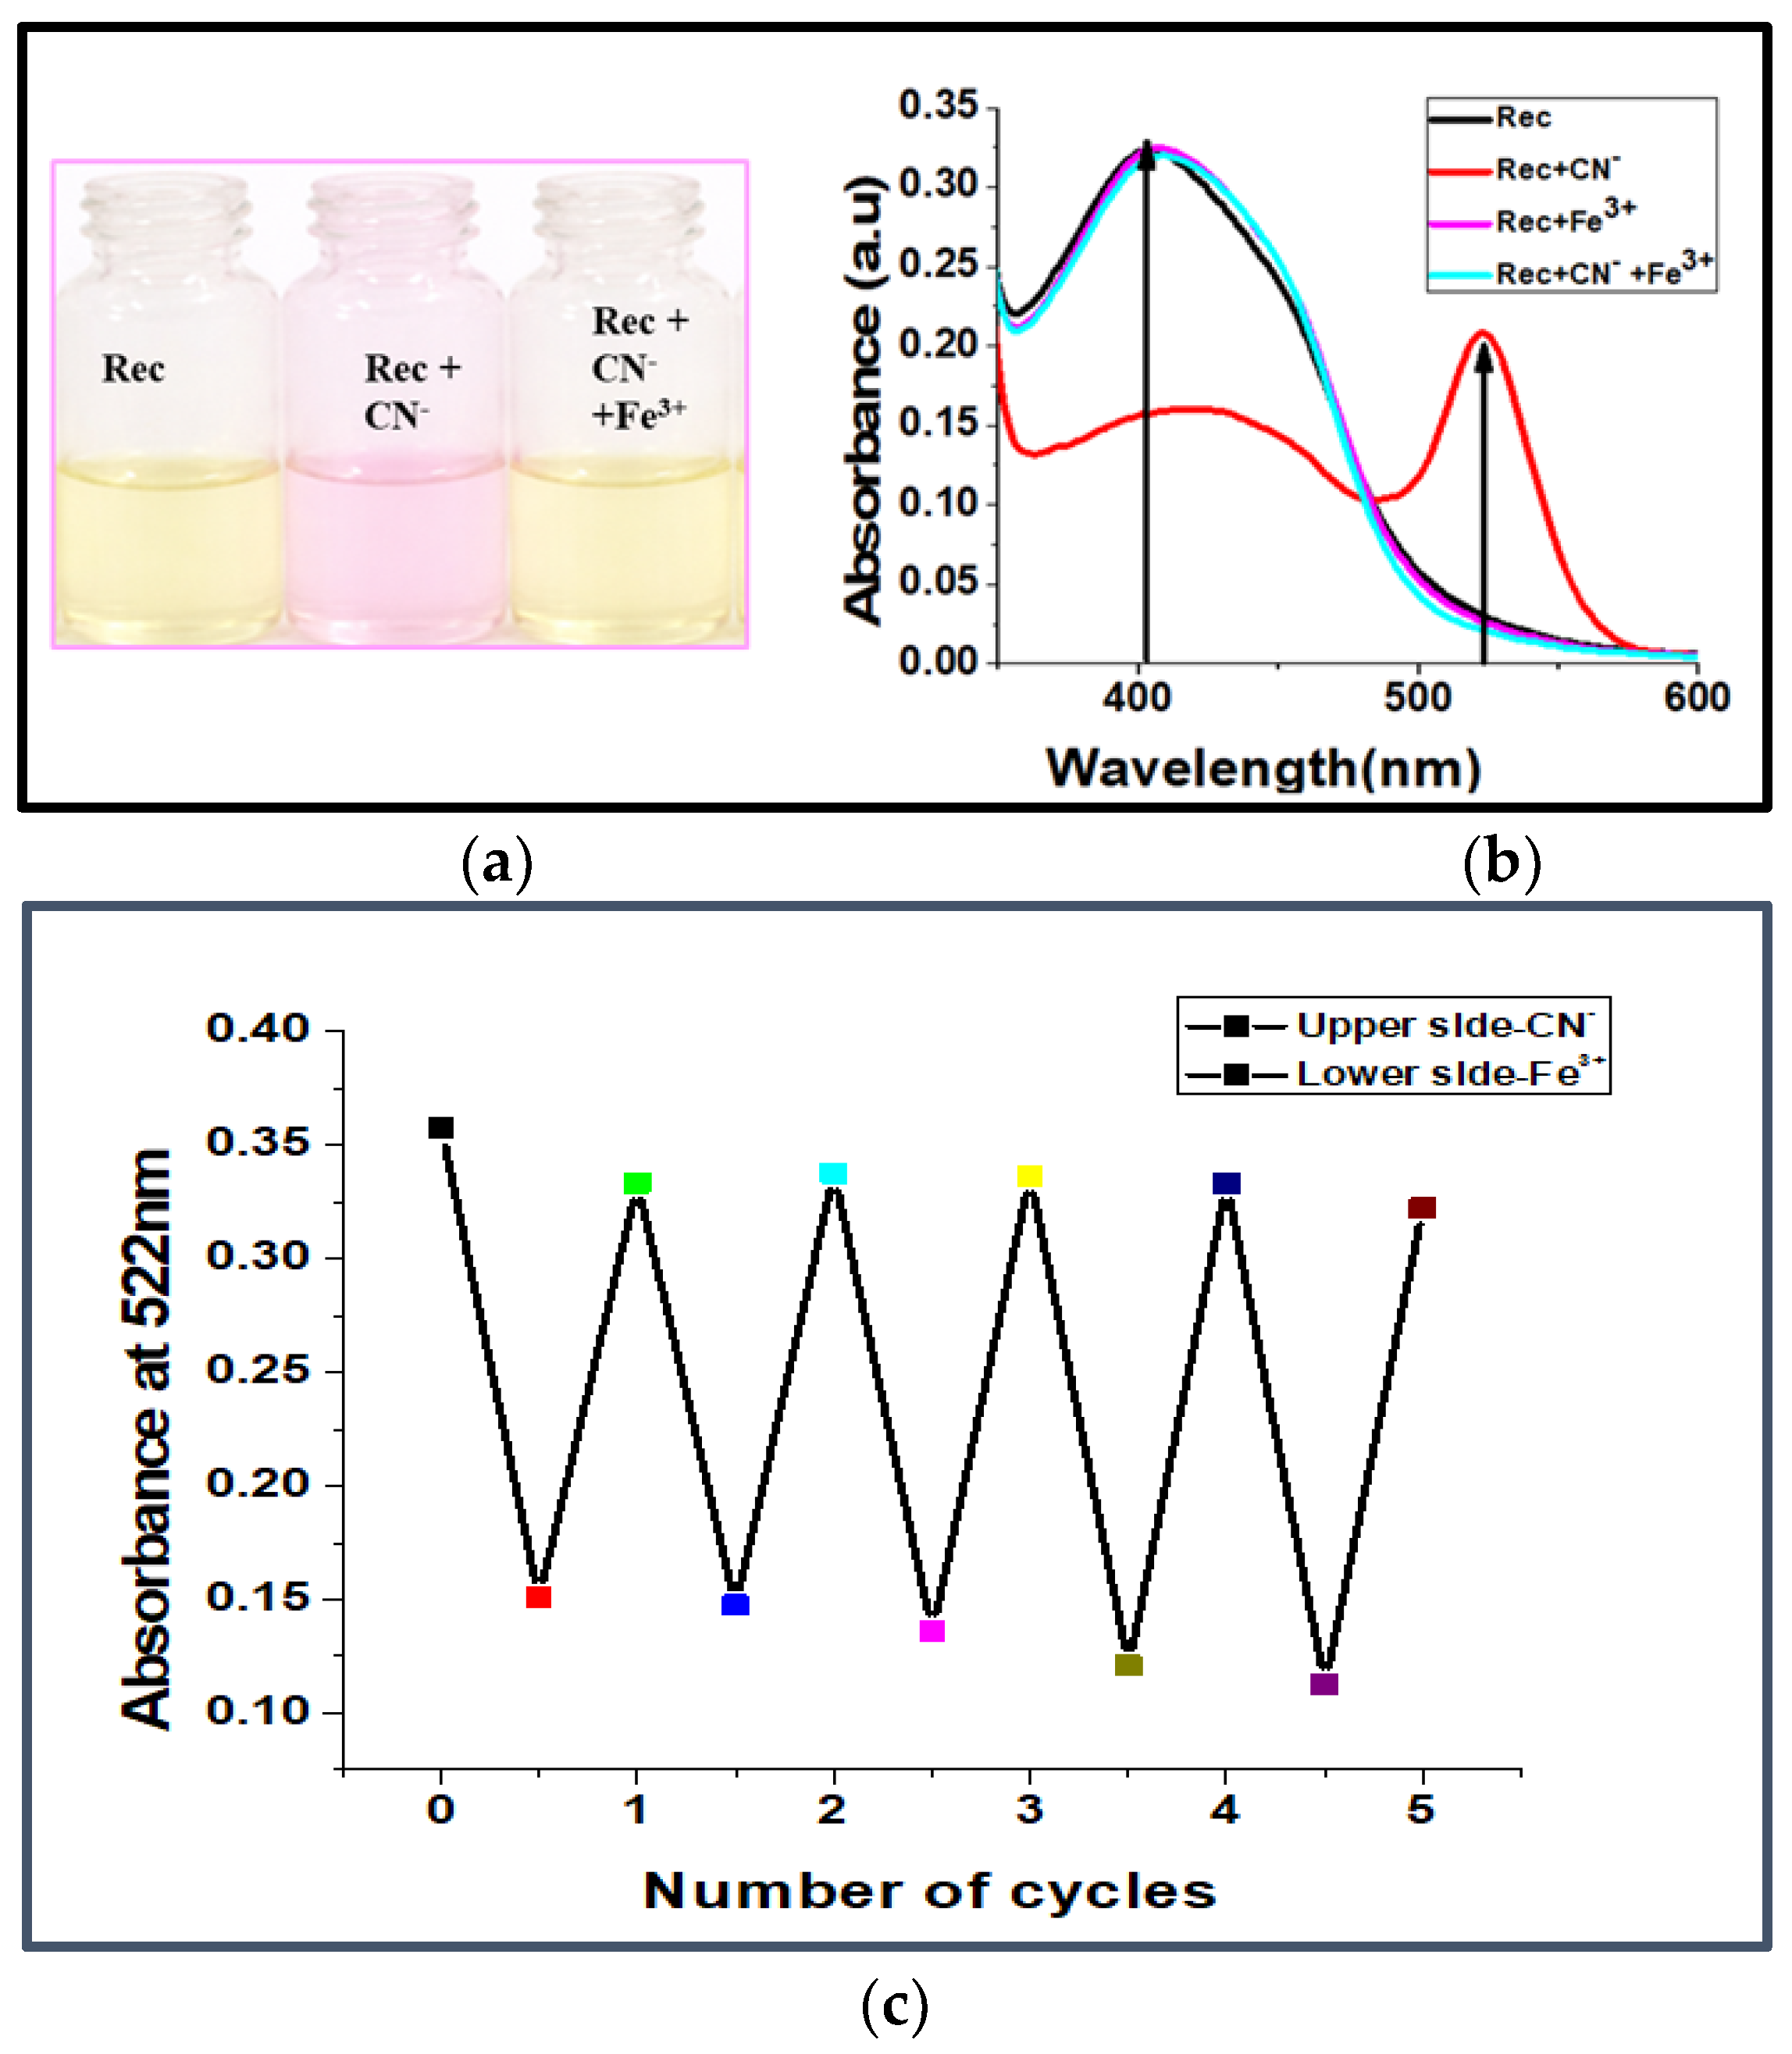
The free receptor, which exhibits yellow coloration, displays a characteristic absorption maximum at 424 nm, corresponding to the “ON” state of the implication (IMP) gate. Upon the addition of CN− ions to the receptor (1), the solution undergoes a distinct color transition from yellow to pink, accompanied by the appearance of a new absorption band at 522 nm. This spectral response corresponds to the “ON” state of the inhibition (INH) gate. In contrast, the addition of Fe3+ ions to the free receptor does not cause a significant change in the absorption band at 424 nm, thereby maintaining the “ON” state of the IMP gate. Interestingly, subsequent addition of Fe3+ ions to the receptor–CN− complex restores the original absorption response at 424 nm, indicating a return to the “ON” state of the IMP gate. This reversible colorimetric response is clearly visible to the naked eye, as shown in Figure 11a, and is further supported by the corresponding UV–visible absorption spectra presented in Figure 11b. Sequential treatment of the receptor with 2.0 equiv. of CN− followed by 2.0 equiv. of Fe3+ produces a reversible yellow → pink → yellow color transition (Figure 11c). This reversible switching behavior can be attributed to the ability of Fe3+ ions to effectively disrupt or suppress the interaction between CN− and the receptor, thereby restoring the initial electronic state of the receptor. The resulting dual-output optical responses enable the construction of two molecular logic functions, namely IMP and INH, as illustrated in Figure 12.
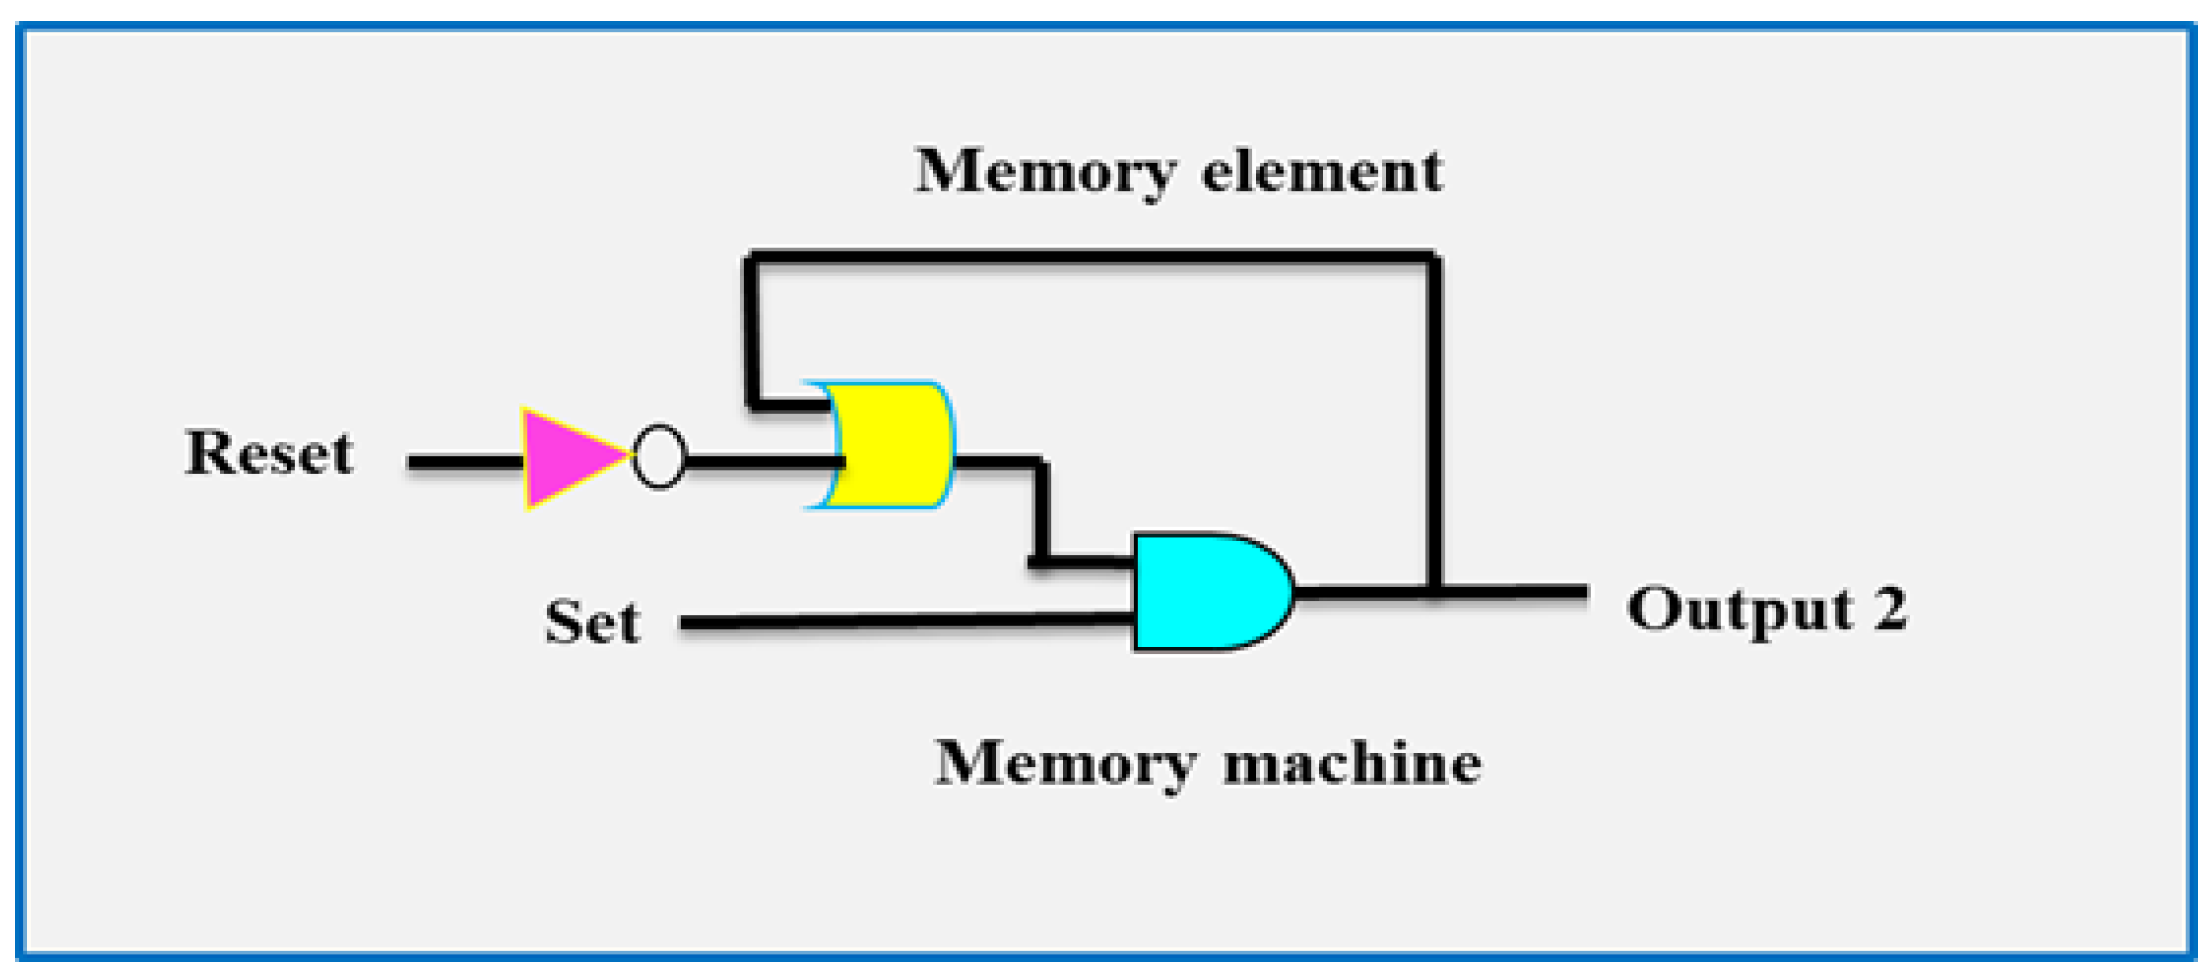
The reproducible and reversible colorimetric switching further enables the development of a sequential molecular logic circuit based on a “writing–reading–erasing–reading” operation. In this system, CN− and Fe3+ serve as the “set” and “reset” inputs, respectively. Addition of CN− constitutes the writing process, whereas subsequent addition of Fe3+ erases the stored optical state. The corresponding output responses and logic states are summarized in Table 1. The molecular system exhibits reversible ON–OFF switching behavior (Figure 13), allowing the writing–reading–erasing–reading sequence to be performed repeatedly. This reversible molecular response demonstrates the potential of the receptor for information processing and molecular-level memory applications.

3.9. Optical Sensor Using Silica

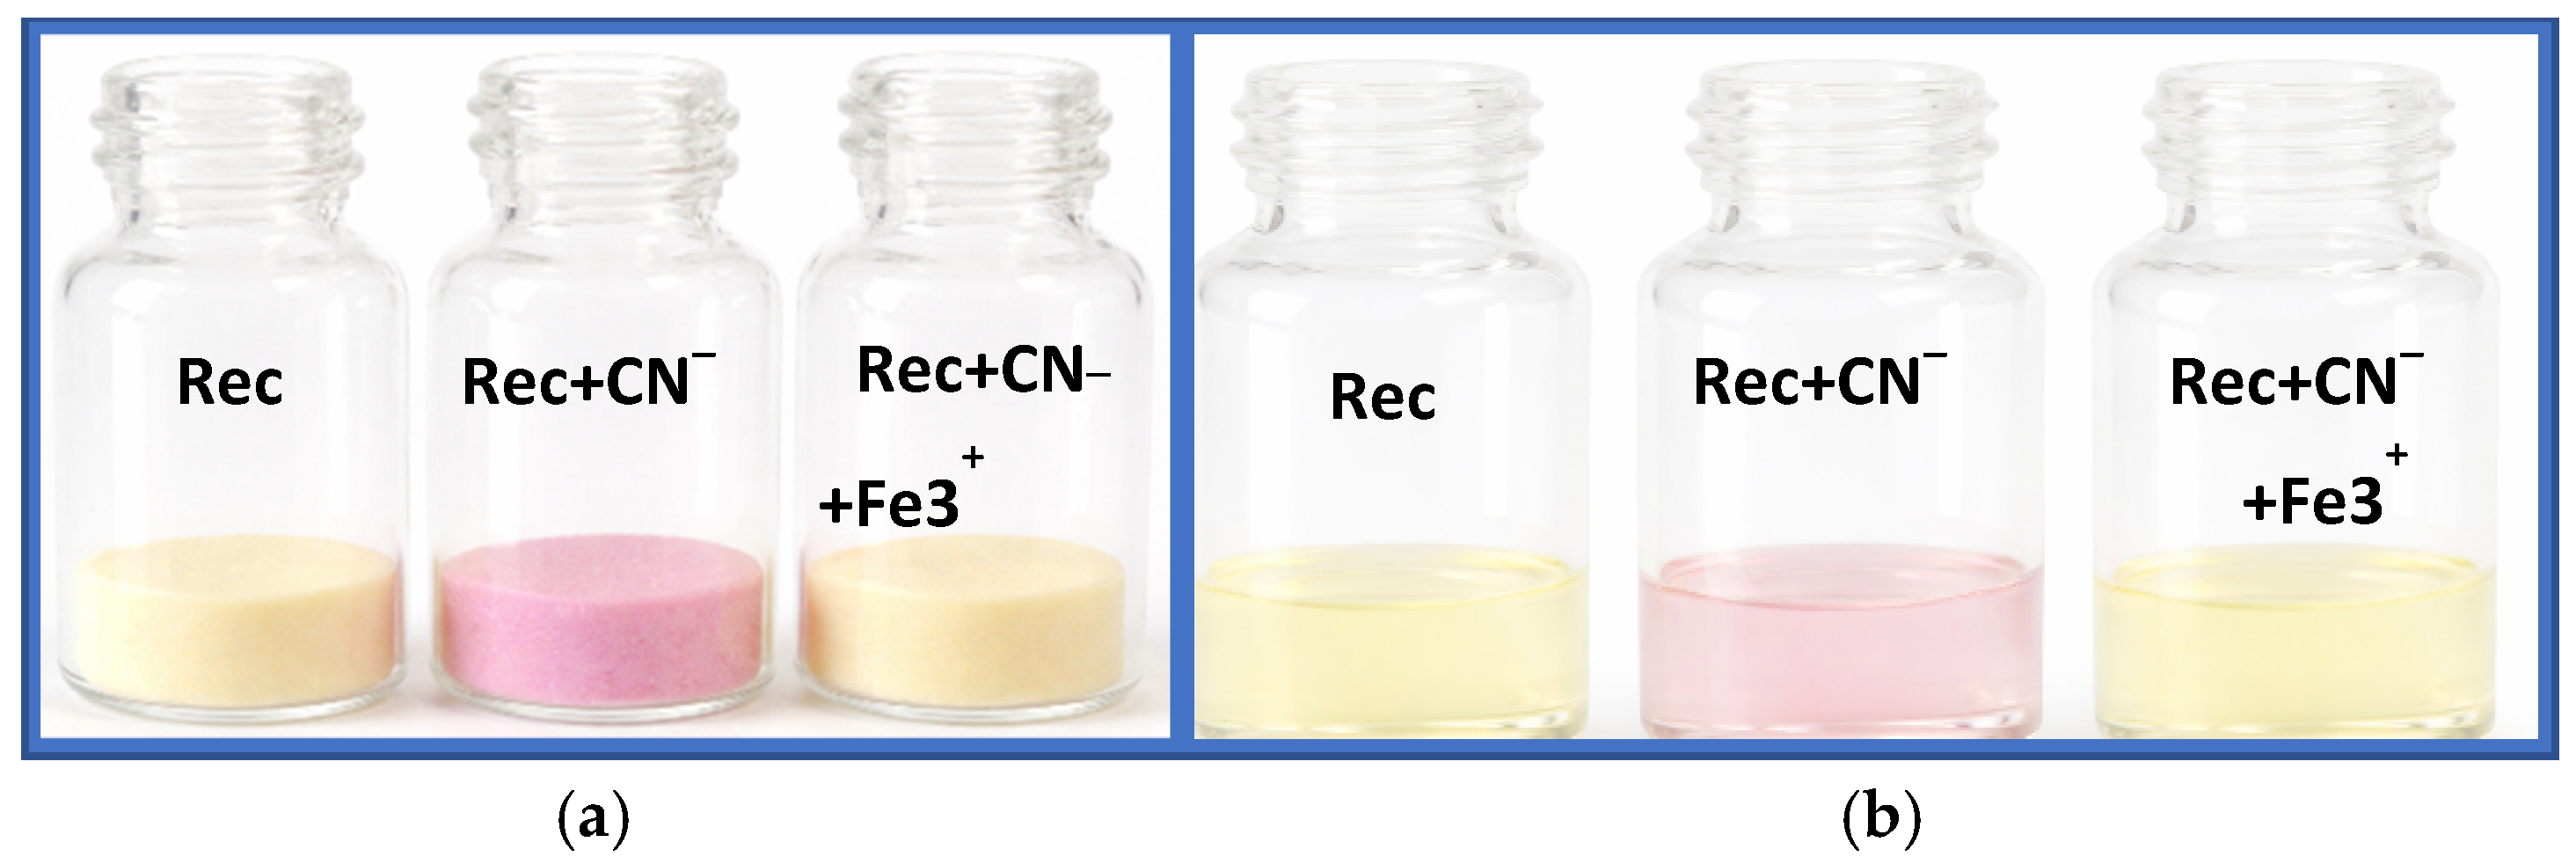
To evaluate the applicability of the receptor as a solid-state optical sensor, colorless silica gel (0.05 g, 100–200 mesh) was employed as the supporting material [55,56]. Initially, a solution of the receptor (5 × 10⁻⁵ M in DMSO) was added to the silica gel and thoroughly mixed for 5–10 min, resulting in a uniformly yellow-colored silica-based sensing material. Upon exposure of the receptor-functionalized silica to CN− ions (1 × 10⁻⁴ M), a distinct color change from yellow to pink was observed. Subsequent treatment with Fe3+ ions (1 × 10⁻⁴ M in aqueous medium) induced a reverse color transition from pink to yellow, thereby restoring the initial visual state of the receptor. The observed color changes were readily distinguishable by the naked eye without requiring any instrumental assistance, as shown in Figure 14a. Moreover, the colorimetric responses obtained under solid-state conditions were consistent with those observed in solution, as illustrated in Figure 14b. These results demonstrate that the receptor retains its characteristic optical response upon immobilization onto a silica support, highlighting its potential for solid-state optical sensing applications. The silica gel experiments were conducted as qualitative proof-of-concept studies to assess the visual colorimetric response of the receptor toward CN− under solid-state conditions. The pronounced and readily observable color transition upon cyanide exposure confirms the feasibility of employing the receptor as a simple solid-state sensing platform.

3.10. Real-Sample Analysis

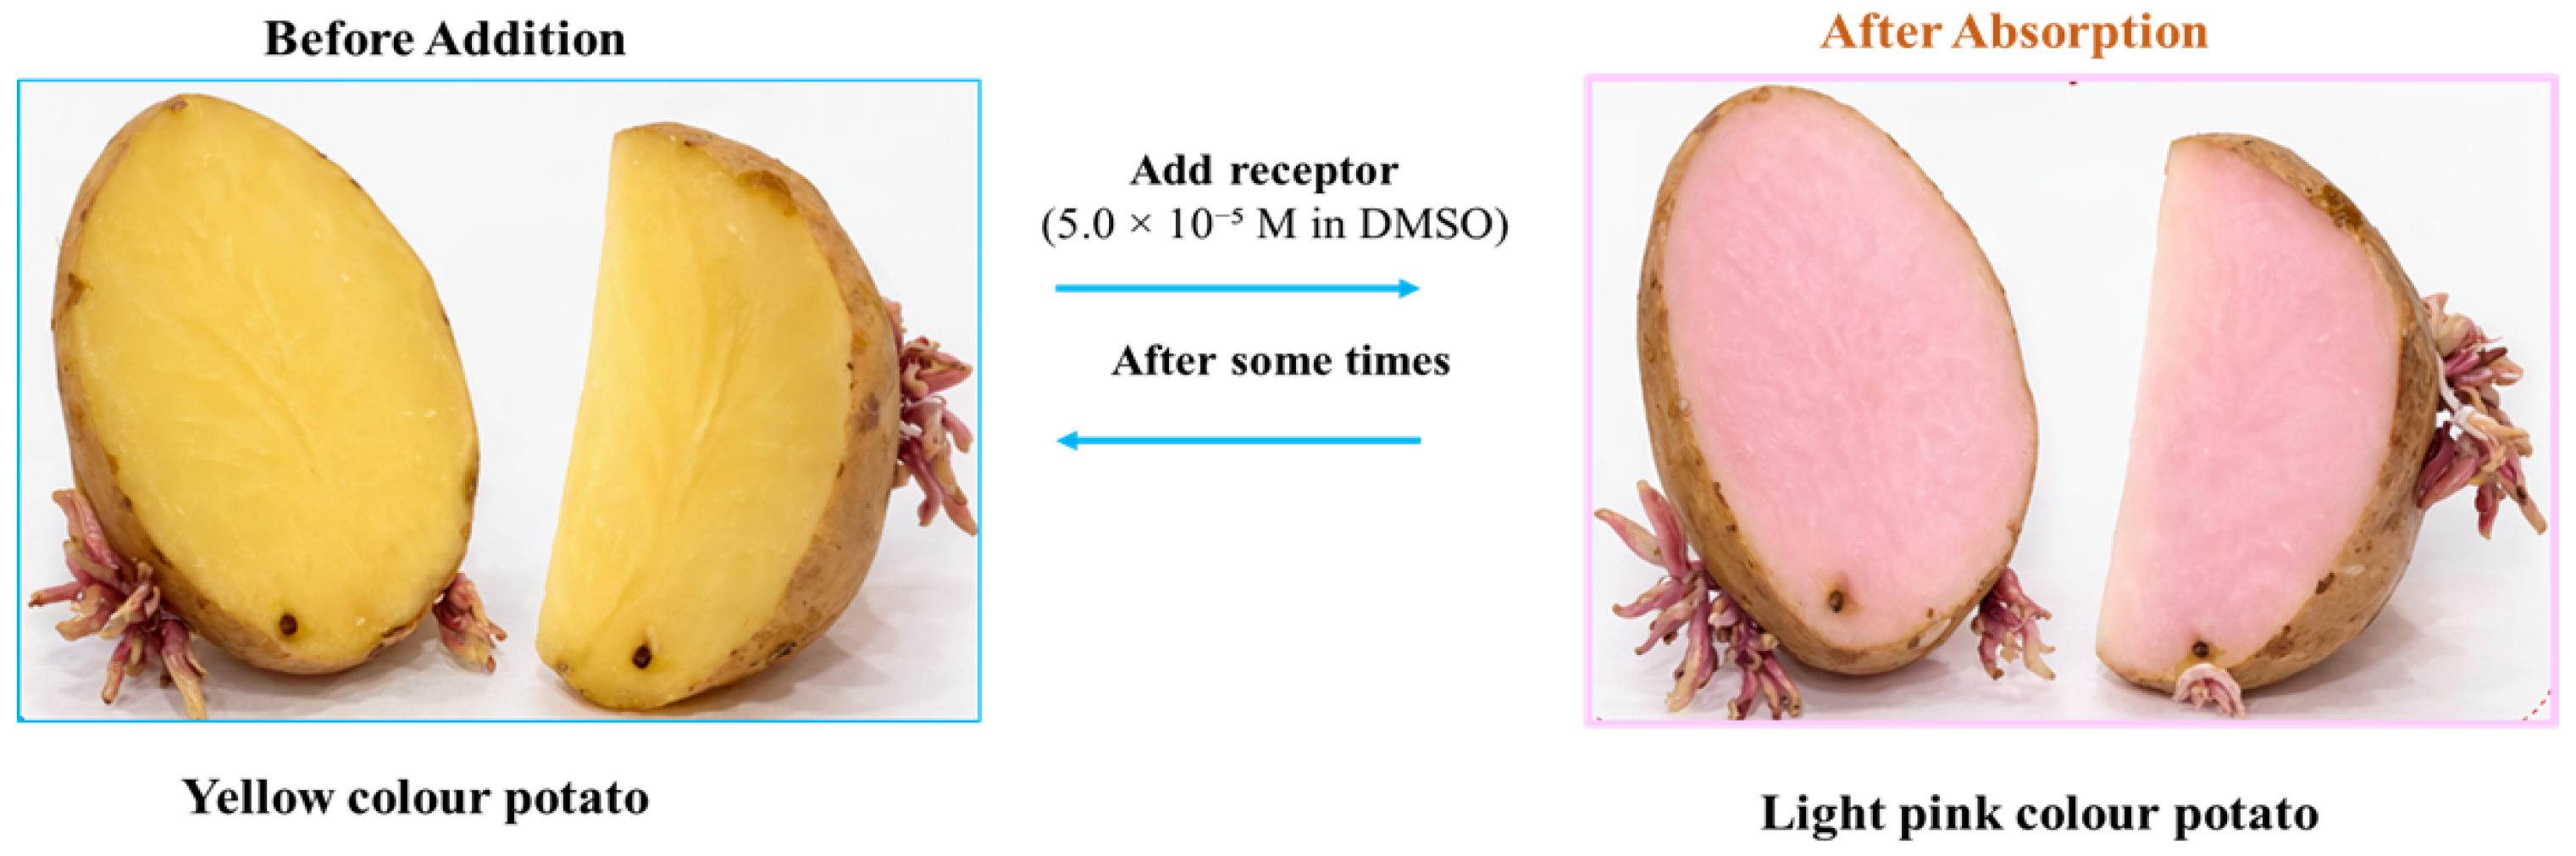
For real-sample analysis, a cleaned sprouted potato was selected as the test substrate to demonstrate the practical applicability of the proposed receptor. The potato was carefully divided into two pieces, both of which initially exhibited yellow coloration. A solution of the receptor (5.0 × 10⁻⁵ M in DMSO) was then applied uniformly onto the surface of the potato. After a short incubation period, the receptor solution was absorbed by the potato substrate, resulting in a distinct color transition from yellow to light pink. This visible color change was readily distinguishable by the naked eye without the requirement for any instrumental assistance, as shown in Figure 14a. The sprouted potato experiments were conducted as qualitative proof-of-concept studies to evaluate the feasibility of the receptor for visual cyanide detection under solid-state conditions. The readily observable colorimetric response upon exposure to CN− demonstrates that the receptor retains its sensing ability on a real substrate. These observations highlight the potential applicability of the proposed receptor for simple and rapid visual detection of cyanide ions in real-sample environments. The corresponding experimental observations are presented in Figure 15.

3.11. Bioimaging Studies

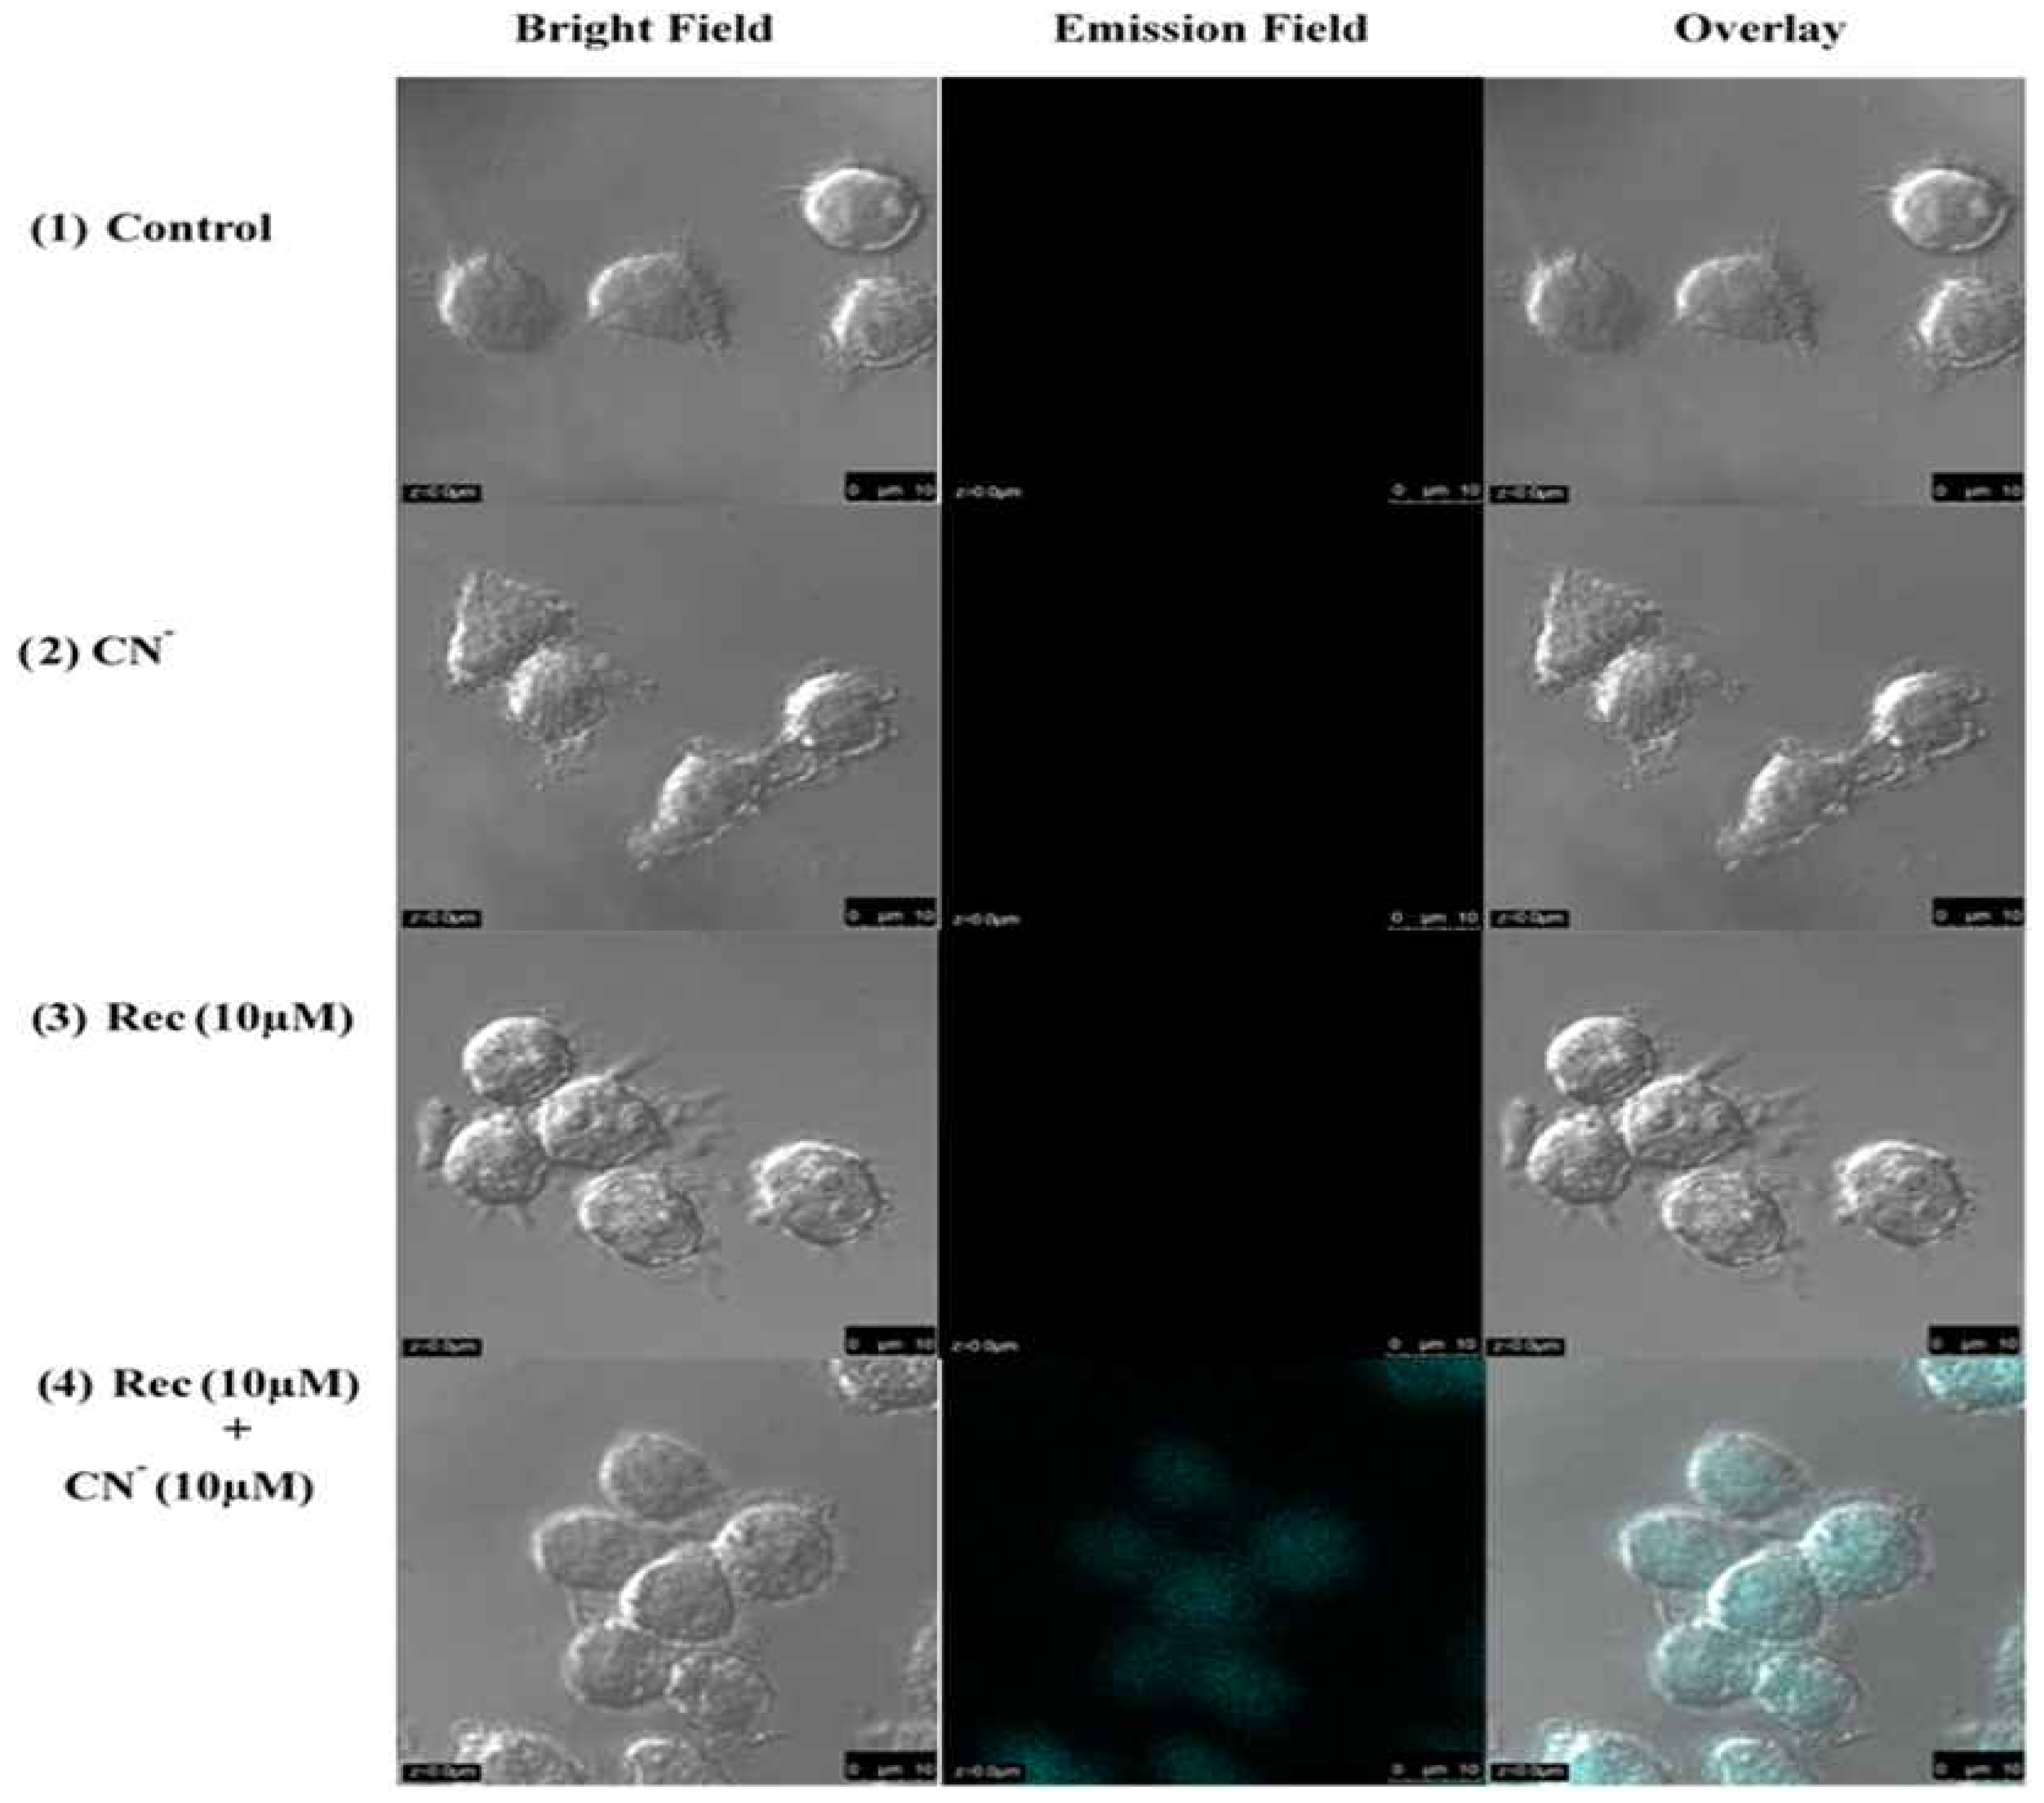
The cellular fluorescence imaging capability of the receptor was evaluated using the RAW264.7 cell line, which was procured from an institution in Taiwan (FIRDI). The cells were cultured in Dulbecco’s Modified Eagle Medium (DMEM) supplemented with 10% fetal bovine serum (FBS) and maintained in a humidified atmosphere containing 5% CO2 at 37 °C. For fluorescence imaging experiments, RAW264.7 cells were seeded onto 18 mm glass coverslips and allowed to adhere for 24 h under standard culture conditions. To investigate the cellular response toward CN− ions, the cells were incubated with tetrabutylammonium cyanide (TBACN) prepared in phosphate-buffered saline (PBS, pH 7.4). Briefly, 2 µL of a 10 mM CN− stock solution prepared in sterile PBS was added to the cells to achieve a final concentration of 10 µM, followed by incubation at 37 °C for 30 min. After incubation, the cells were carefully washed with PBS (3 × 2 mL) to remove residual cyanide ions, and 2 mL of fresh culture medium was subsequently added. The receptor was then introduced by adding 2 µL of a 10 mM stock solution prepared in DMSO, resulting in a final concentration of 10 µM. The cells were further incubated at 37 °C for 30 min to facilitate cellular uptake of the receptor. Following incubation, the culture medium was removed, and the cells were thoroughly washed with PBS (3 × 2 mL) before fluorescence imaging. The fluorescence imaging results demonstrate that the receptor possesses sufficient cell membrane permeability to facilitate its entry into RAW264.7 cells. In the absence of CN−, the receptor-treated cells exhibited only weak fluorescence, whereas cells treated with both the receptor and CN− displayed a pronounced cyan fluorescence signal within the cells. This enhanced intracellular fluorescence is attributed to the selective interaction of the receptor with CN− ions, indicating that the receptor can function as a fluorescent probe for intracellular cyanide detection. The corresponding fluorescence microscopy images are presented in Figure 16.

3.12. Cytotoxicity Assay of RAW264.7 Cells

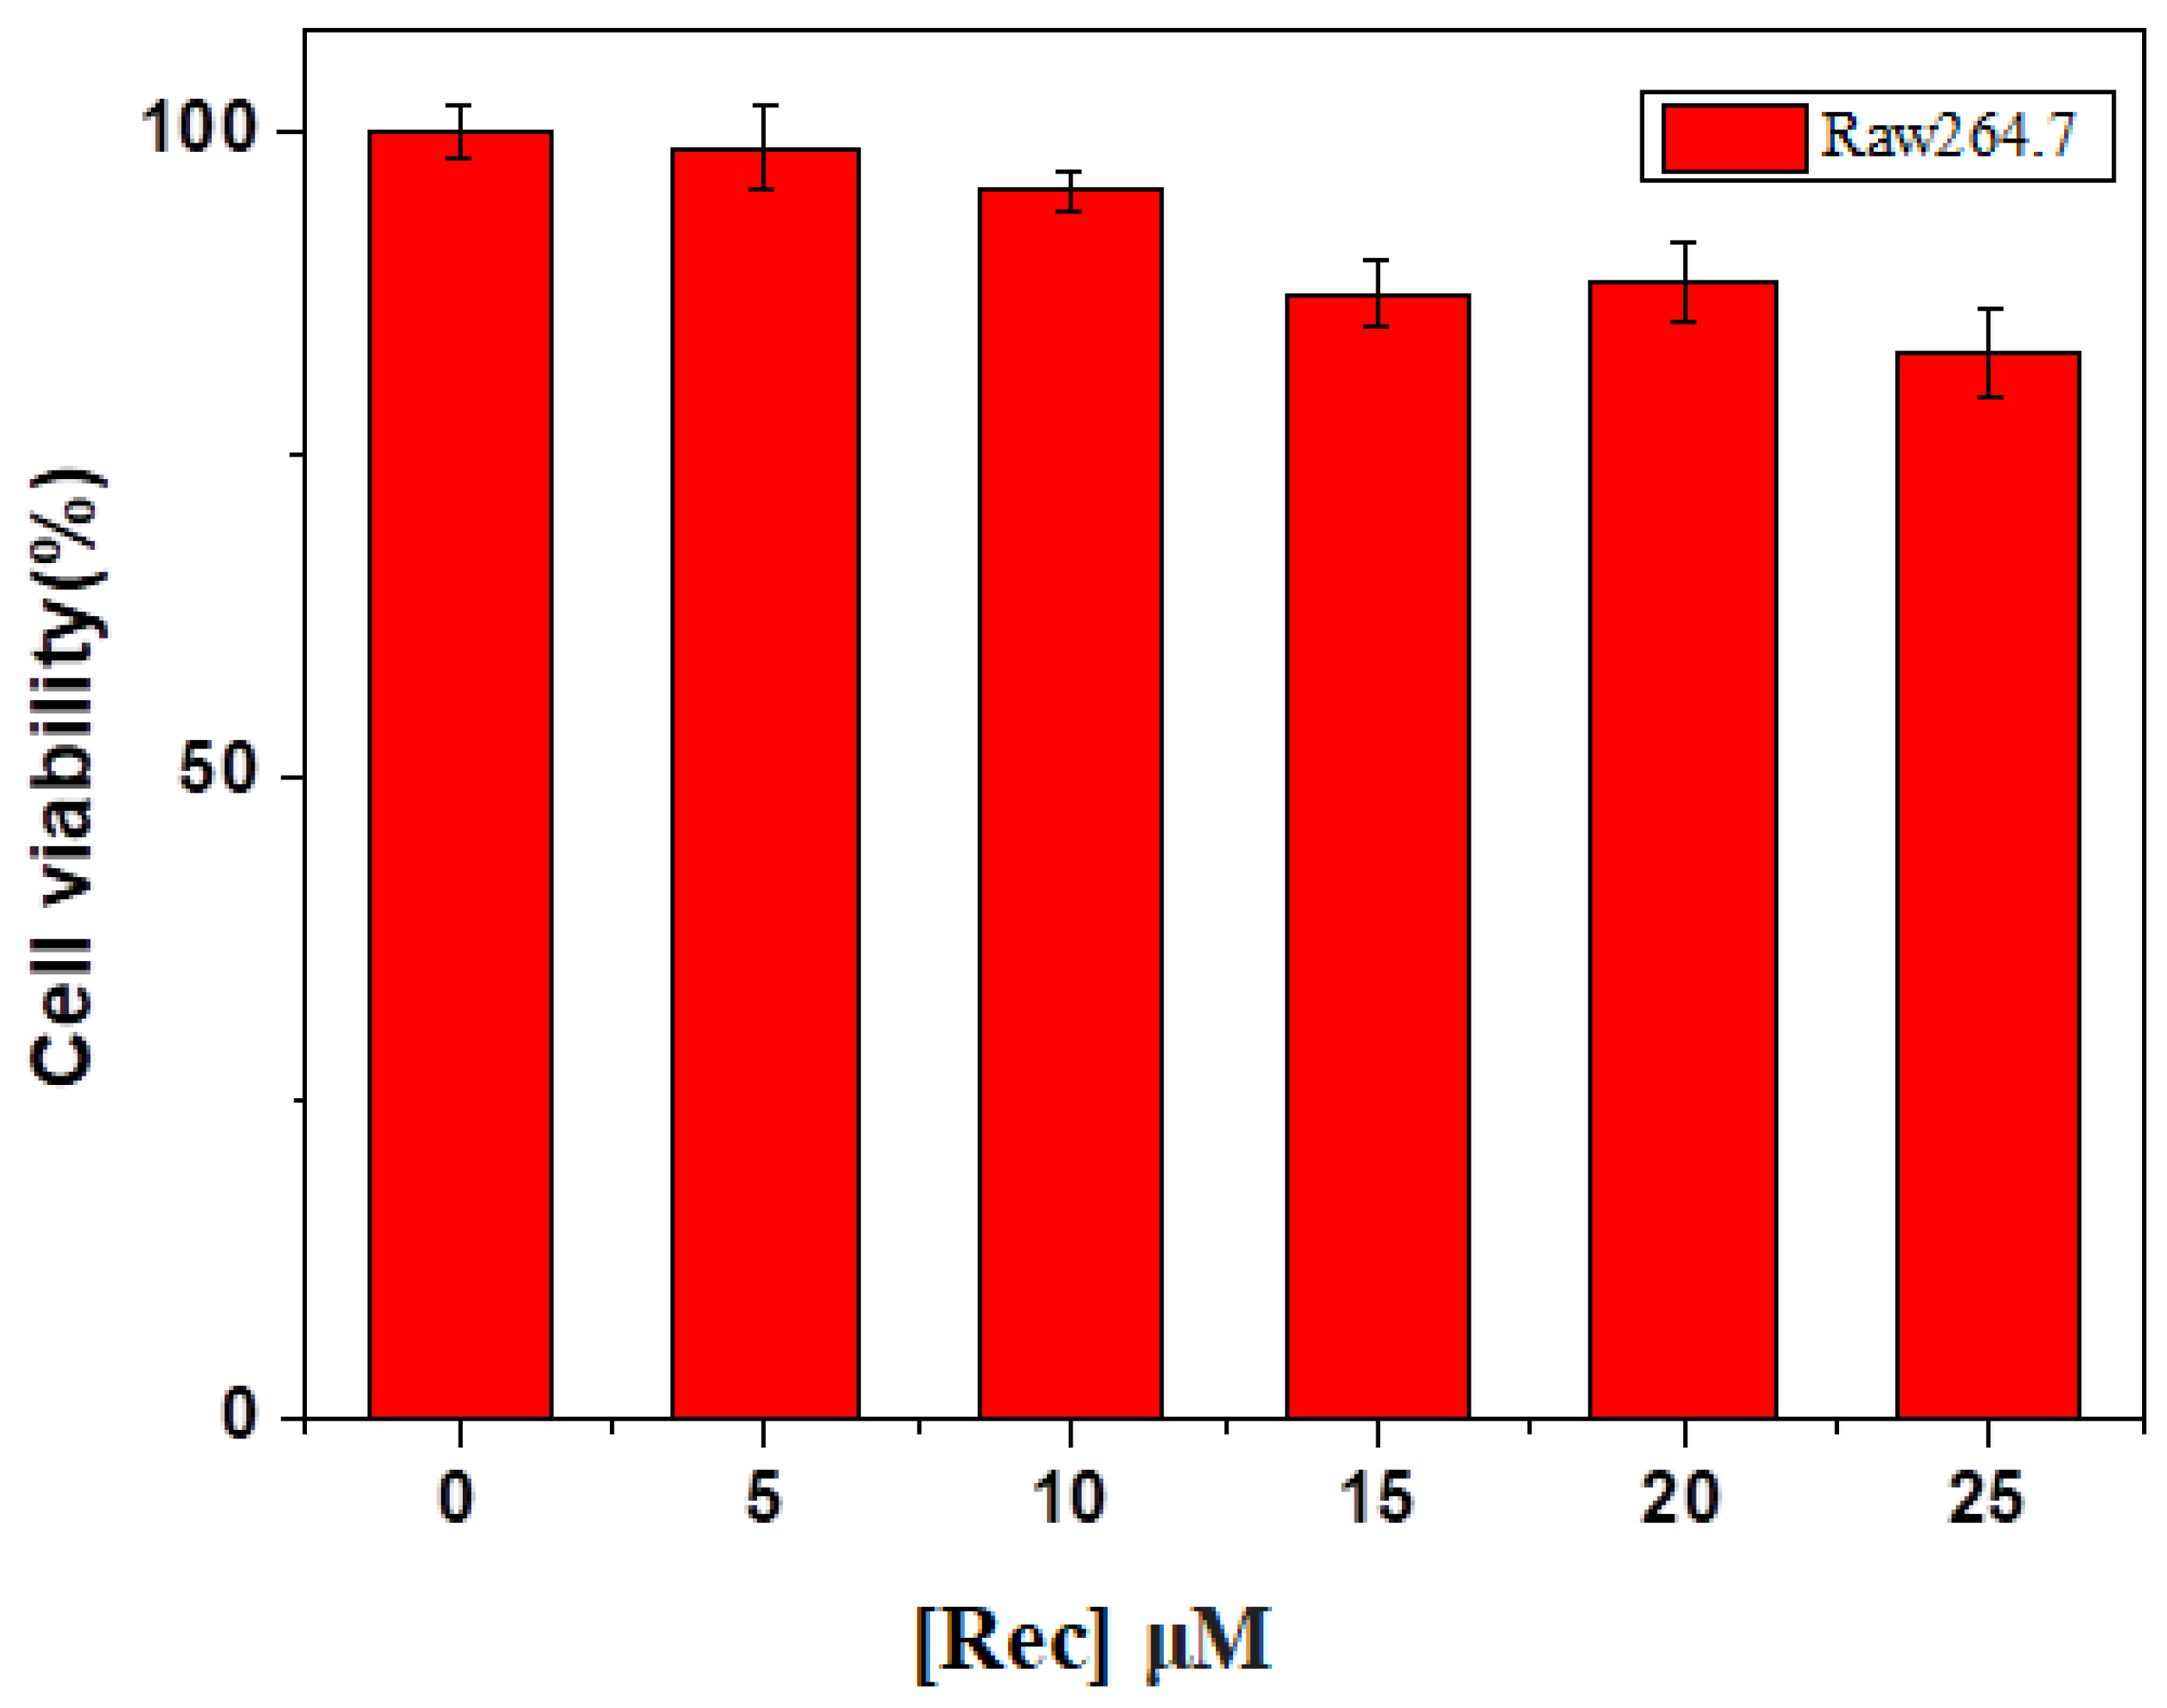
The cytotoxicity assay of RAW264.7 was evaluated through the methyl thiazolyl tetrazolium (MTT) assay. By growing the RAW264.7 cells using a 96-well cell culture plate and adding to the concentrations from 5 to 25 µM, the receptor was added into the wells using the 5% CO2 for 1 day at 37 °C. Using the above conditions, the cells were incubated. Further [under 5% of CO2 for 4 h at 37 °C with 10 mL of MTT (5 mg/mL)], every well was incubated using this condition. After that, we removed the MTT solution and continued to dissolve the formazan, i.e., yellow precipitate, which was dissolved in the Sorensen’ glycine buffer of 25 mL, i.e., 0.1 M glycine and 0.1 M NaCl and 200 mL solution of DMSO. Then, using a Multiskan GO microplate reader, every well was measured with the absorbance at 570 nm in Figure 17. By using the following formula, the cell viability was calculated. This formula is as follows Cell viability (%) = (Mean of absorbance value of treatment group)/(Mean of absorbance value of control group).

4. Conclusions

Overall, the present study demonstrates that the synthesized anthracene-based optical receptor is an effective molecular platform for the selective and sensitive recognition of CN− ions. The receptor exhibits a pronounced optical response toward cyanide in the DMSO medium, highlighting its potential for cyanide monitoring in environmental and biological contexts. Furthermore, the reversible sensing behavior enables the construction of molecular logic gates, while its applicability in real and solid-state samples demonstrates its practical utility for visual cyanide detection. The demonstrated sensing characteristics, together with the logic gate functionality and real-sample analysis, make this anthracene-based receptor a promising candidate for further development in chemical sensing, environmental monitoring, and bioanalytical applications.

Supplementary Materials

The following supporting information can be downloaded at https://www.mdpi.com/article/10.3390/chemosensors14090194/s1. Figure S1. IR spectrum of the receptor. Figure S2. 1H NMR spectrum of receptor. Figure S3. 13C NMR spectrum of receptor. Figure S4. Binding constant plot for receptor with CN− ion. Figure S5. Detection limit plot for receptor with CN−.

Author Contributions

Conceptualization, G.P.; methodology, G.P.; software, G.M.; validation, G.M. and S.A.; formal analysis, G.M. and S.A.; investigation, G.P.; resources, T.-G.L.; writing—original draft preparation, G. P.; writing—review and editing, G.P. and T.-G.L.; visualization, G.P. and T.-G.L.; funding acquisition, T.-G.L. All authors have read and agreed to the published version of the manuscript.

Funding

This research received the article processing charge (APC) via the 2030 Keimyung University Research Initiative program.

Institutional Review Board Statement

Not applicable.

Informed Consent Statement

Not applicable.

Data Availability Statement

The original contributions presented in this study are included in the article/Supplementary Material. Further inquiries can be directed to the corresponding author(s).

Acknowledgments

Authors are thankful to the Keimyung University, Republic of Korea. And, we acknowledge the use of an AI tool, ChatGPT 5.5, free version for language editing and grammar checking. The tool was not involved in the research design, data interpretation, or conclusion drawing. The authors take full responsibility for the entire content of the manuscript.

Conflicts of Interest

The authors declare no conflicts of interest.

References

  1. Jothi, D.; Munusamy, S.; Manoj Kumar, S.; Enbanathan, S.; Iyer, S.K. A benzothiazole-based new fluorogenic chemosensor for the detection of CN− and its real-time application in environmental water samples and living cells. RSC Adv. 2022, 12, 8570–8577. [Google Scholar] [CrossRef] [Scilit] [PubMed]
  2. Kim, G.J.; Kim, H.J. Coumarinyl aldehyde as a Michael acceptor type of colorimetric and fluorescent probe for cyanide in water. Tetrahedron Lett. 2010, 51, 2914–2916. [Google Scholar] [CrossRef] [Scilit]
  3. Zuhra, K.; Szabo, C. The two faces of cyanide: An environmental toxin and a potential novel mammalian gasotransmitter. FEBS J. 2022, 289, 2481–2515. [Google Scholar] [CrossRef] [Scilit] [PubMed]
  4. Lachowicz, J.I.; Alexander, J.; Aaseth, J.O. Cyanide and cyanogenic compounds—Toxicity, molecular targets, and therapeutic agents. Biomolecules 2024, 14, 1420. [Google Scholar] [CrossRef] [Scilit] [PubMed]
  5. Nielson, J.R.; Nath, A.K.; Doane, K.P.; Shi, X.; Lee, J.; Tippetts, E.G.; Saha, K.; Morningstar, J.; Hicks, K.G.; Chan, A.; et al. Glyoxylate protects against cyanide toxicity through metabolic modulation. Sci. Rep. 2022, 12, 4982. [Google Scholar] [CrossRef] [Scilit] [PubMed]
  6. Bortey-Sam, N.; Jackson, R.; Gyamfi, O.A.; Bhadra, S.; Freeman, C.; Mahon, S.B.; Brenner, M.; Rockwood, G.A.; Logue, B.A. Diagnosis of cyanide poisoning using an automated, field-portable sensor for rapid analysis of blood cyanide concentrations. Anal. Chim. Acta 2020, 1098, 125–132. [Google Scholar] [CrossRef] [Scilit] [PubMed]
  7. Alvillo-Rivera, A.; Garrido-Hoyos, S.; Buitrón, G.; Thangarasu-Sarasvathi, P.; Rosano-Ortega, G. Biological treatment for the degradation of cyanide: A review. J. Mater. Res. Technol. 2021, 12, 1418–1433. [Google Scholar] [CrossRef] [Scilit]
  8. Olaya-Abril, A.; Biełło, K.; Rodríguez-Caballero, G.; Cabello, P.; Sáez, L.P.; Moreno-Vivián, C.; Luque-Almagro, V.M.; Roldán, M.D. Bacterial tolerance and detoxification of cyanide, arsenic and heavy metals: Holistic approaches applied to bioremediation of industrial complex wastes. Microb. Biotechnol. 2024, 17, e14399. [Google Scholar] [CrossRef] [Scilit] [PubMed]
  9. Milani, M.; Ouellet, Y.; Ouellet, H.; Guertin, M.; Boffi, A.; Antonini, G.; Bocedi, A.; Mattu, M.; Bolognesi, M.; Ascenzi, P. Cyanide binding to truncated hemoglobins: A crystallographic and kinetic study. Biochemistry 2004, 43, 5213–5221. [Google Scholar] [CrossRef] [Scilit] [PubMed]
  10. Liu, Y.; Chang, Y.Z. The regulation of mitochondrial ferritin on mitochondrial redox balance is essential to cell fate decision. Redox Biol. 2026, 92, 104124. [Google Scholar] [CrossRef] [Scilit] [PubMed]
  11. Read, A.D.; Bentley, R.E.; Archer, S.L.; Dunham-Snary, K.J. Mitochondrial iron–sulfur clusters: Structure, function, and an emerging role in vascular biology. Redox Biol. 2021, 47, 102164. [Google Scholar] [CrossRef] [Scilit] [PubMed]
  12. da Fonseca-Pereira, P.; Monteiro-Batista, R.D.C.; Araújo, W.L.; Nunes-Nesi, A. Harnessing enzyme cofactors and plant metabolism: An essential partnership. Plant J. 2023, 114, 1014–1036. [Google Scholar] [CrossRef] [Scilit] [PubMed]
  13. Marelja, Z.; Leimkühler, S.; Missirlis, F. Iron sulfur and molybdenum cofactor enzymes regulate the Drosophila life cycle by controlling cell metabolism. Front. Physiol. 2018, 9, 50. [Google Scholar] [CrossRef] [Scilit] [PubMed]
  14. Tragni, V.; Primiano, G.; Tummolo, A.; Cafferati Beltrame, L.; La Piana, G.; Sgobba, M.N.; Cavalluzzi, M.M.; Paterno, G.; Gorgoglione, R.; Volpicella, M.; et al. Personalized medicine in mitochondrial health and disease: Molecular basis of therapeutic approaches based on nutritional supplements and their analogs. Molecules 2022, 27, 3494. [Google Scholar] [CrossRef] [Scilit] [PubMed]
  15. Barra, L.; Awakawa, T.; Abe, I. Noncanonical functions of enzyme cofactors as building blocks in natural product biosynthesis. Jacs AU 2022, 2, 1950–1963. [Google Scholar] [CrossRef] [Scilit] [PubMed]
  16. Chen, J.; Calderone, L.A.; Pan, L.; Quist, T.; Pandelia, M.E. The Fe and Zn cofactor dilemma. Biochim. Biophys. Acta BBA-Proteins Proteom. 2023, 1871, 140931. [Google Scholar] [CrossRef] [Scilit] [PubMed]
  17. Antar, S.A.; Ashour, N.A.; Sharaky, M.; Khattab, M.; Ashour, N.A.; Zaid, R.T.; Roh, E.J.; Elkamhawy, A.; Al-Karmalawy, A.A. Diabetes mellitus: Classification, mediators, and complications; A gate to identify potential targets for the development of new effective treatments. Biomed. Pharmacother. 2023, 168, 115734. [Google Scholar] [CrossRef] [Scilit] [PubMed]
  18. Xie, T.; Yao, L.; Li, X. Advance in iron metabolism, oxidative stress and cellular dysfunction in experimental and human kidney diseases. Antioxidants 2024, 13, 659. [Google Scholar] [CrossRef] [Scilit] [PubMed]
  19. Ayikkodan Veettil, A.; Basheer, S.M. Novel Colorimetric Anthracene-Based Thiosemicarbazone Probe for Selective Cyanide Ion Detection: From Synthesis to Real-Time Applications. ACS Omega 2025, 10, 52730–52744. [Google Scholar] [CrossRef] [Scilit] [PubMed]
  20. Li, Y.; Zhou, C.; Li, J.; Sun, J. A new phenothiazine-based fluorescent sensor for detection of cyanide. Biosensors 2024, 14, 51. [Google Scholar] [CrossRef] [Scilit] [PubMed]
  21. Waseem, M.T.; Junaid, H.M.; Majeed, S.; Khan, A.M.; Mahmood, T.; Shahzad, S.A. Fluorene based fluorescent and colorimetric chemosensors for selective detection of cyanide ions in aqueous medium and application of logic gate. Microchem. J. 2022, 173, 107018. [Google Scholar] [CrossRef] [Scilit]
  22. Acar, M.; Daştan, A.; Koçak, R. Fluorometric and colorimetric sensor for selective detection of cyanide anion by dibenzosuberenone-based dihydropyridazine in aqueous solution. Talanta 2024, 277, 126241. [Google Scholar] [CrossRef] [Scilit] [PubMed]
  23. Yadav, N.; Singh, A.K. Dual anion colorimetric and fluorometric sensing of arsenite and cyanide ions. RSC Adv. 2016, 6, 100136–100144. [Google Scholar] [CrossRef] [Scilit]
  24. Wang, F.; Wang, L.; Chen, X.; Yoon, J. Recent progress in the development of fluorometric and colorimetric chemosensors for detection of cyanide ions. Chem. Soc. Rev. 2014, 43, 4312–4324. [Google Scholar] [CrossRef] [Scilit] [PubMed]
  25. Nelson, M.; Ayyanar, S.; Selvaraj, M.; Assiri, M.A. Exploiting cyanide anion detection in food samples and for constructing logic gates by turn-off fluorescent chemosensor. J. Mol. Struct. 2025, 1321, 140018. [Google Scholar] [CrossRef] [Scilit]
  26. Bhaskar, R.; Sarveswari, S. Colorimetric sensor for real-time detection of cyanide ion in water and food samples. Inorg. Chem. Commun. 2019, 102, 83–89. [Google Scholar] [CrossRef] [Scilit]
  27. Otu, E.O.; Byerley, J.J.; Robinson, C.W. Ion chromatography of cyanide and metal cyanide complexes: A review. Int. J. Environ. Anal. Chem. 1996, 63, 81–90. [Google Scholar] [CrossRef] [Scilit]
  28. Xu, Z.; Chen, X.; Kim, H.N.; Yoon, J. Sensors for the optical detection of cyanide ion. Chem. Soc. Rev. 2010, 39, 127–137. [Google Scholar] [CrossRef] [Scilit] [PubMed]
  29. Kathuria, I.; Sharma, P.; Kumar, S. Colorimetric, fluorometric, and electrochemical sensing of cyanide ion in aqueous media using merocyanine-ferrocene conjugate. J. Photochem. Photobiol. A Chem. 2023, 445, 115081. [Google Scholar] [CrossRef] [Scilit]
  30. Haj-Hussein, A.T. Spectropotometric Determination of Cyanide by Flow Injection Analysis. Anal. Lett. 1988, 21, 1285–1296. [Google Scholar] [CrossRef] [Scilit]
  31. Kaur, N.; Kaur, B. Recent development in anthracene possessing chemosensors for cations and anions. Microchem. J. 2020, 158, 105131. [Google Scholar] [CrossRef] [Scilit]
  32. Kumar, A.; Jeong, E.; Noh, Y.; Chae, P.S. Fluorescence-based ratiometric sensors as emerging tools for CN− detection: Chemical structures, sensing mechanisms and applications. Methods 2024, 222, 57–80. [Google Scholar] [CrossRef] [Scilit] [PubMed]
  33. Lin, Q.; Chen, P.; Fu, Y.-P.; Zhang, Y.-M.; Shi, B.-B.; Zhang, P.; Wei, T.-B. A Green Synthesis of a Simple Chemosensor That Could Instantly Detect Cyanide with High Selectivity in Aqueous Solution. Chin. Chem. Lett. 2013, 24, 699–702. [Google Scholar] [CrossRef] [Scilit]
  34. Udhayakumari, D. Chromogenic and fluorogenic chemosensors for lethal cyanide ion. A comprehensive review of the year 2016. Sens. Actuators B Chem. 2018, 259, 1022–1057. [Google Scholar] [CrossRef] [Scilit]
  35. Yu, H.; Zhao, Q.; Jiang, Z.; Qin, J.; Li, Z. A ratiometric fluorescent probe for cyanide: Convenient synthesis and the proposed mechanism. Sens. Actuators B Chem. 2010, 148, 110–116. [Google Scholar] [CrossRef] [Scilit]
  36. Zhang, Y.; Zhou, C.; Li, J.; Kovtunets, E. A New Acridine-Based Fluorescent Sensor for the Detection of CN−. Chemosensors 2026, 14, 67. [Google Scholar] [CrossRef] [Scilit]
  37. Su, Q.-L.; Chen, J.-F.; Sun, X.-M.; Liu, J.; Dai, X.-Y.; Wei, T.-B.; Yao, H.; Lin, Q. Pillar[5]arene and Azine Derivative Assembly Improved Dual-Channel Detection of CN−. Chin. J. Chem. 2024, 42, 2471–2478. [Google Scholar] [CrossRef] [Scilit]
  38. Kim, T.; Kim, H.J.; Shin, I.-S.; Hong, J.-I. Potential-Dependent Electrochemiluminescence for Selective Molecular Sensing of Cyanide. Anal. Chem. 2020, 92, 6019–6025. [Google Scholar] [CrossRef] [Scilit] [PubMed]
  39. Punithakumari, G.; Velmathi, S. Smart Sensing of Cyanide and Iron(III) by Anthracene-Based Probe through Relay Recognition Approach. J. Photochem. Photobiol. A Chem. 2019, 373, 94–104. [Google Scholar] [CrossRef] [Scilit]
  40. Kim, M.; Mergu, N.; Son, Y.A. Imidazole-containing ratiometric receptor for the selective and sensitive detection of cyanide and fluoride via deprotonation and a receptor-anion ensemble for Cu2+ sensing. J. Lumin. 2018, 204, 244–252. [Google Scholar] [CrossRef] [Scilit]
  41. Hijji, Y.M.; Rajan, R.; Shraim, A.M.; Attili, B.; Uota, S.; Abebe, F. Selective and Sensitive Dual Chromogenic Cyanide and Fluorescent Azide Probe. Photochem 2025, 5, 12. [Google Scholar] [CrossRef] [Scilit]
  42. Chakraborty, S.; Paul, S.; Roy, P.; Rayalu, S. Detection of cyanide ion by chemosensing and fluorosensing technology. Inorg. Chem. Commun. 2021, 128, 108562. [Google Scholar] [CrossRef] [Scilit]
  43. Barkale, H.V.; Dey, N. Selective sensing of cyanide ions: Impact of molecular design and assembly on the response of π-conjugated acylhydrazone compounds. RSC Adv. 2024, 14, 25108–25114. [Google Scholar] [CrossRef] [Scilit] [PubMed]
  44. Kiran; Ranolia, A.; Rani, P.; Joshi, G.; Kumar, R.; Kumar, S.; Kumar, P.; Singh, S.; Sindhu, J. Precisely designed NIR based conjugated framework as a solid-state emitter for selective recognition of cyanide ion in solid state and cancer cells. J. Photochem. Photobiol. A Chem. 2024, 449, 115373. [Google Scholar] [CrossRef] [Scilit]
  45. Ponlakshmi, P.; Dharaniprabha, V.; Elango, K.P. Solvatochromism of an ICT-based Colourimetric Probe and its Utility to Sense Cyanide in Aqueous Solution and to Estimate it in Food Materials. J. Fluoresc. 2025, 35, 13685–13698. [Google Scholar] [CrossRef] [Scilit] [PubMed]
  46. Manivannan, R.; Son, Y.A. Blue light emitting fluorophore for the effective detection of cyanide ion and electronic test kit development for real time measurement. Dye. Pigment. 2023, 210, 110941. [Google Scholar] [CrossRef] [Scilit]
  47. Dharaniprabha, V.; Elango, K.P. ICT/PET modulated Chromogenic/Fluorogenic detection of cyanide ions: A spectroscopic and theoretical study. J. Fluoresc. 2025, 35, 8993–9003. [Google Scholar] [CrossRef] [Scilit] [PubMed]
  48. Nagy, M.; Fiser, B.; Szőri, M.; Vanyorek, L.; Viskolcz, B. Optical study of solvatochromic isocyanoaminoanthracene dyes and 1, 5-diaminoanthracene. Int. J. Mol. Sci. 2022, 23, 1315. [Google Scholar] [CrossRef] [Scilit] [PubMed]
  49. Islam, S.; Mansha, A.; Asim, S. Effects of metal ions and substituents on HOMO–LUMO gap evident from UV–visible and fluorescence spectra of anthracene derivatives. J. Fluoresc. 2023, 34, 2495–2512. [Google Scholar] [CrossRef] [Scilit] [PubMed]
  50. Kastrati, A.; Oswald, F.; Scalabre, A.; Fromm, K.M. Photophysical properties of anthracene derivatives. Photochem 2023, 3, 227–273. [Google Scholar] [CrossRef] [Scilit]
  51. Balthazar, G.; Naït, T.; Guillot, R.; Rivière, E.; Brisset, F.; Dronova, M.; Brubach, J.B.; Fornasieri, G.; Bleuzen, A. Interactions between the [Fe(CN)6]3− Complex and Monovalent Group IA A+ Ions (A+ = H+, Li+, Na+, K+, Rb+, and Cs+) in A3[Fe(CN)6] Model Compounds and Their Influence on the Formation and Properties of CoFe Prussian Blue Analogues. Inorg. Chem. 2025, 64, 23887–23898. [Google Scholar] [CrossRef] [Scilit] [PubMed]
  52. Brahma, M.; Kanungo, A.D.; Das, M.; Mathew, S.P.; Jaganathan, B.G.; Krishnamoorthy, G. Sensing of cyanide ion by tweaking the proton transfer. Spectrochim. Acta Part A Mol. Biomol. Spectrosc. 2025, 338, 126203. [Google Scholar] [CrossRef] [Scilit] [PubMed]
  53. Zhou, C.; Sun, M.; Yan, C.; Yang, Q.; Li, Y.; Song, Y. A new colorimetric and fluorescent chemodosimeter for fast detection of cyanide. Sens. Actuators B Chem. 2014, 203, 382–387. [Google Scholar] [CrossRef] [Scilit]
  54. Feng, Y.; Bai, L.; Wang, S.; Kong, X.; Cong, L.; Zhao, Q.; Yang, Q.; Li, Y. A novel ratiometric fluorescent probe for cyanide anion with high selectivity and its application in cell imaging. Chem. Res. Chin. Univ. 2017, 33, 534–539. [Google Scholar] [CrossRef] [Scilit]
  55. del Campo, O.; Carbayo, A.; Cuevas, J.V.; Muñoz, A.; García-Herbosa, G.; Moreno, D.; Ballesteros, E.; Basurto, S.; Gómez, T.; Torroba, T. An organopalladium chromogenic chemodosimeter for the selective naked-eye detection of Hg2+ and MeHg+ in water–ethanol 1:1 mixture. Chem. Commun. 2008, 44, 4576–4578. [Google Scholar] [CrossRef] [Scilit] [PubMed]
  56. Wang, L.; Yang, L.; Huang, L.; Cao, D. Diketopyrrolopyrrole-derived Schiff base as colorimetric and fluoromertic probe for sequential detection of HSO4− and Fe3+ with “off-on-off” response. Sens. Actuators B Chem. 2015, 209, 536–544. [Google Scholar] [CrossRef] [Scilit]
Scheme 1. Synthesis of receptor.
Chemosensors 14 00194 sch001
Figure 1. Naked-eye sensing of receptor (5 × 10⁻⁵ M in DMSO) with various anions (1.5 × 10⁻³ M in DMSO) (free receptor = yellow in color; cyanide + receptor = pink color).
Chemosensors 14 00194 g001
Figure 2. UV–Vis spectral changes of receptor (5 × 10⁻⁵ M in DMSO) with the addition of cyanide ion (1.5 × 10⁻³ M in DMSO).
Chemosensors 14 00194 g002
Figure 3. Incremental addition of receptor (5 × 10⁻⁵ M in DMSO) with cyanide ion (1.5 × 10⁻³ M in DMSO) in 0.1 equ–2.0 equ.
Chemosensors 14 00194 g003
Figure 4. Fluorescence spectral changes of receptor (5 × 10⁻⁵ M in DMSO) with the addition of cyanide ion concentration (1.5 × 10⁻³ M in DMSO).
Chemosensors 14 00194 g004
Figure 5. Incremental addition of receptor with the concentration of (5 × 10⁻⁵ M in DMSO) with cyanide ion with the concentration of (1.5 × 10⁻³ M in DMSO) in 0.1 equ–2.0 equ.
Chemosensors 14 00194 g005
Figure 6. The absorbance of receptor at 522 nm was recorded upon the addition of CN− ions in the presence of various interfering anions in DMSO medium. The concentration of receptor was 5.0 × 10⁻⁵ M, with the concentrations of the interfering anions and CN− as 1.5 × 10⁻³ M in DMSO.
Chemosensors 14 00194 g006
Figure 7. Naked-eye detection experiment of receptor (5.0 × 10⁻⁵ M in DMSO) toward CN− (1.5 × 10⁻³ M in DMSO) after adding various cations (1.5 × 10⁻³ M in H2O) (free receptor = yellow in color; receptor + cyanide + other cations = pink color; receptor + cyanide + Fe3+ = yellow color).
Chemosensors 14 00194 g007
Figure 8. UV–Vis spectra and fluorescence spectra of the receptor (5.0 × 10⁻⁵ M in DMSO) containing CN− ion (1.5 × 10⁻³ M in DMSO) after adding different cations (1.5 × 10⁻³ M in H2O).
Chemosensors 14 00194 g008
Scheme 2. Binding mechanism of the receptor with cyanide ion.
Chemosensors 14 00194 sch002
Figure 10. 1H NMR titration studies of receptor with cyanide ion in (0.1 equ–2.0 equ).
Chemosensors 14 00194 g010
Figure 11. (a) Color change of receptor upon the sequential addition of CN−, followed by CN− and Fe3+ ions; (b) corresponding UV–visible spectral changes observed upon the addition of CN−, Fe3+, CN−, and Fe3+ ions. (c) Number of cycles repeating after the addition of receptor with cyanide ion and Fe3+ ion.
Chemosensors 14 00194 g011
Figure 12. Schematic representation of implication (IMP) and inhibition (INH) logic circuits for the molecular gate system.
Chemosensors 14 00194 g012
Figure 13. Schematic illustration of the memory-based molecular logic circuit.
Chemosensors 14 00194 g013
Figure 14. (a) Visible color changes of receptor immobilized on silica upon the addition of CN− and Fe3+ ions. (b) Visible color changes of the receptor solution after the addition of CN− and Fe3+ ions.
Chemosensors 14 00194 g014
Figure 15. Real-sample sensing of cyanide ions using a sprouted potato treated with the receptor (5.0 × 10⁻⁵ M in DMSO medium).
Chemosensors 14 00194 g015
Figure 16. Confocal fluorescence images of RAW264.7 cells. The left panel shows the bright-field image, the middle panel shows the fluorescence emission image, and the right panel represents the merged image. (1) Control RAW264.7 cells. (2) Cells incubated only with CN− for 30 min. (3) Cells incubated with receptor (10 μM) for 30 min. (4) Cells treated with receptor (10 μM) for 30 min followed by incubation with CN− (10 μM) for an additional 30 min. Images were recorded at an excitation wavelength (λ_ex) of 435 nm. Scale bar = 10 μm.
Chemosensors 14 00194 g016
Figure 17. MTT assay of RAW264.7 cells (0–25 µM) at 37 °C for 24 h in the presence of receptor.
Chemosensors 14 00194 g017
Table 2. Consolidated truth table illustrating the molecular logic behavior of the receptor toward CN− (set input) and Fe3+ (reset input). The absorbance at 424 nm functions as an IMP (implication) logic gate, while the absorbance at 522 nm follows an INH (inhibit) logic gate. Binary values 1 and 0 represent the ON and OFF states, respectively.
Set (CN−)Reset (Fe3+)Output at 424 nm (IMP Gate)Output at 522 nm (INH Gate)
0010
1001
0110
1110
Disclaimer/Publisher’s Note: The statements, opinions and data contained in all publications are solely those of the individual author(s) and contributor(s) and not of MDPI and/or the editor(s). MDPI and/or the editor(s) disclaim responsibility for any injury to people or property resulting from any ideas, methods, instructions or products referred to in the content.