


Abstract
The use of insect-based protein sources in aquaculture is gaining increasing attention with Hermetia illucens (black soldier fly, BSF) larvae meal representing a promising substitute to fishmeal (FM). This study evaluated the effect of partial dietary inclusion of BSF meal (BSF0, BSF2.5, BSF5, BSF10%) on the volatilome of rainbow trout (Oncorhynchus mykiss) fillets, before and after cooking, using gas chromatography–mass spectrometry (GC–MS) and a metal oxide sensor-(MOX)-based device. Fish were fed diets with increasing BSF inclusion, and both raw and cooked fillets were analyzed to assess changes in volatile organic compounds (VOCs). GC–MS enabled the identification and semi-quantitative analysis of VOC classes, while MOX sensor responses were processed using Linear Discriminant Analysis (LDA) to assess discrimination among dietary treatments. Results showed that BSF inclusion influenced the volatile profile, with clearer separation at higher inclusion levels (BSF5–BSF10%), especially in cooked fillets. Thermal processing enhanced these differences. GC–MS analysis revealed a reduction in aldehydes and ketones and an increase in carboxylic acids with higher BSF inclusion. Key compounds such as hexanal and heptanal decreased, indicating changes in lipid-derived volatile pathways. Overall, the integration of GC–MS and MOX sensors proved effective in detecting diet-induced changes, supporting their application as effective and reliable tools for quality assessment in aquaculture products, with potential implications for sensory quality that should be further confirmed through dedicated sensory studies.
1. Introduction
Food quality is a complex and multidimensional concept that cannot be reduced to a single parameter or standardized definition. It encompasses a combination of objective characteristics, such as physicochemical properties, and subjective attributes related to consumer perception, including aroma, texture, and overall acceptability. In modern food systems, quality is also closely linked to safety, traceability, and sustainability, reflecting both regulatory requirements and evolving consumer expectations. In this context, the evaluation of food quality requires integrated and multidisciplinary approaches capable of capturing both compositional and perceptual dimensions [1].
Within the rapidly expanding aquaculture sector, the challenge of ensuring high-quality products is closely intertwined with the need to adopt more sustainable production strategies. Carnivorous species such as rainbow trout (Oncorhynchus mykiss) rely heavily on fishmeal as a primary protein source, raising concerns about the environmental and economic sustainability of aquafeeds. As a result, extensive research efforts have been directed toward identifying alternative protein sources that can reduce dependency on marine resources without compromising fish performance or product quality [2,3,4,5].
Among these alternatives, black soldier fly (BSF—Hermetia illucens) larvae meal has emerged as one of the most promising candidates. Its favorable nutritional profile and the possibility of large-scale production through the valorization of organic by-products make it particularly attractive in the framework of circular economy strategies. While numerous studies have demonstrated that insect-based meals can effectively replace fishmeal in aquafeed without negatively affecting growth performance or fish health, less attention has been paid to their impact on the quality of the final product, especially in terms of aroma and volatile composition [6,7].
Aroma is a key determinant of food quality and consumer acceptance, as it directly reflects the chemical complexity of the product. The analysis of volatile organic compounds provides detailed insights into the biochemical and metabolic processes underlying food characteristics, as well as into the modifications induced by diet and processing conditions [6]. In fish products, volatile compounds such as aldehydes, ketones, alcohols, and acids play a central role in defining the characteristic sensory profile, and even subtle changes in their relative abundance can significantly alter perceived quality [8,9,10,11].
Gas chromatography–mass spectrometry is widely recognized as the reference technique for the identification and characterization of volatile compounds, allowing a detailed and compound-specific analysis of the volatilome. However, this approach is often time-consuming and requires complex sample preparation and data processing. In parallel, sensor-based technologies, such as devices based on metal oxide sensors, have gained increasing attention as rapid and non-destructive tools for food quality assessment. These systems can capture the overall volatile fingerprint of a sample and, when combined with multivariate statistical methods, enable effective discrimination between products with different compositional or processing characteristics [12].
Despite the growing interest in both insect-based diets and advanced sensing technologies [13]. The integration of conventional analytical techniques and sensor-based approaches to investigate the effects of alternative feeds on the volatilome of aquaculture products remains limited. In particular, the combined evaluation of raw and cooked products is essential, as thermal processing can significantly influence the formation and release of volatile compounds, potentially amplifying diet-induced differences.
Therefore, the aim of this study was to investigate the effect of increasing levels of BSF larvae meal in rainbow trout diets on the volatilome of fillets, both raw and cooked, using a combined analytical approach based on gas chromatography–mass spectrometry and metal oxide sensor technology. Particular attention was given to the ability of sensor-based methods to discriminate samples according to dietary treatment and to the role of cooking in modulating volatile profiles.
2. Materials and Methods
2.1. Black Soldier Fly Meal, Diets and Fish Trial
Black soldier fly (BSF) larvae (H. illucens) were reared by Hermetia Baruth GmbH (Baruth/Mark, Germany) on vegetable-based substrates. The larvae underwent a dry-pressing process to obtain a partially defatted meal (8.27% ether extract, DM). Detailed information regarding the rearing substrate and processing conditions was not disclosed by the producer due to confidentiality constraints. The resulting BSF meal was used to formulate four iso-nitrogenous, iso-lipidic, and iso-energetic diets, produced and supplied by Zoonomi S.A. (Vrahati Korinthias, Greece).
The experimental design included a control diet (BSF0), containing 20.3% fishmeal (FM), and three additional diets in which FM was partially replaced by BSF meal at increasing inclusion levels: 2.5% (BSF2.5), 5% (BSF5), and 10% (BSF10) on an as-fed basis, corresponding to FM substitution levels of 12.3%, 24.6%, and 45.8%, respectively.
The formulation of diets was designed to ensure comparable nutritional profiles across treatments, allowing the evaluation of the sole effect of BSF inclusion. The detailed composition, including ingredients, proximate analysis, and gross energy content of the experimental diets, is reported in Table 1.
Table 1.
Ingredients (% as fed), proximate composition (% as is), and Gross energy (MJ/kg, as is) of the experimental diets.
A large-scale trial was carried out on a commercial farm (Azienda Agricola Canali Cavour, Mulino di Mellea, Centallo, CN, Italy) with water temperature 15 ± 1 °C, recorded every two weeks. The experimental protocol was approved by the Ethical Committee of the University of Turin, Italy (protocol no. 15741) as previously reported [7]. This protocol was drafted based on the European Directive on the protection of animals used for scientific purposes (2010/63/EU). The adopted experimental design was balanced with four diets × three replicate tanks (4 × 3). At the beginning of the trial, a total of 1560 healthy female rainbow trout (Oncorhynchus mykiss) juveniles were anaesthetised (MS-222, PHARMAQ Ltd., Sandleheath, UK; 60 mg L−1), weighed (average weight 117.1 ± 6.351g SD), and randomly distributed among twelve fibreglass tanks (1800 litres), with each tank containing 130 fish. After 14 days of acclimatation to the structures, in which the animals were fed with a commercial diet (Classic extra 3P, Skretting, Italy), the tanks were randomly assigned to one of the different dietary treatments (3 tanks/treatment). Feeds were provided to fish keepers with a blind code that was associated to each tank in order to minimise potential confounders such as the order of treatments and fish/tank location.
2.2. Sample Preparation and Analytical Conditions for GC–MS and S3+ Analyses
A subsample of 48 rainbow trout specimens (n. 4 fish per tank, n. 12 fish per diet/treatment) fed the experimental diets described in Section 2.1 were randomly killed by over anaesthesia. Fillets (approximate weight 20–25 g) sampled were stored at −20 °C prior to analysis to preserve their properties. Thawing procedures were adapted according to the intended use: raw samples were thawed overnight at 4 °C in a cool chamber, whereas samples intended for cooking were boiled directly from frozen.
Cooking was performed in a glass container filled with water, placed on a hotplate equipped with a thermal probe, maintaining a constant temperature of 85 °C. This vacuum-sealed cooking procedure was selected as a controlled thermal processing condition to ensure uniform heating, avoid direct contact between the fillet and water, reduce uncontrolled losses of water-soluble and volatile compounds, and improve reproducibility among samples. Vacuum-sealed samples were cooked for 25 min, then allowed to cool, sliced, and subsequently transferred to the analysis chamber. Throughout all stages, sterile conditions were maintained to prevent contamination and the formation of undesirable metabolites resulting from bacterial activity. To this end, sterilized materials, Bunsen burners or laminar flow cabinets were used, and work surfaces were thoroughly sanitized.
For GC–MS analysis, a 2 g aliquot of each sample was collected using a coring device and transferred into 20 mL chromatographic vials, which were then sealed with aluminum caps and PTFE/silicone septa. To ensure sample representativeness, three subsamples were taken from different areas and combined within each vial. For S3+ analysis, 5 g of each sample were used. Samples were transferred into polypropylene (PP) containers equipped with lids featuring two openings for the insertion of aspiration tubes.
A total of 96 samples were analyzed, including both GC–MS and S3+ measurements (Table 2). Specifically, 72 samples were analyzed by GC–MS, including 36 raw and 36 cooked samples. Fish were reared in separate tanks, identified by the letter “T”, while “F” denotes the individual fish within each tank. For each dietary treatment, fish were collected from three independent tanks. Within each tank, three different fish (F1–F3) were selected for GC–MS analysis and analyzed both in raw and cooked form. This approach was adopted to account for biological variability and to ensure robust compound-specific characterization of the volatilome by GC–MS. A fourth fish from the same tank (F4) was instead used for analysis with the S3+ device, in order to keep GC–MS and sensor-based measurements independent while maintaining the same tank and dietary conditions. For each S3+ sample, five technical measurements were performed, resulting in a total of 24 samples analyzed with the S3+ system.
Table 2.
Experimental design and sample coding for GC–MS (a) and S3+ analyses (b).
2.3. GC-MS Analysis Conditions
Volatile organic compounds (VOCs) were extracted from the headspace using a DVB/CAR/PDMS 50/30 μm solid-phase microextraction (SPME) fiber (Supelco, Bellefonte, PA, USA), selected for its high affinity toward compounds with a wide range of volatility and polarity. For both raw and cooked samples, SPME extraction was performed under the same headspace exposure conditions, with the fiber exposed to the headspace for 1.5h at 40 °C. The difference between raw and cooked samples was related to the sample pre-treatment: raw samples were analyzed after thawing, whereas cooked samples were vacuum-sealed and thermally treated before VOC extraction. The use of identical SPME extraction conditions allowed comparison of VOC profiles while preserving the distinction between the two sample states. The exposure time was selected to ensure adequate equilibration among the sample matrix, headspace, and fiber, thus improving reproducibility and the comprehensiveness of the volatile profile.
Chromatographic separation was performed using a Shimadzu GC-2020 system coupled with a Shimadzu MS-QP2020 mass spectrometer (Kyoto, Japan). Analyte desorption was carried out in the GC injector port in splitless mode for 6 min at 250 °C, in order to maximize compound transfer onto the column. Separation was achieved on a MEGA-5MS capillary column (25 m × 0.25 mm × 0.25 μm film thickness; Agilent Technologies, Santa Clara, CA, USA), suitable for the analysis of volatile and semi-volatile compounds in complex matrices.
The mass spectrometer operated in electron ionization (EI) mode at 70 eV, with the ion source temperature set at 240 °C. Mass spectra were acquired in total ion current (TIC) mode over a mass range of 35–500 m/z, with a scan interval of 0.3 s, ensuring adequate coverage of the compounds of interest. Hydrogen (99.99%) was used as the carrier gas, generated by a GENius PF500 system (FullTech Instruments Srl, Rome, Italy), to improve chromatographic efficiency and reduce analysis time. Hydrogen was supplied by a dedicated generator and used under controlled instrumental conditions, including regulated flow and pressure. In this configuration, hydrogen was used only as a carrier gas and not as a reactive gas. Moreover, the analytical setup did not include catalysts or reaction conditions that could promote hydrogenation artifacts. Operating conditions included a column flow of 2.5 mL/min, linear velocity of 87.4 cm/s, inlet pressure of 35.7 kPa, and purge flow of 4.0 mL/min.
The GC oven temperature program started at 40 °C (held for 1 min), followed by a ramp of 4.5 °C/min up to 50 °C, then 6.5 °C/min up to 80 °C, and finally 15 °C/min up to 180 °C, allowing effective separation of compounds with different volatilities. The total chromatographic run time was 17 min, while the overall analysis time per sample was approximately 107 min.
Compound identification was performed by comparing the obtained mass spectra with those from NIST11, NIST11b, and FFNSC2 libraries. Peak integration was based on peak area, considering a minimum of 70 peaks with an area threshold above 500 AMU. Data processing parameters included a slope of 100/min, peak width of 2 s, drift set to 0/min, and a doubling time (T.DBL) of 1000 min. No signal smoothing was applied in order to preserve data integrity.
The relative abundance of VOCs was expressed as the percentage of GC peak area over time (% GC area) and reported as mean ± standard deviation.
2.4. Calibration of MOX Sensor Arrays
Volatile organic compounds (VOCs) of raw and cooked fillet samples were analyzed using the Small Sensor System S3+ (Nano Sensor Systems s.r.l., Reggio Emilia, Italy; www.nasys.it). The device is designed for VOC detection through an array of metal oxide (MOX) sensors and consists of a sensing chamber, a fluidic circuit for VOC delivery, and an electronic control unit [14].
In this study, the S3+ system was configured with two MOX sensors, each integrating three sensing elements, for a total of six active sensing units. The selected materials were SnO2, SnO2–Pd, and SnO2–Au, replicated on both sensors. This configuration was adopted to enhance measurement robustness and reliability: the presence of identical sensing materials on both sensors allows compensation for potential sensor malfunction, thereby improving signal reproducibility. Furthermore, the two sensors operate at different working temperatures (ranging from 500 to 800 °C), enabling a broader and more selective response toward compounds with different surface reactivity.
It is important to note that the operating temperature of the sensors is independent of the sample temperature and does not affect the analytical conditions. Sensor heating is achieved through integrated micro-heaters, which allow high temperatures to be reached locally at the sensing surface without altering the temperature of the surrounding environment or the sample.
The sensing chamber, made of stainless steel, houses the sensor array and enables controlled exposure to VOCs. For the analysis, each fillet sample (5 g) was placed in a sterile 50 mL polypropylene (PP) container and maintained at 30 °C using a thermostatic bath, in order to ensure reproducible headspace generation conditions. The container was sealed with a screw cap equipped with two openings for the insertion of inlet and outlet tubes.
The inlet tube allowed the renewal of air within the headspace, while the outlet tube was connected to the S3+ device for VOC sampling. Both tubes, made of polypropylene and equipped with carbon filters, were used to prevent external contamination [6]. Sensor calibration was performed following standardized protocols to ensure data reproducibility and reliability [15].
Each analytical cycle lasted 16 min and consisted of three phases: sensor stabilization (100 s), sample exposure (200 s), and sensor recovery (500 s). For each sample, five replicates were performed to improve the robustness and consistency of the acquired data.
Sensor signals were acquired and transmitted to the Microsoft Azure cloud platform, where they were managed through a dedicated interface and mixture classification service. Data analysis and interpretation were carried out using Linear Discriminant Analysis (LDA) to evaluate the discriminative capability of the system among different experimental treatments.
2.5. Post-Run Analysis
Post-run analysis of the sensor signals was performed through a feature extraction procedure aimed at summarizing the dynamic responses of the MOX sensor array into a set of descriptive parameters. Feature extraction was performed using custom Python 3.11 scripts. These features were selected to capture complementary aspects of the sensor response, including signal intensity, temporal dynamics, and stability.
Specifically, a combination of statistical, dynamic, and segment-based features was computed, including stability indices calculated over different portions of the signal, minimum and maximum derivatives (representing the steepest decreasing and increasing trends), the integral of the signal (area under the curve, AUC), the response amplitude (ΔR), the logarithm of the signal sum, and the minimum and maximum signal values.
A detailed description of the extracted features is reported in Table 3. The raw sensor signals used for feature extraction are provided as Supplementary Material (Table S1), ensuring transparency and reproducibility of the analysis.
Table 3.
Description of the features extracted from MOX sensor responses used for multivariate analysis.
The extracted features were then used as input variables for multivariate analysis. Before Linear Discriminant Analysis (LDA), the extracted features were normalized to ensure that variables with different numerical ranges contributed comparably to the model and to avoid a disproportionate influence of features with larger magnitudes. To evaluate model robustness and reduce the risk of overfitting, LDA performance was assessed using leave-one-out cross-validation (LOOCV). In this procedure, each observation was iteratively excluded from model training and used as an independent test observation, while the model was trained on the remaining observations. Cross-validated classification accuracy was then calculated and reported together with the apparent classification accuracy. The final LDA models were applied separately to raw and cooked S3+ datasets. LDA is a supervised statistical and machine learning technique that identifies linear combinations of variables that maximize separation among predefined classes [16]. The main objective of this method is to reduce dataset dimensionality while preserving the most discriminative information. The transformation projects the data into a reduced feature space, up to k − 1 dimensions, where k is the number of classes, enabling improved visualization and classification of the samples.
3. Results and Discussion
In this study, both raw and cooked trout fillet samples obtained from fish fed different insect-based diets were analyzed using a combined approach integrating innovative sensing technologies and conventional analytical methods. While raw fish is generally characterized by a relatively mild aroma, it represents a complex biochemical system rich in precursors of volatile organic compounds (VOCs), including lipids, amino acids, and other metabolites. These precursors play a crucial role in the development of the volatilomic profile, particularly during thermal processing. Therefore, dietary composition is expected to influence not only the baseline volatilome of raw fish but also its transformation during cooking, potentially leading to amplified or emergent differences in aroma profiles.
3.1. Small Sensor System S3+ Analysis
Linear Discriminant Analysis (LDA) was applied to the data obtained from the Small Sensor System S3+ to investigate differences in VOC profiles among raw trout samples subjected to different feeding regimes. As a supervised multivariate technique, LDA maximizes the separation among predefined classes, enabling a more robust interpretation of subtle variations in complex sensor responses.
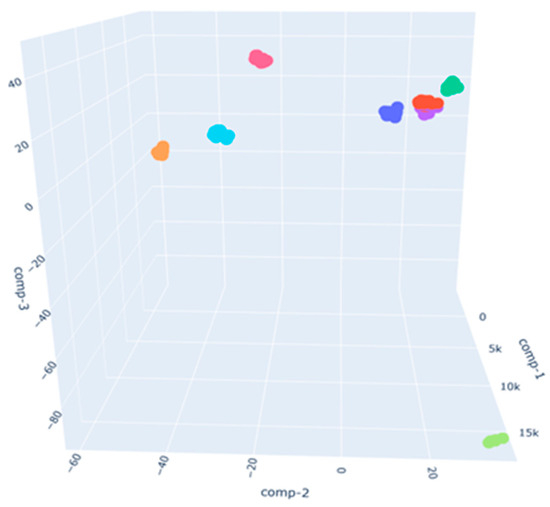
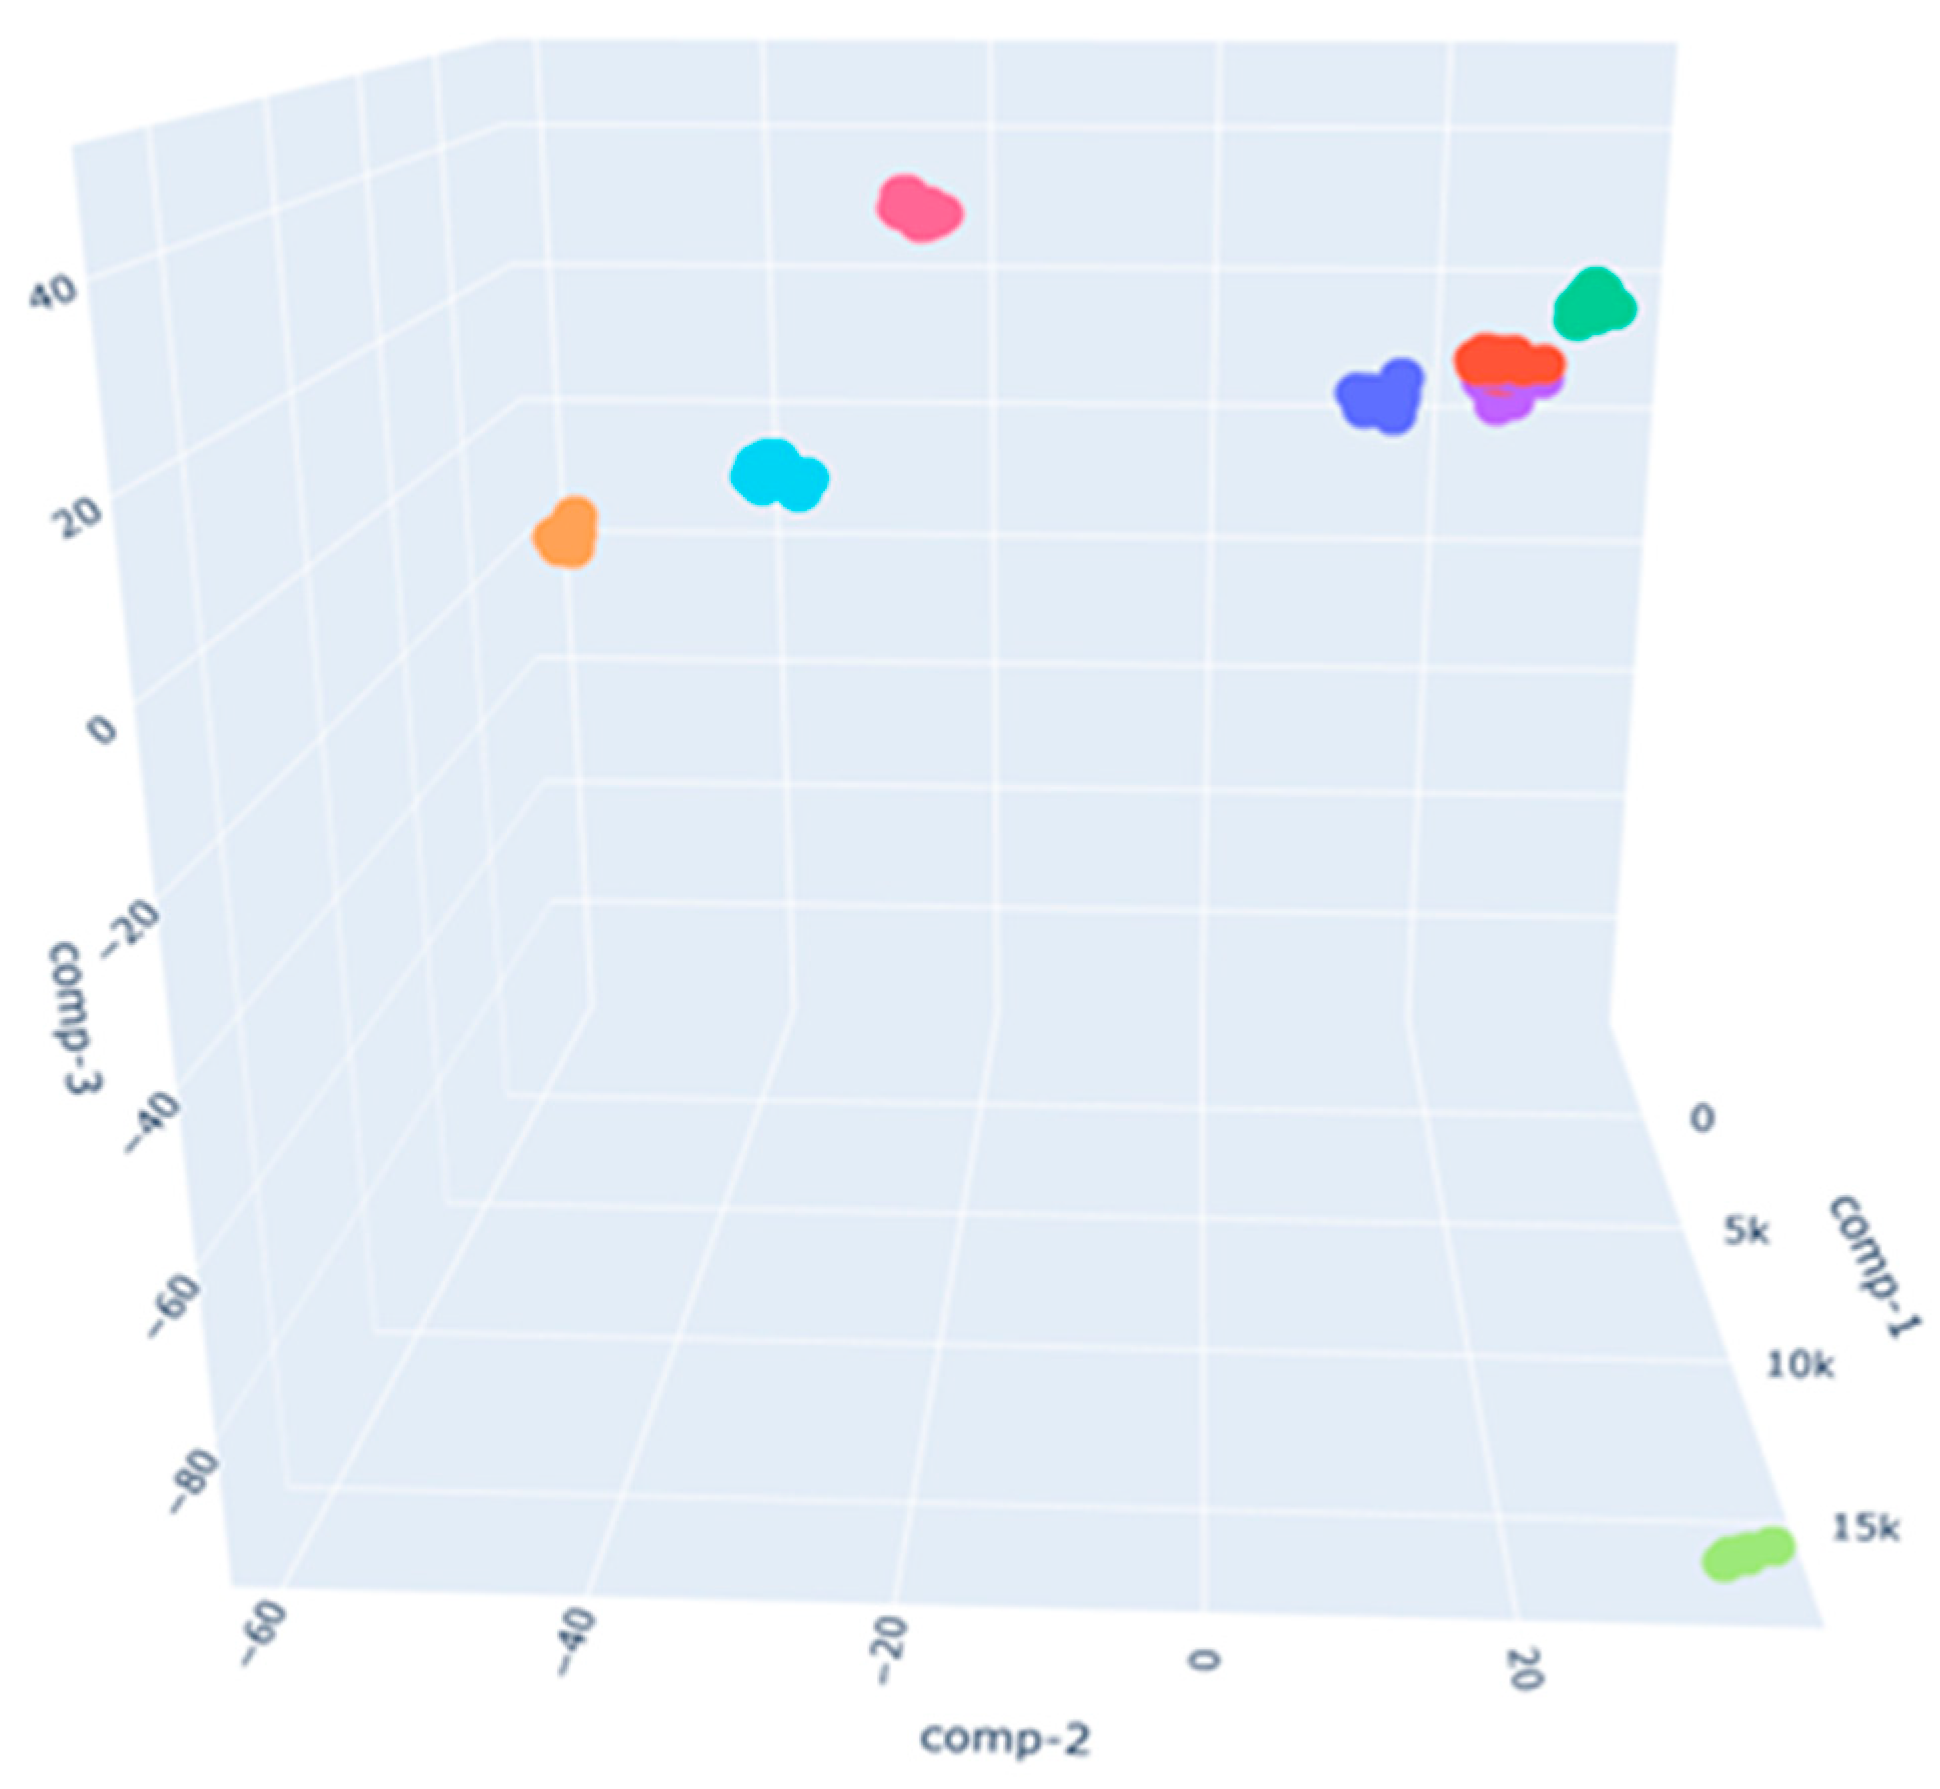
As shown in Figure 1, raw samples exhibited a well-defined clustering pattern, indicating that even in the absence of thermal processing, dietary treatments induced detectable changes in the volatilomic fingerprint. Different colors within the same dietary treatment reflect the experimental structure of the dataset, including fish originating from different rearing tanks within the same dietary group. Therefore, the sub-clustering visible in the LDA plot may partially reflect biological and tank-related variability superimposed on the diet-induced effect. Notably, samples from the control diet (BSF0) clustered closely with those from the lowest level of insect meal inclusion (BSF2.5), showing partial overlap and suggesting that low substitution rates do not substantially alter the overall volatile profile. In contrast, higher inclusion levels (BSF5 and BSF10) resulted in a progressive separation from the control group, supporting the hypothesis of a dose-dependent effect of BSF insect meal on the volatilomic composition. Overall, despite the within-treatment variability, the main separation trend was associated with dietary treatment, particularly at higher BSF inclusion levels. The gradual divergence among clusters suggests that dietary modulation influences the biochemical pathways responsible for VOC generation, likely through alterations in lipid composition, fatty acid profiles, and oxidative stability [17]. Additionally, changes in metabolic activity and precursor availability may contribute to the observed differences, highlighting the complex interplay between diet and volatilome even in raw matrices. The LDA model achieved an apparent classification accuracy of 100.00% for raw samples. To assess model robustness, leave-one-out cross-validation (LOOCV) was also performed, resulting in a cross-validated accuracy of 68.75%. These results indicate that the S3+ system captured diet-related differences in raw samples; however, the decrease in accuracy after cross-validation suggests that further validation on larger and more balanced datasets is required to fully assess model generalization.
Figure 1.
LDA plot of raw trout fillets analyzed using the S3+ system. Samples are grouped according to dietary treatment: BSF0, BSF2.5, BSF5, and BSF10. Different colors within the same dietary treatment indicate experimental subgroups associated with fish originating from different rearing tanks, allowing visualization of within-treatment variability.
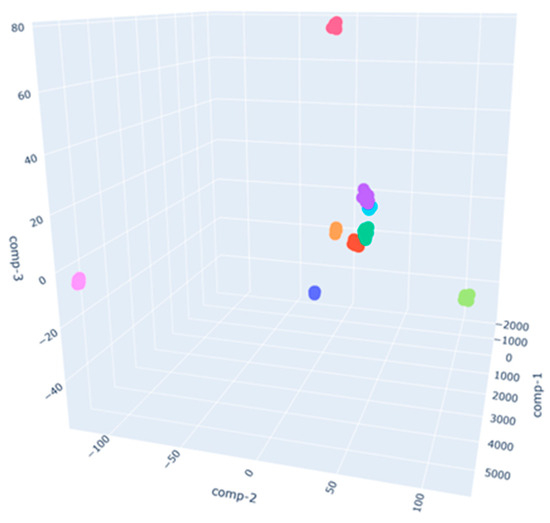
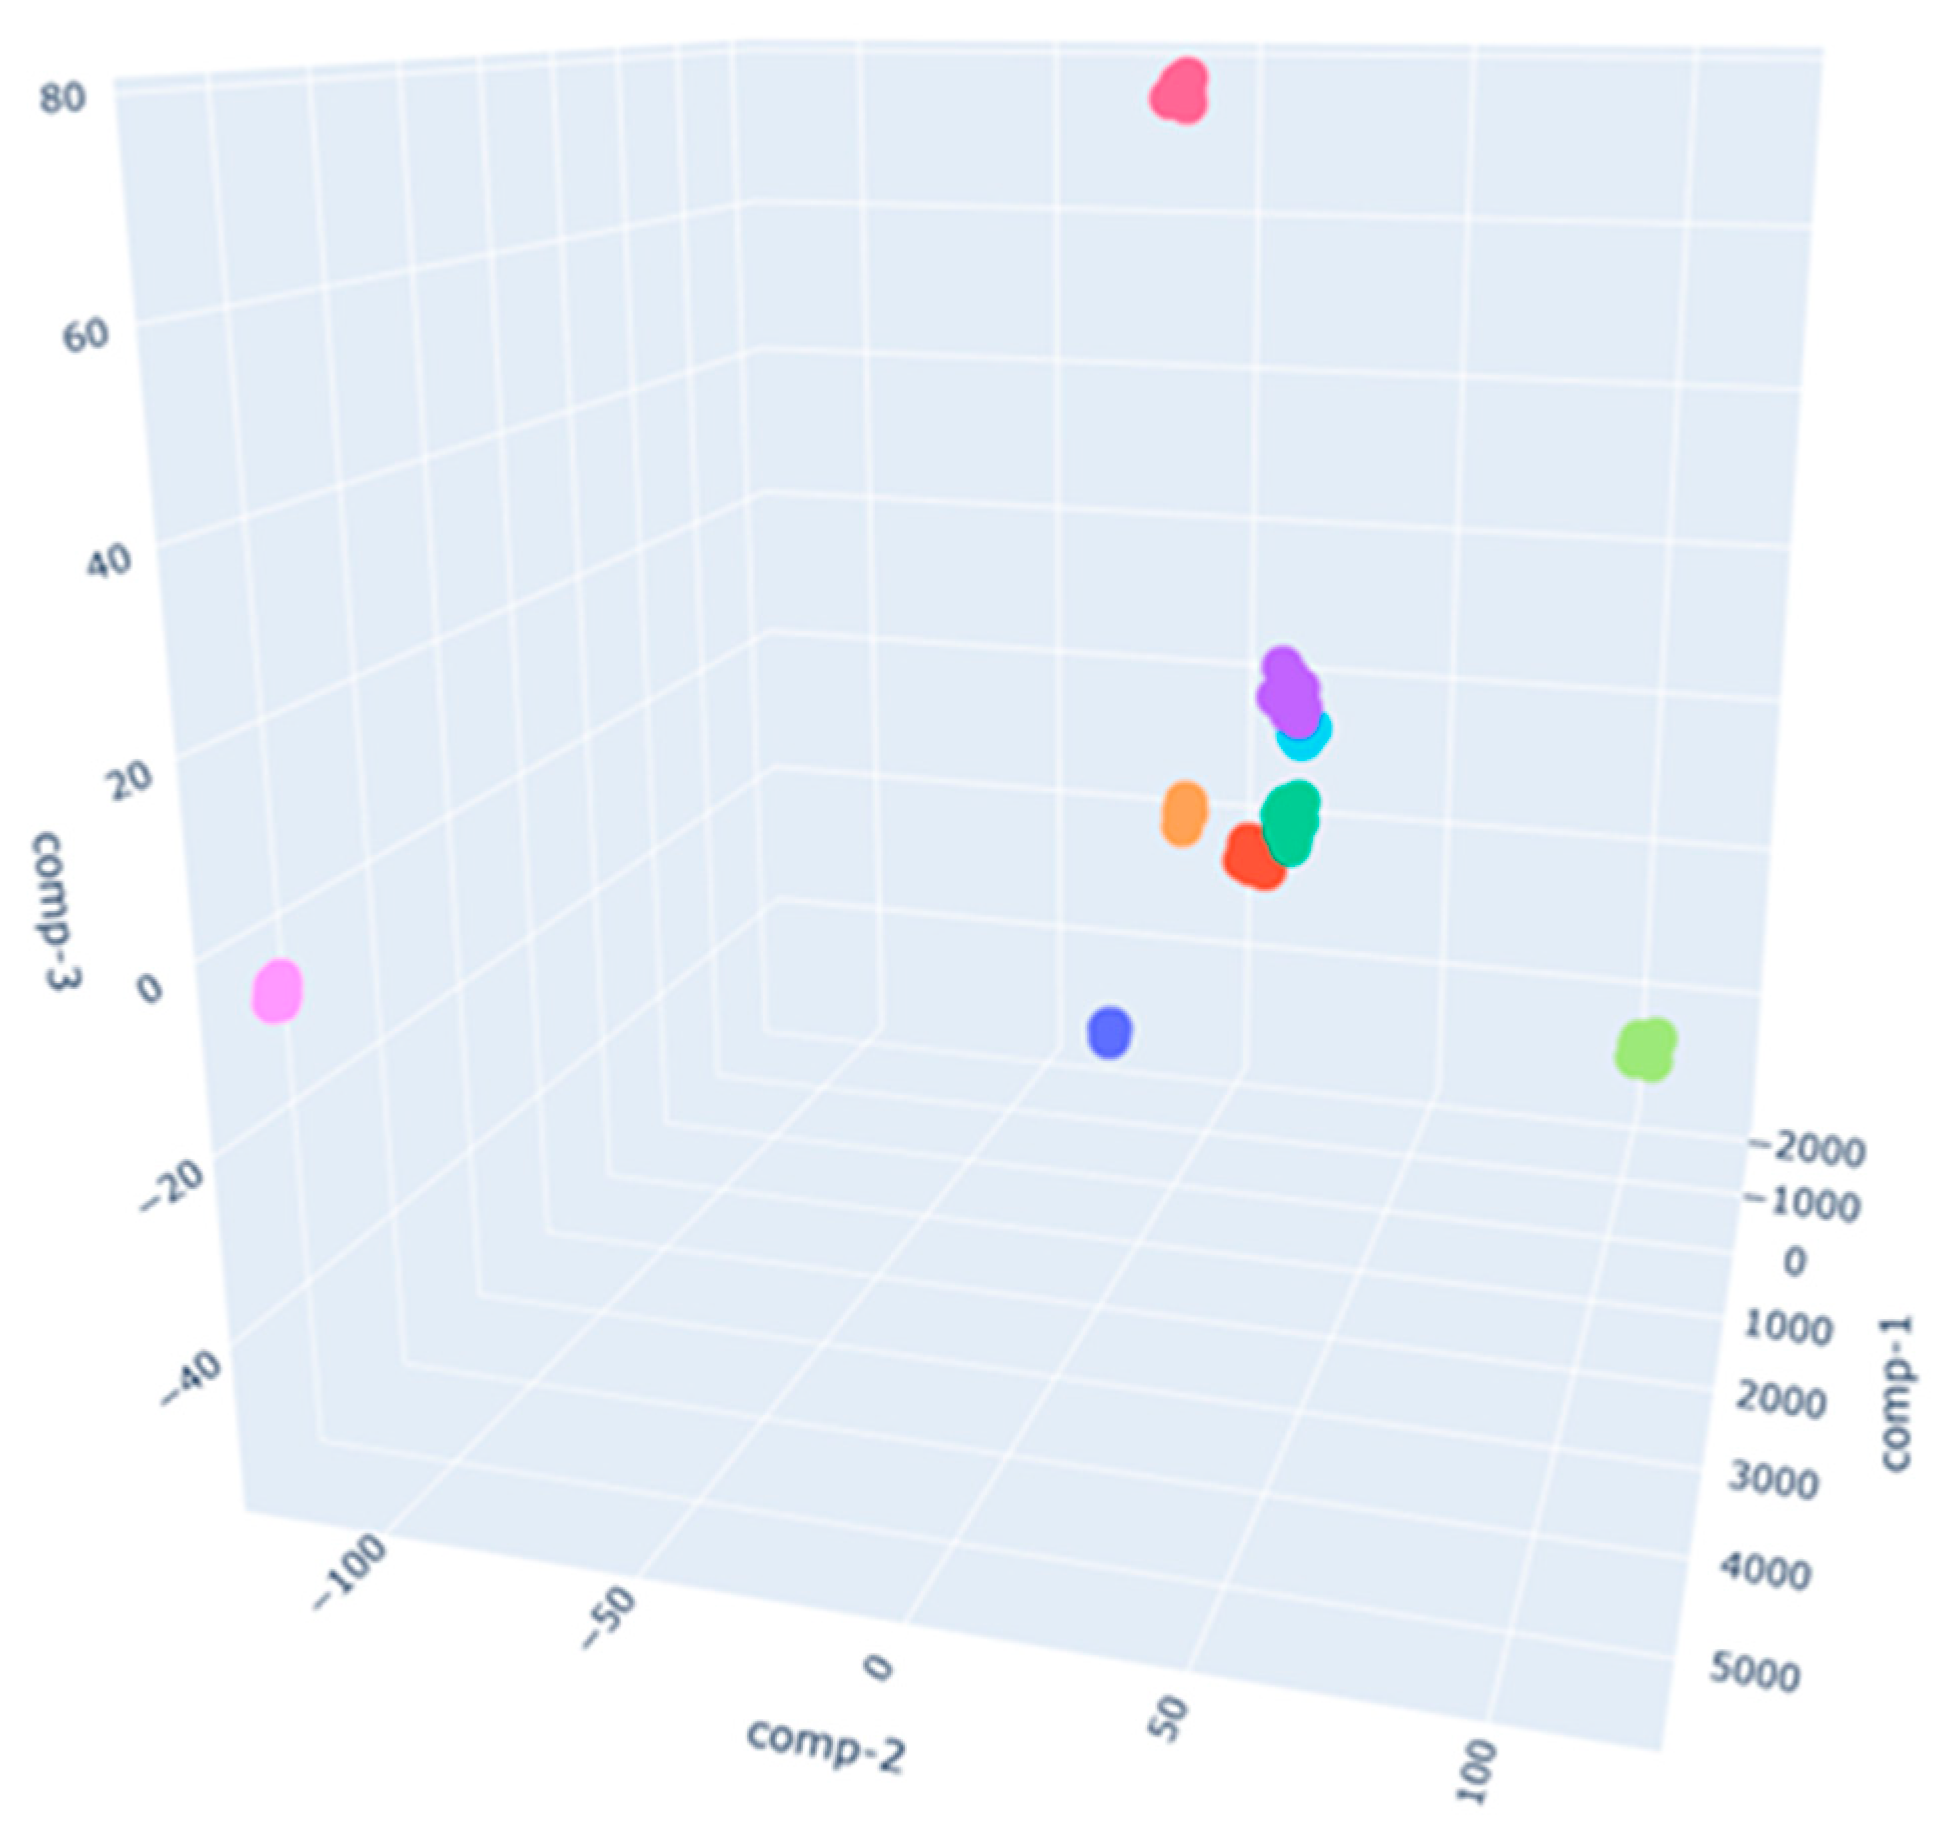
In the LDA plot of cooked trout fillet samples (Figure 2), the separation among dietary groups appears more pronounced compared to the raw samples, indicating that thermal processing enhances the detectability of diet-induced differences. In particular, BSF0 and BSF2.5 samples show minimal overlap, suggesting that even low levels of insect meal inclusion become more distinguishable after cooking. Conversely, BSF5 and BSF10 samples exhibit a more dispersed distribution, with BSF10 forming the most distinct cluster, reflecting a higher degree of variability and differentiation at elevated substitution levels.
Figure 2.
LDA plot of cooked trout fillets analyzed using the S3+ system. Samples are grouped according to dietary treatment: BSF0, BSF2.5, BSF5, and BSF10. Different colors within the same dietary treatment indicate experimental subgroups associated with fish originating from different rearing tanks, allowing visualization of within-treatment variability.
This pattern suggests that cooking acts as an amplifying factor for volatilomic differences, likely due to the activation of thermally driven reactions such as lipid oxidation, Maillard reactions, and the breakdown of complex precursors. These processes not only generate new volatile compounds but also modulate the relative abundance of existing ones, thereby enhancing the chemical contrast between samples. The increased dispersion observed in higher inclusion groups may further indicate a more complex and heterogeneous volatilomic response, potentially linked to greater variability in precursor composition and reaction pathways. For cooked samples, the LDA model achieved an apparent classification accuracy of 88.24%. LOOCV resulted in a cross-validated accuracy of 58.82%, indicating that discrimination among dietary treatments was less robust after cross-validation. This result should be interpreted cautiously, likely due to the limited number of S3+ observations, and further studies with larger and more balanced datasets are needed to better assess model generalization.
Additional two-dimensional planar projections of the LDA score plots for both raw and cooked samples are reported in Supplementary Figure S1. These projections show pairwise combinations of the first three discriminant functions and provide a complementary visualization of the spatial distribution of the dietary groups. Overall, these findings highlight that cooking does not merely modify the volatilomic profile but contributes to the expression of diet-related differences, reinforcing the role of thermal processing as a critical factor in shaping the aroma characteristics of fish. From an analytical perspective, this also suggests that sensor-based technologies such as S3+ can capture diet-related differences in processed samples, although further validation on larger datasets is required to assess classification robustness.
3.2. GC–MS Analysis
The results obtained from the Small Sensor System S3+ suggested that insect-based diets influence the volatilomic profile of both raw and cooked rainbow trout. Therefore, SPME–GC–MS analysis was performed to identify and characterize the volatile compounds responsible for these differences.
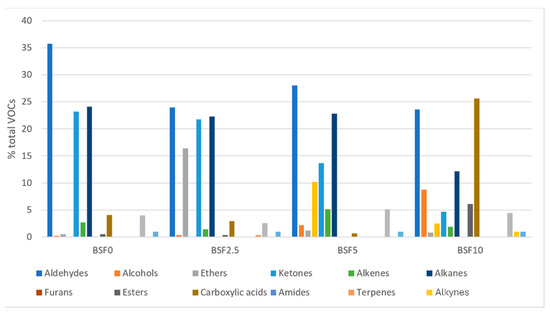
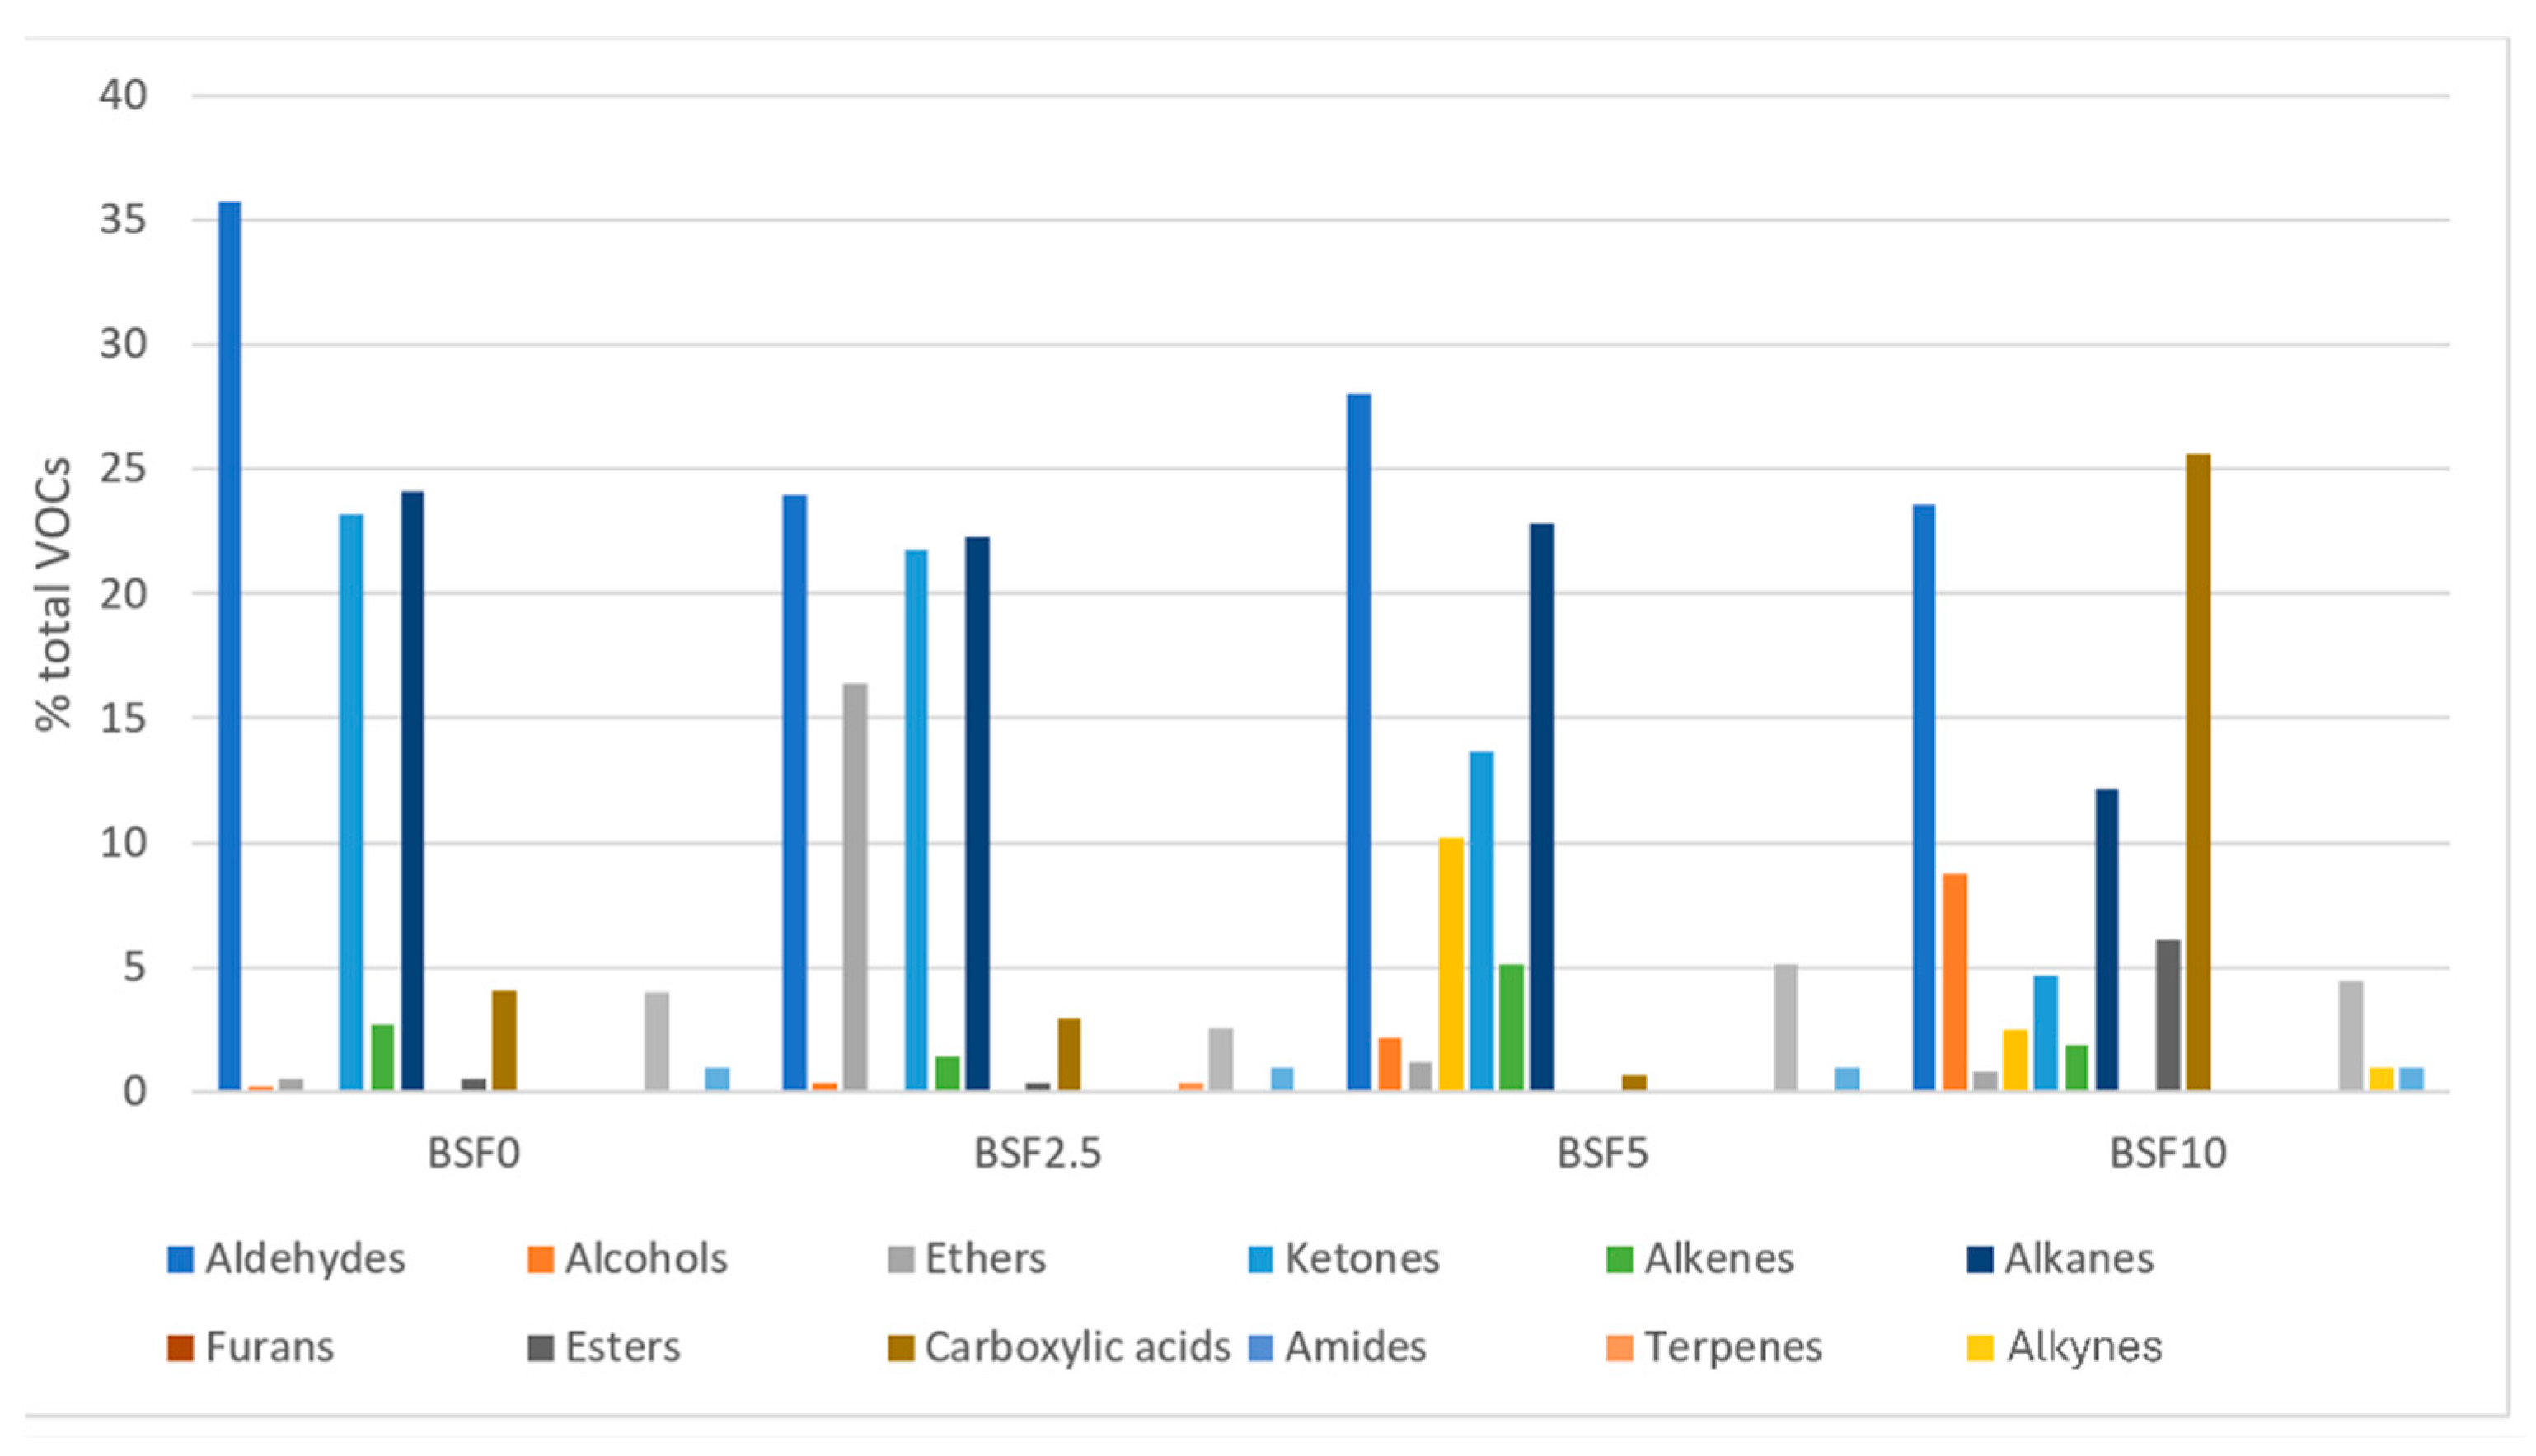
The analysis of raw samples revealed the presence of several chemical classes, including aldehydes, alcohols, esters, alkanes, carboxylic acids, ketones, phenols, alkenes, ethers, alkynes, and terpenes (Figure 3). A general decreasing trend was observed for some classes, particularly aldehydes, ketones, and alkanes, with increasing levels of insect meal in the diet.
Figure 3.
Chemical classes and relative abundance of volatile organic compounds in raw samples of rainbow trout fed different amounts of H. illucens-based meal.
Aldehydes, which are among the most abundant odor-active compounds in rainbow trout [18], showed a marked decrease from 36% in BSF0 to 24% in BSF10. Compounds such as hexanal, heptanal, and octanal—typically associated with green, fatty, and marine-like odors [18,19,20] followed this trend. In particular, hexanal exhibited the most pronounced reduction, decreasing from 31% in BSF0 to 10% in BSF10. This compound is commonly formed through the oxidation of linoleic acid [15]; however, no significant differences in linoleic acid content were observed between BSF0 and BSF10 in the present study [18]. This suggests that hexanal formation was not exclusively driven by the total amount of linoleic acid, but was likely influenced by the oxidative stability of the lipid fraction, the accessibility of oxidizable substrates, the balance between pro-oxidant and antioxidant compounds, and the overall biochemical organization of the fish matrix [21]. Therefore, the lower hexanal abundance observed at higher BSF inclusion levels may reflect a modulation of lipid oxidation dynamics rather than a direct reduction in linoleic acid concentration.
Among ketones, acetoin showed a substantial decrease, dropping from approximately 20% of total VOCs in BSF0 to about 2% in BSF10. This compound, characterized by a sweet odor, has previously been reported in rainbow trout fed conventional diets [16]. Similarly, alkanes accounted for approximately 20% of total VOCs in BSF0, BSF2.5, and BSF5 samples, but decreased to around 12% in BSF10.
Conversely, carboxylic acids increased with higher insect meal inclusion, reaching 26% of total VOCs in BSF10 samples. The most abundant compound in this class was hexadecanoic acid (approximately 13%), which was not detected in samples from the other dietary groups. This shift may indicate alterations in lipid metabolism and degradation pathways associated with insect-based feeding strategies.
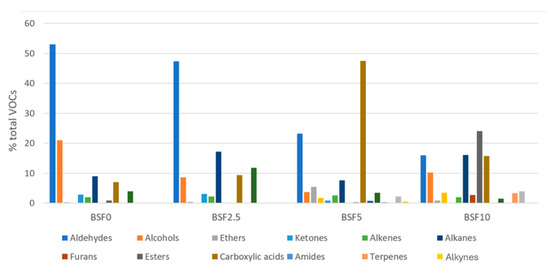
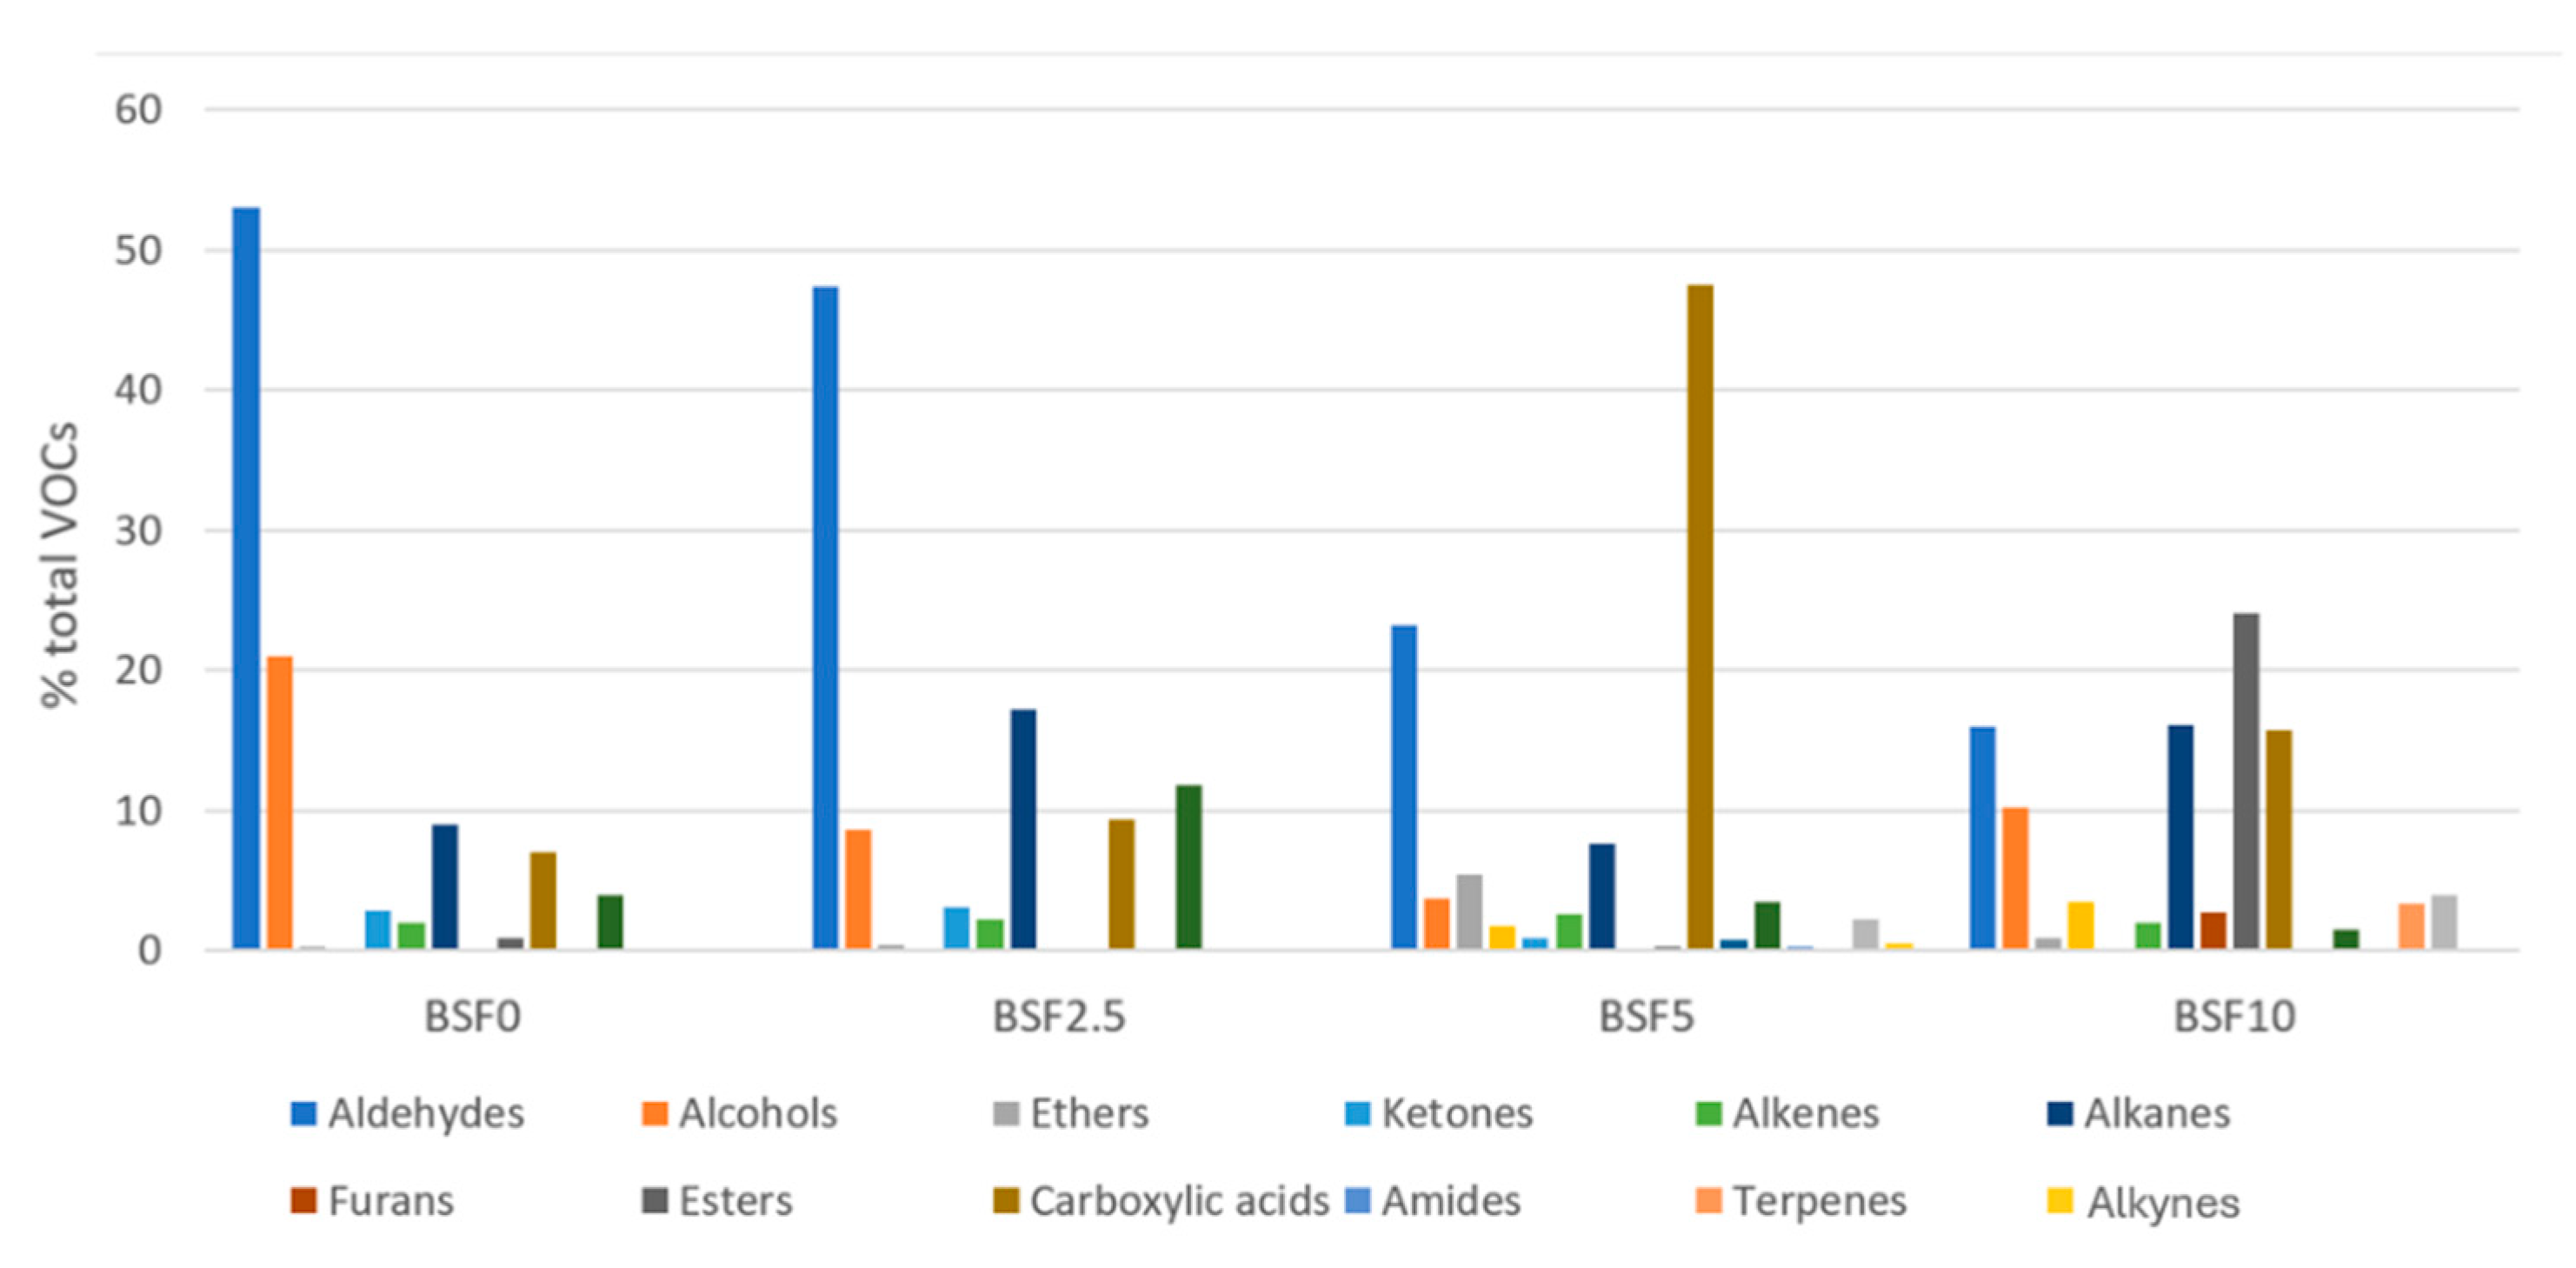
With regard to cooked rainbow trout, the overall volatile profiles of BSF0 and BSF2.5 samples appeared similar. Aldehydes represented the dominant class of volatile compounds in both groups, accounting for 53% and 47% of total VOCs, respectively (Figure 4). As observed in raw fillets, hexanal was the most abundant aldehyde, reaching up to 28% of total VOCs in BSF0, while it markedly decreased to 8% in BSF10. A similar trend was observed for heptanal, which progressively declined with increasing levels of insect meal inclusion, decreasing from 6% in BSF0 to complete absence in BSF10.
Figure 4.
Chemical classes and relative abundance of volatile organic compounds in cooked samples of rainbow trout fed different amounts of H. illucens-based meal.
Samples from BSF5 and BSF10 exhibited comparable profiles, characterized by a reduction in aldehydes and a concomitant increase in carboxylic acids, compared to BSF0 and BSF2.5. This shift suggests that higher levels of insect meal may influence lipid oxidation pathways and the formation of secondary volatile compounds during cooking.
Previous studies on cooked rainbow trout fed conventional diets have identified aldehydes and alcohols as the main aroma-active compounds [22]. In particular, heptanal and nonanal have been reported as key odor-active aldehydes, while 1-octen-3-ol has been highlighted among the most relevant alcohols, typically generated through the oxidation of n-3 and n-6 polyunsaturated fatty acids (PUFAs) [23,24]. In the present study, 1-octen-3-ol was detected exclusively in cooked samples, accounting for approximately 5% of total VOCs in BSF0 and BSF2.5, while its abundance decreased to 1.1% and was not detected in BSF5 and BSF10, respectively.
A reduction in heptanal levels in rainbow trout fed H. illucens-based diets has previously been reported [25,26]. However, in that study, the insect-based diet primarily affected heptanal and octanal concentrations, while no significant variations were observed for other aldehydes such as hexanal. In contrast, the present results indicate a broader modulation of aldehyde compounds, suggesting a more pronounced impact of insect meal inclusion on the volatilomic profile, particularly after thermal processing.
In agreement with the results obtained from the Small Sensor System S3+, GC–MS analysis further confirmed that the inclusion of insect-based meal in the diet significantly influences the volatile profiles of rainbow trout. In particular, a clear differentiation was observed in cooked samples between diets with low insect meal inclusion (BSF0 and BSF2.5) and higher inclusion levels (BSF5 and BSF10). These findings indicate that the use of insect meal as an alternative protein source induces measurable and distinct modifications in the volatilomic signature of fish fillets. It should be noted that the objective of the combined analytical approach was not to perform a direct sample-by-sample comparison between GC–MS and S3+ responses, but rather to evaluate the effect of different dietary treatments on the volatile characteristics of rainbow trout fillets at the experimental group level. Fish analyzed by GC–MS and S3+ originated from the same dietary groups and rearing tanks, and were therefore subjected to the same feeding and environmental conditions. Accordingly, GC–MS provided compound-specific information on VOC composition, while the S3+ system captured the overall volatile fingerprint and assessed its ability to discriminate among dietary treatments.
However, it is important to note that the differences observed at the volatilomic level do not necessarily correspond to perceptible variations in sensory attributes. Moreover, cooked samples were obtained using a single controlled vacuum-sealed cooking condition. Other cooking methods, such as pan-frying, grilling, or oven-baking, may generate different volatile profiles due to differences in heat transfer, surface temperature, dehydration, lipid oxidation, and Maillard reaction intensity. Therefore, the results obtained for cooked samples should be interpreted in relation to the specific cooking condition used in this study and should not be directly generalized to all domestic cooking practices. In this context, further studies are required to assess the actual impact of these modifications on sensory quality through sensory panel evaluations on cooked samples. In parallel, nutritional and biochemical investigations could help clarify whether the observed changes in volatile compounds are associated with alterations in lipid profiles or other nutritional quality parameters.
From this perspective, the detected differences should not be interpreted solely as variations in aroma composition, but rather as indicators of broader metabolic and compositional changes induced by the diet. This opens up interesting research opportunities aimed at correlating the volatilome with nutritional quality and sensory acceptability, contributing to a more comprehensive evaluation of insect meal application in aquaculture.
Overall, these results highlight the potential of integrating sensor-based technologies and chromatographic analyses as complementary tools for monitoring diet-induced effects in fish products, supporting the development of sustainable feeding strategies without compromising final product quality.
4. Conclusions
This study demonstrates that insect-based diets induce measurable, dose-dependent changes in the volatilomic profile of rainbow trout, as consistently evidenced by both SPME–GC–MS and the Small Sensor System S3+. The combined use of analytical and sensor-based approaches proved effective in capturing both compositional details and overall volatile fingerprints. Notably, thermal processing amplified diet-related differences, leading to a clearer discrimination among samples and highlighting the importance of evaluating cooked products when assessing feed-related quality changes. The observed shift from aldehydes to carboxylic acids suggests a modulation of lipid oxidation pathways, reflecting broader metabolic effects of insect meal inclusion. While these changes were analytically significant, their sensory relevance remains to be clarified. Future studies integrating sensory and nutritional evaluations will be essential to fully assess the impact of insect-based feeds on product quality. Overall, these findings support the potential of insect meal as a sustainable alternative protein source and highlight the value of integrated volatilomic approaches for monitoring diet-induced changes in aquaculture products.
Supplementary Materials
The following supporting information can be downloaded at https://www.mdpi.com/article/10.3390/chemosensors14060141/s1.
Author Contributions
Conceptualization, E.P., E.N.C., Z.L., F.G., L.T. and V.S.; methodology, E.P., L.T., F.G. and V.S.; software, E.P., E.N.C. and V.S.; validation, E.P., E.N.C., F.G. and V.S.; formal analysis, E.P., E.N.C., Z.L., F.G., L.T. and V.S.; investigation, E.P., E.N.C., Z.L., F.G. and V.S.; resources, F.G. and V.S.; data curation, E.P. and V.S.; writing—original draft preparation, E.P., F.G. and L.T.; writing—review and editing, E.P., E.N.C., F.G. and V.S.; visualization, E.P., F.G. and V.S.; supervision, F.G. and V.S.; project administration, F.G.; funding acquisition, F.G. All authors have read and agreed to the published version of the manuscript.
Funding
This research has received funding from the European Union’s Horizon 2020 research and innovation programme under grant agreement n° 861976.
Institutional Review Board Statement
This study was approved by the Bioethics Committee of University of Turin (Prot n. 15741 of 15/01/2020). All experimental procedures followed the Regulations Bioethics Committee of University of Turin. Every effort was made to minimize animal suffering and to use the fewest animals necessary for statistically valid conclusions.
Informed Consent Statement
Not applicable.
Data Availability Statement
Data are contained within the article.
Acknowledgments
Authors thank Dario Sola and Christian Caimi for the management of the fish at DISAFA fish facility.
Conflicts of Interest
Author Veronica Sberveglieri is a Co-founder of the company Nano Sensor System srl (NASYS) but has never been employed there nor has received a salary from it. The remaining authors declare that the research was conducted in the absence of any commercial or financial relationships that could be construed as a potential conflict of interest.
References
- Boyd, C.E.; D’Abramo, L.R.; Glencross, B.D.; Huyben, D.C.; Juarez, L.M.; Lockwood, G.S.; McNevin, A.A.; Tacon, A.G.J.; Teletchea, F.; Tomasso, J.R., Jr.; et al. Achieving Sustainable Aquaculture: Historical and Current Perspectives and Future Needs and Challenges. J. World Aquac. Soc. 2020, 51, 578–633. [Google Scholar] [CrossRef] [Scilit]
- Colombo, S.M.; Roy, K.; Mraz, J.; Wan, A.H.L.; Davies, S.J.; Tibbetts, S.M.; Øverland, M.; Francis, D.S.; Rocker, M.M.; Gasco, L.; et al. Towards Achieving Circularity and Sustainability in Feeds for Farmed Blue Foods. Rev. Aquac. 2022, 15, 1115–1141. [Google Scholar] [CrossRef] [Scilit]
- Weththasinghe, P.; Hansen, J.Ø.; Mydland, L.T.; Øverland, M. A Systematic Meta-Analysis Based Review on Black Soldier Fly (Hermetia illucens) as a Novel Protein Source for Salmonids. Rev. Aquac. 2021, 14, 938–956. [Google Scholar] [CrossRef] [Scilit]
- Stadtlander, T.; Stamer, A.; Buser, A.; Wohlfahrt, J.; Leiber, F.; Sandrock, C. Hermetia illucens Meal as Fish Meal Replacement for Rainbow Trout on Farm. J. Insects Food Feed 2017, 3, 165–175. [Google Scholar] [CrossRef] [Scilit]
- Caimi, C.; Biasato, I.; Chemello, G.; Bellezza Oddon, S.; Lussiana, C.; Malfatto, V.M.; Capucchio, M.T.; Colombino, E.; Schiavone, A.; Gai, F.; et al. Dietary Inclusion of a Partially Defatted Black Soldier Fly (Hermetia illucens) Larva Meal in Low Fishmeal-Based Diets for Rainbow Trout (Oncorhynchus mykiss). J. Anim. Sci. Biotechnol. 2021, 12, 50. [Google Scholar] [CrossRef] [Scilit] [PubMed]
- Belghit, I.; Liland, N.S.; Gjesdal, P.; Biancarosa, I.; Menchetti, E.; Li, Y.; Waagbø, R.; Krogdahl, Å.; Lock, E.-J. Black Soldier Fly Larvae Meal Can Replace Fish Meal in Diets of Sea-Water Phase Atlantic Salmon (Salmo salar). Aquaculture 2019, 503, 609–619. [Google Scholar] [CrossRef] [Scilit]
- Bellezza Oddon, S.; Biasato, I.; Gai, F.; Renna, M.; Lussiana, C.; Caimi, C.; Belghit, I.; Radhakrishnan, G.; Moyano Lopez, F.J.; Aznar, M.J.; et al. Nutritional Evaluation of Partially Defatted Hermetia illucens Meal in Rainbow Trout (Oncorhynchus mykiss) Diets under Commercial-Like Conditions. Ital. J. Anim. Sci. 2025, 24, 2272–2284. [Google Scholar] [CrossRef] [Scilit]
- Russo, G.L.; Langellotti, A.L.; Genovese, A.; Martello, A.; Sacchi, R. Volatile Compounds, Physicochemical and Sensory Characteristics of Colatura di Alici, a Traditional Italian Fish Sauce. J. Sci. Food Agric. 2020, 100, 3755–3764. [Google Scholar] [CrossRef] [Scilit] [PubMed]
- Selli, S.; Prost, C.; Serot, T. Odour-Active and Off-Odour Components in Rainbow Trout (Oncorhynchus mykiss) Extracts Obtained by Microwave Assisted Distillation–Solvent Extraction. Food Chem. 2009, 114, 317–322. [Google Scholar] [CrossRef] [Scilit]
- Ma, R.; Liu, X.; Tian, H.; Han, B.; Li, Y.; Tang, C.; Zhu, K.; Li, C.; Meng, Y. Odor-Active Volatile Compounds Profile of Triploid Rainbow Trout with Different Marketable Sizes. Aquac. Rep. 2020, 17, 100312. [Google Scholar] [CrossRef] [Scilit]
- Liu, L.; Zhao, Y.; Zeng, M.; Xu, X. Research Progress of Fishy Odor in Aquatic Products: From Substance Identification, Formation Mechanism, to Elimination Pathway. Food Res. Int. 2024, 178, 113914. [Google Scholar] [CrossRef] [Scilit] [PubMed]
- Mahmoud, M.A.A.; Buettner, A. Characterisation of Aroma-Active and Off-Odour Compounds in German Rainbow Trout (Oncorhynchus mykiss). Part II: Case of Fish Meat and Skin from Earthen-Ponds Farming. Food Chem. 2017, 232, 841–849. [Google Scholar] [CrossRef] [Scilit] [PubMed]
- Gougbedji, A.; Detilleux, J.; Lalèyè, P.A.; Francis, F.; Caparros Megido, R. Can Insect Meal Replace Fishmeal? A Meta-Analysis of the Effects of Black Soldier Fly on Fish Growth Performances and Nutritional Values. Animals 2022, 12, 1700. [Google Scholar] [CrossRef] [Scilit] [PubMed]
- Poeta, E.; Liboà, A.; Mistrali, S.; Núñez-Carmona, E.; Sberveglieri, V. Nanotechnology and E-Sensing for Food Chain Quality and Safety. Sensors 2023, 23, 8429. [Google Scholar] [CrossRef] [Scilit] [PubMed]
- Ochoa-Muñoz, Y.H.; Mejía de Gutiérrez, R.; Rodríguez-Páez, J.E. Metal Oxide Gas Sensors to Study Acetone Detection Considering Their Potential in the Diagnosis of Diabetes: A Review. Molecules 2023, 28, 1150. [Google Scholar] [CrossRef] [Scilit] [PubMed]
- Ricciardi, C.; Valente, A.S.; Edmund, K.; Cantoni, V.; Green, R.; Fiorillo, A.; Picone, I.; Santini, S.; Cesarelli, M. Linear Discriminant Analysis and Principal Component Analysis to Predict Coronary Artery Disease. Health Inform. J. 2020, 26, 2181–2192. [Google Scholar] [CrossRef] [Scilit] [PubMed]
- Xanthopoulos, P.; Pardalos, P.M.; Trafalis, T.B. Linear Discriminant Analysis. In Robust Data Mining; SpringerBriefs in Optimization: New York, NY, USA, 2013; pp. 27–33. [Google Scholar] [CrossRef] [Scilit]
- Radhakrishnan, V.; Venkatakrishnan, K.; Perumal Kalaiyarasi, J.; Selvarajan, G.; Mahaboobasha, N.; Victor, P.V.; Anbazhagan, M.; Sivanandam, D.M.; Rajaraman, S. Dexamethasone-Free Antiemetic Prophylaxis for Highly Emetogenic Chemotherapy: A Double-Blind, Phase III Randomized Controlled Trial (CINV POD Study). JCO Glob. Oncol. 2024, 10, e2300301. [Google Scholar] [CrossRef] [Scilit] [PubMed]
- Mahmoud, M.A.A.; Magby, M.; Tybussel, T.; Barth, J.; Buettner, A. Comparative Evaluation of Wild and Farmed Rainbow Trout Based on Representative Chemosensory and Microbial Indicators of Their Habitat. J. Agric. Food Chem. 2023, 71, 2094–2104. [Google Scholar] [CrossRef] [Scilit] [PubMed]
- Wu, T.; Wang, M.; Wang, P.; Tian, H.; Zhan, P. Advances in the Formation and Control Methods of Undesirable Flavors in Fish. Foods 2022, 11, 2504. [Google Scholar] [CrossRef] [Scilit] [PubMed]
- Wang, D.; Xiao, H.; Lyu, X.; Chen, H.; Wei, F. Lipid Oxidation in Food Science and Nutritional Health: A Comprehensive Review. Oil Crop Sci. 2023, 8, 35–44. [Google Scholar] [CrossRef] [Scilit]
- Mancini, S.; Medina, I.; Iaconisi, V.; Gai, F.; Basto, A.; Parisi, G. Impact of Black Soldier Fly Larvae Meal on the Chemical and Nutritional Characteristics of Rainbow Trout Fillets. Animals 2018, 12, 1672–1681. [Google Scholar] [CrossRef] [Scilit] [PubMed]
- Tao, N.-P.; Wu, R.; Zhou, P.-G.; Gu, S.-Q.; Wu, W. Characterization of Odor-Active Compounds in Cooked Meat of Farmed Obscure Puffer (Takifugu obscurus) Using Gas Chromatography–Mass Spectrometry–Olfactometry. J. Food Drug Anal. 2014, 22, 431–438. [Google Scholar] [CrossRef] [Scilit] [PubMed]
- Selli, S.; Rannou, C.; Prost, C.; Robin, J.; Serot, T. Characterization of Aroma-Active Compounds in Rainbow Trout (Oncorhynchus mykiss) Eliciting an Off-Odor. J. Agric. Food Chem. 2006, 54, 9496–9502. [Google Scholar] [CrossRef] [Scilit] [PubMed]
- Poeta, E.; Núñez-Carmona, E.; Sberveglieri, V.; Lozano, J.; Sánchez, R. Monitoring the Olfactory Evolution of Cold-Fermented Sourdough Using an Electronic Nose. Chemosensors 2025, 13, 187. [Google Scholar] [CrossRef] [Scilit]
- Gasco, L.; Biancarosa, I.; Liland, N.S. From Waste to Feed: A Review of Recent Knowledge on Insects as Producers of Protein and Fat for Animal Feeds. Curr. Opin. Green Sustain. Chem. 2020, 23, 67–79. [Google Scholar] [CrossRef] [Scilit]

Disclaimer/Publisher’s Note: The statements, opinions and data contained in all publications are solely those of the individual author(s) and contributor(s) and not of MDPI and/or the editor(s). MDPI and/or the editor(s) disclaim responsibility for any injury to people or property resulting from any ideas, methods, instructions or products referred to in the content. |
© 2026 by the authors. Licensee MDPI, Basel, Switzerland. This article is an open access article distributed under the terms and conditions of the Creative Commons Attribution (CC BY) license.