


Abstract
Hydrogen sulfide (H2S) is a toxic and biologically relevant gas, necessitating sensitive and interference-resistant detection methods for environmental monitoring. Here, we develop a donor–acceptor molecular platform incorporating a polarized conjugated double bond bridge and demonstrate its application, using YG2 as the representative probe, as a dual-peak ratiometric UV–Vis sensor for H2S. UV–Vis spectroscopy, supported by 1H NMR analysis, indicates HS--induced interaction with the conjugated linkage, leading to disruption of π-conjugation, suppression the intramolecular charge-transfer (ICT) band at 409 nm, and enhancing the locally excited (LE) band at 279 nm. The ratiometric parameter log(Abs279/Abs409) affords a linear response over the concentration range of 1.0 × 10⁻⁶–1.0 × 10⁻⁴ M with a detection limit of 8.3 × 10⁻⁷ M, providing approximately an order-of-magnitude improvement in analytical sensitivity compared with single-wavelength methods, and the reaction reaches completion within ~10 s. YG2 exhibits excellent selectivity toward H2S over common anions and enables accurate quantification in real water samples, with recoveries of 95.43–105.86% and relative standard deviations (RSDs) of 0.56–9.58%. These results suggest that YG2 is a rapid, self-calibrating, and spectroscopically interpretable ratiometric probe suitable for reliable H2S detection in complex aqueous environments.
1. Introduction
Hydrogen sulfide (H2S) is a colorless and malodorous gas generated from the decomposition of organic matter as well as numerous industrial and petrochemical processes [1,2,3]. Because of its high membrane permeability and strong reducing nature, even low-level exposure to H2S can cause severe toxicity, including respiratory paralysis, central nervous system damage, coma, and death [4,5,6,7,8,9,10]. Moreover, dysregulated endogenous H2S concentrations have been implicated in various pathological conditions such as Alzheimer’s disease, Down syndrome, liver cirrhosis, and diabetes [11,12,13,14], underscoring its emerging role as a biologically relevant gaseous mediator. Recognizing its acute toxicity, the U.S. Occupational Safety and Health Administration (OSHA) classifies H2S as a hazardous gas, highlighting the urgent need for accurate, sensitive, and real-time detection in environmental and biological settings [15].
Established analytical techniques for H2S detection, such as electrochemical methods and gas chromatography, provide high reliability but require expensive and bulky instrumentation, complex sample preparation, and skilled operators. These constraints limit their suitability for on-site or continuous monitoring. In contrast, chemical sensing strategies offer compelling advantages, including low cost, straightforward operation, and the potential for rapid detection [2]. Fluorescent probes [3,16,17,18,19,20,21,22,23] in particular have attracted significant interest because selective reactions with H2S [24,25,26] can yield pronounced optical changes. A representative design employs a donor–acceptor naphthalimide scaffold bearing an azide at the 4-position as the H2S-reactive site; reduction by H2S deprotects the azide to an amine and restores naphthalimide emission via an off–on switching mechanism [27]. Another example is a dual-emissive system incorporating pyrene, naphthalimide, and an NBD quencher, where H2S-induced reduction in the NBD unit restores naphthalimide emission and generates a self-referenced ratiometric output [28]. Despite such advances in fluorescence-based systems, ratiometric absorption probes remain far less developed.
Absorption-based sensing platforms, including UV–Vis and colorimetric probes, offer a complementary approach due to their minimal instrumental requirements and compatibility with field deployment. Many reported systems rely on donor–acceptor (D–A) charge-transfer chromophores whose electronic structure is perturbed by H2S. For example, Schiff-base naphthaldehyde derivatives undergo H2S-triggered deprotonation, strengthening intramolecular charge transfer (ICT) and producing a visible bathochromic shift. Isoindigo-based probes represent another design [29], where nucleophilic attack of HS− bleaches the characteristic 401 nm band by disrupting π–π* conjugation. However, most absorption probes remain fundamentally single-channel [19,20,21], detecting either the growth or decay of a single optical band. Such single-wavelength measurements are highly susceptible to variations in probe concentration, optical pathlength, light-source intensity, scattering, and environmental fluctuations, which undermine quantitative accuracy. Ratiometric UV–Vis probes, which measure the ratio between two spectrally distinct and internally referenced absorption peaks, can inherently overcome these limitations. Nonetheless, their development remains scarce because achieving large, clean, and mechanistically well-defined dual-band transformations upon H2S reaction is challenging. In particular, dipolar D–π–A scaffolds capable of undergoing H2S-induced ICT-to-locally excited (LE) transitions are rare, leaving a significant gap in molecular design strategies for ratiometric absorption sensing.
Here, we report a dual-peak ratiometric UV–Vis probe designed to address these challenges. The molecular platform is based on a dipolar push–pull architecture consisting of an aryloxy-substituted phenyl unit as the primary electron-donating fragment, a pyridyl moiety that modulates the electronic distribution and dipolar character of the conjugated system, and a strongly electron-withdrawing 4-phenyl-2-oxo-2,5-dihydrofuran-3-carbonitrile acceptor [30,31,32,33,34,35,36]. These components are connected through a polarized exocyclic C=C linkage generated by Knoevenagel condensation, giving rise to pronounced electronic asymmetry. Flexible alkoxy side chains were deliberately introduced at the phenolic position to tune solubility and intermolecular interactions without significantly perturbing the conjugated backbone. In particular, alkylated and hydroxy-terminated ethoxy substituents were employed to examine the influence of side-chain polarity and hydrogen-bonding capability on aggregation behavior and sensing performance, while maintaining an identical push–pull core. This strong push–pull polarization renders the conjugated C=C linkage susceptible to nucleophilic interaction with HS−, providing a chemically plausible basis for sensing.
Upon exposure to H2S, spectroscopic measurements reveal pronounced perturbation of the donor–acceptor coupling and suppression of the ICT pathway. Prior to H2S exposure, the probe exhibits a characteristic ICT band at 409 nm. Upon reaction with H2S, the ICT band diminishes and a LE transition emerges at 279 nm. This ICT-to-LE transformation spans a large spectral separation of approximately 130 nm, effectively minimizing peak overlap and instrumental artifacts and enabling reliable determination of the absorbance ratio Abs279/Abs409. The resulting dual-peak response provides a stable, self-calibrated ratiometric signal for robust H2S quantification. Compared with conventional single-band UV–Vis assays, this dual-peak ratiometric strategy intrinsically compensates for fluctuations in probe concentration, light intensity, and environmental conditions while retaining the simplicity, low cost, and operational convenience of absorption spectroscopy. Beyond expanding the repertoire of ratiometric UV–Vis sensing platforms, this work highlights how modulation of ICT pathways and sulfide-induced perturbation of polarized conjugated systems can be leveraged as a molecular design principle for next-generation absorption-based H2S probes.
2. Experimental Section
2.1. Reagents and Instruments
[1,1′-Bis(diphenylphosphino)ferrocene]dichloropalladium(II) (Pd(dppf)Cl2), bis(pinacolato)diboron, and 4-formylphenylboronic acid were obtained from Matrix Scientific (Columbia, SC, USA). 4-Bromophenol, potassium carbonate, and cyanoacetic acid were purchased from Alfa Aesar (Ward Hill, MA, USA). 2-Chloroethyl propyl ether, ethyl acetate, and acetone were acquired from Tokyo Chemical Industry (TCI, Tokyo, Japan). Sodium iodide was bought from Acros Organics (Geel, Belgium). 5-Bromopyridine-2-carbaldehyde and diethylene glycol monochlorohydrin were supplied by Fluka (Buchs, Switzerland). Potassium acetate, tetrakis(triphenylphosphine)palladium(0) [Pd(PPh3)4], and potassium cyanide were obtained from Sigma-Aldrich (St. Louis, MO, USA). Sodium hydroxide, 2-bromoacetophenone, and ethanol were purchased from Marco Scientific (Taipei, Taiwan), Fisher Scientific (Waltham, MA, USA), and Taiwan Tobacco and Liquor Corporation (TSC, Taipei, Taiwan), respectively. Acetonitrile, dichloromethane, and potassium phosphate tribasic were purchased from DUKSAN Pure Chemicals (Ansan, Republic of Korea). N,N-Dimethylformamide (DMF) was obtained from Tedia (Fairfield, OH, USA). For inorganic salts, potassium fluoride (Choneye Pure Chemicals, Taipei, Taiwan), potassium chloride and potassium hydroxide (Junsei Chemical Co., Tokyo, Japan), potassium iodide (Aldrich, St. Louis, MO, USA), and potassium nitrate (JIS Chemical, Tokyo, Japan) were used as received.
An LC Technology Solutions SPBT-101 solvent purification system (Riverside, CA, USA) was used to dispense anhydrous ACS-grade solvents. Flash column chromatography was performed using silica gel (KM3 Cubic Technology, Taipei, Taiwan; 46–75 μm) with appropriate eluents. Thin-layer chromatography (TLC) employed silica gel 60 F254 aluminium-backed plates (Merck, Darmstadt, Germany); spots were visualized under a handheld UVGL-25 lamp at 254 and 365 nm.
UV–Vis spectra were recorded using an Evolution 6S spectrophotometer (Thermo Fisher Scientific, Waltham, MA, USA) with HPLC-grade acetonitrile. NMR spectra were obtained on AC-300 and AC-600 FT-NMR spectrometers (Bruker BioSpin, Billerica, MA, USA). Chemical shifts (δ) are reported in ppm, coupling constants (J) in Hz, and residual solvent peaks were used for internal calibration. Multiplicities are indicated as s, d, t, q, m, and dd. Mass spectra were acquired at the Mass Spectrometry Facility, Institute of Chemistry, Academia Sinica, using a JMS-T100LP instrument (JEOL Ltd., Tokyo, Japan). LC/MS analysis was performed using a Shimadzu Nexera LC system coupled to a single-quadrupole mass spectrometer (LCMS-2050, Shimadzu, Kyoto, Japan) equipped with an electrospray ionization (ESI) source, operated in both positive- and negative-ion modes. Elemental analysis (C, H, N) was performed using an Elementar UNI cube elemental analyzer (Elementar Analysensysteme GmbH, Langenselbold, Germany) with stated accuracy of ±0.1% at National Taiwan University. Data analysis and plotting were performed using OriginPro 2024 (OriginLab Corporation, Northampton, MA, USA).
2.2. Characterizations
A 1.0 × 10⁻³ M stock solution of the probe was prepared in acetonitrile and diluted to 1.0 × 10⁻⁴ M for spectroscopic measurements. Aqueous sodium sulfide (Na2S) solutions (1.0 × 10⁻⁶–1.0 × 10⁻⁴ M) were used as the H2S source. UV–Vis absorption spectra were collected at room temperature on a Thermo Fisher Scientific Evolution 6S spectrophotometer using 1 cm quartz cuvettes. To ensure the validity of quantitative analysis, the linearity of absorbance with respect to probe concentration was experimentally verified over the concentration range employed in this study (Figure S1). The absorbance values recorded under these conditions fall within the linear regime of the Beer–Lambert law, indicating that the measurements are suitable for ratiometric analysis and that potential inner filter effects are not significant under the employed conditions.
2.3. H2S Detection Tests
Probe solutions (1.0 × 10⁻⁴ M) were prepared in acetonitrile/water (99:1, v/v). For each measurement, aliquots of the probe were placed in quartz cuvettes, and appropriate Na2S solutions were added to maintain constant total volume. The mixtures were gently shaken for ~10 s to promote reaction and immediately subjected to UV–Vis analysis. The ratiometric response was quantified using the absorbance ratio Abs279/Abs409, and its base-10 logarithm, log(Abs279/Abs409), was used as the analytical readout. All measurements were conducted at room temperature.
2.4. Real Sample Analysis
Five environmental water matrices were examined: laboratory tap water, Tamsui River water, seawater from Fisherman’s Wharf, and two on-campus pond samples. All samples were filtered to remove suspended solids before use. Each matrix was spiked with Na2S to obtain final concentrations of 85, 35, and 7 μM, followed by gentle shaking for ~10 s prior to analysis. UV–Vis spectra were acquired under identical conditions using acetonitrile/water (99:1, v/v) as the solvent and blank. The ratiometric signal was defined as Abs279/Abs409, where Abs279 corresponds to the local excitation band maximum (≈279–283 nm depending on probe variant) and Abs409 corresponds to the ICT band. The analytical metric used for calibration and recovery evaluation was log(Abs279/Abs409). Calibration for each matrix employed a three-point standard-addition method (7, 35, and 85 μM, n = 3) with ordinary least-squares linear regression.
3. Results and Discussion
3.1. Synthesis of the Probes
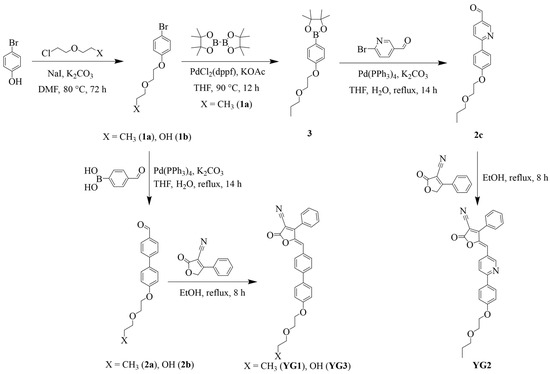
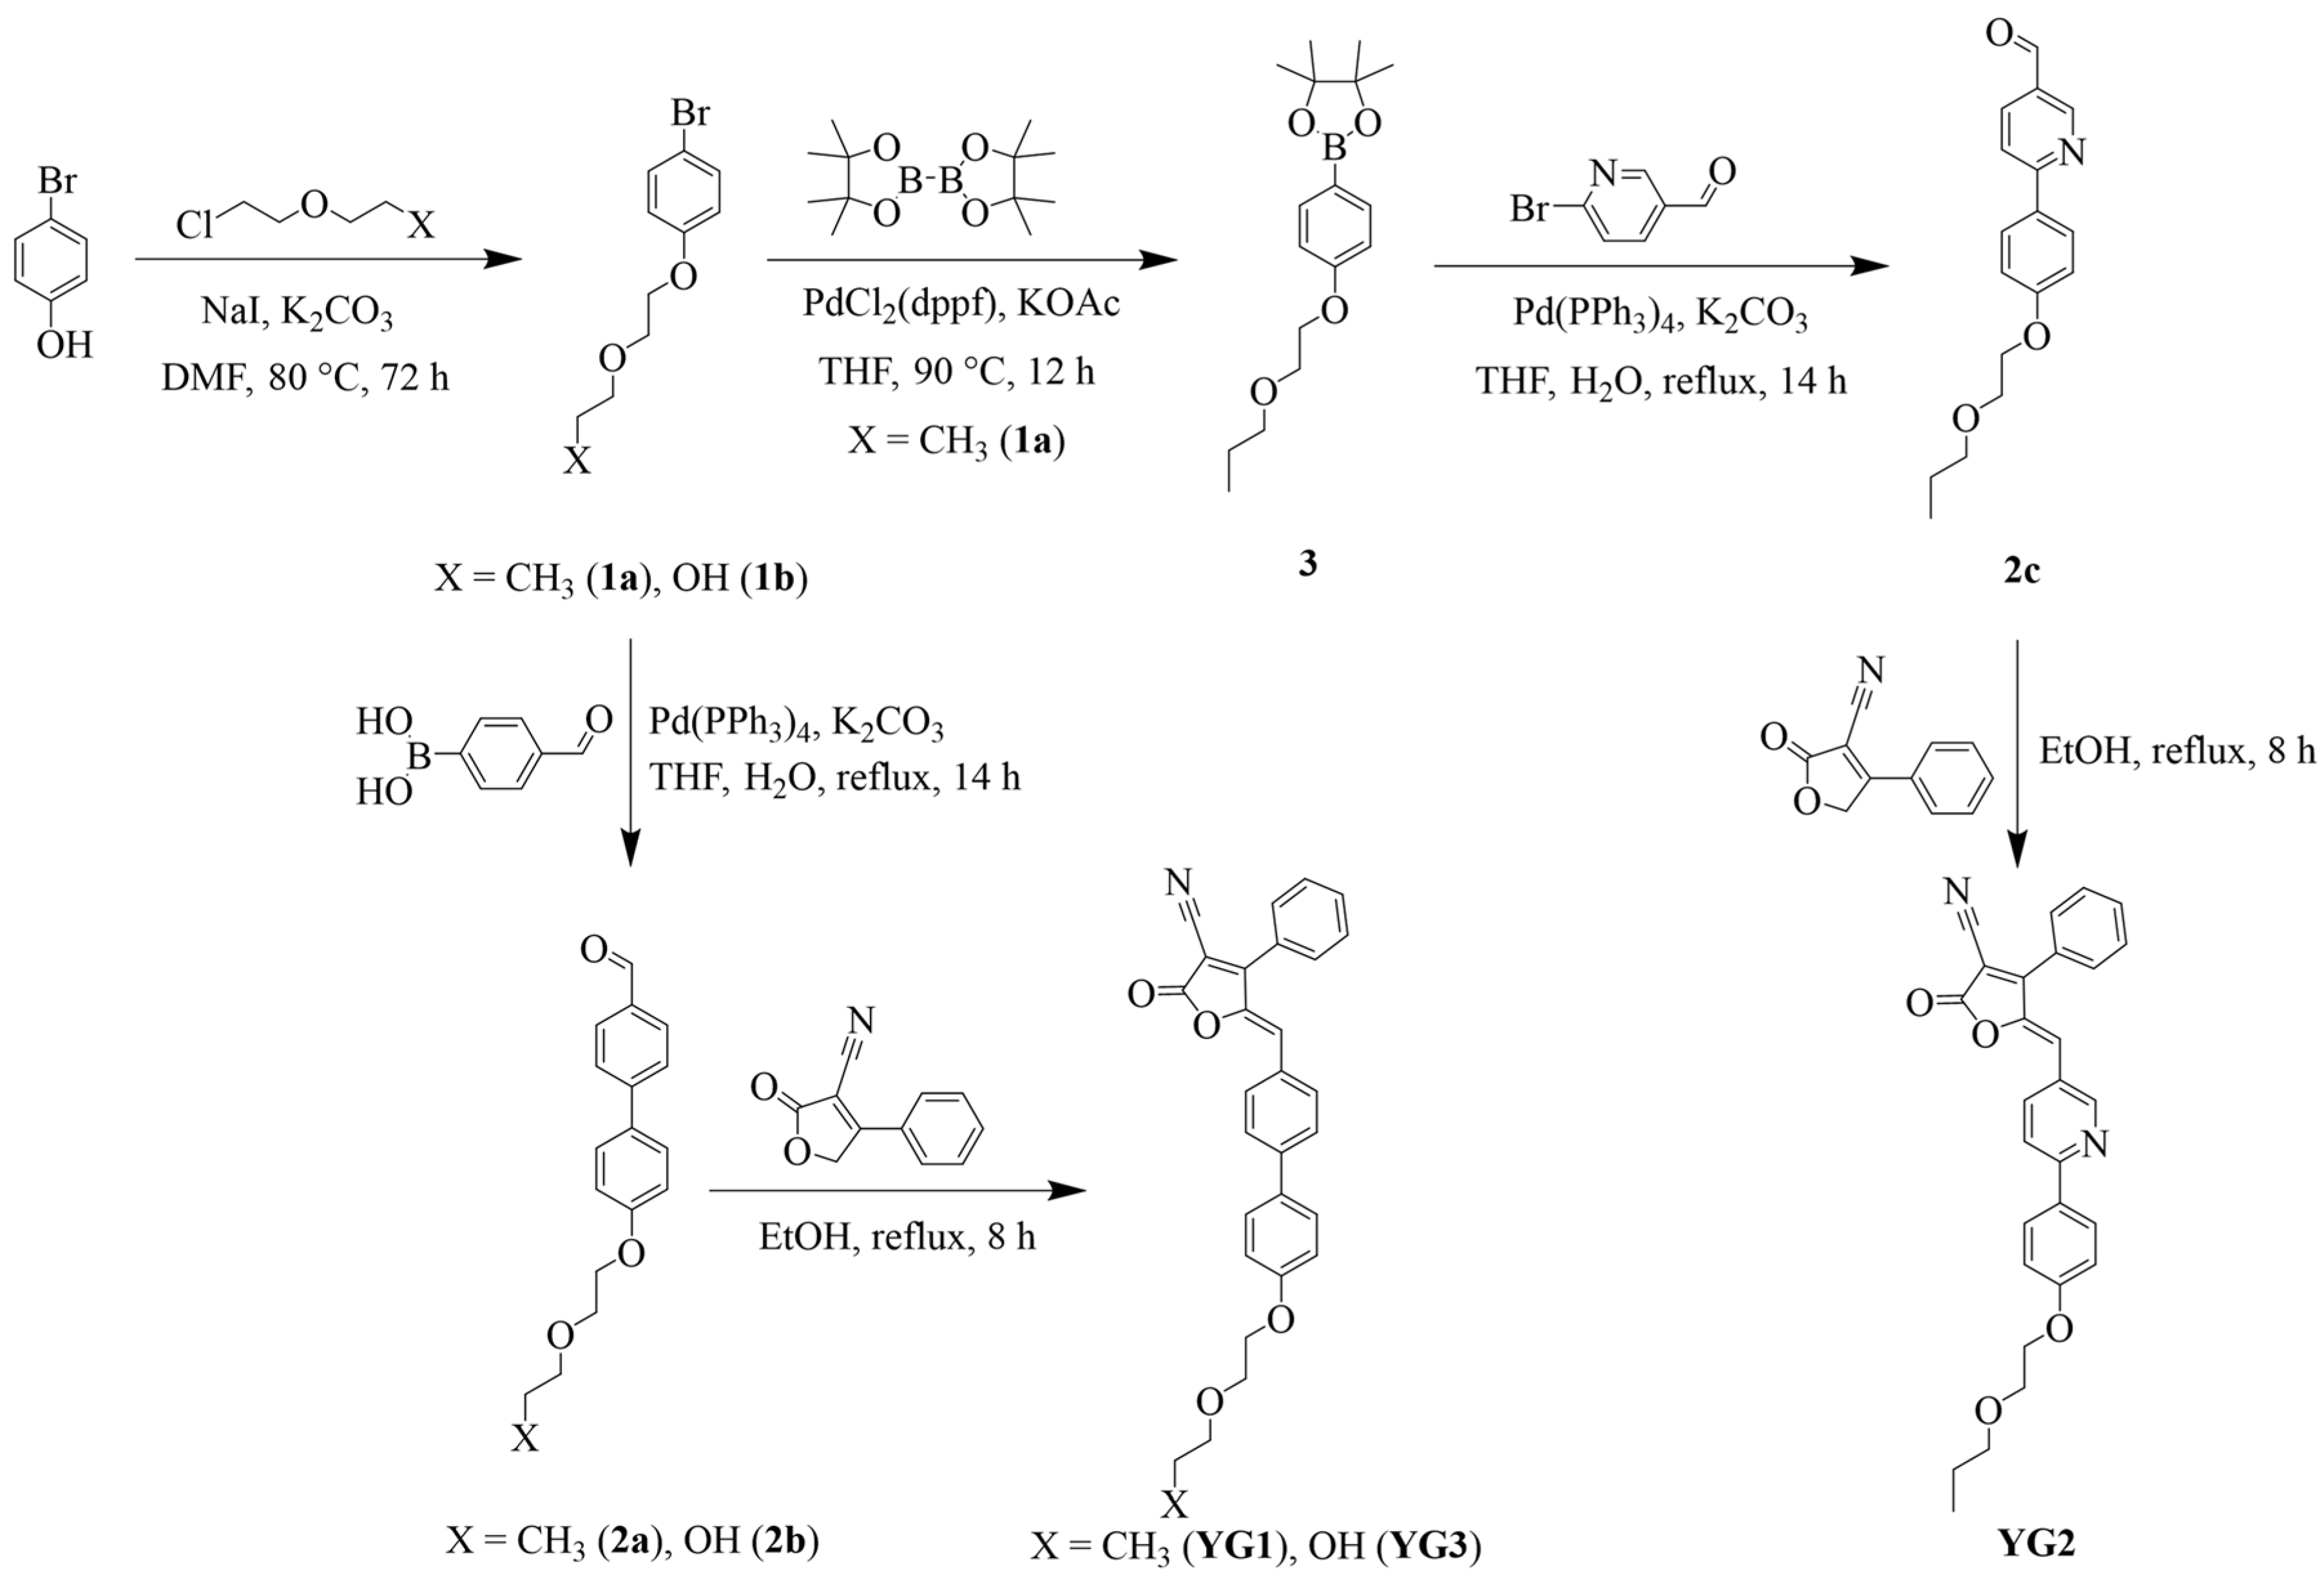
The synthetic routes to the donor–acceptor probes YG1, YG2 and YG3 are summarized in Scheme 1. The key intermediates 1-bromo-4-(2-propoxyethoxy)benzene, as well as the acceptor fragment 4-phenyl-2-oxo-2,5-dihydrofuran-3-carbonitrile, were prepared following established literature procedures [31,37]. A modular strategy was adopted to enable systematic tuning of the donor strength while maintaining a common π-bridge and acceptor unit. The aryl–pyridyl motifs were constructed via Suzuki–Miyaura cross-coupling, which proceeded smoothly under standard Pd(0) catalysis without requiring protection of the heteroaromatic or phenolic functionalities. This approach allows straightforward installation of electronically distinct donor groups, facilitating comparative structure–property analysis across the YG series [32,38]. Following donor assembly, the acceptor was introduced through a base-catalyzed Knoevenagel condensation between the donor aldehydes and the activated methylene group of the furanone–nitrile acceptor. The resulting conjugated double bond bridge plays a critical role in establishing long-range charge separation within the D–π–A framework and serves as a plausible reactive center for H2S, consistent with subsequent spectroscopic observations. The final probes YG1, YG2 and YG3 were obtained in isolated yields of 55%, 70% and 71%, respectively, after chromatographic purification. All compounds were fully characterized by 1H and 13C NMR spectroscopy and high-resolution mass spectrometry, confirming their molecular structures and high purity.
Scheme 1.
Synthetic pathway of the probes YG1, YG2 and YG3.
3.2. ICT Photophysics and Structure–Property Relationships in the YG Series
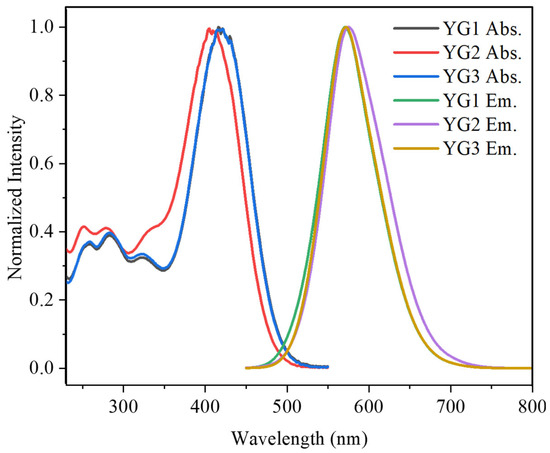
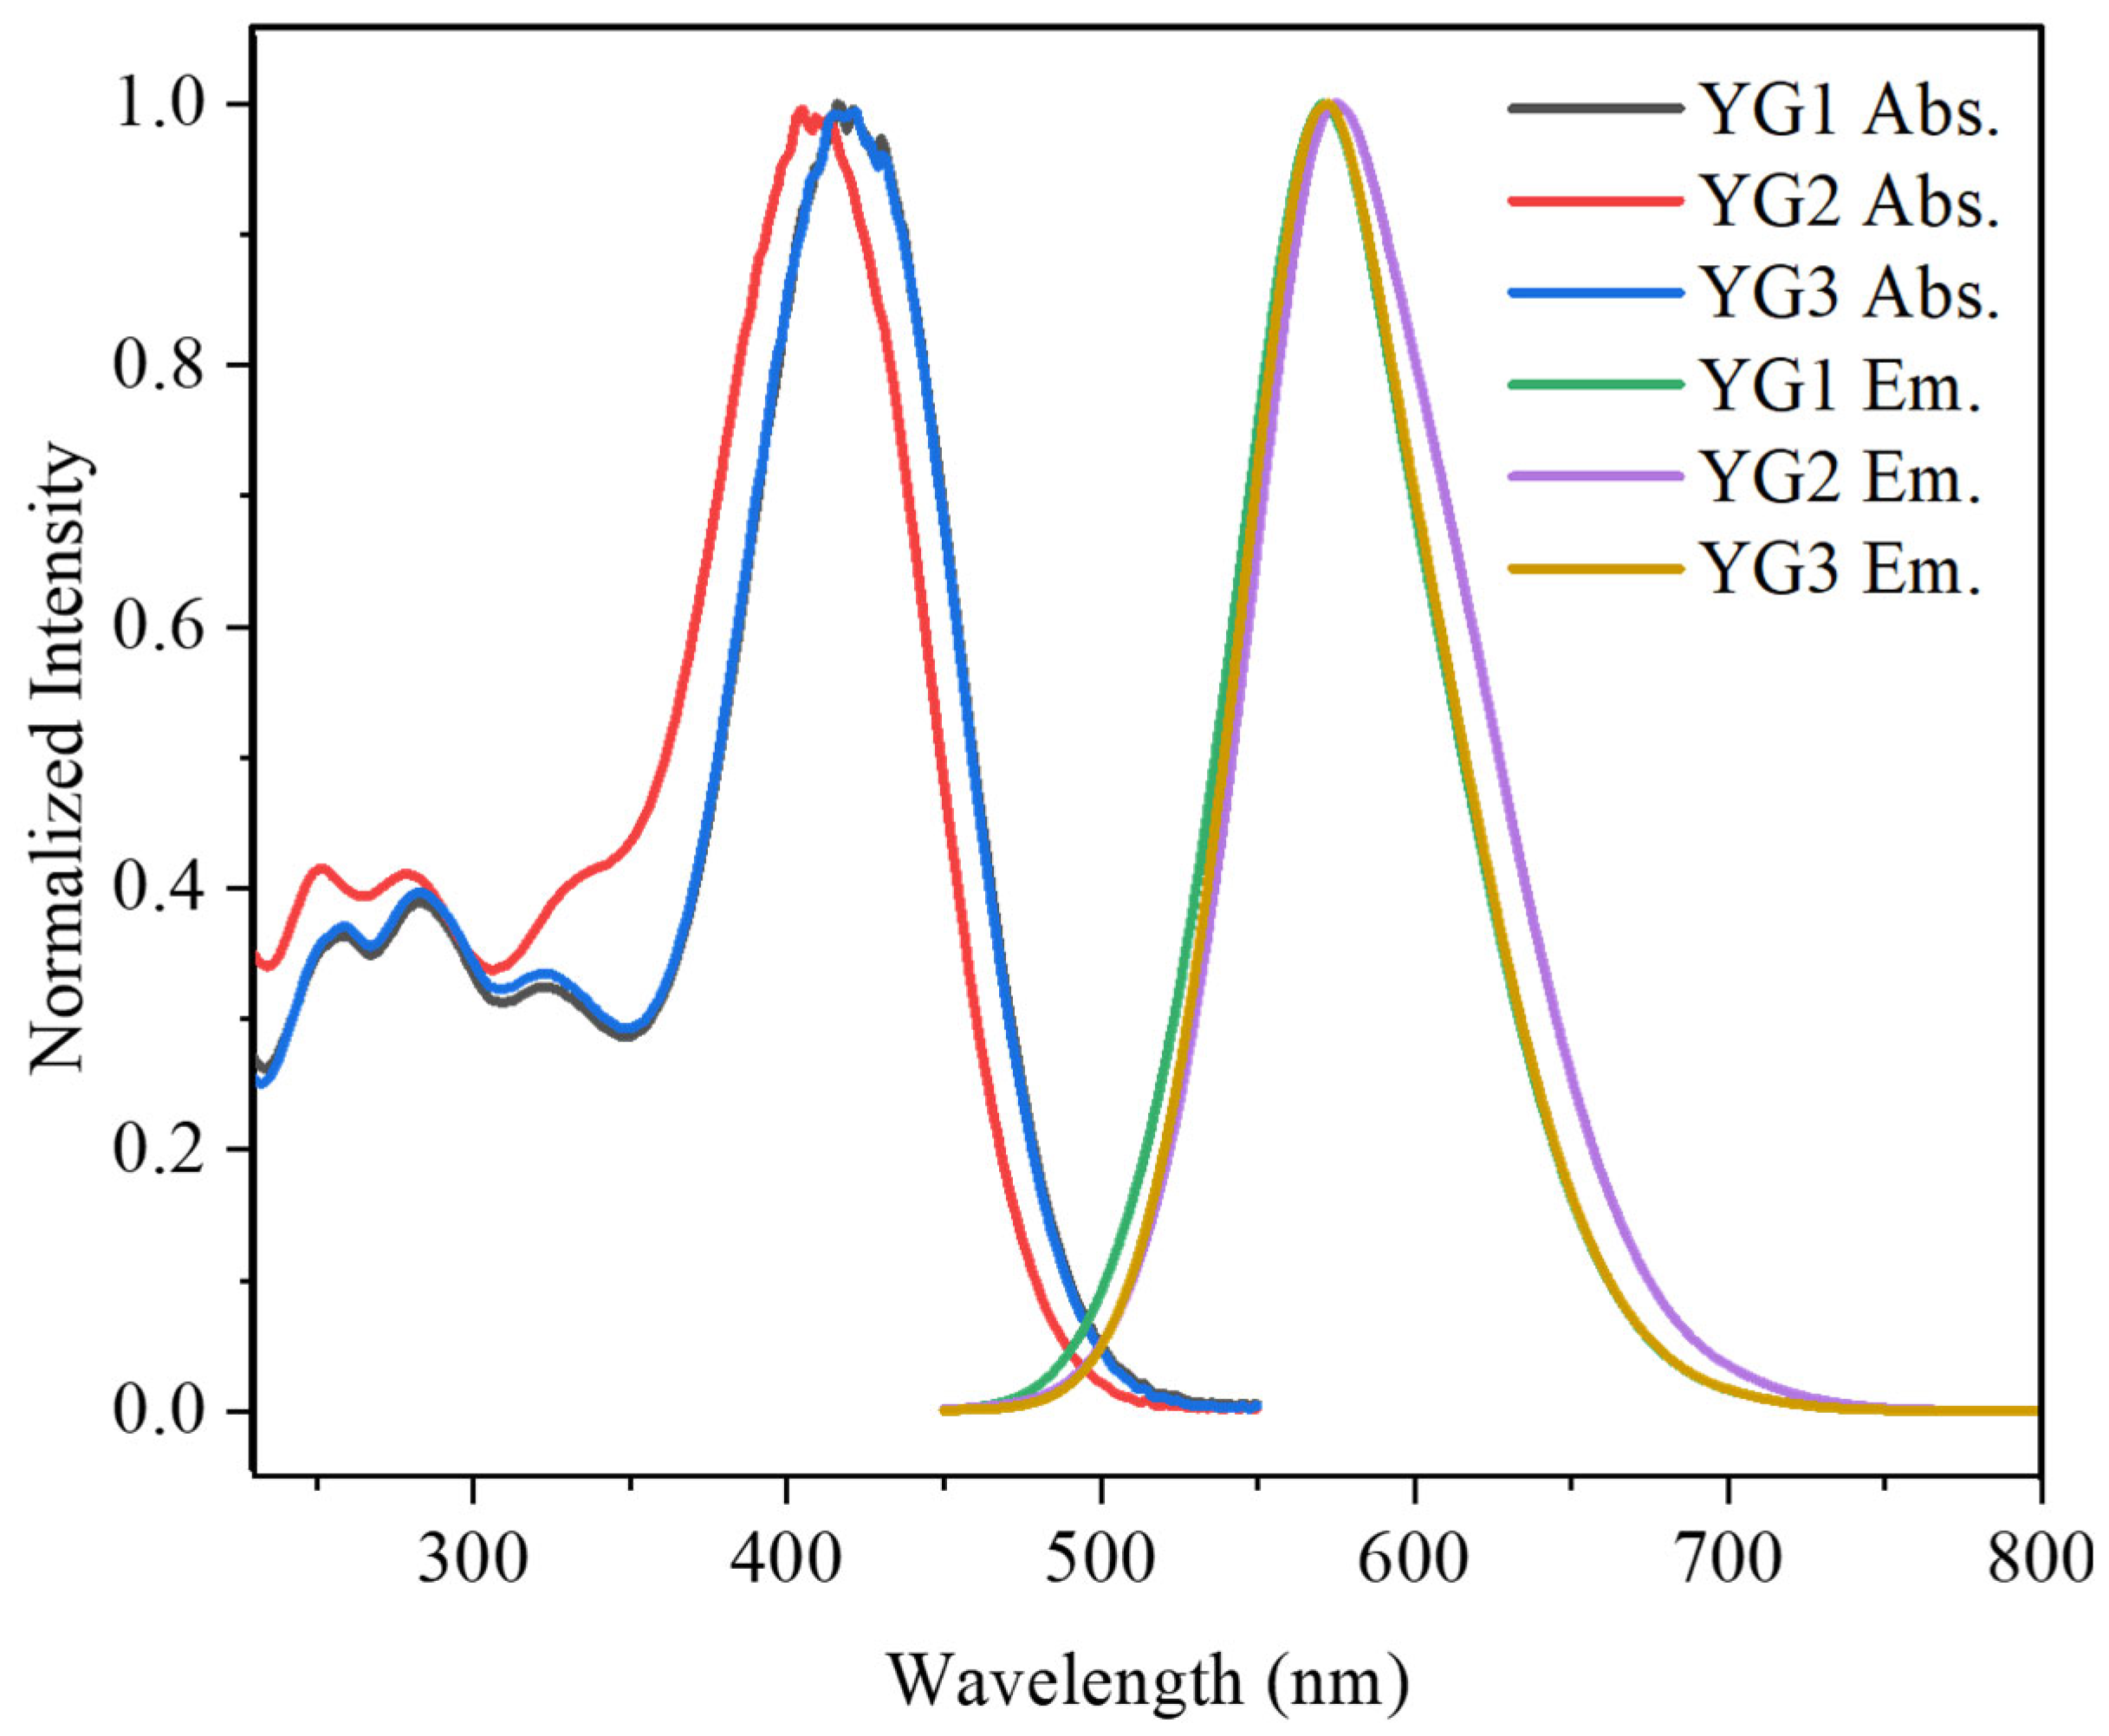
To evaluate how structural variations influence the electronic properties of the YG probes, UV–Vis absorption and fluorescence spectra of YG1, YG2, and YG3 (1.0 × 10⁻⁵ M in acetonitrile) were recorded under identical experimental conditions (Figure 1). All three molecules exhibit two characteristic absorption manifolds: (i) a high-energy band at 250–290 nm corresponding to LE π–π* transitions of the aromatic framework, and (ii) a broad lower-energy band spanning 350–500 nm assigned to intramolecular charge transfer (ICT), consistent with their dipolar push–pull conjugated architectures. Among the series, YG2 displays the most hypsochromically shifted ICT absorption maximum (≈409 nm), whereas YG1 and YG3 exhibit red-shifted ICT bands centered at ≈421 nm. This blue shift in YG2 can be attributed to the incorporation of a pyridyl unit within the donor segment, which is intrinsically π-electron deficient. Introduction of the pyridyl moiety weakens the electron-donating strength and donor–acceptor electronic coupling along the conjugated backbone, thereby reducing the charge-transfer character of the ICT transition and resulting in a higher-energy ICT absorption. In contrast, the relatively small variation (<15 nm) among the three probes indicates that modifications at the peripheral alkoxy side chain exert only a minor influence on the electronic structure of the conjugated push–pull core. This observation is consistent with ICT transitions being primarily governed by the aromatic donor segment, the conjugated C=C bridge, and the strongly electron-withdrawing furanone–nitrile acceptor, while the terminal alkyl side chain plays a secondary role. To further probe the influence of peripheral side-chain functionality, YG3 was deliberately designed to incorporate a terminal hydroxyl group at the end of the alkoxy chain. This modification was intended to enhance polarity and introduce potential intermolecular hydrogen-bonding interactions that might affect aggregation behavior or ICT characteristics. However, the nearly identical absorption and emission features observed for YG1 and YG3 indicate that introduction of a terminal –OH group does not significantly perturb the electronic structure or photophysical properties of the conjugated push–pull core. This comparison suggests that, within the present molecular framework, side-chain hydrogen bonding plays only a secondary role relative to the dominant conjugated architecture.
Figure 1.
Normalized UV–Vis absorption spectra (1.0 × 10⁻⁵ M) and fluorescence spectra (1.0 × 10⁻⁴ M) of YG1, YG2 and YG3 in acetonitrile (λex = 421 nm for YG1 and YG3; 409 nm for YG2).
In the fluorescence spectra obtained by excitation at the respective absorption maxima, all three probes exhibit emission bands centered near 570–580 nm, with YG2 showing a slightly red-shifted maximum (≈575 nm). Despite the noticeable differences in ICT absorption energies, the emission maxima converge in acetonitrile, indicating that the relaxed excited states of YG1–YG3 are energetically similar in this polar solvent. This behavior can be rationalized by considering that absorption probes the vertical S0→S1 transition prior to solvent relaxation, whereas fluorescence originates from fully relaxed excited states in which solvent reorganization effectively stabilizes charge-transfer character. The coexistence of a blue-shifted ICT absorption and a marginally red-shifted emission in YG2 therefore reflects a greater disparity between ground- and excited-state ICT energetics, a feature that foreshadows its enhanced sensitivity toward H2S-induced electronic perturbation discussed in the following section.
3.3. H2S-Induced ICT Suppression and Ratiometric Absorption Response
To investigate the sensing behavior of the YG probes toward hydrogen sulfide, UV–Vis spectra were collected for YG1, YG2 and YG3 (1.0 × 10⁻⁴ M in acetonitrile/water = 99:1, v/v) before and after addition of an equimolar H2S source (Na2S, 1.0 × 10⁻⁴ M). As shown in Figure S2, all three compounds undergo a characteristic decrease in the long-wavelength ICT band accompanied by a concurrent increase in the high-energy LE band, consistent with H2S-induced perturbation of the donor–acceptor electronic coupling and partial disruption of the ICT pathway. Among the series, YG2 exhibits the most pronounced ICT suppression. Upon exposure to H2S, the ICT absorption at ~409 nm decreases by ~42.4%, while the LE band (279 nm for YG2; 283 nm for YG1 and YG3) increases by ~22.3%, resulting in an overall ~120.8% enhancement in the Abs279/Abs409 absorbance ratio. By contrast, YG1 and YG3 show smaller changes (LE growth of ~14.9%, respectively), indicating comparatively weaker electronic modulation. These results indicate that YG2 possesses the highest susceptibility to ICT disruption, in line with its more strongly polarized D–π–A framework identified in Section 3.2.
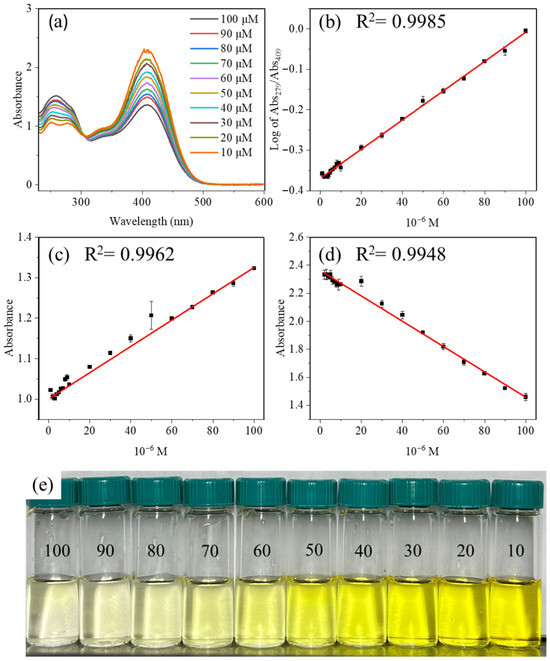
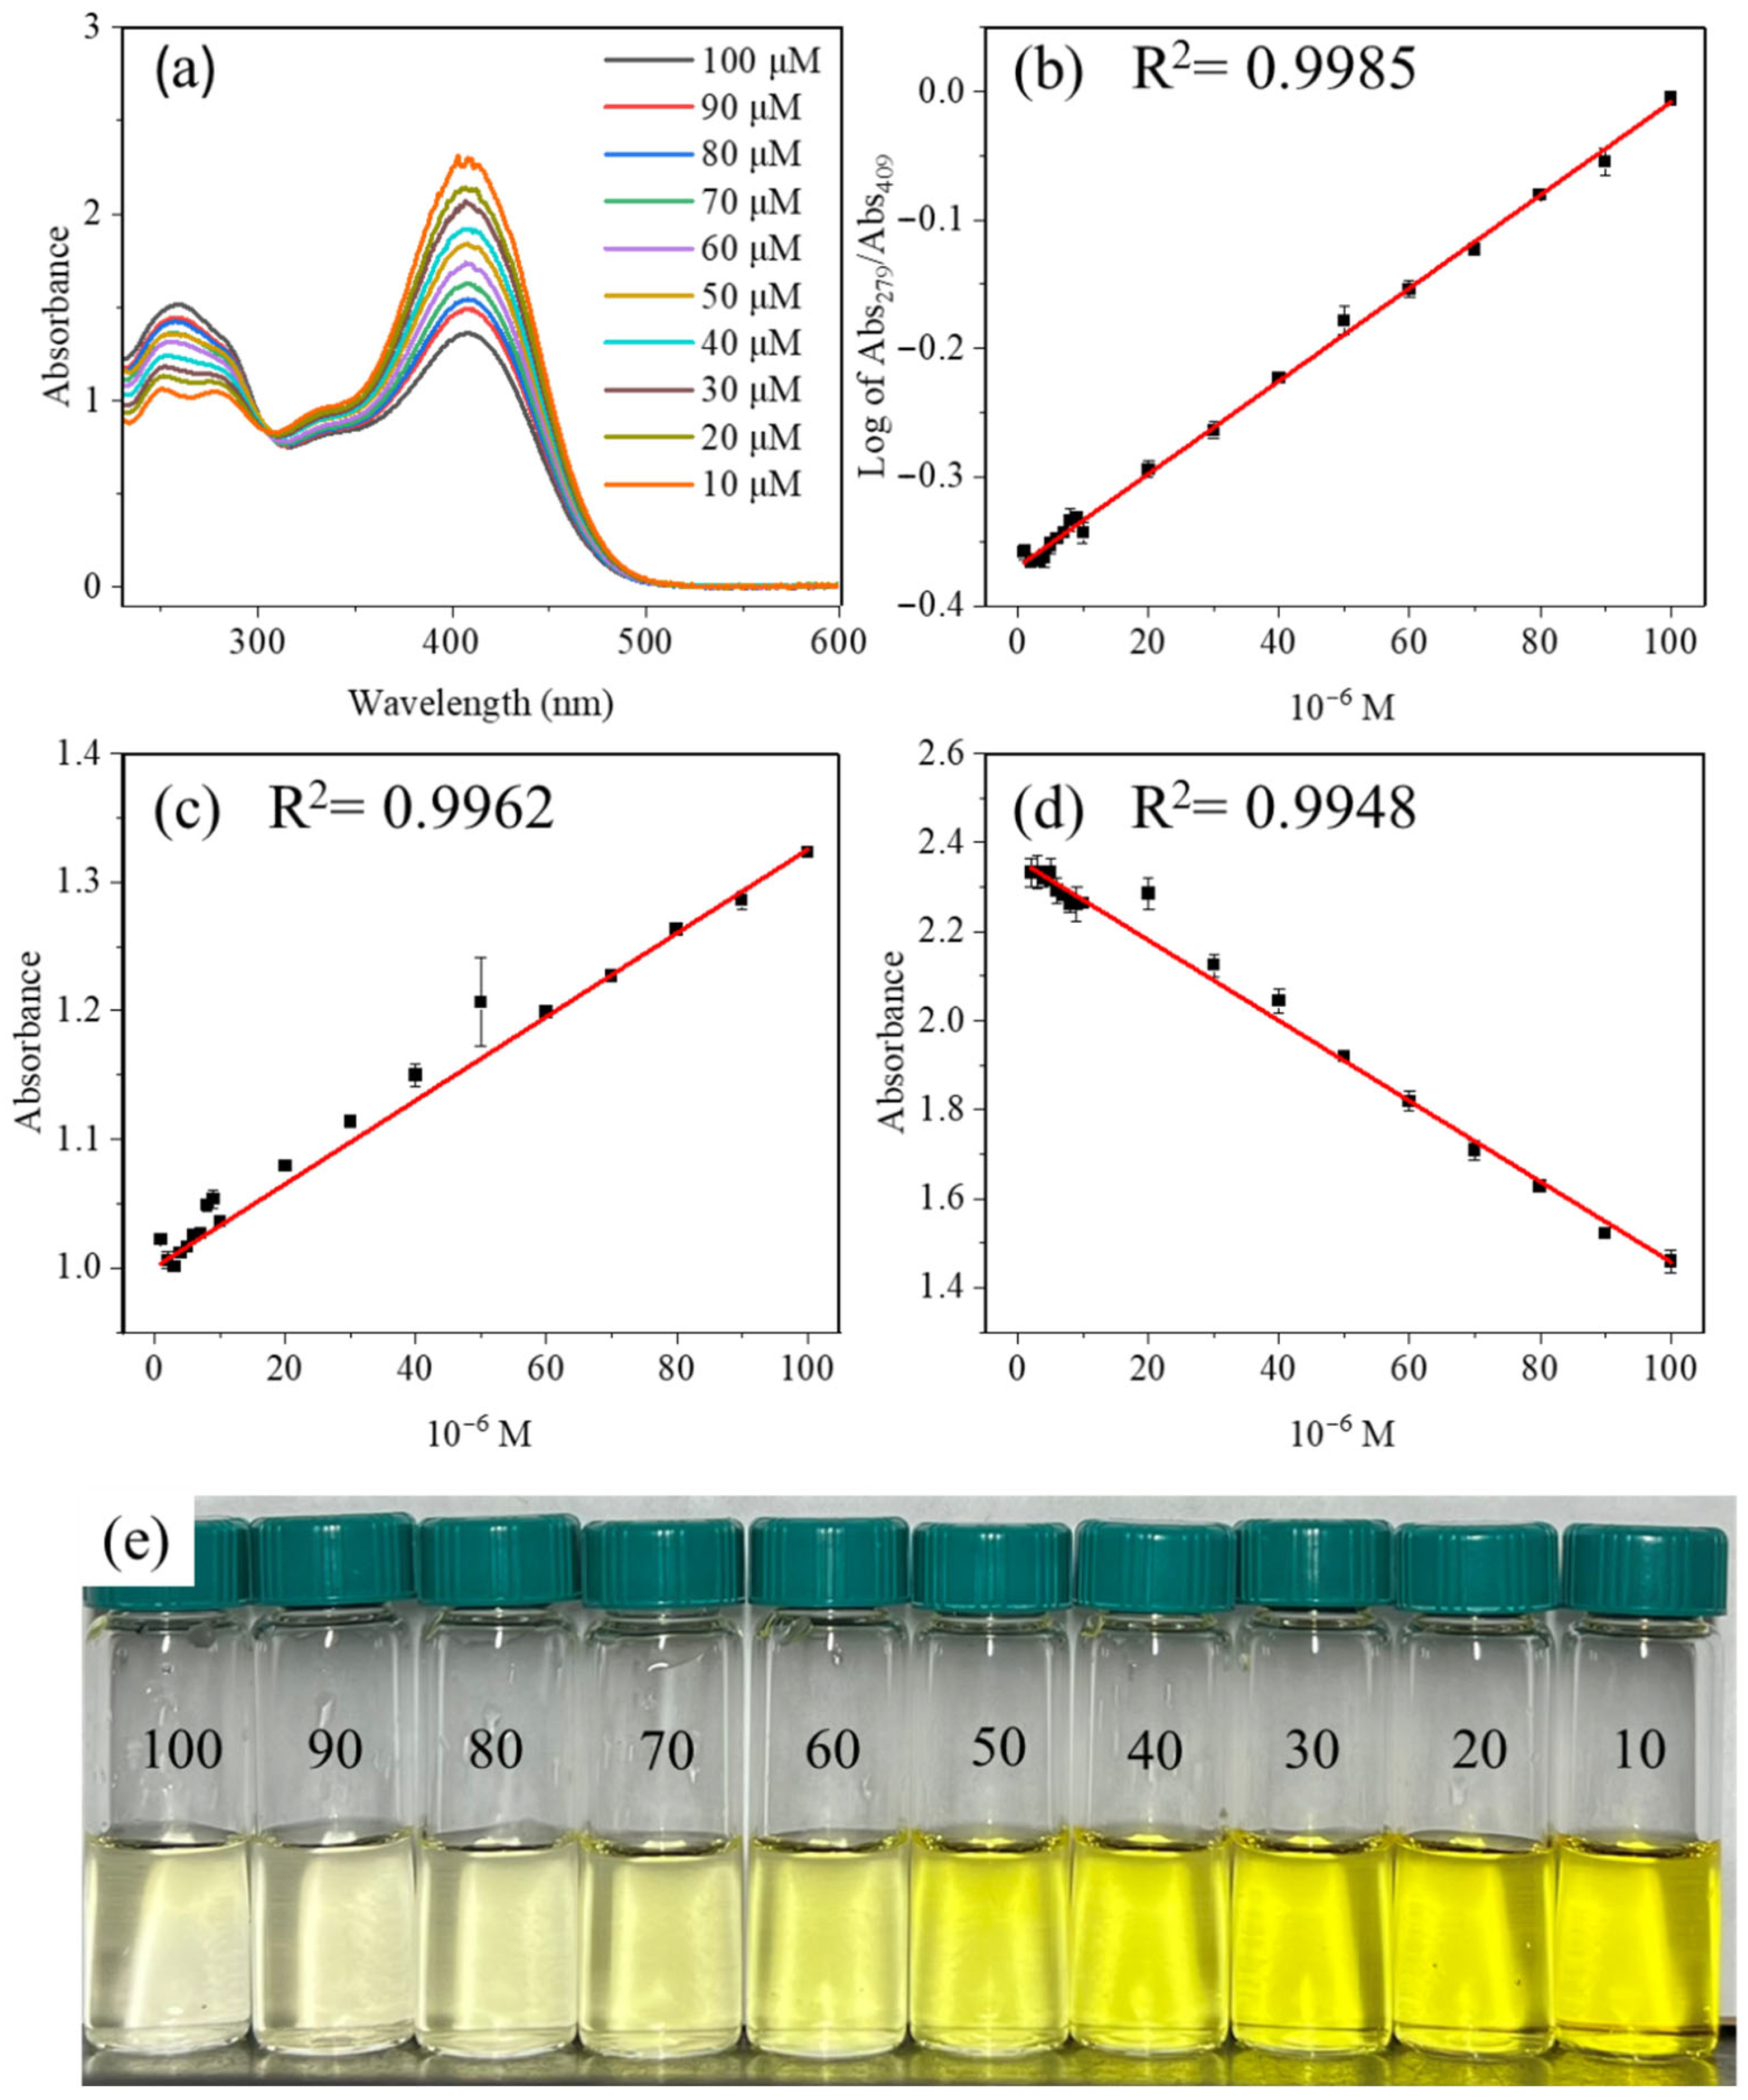
Given its superior responsiveness, YG2 was selected as the representative system for quantitative analysis. In addition, photographs of YG2 solutions after reaction with different concentrations of H2S (1.0 × 10⁻⁵–1.0 × 10⁻⁴ M) are provided in Figure 2e, visually demonstrating the appearance of the sensing system under the same conditions used for the UV–Vis measurements. Upon titration with 1.0 × 10⁻⁶–1.0 × 10⁻⁴ M H2S, the ICT band at 409 nm gradually diminishes while the LE band at 279 nm increases proportionally (Figure 2a), accompanied by a well-defined isosbestic point at 307 nm. The presence of an isosbestic point indicates a clean two-species interconversion, which is ideal for ratiometric sensing. To obtain a self-referenced analytical signal, the absorbance ratio Abs279/Abs409 was used, and its common logarithm log(Abs279/Abs409) displayed excellent linearity (R2 > 0.99) over a broad H2S range (Figure 2b). From the regression parameters, the limit of detection (LOD) and limit of quantification (LOQ), calculated as LOD = 3σ/slope and LOQ = 10σ/slope, were determined to be 8.27 × 10⁻⁷ M and 2.76 × 10⁻⁶ M, respectively. These values highlight the high sensitivity achieved through ratiometric normalization. For comparison, calibration curves constructed from single-channel absorbances at 279 nm (LE) and 409 nm (ICT) yield significantly poorer analytical performance, with LOD/LOQ values of 1.1 × 10⁻⁵/3.8 × 10−5 M (Figure 2c) and 8.8 × 10⁻⁶/2.9 × 10−5 M (Figure 2d), respectively. These thresholds are an order of magnitude higher than those of the ratiometric method. This comparison shows that ratio-based quantitation suppresses concentration fluctuations, light-path variability, scattering, and instrumental drift, giving rise to superior precision and robustness. Together, these results indicate YG2 as a highly responsive H2S probe, in which a well-defined ICT→LE transition provides a sensitive and self-calibrating ratiometric absorption readout suitable for quantitative sulfide detection.
Figure 2.
(a) UV–Vis absorption spectra of YG2 (1.0 × 10⁻⁴ M) upon addition of H2S (1.0 × 10⁻⁶–1.0 × 10⁻⁴ M). (b) Ratiometric calibration plot of log(Abs279/Abs409) as a function of H2S concentration. (c) Single-channel calibration at the LE band (279 nm) and (d) ICT band (409 nm) over the H2S concentration range of 1.0 × 10⁻⁶–1.0 × 10⁻⁴ M. (e) Photographs of YG2 solutions (1.0 × 10⁻⁴ M) after reaction with different concentrations of H2S (1.0 × 10⁻⁵–1.0 × 10⁻⁴ M), illustrating the visual appearance of the sensing system under identical conditions used for UV–Vis measurements.
3.4. Selectivity Toward H2S and Resistance to Anionic Interference
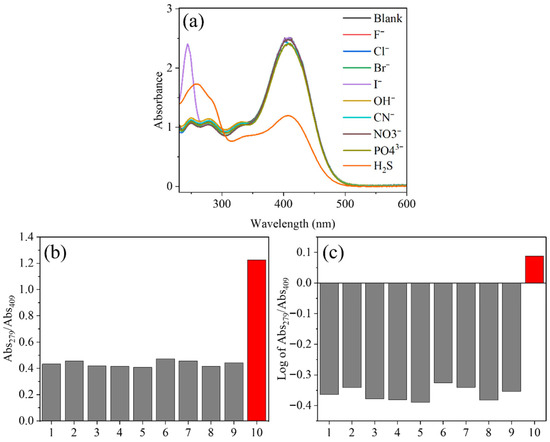
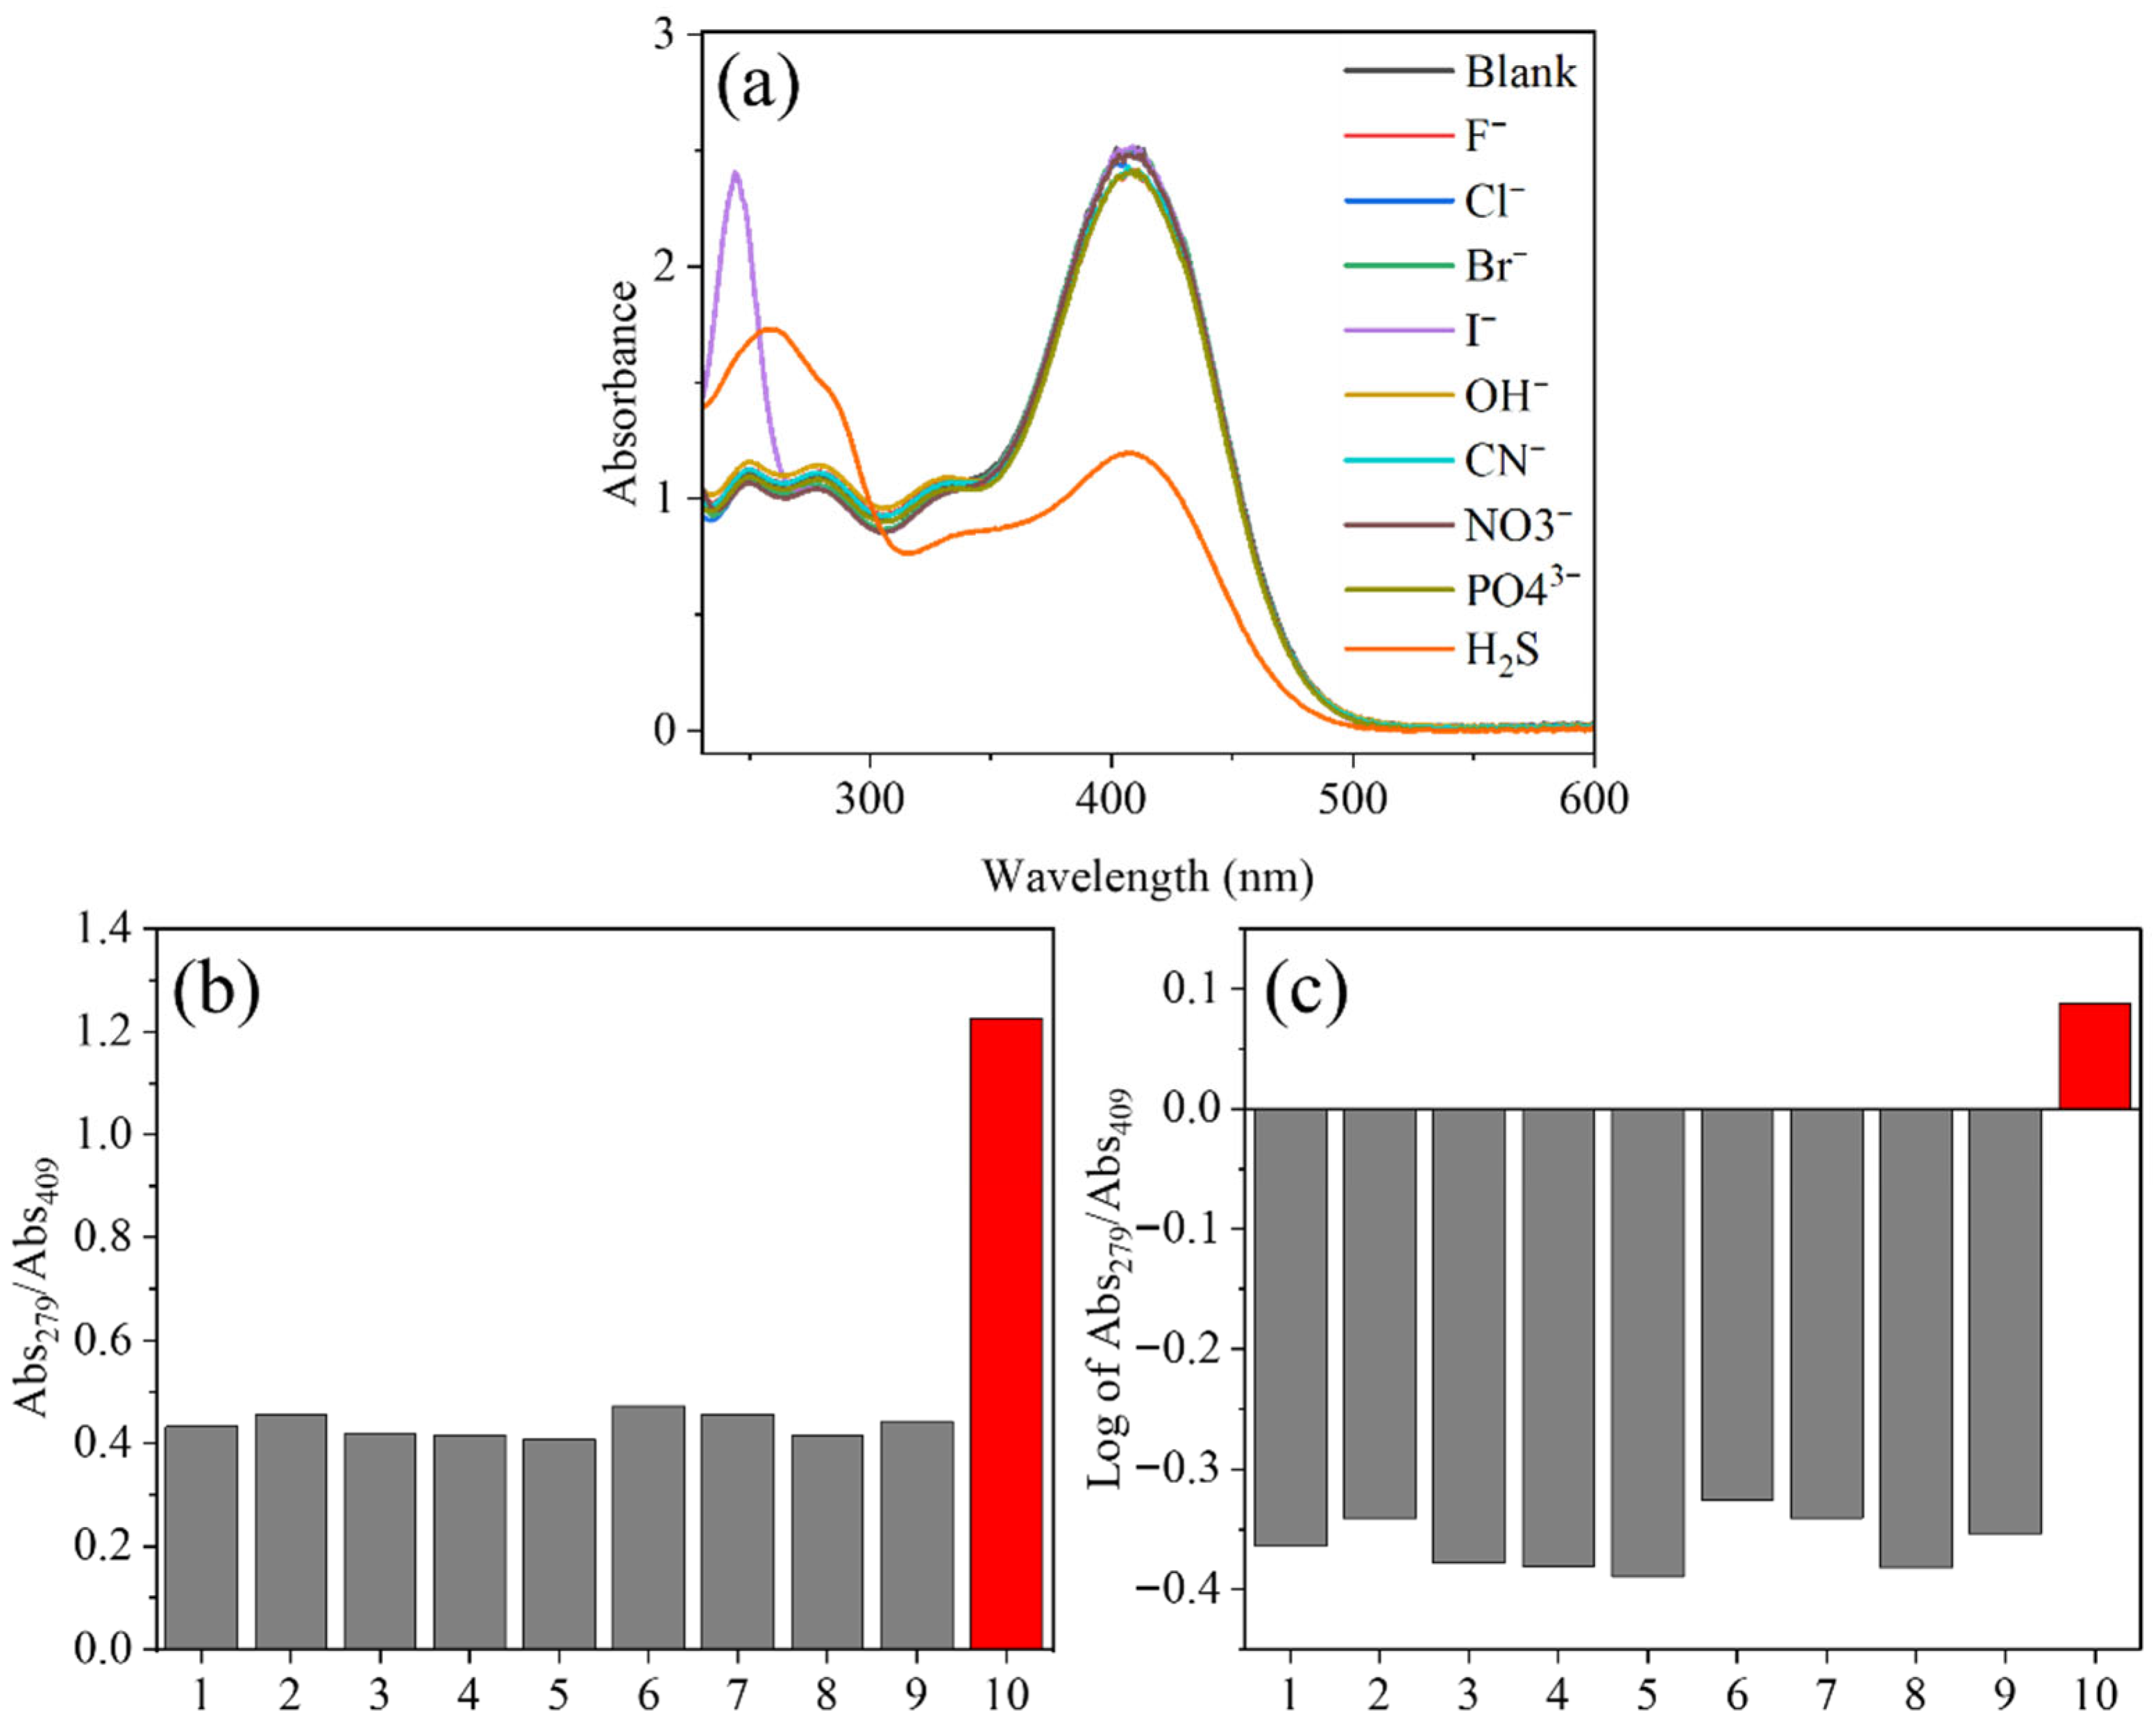
To examine the selectivity of the YG probes for hydrogen sulfide, YG2 was selected as the representative system because of its highest ICT responsiveness. In acetonitrile/water (99:1, v/v; [YG2] = 1.0 × 10⁻⁴ M), equimolar concentrations (1.0 × 10⁻⁴ M) of various common anions, including F−, Cl−, Br−, I−, OH−, CN−, NO3−, and PO43−, were introduced, and UV–Vis spectra were collected after gentle shaking for 10 s (Figure 3a). Selectivity was evaluated using the ratiometric parameters Abs279/Abs409 and log(Abs279/Abs409). As shown in Figure 3a, none of the competing anions produced any significant attenuation of the ICT band or enhancement of the LE band. Correspondingly, both Abs279/Abs409 (Figure 3b) and log(Abs279/Abs409) (Figure 3c) remained essentially invariant, fluctuating only within the baseline noise. In sharp contrast, H2S generated the characteristic spectral signature identified in Section 3.3, namely a pronounced decrease in the ICT band at 409 nm and a concomitant increase in the LE band at 279 nm. Therefore, a distinct elevation of the ratiometric signal was observed. This high selectivity can be rationalized by the intrinsic reactivity of the polarized conjugated double bond bridge, whose electron-deficient character renders it susceptible to nucleophilic interaction by HS-. Competing anions either lack sufficient nucleophilicity (e.g., NO3−, PO43−), possess hard-base character mismatched to the soft electrophilic site (e.g., F−, OH−), or cannot effectively perturb the π-conjugated electronics of the double bond linkage (e.g., Cl−, Br−, I−). As a result, only HS- produces the ICT suppression required to trigger the ratiometric ICT→LE transformation. Taken together, these results show that YG2 exhibits excellent selectivity toward H2S under single-interferent conditions, further validating the electronic specificity of the sensing mechanism.
Figure 3.
Selectivity of YG2 toward H2S. (a) UV–Vis absorption spectra of YG2 (1.0 × 10⁻⁴ M) after addition of H2S or various anions each 1.0 × 10⁻⁴ M. (b) Comparison of absorbance ratios Abs279/Abs409 under each condition. (c) Corresponding log(Abs279/Abs409) values. Grey bars represent the blank and competing anions, while the red bars correspond to H2S treatment. Conditions: ((1) Blank, (2) F−, (3) Cl−, (4) Br−, (5) I−, (6) OH−, (7) CN−, (8) NO3−, (9) PO43− (10) H2S).
3.5. Mechanistic Insights from 1H NMR Spectroscopy
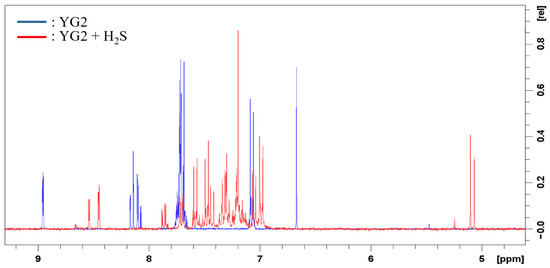
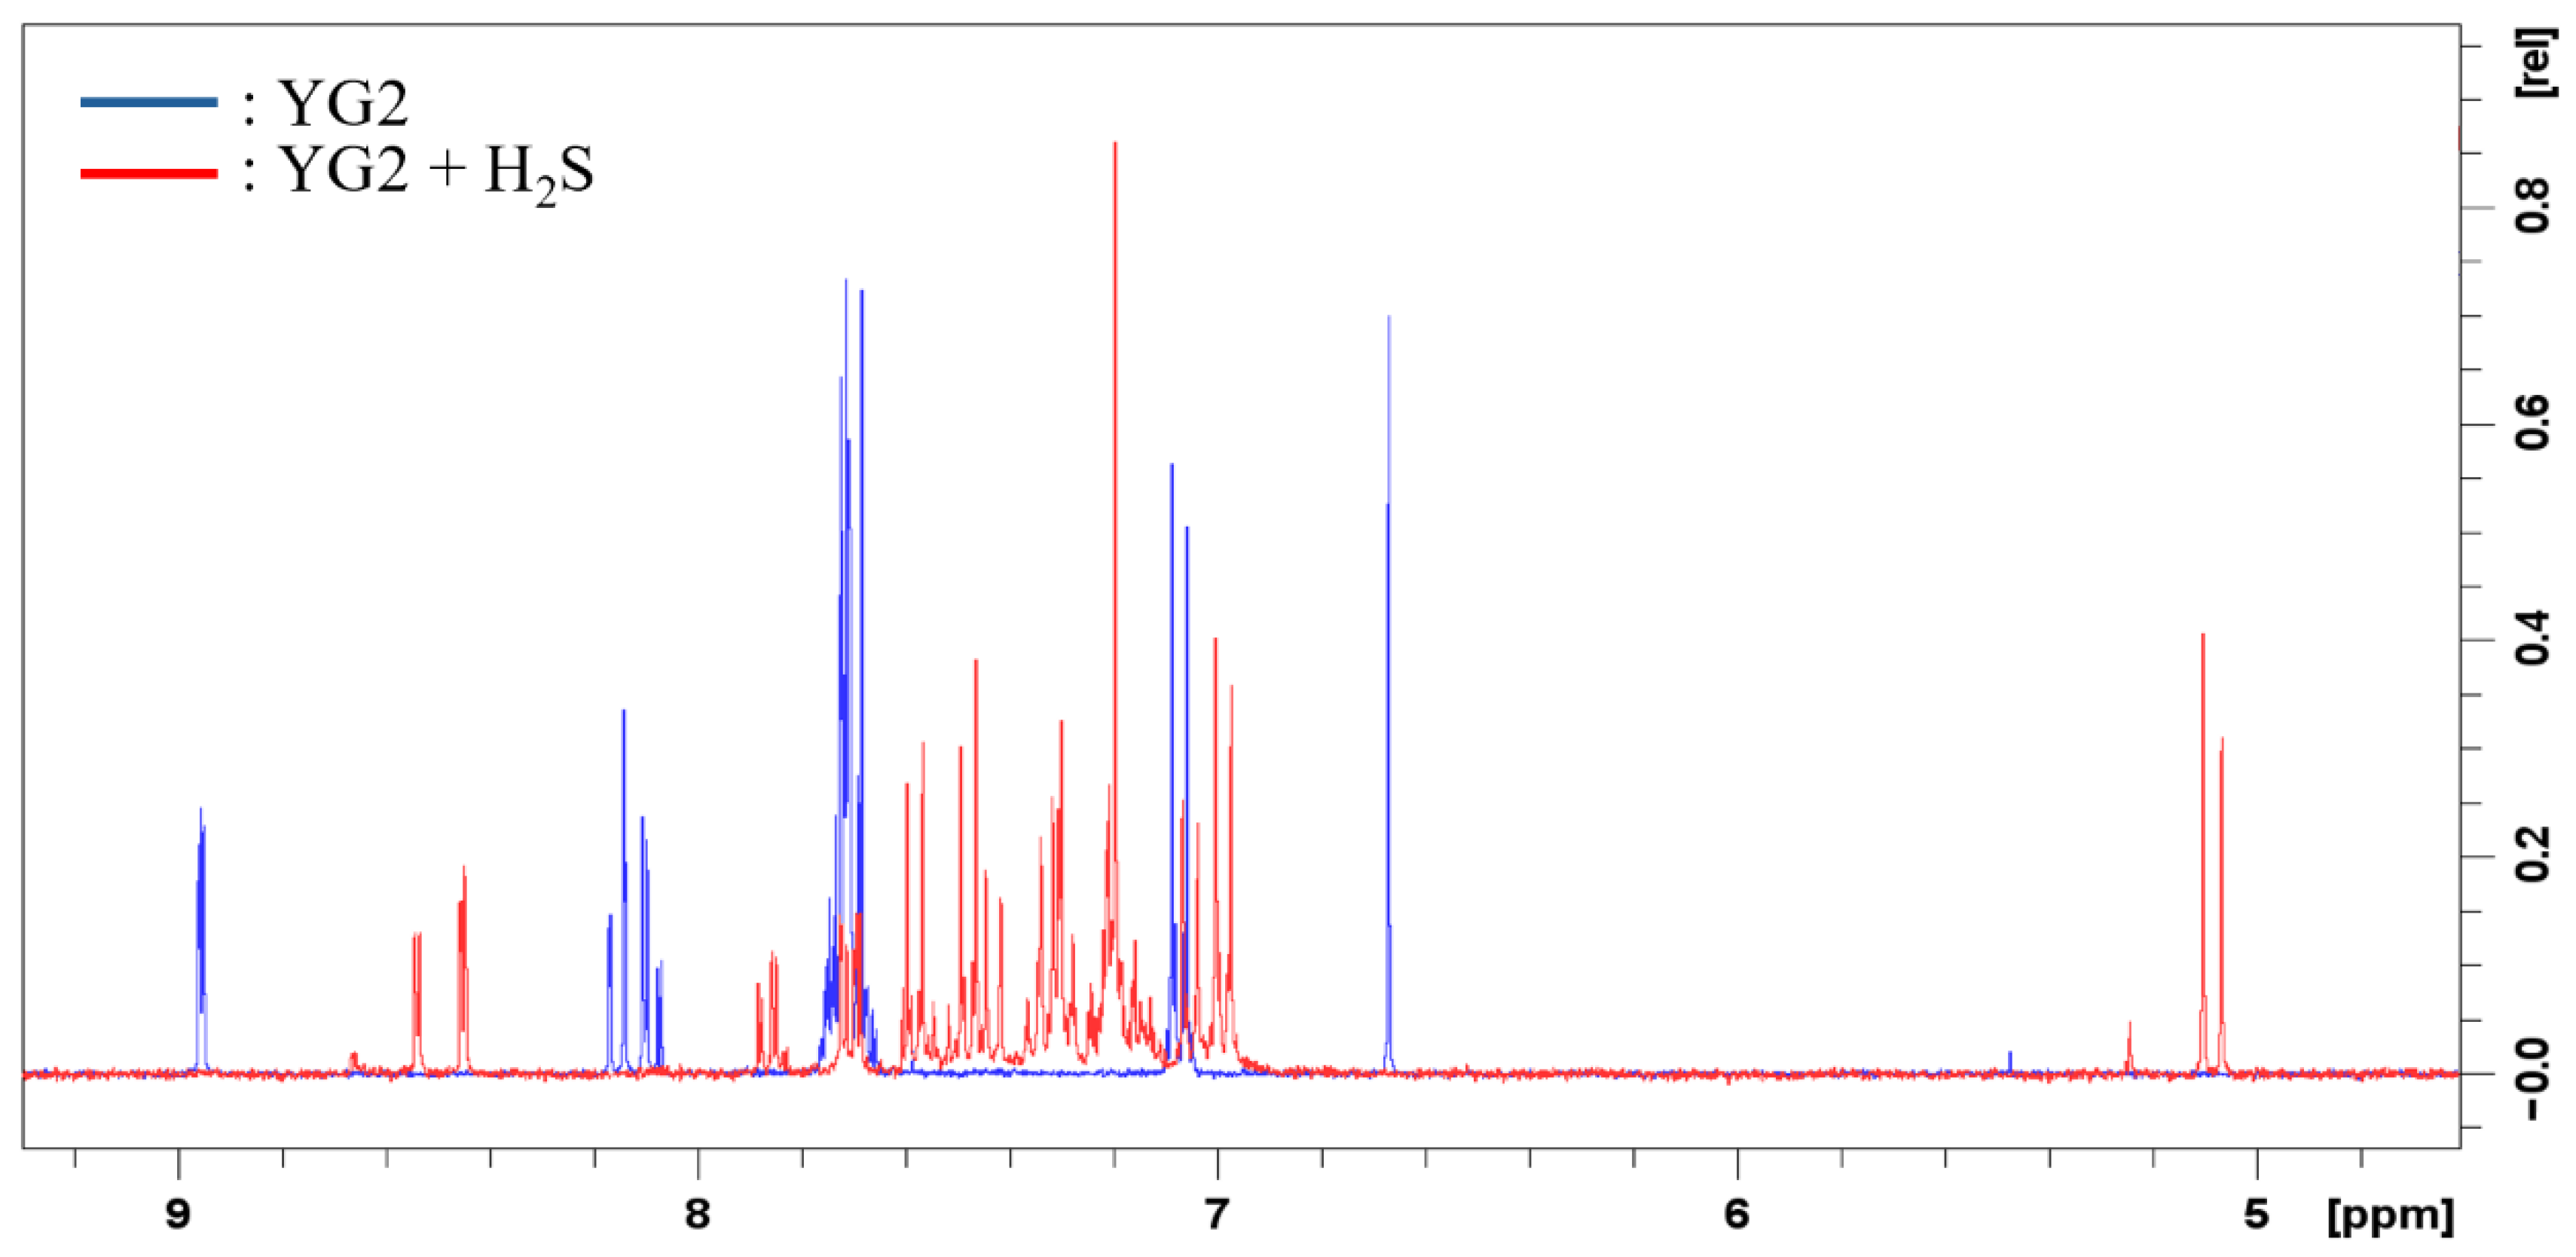
To further elucidate the structural changes induced by hydrogen sulfide, 1H NMR spectra of YG2 were collected before and after exposure to H2S (CD3CN; post-reaction CD3CN/H2O = 97:3, v/v). Prior to reaction, the conjugated double bond bridge displays a characteristic olefinic proton resonance at δ ≈ 6.6–6.8 ppm. Upon addition of H2S, this resonance disappears completely, and a new, sharp signal emerges at δ = 5.30–5.05 ppm. The chemical shift and narrow line shape of this new signal are consistent with a methine adjacent to a heteroatom (–CH–X, X = O/S), indicating direct involvement of the polarized C=C linkage upon exposure to HS− (and/or water). Such interaction at the electron-deficient double bond perturbs the conjugated D–π–A framework, converting the sp2 C=C linkage into a saturated or partially saturated center and consequently interrupting π-conjugation. This structural perturbation provides a molecular-level explanation for the observed suppression of the ICT band and the emergence of LE-dominated absorption upon exposure to H2S. That is, the suppression of the ICT band and emergence of LE-dominated absorption. In the aromatic region (δ ≈ 7.0–8.3 ppm), several changes in splitting patterns and local chemical shifts were detected (Figure 4), reflecting redistribution of electronic density and anisotropy. However, integration analysis shows that the total aromatic proton count remains unchanged, ruling out nucleophilic aromatic substitution or cleavage at the donor or acceptor aryl rings. Likewise, the alkyl region (δ ≈ 0.8–2.2 ppm) exhibits only small chemical-shift drifts with no new resonances, indicating that the peripheral alkyl substituents are not chemically involved in the reaction (Figure S3). Collectively, the 1H NMR results provide direct molecular-level evidence that H2S preferentially engages the conjugated double bond bridge, reducing its effective conjugation. This structural perturbation is fully consistent with the ICT→LE spectral conversion and ratiometric absorption behavior discussed previously. Consistent with the non-integer integrations and signal broadening observed in the post-reaction 1H NMR spectra, LC/MS analysis of the reacted solution reveals multiple chromatographic components (Figure S4), suggesting that the sensing process does not yield a single, well-defined molecular species under the employed conditions.
Figure 4.
Overlaid 1H NMR spectra of YG2 before and after reaction with H2S (CD3CN; post-reaction solvent CD3CN/H2O = 97:3, v/v).
3.6. Real-Sample Analysis and Matrix-Tolerance Evaluation
To assess the practical utility of YG2 for field-relevant H2S detection, five representative water matrices from New Taipei City were examined: Tamsui River water, seawater from Fisherman’s Wharf, two campus ponds at Tamkang University (Pond 1 and Pond 2), and laboratory tap water. Working probe solutions and standards were prepared using acetonitrile/water (99:1, v/v). Each matrix was spiked with H2S at three concentration levels, i.e., 85, 35, and 7 μM (equivalent to 2896.8, 1192.8, and 238.5 ppb), to simulate different contamination scenarios. Because environmental matrices vary substantially in ionic strength, dissolved organic content, turbidity, and background absorbance, quantitative analysis was performed using a three-point standard-addition method (7, 35, and 85 μM; n = 3) and the ratiometric parameter log(Abs279/Abs409). Linear calibration was obtained for all matrices (R2 ≥ 0.99), indicating that the ratiometric response is minimally affected by sample-to-sample optical variability (Figure S5).
The resulting spike recoveries and precision values are summarized in Table 1. Across all matrices and spike levels, recoveries ranged from 95.43% to 105.86%, with relative standard deviation (RSD) values between 0.56% and 9.58% (n = 3). Notably, even the high-ionic-strength seawater sample yielded recoveries close to 100%, demonstrating excellent tolerance to salinity and competing anions. At the lowest spike level (7 μM), where matrix effects are generally more pronounced, the ratiometric protocol continued to provide analytically acceptable precision. These results collectively confirm that YG2 enables reliable quantification of H2S in real aqueous systems. The strong matrix tolerance, combined with the intrinsic self-calibration capability of the ratiometric readout, highlights the suitability of YG2 for on-site monitoring, rapid screening, and field-deployable colorimetric sensing of H2S in diverse environmental waters.
Table 1.
Spike recovery and precision for H2S in real water samples (mean ± SD, n = 3). “Added/Detected” reported in μM/ppb (ppb ≡ μg·L−1, calculated using the molecular weight of H2S = 34.08 g·mol−1).
4. Conclusions
We developed a dipolar push–pull molecular platform that enables rapid and sensitive ratiometric UV–Vis detection of hydrogen sulfide. The probes undergo an H2S-triggered transformation in which interaction of HS- with a polarized conjugated C=C linkage perturbs the donor–acceptor electronic coupling, leading to suppression of the ICT transition. This process manifests spectroscopically as attenuation of the ICT band at 409 nm, enhancement of the LE band at 279 nm, and the appearance of a clean isosbestic point at 307 nm. Using YG2 as the representative system, the ratiometric parameter log(Abs279/Abs409) provides a linear response over a broad concentration range of 1.0 × 10⁻⁶–1.0 × 10⁻⁴ M H2S with a detection limit of 8.27 × 10⁻⁷ M. Notably, under identical measurement conditions, the ratiometric readout improves analytical sensitivity by approximately one order of magnitude relative to single-wavelength UV–Vis measurements, highlighting the advantage of dual-peak self-calibration. 1H NMR analysis further supports the proposed sensing mechanism by revealing disappearance of the olefinic proton signal and formation of a new methine resonance, consistent with HS− interaction at the conjugated C=C linkage. YG2 also exhibits excellent selectivity toward hydrogen sulfide, with common inorganic anions producing negligible spectral perturbation. In addition, real-sample analyses across five environmental water matrices yield recoveries of 95.43–105.86% with relative standard deviations of 0.56–9.58% (n = 3), confirming strong matrix tolerance and analytical robustness. Although the detection limit of the present probe is not the lowest reported among dye-based H2S chemosensors—many of which achieve limits in the 10−8–10−6 M range using fluorescence turn-on responses, external reference dyes, or multicomponent ratiometric assemblies—the present system uniquely enables self-calibrated dual-peak ratiometric UV–Vis sensing using a single push–pull dye molecule. This combination of ratiometric self-calibration, rapid response, clean dual-band separation, spectroscopic interpretability, and applicability to real water samples positions the present platform as a complementary and methodologically distinct alternative to existing dye-based hydrogen sulfide sensors.
Supplementary Materials
The following supporting information can be downloaded at: https://www.mdpi.com/article/10.3390/chemosensors14060125/s1, Scheme S1. Synthetic routes to 1a and 1b. Scheme S2. Synthetic routes to of 2a and 2b. Scheme S3. Synthetic routes to 3. Scheme S4. Synthesis route of 2c. Scheme S5. Synthesis routes to YG1 and YG3. Scheme S6. Synthesis route to YG2. Figure S1. UV–Vis absorption spectra of YG1, YG2, and YG3 (1.0 × 10⁻⁴ M in acetonitrile/water = 99:1, v/v) recorded before and after addition of H2S (1.0 × 10⁻⁴ M). Figure S2. Overlaid 1H NMR spectra of YG2 before and after reaction with H2S (CD3CN; post-reaction solvent CD3CN/H2O = 97:3, v/v), showing disappearance of the vinyl proton and formation of a new methine signal. Figure S3. Linear calibration plots of log(Abs279/Abs409) versus H2S concentration for YG2 (1.0 × 10⁻⁴ M) in different real water samples. Figure S4. Total ion chromatograms (TIC) of the post-reaction solution of YG2 after exposure to H2S recorded in (a) positive-ion and (b) negative-ion modes under identical LC/MS conditions. Both TIC traces display multiple chromatographic components without a single dominant molecular ion peak, indicating increased compositional complexity in the post-reaction mixture. These data are provided for qualitative comparison only. The reaction product(s) were not isolated, and no structural assignment or mechanistic conclusion is drawn from the LC/MS results. Figure S5. 1H NMR (300 MHz, CDCl3) of 1a. Figure S6. 1H NMR (300 MHz, CDCl3) of 1b. Figure S7. 1H NMR (300 MHz, CDCl3) of 2a. Figure S8. 1H NMR (300 MHz, CDCl3) of 2b. Figure S9. 1H NMR (300 MHz, CDCl3) of 3. Figure S10. 1H NMR (300 MHz, CDCl3) of 2c. Figure S11. 1H NMR (600 MHz, CDCl3) of YG1. Figure S12. 13C NMR (600 MHz, CDCl3) of YG1. Figure S13. 1H NMR (600 MHz, CDCl3) of YG2. Figure S14. 13C NMR (600 MHz, CDCl3) of YG2. Figure S15. 1H NMR (600 MHz, CDCl3) of YG3. Figure S16. 13C NMR (600 MHz, CDCl3) of YG3. Figure S17. HRMS of YG1. Figure S18. HR-MS of YG2. Figure S19. HR-MS of YG3.
Author Contributions
Conceptualization, C.-H.C. and Y.-C.T.; methodology, C.-H.C. and Y.-C.T.; validation, C.-H.C. and Y.-C.T.; formal analysis, Y.-C.T.; investigation, Y.-C.T.; resources, C.-H.C.; data curation, Y.-C.T.; writing—original draft preparation, Y.-C.T.; writing—review and editing, C.-H.C.; supervision, C.-H.C.; project administration, C.-H.C.; funding acquisition, C.-H.C. All authors have read and agreed to the published version of the manuscript.
Funding
This research was funded by National Science and Technology Council, Taiwan grant number NSTC 113-2113-M-032-002, 114-2113-M-032-002.
Institutional Review Board Statement
Not Applicable.
Informed Consent Statement
Not Applicable.
Data Availability Statement
The data presented in this study are available within the article and Supplementary Materials. Additional raw data supporting the findings of this study are available from the corresponding author upon reasonable request.
Acknowledgments
The authors are grateful to National Science and Technology Council, Taiwan, for financial support (Grant No. NSTC 113-2113-M-032-002, 114-2113-M-032-002).
Conflicts of Interest
The authors declare no conflict of interest.
References
- Dorman, D.C.; Brenneman, K.A.; Struve, M.F.; Miller, K.L.; James, R.A.; Marshall, M.W.; Foster, P.M.D. Fertility and developmental neurotoxicity effects of inhaled hydrogen sulfide in Sprague-Dawley rats. Neurotoxicol. Teratol. 2000, 22, 71–84. [Google Scholar] [CrossRef] [Scilit]
- Pandey, A.; Pandey, S. Hydrogen sulfide detection: Recent advancement and future perspectives toward fluorescence as a versatile biophysical method. Nitric Oxide 2025, 157, 34–45. [Google Scholar] [CrossRef] [Scilit]
- Ahmed, I.; Iqbal, S.; Khan, A.; Fatima, F.; Mahar, H.; Bhutto, R.A. Advances in fluorescent probes for hydrogen sulfide detection: Applications in food safety, environmental monitoring, and biological systems. Microchem. J. 2025, 215, 114188. [Google Scholar] [CrossRef] [Scilit]
- Maiti, S.; Mandal, B.; Sharma, M.; Mukherjee, S.; Das, A.K. A covalent organic polymer as an efficient chemosensor for highly selective H2S detection through proton conduction. Chem. Commun. 2020, 56, 9348–9351. [Google Scholar] [CrossRef] [Scilit]
- Beauchamp, R.O., Jr.; Bus, J.S.; Popp, J.A.; Boreiko, C.J.; Andjelkovich, D.A. A critical review of the literature on hydrogen sulfide toxicity. Crit. Rev. Toxicol. 1984, 13, 25–97. [Google Scholar] [CrossRef] [Scilit]
- Doujaiji, B.; Al-Tawfiq, J.A. Hydrogen sulfide exposure in an adult male. Ann. Saudi Med. 2010, 30, 76–80. [Google Scholar] [CrossRef] [Scilit] [PubMed]
- Sonobe, T.; Haouzi, P. Immediate and long-term outcome of acute H2S intoxication induced coma in unanesthetized rats: Effects of methylene blue. PLoS ONE 2015, 10, e0131340. [Google Scholar] [CrossRef] [Scilit] [PubMed]
- Quist, A.J.L.; Johnston, J.E. Respiratory and nervous system effects of a hydrogen sulfide crisis in Carson, California. Sci. Total Environ. 2024, 906, 167480. [Google Scholar] [CrossRef] [Scilit] [PubMed]
- Sawaya, A.; Regina, A.C.; Menezes, R.G. Hydrogen Sulfide Toxicity. In StatPearls; StatPearls Publishing: Treasure Island, FL, USA, 2024. Available online: https://www.ncbi.nlm.nih.gov/books/NBK559264/ (accessed on 10 January 2026).
- Rumbeiha, W.K.; Kim, D.S. Neurological Sequelae of Acute Hydrogen Sulfide Poisoning: A Literature Review, Controversies, and Knowledge Gaps. Neurol. Int. 2025, 17, 71. [Google Scholar] [CrossRef] [Scilit]
- Jain, S.K.; Bull, R.; Rains, J.L.; Kannan, K.; Limbaugh, M.C.; McMillan, J.M.; Ketkar, A.; Bourgeois, V.L. Low levels of hydrogen sulfide in the blood of diabetes patients and streptozotocin-treated rats causes vascular inflammation? Antioxid. Redox Signal. 2010, 12, 1333–1337. [Google Scholar] [CrossRef] [Scilit] [PubMed]
- Panagaki, T.; Randi, E.B.; Augsburger, F.; Szabo, C. Overproduction of H2S, generated by CBS, inhibits mitochondrial Complex IV and suppresses oxidative phosphorylation in Down syndrome. Proc. Natl. Acad. Sci. USA 2019, 116, 18769–18771. [Google Scholar] [CrossRef] [Scilit]
- Disbrow, E.; Stokes, K.Y.; Ledbetter, C.; Patterson, J.; Kelley, R.; Pardue, S.; Reekes, T.; Larmeu, L.; Batra, V.; Yuan, S.; et al. Plasma hydrogen sulfide: A biomarker of Alzheimer’s disease and related dementias. Alzheimer’s Dement. 2021, 17, 1391–1402. [Google Scholar] [CrossRef] [Scilit]
- Szabo, C. Hydrogen Sulfide, an Endogenous Stimulator of Mitochondrial Function in Cancer Cells. Cells 2021, 10, 220. [Google Scholar] [CrossRef] [Scilit] [PubMed]
- OSHA. Hydrogen Sulfide Hazards. Available online: https://www.osha.gov/SLTC/hydrogensulfide/hazards.html (accessed on 10 January 2026).
- Shang, Z.; Meng, Q.; Tian, D.; Wang, Y.; Zhang, Z.; Zhang, Z.; Zhang, R. Red-emitting fluorescent probe for hydrogen sulfide detection and its applications in food freshness determination and in vivo bioimaging. Food Chem. 2023, 427, 136701. [Google Scholar] [CrossRef] [Scilit]
- Fosnacht, K.G.; Pluth, M.D. Activity-Based Fluorescent Probes for Hydrogen Sulfide and Related Reactive Sulfur Species. Chem. Rev. 2024, 124, 4124–4257. [Google Scholar] [CrossRef] [Scilit]
- Tang, X.-H.; Zhang, H.-N.; Wang, W.-L.; Wang, Q.-M. An Aggregation-Induced Fluorescence Probe for Detection H2S and Its Application in Cell Imaging. Molecules 2024, 29, 2386. [Google Scholar] [CrossRef] [Scilit]
- Ghosh, P.; De, D.; Sahoo, P. Development of an assay for colorimetric and fluorometric detection of H2S. RSC Adv. 2024, 14, 25071. [Google Scholar] [CrossRef] [Scilit] [PubMed]
- Wu, Z.; Jiang, Y.; Lv, X.; Gao, W.; Bi, M.; Wu, Y. A novel xanthene-based colorimetric and fluorescent dual-channel near-infrared probe for detecting H2S. Microchem. J. 2025, 219, 116222. [Google Scholar] [CrossRef] [Scilit]
- Kulkarni, R.M.; Ranjana, M.; Ullal, N.; Sunil, D. A Versatile pH-Dependent Fluorometric, Colorimetric, and Electrochemical Sensor for H2S Monitoring in Water. J. Fluoresc. 2025, 35, 4861–4871. [Google Scholar] [CrossRef] [Scilit]
- Xiong, P.; Cheng, W.; Chen, X.; Niu, H. Research progress of hydrogen sulfide fluorescent probes targeting organelles. Talanta 2025, 281, 126869. [Google Scholar] [CrossRef] [Scilit] [PubMed]
- Yan, Y.; Ahmad, H.; Mazhar, M.; Wang, X.; Wang, H.; Chen, D.; Zeng, W.; Jiang, J.; Zhang, P.; Iqbal, M.S.; et al. BODIPY-based probes for hydrogen sulfide (H2S) detection: Bridging molecular design and biological function. TrAC Trends Anal. Chem. 2026, 194, 118513. [Google Scholar] [CrossRef] [Scilit]
- Fortibui, M.M.; Park, C.; Kim, N.Y.; Kim, T.H.; Lee, M.H. Dual-emissive detection of ATP and hypochlorite ion for monitoring inflammation-driven liver injury in vitro and in vivo. Anal. Chem. 2024, 96, 9408–9415. [Google Scholar] [CrossRef] [Scilit]
- Fortibui, M.M.; Yoon, S.A.; Yoo, S.Y.; Son, J.Y.; Lee, M.H. Advances in dual-sensing bioprobes for simultaneous monitoring ATP and various biological species. Coord. Chem. Rev. 2024, 510, 215800. [Google Scholar] [CrossRef] [Scilit]
- Dvorak, T.; Hernandez-Sandoval, H.; Cheku, S.; Mora Valencia González, M.; Borer, L.; Grieser, R.; Carlson, K.A.; Cao, H. Development of a Rapid-Response Fluorescent Probe for H2S: Mechanism Elucidation and Biological Applications. Biosensors 2025, 15, 174. [Google Scholar] [CrossRef] [Scilit]
- Ding, D.; Li, J.; Xu, L.; Wang, J.; Tan, D.; Lin, W. Development of an activatable hydrogen sulfide-specific two-photon fluorescent probe for bioimaging in an air pouch inflammation model. J. Mater. Chem. B 2022, 10, 4568–4574. [Google Scholar] [CrossRef] [Scilit]
- Kim, N.Y.; Lee, M.H. Self-correcting ratiometric fluorescence assay for H2S detection in live cells and releasing agents. Sens. Actuators B Chem. 2025, 422, 136567. [Google Scholar] [CrossRef] [Scilit]
- Vargas, A.P.; Gámez, F.; Roales, J.; Lopes-Costa, T.; Pedrosa, J.M. A paper-based ultrasensitive optical sensor for the selective detection of H2S vapors. Chemosensors 2021, 9, 40. [Google Scholar] [CrossRef] [Scilit]
- Ford, J.A., Jr.; Wilson, C.V.; Young, W.R. The preparation of 2(5H)-furanones and dyes derived from them. J. Org. Chem. 1967, 32, 173–179. [Google Scholar] [CrossRef] [Scilit]
- Moreno-Yruela, C.; Garín, J.; Orduna, J.; Franco, S.; Quintero, E.; Lopez Navarrete, J.T.; Diosdado, B.E.; Villacampa, B.; Casado, J.; Andreu, R. D–π–A compounds with tunable intramolecular charge transfer achieved by incorporation of butenolide nitriles as acceptor moieties. J. Org. Chem. 2015, 80, 12115–12128. [Google Scholar] [CrossRef] [Scilit] [PubMed]
- Zheng, Z.; Zhang, T.; Liu, H.; Chen, Y.; Kwok, R.T.K.; Ma, C.; Zhang, P.; Sung, H.H.Y.; Williams, I.D.; Lam, J.W.Y.; et al. Bright near-infrared aggregation-induced emission luminogens with strong two-photon absorption, excellent organelle specificity, and efficient photodynamic therapy potential. ACS Nano 2018, 12, 8145–8159. [Google Scholar] [CrossRef] [Scilit]
- Tejeda-Orusco, V.; Blais, M.; Cabanetos, C.; Blanchard, P.; Andreu, R.; Franco, S.; Orduna, J.; Diosdad, B.E. 4H-pyranylidene-based small push–pull chromophores: Synthesis, structure, electronic properties and photovoltaic evaluation. Dye. Pigm. 2020, 178, 108357. [Google Scholar] [CrossRef] [Scilit]
- Zhang, F.; Liu, Y.; Yang, B.; Wen, G.; Liu, B. Near-infrared AIEgens for lipid droplets imaging in Locusta migratoria corpus adiposum or trachea and its application in photodynamic therapy. Sens. Actuators B Chem. 2020, 322, 128589. [Google Scholar] [CrossRef] [Scilit]
- Sun, Z.; Liu, Y.; Guan, P.; Yang, B.; Liu, B. Near-infrared dual-functional AIEgens for lipid droplets imaging in multispecies and photodynamic therapy. Dye. Pigm. 2020, 181, 108584. [Google Scholar] [CrossRef] [Scilit]
- Liu, S.-F.; Hsieh, C.-H.; Thomas, K.R.J.; Chen, C.-H. Deep-red carbazole–furanonitrile emitters with linker-dependent planarity and aggregation-induced emission. J. Chin. Chem. Soc. 2025, 72, 1171–1182. [Google Scholar] [CrossRef] [Scilit]
- Seto, M.; Aramaki, Y.; Okawa, T.; Miyamoto, N.; Aikawa, K.; Kanzaki, N.; Niwa, S.-i.; Iizawa, Y.; Baba, M.; Shiraishi, M. Orally active CCR5 antagonists as anti-HIV-1 agents: Synthesis and biological activity of 1-benzothiepine 1,1-dioxide and 1-benzazepine derivatives containing a tertiary amine moiety. Chem. Pharm. Bull. 2004, 52, 577–590. [Google Scholar] [CrossRef] [Scilit] [PubMed]
- Roncali, J. Molecular Engineering of the Band Gapof p-Conjugated Systems: FacingTechnological Applications. Macromol. Rapid Commun. 2007, 28, 1761–1775. [Google Scholar] [CrossRef] [Scilit]

Disclaimer/Publisher’s Note: The statements, opinions and data contained in all publications are solely those of the individual author(s) and contributor(s) and not of MDPI and/or the editor(s). MDPI and/or the editor(s) disclaim responsibility for any injury to people or property resulting from any ideas, methods, instructions or products referred to in the content. |
© 2026 by the authors. Licensee MDPI, Basel, Switzerland. This article is an open access article distributed under the terms and conditions of the Creative Commons Attribution (CC BY) license.