Abstract
Human serum albumin (HSA), an endogenous protein, was employed in the synthesis of nanoparticles. The treatment of an HSA solution with ethanol and glutaraldehyde resulted in the formation of human serum albumin nanoparticles (HSA NPs), which exhibited a weak fluorescence emission peak at 515 nm upon excitation at 360 nm. Importantly, these synthesized HSA NPs displayed a pronounced fluorescence polarization (FP) signal under identical excitation and emission conditions. Furthermore, incubation of the HSA NPs with specific DNA aptamers targeting lysozyme and thrombin led to a significant decrease in the FP values. This reduction in FP was effectively reversed upon the addition of lysozyme and thrombin. Based on these observations, a label-free fluorescence polarization-based detection platform for lysozyme and thrombin was developed utilizing HSA NPs and a DNA aptamer system.
1. Introduction
Fluorescence polarization (FP) is an analytical method that leverages the relationship between molecular rotational behavior and the polarization characteristics of fluorescence emission []. This technique is widely applied across multiple fields, such as the study of molecular interactions, drug development, and immunoassays []. When fluorescently labeled molecules are excited with plane-polarized light, those exhibiting limited mobility emit fluorescence that preserves the original polarization orientation. In contrast, rapid molecular rotation during the excited state results in depolarization of the emitted fluorescence []. Specifically, fast rotational movements of fluorophores cause the polarization direction of the emitted light to become randomized, leading to a reduction in the FP value. The rotational speed of molecules is primarily determined by their volume. The FP value is determined by measuring fluorescence intensity at the vertical (Fv) and horizontal (Fh) axes, calculated using the following equation:
FP (mP) = 1000 × (Fv − G × Fh)/(Fv + G × Fh)
FP values are expressed in millipolarization units (mP), and G represents the G correction factor [,].
According to the principle of FP, fluorescently labeled small-molecule antigens compete with sample antigens for antibody-binding sites. The formation of antigen–antibody complexes leads to a reduction in molecular rotation, thereby causing an increase in the FP value. Similarly, fluorescently labeled DNA or RNA aptamers bind to their targets, which restricts molecular rotation and consequently elevates the FP value. These changes in FP value can be quantitatively monitored and utilized for the detection of proteins and molecules [,]. For example, Zhang et al. employed graphene oxide nanosheets to enhance the FP signal of carbon dot-labeled lactoferrin aptamers. Their study demonstrated the feasibility of detecting tear lactoferrin within a concentration range of 0.66–3.32 mg/mL based on the decrease in FP values []. Jia and colleagues investigated the FP alterations of aptamer-modified Ag10 nanoparticles and dye-labeled DNA sequences following the introduction of polychlorinated biphenyls []. Zhang et al. established an aptamer-based FP assay for the quantification of exosomes, enabling quantitative analysis within a concentration range of 5 × 10²–5 × 10⁵ particles per microliter for exosomes derived from cell lines []. So far, most reported FP assays rely on fluorescent probe labeled aptamers or antibody [,,,,,].
The labeling process not only increases the cost of synthesis but may also reduce the binding affinity to the target molecule. Therefore, the development of label-free FP detection technologies is critically important to enhance the practical applicability of FP methodologies. In 2025, Wang et al. first reported the amplification of FP signals using bovine serum albumin nanoparticles induced by manganese dioxide nanosheets and further demonstrated the FP-based detection of glucose and choline in the presence of glucose oxidase and choline oxidase, respectively []. Lysozyme (LYZ) exhibits strong antimicrobial activity by specifically hydrolyzing the β-1,4-glycosidic bonds within the peptidoglycan layer of bacterial cell walls [,]. Moreover, LYZ can interfere with viral replication by forming complexes with nucleic acids [,]. Thrombin (TBA), a serine protease, plays a pivotal role in fibrinogen degradation, platelet aggregation, and cellular repair processes [,,]. Both LYZ and TBA have been identified as important biomarkers for a variety of diseases.
In this study, human serum albumin (HSA) was used as the precursor material to prepare human serum albumin nanoparticles (HSA NPs), which exhibited a pronounced FP signal. The effects of various DNA aptamers, including an anti-LYZ sequence (DNA-1) and anti-TBA aptamers (DNA-2 and DNA-3) on the FP signal of HSA NPs, were systematically investigated. A marked reduction in the FP signal was observed upon incubation with these aptamers. Considering the established affinities of these aptamers for LYZ and TBA, the potential application of FP-based detection for these proteins was further examined by conjugating HSA NPs with the corresponding aptamers.
2. Materials and Methods
2.1. Materials
HSA, absolute ethyl alcohol, glutaraldehyde, LYZ, and TBA were purchased from Shanghai Macklin Biochemical Technology Co., Ltd. (Shanghai, China). DNA-1 sequence (5′-ATC AGG GCT AAA GAG TGC AGA GTT ACT TAG-3′), DNA-2 sequence (5′-AGT CCG TGG TAG GGC AGG TTG GGG TGA CT-3′), and DNA-3 sequence (5′-GGT TGG TGT GGT TGG-3′) were purchased from Beijing Dingguo Biological Reagent Company, (Beijing, China). All the reagents were of at least chemical grade. The resistivity of deionized water used in the experiment was not less than 18 MΩ·cm.
2.2. Preparation of HSA NPs
The preparation procedure was carried out in accordance with established protocols, with specific modifications as described in reference []. Initially, 120 mg of HSA powder was dissolved in 4 mL of deionized water. Subsequently, 8 mL of absolute ethanol was added dropwise to the HSA solution under continuous stirring for 15 min. Thereafter, 20 μL of a 50% (w/w) glutaraldehyde solution was rapidly introduced into the mixture, which was then stirred for an additional 6 h. The resulting HSA NPs precipitate was collected by centrifugation at 12,000 rpm for 15 min and redispersed in 12 mL of deionized water. This process was repeated twice, after which the collected HSA NPs precipitate was subjected to lyophilization. The purified HSA NPs powder was subsequently stored at −4 °C.
2.3. The Investigation of FP Changes in HSA NPs Incubated with DNA Sequences
The prepared DNA sequence solution was heated to 75 °C for 10 min and allowed to cool down on ice. The heating and cooling operations were used to minimize the potential misfolding of DNA sequences prior to incubation with the protein target.
A volume of 200 μL of HSA NPs solution at a concentration of 0.325 mg/mL, varying volumes of DNA sequence solution (25 μg/mL), and 1 mL of Tris-HCl buffer solution (pH 7.4, 10 mmol/L) containing 20 mM NaCl and 20 mM MgCl2 were combined in a centrifuge tube. The mixture was then diluted to a final volume of 2 mL with deionized water and subjected to continuous agitation for 20 min at ambient temperature. Subsequently, the FP values, expressed in mP, of the resulting solution were determined using an excitation wavelength of 360 nm and an emission wavelength of 515 nm. All fluorescent tests were performed on the same equipment fluorescence spectrophotometer, Cary Eclipse, and the G correction factor was set to 1.0.
2.4. The Effect of LYZ on HSA NPs/DNA-1 System
A volume of 200 μL of HSA NPs solution (0.325 mg/mL), 200 μL of DNA-1 solution (25 μg/mL), varying volumes of LYZ solution, and 1 mL of Tris-HCl buffer (pH 7.4, 10 mmol/L) containing 20 mM NaCl and 20 m MgCl2 were mixed in a centrifuge tube. The mixture was then diluted to a final volume of 2 mL with deionized water and subjected to continuous agitation for 20 min at ambient temperature. Subsequently, the FP values of the resulting solution were determined using an excitation wavelength of 360 nm and an emission wavelength of 515 nm.
2.5. The Effect of TBA on HSA NPs/DNA-2 System or HSA NPs/DNA-3
A volume of 200 μL of HSA NPs solution (0.325 mg/mL), 200 μL of DNA-2 or DNA-3 solution (25 μg/mL), varying volumes of TBA solution, and 1 mL of Tris-HCl buffer (pH 7.4, 10 mmol/L) containing 20 mM NaCl and 20 m MgCl2 were mixed in a centrifuge tube. The mixture was then diluted to a final volume of 2 mL with deionized water and subjected to continuous agitation for 20 min at ambient temperature. Subsequently, the FP values of the resulting solution were determined using an excitation wavelength of 360 nm and an emission wavelength of 515 nm.
3. Results and Discussions
The denaturation of HSA was performed in an alcohol–water mixture, followed by cross-linking via the addition of glutaraldehyde. Figure 1A illustrates that the synthesized HSA NPs exhibited a characteristic fluorescence emission peak at 515 nm, along with a broad absorption band ranging from 300 to 600 nm. The morphology and particle size of the HSA NPs were further characterized using transmission electron microscopy (TEM) and dynamic light scattering (DLS). As shown in Figure 1B,C, the HSA NPs appeared as aggregated spherical structures, with an average diameter of 182 nm as measured by DLS, and a zeta potential of −30.2 mV. Fourier transform infrared spectroscopy (FTIR) was utilized to investigate changes in functional groups. The FTIR spectra presented in Figure 1D for both native HSA and HSA NPs indicate a notable increase in the C–H stretching vibration at 2960 cm−1 and the Schiff base (C = N) at 1580 cm−1 in the HSA NPs.
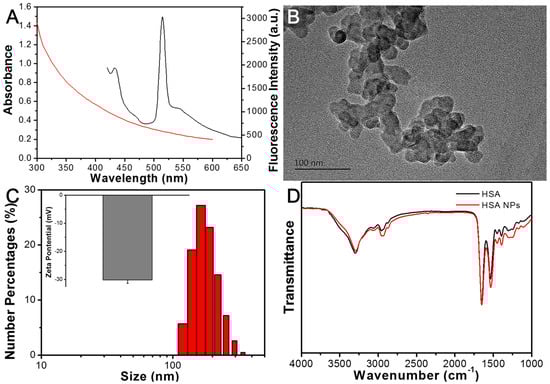
Figure 1.
(A) Fluorescence emission spectra (Black line) and UV-Vis absorption spectra (Red line) of HSA NPs. (B) TEM image of HSA NPs. (C) Hydrated size distribution and zeta potential measurement of HSA NPs. (D) FTIR of HSA and HSA NPs.
Figure 2A presents the series of fluorescence emission spectra of HSA NPs under varying excitation wavelengths. Notably, the emission peak exhibits a pronounced redshift from 515 nm to 634 nm as the excitation wavelength increases from 360 nm to 460 nm. Subsequently, the FP values of HSA NPs were examined across different excitation (EX) and emission (EM) wavelength pairs. As illustrated in Figure 2B, the FP values measured at various EX/EM pairs of 360 nm/515 nm, 380 nm/538 nm, 400 nm/574 nm, 420 nm/609 nm, 440 nm/621 nm, and 460 nm/634 nm remained consistently stable.
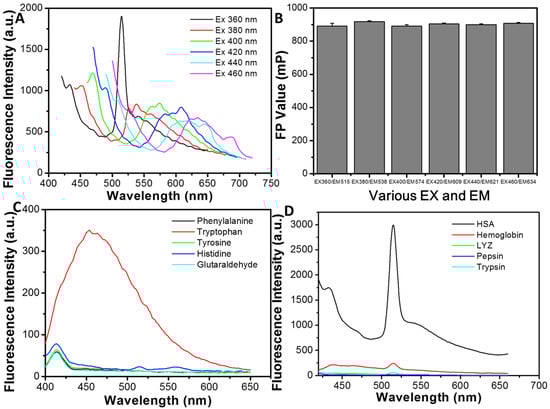
Figure 2.
(A) The fluorescence emission spectra of HSA NPs with different excitation wavelengths. (B) The FP values of HSA NPs measured at various excitation and emission wavelengths. (C) The fluorescence emission spectra under 360 nm excitation of the prepared solution with various amino acids as raw materials. (D) The fluorescence emission spectra under 360 nm excitation of the prepared solution with various proteins as raw materials.
To elucidate the origin of the fluorescence observed in HSA NPs, it is important to consider that intrinsic protein fluorescence typically arises from specific amino acid chromophores, including phenylalanine (Phe), tryptophan (Try), tyrosine (Tyr), and histidine (His) []. To investigate this, the synthesis of nanoparticles was conducted by substituting HSA powder with these individual amino acids. As depicted in Figure 2C, the solution prepared with His as the precursor exhibited weak fluorescence centered around 515 nm, resembling that of HSA NPs, whereas the solution derived from Try displayed a pronounced fluorescence around 450 nm. To exclude the potential contribution of glutaraldehyde, fluorescence emission spectra were also recorded for samples synthesized solely with glutaraldehyde. The results, shown in Figure 2C, indicate that glutaraldehyde alone produces negligible fluorescence within the 400–650 nm range. Collectively, these findings suggest that the fluorescence emission peak of HSA NPs primarily originates from the cross-linking interactions among glutaraldehyde, His, and Try residues.
Furthermore, various proteins, including hemoglobin, LYZ, pepsin, and trypsin, were used to replace HSA in the synthesis process of HSA NPs under identical conditions. As demonstrated in Figure 2D, hemoglobin, LYZ, pepsin, and trypsin as raw materials cannot produce remarkable fluorescence, and only HSA as raw material exhibited significant fluorescence emission around 515 nm.
As depicted in Figure 3A, the prepared HSA NPs solution exhibited a pronounced FP signal of approximately 886 mP, which remained stable over a duration of 30 min. In contrast, upon incubation with 2.5 μg/mL of DNA-1, the FP value of the HSA NPs solution demonstrated a gradual decline during the initial 15 min, after which it reached a plateau. Figure 3B,C illustrate the effects of varying DNA-1 concentrations on the HSA NPs. Specifically, Figure 3B reveals a significant decrease in the FP value of the HSA NPs solution as the concentration of DNA-1 increased from 0 to 2.5 μg/mL. Conversely, the fluorescence emission spectra of the HSA NPs solution exhibited minimal changes with increasing DNA-1 concentrations, as shown in Figure 3C. It is well established that the FP signal of a fluorogen is correlated with its molecular volume and vibrational dynamics. The hydrated particle size and zeta potential of the HSA NPs solution following incubation with 2.5 μg/mL DNA-1 (referred to as HSA NPs/DNA-1) are presented in Figure 4A. Notably, the mean particle size of the HSA NPs decreased to approximately 17 nm post-incubation, accompanied by an increase in surface negative charge to −47.3 mV. TEM was employed to confirm morphological changes subsequent to DNA-1 addition. As illustrated in Figure 4B, the HSA NPs retained a spherical and monodisperse morphology. Based on these observations, it is hypothesized that HSA NPs adsorb DNA-1 via hydrogen bonding and π–π stacking interactions [,]. This adsorption process substantially inhibits aggregation of HSA NPs, leading to a reduction in hydrated particle size and a decrease in FP values. Furthermore, fluorescence lifetime measurements of both HSA NPs and HSA NPs/DNA-1 were conducted. As shown in Figure 4C,D, the fluorescence decay curves can be modeled by the following equation:
I(t) = A1exp(−t/τ1) + A2exp(−t/τ2)
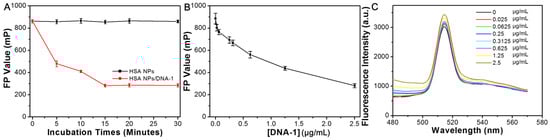
Figure 3.
(A) The FP value changes in HSA NPs and HSA NPs incubated with 2.5 μg/mL of DNA-1 in 30 min. (B) The FP value changes in HSA NPs incubated with different concentrations of DNA-1 for 20 min. (C) The fluorescence emission spectra of HSA NPs incubated with different concentrations of DNA-1 for 20 min.
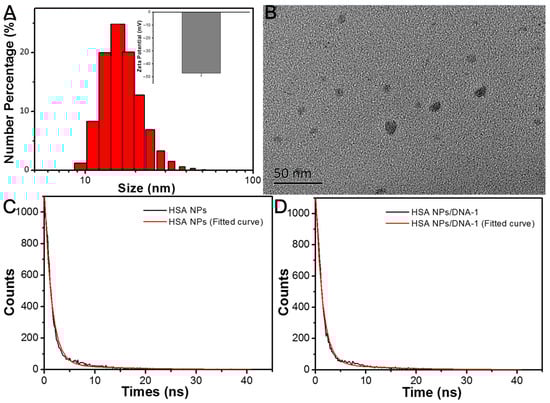
Figure 4.
(A) Hydrated size distribution and zeta potential measurement of HSA NPs/DNA-1. (B) TEM image of HSA NPs/DNA-1. (C) The fluorescence decay curve and fitted curve of HSA NPs with 360 nm excitation and 515 nm emission. (D) The fluorescence decay curve and fitted curve of HSA NPs/DNA-1 with 360 nm excitation and 515 nm emission.
The relevant parameters are offered in Table 1. The fluorescence lifetime τ of HSA NPs and HSA NPs/DNA-1 was 4.35 ns and 4.39 ns, calculated by the following equation:
τ = (A1τ12 + A2τ22)/(A1τ1 + A2τ2)

Table 1.
The relative parameters of the fitted curve of the HSA NP solution and the HSA NPs/DNA-1 solution.
Although the FP value of HSA NPs significantly decreased after the incubation with DNA-1, the fluorescence lifetime τ of HSA NPs changed little after the addition of DNA-1.
Previous research has established that the aptamer DNA-1 exhibits a strong affinity for LYZ, with a dissociation constant (Kd) of 31 nM, which is lower than that observed for serum albumin [,,,,]. Based on this finding, we posited that DNA-1 preferentially bound to LYZ rather than to HSA NPs. To investigate this hypothesis, we analyzed the FP changes in HSA NPs incubated with 2.5 μg/mL of DNA-1 in the presence of varying concentrations of LYZ. As depicted in Figure 5A, the FP values of the HSA NPs/DNA-1 complex increased progressively as the concentration of LYZ (CLyz) was raised from 0 to 8.334 μg/mL. Moreover, within the concentration range from 0 to 0.417 μg/mL, the relationship between the FP values and CLyz was accurately characterized by the following equations:
FP = 284.9 + 302.5 CLyz
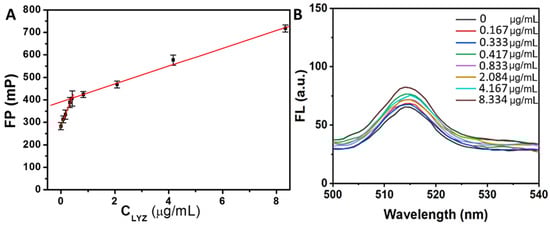
Figure 5.
(A) The correspondent relation between the FP value of HSA NPs/DNA-1 and LYZ in the range of 0–8.334 μg/mL. (B) The fluorescence emission spectra of HSA NPs/DNA-1 incubated with different LYZ concentrations for 20 min.
The fitting coefficient R2 was 0.997, and the detection limit for LYZ was 0.032 μg/mL according to the 3 s/k criterion. The relationship between the FP value and CLyz in the range of 0.417–8.334 μg/mL can be well described by the following equations:
FP = 391.3 + 39.6 CLyz
The fitting coefficient R2 was 0.998. Instead, the fluorescence emission spectra of HSA NPs/DNA-1 system changed a little with the increase of CLyz from 0 to 8.334 μg/mL (Figure 5B). Since DNA-1 can bind specifically to LYZ, the binding to LYZ weakens the binding to HSA NPs [,,]. These changes decreased the ability of DNA-1 to suppress HSA NPs aggregates. As a result, the remarkable enhancement of the FP value was observed along with the increase of CLyz from 0 to 0.417 μg/mL, and the FP value increase slowed down with the increase of CLyz from 0.417 to 8.334 μg/mL, as most DNA-1 had been adsorbed on LYZ []. The above results demonstrated the feasibility of the FP detection for LYZ based on the HSA NPs/DNA-1 system.
We further evaluated the FP response of the HSA NPs/DNA-1 system to a range of metal ions and biomolecules, including LYZ, Na+, K+, Ca2+, Co2+, Cd2+, Ba2+, Cu2+, Zn2+, Mg2+, Al3+,and Cr3+, as well as biomolecules such as His, Phe, arginine (Arg), glycine (Gly), L-cysteine (Cys), serine (Ser), Tyr, sarcosine (Sar), Trp, threonine (Thr), trypsin, and pepsin (Figure 6A,B). The data revealed that only the addition of LYZ elicited a significant increase in FP. Moreover, we investigated the FP variations in the HSA NPs/DNA-1 system incubated with 4.167 μg/mL of LYZ in the presence of other metal ions and biomolecules. As shown in Figure 6C,D, despite the coexistence of these substances, LYZ consistently induced a pronounced enhancement in the FP of the HSA NPs/DNA-1 system. The detailed information is summarized in Table 2 and Table 3. In the selective test, only LYZ can trigger a 2.47-fold FP increase (Table 2). In the anti-interference test, the coexistence of those substances can only induce the FP fluctuation of the HSA NPs/DNA-1 and LYZ system in the range from 204.5% to 279.2% (Table 3). These findings demonstrate that the developed HSA NPs/DNA-1 system exhibits selective FP detection capability for LYZ.
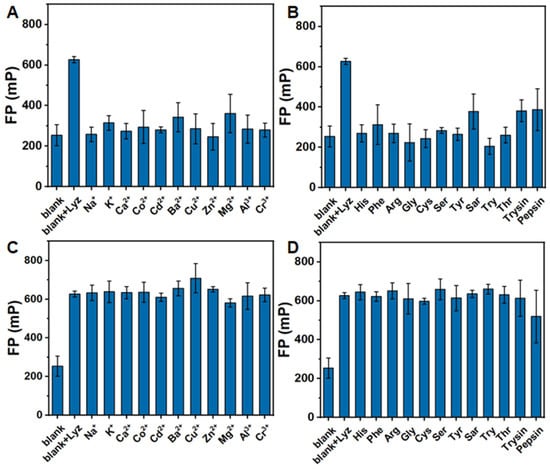
Figure 6.
Selective and anti-interference performance for LYZ. (A) The FP value of HSA NPs/DNA-1 incubated with 4.167 μg/mL of LYZ or various metal ions for 20 min. (B) The FP value of HSA NPs/DNA-1 incubated with 4.167 μg/mL of LYZ or various biomolecules for 20 min. (C) The FP value of HSA NPs/DNA-1 incubated with 4.167 μg/mL of LYZ and 4.167 μg/mL of various metal ions for 20 min. (D) The FP value of HSA NPs/DNA-1 incubated with 4.167 μg/mL of LYZ and 4.167 μg/mL of various biomolecules for 20 min.
Table 2.
The FP value ratio of HSA NPs/DNA-1 incubated with 4.167 μg/mL of LYZ or various metal ions for 20 min.
Table 3.
The FP value ratio of HSA NPs/DNA-1 incubated with 4.167 μg/mL of LYZ and various biomolecules for 20 min.
Previous studies have demonstrated that aptamers DNA-2 and DNA-3 exhibit high affinity for TBA [,]. Based on this observation, we speculated that DNA-2 or DNA-3 preferentially binds to TBA rather than to HSA NPs [,]. Figure 7A,B displayed the FP changes in the HSA NPs solution incubated with different concentrations of DNA-2 and DNA-3 for 20 min. The results indicated that the FP value of the HSA NPs solution significantly decreased after the addition of DNA-2 or DNA-3. The varying trend is consistent with the addition of DNA-1. According to the above results, the addition of DNA-1, DNA-2, or DNA-3 can induce changes in HSA NPs from an aggregate state to a dispersed state. The FP value of HSA NPs in a well dispersed state is about 280 mP. Herein, we further investigated the FP changes in the HSA NPs incubated with 2.5 μg/mL of DNA-2 and various TBA concentrations (CTBA). As shown in Figure 8A, the FP value of the HSA NPs/DNA-2 system gradually enhanced with the increase in CTBA from 0 to 20.84 μg/mL. Moreover, the relationship between the FP value and CTBA in the range of 0−20.84 μg/mL can be well described by the following equations:
FP = 303.3 + 20.9 CTBA
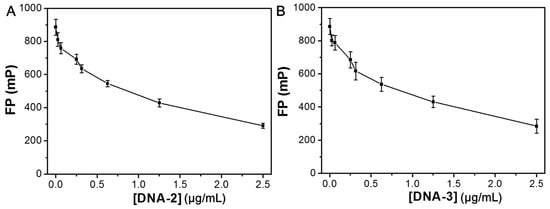
Figure 7.
(A) The FP value changes in the HSA NPs incubated with different concentrations of DNA-2 for 20 min. (B) The FP value changes in the HSA NPs incubated with different concentrations of DNA-3 for 20 min.
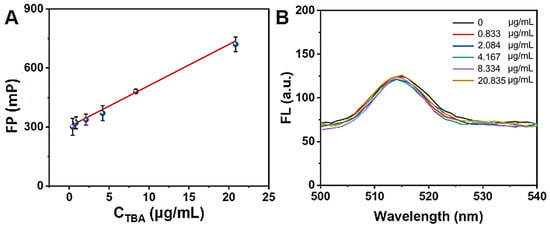
Figure 8.
(A) The correspondent relation between FP value of HSA NPs/DNA-2 and TBA in the range of 0–20.835 μg/mL. (B) The fluorescence emission spectra of HSA NPs/DNA-2 incubated with different TBA concentrations for 20 min.
The fitting coefficient R2 was 0.993, and the detection limit for TBA was 0.058 μg/mL according to the 3 s/k criterion. Instead, the fluorescence emission spectra of the HSA NPs/DNA-2 system changed a little with the increase in CTBA from 0 to 20.84 μg/mL (Figure 8B).
In addition, the FP changes in the HSA NPs incubated with 2.5 μg/mL of DNA-3 and various TBA concentrations are shown in Figure 9A. It is worth noting that the FP value of the HSA NPs/DNA-3 system just exhibited a slight enhancement with the increase in CTBA from 0 to 20.84 μg/mL. The relationship between the FP value and CTBA in the range of 0–2.084 μg/mL can be well described by the following equations.
FP = 284.7 + 17.1 CTBA
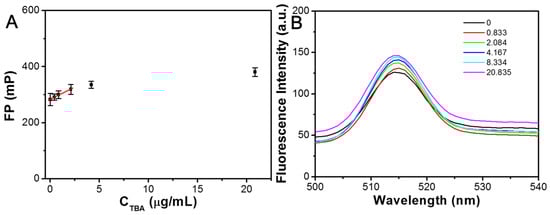
Figure 9.
(A) The correspondent relation between FP value of HSA NPs/DNA-3 and TBA in the range of 0–20.835 μg/mL. (B) The fluorescence emission spectra of HSA NPs/DNA-3 incubated with different TBA concentrations for 20 min.
The coefficient R2 was calculated to be 0.994, and the detection limit for TBA was determined to be 0.095 μg/mL based on the 3 s/k criterion. Concurrently, the fluorescence emission spectra of the HSA NPs/DNA-3 system exhibited minimal variation with increasing CTBA ranging from 0 to 20.84 μg/mL (Figure 9B). These findings indicated that the HSA NPs/DNA-2 system demonstrated a more pronounced FP response to TBA compared to the HSA NPs/DNA-3 system. Previous studies have reported that the Kd of aptamer DNA-2 for TBA is 0.5 nM, which is significantly lower than the Kd of aptamer DNA-3 for TBA, reported as 25 nM [,]. This suggests that DNA-2 possesses a higher affinity for TBA than DNA-3. The observed FP sensitivity of the HSA NPs combined with the respective DNA sequences to TBA correlates with their respective affinities for TBA. It is therefore hypothesized that the differential FP responses are attributable to variations in binding affinity.
The FP response of the HSA NPs/DNA-2 system to various metal ions and biomolecules was further evaluated (Figure 10A,B). The results indicated that only the addition of TBA elicited a significant increase in FP. Additionally, the FP changes in the HSA NPs/DNA-2 system were examined following incubation with 8.334 μg/mL of TBA in the presence of 8.334 μg/mL of other metal ions and biomolecules. As shown in Figure 10C,D, TBA continued to induce a pronounced enhancement in FP within the HSA NPs/DNA-2 system despite the presence of these coexisting substances. Detailed information is summarized in Table 4 and Table 5. In the selectivity assay, only TBA triggered a 1.84-fold increase in FP (Table 4). In the interference-resistance test, the coexistence of these substances resulted in FP fluctuations of the HSA NPs/DNA-2 and TBA system ranging from 167.6% to 207.5% (Table 5). Collectively, these findings demonstrate that the developed HSA NPs/DNA-2 system is suitable for the selective FP-based detection of TBA.
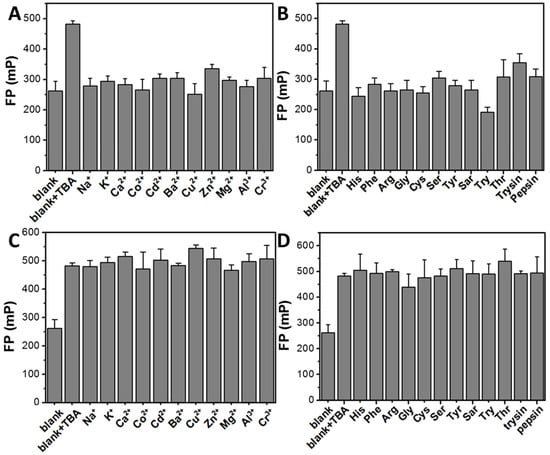
Figure 10.
Selective and anti-interference performance for TBA. (A) The FP value of HSA NPs/DNA-2 incubated with 8.334 μg/mL of TBA or various metal ions for 20 min. (B) The FP value of HSA NPs/DNA-2 incubated with 8.334 μg/mL of TBA or various biomolecules for 20 min. (C) The FP value of HSA NPs/DNA-2 incubated with 8.334 μg/mL of TBA and 8.334 μg/mL of various metal ions for 20 min. (D) The FP value of HSA NPs/DNA-2 incubated with 8.334 μg/mL of TBA and 8.334 μg/mL of various biomolecules for 20 min.
Table 4.
The FP value ratio of HSA NPs/DNA-2 incubated with 8.334 μg/mL of TBA or various metal ions for 20 min.
Table 5.
The FP value ratio of HSA NPs/DNA-2 incubated with 8.334 μg/mL of TBA and various biomolecules for 20 min.
As shown in Table 6, we summarized the detection performance for LYZ and TBA based on various optical assays. It can be found that this method offered a simple detection system and similar detection range and detection limit [,,,,,,,,,].
Table 6.
The detection performance for LYZ and TBA based on various kinds of optical detections.
In order to further test the applied potentials of this method in practical samples, the HSA NPs/DNA-1 system and the HSA NPs/DNA-2 system were utilized for the FP detection of LYZ and TBA concentrations in saliva samples. LYZ and TBA were added to 2-fold saliva sample dilutions. The determined results are shown in Table 7 and Table 8. The added LYZ and TBA were successfully detected, and the recoveries were in the range of 92–108% and 104–109%, with relative standard deviation (RSD) no more than 4.7%. The above results demonstrated the potential of detecting LYZ and TBA in actual samples based on this method.
Table 7.
The detection of LYZ in saliva samples.
Table 8.
The detection of TBA in saliva samples.
4. Conclusions
Fluorescent albumin nanoparticles were synthesized, and their FP properties were investigated following incubation with different DNA sequences. The fabricated HSA NPs exhibited a marked reduction in FP upon exposure to DNA-1 and DNA-2, which possessed high binding affinities for LYZ and TBA, respectively. Additionally, HSA NPs/DNA-1 and HSA NPs/DNA-2 complexes were developed, facilitating the FP-based detection of LYZ and TBA via the recovery of FP signals.
Author Contributions
Conceptualization, Y.W. and Z.D.; methodology, Y.W., R.A., F.L. and S.Y.; validation, Y.W., R.A., F.L. and S.Y.; formal analysis, S.Y.; resource, S.L.; data curation, Y.W. and Z.D.; writing—original draft preparation, Y.W. and R.A.; writing—review and editing, S.Y. and S.L.; project administration, S.L. All authors have read and agreed to the published version of the manuscript.
Funding
This research was funded by the National Training Program of Innovation and Entrepreneurship for Undergraduates grant number [250244].
Informed Consent Statement
Not applicable.
Data Availability Statement
Data will be made available on request.
Acknowledgments
The authors thank Yu Dong from the Analytical and Testing Center of Northeastern University for TEM data acquisition.
Conflicts of Interest
The authors declare that they have no known competing financial interests or personal relationships that could have appeared to influence the work reported in this paper.
References
- Xiao, X.; Zhen, S. Recent advances in fluorescence anisotropy/polarization signal amplification. RSC Adv. 2022, 12, 6364–6376. [Google Scholar] [CrossRef] [PubMed]
- Hendrickson, O.D.; Taranova, N.A.; Zherdev, A.V.; Dzantiev, B.B.; Eremin, S.A. Fluorescence Polarization-Based Bioassays: New Horizons. Sensors 2020, 20, 7132. [Google Scholar] [CrossRef] [PubMed]
- Camacho, R.; Täuber, D.; Scheblykin, I.G. Fluorescence Anisotropy Reloaded-Emerging Polarization Microscopy Methods for Assessing Chromophores’ Organization and Excitation Energy Transfer in Single Molecules, Particles, Films, and Beyond. Adv. Mater. 2019, 31, e1805671. [Google Scholar] [CrossRef] [PubMed]
- Jameson, D.M.; Ross, J.A. Fluorescence polarization/anisotropy in diagnostics and imaging. Chem. Rev. 2010, 110, 2685–2708. [Google Scholar] [CrossRef]
- Vinegoni, C.; Feruglio, P.F.; Gryczynski, I.; Mazitschek, R.; Weissleder, R. Fluorescence anisotropy imaging in drug discovery. Adv. Drug Deliv. Rev. 2019, 151–152, 262–288. [Google Scholar] [CrossRef]
- Bai, Y.; Shu, T.; Su, L.; Zhang, X. Functional nucleic acid-based fluorescence polarization/anisotropy biosensors for detection of biomarkers. Anal. Bioanal. Chem. 2020, 412, 6655–6665. [Google Scholar] [CrossRef]
- Fukuyama, M.; Nakamura, A.; Nishiyama, K.; Imai, A.; Tokeshi, M.; Shigemura, K.; Hibara, A. Noncompetitive Fluorescence Polarization Immunoassay for Protein Determination. Anal. Chem. 2020, 92, 14393–14397. [Google Scholar] [CrossRef]
- Zhang, Y.; Yan, P.; Tang, H.; Zhang, J. Rapid detection of tear lactoferrin for diagnosis of dry eyes by using fluorescence polarization-based aptasensor. Sci. Rep. 2023, 13, 15179. [Google Scholar] [CrossRef]
- Jia, W.; Jin, X.; Wu, Y.; Xie, D.; Yin, W.; Zhao, B.; Huang, Z.; Liu, L.; Yang, Y.; Cao, T.; et al. Amplification of fluorescence polarization signal based on specific recognition of aptamers combined with quantum quenching effect for ultrasensitive and simple detection of PCB-77. Spectrochim. Acta A Mol. Biomol. Spectrosc. 2022, 278, 121341. [Google Scholar] [CrossRef]
- Zhang, Z.; Tang, C.; Zhao, L.; Xu, L.; Zhou, W.; Dong, Z.; Yang, Y.; Xie, Q.; Fang, X. Aptamer-based fluorescence polarization assay for separation-free exosome quantification. Nanoscale 2019, 11, 10106–10113. [Google Scholar] [CrossRef]
- Lee, C.Y.; Degani, I.; Cheong, J.; Lee, J.H.; Choi, H.J.; Cheon, J.; Lee, H. Fluorescence polarization system for rapid COVID-19 diagnosis. Biosens. Bioelectron. 2021, 178, 113049. [Google Scholar] [CrossRef]
- Ma, P.; Duan, N.; Ye, H.; Xia, Y.; Ding, Z.; Wang, Z. Selection, truncation and fluorescence polarization based aptasensor for Weissella viridescens detection. Talanta 2022, 246, 123499. [Google Scholar] [CrossRef] [PubMed]
- Yang, H.; He, Q.; Eremin, S.A.; Pan, J.; Zou, Y.; Cui, X.; Zhao, S. Fluorescence polarization immunoassay for rapid determination of dehydroepiandrosterone in human urine. Anal. Bioanal. Chem. 2021, 413, 4459–4469. [Google Scholar] [CrossRef] [PubMed]
- Zhao, Q.; Tao, J.; Feng, W.; Uppal, J.S.; Peng, H.; Le, X.C. Aptamer binding assays and molecular interaction studies using fluorescence anisotropy—A review. Anal. Chim. Acta 2020, 1125, 267–278. [Google Scholar] [CrossRef] [PubMed]
- Zhao, Q.; Bai, Y.; Wang, H. Directing a rational design of aptamer-based fluorescence anisotropy assay for sensitive detection of immunoglobulin E by site-specific binding study. Talanta 2020, 217, 121018. [Google Scholar] [CrossRef]
- Liu, L.; Zhao, Q. A simple fluorescence anisotropy assay for detection of bisphenol A using fluorescently labeled aptamer. J. Environ. Sci. 2020, 97, 19–24. [Google Scholar] [CrossRef]
- Fan, S.; Wang, J.; Wen, X.; Feng, Y.; Shao, F.; Xu, L.; Liu, S.; Liu, W. A label-free fluorescence polarization technology for the detection of food additives. Spectrochim. Acta A Mol. Biomol. Spectrosc. 2026, 344, 126634. [Google Scholar] [CrossRef]
- Ziai, Y.; Rinoldi, C.; Petronella, F.; Zakrzewska, A.; De, S.L.; Pierini, F. Lysozyme-sensitive plasmonic hydrogel nanocomposite for colorimetric dry-eye inflammation biosensing. Nanoscale 2024, 16, 13492–13502. [Google Scholar] [CrossRef]
- Kirk, K.A.; Vasilescu, A.; Andreescu, D.; Senarathna, D.; Mondal, S.; Andreescu, S. Collision-Based Electrochemical Detection of Lysozyme Aggregation. Anal. Chem. 2021, 93, 2026–2037. [Google Scholar] [CrossRef]
- Melinte, G.; Selvolini, G.; Cristea, C.; Marrazza, G. Aptasensors for lysozyme detection: Recent advances. Talanta 2021, 226, 122169. [Google Scholar] [CrossRef]
- Yang, Z.H.; Huang, L.F.; Wang, Y.S.; Chang, C.C. Turn-off enzyme activity of histidine-rich peptides for the detection of lysozyme. Mikrochim. Acta 2024, 191, 307. [Google Scholar] [CrossRef]
- Oushyani, R.Z.; Ghasemi, H.; Khatami, S.H.; Khorsand, M.; Rahdan, F.; Chehri, D.; Sheydaei, O.; Aiiashi, S.; Mahmoudi, R.; Movahedpour, A. Aptamer biosensors for thrombin. Clin. Chim. Acta 2025, 565, 119976. [Google Scholar] [CrossRef]
- Deng, Z.; Tan, X.; Guo, D.; Zhang, J.; Xu, D.; Hou, X.; Wang, S.; Zhang, J.; Wei, F.; Zhang, D. MXene-sensitized electrochemiluminescence sensor for thrombin activity detection and inhibitor screening. Mikrochim. Acta 2023, 190, 328. [Google Scholar] [CrossRef] [PubMed]
- Ҫimen, D.; Bereli, N.; Günaydın, S.; Denizli, A. Molecular imprinted nanoparticle assisted surface plasmon resonance biosensors for detection of thrombin. Talanta 2022, 246, 123484. [Google Scholar] [CrossRef] [PubMed]
- Zheng, S.; Zhang, X.; Pang, Z.; Liu, J.; Liu, S.; Sheng, R. Anti-Pan-Rspo Chimeric Protein-Conjugated Albumin Nanoparticle Provides Promising Opportunities in Cancer Targeted Therapy. Adv. Healthc. Mater. 2023, 12, e2301441. [Google Scholar] [CrossRef] [PubMed]
- Yang, Q.; Ye, Z.; Zhong, M.; Chen, B.; Chen, J.; Zeng, R.; Wei, L.; Li, H.W.; Xiao, L. Self-Assembled Fluorescent Bovine Serum Albumin Nanoprobes for Ratiometric pH Measurement inside Living Cells. ACS Appl. Mater. Interfaces 2016, 8, 9629–9634. [Google Scholar] [CrossRef]
- Lacroix, A.; Edwardson, T.G.W.; Hancock, M.A.; Dore, M.D.; Sleiman, H.F. Development of DNA Nanostructures for high-affinity binding to human serum albumin. J. Am. Chem. Soc. 2017, 139, 7355–7362. [Google Scholar] [CrossRef]
- Vita, G.M.; De Simone, G.; De Marinis, E.; Nervi, C.; Ascenzi, P.; Di Masi, A. Serum albumin and nucleic acids biodistribution: From molecular aspects to biotechnological applications. IUBMB Life 2022, 74, 866–879. [Google Scholar] [CrossRef]
- Lin, Y.; Sun, Y.; Dai, Y.; Zhu, X.; Liu, H.; Han, R.; Gao, D.; Luo, C.; Wang, X. A chemiluminescence assay for determination of lysozyme based on the use of magnetic alginate-aptamer composition and hemin@HKUST-1. Mikrochim. Acta 2020, 187, 281. [Google Scholar] [CrossRef]
- Bayramoglu, G.; Kilic, M.; Arica, M.Y. Selective isolation and sensitive detection of lysozyme using aptamer based magnetic adsorbent and a new quartz crystal microbalance system. Food Chem. 2022, 382, 132353. [Google Scholar] [CrossRef]
- Tang, D.; Liao, D.; Zhu, Q.; Wang, F.; Jiao, H.; Zhang, Y.; Yu, C. Fluorescence turn-on detection of a protein through the displaced single-stranded DNA binding protein binding to a molecular beacon. Chem. Commun. 2011, 47, 5485–5487. [Google Scholar] [CrossRef]
- Wang, B.; Yu, C. Fluorescence turn-on detection of a protein through the reduced aggregation of a perylene probe. Angew. Chem. Int. Ed. Engl. 2010, 49, 1485–1488. [Google Scholar] [CrossRef] [PubMed]
- Zhao, L.; Li, L.; Zhu, C.; Ghulam, M.; Qu, F. pH-responsive polymer assisted aptamer functionalized magnetic nanoparticles for specific recognition and adsorption of proteins. Anal. Chim. Acta 2020, 1097, 161–168. [Google Scholar] [CrossRef] [PubMed]
- Dillen, A.; Vandezande, W.; Daems, D.; Lammertyn, J. Unraveling the effect of the aptamer complementary element on the performance of duplexed aptamers: A thermodynamic study. Anal. Bioanal. Chem. 2021, 413, 4739–4750. [Google Scholar] [CrossRef] [PubMed]
- Myres, G.J.; Kitt, J.P.; Harris, J.M. Raman Scattering Reveals Ion-Dependent G-Quadruplex Formation in the 15-mer Thrombin-Binding Aptamer upon Association with α-Thrombin. Anal. Chem. 2023, 95, 16160–16168. [Google Scholar] [CrossRef]
- Riccardi, C.; Napolitano, E.; Platella, C.; Musumeci, D.; Montesarchio, D. G-quadruplex-based aptamers targeting human thrombin: Discovery, chemical modifications and antithrombotic effects. Pharmacol. Ther. 2021, 217, 107649. [Google Scholar] [CrossRef]
- Wang, Y.H.; Xia, H.; Huang, K.J.; Wu, X.; Ma, Y.Y.; Deng, R.; Lu, Y.F.; Han, Z.W. Ultrasensitive determination of thrombin by using an electrode modified with WSe2 and gold nanoparticles, aptamer-thrombin-aptamer sandwiching, redox cycling, and signal enhancement by alkaline phosphatase. Mikrochim. Acta 2018, 185, 502. [Google Scholar] [CrossRef]
- Avino, A.; Fabrega, C.; Tintore, M.; Eritja, R. Thrombin binding aptamer, more than a simple aptamer: Chemically modified derivatives and biomedical applications. Curr. Pharm. Des. 2012, 18, 2036–2047. [Google Scholar] [CrossRef]
- Bock, L.C.; Griffin, L.C.; Latham, J.A.; Vermaas, E.H.; Toole, J.J. Selection of single-stranded DNA molecules that bind and inhibit human thrombin. Nature 1992, 355, 564–566. [Google Scholar] [CrossRef]
- Wang, J.; Liu, B. Fluorescence resonance energy transfer between an anionic conjugated polymer and a dye-labeled lysozyme aptamer for specific lysozyme detection. Chem. Commun. 2009, 17, 2284–2286. [Google Scholar] [CrossRef]
- Zhang, X.; Tang, B.; Li, Y.; Liu, C.; Jiao, P.; Wei, Y. Molecularly Imprinted Magnetic Fluorescent Nanocomposite-Based Sensor for Selective Detection of Lysozyme. Nanomaterials 2021, 11, 1575. [Google Scholar] [CrossRef] [PubMed]
- Cai, Z.X.; Chen, G.X.; Huang, X.; Ma, M.H. Determination of lysozyme at the nanogram level in chicken egg white using Resonance Rayleigh-scattering method with Cd-doped ZnSe quantum dots as probe. Sens. Actuators B 2011, 157, 368–373. [Google Scholar] [CrossRef]
- Mukhametova, L.I.; Zherdev, D.O.; Kuznetsov, A.N.; Yudina, O.N.; Tsvetkov, Y.E.; Eremin, S.A.; Krylov, V.B.; Nifantiev, N.E. Fluorescence-Polarization-Based Assaying of Lysozyme with Chitooligosaccharide Tracers. Biomolecules 2024, 14, 170. [Google Scholar] [CrossRef] [PubMed]
- Mukhametova, L.I.; Zherdev, D.O.; Eremin, S.A.; Levashov, P.A.; Siebert, H.C.; Tsvetkov, Y.E.; Yudina, O.N.; Krylov, V.B.; Nifantiev, N.E. Application of the Chitooligosaccharides and Fluorescence Polarization Technique for the Assay of Active Lysozyme in Hen Egg White. Biomolecules 2024, 14, 1589. [Google Scholar] [CrossRef]
- Zeng, X.; Zhou, Q.; Wang, L.; Zhu, X.; Cui, K.; Peng, X.; Steele, T.W.J.; Chen, H.; Xu, H.; Zhou, Y. A Fluorescence Kinetic-Based Aptasensor Employing Stilbene Isomerization for Detection of Thrombin. Materials 2021, 14, 6927. [Google Scholar] [CrossRef]
- Chen, L.; Bao, Y.; Denstedt, J.; Zhang, J. Nanostructured bioluminescent sensor for rapidly detecting thrombin. Biosens. Bioelectron. 2016, 77, 83–89. [Google Scholar] [CrossRef]
- Zhu, Y.; Hu, X.C.; Shi, S.; Gao, R.R.; Huang, H.L.; Zhu, Y.Y.; Lv, X.Y.; Yao, T.M. Ultrasensitive and universal fluorescent aptasensor for the detection of biomolecules (ATP, adenosine and thrombin) based on DNA/Ag nanoclusters fluorescence light-up system. Biosens. Bioelectron. 2016, 79, 205–212. [Google Scholar] [CrossRef]
- Li, J.; Zhong, X.; Zhang, H.; Le, X.C.; Zhu, J.J. Binding-induced fluorescence turn-on assay using aptamer-functionalized silver nanocluster DNA probes. Anal. Chem. 2012, 84, 5170–5174. [Google Scholar] [CrossRef]
- Xu, N.; Wang, Q.; Lei, J.; Liu, L.; Ju, H. Label-free triple-helix aptamer as sensing platform for “signal-on” fluorescent detection of thrombin. Talanta 2015, 132, 387–391. [Google Scholar] [CrossRef]
Disclaimer/Publisher’s Note: The statements, opinions and data contained in all publications are solely those of the individual author(s) and contributor(s) and not of MDPI and/or the editor(s). MDPI and/or the editor(s) disclaim responsibility for any injury to people or property resulting from any ideas, methods, instructions or products referred to in the content. |
© 2025 by the authors. Licensee MDPI, Basel, Switzerland. This article is an open access article distributed under the terms and conditions of the Creative Commons Attribution (CC BY) license (https://creativecommons.org/licenses/by/4.0/).