


Abstract
Background/Objectives: Major wealth losses are linked to poorer later-life health, but it is unclear whether regaining wealth is followed by slower frailty progression. We examined whether substantial post-shock wealth recovery was associated with subsequent frailty progression across three national ageing cohorts. Methods: We analysed longitudinal data from the Health and Retirement Study (HRS), the English Longitudinal Study of Ageing (ELSA), and the Korean Longitudinal Study of Aging (KLoSA). A major wealth shock was defined as a ≥75% decline in wealth, and substantial recovery as regaining ≥50% of the shock-related loss by the next interview (landmark). We compared annual frailty-index (FI) change between participants with substantial recovery and those with persistent loss or limited recovery using cohort-specific linear mixed-effects models and a secondary random-effects synthesis. Results: The analysis included 5114 HRS, 699 ELSA, and 2502 KLoSA participants. The adjusted difference in annual FI change was 0.0013 FI units/year in HRS (95% confidence interval [CI], 0.0006 to 0.0019), −0.0014 in ELSA (−0.0037 to 0.0008), and 0.0006 in KLoSA (−0.0006 to 0.0017). The secondary summary was 0.0005 FI units/year (95% CI, −0.0026 to 0.0035; I2 = 72.5%). Estimates were similar with the common-item FI and multiple imputation, while survey weighting yielded wider CIs. Some estimates varied across recovery thresholds and wealth-related restrictions. Alternative longitudinal models widened confidence intervals; in HRS, allowing participant-specific random slopes yielded a CI crossing zero. Conclusions: Substantial wealth recovery was not consistently associated with slower subsequent frailty progression across three ageing cohorts. Financial recovery and subsequent frailty progression should therefore be considered separately.
1. Introduction
Frailty is a multidimensional state of increased vulnerability in later life and is associated with disability, greater healthcare use, long-term care admission, and mortality [1]. The frailty index (FI) summarises accumulated health deficits across multiple domains and, when measured repeatedly, allows both frailty levels and changes over time to be examined [2,3]. Socioeconomic disadvantage is associated with a greater burden of frailty in later life [1,4]. Among socioeconomic resources, wealth is particularly relevant in later life because it reflects economic resources accumulated over time [5]. However, wealth may change substantially in later life, with major losses followed by persistent financial disadvantage or partial recovery [6,7].
Longitudinal studies have examined both wealth levels and changes in economic circumstances in relation to frailty in later life [4,8,9,10]. Uccheddu et al. (2019) found no clear within-person association between changes in relative wealth position and FI in most subgroups [9], whereas Sirven et al. (2020) reported that worsening wealth and financial difficulties were associated with increases in frailty symptoms over time [10]. In parallel, studies of major negative wealth shocks have examined depressive symptoms, mortality, and cognitive outcomes [11,12,13,14]. Although these studies highlight the relevance of major wealth losses to later-life health, they do not address how subsequent changes in wealth relate to multidimensional frailty. Following a major wealth loss, wealth may remain substantially below its pre-shock level or recover to varying degrees. It remains unclear whether substantial post-shock wealth recovery is associated with slower subsequent FI progression than persistent loss or limited recovery.
Persistent wealth loss may constrain older adults’ ability to meet healthcare and daily needs, whereas recovering part of that loss may ease these constraints. For example, borrowing against housing equity after disease onset was associated with less cost-related medication non-adherence among older adults [15]. Such support for health management may be relevant to frailty progression, as changes in the FI reflect both the development of new health deficits and the resolution of existing ones [16]. If recovered economic resources help sustain disease management and maintain physical function, they may contribute to fewer new deficits or greater resolution of existing deficits, potentially resulting in slower subsequent FI progression. This hypothesised difference in the rate of FI change is distinct from a difference in FI level at the time wealth recovery is assessed.
We therefore examined whether wealth recovery after a major negative wealth shock was associated with subsequent frailty progression among older adults. We used longitudinal data from three population-based ageing cohorts in the United States, England, and South Korea. Our primary comparison was between participants with substantial wealth recovery and those with persistent loss or limited recovery. We hypothesised that substantial wealth recovery would be associated with slower subsequent frailty progression than persistent wealth loss or limited recovery.
2. Materials and Methods
2.1. Study Design and Data Sources
We conducted a longitudinal observational study using harmonised data from three national surveys on ageing: the Health and Retirement Study (HRS), the English Longitudinal Study of Ageing (ELSA), and the Korean Longitudinal Study of Aging (KLoSA) [17,18,19,20]. These cohorts provide repeated assessments of wealth and health.
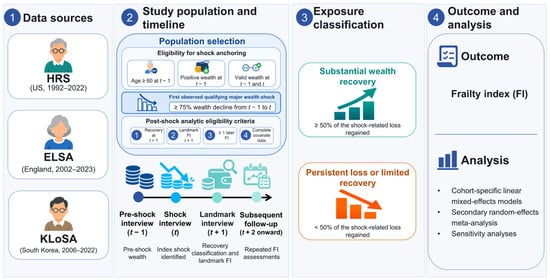
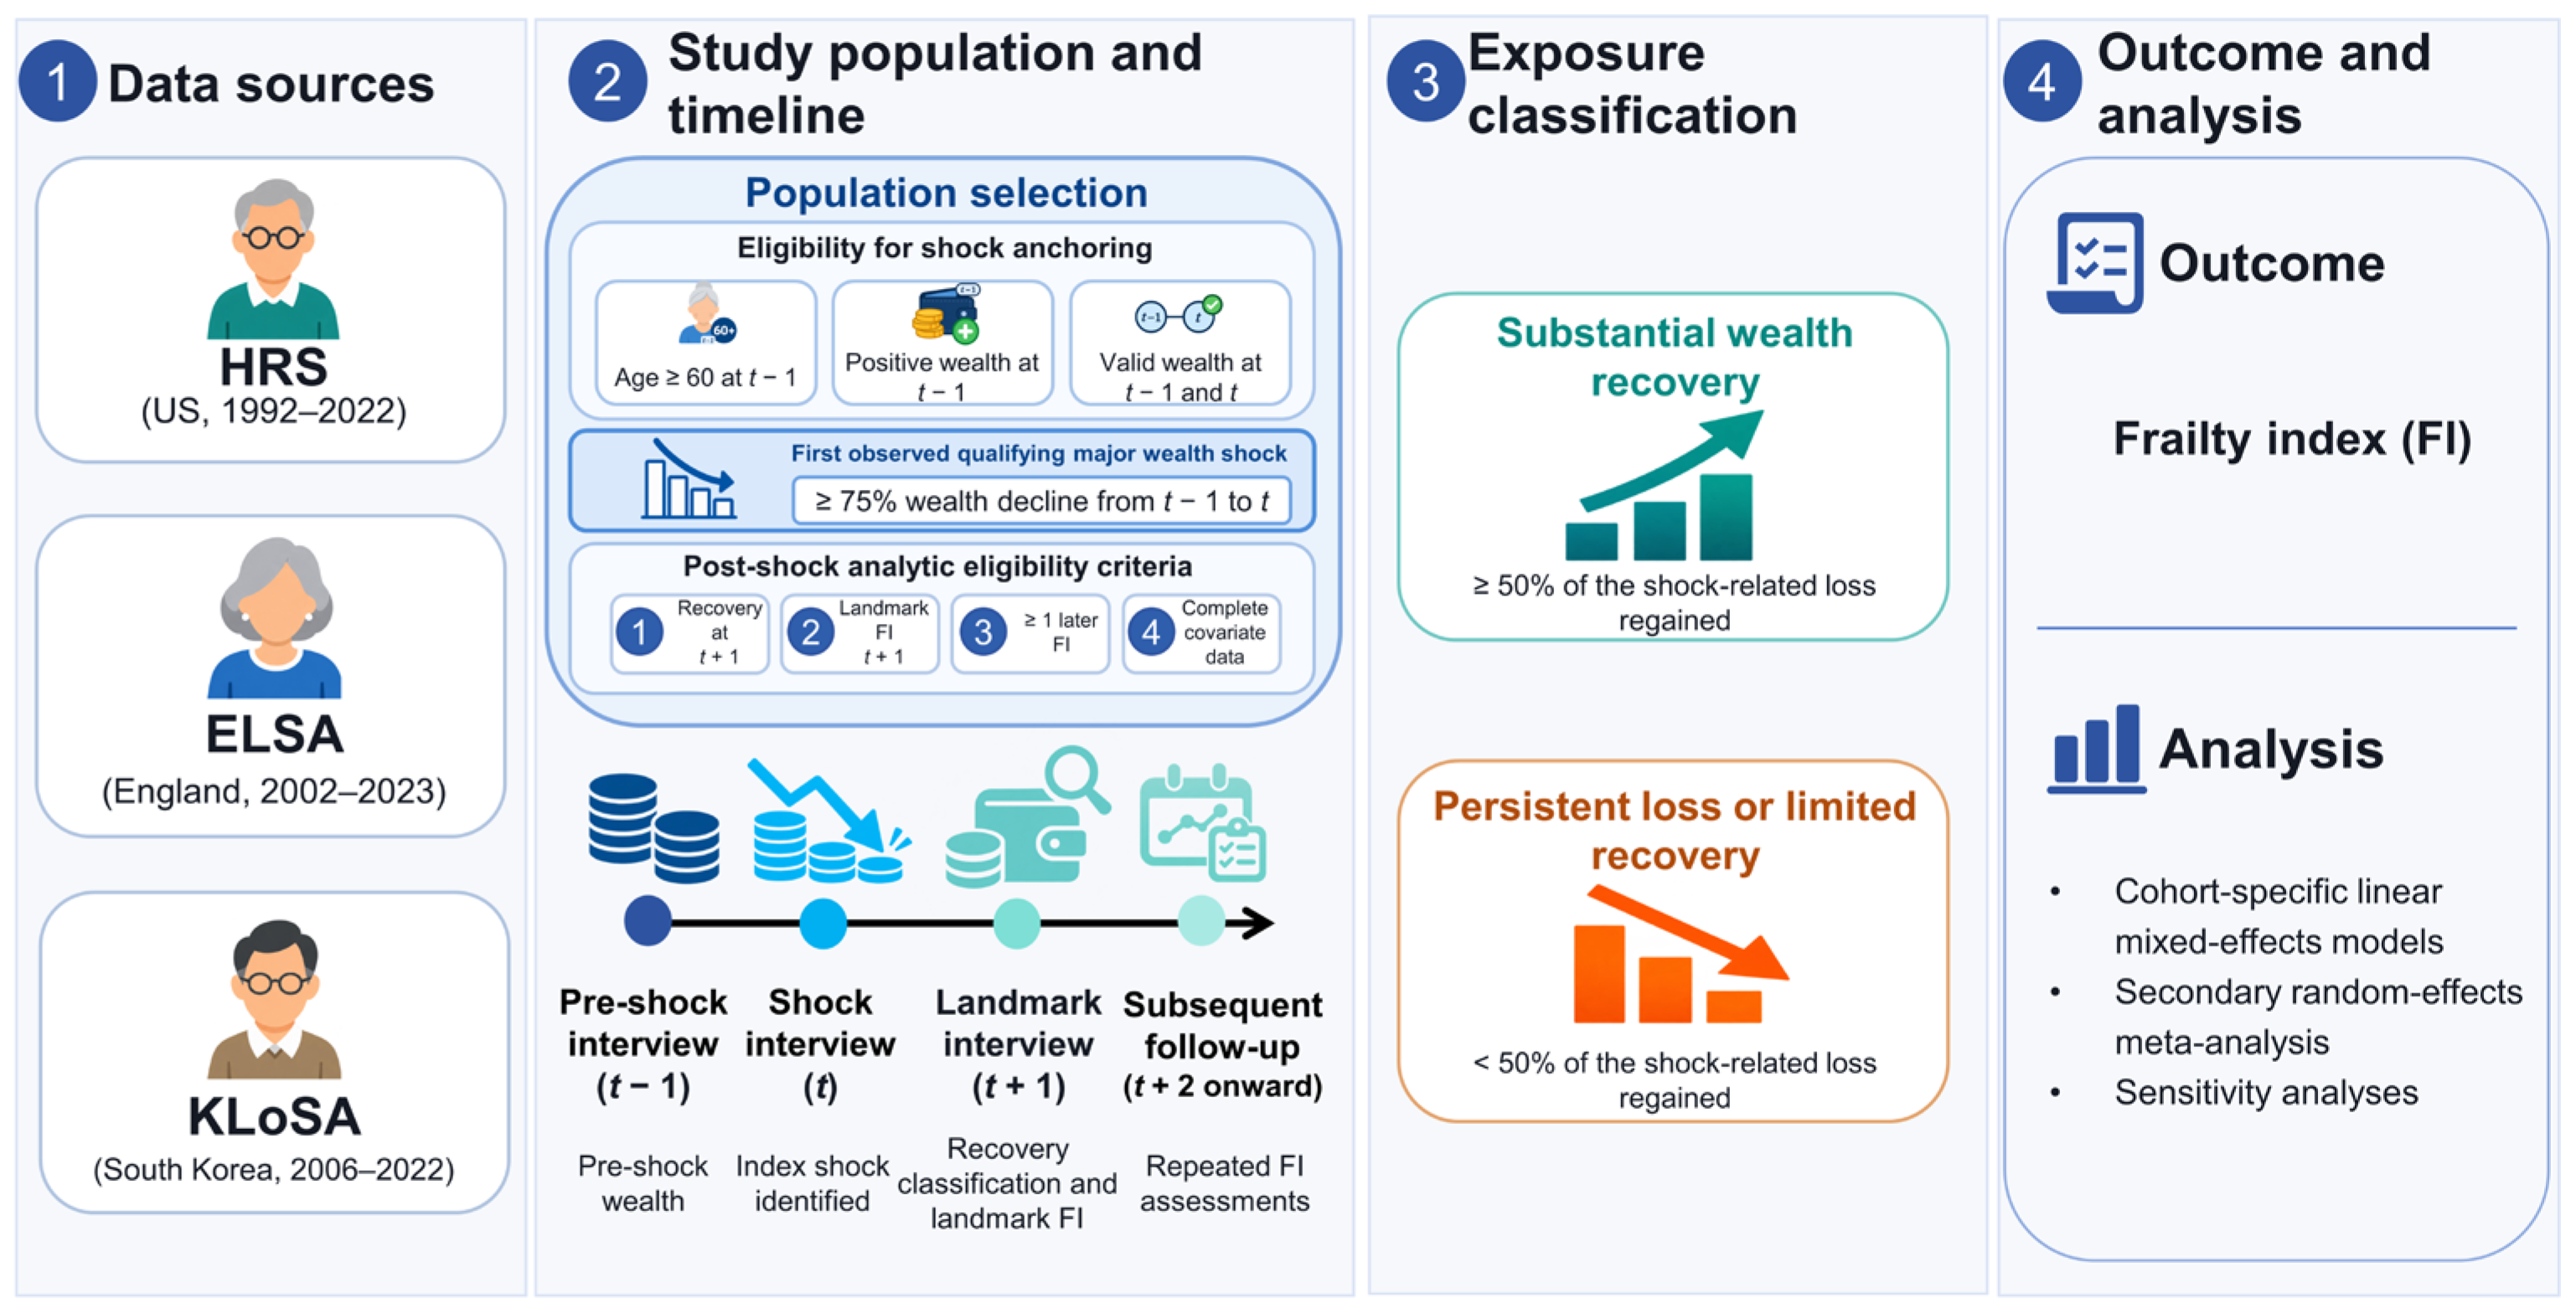
We identified participants who experienced a major wealth shock within set observation periods. Wealth recovery was assessed at the next scheduled interview, which served as the landmark and baseline for subsequent frailty follow-up. We compared frailty trajectories between individuals who substantially recovered their wealth and those who faced persistent loss or limited recovery (Figure 1). Details on the data sources, survey timing, and original sampling frameworks are provided in Supplementary Table S1.
Figure 1.
Study workflow and temporal alignment. The study proceeded through four steps: (1) harmonised ageing cohorts; (2) anchoring the first qualifying major wealth shock; (3) assessment and classification of post-shock wealth recovery at the landmark interview; and (4) assessment of subsequent frailty progression. US, United States; HRS, Health and Retirement Study; ELSA, English Longitudinal Study of Ageing; KLoSA, Korean Longitudinal Study of Aging; FI, frailty index.
2.2. Study Population and Follow-Up
Eligible person-intervals were defined between consecutive survey waves t − 1 and t. Intervals were included if they met three criteria: (1) age ≥ 60 years at t − 1; (2) positive wealth at t − 1; and (3) valid wealth at both t − 1 and t. Intervals not meeting these criteria were excluded.
For each participant, the first eligible interval meeting the major wealth-shock definition was selected as the index event. Participants then passed four post-shock gates to enter the primary complete-case analytic sample: (1) valid recovery status at the landmark t + 1; (2) a valid landmark FI at t + 1; (3) at least one subsequent valid frailty assessment from t + 2 onward; and (4) complete data on all prespecified adjustment variables. The index shock was fixed at the first qualifying event and was not replaced by a later shock. The landmark FI defined the baseline for frailty follow-up, and all available subsequent FI assessments were included. Survey timing is shown in Supplementary Table S1B, and sample selection in Supplementary Figure S1.
To assess potential selection into subsequent frailty follow-up, we separately compared participants with and without valid post-landmark FI assessments among those with valid recovery status, landmark FI, interview timing, and complete prespecified covariate data, regardless of subsequent FI availability. Age, FI at the shock and landmark interviews, and substantial wealth recovery status were compared using descriptive statistics and standardised mean differences (Supplementary Table S6).
2.3. Wealth Shocks and Post-Shock Recovery
We used cohort-specific harmonised wealth measures covering housing and other real estate, business assets, and non-housing financial assets, with applicable debts deducted (Supplementary Table S2). The HRS measure represented household/couple wealth excluding IRA/Keogh account balances; the ELSA measure represented family/couple wealth excluding vehicles, with life-insurance values and pension plans excluded from non-housing financial wealth; and the KLoSA measure represented respondent-level net assets, including the present value of private annuities within other financial assets. These wealth measures did not separately capitalise public or employer pension entitlements.
To quantify wealth loss and subsequent recovery, let W denote wealth at the pre-shock interview t − 1, index shock interview t, and next interview t + 1, which served as the recovery-assessment landmark. The proportion of pre-shock wealth lost was defined by Equation (1):
A qualifying major negative wealth shock required Li ≥ 0.75, consistent with previous studies [11,12,13]. Pre-shock wealth had to be positive, and wealth at the shock and landmark interviews could be zero or negative. Loss proportions could therefore exceed 100%. We selected the first observed qualifying shock within the eligible observation window, not necessarily the first in a participant’s lifetime.
At the landmark, the proportion of the index shock loss regained was calculated using Equation (2):
The denominator is the strictly positive absolute amount lost during the index shock. Participants with Ri ≥ 0.50 were classified as having substantial wealth recovery, whereas those with Ri < 0.50 formed the persistent loss or limited recovery reference group. Regaining half the loss is neither a 50% increase in wealth nor recovery to 50% of pre-shock wealth, and does not require full recovery. Negative ratios indicate further loss; ratios ≥ 1 indicate recovery to or above pre-shock wealth. For example, if wealth fell from 100 to −20, the loss would be 120 (120% of pre-shock wealth). A subsequent increase to 40 would represent recovery of 60 of the 120 lost, or 50%. The 50% threshold provides an interpretable operational distinction between limited and substantial partial recovery: a pragmatic midpoint between no and complete recovery, not an empirically validated optimum or established health-related cutoff. Sensitivity analyses evaluated 25% and 100% recovery thresholds. Status was fixed at the landmark to compare subsequent frailty trajectories, which does not imply that wealth remained stable or that the reference group never recovered later.
2.4. Frailty
Frailty was the primary outcome and was measured using a deficit-accumulation FI [3,21]. We constructed a 30-item FI in each cohort to capture multidimensional health across chronic conditions, sensory and self-rated health, activities of daily living, instrumental activities of daily living, mental health, and physical function.
To support cross-cohort comparison, 22 deficits were conceptually aligned across HRS, ELSA, and KLoSA, informed by previous cross-cohort FI harmonisation work [22]. Each cohort then contributed eight additional deficits available consistently within that cohort, yielding a 30-item primary FI in all three studies. Detailed item definitions and source mappings are shown in Supplementary Table S3. To preserve longitudinal comparability, the same prespecified item set was used across all analytic waves within each cohort. Each deficit was scored from 0 to 1, and the FI was calculated as the mean of observed deficit scores [3,21]. The primary FI required at least 27 of 30 items to be available, using a prespecified 90% completeness rule, exceeding the commonly recommended 80% minimum [21]. The FI was analysed continuously, with higher values indicating greater frailty.
2.5. Covariates
Covariates were selected a priori to capture common causes of post-shock wealth recovery and subsequent frailty progression [13,23]. The adjustment set included age, sex, education, marital status, household size, labour-force status, household income rank, current smoking, pre-shock wealth quintile, the proportion of wealth lost during the index shock, and FI at the shock interview. Time-varying covariates were measured at the shock interview t; pre-shock wealth quintile was measured at t − 1, and wealth loss over t − 1 to t. Sex and education were treated as fixed characteristics. All adjustment variables were fixed at these prespecified values during follow-up. Cohort-specific definitions, coding, and harmonisation are shown in Supplementary Table S4.
2.6. Statistical Analysis
Participant characteristics were summarised by cohort and wealth recovery status. Continuous variables were summarised using means and standard deviations or medians and interquartile ranges, and categorical variables using counts and percentages. Descriptive statistics were unweighted.
The primary analysis compared frailty progression between participants with substantial wealth recovery and those with persistent loss or limited recovery. Primary models were unweighted and fitted separately in each cohort. We fitted cohort-specific linear mixed-effects models using all available frailty assessments from the landmark onward. Time was measured in years from the landmark, and the main estimate was the recovery-by-time interaction: the adjusted difference in annual FI change between the two groups. Models included the prespecified adjustment set described in Section 2.5 and a participant-specific random intercept. Covariates were entered as main effects and interacted with time. Full model specification and covariate standardisation are provided in Supplementary Methods, Section S1.1. Adjusted frailty trajectories were generated from the same models to show how the two groups differed over follow-up (Supplementary Methods, Section S1.2). Cohort-specific estimates were reported separately and combined in a secondary random-effects meta-analysis (Supplementary Methods, Section S1.3).
2.7. Sensitivity Analyses
We conducted sensitivity analyses to assess whether the findings depended on the definition and measurement of wealth recovery. First, we used alternative recovery thresholds of 25% and 100% of the shock-related wealth loss. We then examined the results after excluding participants in the lowest pre-shock wealth quintile and restricting the sample to those with absolute wealth losses at or above the cohort-specific 25th percentile. We also used a log-transformed wealth loss proportion for covariate adjustment. Finally, we restricted the analyses to participants with unchanged wealth-equivalisation factors and those with positive wealth at the shock interview. Further details are provided in Supplementary Methods S2.1 and S2.2.
We also assessed sensitivity to frailty measurement, survey weighting, and missing covariate data. First, we repeated the primary analyses using the Common-22 FI, which included 22 conceptually aligned deficits across the three cohorts. Second, we repeated the analyses using landmark survey weights. Third, we used multiple imputation by chained equations to address missing adjustment covariates. Imputation was conducted separately within each cohort. Wealth recovery status and longitudinal FI outcomes were not imputed. Further details are provided in Supplementary Methods S2.3–S2.5.
We further examined whether the findings were sensitive to the longitudinal model specification. We first fitted models with participant-specific random slopes for follow-up time, in addition to random intercepts. We then used restricted cubic splines to allow for nonlinear changes in FI over time. For these nonlinear models, we estimated the average annual difference in FI change between recovery groups over 0–8 years after the landmark. Further details are provided in Supplementary Methods S2.6.
We also assessed sensitivity to outcome timing and landmark frailty adjustment. First, we excluded the landmark FI assessment from the longitudinal outcome while retaining the same participants and time origin. We then additionally adjusted for landmark FI and its interaction with follow-up time using the same post-landmark outcome observations. Finally, we examined whether the results changed after adjusting for the index shock survey wave and its interaction with follow-up time. Further details are provided in Supplementary Methods S2.7 and S2.8. All analyses were conducted using a reproducible Python—R workflow (Python 3.14.7 and R 4.5.1). Weighted mixed-effects models were fitted using WeMix (version 4.0.3), and multiple imputation was performed using mice (version 3.19.0).
3. Results
3.1. Study Population and Observation Selection
Among older adults with a first observed qualifying major wealth shock, 8204 participants in HRS, 1284 in ELSA, and 3125 in KLoSA were identified (Supplementary Figure S1). Recovery status at the landmark interview was unavailable for 1657, 316, and 370 participants, respectively. Landmark FI data were additionally unavailable for 212 HRS participants and none in ELSA or KLoSA. A further 1113, 196, and 248 participants, respectively, had no valid post-landmark FI assessment, and 108, 73, and 5 were excluded because of missing prespecified adjustment data (Supplementary Figure S1). The resulting primary complete-case samples comprised 5114 HRS, 699 ELSA, and 2502 KLoSA participants. Substantial wealth recovery at the landmark was observed in 1703 (33.3%), 271 (38.8%), and 943 (37.7%) participants, respectively (Table 1).
Table 1.
Participant characteristics, wealth and frailty, and longitudinal observations by cohort and post-shock wealth recovery status.
Participants with substantial wealth recovery and those with persistent loss or limited recovery differed in pre-shock wealth position and frailty levels, with patterns varying across cohorts (Table 1). At the landmark, mean FI was 0.260 versus 0.284 in HRS, 0.247 versus 0.237 in ELSA, and 0.129 versus 0.154 in KLoSA for the substantial recovery and persistent/limited-recovery groups, respectively. Median observed follow-up ranged from 5.8 to 6.4 years across the recovery groups in the three cohorts (Table 1). In total, participants contributed 18,297 valid post-landmark FI assessments in HRS, 1885 in ELSA, and 8260 in KLoSA (Supplementary Table S5).
In a separate comparison of participants with classifiable recovery status, valid landmark FI, and complete covariate data, 1054 of 6168 (17.1%) in HRS, 180 of 879 (20.5%) in ELSA, and 248 of 2750 (9.0%) in KLoSA had no valid subsequent FI assessment (Supplementary Table S6). Across all three cohorts, participants without subsequent FI data were older, had higher FI at both the shock and landmark interviews, and were less likely to have substantial wealth recovery than those with subsequent FI data.
3.2. Wealth Recovery and Subsequent Frailty Progression
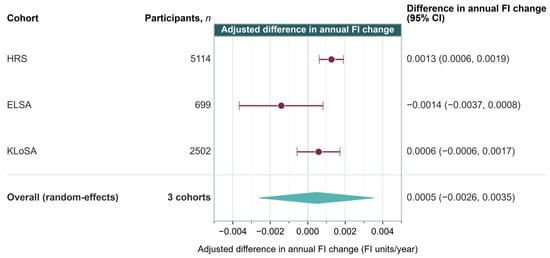
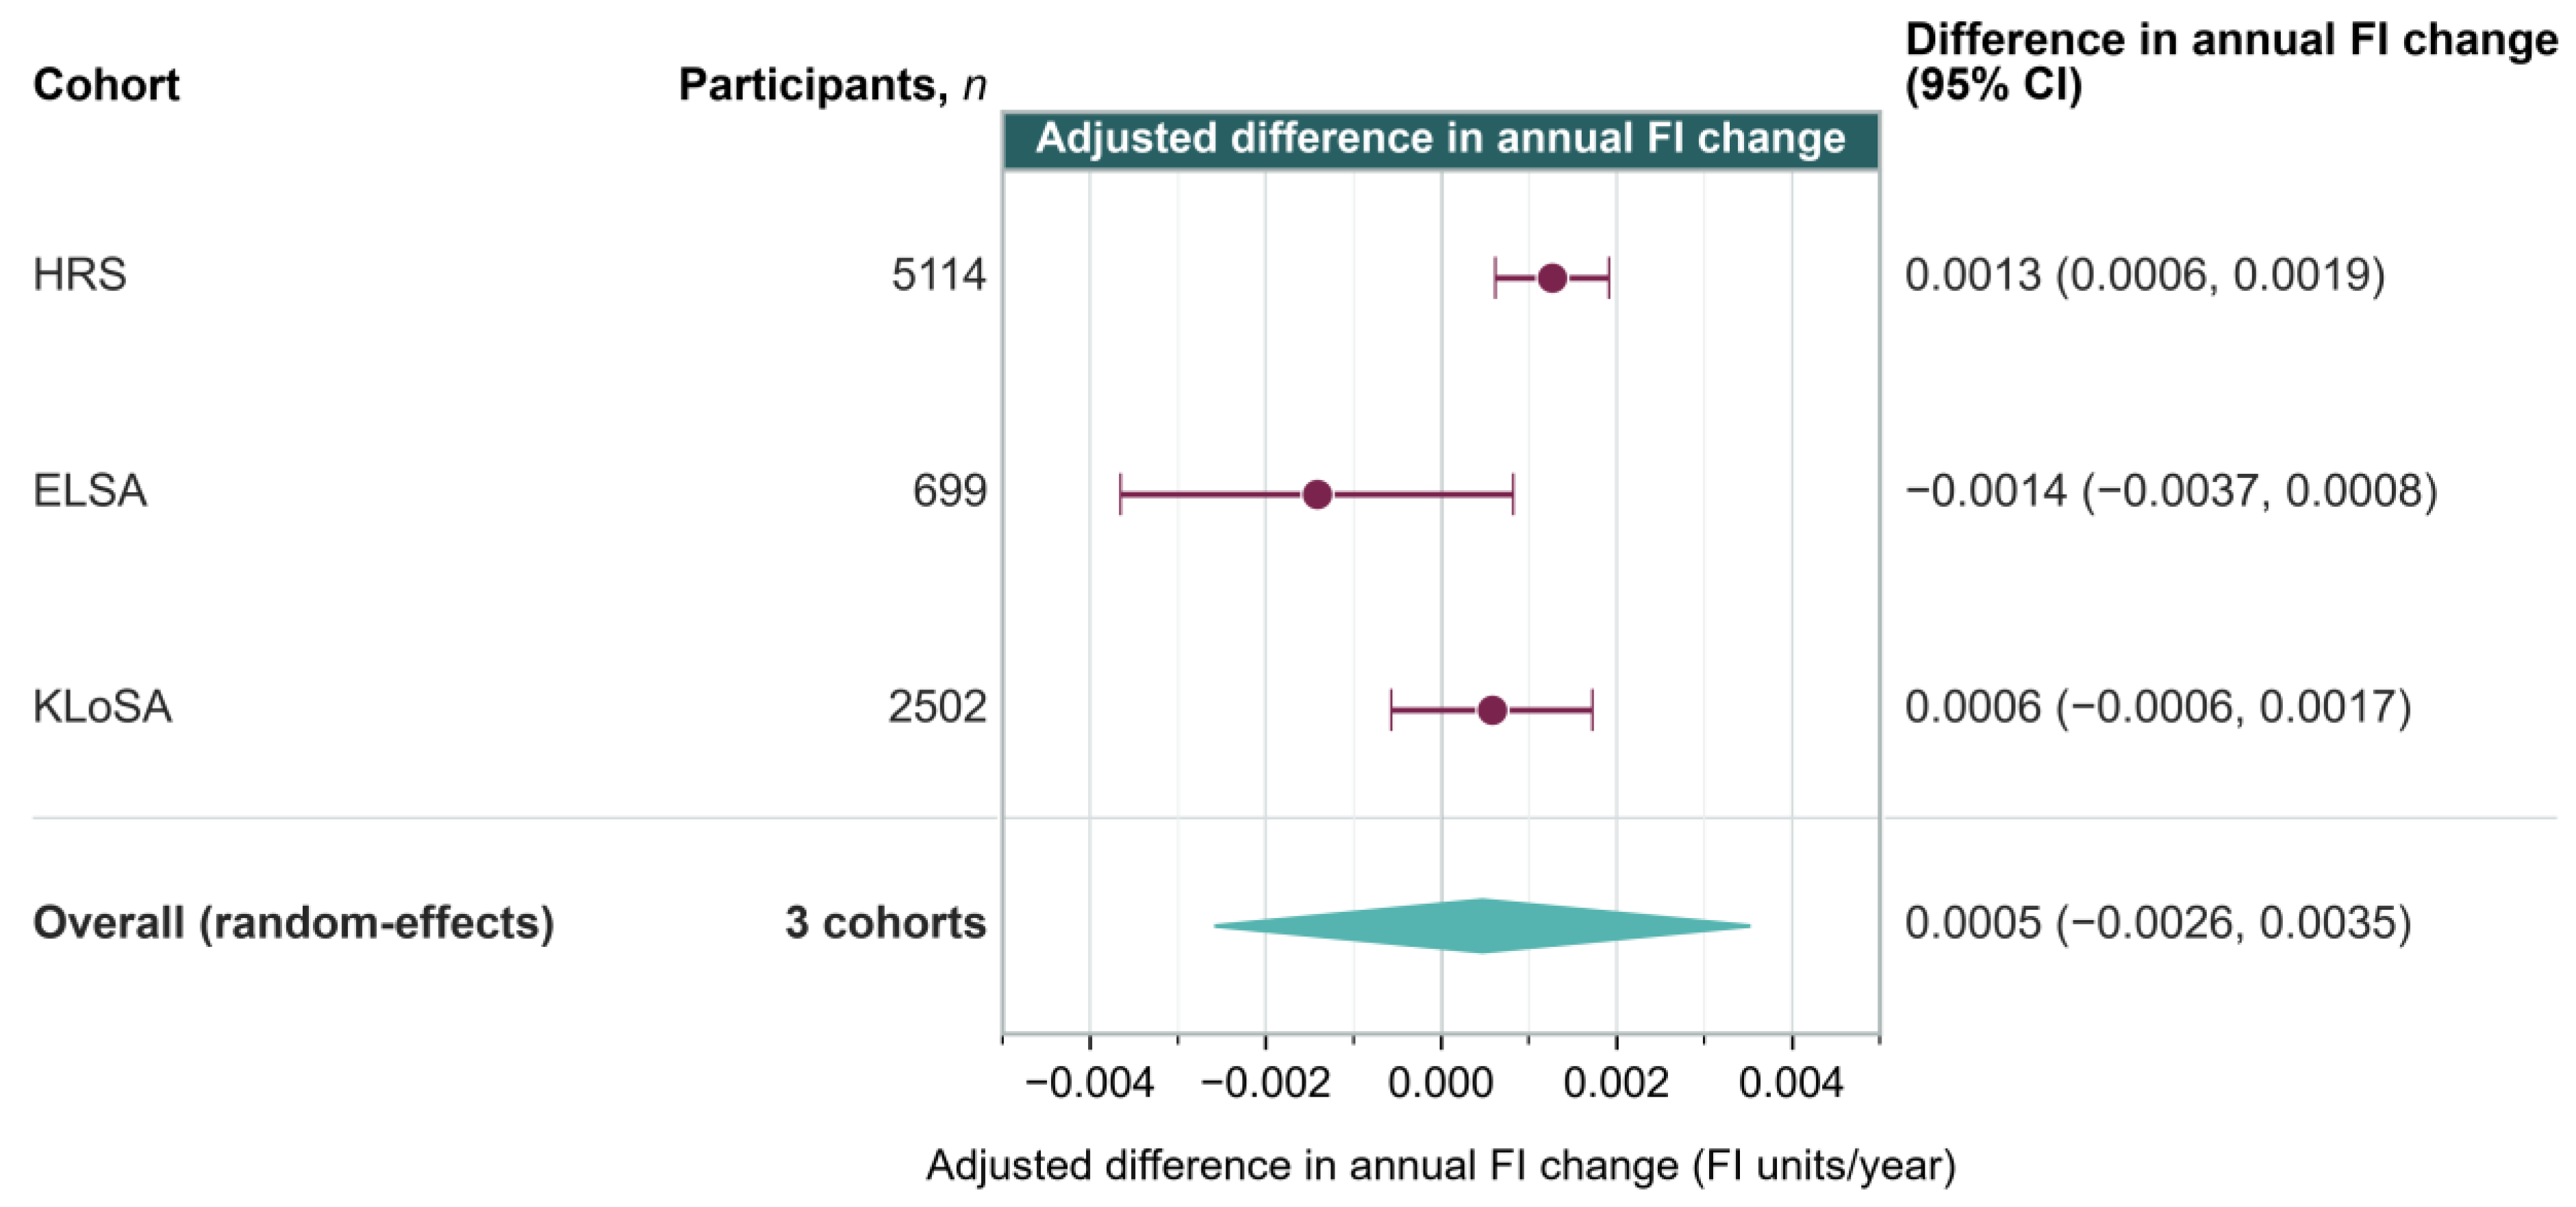
Substantial wealth recovery was not consistently associated with slower frailty progression across the three cohorts (Figure 2). In HRS, the adjusted difference in annual FI change between participants with substantial wealth recovery and those with persistent loss or limited recovery was 0.0013 FI units/year (95% CI, 0.0006 to 0.0019). The corresponding estimates were −0.0014 FI units/year (95% CI, −0.0037 to 0.0008) in ELSA and 0.0006 FI units/year (95% CI, −0.0006 to 0.0017) in KLoSA.
Figure 2.
Wealth recovery and subsequent frailty progression, by cohort. Magenta points show the adjusted difference in annual FI change between participants with substantial wealth recovery and those with persistent loss or limited recovery; horizontal lines indicate 95% CIs. Negative values indicate slower annual FI increase in the substantial recovery group. Cohort-specific estimates were obtained from the primary longitudinal models, and the teal diamond represents the secondary random-effects summary across HRS, ELSA, and KLoSA, with its width indicating the 95% CI. CI, confidence interval; HRS, Health and Retirement Study; ELSA, English Longitudinal Study of Ageing; KLoSA, Korean Longitudinal Study of Aging; FI, frailty index.
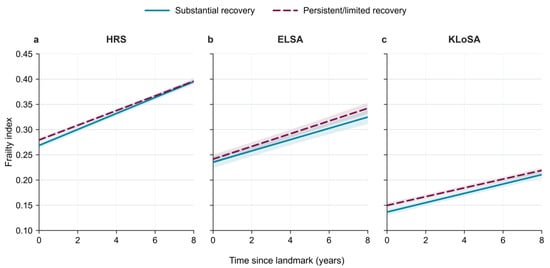
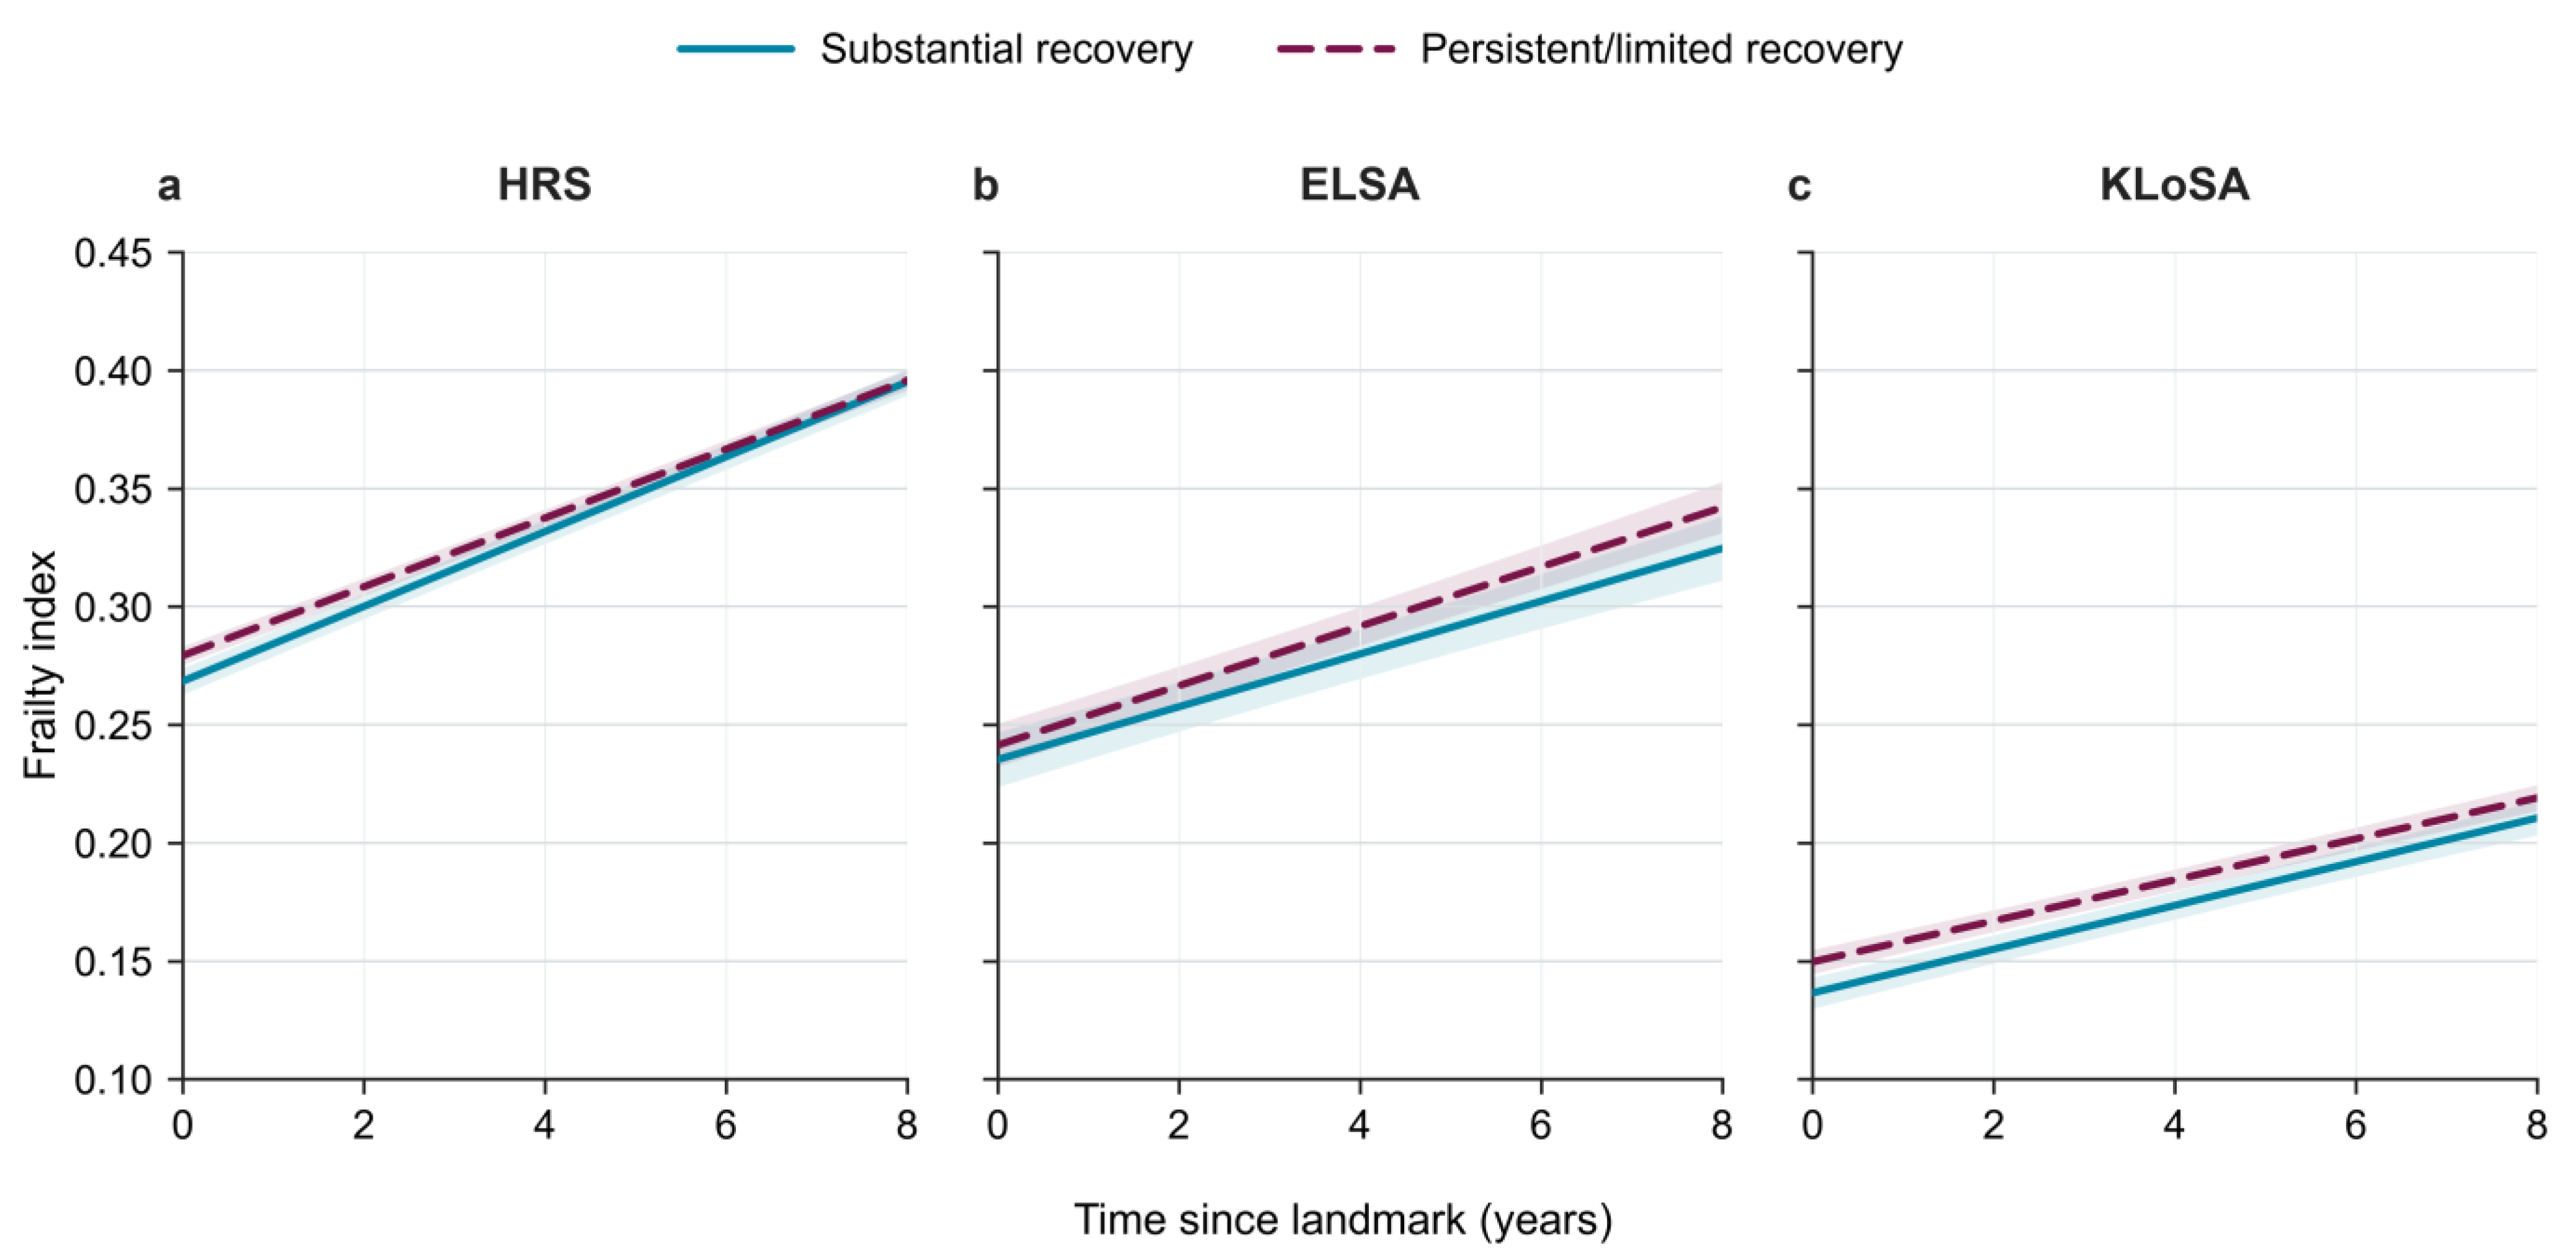
The secondary random-effects summary was 0.0005 FI units/year (95% CI, −0.0026 to 0.0035), with between-cohort heterogeneity (I2 = 72.5%; Figure 2; Supplementary Table S7). In the model-standardised FI-level trajectories, the between-group gap narrowed over time in HRS, widened in ELSA, and changed little in KLoSA (Figure 3).
Figure 3.
Adjusted frailty trajectories after the landmark interview by wealth recovery status and cohort. Lines represent model-based, standardised frailty-index (FI) trajectories for substantial wealth recovery and persistent loss or limited recovery in HRS, ELSA, and KLoSA. Shaded bands indicate pointwise 95% confidence intervals. Predictions were obtained from the cohort-specific primary linear mixed-effects models over 0–8 years after the landmark interview and standardised to the same empirical covariate distribution within each cohort. These trajectories describe adjusted FI levels over time rather than observed group means or causal effects. HRS, Health and Retirement Study; ELSA, English Longitudinal Study of Ageing; KLoSA, Korean Longitudinal Study of Aging; FI, frailty index.
3.3. Core Sensitivity Analyses and Wealth-Related Assessments
Estimates varied when alternative thresholds were used to define substantial wealth recovery (Supplementary Table S7). At the 25% threshold, point estimates were positive in all three cohorts. In ELSA, the estimate was 0.0002 FI units/year (95% CI, −0.0020 to 0.0024), compared with a negative estimate in the primary analysis. At the 100% threshold, the estimates were positive in HRS (0.0009 FI units/year; 95% CI, 0.0002 to 0.0017) and KLoSA (0.0018; 95% CI, 0.0005 to 0.0030), but negative in ELSA (−0.0028; 95% CI, −0.0056 to 0.0000). Estimates using the Common-22 FI and multiple imputation of missing covariates were close to the primary estimates across cohorts. Survey-weighted analyses retained the cohort-specific directions but yielded wider confidence intervals, including in HRS (0.0009 FI units/year; 95% CI, −0.0003 to 0.0021).
Median pre-shock wealth and absolute shock-related wealth losses were both lower among participants with substantial wealth recovery than among those with persistent loss or limited recovery in all three cohorts (Supplementary Table S8). Across sensitivity analyses of wealth loss adjustment and sample restrictions, point estimates remained positive in HRS and negative in ELSA, but changed direction in KLoSA under the absolute-loss restriction (Supplementary Table S9). In ELSA, excluding the lowest pre-shock wealth quintile reduced the sample from 699 to 306 participants. The estimate remained negative (−0.0014 FI units/year; 95% CI, −0.0045 to 0.0018), with a wider confidence interval than in the primary analysis. In KLoSA, restricting the analysis to participants with shock-related wealth losses at or above the cohort-specific 25th percentile yielded an adjusted difference in annual FI change of −0.0003 FI units/year (95% CI, −0.0016 to 0.0011), compared with 0.0006 (95% CI, −0.0006 to 0.0017) in the primary analysis. Estimates were similar to the primary results after using a log-transformed wealth loss proportion for covariate adjustment. Restricting the sample to participants with positive wealth at the shock interview substantially reduced sample sizes, particularly in KLoSA (from 2502 to 801), while the direction of the estimates remained unchanged and confidence intervals widened (Supplementary Table S9).
3.4. Sensitivity to Longitudinal Model Specification and Timing
Allowing participant-specific random slopes reduced the HRS-adjusted difference in annual FI change from 0.0013 to 0.0009 FI units/year (95% CI, −0.0004 to 0.0022) and increased its standard error from 0.00033 to 0.00065 (Supplementary Table S10). In ELSA, the point estimate changed from negative to slightly positive (0.0003 FI units/year; 95% CI, −0.0028 to 0.0034), while the KLoSA estimate remained small and positive with greater uncertainty. When time was modelled nonlinearly, the estimated average annual differences over 0–8 years were 0.0007 FI units/year in HRS (95% CI, −0.0002 to 0.0017), −0.0007 in ELSA (95% CI, −0.0031 to 0.0016), and 0.0004 in KLoSA (95% CI, −0.0008 to 0.0017; Supplementary Table S10).
Excluding the landmark FI assessment from the longitudinal outcome, while retaining the original participants and time origin, yielded adjusted annual differences of 0.0014 FI units/year in HRS (95% CI, 0.0006 to 0.0022), −0.0018 in ELSA (95% CI, −0.0049 to 0.0012), and 0.0010 in KLoSA (95% CI, −0.0006 to 0.0025), with wider confidence intervals than in the primary analyses (Supplementary Table S11). Further adjustment for landmark FI and its interaction with time, using the same post-landmark outcome observations, produced only small additional changes in the estimates across cohorts (Supplementary Table S11). Additional adjustment for the index shock survey wave and its interaction with follow-up time yielded estimates close to those of the primary analyses in HRS, ELSA, and KLoSA (Supplementary Table S12).
4. Discussion
In this longitudinal study of older adults who had experienced a major wealth shock, substantial wealth recovery was not consistently associated with slower subsequent frailty progression across three ageing cohorts. Compared with persistent loss or limited recovery, substantial recovery was associated with a slightly greater adjusted annual FI increase in HRS, a smaller increase in ELSA, and a small positive difference in KLoSA, with 95% confidence intervals crossing zero in ELSA and KLoSA. Findings were generally similar under alternative FI definitions, survey weighting, and multiple imputation of missing covariates. However, estimates varied across recovery thresholds, while allowing participant-specific random slopes changed some point estimates and widened confidence intervals in all three cohorts. The near-zero cross-cohort summary should be interpreted cautiously, given the differences in estimates across only three cohorts.
The cohort-specific estimates should be interpreted with caution because their precision depended partly on the longitudinal model specification. In HRS, allowing participant-specific random slopes reduced the estimated difference in annual FI change and nearly doubled its standard error, with the 95% confidence interval crossing zero. In ELSA, the point estimate changed from negative to slightly positive, although both confidence intervals included zero. In KLoSA, the estimate remained small and positive, but its confidence interval widened. Allowing nonlinear FI trajectories also produced smaller average annual differences over 0–8 years, with slightly larger standard errors and 95% confidence intervals crossing zero in all three cohorts. Together, these findings suggest that the positive association observed in HRS is less certain than the primary model alone would indicate. The estimated differences in annual FI change were also small in absolute terms. For context, Jang et al. (2020) reported that a within-person FI change of approximately 0.028 over one year may be clinically meaningful in community-dwelling older adults [24]. However, this benchmark cannot be directly applied to between-group differences in annual FI progression, and the clinical importance of our estimates remains uncertain.
The health implications of wealth recovery may depend on the resources it makes available for health, rather than the proportion of wealth regained alone. In all three cohorts, participants with substantial recovery had lower median pre-shock wealth and smaller absolute wealth losses, but larger shock-to-landmark wealth gains and higher median wealth at the landmark than those with persistent loss or limited recovery (Supplementary Table S8). However, a recovery proportion alone does not describe the amount of wealth remaining after the shock. Moreover, higher total wealth does not necessarily mean greater access to resources for healthcare and daily needs. Previous research has linked financial difficulties with worsening frailty symptoms [10] and found that borrowing against housing wealth was associated with less cost-related medication non-adherence [15]. For participants with substantial recovery, higher net wealth may not translate into greater resources for ongoing health management. Conversely, participants with persistent loss or limited recovery may still be able to meet health needs through income, healthcare coverage, or other sources of support. These possibilities may help explain why substantial wealth recovery was not consistently associated with slower subsequent FI progression. However, we did not directly measure asset liquidity, healthcare access, or health-related expenditure, so these explanations remain untested.
The association between wealth recovery and frailty progression may also depend on the broader social and economic context. Healthcare coverage, pensions, and other social protection may help older adults meet essential needs even when their wealth has not substantially recovered. Where such support reduces the financial barriers to healthcare and daily living, substantial wealth recovery may provide less additional benefit for subsequent frailty progression compared with persistent loss or limited recovery. Previous studies have suggested that associations between economic circumstances and later-life health may vary across national and welfare contexts [9,13]. However, our study did not directly assess whether social protection modified the association between wealth recovery and frailty progression. Differences in cohort populations and measurements may also contribute to the observed patterns, so the cohort-specific findings cannot be attributed to particular national policies.
Health status may influence both wealth recovery and the availability of subsequent frailty assessments, complicating the interpretation of the observed associations. Health changes between the wealth shock and the recovery assessment may influence both the ability to regain wealth and subsequent frailty progression. Previous longitudinal research has linked deteriorating health to a greater likelihood of subsequent major wealth loss [25], suggesting that health may also influence financial circumstances. In our study, additional adjustment for landmark FI and its interaction with time produced only small changes in the estimates. However, this analysis cannot rule out reverse causation because health and wealth may have influenced each other between the shock and landmark interviews. Subjective expectations may also represent a source of residual confounding. Anticipating the initial wealth shock could influence financial preparation, while expectations of subsequent recovery might shape post-shock financial decisions, potentially affecting recovery status at the landmark. Independently of realised wealth recovery, such expectations about economic events might also relate to subsequent health through increased depressive symptoms among older workers [26]. Another concern is that the availability of subsequent FI assessments may depend on participants' health status. In all three cohorts, participants without subsequent FI assessments were older, had higher FI levels at both the shock and landmark interviews, and were less likely to have substantial wealth recovery (Supplementary Table S6). These differences raise concerns about selection into the analytic sample, as the observed frailty trajectories may not represent all older adults who experienced a major wealth shock. Together, these concerns limit causal interpretation of the observed associations.
Several limitations related to the study design, wealth measurement, and longitudinal modelling remain. First, large reported wealth losses followed by recovery may partly reflect measurement error rather than genuine economic changes, particularly among participants with low pre-shock wealth. Sensitivity analyses restricting participants by pre-shock wealth or absolute wealth loss showed some changes in the estimates. In ELSA, excluding the lowest pre-shock wealth quintile substantially reduced the sample size and widened the confidence interval, while in KLoSA, restricting the analysis to larger absolute losses changed the direction of the point estimate. However, these restrictions changed the populations being analysed and could not distinguish genuine wealth changes from measurement error. We did not formally test whether the association between wealth recovery and frailty progression varied by pre-shock wealth quintile or by the absolute amounts of wealth lost or regained. We also did not characterise wealth volatility before the index shock. Second, wealth recovery was assessed only at the landmark interview, and subsequent changes in wealth were not captured in the recovery classification. Participants classified as having substantial recovery may have experienced later wealth losses, while those in the reference group may have recovered subsequently. Therefore, recovery status at the landmark may not represent participants' longer-term financial circumstances, potentially affecting the observed association with frailty progression. Third, the bounded nature of the FI may limit the suitability of Gaussian linear mixed-effects models. Residual diagnostics showed departures from Gaussian assumptions (Supplementary Figure S2). Alternative random-effects and nonlinear time specifications indicated some sensitivity, while observations at longer follow-up times remained limited. Finally, because our analysis was restricted to participants who experienced a major wealth shock, we could not determine whether subsequent wealth recovery restored frailty trajectories to those of older adults without such shocks.
This study extends previous research on wealth shocks by examining whether subsequent wealth recovery is associated with frailty progression in later life. Using longitudinal data from three ageing cohorts, we show that financial recovery is not consistently associated with slower subsequent frailty progression. From a public health perspective, wealth recovery after a major financial loss should not be assumed to indicate better subsequent health trajectories. Assessing both financial circumstances and frailty may help identify the continuing health needs of older adults. Future studies should track wealth and frailty repeatedly after major financial shocks to examine whether recovery is sustained and how subsequent economic and health trajectories relate to each other. Distinguishing liquid from non-liquid wealth may also help clarify whether recovered resources are available to support ongoing health needs.
5. Conclusions
Substantial wealth recovery after a major wealth shock was not consistently associated with slower subsequent frailty progression across three ageing cohorts. Cohort-specific estimates varied in direction, and some estimates and their precision were sensitive to recovery definitions and longitudinal model specifications. These findings highlight the importance of considering financial recovery and subsequent frailty progression separately, as improved financial circumstances do not necessarily indicate more favourable health trajectories.
Supplementary Materials
The following supporting information can be downloaded at: https://www.mdpi.com/article/10.3390/healthcare14223966/s1, Supplementary Methods S1–S2 (Sections S1.1–S1.3 and S2.1–S2.8); Supplementary Results: Primary-Model Diagnostics and Model-standardised Average Annual FI Change; Figure S1: Selection of the analytic samples in HRS, ELSA, and KLoSA; Figure S2: Diagnostic plots for the primary random-intercept models in HRS, ELSA, and KLoSA; Table S1: Data sources, survey timing, and sampling frameworks; Table S2: Cohort-specific wealth measures, harmonisation, and component coverage; Table S3: Frailty-index construction and cross-cohort harmonisation; Table S4: Covariate definitions, timing, and longitudinal handling; Table S5: Longitudinal frailty follow-up and covariate missingness across the three ageing cohorts; Table S6: Characteristics of Participants With and Without Subsequent Frailty Assessments; Table S7: Primary and sensitivity estimates for wealth recovery and frailty progression; Table S8: Wealth Levels, Shock-Related Losses, and Post-Shock Changes by Cohort and Recovery Status; Table S9: Wealth Measurement and Sample-Restriction Sensitivity Analyses; Table S10: Sensitivity to Random-Effects Structure and Nonlinear Time Specification; Table S11: Sensitivity to Outcome Timing and Landmark Frailty Adjustment; Table S12: Sensitivity to Index Shock Wave Adjustment.
Author Contributions
Conceptualization, B.L.; methodology, B.L. and Z.Z.; software, B.L. and J.G.; validation, B.L., J.G., Z.Z. and D.Z.; formal analysis, B.L. and J.G.; resources, D.Z. and Y.D.; data curation, B.L. and J.G.; writing—original draft preparation, B.L.; writing—review and editing, B.L., J.G., Z.Z., D.Z. and Y.D.; visualization, J.G. and B.L.; supervision, Y.D.; project administration, Y.D. All authors have read and agreed to the published version of the manuscript.
Funding
This research received no external funding.
Institutional Review Board Statement
This study used de-identified secondary data from the Health and Retirement Study (HRS), the English Longitudinal Study of Ageing (ELSA), and the Korean Longitudinal Study of Aging (KLoSA). The original cohort studies obtained ethical approval from their respective institutional or national review bodies and obtained informed consent from participants. The present study involved no new participant recruitment, intervention, or collection of identifiable information; therefore, no additional ethical approval was required for this secondary analysis of de-identified data.
Informed Consent Statement
Informed consent was obtained from all subjects involved in the original HRS, ELSA, and KLoSA studies. No additional informed consent was required for the present secondary analysis of de-identified data.
Data Availability Statement
The source data are available from the respective HRS, ELSA, and KLoSA repositories, subject to their registration and data-use requirements. Harmonised data and documentation used in this study are available through the Gateway to Global Aging Data (https://g2aging.org/), subject to applicable access requirements. Derived analytic datasets may be made available from either the first author or the corresponding author upon reasonable request, where permitted under the original studies’ data-use conditions. Analysis scripts and accompanying documentation are publicly available on GitHub at https://github.com/BojieLiu24/wealth-recovery-frailty-analysis, accessed on 15 November 2026.
Acknowledgments
The Health and Retirement Study (HRS) is sponsored by the National Institute on Aging (U01AG009740) and conducted by the University of Michigan. The English Longitudinal Study of Ageing (ELSA) is supported by the National Institute on Aging (R01AG017644) and the UK National Institute for Health and Care Research Policy Research Programme. The Korean Longitudinal Study of Aging (KLoSA) is conducted by the Korea Employment Information Service. This analysis also used harmonized data and documentation developed by the Gateway to Global Aging Data, supported by the National Institute on Aging. We thank the participants and study teams of HRS, ELSA, and KLoSA for making these longitudinal resources available. During the preparation of this manuscript, the authors used OpenAI ChatGPT-5.6 Sol for language editing and improvements to clarity and organisation. The authors reviewed and edited the output and take full responsibility for the content of this publication.
Conflicts of Interest
The authors declare no conflicts of interest.
Abbreviations
The following abbreviations are used in this manuscript:
| CI | Confidence interval |
| ELSA | English Longitudinal Study of Ageing |
| FI | Frailty index |
| HRS | Health and Retirement Study |
| KLoSA | Korean Longitudinal Study of Aging |
References
- Hoogendijk, E.O.; Afilalo, J.; Ensrud, K.E.; Kowal, P.; Onder, G.; Fried, L.P. Frailty: Implications for Clinical Practice and Public Health. Lancet 2019, 394, 1365–1375. [Google Scholar] [CrossRef] [Scilit]
- Rockwood, K.; Mitnitski, A. Frailty in Relation to the Accumulation of Deficits. J. Gerontol. Ser. A Biol. Sci. Med. Sci. 2007, 62, 722–727. [Google Scholar] [CrossRef] [Scilit]
- Searle, S.D.; Mitnitski, A.; Gahbauer, E.A.; Gill, T.M.; Rockwood, K. A Standard Procedure for Creating a Frailty Index. BMC Geriatr. 2008, 8, 24. [Google Scholar] [CrossRef] [Scilit]
- Stolz, E.; Mayerl, H.; Waxenegger, A.; Rásky, É.; Freidl, W. Impact of Socioeconomic Position on Frailty Trajectories in 10 European Countries: Evidence From the Survey of Health, Ageing and Retirement in Europe (2004–2013). J. Epidemiol. Community Health 2017, 71, 73–80. [Google Scholar] [CrossRef] [Scilit]
- Pollack, C.E.; Chideya, S.; Cubbin, C.; Williams, B.; Dekker, M.; Braveman, P. Should Health Studies Measure Wealth? A Systematic Review. Am. J. Prev. Med. 2007, 33, 250–264. [Google Scholar] [CrossRef] [Scilit]
- Lin, I.-F.; Brown, S.L. The Economic Consequences of Gray Divorce for Women and Men. J. Gerontol. Ser. B Psychol. Sci. Soc. Sci. 2021, 76, 2073–2085. [Google Scholar] [CrossRef] [Scilit]
- Gustman, A.L.; Steinmeier, T.L.; Tabatabai, N. The Great Recession, Decline, and Rebound in Household Wealth for the Near-Retirement Population. J. Retire. 2014, 2, 27–44. [Google Scholar] [CrossRef] [Scilit]
- Maharani, A.; Sinclair, D.R.; Chandola, T.; Bower, P.; Clegg, A.; Hanratty, B.; Nazroo, J.; Pendleton, N.; Tampubolon, G.; Todd, C.; et al. Household Wealth, Neighbourhood Deprivation and Frailty Amongst Middle-Aged and Older Adults in England: A Longitu-Dinal Analysis Over 15 Years (2002–2017). Age Ageing 2023, 52, afad034. [Google Scholar] [CrossRef] [Scilit]
- Uccheddu, D.; Gauthier, A.H.; Steverink, N.; Emery, T. Gender and Socioeconomic Inequalities in Health at Older Ages Across Different European Welfare Clusters: Evidence From SHARE Data, 2004–2015. Eur. Sociol. Rev. 2019, 35, 346–362. [Google Scholar] [CrossRef] [Scilit]
- Sirven, N.; Dumontet, M.; Rapp, T. The Dynamics of Frailty and Change in Socio-Economic Conditions: Evidence for the 65+ in Europe. Eur. J. Public Health 2020, 30, 715–719. [Google Scholar] [CrossRef] [Scilit]
- Pool, L.R.; Needham, B.L.; Burgard, S.A.; Elliott, M.R.; de Leon, C.F.M. Negative Wealth Shock and Short-Term Changes in Depressive Symptoms and Medication Adherence Among Late Middle-Aged Adults. J. Epidemiol. Community Health 2017, 71, 758–763. [Google Scholar] [CrossRef] [Scilit]
- Pool, L.R.; Burgard, S.A.; Needham, B.L.; Elliott, M.R.; Langa, K.M.; Mendes de Leon, C.F. Association of a Negative Wealth Shock With All-Cause Mortality in Middle-Aged and Older Adults in the United States. JAMA 2018, 319, 1341–1350. [Google Scholar] [CrossRef] [Scilit]
- Cho, T.-C.; Yu, X.; Gross, A.L.; Zhang, Y.S.; Lee, J.; Langa, K.M.; Kobayashi, L.C. Negative Wealth Shocks in Later Life and Subsequent Cognitive Function in Older Adults in China, England, Mexico, and the USA, 2012–18: A Population-Based, Cross-Nationally Harmonised, Longitudinal Study. Lancet Healthy Longev. 2023, 4, e461–e469. [Google Scholar] [CrossRef] [Scilit]
- Ran, G.; Zuo, C.; Liu, D. Negative Wealth Shocks and Subsequent Depressive Symptoms and Trajectories in Middle-Aged and Older Adults in the USA, England, China, and Mexico: A Population-Based, Multinational, and Longitudinal Study. Psychol. Med. 2024, 54, 3888–3895. [Google Scholar] [CrossRef] [Scilit]
- Moulton, S.; Rhodes, A.; Haurin, D.; Loibl, C. Managing the Onset of a New Disease in Older Age: Housing Wealth, Mortgage Borrowing, and Medication Adherence. Soc. Sci. Med. 2022, 314, 115437. [Google Scholar] [CrossRef] [Scilit]
- Farrell, S.; Kane, A.E.; Bisset, E.; Howlett, S.E.; Rutenberg, A.D. Measurements of Damage and Repair of Binary Health Attributes in Aging Mice and Humans Reveal That Robustness and Resilience Decrease with Age, Operate Over Broad Timescales, and Are Affected Differently by Interventions. eLife 2022, 11, e77632. [Google Scholar] [CrossRef] [Scilit]
- Sonnega, A.; Faul, J.D.; Ofstedal, M.B.; Langa, K.M.; Phillips, J.W.R.; Weir, D.R. Cohort Profile: The Health and Retirement Study (HRS). Int. J. Epidemiol. 2014, 43, 576–585. [Google Scholar] [CrossRef] [Scilit]
- Steptoe, A.; Breeze, E.; Banks, J.; Nazroo, J. Cohort Profile: The English Longitudinal Study of Ageing. Int. J. Epidemiol. 2013, 42, 1640–1648. [Google Scholar] [CrossRef] [Scilit]
- Jang, S.-N. Korean Longitudinal Study of Ageing (KLoSA): Overview of Research Design and Contents. In Encyclopedia of Geropsychology; Pachana, N.A., Ed.; Springer: Singapore, 2016; pp. 1–9. [Google Scholar] [CrossRef] [Scilit]
- Lee, J.; Phillips, D.; Wilkens, J.; Gateway to Global Aging Data Team. Gateway to Global Aging Data: Resources for Cross-National Comparisons of Family, Social Environment, and Healthy Aging. J. Gerontol. Ser. B Psychol. Sci. Soc. Sci. 2021, 76, S5–S16. [Google Scholar] [CrossRef] [Scilit]
- Theou, O.; Haviva, C.; Wallace, L.; Searle, S.D.; Rockwood, K. How to Construct a Frailty Index from an Existing Dataset in 10 Steps. Age Ageing 2023, 52, afad221. [Google Scholar] [CrossRef] [Scilit]
- Seligman, B.; Ward, M.; Ferranna, M.; Bloom, D.E.; Kenny, R.A.; Orkaby, A.R. A Harmonized Frailty Index Using Global Aging Data. J. Gerontol. Ser. A Biol. Sci. Med. Sci. 2026, 81, glaf217. [Google Scholar] [CrossRef] [Scilit]
- VanderWeele, T.J. Principles of Confounder Selection. Eur. J. Epidemiol. 2019, 34, 211–219. [Google Scholar] [CrossRef] [Scilit]
- Jang, I.-Y.; Jung, H.-W.; Lee, H.Y.; Park, H.; Lee, E.; Kim, D.H. Evaluation of Clinically Meaningful Changes in Measures of Frailty. J. Gerontol. Ser. A Biol. Sci. Med. Sci. 2020, 75, 1143–1147. [Google Scholar] [CrossRef] [Scilit]
- Cho, T.-C.; Yu, X.; Adar, S.D.; Choi, H.; Langa, K.M.; Kobayashi, L.C. Changes in Marital and Health Status as Risk Factors for a Subsequent Negative Wealth Shock: A Population-Based Longitudinal Study in the United States, 1995–2020. Soc. Sci. Med. 2025, 371, 117905. [Google Scholar] [CrossRef] [Scilit]
- Mandal, B.; Ayyagari, P.; Gallo, W.T. Job Loss and Depression: The Role of Subjective Expectations. Soc. Sci. Med. 2011, 72, 576–583. [Google Scholar] [CrossRef] [Scilit]

Disclaimer/Publisher’s Note: The statements, opinions and data contained in all publications are solely those of the individual author(s) and contributor(s) and not of MDPI and/or the editor(s). MDPI and/or the editor(s) disclaim responsibility for any injury to people or property resulting from any ideas, methods, instructions or products referred to in the content. |
© 2026 by the authors. Licensee MDPI, Basel, Switzerland. This article is an open access article distributed under the terms and conditions of the Creative Commons Attribution (CC BY) license.