


Highlights
What are the main findings?
- It extended the previously established multidimensional framework for analyzing the agglomeration of medical and health talent (including density, scale, intensity and equilibrium) to the longitudinal urban level.
- Urban hospital beds were identified as the most robust and consistently positive factors associated with medical and health talent agglomeration across different dimensions of talent agglomeration.
- Economic factors demonstrated nonlinear association and substantial heterogeneity across agglomeration dimensions and regions.
What are the implications of the main findings?
- Talent attraction policies should move beyond uniform approaches toward region specific strategies integrating economic, social, and ecological conditions.
- Strengthening medical resource capacity should be considered as a fundamental regional strategy for attracting and retaining medical and health talents.
Abstract
Background: Medical and health talent (MHT) is a core strategic resource for safeguarding public health. Understanding the factors associated with MHT agglomeration is essential for improving healthcare workforce planning and optimizing the allocation of health resources. Methods: Using panel data from 285 prefecture-level cities in China spanning 2004–2019, this study extended the previously established multidimensional framework for analyzing MHT agglomeration encompassing density, scale, intensity, and equilibrium to a longitudinal urban setting. Spatial autocorrelation analysis and a two-way fixed effects panel model were used to examine economic, social, and ecological factors associated with MHT agglomeration. Robustness tests, endogeneity checks, and heterogeneity analysis were also conducted. Results: The spatial autocorrelation analysis reveals that the spatial distribution of MHT exhibits a generally random and dispersed pattern. Urban hospital beds per 1000 population maintained a significant positive association across all model specifications, representing the most robust factor associated with talent agglomeration. Sci-tech expenditure exhibited nonlinear association, while ecological factors displayed pronounced dimensional heterogeneity and regional differentiation. Conclusions: MHT agglomeration is associated with factors across multiple dimensions, with hospital bed capacity showing a particularly consistent association.
1. Introduction
The Healthy China strategy is a vital component of China’s current economic and social development, and medical and health talent (MHT) is central to its implementation. As global competition in scientific and technological innovation intensifies, MHT remains a core strategic resource for advancing medical technology, improving public health services, and safeguarding population health and well-being. The efficiency of its spatial allocation directly affects the overall effectiveness of the national healthcare system and coordinated regional development. Since China’s reform and opening-up, MHT has become highly concentrated in eastern coastal regions and major cities. Recent studies on the spatial distribution of primary care resources and high-quality medical services have widely documented this pattern [1,2,3]. Although this uneven distribution has improved innovation efficiency, it has also exacerbated interregional inequalities in medical and health resources, limiting equitable access to high-quality medical resources across regions.
Compared with traditional labor migration, the location decisions of highly skilled medical and health professionals are more complex. These professionals consider not only conventional economic incentives, such as remuneration and benefits, but also career development opportunities, family quality of life, children’s education, and the urban ecological environment. However, the convergence of local policies in the current competition for talent reflects an insufficient understanding of the factors associated with talent agglomeration. Many regions still rely excessively on economic instruments, such as one-off relocation subsidies and salary bonuses. They give less attention to building long-term attractiveness by improving social services and the ecological environment, which limits the precision and sustainability of talent policies. Therefore, identifying the key factors associated with MHT agglomeration and determining how their associations differ across agglomeration dimensions are important research priorities for optimizing the spatial allocation of talent and developing more targeted policies.
Although existing studies have examined economic, social, and ecological factors influencing talent mobility, several issues remain insufficiently explored at the city level. First, prefecture-level cities are important local labor markets and administrative units for allocating healthcare resources, providing public services, and implementing talent policies in China. Analyses conducted only at the national or provincial level may therefore obscure substantial differences among cities within the same province [4]. Second, although previous studies have examined the distribution of physicians and healthcare resources across Chinese cities [5,6], many relied on a single indicator or a limited set of conventional indicators, such as physicians or hospital beds per population. These indicators provide important information on resource availability and inequality but are not designed to compare different manifestations of talent agglomeration. Consequently, whether the same economic, social, and ecological factors have different associations with different dimensions of MHT agglomeration remains unclear. To address this issue, this study uses panel data from 285 prefecture-level cities over 16 consecutive years (2004–2019) to examine these dimension-specific associations.
This paper makes the following contributions. First, it constructs an integrated economic–social–ecological analytical framework that transcends single-dimension. Incorporating squared terms for economic variables, it examines the nonlinear associations of per capita GRP and science and technology expenditure with MHT agglomeration, extending the linear specifications used in most existing studies. Second, it extends our previously developed multidimensional framework to a longitudinal city-level setting, shifting the focus from measurement and spatiotemporal description to the analysis of associated factors. Specifically, we use the four dimensions as parallel outcomes to examine whether economic, social, and ecological characteristics have different associations with different manifestations of agglomeration across 285 cities over 2004–2019.
2. Institutional Background
Understanding the factors associated with the spatial allocation of MHT in China’s healthcare sector requires a clear account of how the relevant institutional arrangements have evolved. Since China’s reform and opening-up, changes in the healthcare system and personnel management institutions have profoundly influenced the location choices and mobility patterns of medical and health professionals.
2.1. Basic Structure of China’s Healthcare System and Policy Background
The regional allocation of medical and health resources in China has long been uneven, with more resources in the east than in the west and in urban areas than in rural areas. This pattern is closely linked to hospital management institutions and policy priorities. Governments at all levels have introduced a series of supporting measures to develop a four-tier healthcare service system led by national medical centers and supported by regional medical centers at various levels. This system forms a comprehensive healthcare service network spanning the national, provincial, municipal, and county levels [7].
The tax-sharing reform of 1994 established separate fiscal responsibilities for central and local governments. Under this framework, local governments bear most expenditure on public services, including healthcare. Economically developed regions can invest more fiscal resources in building medical institutions and developing their healthcare workforce. Less-developed regions face fiscal constraints, creating a cumulative advantage for stronger regions. In their study of medical resource allocation in Xinjiang, Fu et al. [8] found that the development of the medical and health technical workforce and the level of regional economic development were the dominant factors associated with spatial disparities in medical resource allocation. Medical talent attrition was more pronounced in economically less-developed regions.
Regarding social factors, Li [9] found that economically developed megacities strongly attract medical talent through their accumulated social resources and advanced technologies. Consistent with the Matthew effect, the coexistence of talent agglomeration in higher-level medical institutions and severe talent attrition in lower-level institutions has become increasingly pronounced.
The hospital grading management system, implemented since 1989, classifies hospitals into three tiers and ten grades, with tertiary Grade A hospitals concentrated in provincial capitals and regional central cities. The detailed evaluation criteria for tertiary hospitals require rigorous institutional development, quality control, and resource allocation. These requirements confer institutional and managerial advantages on top-tier institutions relative to lower-grade institutions [10]. Consequently, top-tier hospitals benefit from differentiated policies on fiscal allocations, fee standards, equipment provision, and talent recruitment. While standardizing hospital management, the system has also reinforced the spatial hierarchy of medical resources, directing talent toward medical institutions in large cities with higher administrative status.
2.2. Evolution of Medical and Health Talent Policies and Regional Talent Competition
Since the beginning of the 21st century, governments at all levels have increasingly regarded talent as the primary resource for innovation and development. In 2002, the Central Committee of the Communist Party of China proposed the strategy of “strengthening the nation through talent,” and in 2010, it issued the Outline of the National Medium- and Long-Term Talent Development Plan (2010–2020). To address interregional imbalances in medical resource allocation, the state has implemented a series of policy interventions targeting western China and other less-developed regions. These regions commonly face insufficient and unevenly distributed healthcare resources and lower operational efficiency in primary care institutions [11]. From 2012 to 2021, the number of health technicians in primary healthcare institutions nationwide increased from 2.0518 million to 3.3016 million, a total increase of 60.91% [12]. Nevertheless, market forces and institutional constraints continue to limit the effectiveness of policies intended to direct talent toward primary care and less-developed areas.
3. Literature Review
3.1. Talent Agglomeration and Its Measurement Indicators
The Ministry of Science and Technology issued the National Medium- and Long-Term Medical and Health Talent Development Plan (2010–2020) in 2011. The plan defined medical and health talent as workers who possess certain professional knowledge or specialized skills, engage in creative scientific and technological activities, and contribute to the development of science and technology as well as the economy and society [13]. Scientific and technological talent agglomeration occurs during human capital mobility and migration, as individuals converge in a specific geographic region in response to income, resources, culture, and the environment. This process leads to the rapid concentration of scientific and technological talent in that area. Simon (1998) and Giannetti (2001) argued that human capital agglomeration is a form of spatial concentration in which professionals with different skills cluster to complement one another, improve work efficiency, reduce production costs, and achieve economies of scale, forming the basis of the concept of talent agglomeration [14,15]. Liu et al. (2008) defined scientific and technological talent agglomeration as the movement of scientific and technological talent across different regions or units in response to specific conditions [16]. They described it as a complex form of population mobility that reflects differences in the attractiveness of resources to scientific and technological talent [16].
Several indicators have been used to measure MHT agglomeration. Li et al. (2011) measured the density of scientific and technological human resources using an approach analogous to population density, calculating the ratio of the total number of personnel to the total regional area [17]. Zhao et al. (2012) constructed an indicator system for the agglomeration effects of medical and health talent based on the characteristics of such effects [18]. Chen et al. (2017) selected the number of scientific and technological innovation human resources and the size of the total talent pool as variables for constructing MHT agglomeration indicators [19]. Xiu et al. (2017) drew on the concept of location entropy and introduced the notion of MHT agglomeration equilibrium to evaluate talent agglomeration comprehensively [20]. Building on these approaches, Zhang et al. (2025) established a comprehensive four-dimensional index system—encompassing Talent Agglomeration Density (TAD), Talent Agglomeration Scale (TAS), Talent Agglomeration Intensity (TAI), and Talent Agglomeration Equilibrium (TAE) [21]. Using long-term data from 1982 to 2020, they systematically analyzed the spatiotemporal evolution and regional disparities of MHT in China [21]. This multidimensional framework provides the methodological basis for calculating the core indicators in this study.
3.2. Factors Associated with Talent Agglomeration
Like changes in population size, talent agglomeration is influenced by numerous factors. Krugman (1991) proposed the “center–periphery” model of horizontal talent agglomeration [22]. Palivos and Wang (1996) identified knowledge spillover effects, fixed asset investment, internal economies of scale, external economies of scale, government talent policies, and salary levels as the main factors influencing talent agglomeration effects [23]. In their study of the relationship between scientific and technological talent and the regional environment, Rotemberg and Saloner (2000) found that healthy scientific and technological talent competition, incentive mechanisms, and the improvement of relevant laws and regulations play important roles in regional scientific and technological talent agglomeration [24]. Researchers in China have conducted extensive research on the driving factors of talent agglomeration. Li (2012) employed a system dynamics approach to analyze the roles of the industrial economic environment, educational environment, and social and cultural environment in talent agglomeration [25]. Li (2013) reported that differences and changes in the natural environment, economic foundation, political environment, and cultural education affect the overall spatial distribution and spatiotemporal evolution of academicians of the Chinese Academy of Sciences to varying degrees [26]. Examining life satisfaction and factors influencing attrition among scientific and technological professionals, Hou et al. (2014) found that ethnic identity, educational attainment, job satisfaction, and life satisfaction are important factors affecting scientific and technological talent agglomeration [27]. Fang (2016) demonstrated that science and technology is the primary factor continuously influencing the spatial agglomeration of the creative class in Guangdong Province [28]. Zhang (2018) found significant positive associations of economic development and local fiscal investment in education with talent agglomeration at all quantiles [29]. Wage levels and public service provision showed significant positive associations at lower quantiles, whereas urbanization showed a significant positive association at higher quantiles [29]. Huang et al. (2018) found a relatively close relationship between the departure of high-level talent and the acquisition of academic capital, but a weaker association with administrative resources and economic capital [30]. They argued that promoting the rational and orderly mobility of high-level talent requires addressing market failures and issues of public policy legitimacy and anomie [30]. Xu et al. (2019) found that economic development level and scientific research environment are the main factors influencing the interprovincial mobility of scientific and technological talent [31]. Ning et al. (2020) analyzed the state of primary healthcare workforce development in Fujian Province, concluding that some areas face problems in recruitment, training and deployment, and safeguards for staff mobility [32]. They recommended strengthening primary healthcare workforce development [32]. Wang (2020) analyzed medical and health resource agglomeration in 13 cities of Jiangsu Province. Registered nurses, health technicians, licensed physicians, and licensed assistant physicians contributed substantially to resource agglomeration [33]. Wuxi, Nanjing, and Suzhou had relatively high levels of medical resource agglomeration [33].
However, several gaps remain in the literature. First, research on agglomeration mechanisms specific to MHT is relatively scarce. Second, most studies use a single indicator to measure talent agglomeration, making it difficult to capture its multidimensional characteristics, including density, scale, intensity, and equilibrium. This study seeks to address these gaps. Drawing on existing research, it constructs an analytical framework encompassing economic, social, and ecological dimensions. Economic factors provide the foundational conditions for talent agglomeration. Per capita GRP reflects regional economic development, whereas science and technology expenditure characterizes the innovation environment. These factors constitute the economic basis for talent agglomeration. Social factors encompass the provision of healthcare resources and cultural facilities, which directly influence professionals’ quality of life and career development opportunities. Ecological factors include indicators of environmental quality, such as air quality and urban greening.
4. Materials and Methods
4.1. Variables and Data
4.1.1. Dependent Variables
The dependent variables measure the level of medical and health talent (MHT) agglomeration in China. To obtain consistent and comparable city-level measures over 2004–2019, we used the numbers of licensed physicians and licensed assistant physicians reported in the annual China City Statistical Yearbook. These physicians constitute a core professional group within MHT: they are regulated healthcare personnel directly engaged in diagnosis, treatment, and the delivery of medical services. Their numbers therefore provide a useful indication of changes in local healthcare human resources. Previous city-level studies have also used this measure [34,35]. Given data availability, the number of “licensed (assistant) physicians” published in statistical yearbooks was adopted as a proxy variable for MHT. Drawing on existing studies, we constructed a four-dimensional index system to measure the level of MHT agglomeration.
Talent Agglomeration Density (TAD): Defined as the ratio of the MHT count to the total area of a region, reflecting the agglomeration degree of MHT per unit area. A higher value indicates greater regional MHT density, whereas a lower value indicates lower density [17,36]. The calculation formula is as follows:
where i denotes the city, t denotes the year, MHTit represents the MHT count in city i in year t, and Ait represents the area of city i in year t.
Talent Agglomeration Scale (TAS): Defined as the ratio of a city’s MHT count to the total MHT count in its province, this indicator reflects the city’s share of provincial MHT. A larger share indicates a larger agglomeration scale in the city, whereas a smaller share indicates a smaller scale [20,37]. The calculation formula is as follows:
where MHTt denotes the total MHT count in the province where the city is located in year t.
Talent Agglomeration Intensity (TAI): Defined as the ratio of the MHT count in a city to its total population, this indicator reflects the concentration of MHT relative to the population in each city. A higher ratio indicates greater agglomeration intensity, whereas a lower ratio indicates lower intensity [20,38]. The calculation formula is as follows:
where TPOPit denotes the total population of city i in year t.
Talent Agglomeration Equilibrium (TAE): Constructed with reference to the concept of location entropy, the location entropy index of MHT reflects the equilibrium degree of MHT agglomeration. A higher TAE indicates a higher degree of MHT agglomeration in the city. When TAE > 1, the city’s MHT equilibrium degree is above the provincial average; when TAE < 1, it is below the provincial average; and when TAE = 1, it equals the provincial average [20,39]. The calculation formula is as follows:
where MHTit denotes the MHT count in city i in year t, and TPOPit denotes the total population of city i in year t.
4.1.2. Explanatory Variables
Drawing on existing studies and considering data availability, explanatory variables were selected from three dimensions: economic, social, and ecological factors.
Economic factors: Economic factors have been a central research focus in studies of job changes, talent attrition, and attraction at the micro level, as well as interregional mobility and international migration at the macro level. Florida [36] examined the relationship between income and the geographic distribution of talent. In addition to per capita GDP, Zhao et al. [40] used the share of tertiary industry output and R&D expenditure as economic indicators. Hu et al. [41,42,43] examined the influence of industrial agglomeration on MHT agglomeration, using the number of high-tech enterprises as an indicator. Drawing on these studies and considering data availability, this study adopts per capita regional gross domestic product and science and technology expenditure as economic indicators. Their squared terms were also included to test for potential nonlinear relationships.
Social factors: Zhao et al. [40] used the number of healthcare institutions as a medical and health indicator within the social dimension. Satpathy et al. [44] included the impact of healthcare levels on migration intentions in their questionnaire. Li et al. [45] examined associations of public library collections per capita and public library floor space per 10,000 population with MHT agglomeration. This paper adopts Urban hospitals, Urban hospital beds (number of hospital beds per 1000 population), and public library collections as social indicators. These variables reflect access to medical resources, medical service capacity, and public cultural service provision, respectively.
Ecological factors: Florida [36] examined the role of warm climates in attracting talent. Cui et al. [46] adopted climate, air quality, and water bodies as indicators of the natural environment when studying the relationship between urban amenities and talent agglomeration. Yu et al. [47,48] also employed climate, air quality, and water quality as natural amenity factors in their research on urban amenities. Zhang [49] adopted average January and July temperatures, sunshine hours, humidity, the proportion of days with good air quality, and the proportion of park green space area as natural environment indicators when studying urban amenity to attract talent in the United States. Sun et al. [50] treated environmental pollution as an influencing factor in their study of the impact of the environment on talent agglomeration. Zou [51] argued that the more severe the environmental pollution, the lower the degree of talent agglomeration. Drawing on existing research and considering data availability, this study uses industrial SO2 emissions, industrial dust emissions, urban green space, and industrial wastewater as ecological indicators potentially associated with MHT agglomeration. Among these, green space area reflects the level of ecological development, while pollutant emissions reflect environmental pressure.
To mitigate heteroscedasticity, all continuous variables were transformed using natural logarithms.
Descriptive statistics for all variables are presented in Table 1.
Table 1.
Descriptive statistics of panel data.
The descriptive statistics show considerable intercity disparities across all four agglomeration indicators. The mean TAD was 3.281, with a standard deviation of 4.186, and the maximum (57.32) was approximately 17.5 times the mean. These values indicate substantial variation in physician density per unit area and a high concentration of MHT in certain cities. The mean TAS was 10.53, with a standard deviation of 16.60 and maximum of 100, reflecting extreme imbalance in the share of physicians across cities within provinces, with individual cities accounting for a predominant proportion of physician resources. The mean TAI was 32.37 per 10,000 population. The wide gap between the minimum (3.332) and maximum (146.3) indicates that physician numbers relative to population in some cities far exceeded the national average, while others remained at relatively low levels. The mean TAE was 0.972, slightly below the provincial average of 1, with a standard deviation of 0.402, also indicating substantial variation.
Among the economic explanatory variables, the mean log-transformed per capita GRP was 10.58, with a standard deviation of 0.776, indicating pronounced differences in economic development across cities. Mean log-transformed science and technology expenditure was 8.560, with a standard deviation of 2.152, reflecting uneven fiscal investment in science and technology. Among social factors, the mean log-transformed number of urban hospitals was 3.923. Mean urban hospital beds were 6.456 per 1000 population, with a maximum of 25.39, highlighting considerable regional differences in healthcare service capacity. Among ecological factors, the standard deviations of log-transformed industrial SO2 emissions and industrial dust emissions both exceeded 1, while that of log-transformed industrial wastewater was 1.178. These statistics indicate similarly pronounced intercity differences in environmental pressure. These characteristics provide a basis for the subsequent heterogeneity analysis. Drawing on existing studies and considering data availability, this study includes per capita GRP and science and technology expenditure, along with their squared terms, as economic indicators. The squared terms allow the analysis to detect potential nonlinear associations that linear specifications would not capture.
4.1.3. Data Sources
This study uses panel data from 285 prefecture-level cities in China spanning 2004–2019. The core indicators cover talent agglomeration and economic, social, and ecological factors. Data were sourced from the China City Statistical Yearbook (2005–2020). Missing values were imputed using linear interpolation, a common practice in studies using Chinese prefecture-level panel data [52,53]. Approximately 689 variable-level observations were interpolated, accounting for about 1.01% of the 68400 data values in the final sample of 4560 city-year observations. The variables most affected were industrial SO2 emissions (2.74%), industrial wastewater (2.74%), and public library collections (1.12%). Core variables, including per capita GRP and urban hospital beds, had interpolation rates below 1%. Given the low overall proportion of missing values and their dispersed distribution across cities and years, linear interpolation was considered appropriate for this dataset.
4.2. Spatial Autocorrelation Analysis
Tobler noted that “the first Law of geography: everything is related to everything else, but near things are more related than distant things” [54]. Spatial autocorrelation analysis is commonly used to examine whether observations of a variable are statistically related across locations and to explore spatial associations among indicators. This study uses Moran’s I and Moran scatter plots to characterize the spatial distribution of MHT across cities and identify patterns of clustering and dispersion.
4.2.1. Global Spatial Autocorrelation
The global Moran’s I reflects the overall spatial autocorrelation of the study area and is used to determine whether the research objects exhibit spatial autocorrelation relationships as a whole. It is a spatial autocorrelation statistic for the entire study area [55,56,57]. The calculation formula is as follows:
where i ≠ j, n is the number of research objects; X is the observed value, is the mean of Xi; Wij is the spatial weight matrix between research objects i and j, with a value of 1 for spatially adjacent units and 0 for nonadjacent units. Global Moran’s I ranges from [−1, 1].
Observing the Moran’s I helps to determine the clustering and dispersion states of data in space. If Moran’s I < 0, it indicates that the statistical data exhibit a negative spatial relationship, and the closer Moran’s I is to −1, the stronger the negative correlation. If Moran’s I = 0, it indicates that the statistical data exhibit no significant spatial correlation, and the data are randomly and uniformly distributed in space. If Moran’s I > 0, it indicates that the statistical data exhibit a positive spatial correlation, and the closer Moran’s I is to 1, the stronger the positive correlation.
Because the research question concerns the presence of spatial autocorrelation in either direction, all Moran’s I tests were conducted using two-sided alternatives rather than one-sided tests. A total of 64 tests were performed (four indicators × sixteen years). To account for multiple comparisons, we applied the Benjamini–Hochberg false discovery rate (FDR) correction across all 64 tests. Both raw two-sided p-values and FDR-adjusted q-values are reported. Results are interpreted using the FDR-adjusted q-values, with q < 0.05 considered statistically significant.
4.2.2. Local Spatial Autocorrelation
To further examine the distribution patterns of MHT, the local spatial autocorrelation analysis method was employed to identify local clustering. The local Moran’s index aims to explore the spatial distribution between a local unit and its adjacent neighbors. The calculation formula is as follows:
where Xt and Xj are the observed values of spatial units t and j, respectively; is the mean of X; Wij is the spatial weight matrix between units i and j.
Local indicators of spatial association (LISA) are used here to identify localized clustering patterns. It should be noted that local LISA statistics capture local spatial heterogeneity or club convergence rather than global spatial dependence. Such time-invariant local club effects are absorbed by city fixed effects in the fixed-effects panel model specification, which further supports the use of an ordinary panel model rather than a spatial econometric model.
4.3. Panel Regression Model
The core empirical analysis examines factors associated with MHT agglomeration at the city level in China. Economic, social, and ecological factors are included as explanatory variables to assess their associations with city-level MHT agglomeration. Using panel data from 2004 to 2019, we specify the following econometric model [58]:
where i denotes each city, and t denotes the year. The dependent variable MHA represents the MHT agglomeration level, measured by the four indicators TAD, TAS, TAI, and TAE, respectively. Econ represents economic factors, Soc represents social factors, and Ecol represents ecological factors. μit is the random error term.
To examine potential nonlinear associations, the variables in the three dimensions are specified individually, and squared terms for economic factors are incorporated into the following extended model:
where i denotes the city and t denotes the year. The dependent variable MHA represents MHT agglomeration, measured in separate models by TAD, TAS, TAI, and TAE. The explanatory variables are defined as follows. Econ1 denotes per capita gross regional product (GRP); Econ12 denotes the squared term of per capita GRP. Econ2 denotes science and technology expenditure. Econ22 denotes the squared term of science and technology expenditure. Soc1 denotes the number of urban hospitals; Soc2 denotes urban hospital beds per 1000 population; Soc3 denotes public library collections. Ecol1 denotes industrial SO2 emissions; Ecol2 denotes industrial dust emissions; Ecol3 denotes urban green space; Ecol4 denotes industrial wastewater. β1 to β11 are the coefficients to be estimated, and μit is the random error term.
Compared with existing studies, this model explicitly includes squared terms for economic factors (Econ12 and Econ22) to test potential nonlinear associations of economic development and science and technology investment with talent agglomeration. This specification allows marginal effects to vary with the level of each explanatory variable, capturing differences in the associations of economic factors at different stages of development.
The Hausman test was used to determine the appropriate specification between fixed-effects and random-effects models. The baseline specification includes both city fixed effects and year fixed effects. City fixed effects control for time-invariant city-level heterogeneity, while year fixed effects absorb common temporal shocks that affect all cities in a given year, such as national healthcare reforms, macroeconomic fluctuations, and environmental regulations. Standard errors are clustered at the city level and reported in parentheses.
5. Results
5.1. Spatial Autocorrelation Analysis
5.1.1. Global Moran’s I
Global Moran’s I tests were conducted for TAD, TAS, TAI, and TAE to assess spatial autocorrelation in MHT agglomeration. Table 2 presents the global Moran’s I values for the four indicators from 2004 to 2019.
Table 2.
Global Moran’s I of TAD, TAS, TAI, and TAE (2004–2019).
Table 2 reports global Moran’s I for TAD, TAS, TAI, and TAE from 2004 to 2019. All tests used two-sided alternatives, and the Benjamini–Hochberg FDR correction was applied across the 64 tests. After correction, none of the Moran’s I values was statistically significant at the 5% level. The smallest two-sided p-value was 0.093 for TAI in 2011, corresponding to an FDR-adjusted q-value of approximately 0.974.
The Moran’s I values for the vast majority of years were close to zero, indicating that the spatial distribution of MHT at the city level in China exhibits a generally random and dispersed pattern, with no significant global spatial dependence. This evidence supports the appropriateness of employing an ordinary panel model rather than a spatial econometric model in the subsequent econometric analysis.
5.1.2. Local Moran’s I
Although global Moran’s I was not statistically significant, the local indicators of spatial association (LISA) analysis can still reveal spatial club characteristics within specific regions. Figure 1 presents the local Moran scatter plots for TAD, TAS, TAI, and TAE in four representative years: 2004, 2009, 2014, and 2019.
Figure 1.
Local Moran scatter plots for TAD, TAS, TAI, and TAE in 2004, 2009, 2014, and 2019. (A) TAD; (B) TAS; (C) TAI; (D) TAE.
The evolution of the scatter plots over time suggests several patterns. First, the local Moran’s I for TAD declined continuously, from 0.372 in 2004 to 0.147 in 2019. Most cities were located in the first and third quadrants, indicating that higher values tended to be surrounded by higher values and lower values by lower values. This pattern of spatial association in agglomeration density weakened over the sample period.
Second, the local Moran’s I for TAS remained very low, ranging from 0.008 to 0.024 throughout the study period, with no discernible trend. Scatter plot patterns were similar across years, with cities distributed across the first, second, and third quadrants. This suggests a stable pattern of weak spatial association, consistent with the global Moran’s I findings.
Third, the local Moran’s I for TAI followed an inverted V-shaped trajectory, rising from 0.129 in 2004 to 0.229 in 2009 before declining to 0.142 by 2019. Most cities were in the first and third quadrants. The reported spatial autocorrelation for TAI was stronger than that for TAS but weaker than that for TAD, suggesting a limited degree of regional similarity in physician allocation relative to population.
Fourth, the local Moran’s I for TAE evolved from a negative value (−0.029 in 2004) to a value near zero (0.014 in 2019). The weak negative correlation observed in 2004 became positive and close to zero after 2009. Most cities were situated in the first and third quadrants. This transition indicates that the spatial association of MHT equilibrium across cities gradually weakened, with the equilibrium levels of individual cities tending to evolve independently.
The local Moran’s I analysis further corroborates the findings of the global test. The overall degree of spatial agglomeration of MHT is weak and exhibits a further weakening trend. Although TAD maintained a certain degree of positive spatial correlation at the local scale, its intensity continuously declined. This evidence supports the appropriateness of employing an ordinary panel model rather than a spatial econometric model in the subsequent econometric analysis.
5.2. Panel Regression
Prior to the panel regression analysis, the Hausman test was employed to determine the appropriate specification between fixed-effects and random-effects models. The Hausman test rejected the null hypothesis at the 1% significance level for all four models, supporting the fixed-effects specification. For the TAS model, the initial Hausman test produced a negative chi-square statistic, which fails to meet the asymptotic assumptions of the test; we therefore re-conducted the test with the sigmamore option and obtained a positive chi-square statistic (chi2 = 252.50, p < 0.001), again supporting the fixed-effects specification. The baseline specification includes both city fixed effects and year fixed effects, and standard errors are clustered at the city level. City fixed effects control for time-invariant city-level heterogeneity, while year fixed effects absorb common temporal shocks that affect all cities in a given year, such as national healthcare reforms, macroeconomic fluctuations, and environmental regulations. Standard errors are reported in parentheses.
Model (1) in Table 3 reports the two-way FE regression with TAD as the dependent variable. Among economic factors, per capita GRP was not statistically significant, whereas its squared term was significantly positive at the 5% level, revealing a U-shaped relationship betweenPer capita GRP and TAD; Sci-tech expenditure was significantly negative at the 1% level, while its squared term was significantly positive at the 1% level, revealing a U-shaped relationship between sci-tech expenditure and TAD: when sci-tech expenditure is at a low level, increases in such expenditure are accompanied by decreases in TAD; once the expenditure surpasses the turning point, further increases are accompanied by increases in TAD, marginal effect and turning point was shown in Table 4. Among social factors, Urban hospitals was significantly negative at the 5% level, indicating a negative association with physician density per unit area. Urban hospital beds were significantly positive at the 1% level. Among ecological factors, urban green space was significantly negative at the 10% level, whereas industrial wastewater was significantly positive at the 10% level.
Table 3.
Panel regression results.
Table 4.
Marginal effect and turning point.
Model (3) reports the two-way FE regression results with TAS as the dependent variable. Among social factors, Urban hospitals was significantly positive at the 1% level, and urban hospital beds were significantly positive at the 5% level. Among ecological factors, only urban green space was significantly positive, at the 10% level, indicating that cities with more green space had a larger share of provincial physicians. All other ecological variables were not statistically significant. Economic factors and most ecological factors were not statistically significant in this model.
Model (5) reports the two-way FE regression results with TAI as the dependent variable. Among economic factors, Sci-tech expenditure squared term was significantly positive at the 5% level, revealing a U-shaped relationship between Sci-tech expenditure and TAI, marginal effect and turning point was shown in Table 4. Among social factors, urban hospital beds were significantly positive at the 1% level. Among ecological factors, industrial wastewater was significantly positive at the 10% level.
Model (7) reports the two-way FE regression results with TAE as the dependent variable. Among economic factors, Sci-tech expenditure squared term was significantly negative at the 10% level, revealing inverted U-shaped relationship between Sci-tech expenditure and TAE, marginal effect and turning point was shown in Table 4. Among social factors, urban hospital beds were significantly positive at the 1% level.
Across the four models, the associations between the explanatory factors and dimensions of MHT agglomeration differed substantially. Among economic factors, the squared term for per capita GRP was significant only in the TAD model (5%). Science and technology expenditure was significantly negative in the TAD model (1%), whereas its squared term was significantly positive in the TAD (1%) and TAI (5%) models and significantly negative in the TAE model (10%). The estimated turning point for per capita GRP (3.69) and those for sci-tech expenditure (8.47, 6.91, and 5.75) all fall within the observed ranges of the corresponding explanatory variables (per capita GRP: −1.763 to 15.68; sci-tech expenditure: 0.693 to 15.53). Thus, these nonlinear patterns occur within the observed sample range rather than being extrapolated beyond the data. Among social factors, urban hospital beds were significantly positive in the TAD (1%), TAS (5%), TAI (1%), and TAE (1%) models, making it the only explanatory variable that remained robust across all dimensions. Urban hospitals was significantly negative in the TAD model (5%) and significantly positive in the TAS model (1%). Among ecological factors, urban green space was significantly negative in the TAD model (10%) and significantly positive in the TAS model (10%). Industrial wastewater was significantly positive in the TAD (10%) and TAI (10%) models.
5.3. Robustness and Endogeneity-Related Checks
To assess the reliability of the baseline results, this study employed six methods for robustness and endogeneity-Related testing: winsorization, excluding municipalities, complete-case sensitivity analysis, one-period-lagged explanatory variables, province × year fixed effects, city-specific linear trends. The regression results for each robustness test are reported in Table 5, Table 6, Table 7, Table 8, Table 9 and Table 10, respectively.
Table 5.
Robustness test 1: Winsorization.
Table 6.
Robustness test 2: Excluding Municipalities.
Table 7.
Robustness test 3: Complete-case sensitivity analysis.
Table 8.
Potential Endogeneity Check1: One-Period-Lagged Explanatory Variables.
Table 9.
Potential Endogeneity Check2: Province × Year Fixed Effects.
Table 10.
Potential Endogeneity Check 3: City-Specific Linear Trends.
5.3.1. Robustness Test 1: Winsorization
To exclude the potential influence of extreme values on the regression results, all continuous variables were winsorized at the 1st and 99th percentiles before re-estimation. Table 5 reports the estimation results after winsorization. In the TAD model, the squared term for per capita GRP was significantly positive at the 10% level, urban hospital beds remained significantly positive at the 1% level, and industrial wastewater was significantly positive at the 10% level. In the TAS model, Urban hospitals and urban hospital beds both remained significantly positive, and urban green space was significantly positive at the 1% level. In the TAI model, per capita GRP was significantly negative at the 1% level, whereas its squared term was significantly positive at the 1% level. Urban hospital beds were significantly positive at the 1% level. In the TAE model, urban hospital beds remained significantly positive at the 1% level.
5.3.2. Robustness Test 2: Excluding Municipalities
Considering that municipalities directly under the central government differ systematically from other cities in terms of administrative hierarchy, resource allocation, and talent agglomeration, which may exert a disproportionate influence on the regression results, the four municipalities of Beijing, Tianjin, Shanghai, and Chongqing were excluded from the sample before re-estimation. Table 6 presents the results. In the TAD model, the squared term for per capita GRP was significantly positive at the 5% level. Science and technology expenditure was significantly negative at the 5% level, whereas its squared term was significantly positive at the 5% level. Urban hospitals was significantly negative at the 5% level, urban hospital beds remained significantly positive at the 1% level, and urban green space was significantly negative at the 10% level. In the TAS model, Urban hospitals and urban hospital beds both remained significantly positive, and urban green space was significantly positive at the 10% level. In the TAI model, the squared term for science and technology expenditure was significantly positive at the 10% level, and urban hospital beds remained significantly positive at the 1% level. In the TAE model, the squared term for science and technology expenditure was significantly negative at the 5% level, and urban hospital beds remained significantly positive at the 1% level.
5.3.3. Robustness Test 3: Complete-Case Sensitivity Analysis
To further examine whether the baseline results are driven by interpolated observations, we conducted a complete-case sensitivity analysis using the original unbalanced panel without any interpolation. Specifically, all city-year observations containing missing values were excluded, and the four baseline two-way fixed-effects models were re-estimated on the remaining fully original observations with city-level clustered standard errors. The results are reported in Table 7.
The core findings remain qualitatively unchanged. In particular, urban hospital beds per 1000 population remains significantly positive across all four dimensions of MHT agglomeration, confirming that the robust positive association between hospital-bed capacity and talent agglomeration is not an artifact of interpolated observations. The nonlinear associations of per capita GRP and sci-tech expenditure are also broadly consistent with the baseline results: per capita GRP exhibits a U-shaped relationship with TAD (linear term: β = −0.3827, p < 0.05; squared term: β = 0.0454, p < 0.05), and sci-tech expenditure exhibits U-shaped relationships with TAD (linear term: β = −0.5308, p < 0.01; squared term: β = 0.0311, p < 0.01) and TAI (linear term:β = −1.3180, p < 0.05; squared term: β = 0.0784, p < 0.05), as well as an inverted U-shaped relationship with TAE (squared term: β = −0.0019, p < 0.10). The signs and magnitudes remain consistent with the baseline results. The complete-case sensitivity analysis suggests that the main conclusions are robust to the exclusion of interpolated observations.
5.3.4. Potential Endogeneity Check1: One-Period-Lagged Explanatory Variables
Considering that economic, social, and ecological factors may exert lagged effects on talent agglomeration, all explanatory variables were replaced with their one-period-lagged values before re-estimation to test temporal robustness. Table 8 reports the estimation results with one-period-lagged explanatory variables. In the TAD model, the squared term for per capita GRP was significantly positive at the 5% level. Science and technology expenditure was significantly negative at the 1% level, whereas its squared term was significantly positive at the 5% level. Urban hospitals was significantly negative at the 10% level, and urban hospital beds remained significantly positive at the 1% level. In the TAS model, Urban hospitals and urban hospital beds were both significantly positive at the 10% level, and urban green space was significantly positive at the 5% level. In the TAI model, the linear term for per capita GRP was significantly negative at the 10% level, the squared term for science and technology expenditure was significantly positive at the 5% level, and urban hospital beds remained significantly positive at the 1% level. In the TAE model, Urban hospitals was significantly negative at the 10% level, and urban hospital beds remained significantly positive at the 1% level. These results indicate that the core conclusions of the baseline regression remain valid after accounting for time-lag effects.
5.3.5. Potential Endogeneity Check2: Province × Year Fixed Effects
To provide additional evidence beyond the one-period-lag robustness test, province-by-year fixed effects were included to absorb unobserved time-varying shocks shared by cities within the same province. Table 9 reports the estimation results with province-by-year fixed effects. Per capita GRP was significantly negative at the 10% level in TAD model, Per capita GRP was significantly negative at the 5% level, and the squared term was significantly positive at the 10% level in TAI model. Sci-tech expenditure was significantly negative at the 5% level, with its squared term significantly positive at the 10% level in TAD model, Sci-tech expenditure was significantly positive at the 5% level with its squared term significantly negative at the 1% level in the TAE model. Urban hospitals was significantly negative at the 5% level in the TAD model and significantly positive at the 1% level in the TAS model. Urban hospital beds remained significantly positive at the 1% level in the TAD, TAI, and TAE models and at the 5% level in the TAS model. Urban green space was significantly negative at the 1% level in the TAD model and significantly positive at the 10% level in the TAS model. The remaining variables were not statistically significant.
5.3.6. Potential Endogeneity Check 3: City-Specific Linear Trends
City-specific linear trends were included to account for heterogeneous long-term development trajectories. Table 10 reports the estimation results with city-specific linear trends. Per capita GRP was not statistically significant in most models, whereas its squared term was significantly positive at the 10% level in the TAD model. Science and technology expenditure was significantly positive, and its squared term was significantly negative at the 10% level in the TAS, TAI, and TAE models. Urban hospitals was significantly positive at the 1% level in the TAS model. Urban hospital beds remained significantly positive in all four models, at the 1% level in the TAD, TAI, and TAE models and at the 10% level in the TAS model. Public library collections were significantly negative at the 5% level in the TAI model. Industrial dust emissions were significantly negative at the 1% level in the TAD model, and urban green space was significantly negative at the 10% level in the TAD model. The remaining variables were not statistically significant.
Across these checks, urban hospital beds remained the most robust factor, with consistently positive associations with MHT agglomeration across all four dimensions. The signs of the other core variables were directionally consistent with the baseline regression.
5.4. Heterogeneity Tests
Considering the significant disparities across different regions of China in terms of economic development levels, industrial structures, and medical resource allocation, this study divided the full sample into three regional subsamples—eastern, central, and western—based on geographic location, and conducted separate group regressions to examine the regional heterogeneity of various factors on MHT agglomeration. Table 11 presents the regional subgroup regression results.
Table 11.
Heterogeneity Tests: Regional Subgroups.
Table 11 shows the following regional patterns.
In the eastern region, science and technology expenditure was significantly negative at the 5% level and its squared term was significantly positive at the 5% level in the TAD model. In the TAI model, the linear term was significantly negative at the 10% level and the squared term was significantly positive at the 5% level. Among social factors, Urban hospitals was significantly positive at the 1% level in the TAS model. Urban hospital beds were significantly positive at the 1% level in the TAD, TAI, and TAE models, while public library collections were significantly negative at the 10% level in the TAE model. Among ecological factors, industrial dust emissions were significantly positive at the 10% level in the TAE model, and urban green space was significantly positive at the 5% level in the TAS model. Industrial wastewater was significantly negative at the 10% level in the TAS model and at the 1% level in the TAE model.
In the central region, science and technology expenditure was significantly positive at the 5% level and its squared term was significantly negative at the 1% level in the TAE model. Among social factors, Urban hospitals was significantly positive at the 1% level in the TAS model, and urban hospital beds were significantly positive at the 1% level in the TAD, TAI, and TAE models. Among ecological factors, industrial SO2 emissions were significantly negative at the 5% level in the TAI model, and industrial wastewater was significantly positive at the 10% level in the TAS model.
In the western region, per capita GRP was significantly negative at the 5% level and its squared term was significantly positive at the 5% level in the TAI model. The squared term for science and technology expenditure was significantly positive at the 5% level in the TAD model. Among social factors, Urban hospitals was significantly negative at the 10% level in the TAD model. Urban hospital beds were significantly positive at the 5% level in the TAD and TAS models and at the 1% level in the TAI and TAE models. Among ecological factors, industrial dust emissions were significantly negative at the 10% level in the TAD model, and urban green space was significantly negative at the 10% level in the TAD model.
Across the three regional subgroup regressions, urban hospital beds maintained significant positive associations in the TAD, TAI, and TAE models in the eastern, central, and western regions. Hospital bed capacity was the only explanatory variable with consistently significant associations across all three regions and multiple dimensions.
6. Discussion
The integrated economic, social and ecological analytical framework considered in this study captures fundamental contextual domains relevant to the attraction, distribution, and retention of healthcare professionals across different institutional and healthcare settings. Economic conditions reflect employment opportunities, professional development, and regional resource capacity. Social conditions represent healthcare infrastructure and public services, while ecological conditions capture environmental and residential characteristics that influence urban attractiveness. The specific variables used to represent each dimension may differ across countries according to institutional arrangements, healthcare system characteristics, and data availability. Nevertheless, the multidimensional structure provides a transferable framework for examining healthcare talent agglomeration in different contexts.
First, economic factors exhibited nonlinear associations. The quadratic specification for per capita GRP suggested a U-shaped relationship with TAD, with an estimated turning point of 3.69, whereas its linear and squared terms were not statistically significant in the TAS, TAI, and TAE models. Science and technology expenditure showed quadratic patterns consistent with U-shaped relationships with TAD and TAI, with estimated turning points of 8.47 and 6.91, respectively, and an inverted U-shaped relationship with TAE, with an estimated turning point of 5.75. These estimates suggest nonlinear associations that differ across dimensions of talent agglomeration.
Second, medical resource capacity showed a particularly consistent association with agglomeration. Urban hospital beds were significantly positive in all four baseline models, making hospital bed capacity the only explanatory variable with significant associations across all four dimensions. This variable retained significant positive associations across the robustness tests and additional fixed-effects checks. In the regional analysis, it remained statistically significant in the TAD, TAI, and TAE models across the eastern, central, and western regions. However, the association may be bidirectional, as hospital capacity and physician agglomeration may influence each other. This finding is consistent with the incentives created by the professional title promotion system [59]. Studies of health resource allocation in China indicate that bed provision is not merely a measure of service capacity but also an important basis for allocating medical resources. Structural surpluses or shortages of beds directly affect operational efficiency and the distribution of talent [60]. By considering disease complexity and service efficiency, using measures such as the case mix index (CMI) and bed utilization index, hospitals can evaluate and adjust bed provision. These adjustments influence the allocation of institutional resources, including staffing quotas and senior professional positions [61]. Bed numbers are closely related to approved staffing quotas and the number of senior professional title positions in medical institutions, influencing professionals’ career development prospects and income expectations. Bed provision therefore represents both medical service capacity and a basis for resource allocation that affects promotion opportunities and the quality of research platforms.
Third, ecological associations differed across agglomeration dimensions. Urban green space was negatively associated with TAD and positively associated with TAS, but its associations with TAI and TAE were not statistically significant. This divergence may reflect the dual role of green space in talent location decisions: abundant green space improves urban livability, while cities with more green space often have lower population density, potentially contributing to lower physician density per unit area [62]. Industrial SO2 emissions and industrial dust emissions were not statistically significant in the baseline models. Industrial wastewater showed weak positive associations with TAD and TAI, but these were not stable across more stringent specifications. Environmental quality is generally an important component of location attractiveness [63]. Air pollution tends to discourage highly educated workers and professionals from migrating to or locating in affected areas in China [64,65], whereas urban amenities, including green space and public services, are generally associated with greater attractiveness to talent [66]. Accordingly, positive coefficients for industrial emissions should not be interpreted as evidence that pollution attracts MHT. Similarly, the negative coefficient for urban green space in the TAD model does not establish that healthcare professionals prefer fewer green amenities. The industrial emission variables are aggregate measures rather than direct measures of individual pollution exposure and may also proxy the scale and composition of industrial activity. Residual confounding by urban scale, population density, industrial structure, healthcare quality, and other unobserved city characteristics cannot be excluded. Furthermore, TAD, TAS, TAI, and TAE measure different dimensions of agglomeration and have different denominators. Differences in coefficient signs may therefore reflect the statistical properties of the outcomes rather than fundamentally different environmental preferences.
Fourth, the results showed regional heterogeneity. Science and technology expenditure showed quadratic patterns consistent with U-shaped associations with TAD and TAI in the eastern region, an inverted U-shaped association with TAE in the central region, and a positive quadratic association with TAD in the western region. These patterns suggest substantial regional differences in nonlinear associations. Per capita GRP was not statistically significant in most regional models but exhibited a U-shaped association with TAI in the western region, suggesting that its association may vary across stages of development in some regional contexts. These regional differences provide an empirical basis for region-specific policies. High-level talent generally moves toward southeastern China, where a regional talent circulation pattern has begun to develop; central and western regions and northeastern China commonly experience severe talent deficits [30]. In the eastern region, where salaries are competitive, the competition for talent increasingly centers on quality of life. Urban hospital beds remained statistically significant in the TAD, TAI, and TAE models across the eastern, central, and western regions, making hospital bed capacity the only explanatory variable with consistently significant associations across all three regions and multiple dimensions. Existing evidence indicates distinct regional patterns in healthcare resource development: bed supply has grown significantly faster in central and western China than in the eastern region, whereas demand for beds has grown faster in economically developed eastern coastal provinces than in central and western regions [60]. These differences suggest new institutional directions for medical and health talent policies based on regional coordination. Strategic planning should account for both expansion in supply-side capacity and population shifts affecting demand.
Compared with the existing literature, this paper makes two incremental contributions. First, it extends the previously established multidimensional framework for analyzing MHT agglomeration, including density, scale, intensity, and equilibrium, to a longitudinal city-level setting. Second, it integrates economic, social, and ecological dimensions within a single analytical framework, that transcends single-dimension discussions, providing a comprehensive perspective on the complex factors associated with medical talent agglomeration.
This study has several limitations. First, although licensed physicians and licensed assistant physicians represent a core professional group of MHT, the measure does not include nurses, public-health professionals, researchers, or other health personnel. Accordingly, the findings should primarily be interpreted as reflecting physician agglomeration rather than the entire MHT workforce. Furthermore, talent heterogeneity in terms of educational background, professional title, and specialty fields, may obscure differences in the agglomeration mechanisms of sub-groups in healthcare workforce. Second, although the proportion of interpolated observations was small, the use of linear interpolation may still introduce some degree of measurement uncertainty. Third, city-level yearbook indicators and aggregate industrial-emission variables may be subject to measurement error and may not perfectly capture individual-level data. Fourth, time-varying omitted variables cannot be fully eliminated by the observational panel design. Future research can be deepened in the following directions: first, employing micro-level survey data to identify the decision-making mechanisms of individual-level talent location choices; second, conducting heterogeneity analyses by specialty fields (such as clinical medicine, public health, and basic medicine) to enhance the specificity and policy guidance value of the research conclusions; third, future studies should employ stronger identification strategies to evaluate potential causal relationships between MHT agglomeration and its associated factors.
7. Conclusions
Using panel data from 285 cities in China spanning 2004 to 2019, this study combined spatial autocorrelation analysis with a two-way fixed-effects panel model to examine economic, social, and ecological factors associated with MHT agglomeration. The main conclusions are as follows:
First, the spatial distribution of MHT at the city level in China exhibits an overall random and dispersed pattern, with insignificant global spatial autocorrelation; however, local club convergence characteristics of high-high and low-low agglomeration exist at the local scale.
Second, economic factors showed nonlinear associations that differed across dimensions of MHT agglomeration. The quadratic specification for per capita GRP suggested a U-shaped association with TAD, whereas science and technology expenditure showed patterns consistent with U-shaped associations with TAD and TAI and an inverted U-shaped association with TAE. Thus, the associations of economic development differed across dimensions of talent agglomeration.
Third, among social factors, urban hospital beds showed the most robust positive associations with MHT agglomeration. These associations remained significant across all model specifications and across multiple outcomes in the regional heterogeneity analyses.
Fourth, ecological factors showed weaker associations that differed across agglomeration dimensions. Urban green space was negatively associated with TAD and positively associated with TAS, whereas associations involving industrial pollution indicators were generally not statistically significant or were unstable across model specifications.
Fifth, factors associated with talent agglomeration exhibit significant regional heterogeneity. Urban hospital beds remained consistently significant across all three regions, reinforcing their role as factors associated with MHT agglomeration irrespective of regional development levels. Science and technology expenditure showed distinct nonlinear patterns in the eastern, central, and western regions, whereas per capita GRP showed a U-shaped association with TAI only in the western region.
8. Policy Implications
Based on these empirical findings, this study proposes the following policy recommendations.
Medical resource capacity should be a core component of regional talent policy. Urban hospital beds were the most robust variable across the tests in this study, showing significant positive associations in all four baseline models and retaining these associations across the robustness tests and checks for potential endogeneity. The regional analysis also showed significant positive associations across multiple agglomeration outcomes, indicating that medical infrastructure remains a priority at the current stage. Given these robust associations, governments at all levels should incorporate improvements of medical resource capacity into their broader planning for talent development.
A mechanism for regularly reviewing and adjusting talent policies should be established. This study found nonlinear associations between economic factors and MHT agglomeration that differed across dimensions. Per capita GRP and science and technology expenditure showed different quadratic patterns consistent with U-shaped or inverted U-shaped associations across the four agglomeration dimensions. Regular monitoring and evaluation of factors associated with talent agglomeration are recommended. Policy priorities should be reviewed as economic development and science and technology investment approach or cross the estimated turning points.
Author Contributions
Conceptualization, L.Z. and L.S.; methodology, L.Z., L.S. and C.H.; software, L.S.; validation, L.Z. and L.S.; formal analysis, L.S. and C.H.; investigation, L.Z., L.S., C.H. and D.Z.; resources, L.Z. and L.S.; data curation, L.S.; writing—original draft preparation, L.Z., L.S., C.H. and D.Z.; writing—review and editing, L.Z. and D.Z.; visualization, L.S. and D.Z.; supervision, L.Z. and D.Z.; project administration, L.Z.; funding acquisition, L.Z. All authors have read and agreed to the published version of the manuscript.
Funding
This research was funded by NATIONAL NATURAL SCIENCE FOUNDATION of China, grant number 72174182.
Institutional Review Board Statement
Not applicable.
Informed Consent Statement
Not applicable.
Data Availability Statement
The dataset can be accessed through the printed yearbooks: China City Statistical Yearbook (2005–2020). The dataset is also available from the corresponding author upon reasonable request.
Conflicts of Interest
The authors declare no conflicts of interest. The funders had no role in the design of the study; in the collection, analyses, or interpretation of data; in the writing of the manuscript; or in the decision to publish the results.
Abbreviations
The following abbreviations are used in this manuscript:
| MHT | Medical and health talent |
| TAD | Talent agglomeration density |
| TAS | Talent agglomeration scale |
| TAI | Talent agglomeration intensity |
| TAE | Talent agglomeration equilibrium |
References
- Ni, P.; Wang, J.; Shi, L.; Xu, L. Regional distribution differences and influencing factors of primary healthcare institutions in China. J. Cent. South Univ. (Med. Sci.) 2025, 50, 2082–2094. [Google Scholar] [CrossRef] [Scilit]
- Qiu, L.; Song, G.; Liu, M.; Jiang, C.; Sun, X. The Characteristics of the Distribution of Healthcare Resources in Primary Healthcare Institutions between Provinces in China. Chin. General. Pract. 2024, 27, 3911–3918. [Google Scholar] [CrossRef]
- Gan, M.; Guo, H. The spatiotemporal distribution of quality medical resources and its effects on maternal and child health in the context of healthy China. Mod. Prev. Med. 2024, 51, 3941–3947. [Google Scholar] [CrossRef]
- Brixi, H.; Mu, Y.; Targa, B.; Hipgrave, D. Engaging Sub-National Governments in Addressing Health Equities: Challenges and Opportunities in China’s Health System Reform. Health Policy Plan. 2013, 28, 809–824. [Google Scholar] [CrossRef] [Scilit]
- Yan, X.; He, S.; Webster, C.; Yu, M. Divergent Distributions of Physicians and Healthcare Beds in China: Changing Patterns, Driving Forces, and Policy Implications. Appl. Geogr. 2022, 138, 102626. [Google Scholar] [CrossRef] [Scilit]
- Liu, C.; Wang, Y.; Han, Y.; Song, Y.; Tao, Z. Identifying the Influencing Factors of Healthcare Resource Distribution Based on Spatial Panel Data of 276 Prefecture-Level Cities in China, 2007–2022. Appl. Spat. Anal. 2026, 19, 59. [Google Scholar] [CrossRef] [Scilit]
- Yan, X.; Li, Y.; Luo, S.; Zhang, P.; Yu, J.; Yu, Y. Talent management practices and considerations at a national children’s regional medical center. Chin. Hosp. 2024, 28, 12–15. [Google Scholar] [CrossRef]
- Fu, R.; Zhang, X.; Yang, D. Spatial equity of healthcare resource in Xinjiang. J. Univ. Chin. Acad. Sci. 2023, 40, 69–78. [Google Scholar] [CrossRef]
- Li, Z. Research on the Flow of Medical Talent Resources in China. China Natl. Cond. Strength 2023, 6, 69–71. [Google Scholar] [CrossRef]
- Hu, Q.; Zang, X.; Tang, T. Practice and thinking of hospital grade evaluation under modern hospital management system. Mod. Hosp. 2024, 24, 348–350. [Google Scholar] [CrossRef]
- Zhou, D.; Ge, X. The Evaluation Index of Post Competence of General Practitioners in Less-developed Areas. Chin. General. Pract. 2023, 26, 3908–3914. [Google Scholar] [CrossRef]
- Ye, R.; Qian, A.; Lin, P. Evaluating human resource allocation for primary care in China using the Spatial Durbin model. Health Dev. Policy Res. 2024, 27, 74–80. [Google Scholar] [CrossRef]
- Chinese Ministry of Health. Medium- and Long-Term Plan for the Development of Medical and Health Talent (2011–2020). Available online: https://www.nhc.gov.cn/renshi/c100028/201104/2af949fa6f474273bb42a0a62436b34a.shtml (accessed on 6 September 2026).
- Simon, C.J. Human Capital and Metropolitan Employment Growth. J. Urban. Econ. 1998, 43, 223. [Google Scholar] [CrossRef] [Scilit]
- Giannetti, M. Skill Complementarities and Migration Decisions. Labour 2001, 15, 1–31. [Google Scholar] [CrossRef] [Scilit]
- Liu, S.; Wang, R. Mechanisms, Effects and Countermeasures of Qualified Scient ists and Technicians Gathering. J. Nanjing Univ. Aeronaut. Astronaut. (Soc. Sci.) 2008, 10, 47–51. [Google Scholar]
- Li, G.; Wang, B. A Study on the Relationship between the Distribution Density of Science and Technology Human Resources and Regional Innovation Capacity. Sci. Technol. Progress. Policy 2011, 28, 144–148. [Google Scholar] [CrossRef]
- Zhao, S.; Niu, C.; Huang, J. Study on Technological Talent Agglomeration Effect and Regional Innovation Capability. Sci. Technol. Manag. Res. 2012, 32, 169–173. [Google Scholar] [CrossRef]
- Chen, Q.; Yan, T.; Liu, X. Influence of Human Resources Agglomeration on Capability of Science and Technology Innovation. J. Tongji Univ. (Nat. Sci.) 2017, 45, 1722–1730. [Google Scholar] [CrossRef]
- Xiu, G.; Han, J.; Chen, X. Research on the Influence of Technological Talent Agglomeration to China’s Regional Sic-Tech Innovation Efficiency. Sci. Technol. Progress. Policy 2017, 34, 36–40. [Google Scholar] [CrossRef]
- Zhang, L.; Tang, J.; Zhou, Q.; Song, Y.; Zhang, D. Spatial-Temporal Distribution and Evolution of Medical and Health Talents in China. BMC Public Health 2025, 25, 124. [Google Scholar] [CrossRef] [Scilit]
- Krugman, P. Increasing Returns and Economic Geography. J. Polit. Econ. 1991, 99, 483–499. [Google Scholar] [CrossRef] [Scilit]
- Palivos, T.; Wang, P. Spatial Agglomeration and Endogenous Growth. Reg. Sci. Urban Econ. 1996, 26, 645. [Google Scholar] [CrossRef] [Scilit]
- Rotemberg, J.J.; Saloner, G. Competition and Human Capital Accumulation: A Theory of Interregional Specialization and Trade. Reg. Sci. Urban Econ. 2000, 30, 373. [Google Scholar] [CrossRef] [Scilit]
- Li, N.; Liu, H. Analysis on the Talents Converging Decision Factors of Different Stages in Industry Development Based on the System Dynamics. Sci. Technol. Progress. Policy 2012, 29, 152–155. [Google Scholar] [CrossRef]
- Li, R.; Wu, D.; Bao, J.; Qiu, Y.; Wang, W. Evolution of temporal and spatial pattern and driving mechanisms of agglomerative growth of senior science talents: A case study of academicians of CAS. Progress. Geogr. 2013, 32, 1123–1138. [Google Scholar] [CrossRef]
- Hou, Z.; Zhou, Y. Analysis of Influence Factors on Scientific Talent Lost in Xinjiang. J. Quant. Econ. 2014, 31, 99–105. [Google Scholar]
- Fang, Y.; Zeng, Q.; Tang, Y.; Mao, Y. The spatial disparities of agglomeration of creative class and determinates in guangdong province. Human. Geogr. 2016, 31, 58–65. [Google Scholar] [CrossRef]
- Zhang, M.; Li, B. Research on Spatial-temporal Pattern and Its Influencing Factors of Talent Agglomeration in China. Sci. Technol. Progress. Policy 2018, 35, 38–44. [Google Scholar] [CrossRef]
- Huang, H.; Qu, Y.; Bai, H. The geographic mobility, spatial distribution and institutional aggregation of China’s research scientists. Stud. Sci. Sci. 2018, 36, 2191–2204. [Google Scholar] [CrossRef]
- Xu, N.; Guo, J. Research on the macro factors impacting the flow of science and technology talents. Stud. Sci. Sci. 2019, 37, 414–421. [Google Scholar] [CrossRef]
- Ning, Y.; Duan, X. Current Situation of, Problems in and Countermeasures and Suggestions to Construction of Grass-roots Health Talent Team in Fujian Province. Chin. Pers. Sci. 2020, 47, 37–42. [Google Scholar] [CrossRef]
- Wang, G.; Liu, J.; Yan, B.; Zhu, X. An Analysis of the Fairness of Medical and Health Resources in Jiangsu Province Based on Clustering and GIS Technologies. Chin. J. Health Stat. 2020, 37, 888–891. [Google Scholar] [CrossRef]
- Yu, X.; Zhang, W.; Liang, J. Physician Distribution across China’s Cities: Regional Variations. Int. J. Equity Health 2021, 20, 162. [Google Scholar] [CrossRef] [Scilit]
- Fu, L.; Wang, R.; Dong, Y. The Impact of the Hierarchical Medical System on Medical Resource Allocation in China. Sci. Rep. 2025, 15, 7561. [Google Scholar] [CrossRef] [Scilit]
- Florida, R. The Economic Geography of Talent. Ann. Assoc. Am. Geogr. 2002, 92, 743–755. [Google Scholar] [CrossRef] [Scilit]
- Hu, B.; Liu, Y.; Zhang, X.; Dong, X. Understanding Regional Talent Attraction and Its Influencing Factors in China: From the Perspective of Spatiotemporal Pattern Evolution. PLoS ONE 2020, 15, e0234856. [Google Scholar] [CrossRef] [Scilit]
- Yang, Z. Has the Pilot Project of Innovative Cities Increased the Level of Scientific and Technological Talents Agglomeration:A Quasi Experimental Study Based on 240 Cities in China. Sci. Technol. Progress. Policy 2021, 38, 116–123. [Google Scholar] [CrossRef]
- Zhang, X.; Lü, W.; Lin, F. Can Scientific and Technological Talent Aggregation Accelerate Economic Growth? An Empirical Study. J. Syst. Sci. Inf. 2015, 3, 145–153. [Google Scholar] [CrossRef] [Scilit]
- Zhao, C.; Zhang, Y.; Niu, T. Research on the Development Trend and Effects of Regional Differences In Science and Technology Talents in China. Sci. Manag. Res. 2020, 38, 137–142. [Google Scholar] [CrossRef]
- Niu, C.; Zhang, F.; Feng, H. On the Relationship among Science and Technology Talent Accumulation, High-tech Industry Agglomeration and Regional Technologic Innovation. Sci. Technol. Progress. Policy 2012, 29, 46–48. [Google Scholar] [CrossRef]
- Hu, C. A Study of the Motivations and Strategies for Science and Technology Talents Aggregation in Characteristic Small Towns in Zhejiang Province from the Perspective of Fusion of Multi-theories. Pioneer. Withscience Technol. Mon. 2020, 33, 53–58. [Google Scholar] [CrossRef]
- Yang, Z. The Interaction Between Science and Technology Talent Agglomeration and Economic Development: Evidence from Hubei Province. Theory Mon. 2011, 3, 77–80. [Google Scholar] [CrossRef]
- Satpathy, D.I. An Encounter with Migrants on the Line of Push-Pull Theory. Zenith Int. J. Bus. Econ. Manag. Res. 2012, 3, 1–12. [Google Scholar]
- Li, X.; Wang, X. Research on the Influencing Factors of Scientific and Technological Talents Agglomeration from the Perspective of Public Service—Configuration Analysis Based on fsQCA Method. Sci. Technol. Econ. 2025, 38, 51–55. [Google Scholar] [CrossRef]
- Cui, D.; Li, G.; Wu, D. Review and Enlightenment of the Influence Mechanism and Practice Research of Urban Amenities on Creative Talents Concentration. Urban. Dev. Stud. 2021, 28, 81–89. [Google Scholar]
- Yu, Z.; Tang, Y.; Zhang, H.; Liang, J. Spatial pattern and driving factors of Chinese urban amenities. Geogr. Res. 2016, 35, 1783–1798. [Google Scholar] [CrossRef]
- Wen, T.; Lin, J.; Cai, J.; Yang, Z.; Ding, Y. Urban amenity: A new perspective and empirical testimony on China’s city competitiveness assessment. Geogr. Res. 2016, 35, 214–226. [Google Scholar] [CrossRef]
- Zhang, H. American Urban Amenity Assessment and Their Impact on the Talent Attraction. Master’s Thesis, East China Normal University, Shanghai, China, 2017. [Google Scholar]
- Sun, L.; Sun, W.; Gao, Z. Research on the measurement and influencing factors of the agglomeration degree of marine science and technology talents in China. Sci. Res. Manag. 2022, 43, 192–199. [Google Scholar] [CrossRef]
- Ling, Z. Research on the Measurement of Urban Talent Agglomeration and Influencing Factors. Sustain. Dev. 2020, 10, 694–702. [Google Scholar] [CrossRef]
- Kang, W. Missing-Data Imputation in Nonstationary Panel Data Models. In Advances in Econometrics; Drukker, D.M., Ed.; Emerald Group Publishing Limited: Leeds, UK, 2011; Volume 27, pp. 235–251. ISBN 978-1-78052-526-6. [Google Scholar]
- Lepot, M.; Aubin, J.-B.; Clemens, F. Interpolation in Time Series: An Introductive Overview of Existing Methods, Their Performance Criteria and Uncertainty Assessment. Water 2017, 9, 796. [Google Scholar] [CrossRef] [Scilit]
- Tobler, W.R. A Computer Movie Simulating Urban Growth in the Detroit Region. Econ. Geogr. 1970, 46, 234–240. [Google Scholar] [CrossRef] [Scilit]
- Bai, Q.; Ke, X.; Huang, L.; Liu, L.; Xue, D.; Bian, Y. Finding Flaws in the Spatial Distribution of Health Workforce and Its Influential Factors: An Empirical Analysis Based on Chinese Provincial Panel Data, 2010–2019. Front. Public Health 2022, 10, 953695. [Google Scholar] [CrossRef] [Scilit]
- Anselin, L. Local Indicators of Spatial Association—LISA. Geogr. Anal. 1995, 27, 93–115. [Google Scholar] [CrossRef] [Scilit]
- Ma, G.; Cao, J. Spatial Heterogeneity Impacts of Bilateral Foreign Direct Investment on Green Energy Efficiency in China. Front. Environ. Sci. 2022, 10, 905933. [Google Scholar] [CrossRef] [Scilit]
- He, Q.; Chen, W.; Wang, X. Relationships among Direct Human Capital Input R&D Input and Innovation Performance: An Empirical Study Based on Panel Data about S&T Activities in China. Technol. Econ. 2009, 28, 1–9. [Google Scholar]
- Wang, D.; Zhu, W.; He, L.; Gu, J.; Zang, Y.; Li, S.; Wang, X. Research on scientific evaluation index system of medical talents in public hospitals. Chin. Hosp. 2023, 27, 39–42. [Google Scholar] [CrossRef]
- Jiang, P.; Ma, G.; Duan, J.; Zhang, C.; Shan, S. Research on the Forecasting of Supply and Demand for Bed Resources in China’s Healthcare Institutions. Chin. Health Qual. Manag. 2026, 33, 93–98. [Google Scholar] [CrossRef]
- Du, Y.; Shen, Y.; Sun, J.; Ye, Q.; Shen, A.; Chen, Y.; Ye, Y.; Qi, S.; Shen, Y. Optimization of bed resource allocation based on BCI index evaluation model. Chin. Hosp. 2024, 28, 91–94. [Google Scholar] [CrossRef]
- Rezaei, N.; Millard-Ball, A. Urban Form and Its Impacts on Air Pollution and Access to Green Space: A Global Analysis of 462 Cities. PLoS ONE 2023, 18, e0278265. [Google Scholar] [CrossRef] [Scilit]
- Roback, J. Wages, Rents, and the Quality of Life. J. Political Econ. 1982, 90, 1257–1278. [Google Scholar] [CrossRef] [Scilit]
- Lai, W.; Song, H.; Wang, C.; Wang, H. Air Pollution and Brain Drain: Evidence from College Graduates in China. China Econ. Rev. 2021, 68, 101624. [Google Scholar] [CrossRef] [Scilit]
- Wang, H.; Guo, F. City-Level Socioeconomic Divergence, Air Pollution Differentials and Internal Migration in China: Migrants vs Talent Migrants. Cities 2023, 133, 104116. [Google Scholar] [CrossRef] [Scilit]
- Cui, D.; Li, G.; Wu, D.; Sun, Y. Spatio-Temporal Patterns Evolution and Impact Mechanism of the Agglomeration of Creative Talents in China. Econ. Geogr. 2020, 40, 1–14. [Google Scholar]
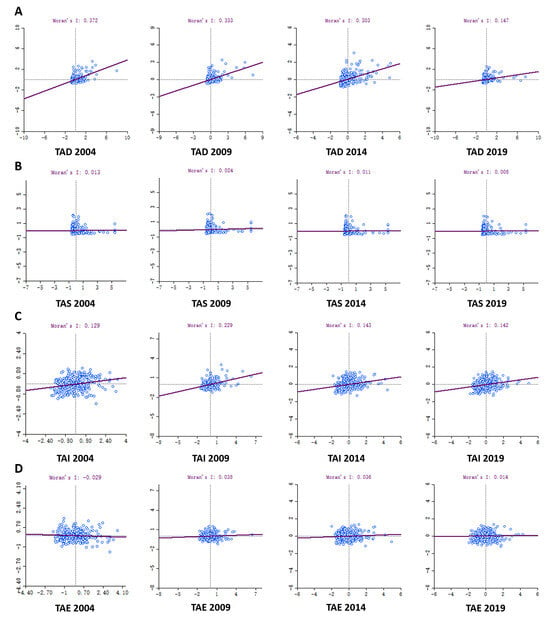
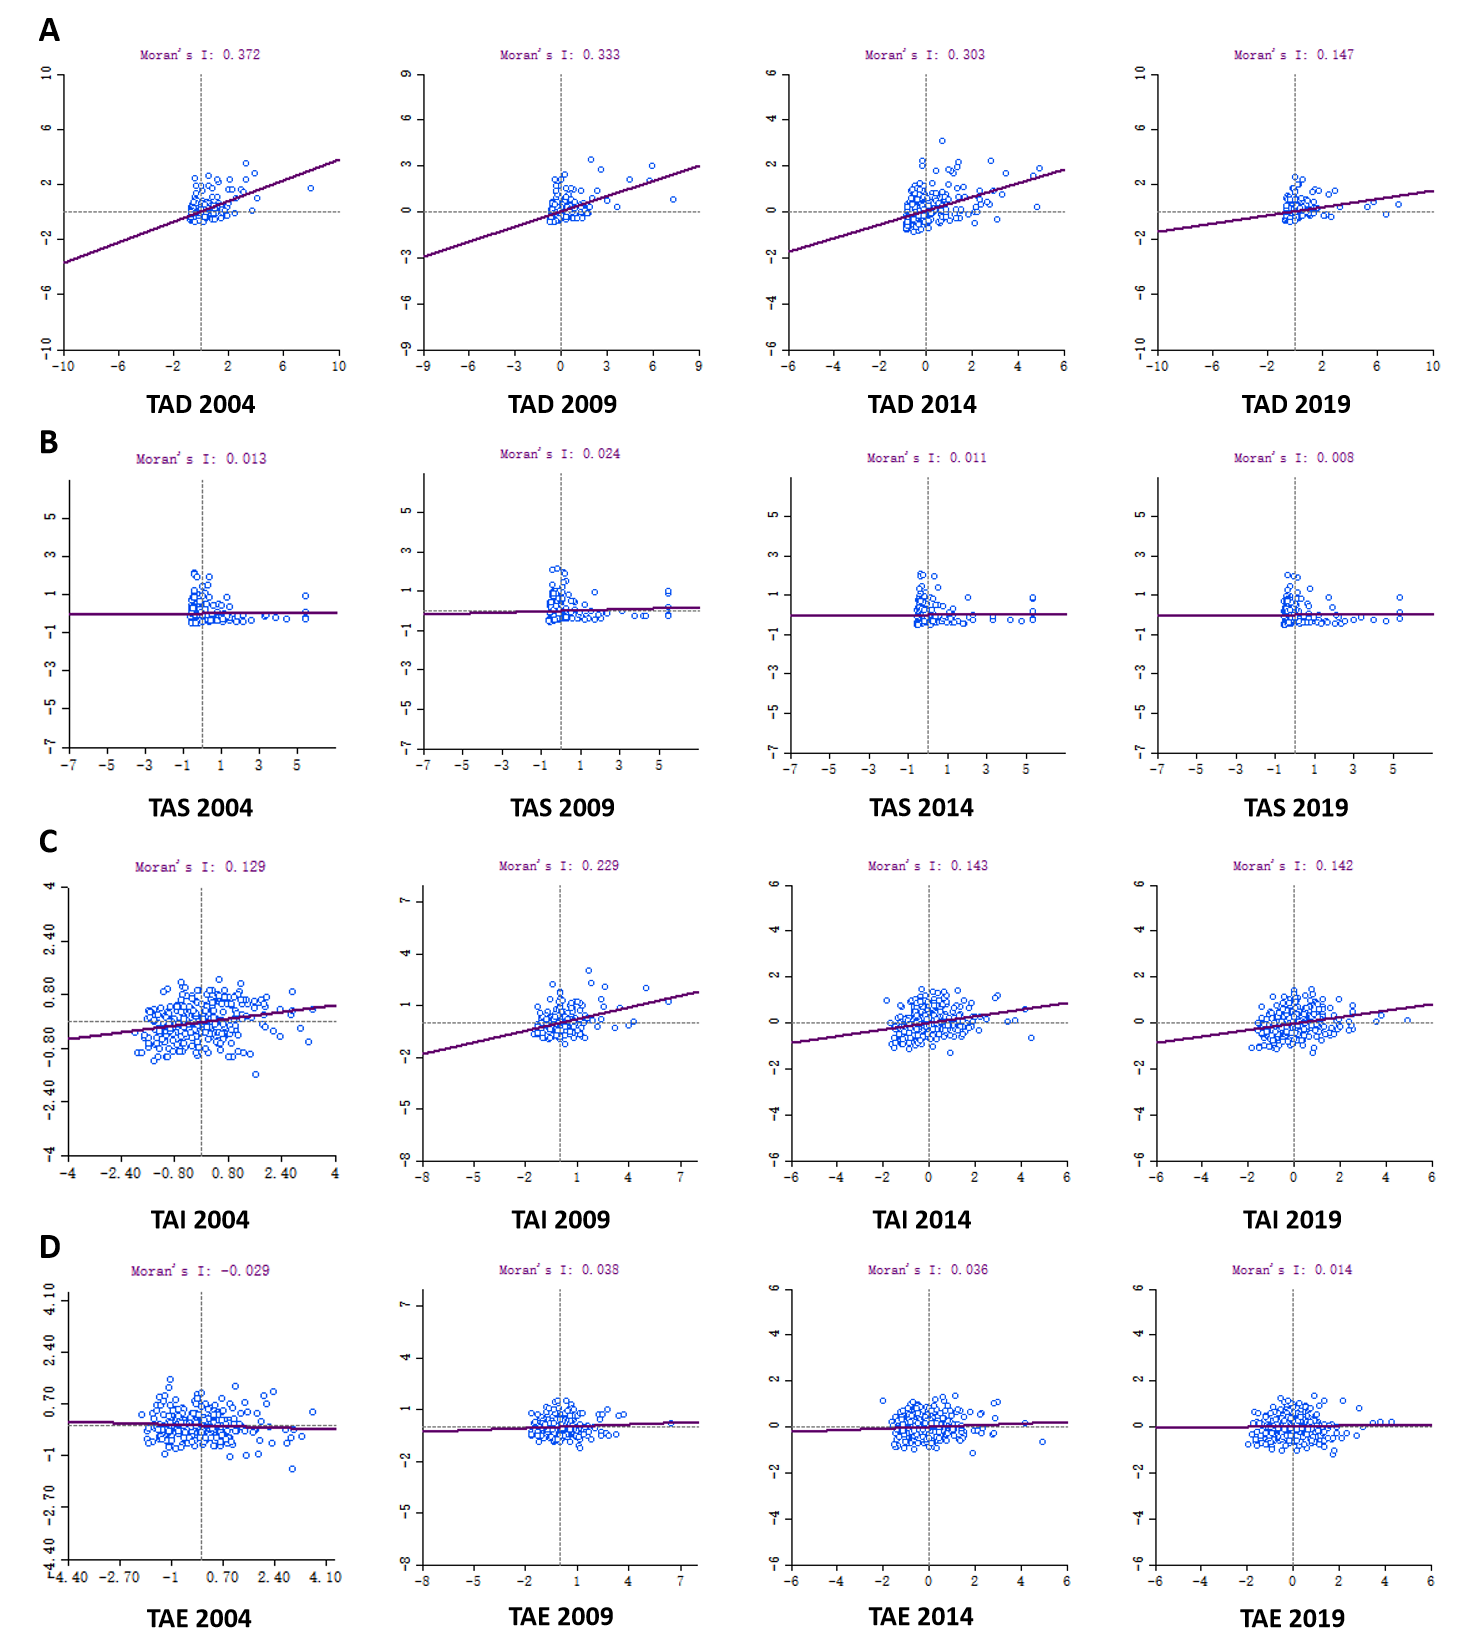

Disclaimer/Publisher’s Note: The statements, opinions and data contained in all publications are solely those of the individual author(s) and contributor(s) and not of MDPI and/or the editor(s). MDPI and/or the editor(s) disclaim responsibility for any injury to people or property resulting from any ideas, methods, instructions or products referred to in the content. |
© 2026 by the authors. Licensee MDPI, Basel, Switzerland. This article is an open access article distributed under the terms and conditions of the Creative Commons Attribution (CC BY) license.