


Abstract
In recent years, China’s digital economy has become a key engine for high-quality development. Assessing the operational efficiency of leading digital enterprises is crucial for optimizing resource allocation and promoting sectoral growth. However, existing research largely remains at regional or industry levels and typically reports efficiency scores without diagnosing the root sources of inefficiency. To fill this gap, this study measures the operational efficiency of 99 firms selected from China’s Top 100 Digital Economy list (2017–2022) using the BCC-DEA model, and analyzes their dynamic evolution via kernel density estimation. The findings reveal a fluctuating upward trend in overall efficiency, and that the gap in overall technical efficiency primarily originates from scale efficiency rather than pure technical efficiency. The kernel density peak exhibits a “rise–decline–rise” pattern, indicating existing but narrowing efficiency differences among firms. By decomposing efficiency, this study further classifies firms into four types, revealing that inefficiency is heterogeneous. This paper makes three main contributions. First, it identifies scale efficiency as the main source of efficiency gaps. Second, it classifies firms into four types, revealing that inefficiency is heterogeneous. Third, it uses kernel density estimation to track the dynamic evolution of efficiency, showing a narrowing efficiency gap but a persistent superstar effect. Two policy implications follow: firms with low pure technical efficiency should focus on management training and technology adoption, while firms with low scale efficiency should pursue scale expansion through mergers or partnerships.
Keywords:
leading enterprises; digital economy; operational efficiency; pure technical efficiency; scale efficiency MSC:
91B38
1. Introduction
The digital economy has become a key driver of high-quality growth in China. Between 2005 and 2021, its value added grew from 2.6 trillion yuan to 45.5 trillion yuan. Its share of the GDP has continued to increase [1]. Leading digital economy enterprises are the core actors of the national digital innovation system. They are important representatives in international competition and cooperation. They wield significant influence in international technological innovation. These enterprises focus on digital technology. They take data as a key resource. They create value and innovate business models by optimizing the use of information, knowledge, and human capital. They play important roles in leading development, creating jobs, and competing globally. They represent the development level and direction of the digital economy. In 2022, the top 100 digital economy firms together generated 9.9 trillion yuan in revenue. This amount accounted for 19.7 percent of the country’s total digital economy output that year. This shows the important role of top digital economy firms in the development of the digital economy and the national economy.
Digital economy research has become a hot topic in academia since the concept was introduced by Tapscott [2] and further elaborated by Ayres and Williams [3]. However, among all digital economy efficiency studies, only a small part focuses on efficiency measurement. Most existing work on digital economy efficiency has focused on two levels: regional and industry. At the regional level, a large body of research has been developed. Based on Chinese provincial panel data, the digital economy index has a positive nonlinear relationship with total factor productivity. The integration effect is stronger in eastern China than in central and western regions [4]. Research on 108 cities in the Yangtze River Economic Belt shows that the digital economy improves green development efficiency. This effect is more evident in upstream and downstream regions and in large- and medium-sized cities [5]. The digital economy also affects energy efficiency [6]. Urbanization and digital development both significantly improve energy efficiency [7]. Spatial spillover effects operate through a market and geography mechanism rather than direct geographic transmission [8,9]. The digital economy has also been shown to drive low-carbon city performance from a multiple-output perspective [10]. At the industry level, scholars have measured the efficiency of digital economy-related industries. Research on China’s semiconductor industry finds an overall upward trend in innovation efficiency from 2009 to 2014. Different segments show varying efficiency levels. Design and package testing have the highest efficiency. Manufacturing and equipment show input redundancies [11]. Higher regional digital industrialization levels reduce the marginal innovation efficiency of enterprise digital investment but improve it in adjacent areas. This indicates spatial spillover effects [12]. Regional- and industry-level analyses rely on aggregated data. They treat all firms as the same. This makes it hard to see the real efficiency differences across individual firms. More importantly, these analyses cannot tell us where the efficiency gaps among leading firms actually come from.
Data envelopment analysis (DEA) and its extensions are the main tools for efficiency measurement in the digital economy. The foundational DEA model was proposed by Charnes et al. [13]. Banker et al. extended it to account for variable returns to scale [14]. The SBM model addresses input–output slack [15]. The super-efficiency SBM model solves the ranking problem of efficient decision-making units [16]. The Malmquist index is widely used for dynamic efficiency analysis. The directional distance function is adopted for green productivity measurement with undesirable outputs [17]. These methods have been widely applied. A basic DEA model applied to China’s digital economy shows that efficiency generally does not reach effectiveness, with a trend of first rising and then falling [18]. A three-stage DEA–Malmquist index approach applied to similar data finds that after excluding external environmental factors, efficiency values increase significantly and show a positive trend driven by technological advancement [19]. One attempt to address this integrates super-efficiency SBM with a backpropagation neural network [19]. This hybrid model overcomes DEA’s sensitivity to statistical noise and the need to remeasure all units when new ones are added. However, this advancement creates a new dilemma [20]. The neural network improves predictive stability but sacrifices interpretability. The root causes of inefficiency become even harder to identify. In summary, existing research has two main gaps. First, different DEA specifications produce conflicting results, but researchers rarely justify their model choices. Second, most studies treat DEA as a black box, reporting scores without diagnosing the root causes of inefficiency.
Recently, some scholars have started looking at efficiency at the firm level [21]. One study found a U-shaped relationship between the digital economy and firm productivity [22]. Another study found that digital transformation in SMEs is characterized by size heterogeneity [23]. A further study showed that digital capabilities and environmental resource orchestration work together to create different patterns of resource allocation [24]. The samples in these studies are mostly small- and medium-sized enterprises or firms from specific industries. There is hardly any research that focuses specifically on leading digital economy firms. Leading firms control large amounts of resources. Their efficiency performance has a major impact on the broader digital economy. Yet existing work has largely ignored this group. This gap matters because leading firms—by virtue of their market power and resource allocation—shape the trajectory of the entire digital economy. Without firm-level efficiency decomposition, policymakers cannot distinguish between firms that are inefficient due to poor management (pure technical inefficiency) versus those that are suboptimally scaled (scale inefficiency). This distinction is critical for targeted interventions.
To solve these two problems, this study selects the top 100 digital economy enterprises from 2017 to 2022 as leading firms. The BCC-DEA method is used to measure firm efficiency. The efficiency is decomposed into pure technical efficiency and scale efficiency. This decomposition helps identify where the main efficiency gap comes from. Kernel density estimation is also used to analyze the dynamic distribution of efficiency. Measuring the efficiency of leading digital economy firms helps us understand their performance in digital economy development. It reveals their strengths and weaknesses in resource allocation. It also helps optimize resource allocation and improve resource use efficiency for sustainable development. This study aims to answer two research questions. First, what is the efficiency level of leading digital economy enterprises, and how does it evolve over time? Second, do efficiency gaps come from pure technical efficiency or scale efficiency? These findings can help identify the advantages and disadvantages of leading firms and promote high-quality development of the digital economy.
2. Efficiency Measurement Indicators for Leading Digital Economy Enterprises
2.1. Efficiency Measurement Indicators
The term “digital economy” first appeared in 1996, nearly three decades ago. However, there is still no unified standard for defining the digital economy. Different countries and international organizations have different understandings with their own emphases. Through the literature review and reference to the Cobb–Douglas production function theory, this paper selects appropriate indicators to construct an efficiency measurement system. The detailed content is shown in Table 1.
Table 1.
Efficiency measurement indicator system for leading digital economy enterprises.
Following the Cobb–Douglas production function, we select net fixed assets and the average number of employees as inputs, and principal business revenue as the output. While these indicators are standard for operational efficiency measurement, they do not capture digital-specific dimensions, such as R&D, patents, or data assets. This limitation is addressed in the concluding section.
2.2. Data Sources
This paper selects data from the top 100 digital economy enterprises from 2017 to 2022. Data from 99 enterprises among the top 100 digital economy enterprises are used as original data to measure and analyze the digital economy efficiency of leading enterprises. The 99 top 100 digital economy enterprises are obtained from the ranking list of China’s top 100 digital economy enterprises. The ranking list comes from the “2022 China Digital Economy Top 100”, jointly released by Forbes China and the China Electronic Chamber of Commerce. This ranking list analyzes the development status and industry trends of enterprises with strong digital economy attributes across electronics, computers, home appliances, communications, media, commercial retail, and mechanical equipment. The evaluation considers four dimensions: total market value, total assets, total operating revenue, and net profit attributable to the parent company. The digital economy level of enterprises is assessed and ranked accordingly. The panel data of the top 100 digital economy enterprises come from the Choice database, a professional financial data product under East Money Information Co., Ltd. (Shanghai, China). For missing data within the database, the linear interpolation method is used for completion. The ranking is based on four dimensions: total market value, total assets, total operating revenue, and net profit. This introduces a size bias, as larger firms are more likely to be included. However, this list is the only publicly available comprehensive ranking of digital economy enterprises in China. To mitigate the bias, we focus on efficiency scores rather than the rankings themselves, and we include all 99 firms in the analysis. Readers should keep this sampling limitation in mind when interpreting the results.
3. Research Methods
3.1. BCC-DEA Model
The BCC-DEA model was implemented using DEAP 2.1 software (Coelli, University of New England, Armidale, NSW, Australia). Kernel density estimation was performed using Stata 17.0 (StataCorp LLC, College Station, TX, USA) with the Epanechnikov kernel function and Silverman‘s rule-of-thumb bandwidth selection. Data preprocessing and linear interpolation were conducted using Microsoft Excel 2021 (Microsoft Corporation, Redmond, WA, USA).
Data Envelopment Analysis (DEA) is a new field of interdisciplinary research across operations research, management science, and mathematical economics. It is a quantitative analysis method that evaluates the relative effectiveness of comparable units of the same type using linear programming based on multiple input indicators and multiple output indicators. The DEA method and its models have been widely applied across different industries and sectors since they were proposed by the famous American operations researchers A. Charnes and W.W. Cooper in 1978. They show unique advantages in handling multi-indicator inputs and multi-indicator outputs. The analysis in this study covers the sample period from 2017 to 2022.
The earliest DEA method was the CCR model, which calculates resource allocation efficiency under constant returns to scale. The CCR model is derived under the premise of constant returns to scale. However, the returns to scale of technological innovation are not fixed. Unequal competition in reality also causes some decision-making units to not operate at an optimal scale. Therefore, Banker, Charnes, and Cooper extended the previous DEA analysis, which only discussed fixed returns to scale, and proposed the BCC model in 1984.
This paper uses the BCC-DEA model when calculating the efficiency of leading digital economy enterprises. The BCC model considers the case of variable returns to scale. That is, when some decision-making units do not operate at optimal scale, the measurement of technical efficiency is affected by scale efficiency. The BCC model is chosen over other DEA variants for three reasons. First, the 99 leading enterprises in our sample vary considerably in size. Some are large, mature firms with billions in revenue, while others are smaller and at earlier stages of growth. This variation makes the variable returns to scale assumption of the BCC model more realistic than the constant returns to scale assumption of the CCR model. Second, due to market competition and different stages of development, not all firms operate at their optimal scale. The BCC model explicitly accounts for this fact, whereas the CCR model would impose an assumption that may not hold. Third, the BCC model allows us to decompose overall technical efficiency into pure technical efficiency and scale efficiency. This decomposition is central to our research aim of identifying whether efficiency gaps among leading firms come from management capability (pure technical efficiency) or scale configuration (scale efficiency). The SBM model, while useful for handling input–output slack, does not provide this decomposition. Dynamic DEA, on the other hand, is designed for measuring efficiency change over time and requires a different data structure. For our purpose of measuring static efficiency and then analyzing its distribution dynamics using kernel density estimation, the BCC model is the most appropriate choice.
Let each digital economy enterprise be a decision-making unit (DMU). Suppose there are DMUs to be evaluated, and each utilizes types of inputs to produce types of outputs. In this paper, and . The input vector is denoted as and the output vector is denoted as .
For a specific under evaluation, the input-oriented BCC-DEA model, under the assumption of variable returns to scale, is formulated as follows:
In this model represents the overall technical efficiency (OTE) score of . A score of indicates that the DMU is technically efficient and lies on the VRS frontier. are the intensity variables that form the convex combination of peer DMUs. and are the slack variables representing excess input and shortfall in output , respectively. is a non-Archimedean infinitesimal, ensuring that slacks are maximized in the optimization. The constraint is the convexity constraint that distinguishes the BCC model (VRS) from the CCR model (CRS).
By applying this model, the overall technical efficiency (OTE) is calculated. Subsequently, the pure technical efficiency (PTE) is derived under VRS, and scale efficiency (SE) is obtained by the decomposition relationship SE = OTE/PTE.
3.2. Kernel Density Estimation
Assume are n independent and identically distributed sample points with probability density function f. Then,
K(·) is the kernel function, which satisfies the following conditions: non-negativity, unit integral, compliance with probability density properties, and zero mean. Commonly used kernel functions include Gaussian, Epanechnikov, and Rectangle kernels. Gaussian and Epanechnikov kernels are widely used in clustering, risk optimization, and other fields. The Epanechnikov kernel can achieve the optimal integral square error in sample analysis and reduce efficiency loss in data fitting. Therefore, this paper adopts the Epanechnikov kernel for analysis. Its functional form is as follows:
4. Efficiency Measurement Analysis of Leading Digital Economy Enterprises
4.1. Efficiency Measurement Results of Leading Enterprises
Based on data availability, this paper selects 99 enterprises from the top 100 digital economy enterprises from 2017 to 2022 as leading enterprises. The BCC-DEA model is used to measure the efficiency of these leading enterprises. The results are shown in Table 2. Since the sample data are relatively large, this table presents the top 10 and bottom 10 enterprises in efficiency ranking for each year.
Table 2.
Efficiency of leading digital economy enterprises from 2017 to 2022.
4.2. Efficiency Analysis of Leading Enterprises
Before presenting the detailed results, we note three structural features revealed by the efficiency rankings. First, a small group of frontier firms (Digital China, Guolian Shares, and Huitongda Network) remains efficient across all six years, creating a “super star” effect. Second, the wide dispersion of efficiency scores (most firms below 0.5) reflects a polarized structure. Third, as will be shown in Section 4.3, inefficiency is heterogeneous.
(1) In our sample, most leading enterprises have low overall efficiency values relative to the frontier firms. This is mainly because some enterprises have too low inputs, while having too high outputs. Table 2 and Table 3 show that, except for a few enterprises, such as Shanghai Ganglian, Huitongda Network, Digital China, and Guolian Shares, whose overall efficiency values are 1 or close to 1, most leading enterprises have overall efficiency values below 0.5. This is because the efficiency of these frontier firms is very high, making the relative efficiency of other enterprises appear low. Apart from these few high-efficiency firms, most other leading enterprises have similar efficiency levels. The top 10 firms by average overall efficiency (e.g., Huitongda Network, Digital China, and Shanghai Ganglian) show little efficiency variation across the sample period, while the bottom 10 firms, though improving, remain at very low levels.
Table 3.
Efficiency of leading digital economy enterprises from 2017 to 2022 (continued).
(2) During the sample period, the overall efficiency of most leading digital economy enterprises exhibited a fluctuating upward trend. According to the results in Table 3, the average overall efficiency of leading digital economy enterprises increased from 0.080 in 2017 to 0.106 in 2022, representing a growth rate of 32.6%. From the perspective of dynamic changes in overall efficiency, except for a few leading enterprises, most leading digital economy enterprises show an upward trend in overall efficiency. Among all leading digital economy enterprises with increasing overall efficiency, Guolian Shares shows the largest increase in absolute terms, with overall efficiency increasing from 0.208 in 2017 to 1.000 in 2022, an increase of 0.792 and a growth rate of 380.77%. Other enterprises with significant growth include TPV Technology, Unigroup Guoxin, Iris Ohyama, and Vipshop. TPV Technology increased from 0.016 in 2017 to 0.090 in 2022, with a growth rate of 462.50%. Unigroup Guoxin increased from 0.019 in 2017 to 0.096 in 2022, with a growth rate of 405.26%. Iris Ohyama increased from 0.004 in 2017 to 0.059 in 2022, an increase of 0.055 and a growth rate of 1375.00%. Although Iris Ohyama has low efficiency, its growth rate is large, indicating substantial growth potential. Vipshop increased from 0.028 in 2017 to 0.426 in 2022, an increase of 0.398 and a growth rate of 1421.43%. This growth rate is the highest among all leading digital economy enterprises, with increasing overall efficiency, and its relative overall efficiency in 2022 was 0.426, indicating significant room for development.
A consistent pattern is observed among firms with increasing efficiency. For most of these firms, the growth rate of inputs is lower than the growth rate of outputs. In some cases, inputs decrease while outputs increase. For example, for Guolian Shares, main business revenue increased by 1913.45%, while inputs grew at a much slower rate. For Vipshop, the number of employees decreased by 88.42%, while output increased by 36.64%. These patterns are consistent with efficiency improvement from a descriptive perspective.
(3) A total of 16 enterprises show a downward trend in overall efficiency. These include Unisplendour, Suning.com, Dahua Technology, and Meituan, among others. Although Shanghai Ganglian shows a decrease in efficiency, it still ranks third in average overall efficiency among the 99 leading enterprises. The decrease in overall efficiency is mainly due to increased inputs without corresponding increases in outputs, or even with decreases in outputs. For Unisplendour, Transsion Holdings, Meituan, and Weibo, net fixed assets input increased significantly during 2017–2022, but main business revenue output did not increase proportionally. For Dahua Technology, Lingyi iTech, Wingtech Technology, 360 Security Technology, Kingsoft Office, Lenovo Group, Autohome, and JD.com, both the net fixed assets input and labor input in terms of number of employees increased significantly during 2017–2022, but the main business revenue output did not increase proportionally, leading to lower overall efficiency. For Suning.com, Shanghai Ganglian, Aisino Corporation, and Foxconn Industrial Internet, one input increased while the other decreased during 2017–2022. Reflected in the output indicator of main business revenue, output growth was not significant, and two enterprises even experienced decreases in main business revenue. Aisino Corporation decreased from 29.754 billion yuan in 2017 to 19.314 billion yuan in 2022, a decrease of 35.1%, which is relatively large. Suning.com decreased from 187.928 billion yuan in 2017 to 71.374 billion yuan in 2022, a decrease of 62%.
(4) The efficiency of leading enterprises is mainly characterized by low efficiency with high growth rates. Table 4 shows that among the 99 leading enterprises, 75 enterprises have efficiency values between 0 and 0.5, with growth rates exceeding 10%. This indicates that although leading enterprises have relatively low efficiency values in our sample, they show rapid growth, suggesting significant growth potential relative to their current efficiency levels. Next is the low efficiency in the low-growth area. Unisplendour, Suning.com, Dahua Technology, Lingyi iTech, Aisino Corporation, Wingtech Technology, Foxconn Industrial Internet, 360 Security Technology, Transsion Holdings, Kingsoft Office, Lenovo Group, Autohome, Meituan, JD.com, and Weibo, a total of 15 enterprises, not only have low efficiency values but also show a decreasing trend in efficiency. Shanghai Ganglian is the only leading enterprise with high efficiency but negative growth, which needs to focus on improving efficiency; otherwise, it may fall into the low efficiency area. Guolian Shares and Digital China have both high efficiency values and high growth rates. Pinduoduo and Huitongda Network are in the low-growth area. Smoore International, Han’s Laser, Huatian Technology, and Trip.com Group-S have low efficiency and low growth rates. These enterprises should avoid falling into the low efficiency with negative growth category. Several analytical patterns emerge from the above observations. First, the “low efficiency with high growth” cluster (75 firms) indicates that many leading digital firms are in a catch-up phase, rapidly expanding output, while their input bases remain relatively constrained. This pattern is consistent with the early-stage growth dynamics of digital platforms. Second, the persistence of frontier firms (Digital China, Guolian Shares, Huitongda Network) across all six years suggests that scale efficiency—once achieved—can be self-reinforcing through network effects. Third, the “high efficiency with negative growth” case (Shanghai Ganglian alone) reveals that maintaining frontier efficiency requires continuous adaptation, and that past efficiency does not guarantee future performance.
Table 4.
Classification of leading enterprises by efficiency and growth rate.
4.3. Analysis of Efficiency Drivers for Leading Enterprises
To explain the factors influencing efficiency changes of the 99 leading digital economy enterprises from 2017 to 2022, this paper decomposes the overall efficiency of leading enterprises using the efficiency formula mentioned above. The overall efficiency is decomposed into the pure technical efficiency and scale efficiency of the digital economy. Table 5 shows the decomposition results of the average overall efficiency for leading digital economy enterprises from 2017 to 2022.
Table 5.
Efficiency decomposition for leading digital economy enterprises from 2017 to 2022.
(1) Only 16 enterprises have consistently effective pure technical efficiency. During 2017–2022, the leading enterprises with pure technical efficiency reaching DEA effectiveness were Sangda Industrial, Digital China, Suning.com, Shanghai Ganglian, China Mobile, Foxconn Industrial Internet, Guolian Shares, GigaDevice Semiconductor, Kingsoft Office, Tencent Holdings, Xiaomi Group-W, Autohome, JD.com, Huitongda Network, Alibaba Group, and Pinduoduo. Sangda Industrial had a pure technical efficiency of 1 from 2018 to 2020. Digital China had a pure technical efficiency of 1 from 2020 to 2022. Suning.com had a pure technical efficiency of 1 from 2017 to 2019. Shanghai Ganglian had a pure technical efficiency of 1 from 2017 to 2020. China Mobile had a pure technical efficiency of 1 from 2017 to 2020. Foxconn Industrial Internet had a pure technical efficiency of 1 from 2017 to 2022. Guolian Shares had a pure technical efficiency of 1 from 2017 to 2022. GigaDevice Semiconductor had a pure technical efficiency of 1 from 2017 to 2018. Kingsoft Office had a pure technical efficiency of 1 in 2020 and 2022. Tencent Holdings had a pure technical efficiency of 1 from 2017 to 2022. Xiaomi Group-W had a pure technical efficiency of 1 from 2017 to 2022. Autohome had a pure technical efficiency of 1 only in 2017. JD.com had a pure technical efficiency of 1 from 2017 to 2022. Huitongda Network had a pure technical efficiency of 1 from 2017 to 2022. Alibaba Group had a pure technical efficiency of 1 from 2018 to 2019 and from 2021 to 2022. Pinduoduo had a pure technical efficiency of 1 from 2017 to 2018. Among the above enterprises, Foxconn Industrial Internet, Guolian Shares, Tencent Holdings, Xiaomi Group-W, JD.com, and Huitongda Network had an average pure technical efficiency of 1 over the six-year period. This means that these enterprises had a pure technical efficiency of 1 each year during the sample period. However, not all of these six enterprises achieved an overall efficiency of 1, indicating that their scale efficiency did not reach effectiveness, which restricted the improvement of overall efficiency. Lens Technology had the lowest average pure technical efficiency over the six-year period, with an efficiency value of only 0.012. Lingyi iTech had an average pure technical efficiency only 0.007 higher, with both enterprises having average pure technical efficiency below 0.020.
(2) Scale efficiency is consistently effective for 39 enterprises. During 2017–2022, the leading enterprises with scale efficiency reaching DEA effectiveness were Konka Group, Digital China, ZTE Corporation, TCL Technology, BOE Technology, TPV Technology, Hisense Home Appliances, Unisplendour, Inspur Information, Dahua Technology, Goertek, Dongshan Precision, Hikvision, Luxshare Precision, Lingyi iTech, Avary Holding, Shanghai Ganglian, Lens Technology, Tsinghua Tongfang, Hengtong Optoelectronics, FiberHome Telecommunication Technologies, Zhongtian Technology, JCET Group, Joyson Electronics, Wingtech Technology, Sichuan Changhong, Universal Scientific Industrial, Semiconductor Manufacturing International Corporation, BYD Electronic, China Communications Services, Skyworth Group, China Tower, Lenovo Group, Sunny Optical Technology, Meituan, Baidu Group, NetEase, Pinduoduo, and Vipshop. Konka Group only achieved scale efficiency in 2020. Digital China and Huitongda Network achieved scale efficiency from 2017 to 2022. ZTE Corporation and Meituan achieved scale efficiency from 2018 to 2019. TCL Technology achieved scale efficiency in 2020. BOE Technology, China Communications Services, and Baidu Group achieved scale efficiency in 2019. TPV Technology, Hisense Home Appliances, Inspur Information, Dahua Technology, Goertek, Hikvision, Luxshare Precision, Lens Technology, Hengtong Optoelectronics, Zhongtian Technology, Joyson Electronics, Wingtech Technology, Universal Scientific Industrial, BYD Electronic, Skyworth Group, Sunny Optical Technology, NetEase, and Pinduoduo all achieved scale efficiency only in 2020. Dongshan Precision, Lingyi iTech, Avary Holding, Tsinghua Tongfang, FiberHome Telecommunication Technologies, JCET Group, and Semiconductor Manufacturing International Corporation achieved scale efficiency from 2020 to 2021. Shanghai Ganglian achieved scale efficiency from 2017 to 2020 and in 2022. Sichuan Changhong and Lenovo Group achieved scale efficiency in 2018 and 2020. China Tower achieved scale efficiency in 2017 and 2020. Vipshop achieved scale efficiency from 2017 to 2019.
Among the above enterprises, Digital China, Shanghai Ganglian, and Huitongda Network had average scale efficiency reaching effectiveness during the sample period. However, in terms of average overall efficiency results, Digital China and Shanghai Ganglian did not achieve an overall efficiency of 1, indicating that their average pure technical efficiency during the sample period did not reach effectiveness, which restricted the improvement of overall efficiency. Hua Hong Semiconductor had the lowest average scale efficiency during the sample period, with an average efficiency of 0.060. Foxconn Industrial Internet, JD.com, Kingsoft Office, China Mobile, and Hua Hong Semiconductor all had average scale efficiency below 0.100. Starting with Foxconn Industrial Internet, the scale efficiency averages for these four enterprises were 0.098, 0.084, 0.076, and 0.067, respectively. These enterprises need to focus on improving their scale efficiency.
(3) Based on our BCC-DEA decomposition, the gap in overall technical efficiency is driven more by scale efficiency than by pure technical efficiency. This conclusion is supported by three main reasons.
First, from the perspective of efficiency values, during the sample period from 2017 to 2022, the average pure technical efficiency of leading digital economy enterprises was 0.243, while the average scale efficiency was 0.551. This shows that in our sample over the six-year period, the average scale efficiency of leading digital economy enterprises was higher than the average pure technical efficiency. The table also shows that for each year from 2017 to 2022, the scale efficiency of leading enterprises was higher than pure technical efficiency. This suggests that within this sample of leading firms, China’s digital economy has not yet fully moved away from the traditional development path of improving production efficiency through large-scale production.
Second, from a static perspective of the contribution of pure technical efficiency and scale efficiency, from 2017 to 2022, the average scale efficiency (0.551) was substantially higher than the average pure technical efficiency (0.243), indicating that scale efficiency played a more important role in overall efficiency. During the three years from 2019 to 2021, the contribution of scale efficiency to overall efficiency for leading enterprises all exceeded 0.700, with contribution values of 0.704, 0.748, and 0.731. In 2020, the contribution of scale efficiency to overall efficiency reached its maximum value of 0.748, and in that same year, scale efficiency was also at its highest, with an efficiency value of 0.726. In 2017, the contribution of scale efficiency to overall efficiency was the smallest at 0.640, meaning that in 2017, the contribution of pure technical efficiency to overall efficiency was the highest at 0.360. Therefore, from a static perspective, scale efficiency consistently contributed the most to the overall efficiency of leading digital economy enterprises.
Third, from a dynamic perspective, from 2017 to 2022, the growth rate of scale efficiency for leading digital economy enterprises was 9.19%, while the growth rate of pure technical efficiency was 0%. The improvement in scale efficiency was the sole source of the increase in overall efficiency over this period. From 2017 to 2022, pure technical efficiency showed a decreasing trend. In 2019, pure technical efficiency reached its lowest value of 0.217. In subsequent years, pure technical efficiency recovered, and by 2022, it was equal to the 2017 value at 0.257. This indicates that from 2018 to 2021, pure technical efficiency had a negative effect on the improvement of overall efficiency. Overall efficiency showed a continuous upward trend from 2017 to 2022. Based on the decomposition, this improvement came primarily from the increase in scale efficiency, while pure technical efficiency had minimal impact within this sample.
After decomposing efficiency, the 99 leading digital economy enterprises can be classified into the following four types.
The first type is the “double-high” type. These enterprises have both relatively high pure technical efficiency and relatively high scale efficiency among the 99 leading digital economy enterprises. These leading enterprises include Digital China, Sangda Industrial, Shanghai Ganglian, Guolian Shares, Huitongda Network, and Pinduoduo, totaling six enterprises. These enterprises should continue to maintain their improving trends in technical efficiency and scale efficiency, steadily promoting continuous efficiency improvement.
The second type is the “low-technical-efficiency and high-scale-efficiency” type. These enterprises have relatively low pure technical efficiency but relatively high scale efficiency. These leading enterprises include Konka Group, Tianma Microelectronics, ZTE Corporation, China Great Wall Technology, TCL Technology, BOE Technology, TPV Technology, Hisense Home Appliances, Unisplendour, Inspur Information, Supor, Sanhua Holding Group, Ninestar Corporation, Dahua Technology, Goertek, Dongshan Precision, Hikvision, MTC, Luxshare Precision, Sanqi Mutual Entertainment, Lingyi iTech, MLS, Avary Holding, Lens Technology, Tsinghua Tongfang, Shengyi Technology, Aisino Corporation, Hengtong Optoelectronics, FiberHome Telecommunication Technologies, Zhongtian Technology, JCET Group, Wuxi Taiji Industry, Joyson Electronics, Wingtech Technology, Sichuan Changhong, Universal Scientific Industrial, Will Semiconductor, Transsion Holdings, Semiconductor Manufacturing International Corporation, BYD Electronic, China Communications Services, Skyworth Group, China Tower, Lenovo Group, AAC Technologies, Sunny Optical Technology, Meituan, Baidu Group, Trip.com Group-S, NetEase, and Vipshop, totaling 51 enterprises. These enterprises should focus on improving their pure technical efficiency and strengthening their technical management capabilities.
The third type is the “high-technical-efficiency and low-scale-efficiency” type. These enterprises have relatively high pure technical efficiency but relatively low scale efficiency. These leading enterprises include Suning.com, China Mobile, Foxconn Industrial Internet, GigaDevice Semiconductor, Kingsoft Office, Tencent Holdings, Xiaomi Group-W, JD.com, GDS Holdings, and Alibaba Group, totaling 10 enterprises. These enterprises should focus on improving their scale efficiency. The focus of transformation should be on expanding the production scale of enterprises and achieving centralized resource allocation.
The fourth type is the “double-low” type. These enterprises have both relatively low pure technical efficiency and relatively low scale efficiency compared to the frontier firms. These leading enterprises include Midea Group, Gree Electric Appliances, Han’s Laser, Unigroup Guoxin, AVIC Jonhon Optronic Technology, Huatian Technology, iFlytek, NAURA Technology Group, Zhejiang Century Huatong, Shennan Circuits, Desay SV, East Money Information, Inovance Technology, Sanyou Group, Mango Excellent Media, China Unicom, Silan Microelectronics, Yonyou Network, Haier Smart Home, Sanan Optoelectronics, Iris Ohyama, Baosight Software, 360 Security Technology, China Telecom, Dawning Information Industry, Ecovacs Robotics, China Resources Microelectronics, Hua Hong Semiconductor, Autohome, Futu Holdings-W, Smoore International, and Weibo, totaling 32 enterprises. For these enterprises, improvement should focus on two aspects. On the one hand, they need to improve their management capabilities. On the other hand, they need to promote the expansion of enterprise scale.
Theoretical explanation for scale efficiency dominance: Three well-established mechanisms from industrial organization and platform economics explain why scale efficiency dominates in China’s digital economy. First, economies of scale. Digital platforms exhibit near-zero marginal cost for additional users [25]. Larger firms can spread substantial fixed costs over a larger revenue base, creating a significant cost advantage. Second, network effects. The value of a digital platform increases with the number of users, creating a positive feedback loop [26]. This mechanism disproportionately benefits larger firms and reinforces their scale efficiency. Third, first-mover advantages. Early entrants can capture market share and establish user habits before later competitors respond [27]. This allows leading firms to achieve efficient scale quickly and maintain it over time. These mechanisms collectively explain why scale efficiency contributes more to overall efficiency than pure technical efficiency in the digital economy context. Recent research on platform ecosystems has reaffirmed the continuing relevance of these mechanisms in the contemporary digital economy [28]. This finding contrasts with that of Li et al. [11], who found that pure technical efficiency dominates innovation efficiency in China’s semiconductor industry. This difference likely stems from industry characteristics: semiconductor manufacturing depends more on technological breakthroughs (pure technical efficiency), while digital platforms depend more on user scale and network effects (scale efficiency). This contrast reinforces our conclusion that the drivers of efficiency in the digital economy differ in important ways from those in traditional manufacturing sectors.
4.4. Robustness Checks
To ensure the reliability of the results, this study conducts robustness checks from two dimensions: model orientation and returns to scale assumptions. The results of these two checks are reported below.
DEA models can be divided into input-oriented and output-oriented. Input orientation focuses on minimizing inputs for a given level of outputs. Output orientation focuses on maximizing outputs for a given level of inputs. The main analysis uses the input-oriented BCC model. This section uses the output-oriented BCC model to remeasure firm efficiency. This test checks whether the choice of orientation affects the efficiency rankings.
Table 6 shows the output-oriented efficiency results. The rankings from the output-oriented model are highly consistent with the main analysis. The frontier firms, including Digital China, Guolian Shares, and Huitongda Network, remain efficient under both orientations, with efficiency scores of 1. Among the top 10 firms, nine have similar rankings under both orientations. Among the bottom 10 firms, all are exactly the same under both orientations. These results show that the efficiency rankings are not sensitive to the choice of orientation.
Table 6.
Comparison of robustness check results.
The main difference between the BCC model and the CCR model is their assumptions about returns to scale. The BCC model assumes variable returns to scale (VRS). This allows firms to have increasing, constant, or decreasing returns at different scales. The CCR model assumes constant returns to scale (CRS). It assumes that all firms operate at their optimal scale. This section uses the CCR model to remeasure efficiency and compares the results with the main BCC results.
Table 6 shows the CCR efficiency results. The rankings from the CCR model are highly consistent with the BCC model. Among the top 10 firms, nine have similar rankings under both models. Among the bottom 10 firms, all are exactly the same under both models. More importantly, the CCR efficiency scores are very close to the scale efficiency scores from the BCC decomposition. Since the CCR model does not separate pure technical efficiency from scale efficiency, its efficiency scores directly reflect scale efficiency. This finding supports the main conclusion of this study. The efficiency gap among leading digital economy firms comes mainly from scale efficiency, not pure technical efficiency.
Table 6 summarizes the rankings of the top 10 and bottom 10 firms under three model specifications. This allows for a direct comparison.
First, the identification of both frontier and low-efficiency firms is highly stable across all three model specifications. Digital China, Guolian Shares, and Huitongda Network are efficient under all specifications, while firms such as Lens Technology and Hua Hong Semiconductor consistently rank at the bottom. Second, the rankings of high-efficiency firms are largely consistent, with nine out of the top ten firms showing similar ranks across specifications. Although GigaDevice Semiconductor ranks 49 under the output-oriented model, this single discrepancy does not affect the overall conclusion. Together, these results confirm that the findings are not sensitive to model orientation or returns to scale assumptions.
In summary, robustness checks on orientation choice and returns to scale assumptions further validate the main conclusions of this study. The efficiency measurement results for leading digital economy firms are reliable. The finding that the efficiency gap comes mainly from scale efficiency is robust.
4.5. Dynamic Evolution of Leading Enterprise Efficiency
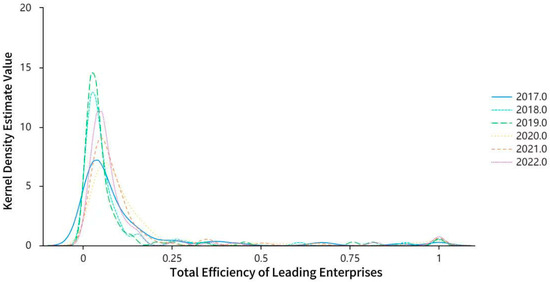
Using the kernel density estimation method mentioned above, this section estimates the distribution characteristics of digital economy efficiency for leading enterprises in China. The Epanechnikov kernel function is adopted. The “Silverman rule of thumb” is used for bandwidth selection. The bandwidth of the Epanechnikov kernel is not fixed. An adaptive kernel density estimation method is applied to obtain the bandwidth values for analysis and the probability density estimation plots of digital economy efficiency for leading enterprises, as shown in Table 7 and Figure 1.
Table 7.
Bandwidth values for digital economy efficiency of leading enterprises.
Figure 1.
Kernel density chart of total efficiency of leading enterprises in digital economy.
The peak of the probability density of digital economy efficiency for leading enterprises shows a trend of “rise–decline–rise”. Differences exist in digital economy efficiency among leading enterprises, but these differences are decreasing. As shown in Figure 1, during the sample period, the density peak of digital economy efficiency for leading enterprises is mostly concentrated around 0.06. The peak of digital economy efficiency for leading enterprises shows a “rise–decline–rise” trend. Overall, the efficiency of leading enterprises shows relatively small and stable variation over time. The right-tail feature is evident. Due to the large efficiency gap between high-efficiency and low-efficiency leading enterprises, the right-tail feature appears each year. Several peaks form at efficiency values of 0.25, 0.35, and 1. This indicates that differences exist in digital economy efficiency among leading enterprises. The main peak width of the kernel density estimation narrowed from 2017 to 2022. This suggests that efficiency differences among most leading digital economy enterprises are decreasing.
Economic interpretation of the kernel density patterns. The kernel density estimation reveals several patterns that can be linked to economic mechanisms.
First, the density peak shows a “rise–decline–rise” trend. The peak rose from 7.19 in 2017 to 8.24 in 2018. This increase coincided with the early growth phase of China’s digital economy, when supportive policies and market expansion lifted many firms. The peak then declined to 7.65 in 2019. This decline may reflect increased market competition and regulatory adjustments in the digital sector. The peak rose again to 11.28 by 2022, likely driven by accelerated digital transformation following the COVID-19 pandemic.
Second, the right-tail feature is evident each year, with small peaks at efficiency values of 0.25, 0.35, and 1. This indicates a “superstar” effect in the digital economy. A small number of highly efficient firms, such as Digital China and Huitongda Network, operate at the efficiency frontier. Most firms cluster at lower efficiency levels. This polarized structure suggests that the digital economy is characterized by winner-take-most dynamics, consistent with platform economy theories.
Third, the main peak width narrowed from 2017 to 2022. This narrowing suggests that efficiency differences among most leading firms are decreasing. Less efficient firms are catching up with more efficient peers. This convergence process can be explained by technology diffusion and knowledge spillovers. As digital technologies mature, they become more accessible, allowing lagging firms to improve their efficiency.
Fourth, starting from 2018, the multi-peak feature became more evident. Four zones emerged: high efficiency (near 1), upper-middle efficiency (around 0.35), middle efficiency (around 0.25), and low efficiency (below 0.1). This stratification indicates that the digital economy is not a level playing field. Policy interventions may be needed to prevent further divergence and promote more inclusive development.
Crucially, these four patterns all point to the same underlying mechanism identified in Section 4.3: scale efficiency dominance. The persistence of the frontier (right-tail) reflects the self-reinforcing nature of scale efficiency through network effects and economies of scale. The narrowing main peak shows that most firms are improving their scale efficiency over time. The emergence of a “superstar” club (the peak near 1) confirms that once a firm achieves efficient scale, it tends to maintain its lead. In other words, the kernel density patterns are not just descriptive statistics; they are visual evidence that scale efficiency is the primary driver of both efficiency gaps and the polarized structure of China’s digital economy.
The finding that scale efficiency dominates is consistent with studies on the US digital economy, where large platforms like Amazon and Google benefit from strong economies of scale. However, it contrasts with Europe, where pure technical efficiency plays a larger role due to a more fragmented digital market. This comparison suggests that China’s digital economy, like that of the US, is characterized by large-scale platforms and winner-take-most dynamics.
5. Research Conclusions and Policy Recommendations
This paper evaluates the operational efficiency of leading digital economy firms in China from 2017 to 2022 using the BCC-DEA model. The results show that overall efficiency is low but exhibits a fluctuating upward trend. More importantly, by decomposing efficiency into pure technical and scale components, this study identifies scale efficiency as the dominant source of efficiency gaps.
Three main findings emerge. First, most leading firms have relatively low efficiency values in our sample but high growth rates. Except for a few firms, such as Shanghai Ganglian, Huitongda Network, Digital China, and Guolian Shares, most firms have efficiency values below 0.5. A total of 83 out of 99 firms show an upward trend. Second, based on the BCC-DEA decomposition, scale efficiency appears as the primary driver of the efficiency gap among the sampled firms. The average scale efficiency is higher than the average pure technical efficiency. Based on the decomposition, the 99 firms are classified into four types: double-high (six firms), low-technical-efficiency with high-scale-efficiency (51 firms), high-technical-efficiency with low-scale-efficiency (10 firms), and double-low (32 firms). Third, the kernel density analysis shows a “rise–decline–rise” trend with a right-tail feature indicating a “superstar” effect. The main peak width has narrowed over time, confirming that efficiency differences are decreasing, though a polarized structure remains.
Building on these findings, this study makes three contributions to the literature on digital economy efficiency.
Unlike most existing studies that rely on regional or industry-level aggregated data, this study focuses on leading digital economy firms at the firm level. By decomposing overall efficiency into pure technical and scale components, it identifies scale efficiency as the dominant source of efficiency gaps. This finding would have been masked in aggregated analyses. More importantly, it provides a clear diagnostic direction for policymakers: efficiency gaps among leading firms are primarily about scale configuration, not just management quality.
Second, this study develops a four-type classification based on the interaction between pure technical efficiency and scale efficiency (double-high, low-technical/high-scale, high-technical/low-scale, double-low). This classification reveals that inefficiency is heterogeneous. Some firms need better management, some need larger scale, some need both, and a few are already efficient. This provides a more nuanced and actionable understanding than simply ranking firms by overall efficiency.
Third, this study applies kernel density estimation to track the dynamic evolution of efficiency from 2017 to 2022. The results show a narrowing main peak but a persistent right-tail superstar effect. This indicates that most leading firms are converging toward a common efficiency level, while a small group of frontier firms maintains their lead. This provides China-specific evidence on how efficiency distribution evolves in a rapidly growing digital economy, and it corroborates the theoretical mechanisms that explain scale efficiency dominance (economies of scale, network effects, first-mover advantages).
These contributions have direct practical implications. Based on the four-type classification, we offer concrete recommendations for each firm type and for policymakers.
For Type 1 firms (double-high, six firms): These are benchmark firms. Policymakers can support knowledge transfer by establishing demonstration programs, industry best-practice sharing platforms, and mentorship schemes, where Type 1 firms guide lower-efficiency firms.
For Type 2 firms (low-technical-efficiency, high-scale-efficiency, 51 firms): These firms have the right scale but poor management. We recommend: (a) management training programs focusing on lean operations, digital process optimization, and data-driven decision-making; (b) subsidies for adopting cloud computing and ERP systems to improve technical efficiency; and (c) peer-learning networks that connect Type 2 firms with Type 1 firms to facilitate knowledge transfer.
For Type 3 firms (high-technical-efficiency, low-scale-efficiency, 10 firms): These firms manage their resources well but are too small. We recommend: (a) facilitating horizontal mergers or strategic alliances to help them reach minimum efficient scale; (b) simplifying regulatory approval for geographic or product-line expansion; and (c) providing access to scale finance, such as preferential loans for capacity expansion.
For Type 4 firms (low both, 32 firms): These firms face dual constraints. We recommend a two-phase approach. Phase 1: Diagnostic assessment. Identify whether management, scale, or both is the binding constraint through firm-level efficiency decomposition and management audits. Phase 2: Targeted pilot projects. If management is the primary constraint, implement training and technology adoption programs (as in Type 2). If scale is the primary constraint, implement merger facilitation or market expansion support (as in Type 3). If both are constraints, implement a sequenced approach, starting with management improvements before pursuing scale expansion.
For policymakers at the regional or sectoral level, do not use one-size-fits-all policies. Identify the dominant inefficiency type in each region or sector and design targeted interventions accordingly. For example, regions with many Type 2 firms should prioritize management training and technology subsidies; regions with many Type 3 firms should prioritize merger facilitation and market access; and regions with many Type 4 firms should prioritize diagnostic capacity and sequenced pilot programs.
Several limitations should be acknowledged. None invalidates our core findings, but they qualify the scope of our conclusions.
First, input–output constraints. Our indicators capture only capital and labor inputs and financial output. They do not capture digital-specific dimensions, such as R&D, patents, data assets, or network effects. This has two opposing implications. A firm may appear efficient by optimizing traditional inputs, yet lag in digital capabilities (overestimation). Conversely, a firm investing heavily in digital transformation may appear inefficient due to high upfront costs without immediate revenue returns (underestimation or misclassification). Therefore, our efficiency measures reflect how efficiently firms use physical capital and labor to generate revenue, not a comprehensive measure of digitalization, and our four-type classification should be interpreted as reflecting current operational efficiency, not digital capability or future potential.
Second, sample bias. Using the 2022 ranking to select firms introduces size and survivorship bias. Larger firms are overrepresented, and firms that exited the ranking are excluded. Our findings apply primarily to surviving, large-scale leading firms.
Third, descriptive analysis. We document trends and associations, not causal relationships. Unobserved factors, such as management quality or policy changes, may also affect efficiency.
Fourth, generalizability. Our findings are based on 99 Chinese leading firms from 2017 to 2022. Whether they extend to smaller firms, other countries, or other periods remains open.
Future research should incorporate digital-specific indicators, use time-varying samples, and apply causal methods.
Author Contributions
Conceptualization, J.Z.; methodology, L.Z.; software, L.Z., Y.Z. and K.Y.; investigation, Y.Z.; data curation, L.Z.; writing—original draft, L.Z., Y.Z. and K.Y.; writing—review and editing, J.Z.; supervision, J.Z.; funding acquisition, J.Z. All authors have read and agreed to the published version of the manuscript.
Funding
This work was supported by the National Social Science Foundation of China (No. 22BGL033).
Institutional Review Board Statement
Not applicable.
Informed Consent Statement
Informed consent was obtained from all subjects involved in the study.
Data Availability Statement
The data that support the findings of this study are derived from publicly available statistical yearbooks, including the China Statistical Yearbook, China Industrial Statistics Yearbook, China Tertiary Industry Statistics Yearbook, China Electronic Information Industry Statistics Yearbook, China Trade and External Economic Statistics Yearbook, China Cultural and Related Industries Statistics Yearbook, and various provincial statistical yearbooks. Further inquiries can be directed to the corresponding author. [statistical yearbooks] [https://www.stats.gov.cn/sj/ndsj/2025/indexeh.htm, accessed on 30 April 2026].
Conflicts of Interest
The authors declare no conflicts of interest.
Appendix A
Table A1.
Overall efficiency of top 100 digital economy enterprises (2017–2022).
Table A2.
Pure technical efficiency of top 100 digital economy enterprises (2017–2022).
Table A3.
Scale efficiency of top 100 digital economy enterprises (2017–2022).
References
- Sun, G.; Fang, J.; Li, J.; Wang, X. Research on the impact of the integration of digital economy and real economy on enterprise green innovation. Technol. Forecast. Soc. Change 2024, 200, 123097. [Google Scholar] [CrossRef] [Scilit]
- Tapscott, D. The Digital Economy: Promise and Peril in the Age of Networked Intelligence; McGraw-Hill: New York, NY, USA, 1996. [Google Scholar]
- Ayres, R.U.; Williams, E. The digital economy: Where do we stand? Technol. Forecast. Soc. Change 2004, 71, 315–339. [Google Scholar] [CrossRef] [Scilit]
- Pan, W.; Xie, T.; Wang, Z.; Ma, L. Digital economy: An innovation driver for total factor productivity. J. Bus. Res. 2022, 139, 303–311. [Google Scholar] [CrossRef] [Scilit]
- Luo, K.; Liu, Y.; Chen, P.F.; Zeng, M. Assessing the impact of digital economy on green development efficiency in the Yangtze River Economic Belt. Energy Econ. 2022, 112, 106127. [Google Scholar] [CrossRef] [Scilit]
- Zhang, Y.; Wang, M.; Cui, L.; Kuang, A. Impact of the digital economy on green total factor productivity in Chinese cities. Econ. Geogr. 2022, 42, 33–42. [Google Scholar] [CrossRef]
- Wang, L.; Shao, J. Digital economy, entrepreneurship and energy efficiency. Energy 2023, 269, 126801. [Google Scholar] [CrossRef] [Scilit]
- Lei, P.; Li, X.; Yuan, M. The consequence of the digital economy on energy efficiency in Chinese provincial and regional contexts: Unleashing the potential. Energy 2024, 311, 133371. [Google Scholar] [CrossRef] [Scilit]
- Zhang, Y.; Ding, S.; Fang, C. Spatiotemporal Variation and Spatial Convergence of China’s Digital Economy Industry Development: Based on the Big Data of Enterprise. Econ. Geogr. 2023, 43, 120–130. [Google Scholar] [CrossRef] [Scilit]
- Li, J.; Zhang, T.; Du, X.; Li, Y. How can the digital economy drive low-carbon city performance in China to achieve sustainable development goals? A multiple-output perspective. J. Clean. Prod. 2024, 454, 142316. [Google Scholar] [CrossRef] [Scilit]
- Li, H.; He, H.; Shan, J.; Cai, J. Innovation efficiency of semiconductor industry in China: A new framework based on generalized three-stage DEA analysis. Socio-Econ. Econ. Econ. Plan. Sci. 2019, 66, 136–148. [Google Scholar] [CrossRef] [Scilit]
- Li, S.; Gao, L.; Han, C.; Gupta, B.; Alhalabi, W.; Almakdi, S. Exploring the effect of digital transformation on Firms’ innovation performance. J. Innov. Knowl. 2023, 8, 100317. [Google Scholar] [CrossRef] [Scilit]
- Charnes, A.; Cooper, W.W.; Rhodes, E. Measuring the efficiency of decision making units. Eur. J. Oper. Res. 1978, 2, 429–444. [Google Scholar] [CrossRef] [Scilit]
- Banker, R.D.; Charnes, A.; Cooper, W.W. Some models for estimating technical and scale inefficiencies in data envelopment analysis. Manag. Sci. 1984, 30, 1078–1092. [Google Scholar] [CrossRef] [Scilit]
- Tone, K. A slacks-based measure of efficiency in data envelopment analysis. Eur. J. Oper. Res. 2001, 130, 498–509. [Google Scholar] [CrossRef] [Scilit]
- Andersen, P.; Petersen, N.C. A procedure for ranking efficient units in data envelopment analysis. Manag. Sci. 1993, 39, 1261–1264. [Google Scholar] [CrossRef] [Scilit]
- Chung, Y.H.; Färe, R.; Grosskopf, S. Productivity and undesirable outputs: A directional distance function approach. J. Environ. Manag. 1997, 51, 229–240. [Google Scholar] [CrossRef] [Scilit]
- Xie, H. Research on efficiency measurement and influencing factors of China’s digital economy. Front. Econ. Manag. 2022, 3, 290–298. [Google Scholar]
- Zhang, G.; Ye, Y.; Sun, M. Assessing the static and dynamic efficiency of digital economy in China: Three stage DEA–Malmquist index based approach. Sustainability 2023, 15, 5270. [Google Scholar] [CrossRef] [Scilit]
- Zhong, K.; Wang, Y.; Pei, J.; Tang, S.; Han, Z. Super efficiency SBM-DEA and neural network for performance evaluation. Inf. Process. Manag. 2021, 58, 102728. [Google Scholar] [CrossRef] [Scilit]
- Zhu, Z.; Song, T.; Huang, J.; Zhong, X. Executive cognitive structure, digital policy, and firms’ digital transformation. IEEE Trans. Eng. Manag. 2022, 71, 2579–2592. [Google Scholar] [CrossRef] [Scilit]
- Sun, Z.; Zhao, L.; Kaur, P.; Islam, N.; Dhir, A. Theorizing the relationship between the digital economy and firm productivity: The idiosyncrasies of firm-specific contexts. Technol. Forecast. Soc. Change 2023, 189, 122329. [Google Scholar] [CrossRef] [Scilit]
- Clemente-Almendros, J.A.; Nicoara-Popescu, D.; Pastor-Sanz, I. Digital transformation in SMEs: Understanding its determinants and size heterogeneity. Technol. Soc. 2024, 77, 102483. [Google Scholar] [CrossRef] [Scilit]
- Zhao, R.; Xu, J.; Zhao, Y.; Feng, Y. Resource allocation pattern to green technology innovation efficiency: Synergy between environmental resource orchestration and firms’ digital capabilities. J. Innov. Knowl. 2025, 10, 100760. [Google Scholar] [CrossRef] [Scilit]
- Shapiro, C.; Varian, H.R. Information Rules: A Strategic Guide to the Network Economy; Harvard Business School Press: Brighton, MA, USA, 1999. [Google Scholar]
- Katz, M.L.; Shapiro, C. Network externalities, competition, and compatibility. Am. Econ. Rev. 1985, 75, 424–440. [Google Scholar]
- Lieberman, M.B.; Montgomery, D.B. First-mover advantages. Strateg. Manag. J. 1988, 9, 41–58. [Google Scholar] [CrossRef] [Scilit]
- Kretschmer, T.; Leiponen, A.; Schilling, M.; Vasudeva, G. Platform ecosystems as meta-organizations: Implications for platform strategies. Strateg. Manag. J. 2022, 43, 405–424. [Google Scholar] [CrossRef] [Scilit]

Disclaimer/Publisher’s Note: The statements, opinions and data contained in all publications are solely those of the individual author(s) and contributor(s) and not of MDPI and/or the editor(s). MDPI and/or the editor(s) disclaim responsibility for any injury to people or property resulting from any ideas, methods, instructions or products referred to in the content. |
© 2026 by the authors. Licensee MDPI, Basel, Switzerland. This article is an open access article distributed under the terms and conditions of the Creative Commons Attribution (CC BY) license.