


Abstract
This study, which uses the 2025 Global Innovation Index dataset, examines the structural architecture of global innovation systems, using Knowledge and Technology Outputs (KTO) as the dependent variable to measure the level of innovation. It aims to identify the latent dimensions of the global innovation system, the heterogeneity of global innovation regimes, and the determinants of global innovation outputs. The study adopts a holistic approach, including PCA, K-means clustering, machine learning algorithms such as MLP, and explainable artificial intelligence methods such as SHAP and LIME. The study finds that the global innovation system is highly concentrated, with 80.22% of the total variance explained by a single component. In addition, the study identifies five sharply differentiated global innovation regimes with near-perfect separability, achieving up to 100% accuracy. The nonlinear MLP model demonstrates strong predictive performance (R2 = 0.8836), with Business Sophistication as the main factor affecting KTO, followed by Infrastructure and Human Capital. Explainability analysis shows high consistency between SHAP and LIME and a highly centralized interaction structure, in which a few dimensions have a strong impact on innovation performance. The structural paradigm of the global innovation system is hybrid, with a linear backbone and nonlinear interactions coexisting. This study has contributed to methodological development in the field of innovation research and has provided insights into the development of more precise and effective innovation policy.
Keywords:
clustering analysis; complex systems; explainable machine learning; global innovation index; innovation regimes; MLP; nonlinear systems; network analysis; SHAP MSC:
37N40
1. Introduction
The importance of innovation as one of the significant drivers of growth, change, and competitiveness has been recognized [1,2]. With regard to a knowledge-driven global economy, the potentiality to create, absorb, and exploit knowledge becomes crucial in understanding productivity behavior and involvement in global production networks [3,4]. Hence, national innovation systems have become one of the principal models used in accounting for differences between countries in terms of innovation success and economic development.
Despite the wealth of empirical evidence that already exists in the field, many studies are based on linear econometric and composite index approaches that assume of homogeneity and linearity in the input-output relationships in innovation [5]. Innovations are adaptive, complex, and nonlinear entities in which feedback and thresholds occur, as well as system behavior dependent on regimes. Thus, there is a possibility that linear models cannot reflect the multidimensional reality of global innovation systems.
However, to overcome these problems, previous research has relied on multivariate statistics including Principal Component Analysis (PCA) and cluster analysis to explore the existence of latent structures and country classifications in innovation regimes [6,7]. Studies utilizing PCA show that few latent factors can account for most variances within innovation variables, whereas cluster analysis indicates that there exist different development trajectories for innovation in countries instead of one equilibrium point [8]. However, there is still little knowledge regarding the relationships between latent structures, regime heterogeneity, and nonlinear determinants [9].
In recent times, machine learning (ML) and explainable artificial intelligence (XAI) advancements have created robust mechanisms for addressing these challenges. ML algorithms facilitate the formulation of nonlinear functions without imposing any stringent functional form assumptions [10]. The SHAP method, among various XAI approaches, is one such approach that is theoretically justified by using cooperative game theory for decomposing model outputs into additive effects of features [11]. Specifically, SHAP guarantees consistency, local accuracy, and global interpretability of model outcomes, and is increasingly adopted in economic, financial, and policy-related research contexts [11,12,13].
SHAP-based explainability, on the other hand, turns black-box ML models into structural models, which help to understand the contribution of each innovation variable into the result. In such a way, it makes it possible for scholars not only to improve model predictions but also gain additional insights on the influence of each innovation dimension. Thus, the use of XAI can bring about greater theoretical knowledge of the interconnection between variables.
Furthermore, contemporary research highlights the importance of XAI approaches not just for interpretative purposes but also for discovering structures within intricate socio-economic systems, thus facilitating the recognition of underlying relationships between variables [14]. Nevertheless, although such progress has been made, there has been little use of an ML-XAI combination in the study of global innovation systems’ structures.
Based on this perspective, the empirical analysis carried out in this study employs a cross-sectional sample from 139 nations using the 2025 Global Innovation Index (GII), which was developed by the World Intellectual Property Organization [15]. There are five input indicators that are considered, namely Institutions, Human Capital and Research, Infrastructure, Market Sophistication, and Business Sophistication, while the KTO index becomes the dependent variable measuring innovation outcomes. Creative outputs are not included as a way of avoiding the output-to-output problem [16].
This suggested theoretical model comprises three types of techniques (linear, nonlinear, and explainable) into one comprehensive analytical framework. To begin with, correlation analysis and PCA are utilized to uncover latent variables and resolve problems related to multicollinearity, thereby determining the major structural factors within the global innovation system [17]. Then, K-means clustering is performed to differentiate innovative regimes, and the techniques of pseudo-supervised learning are implemented for verification purposes [18,19].
Third, a nonlinear Multi-Layer Perceptron (MLP) model is adopted to explore intricate relationships among innovation inputs and outputs. In contrast to econometrics, MLP can approximate functions in higher dimensional space that can be used for nonlinear innovation processes [20]. To overcome the lack of interpretability in the context of black box models, we use both SHAP and LIME for global and local explanations of the model results consistently [11,21].
Notably, this research work contributes to the field of explainability by going beyond the concept of analyzing feature importance. Interaction networks for SHAP are generated to analyze the dependencies that exist among innovation dimensions using graph and spectral techniques [22,23]. Furthermore, entropy measures, based on information theory, are utilized to assess concentration and dominance tendencies in the interaction network [24,25]. Lastly, bootstrap and quantile SHAP analysis is conducted to test for distributional robustness of feature importance [12,26].
As far as comparison goes, the suggested approach has several distinctive features compared to prior research. While the former mainly addresses linear econometric models, dimensionality reduction through PCA, clustering methods for segmenting customers, or black box methods of predicting customer behavior using machine learning, the suggested analysis combines all the above methods in a single framework. The suggested approach includes structure extraction via PCA, regime classification via clustering, nonlinear predictions using MLP, and interpretability through SHAP/LIME.
Novelty of the research includes the following four points. Firstly, this research views global innovation performance as a regime-dependent nonlinear system instead of a homogeneous linear system. Secondly, this paper proposes a pseudo-supervised validation method for assessing structural validity in innovation regimes. Thirdly, this paper considers the distributionally robust SHAP values for the robustness of interpretations. Lastly, this paper expands the application of explainable artificial intelligence from explaining individual features to structural interpretation of innovation systems.
Moreover, recent breakthroughs in the realm of explainable AI have shown that the SHAP decomposition not only increases interpretability but is also capable of improving theoretical insights in economics through structural interpretation of black box outputs [9]. The importance of such a property cannot be overestimated in the case of innovation systems as the analysis of nonlinear interaction structures plays an important role in developing policies. With the help of SHAP decomposition, policymakers can uncover direct and interaction-based effects of innovation dimensions on performance measures.
Using this methodology, the research attempts to answer the following questions:
- (i)
- How prominent is the dominance of latent structures and regimes in the global innovation system?
- (ii)
- Are there statistically distinct innovation regimes in the world?
- (iii)
- What innovation inputs demonstrate the most substantial nonlinear effects on innovation output?
- (iv)
- What features do interaction structures possess?
In answering these questions, this paper makes several contributions to existing literature. Firstly, it offers empirical proof of the existence of regime-dependent innovation architectures. Secondly, it determines the most important nonlinear factors influencing innovation efficiency using machine learning methods. Lastly, it reveals any structural interdependencies using network analysis and information theory tools. In terms of policy implications, it can be concluded that innovation systems have a complex and nonlinear nature; therefore, the approach to policy-making should shift from general solutions to regime-dependent and structural measures.
2. Dataset and Methodology
The methodology of this research employs a multi-stage analysis process that combines linear, nonlinear, and explainable artificial intelligence methods for the assessment of global innovation system structures. As illustrated in Figure 1, the methodology progresses from data processing to network and information theory-based analysis. In this methodology, “structure” is defined as the association between innovation inputs and outcomes. Contrary to the conventional index approach, which presupposes homogeneity, the new methodology incorporates multiple dimensions and heterogeneities of regimes through simultaneous analysis of structural dimensions using PCA, structural heterogeneities through clustering, and structural associations through nonlinear machine learning and network analysis.
Figure 1.
Mapping complexity: the integrated analytical framework for global innovation systems.
As depicted in Figure 1, the process involves five sequential but interrelated steps. Firstly, the set of 139 countries in the GII 2025 is standardized by utilizing the z-score method. Secondly, structural discovery takes place via correlational analysis and PCA, after which the K-means clustering algorithm along with Elbow and Silhouette methods determine the regimes of innovations. The third step involves verification of these regimes in the context of pseudo-supervised learning. Fourthly, a nonlinear modeling methodology using Multi-Layer Perceptron (MLP) is applied, while SHAP and LIME ensure interpretability of the model, and bootstrap provides robustness. Lastly, SHAP interaction network and Shannon entropy help in discovering structural dependencies.
Table 1 is designed to aid in understanding by providing an exhaustive list of symbols, subscripts, and abbreviations used in the analysis through the methodology to improve clarity and interpretation of the mathematics involved.
Table 1.
Comprehensive list of mathematical notations, indices, and acronyms.
2.1. Dataset and Preprocessing
The empirical analysis is based on cross-sectional data from 139 countries, which is drawn from the 2025 edition of the GII. This data is published by the WIPO. The GII framework is based on an extensive and multi-dimensional approach towards the measurement of national innovation systems by encompassing both the input and output dimensions of innovation performance. In particular, the data is based on seven key pillars: Institutions (INST), Human Capital and Research (HCR), Infrastructure (INF), Market Sophistication (MARK), Business Sophistication (BUS), Knowledge and Technology Outputs (KTO), and Creative Outputs (CRE) [15].
This study is an extension of the well-established structure of GII that was used in previous research. To exemplify, the study by Pençe, Kalkan, and Çeşmeli (2019) [27] shows the effectiveness of the innovation performance model using artificial neural networks with the sub-components of GII, which underscores the importance of input variables in the model. Moreover, research such as Carpita and Ciavolino (2017) [28], as well as Jankowska et al. (2017) [29], underscores the structural relationship between innovation inputs and outputs, which suggests that innovation outputs can be seen as the functional transformation of the dimensions of the input variables. Consistent with the above-mentioned literature, the current study is grounded in the conceptual framework of the structural model of innovation outputs as a function of input drivers.
Within this context, KTO is specified as the dependent variable, which represents the innovation performance. On the other hand, the set of independent variables comprises the five input pillars: INST, HCR, INF, MARK, and BUS. Notably, the CRE variable is not included to avoid output–output endogeneity and possible inference bias, as emphasized in the methodological literature [16]. Accordingly, the following is the specification of the empirical model:
where:
In Equation (2) denotes the number of countries and represents the number of input variables. The dependent variable is represented as:
However, in terms of logical consistency, the current specification fits well into the general theoretical framework of GII where general innovation performance is a function of the dimensions of innovation inputs and outputs (that is, ). However, in the case of the current study, the specific output dimension ) is chosen to be used as the dependent variable to ensure non-circular nature of the transformation from innovation inputs into outputs.
Further, has been chosen for use as the dependent variable due to the reason that they represent the most measurable dimension of innovation performance by incorporating the variables related to knowledge creation, technology transfers, and innovative capability, among others. As opposed to innovation indices, measures the efficiency of the transformation from the dimensions of innovation inputs to outputs. Also, the exclusion of CRE helps to overcome the issue of endogeneity among output variables.
In the study, to ensure comparability across variables and eliminate scale effects, all variables are standardized using z-score normalization:
In Equation (4) and denote the mean and standard deviation of variable , respectively. Standardization is an important concept in multivariate analysis, especially in PCA, as it helps to ensure that all the variables are contributing equally to the covariance structure [17].
After applying the z-score normalization process, all the variables become dimensionless and unitless entities. As a result, all mathematical equations in this paper (such as covariance matrices, optimization algorithms, cluster analysis, SHAP explanations, and network models) meet the requirement of dimensional homogeneity.
To ensure the reproducibility and transparency of the results, the entire data set and all the Python 3.14 scripts are publicly available and can be accessed through the following link: https://github.com/Sadullah4535/GII (accessed on 26 April 2026).
2.2. Principal Component Analysis
PCA, first proposed by Karl Pearson [30] and later developed by Harold Hotelling [31]. It is used for dimensionality reduction and extracting the most important structural features from the innovation system.
Given a standardized data matrix defined in Equation (1), a covariance matrix is calculated as follows:
The PCA transformation is obtained through eigenvalue decomposition:
where:
and:
represents the orthonormal eigenvector matrix satisfying:
Each principal component is defined as a linear projection:
with variance:
The proportion of variance explained by each component is:
and the cumulative explained variance is:
Such a framework for spectral decomposition allows for the identification of the prominent structural axes in the innovation system. This means that if a large proportion of variance is explained by a few leading eigenvalues, the innovation system can be effectively represented in a lower-dimensional space [32].
In theory, such a result implies that the global innovation system is controlled by a few prominent structural dynamics, and this result is consistent with those obtained in multivariate system analysis, in which a large-dimensional system tends to be represented on a lower-dimensional manifold [31].
The problems with PCA, however, include the assumptions that it is linear, orthogonally based, and sensitive to scale changes. In the current research, all the variables are scaled before being analyzed. While it does not account for nonlinear relationships, PCA is used only to create an orthogonally based latent space that is later enriched by MLP and clustering methods. The validity of the PCA construction, on the other hand, is justified by the clustering and prediction accuracy findings.
Further confirmation of the latent structures obtained from PCA was done by carrying out PCA regression, cluster stability tests, and consistency verification using SHAP nonlinear importance measures. The high prediction accuracy (R2 = 0.839) alongside consistent cluster recovery and correspondence to the results from the SHAP method confirm the robustness of the latent structures.
2.3. Cluster Identification and Validation
The primary motivation for selecting the K-means algorithm is that the country-level innovation indicators employed in the analysis are specified in a continuous, normalized, and comparable feature space with respect to the Euclidean metric [33]. In this regard, the K-means algorithm enables a geometric interpretation of the clustering configuration since it is founded on an optimization problem that aims to minimize the variance of the clusters. The K-means clustering algorithm was employed to identify the innovation regimes of countries. The objective function is:
This formulation tends to minimize the second-order moment, or the dispersion within each cluster. Thus, K-means allows the specification of cluster centers that denote the “mean regime behavior” for innovation systems, which are continuous and multi-dimensional structures [34,35,36].
The best choice for the number of clusters, i.e., , was determined using both structural and numerical methods. In the Elbow method, the best number of clusters is determined where the increase in the number of clusters does not show any significant improvement in the within-cluster sum of squares, whereas the Silhouette score calculates the tightness of items within clusters and the separation between the clusters.
In Equation (15), is the average distance of the observation to its own cluster, and is the average distance of the observation to the closest alternative cluster. The Silhouette value ranges between −1 and +1, where large positive values indicate well-defined and separated clusters [37,38].
The transformation of the data into a latent feature space, which is achieved with the aid of PCA, is conducted before the clustering step, with the aim of tackling the issue of multicollinearity as well as complex correlations between the innovation indicators. The use of PCA ensures the stabilization of the clustering procedure, as well as the facilitation of the interpretation of the “mean regime behavior” of the innovation systems [30,39,40].
2.4. Pseudo-Supervised Structural Validation
A pseudo-supervised validation strategy was used to assess the structural separability of the clustering solutions. In this strategy, the cluster labels assigned using the K-means algorithm were considered as class labels, and a multi-class classification problem was formulated based on the original indicator space.
The class label assigned to an observation is given by Equation (16), where the observation matrix is and the corresponding cluster labels are .
In Equation (16), denotes the decision function learned by various classifiers.
The structural decomposition is assessed based on the accuracy criterion and the confusion matrix. The confusion matrix is defined in Equation (17) to denote the number of instances belonging to class that are predicted as class [41].
The row-normalized confusion matrix provides a quantitative insight into the degree of overlap of each cluster with other regimes.
The objective of pseudo-supervised validation is not to optimize classification accuracy, but to assess how well the regimes represented by the clusters are recoverable and how well they are distinguished in the feature space. In the literature, the task of recreating cluster labels using classifiers is a common practice suggested for assessing the [42,43,44].
2.5. Nonlinear Regression and Explainability Framework (MLP-Based)
The use of KTO as a measure of innovation performance is done to avoid the circularity and mechanical dependencies that would arise from the use of the aggregated GII. Hence, the focus of the analysis is not about predicting the value of the aggregated index score but understanding the nonlinear impact of various innovation inputs on output performance. In terms of model selection based on the analysis in Section 3.4, the MLP model appears to have the highest predictive accuracy compared to other tree-based ensembles due to the model’s ability to deal with complex nonlinearities and interdependencies [10,20].
Mathematically, the MLP model describes a nonlinear mapping from the input space to the output space , represented by a composition of affine transformations and nonlinear activation functions. The predictive function of a feedforward neural network with hidden layers can be represented as:
In Equation (18) denotes the input vector, and represent the weight matrices and bias vectors at layer , and is a nonlinear activation function (in this study, hyperbolic tangent). This formulation allows for the approximation of highly complex nonlinear relationships without making any assumptions regarding the functional form of the relationships [20].
The parameters of the model are estimated by minimizing a regularized empirical risk function given by Equation (19):
In Equation (19), denotes the set of all network parameters, and is the regularization parameter that controls the model’s complexity. This approach ensures that the model is both predictive and generalizes well, as excessive complexity is penalized [10].
Although neural networks are highly predictive, they are often regarded as “black-box” models because of their lack of interpretability. To combat this issue, the present study has adopted SHAP as a post hoc method for interpretability. SHAP is used for interpreting nonlinear models, and thus, global as well as local interpretability is achieved [11].
The SHAP-based decomposition of the prediction function for the MLP is given by Equation (20).
In Equation (20), represents the expected model output over the dataset, and denotes the marginal contribution of the feature to the prediction. This additive form is ensured by the additive representation, which allows for an exact decomposition of the entire prediction.
The SHAP values are based on the idea of Shapley values, which are derived from cooperative game theory, and can be calculated by means of Equation (21).
where represents a subset of features excluding feature , and is the total number of features. This form ensures fairness, consistency, and additivity of feature contributions [45].
In addition to the application of the SHAP tool, the authors utilize the LIME approach in testing the interpretability of the model. The local explanation is obtained by solving the equation in (22).
In Equation (22) is the local surrogate model, defines the locality around observation , and penalizes model complexity. This definition allows for instance, specific interpretability of nonlinear predictions [21].
For the purpose of evaluating the consistency and robustness of interpretability among various explainability methods, the rankings of feature importances generated by SHAP and LIME are evaluated in terms of rank correlations, namely Spearman’s ρ and Kendall’s τ. Instead of measuring the magnitude of contributions—which cannot be measured since they come from different attributing models—the focus is placed on how the ranking of features can be compared. In doing so, it becomes possible to evaluate the robustness of the relationship between SHAP, whose attribution is global and theoretically sound, and LIME, whose attributions are local and based on perturbations.
2.6. Distributional Robustness: Quantile and Bootstrap SHAP
For the assessment of the distributional stability of SHAP contributions, resampling by means of bootstrap sampling and quantile analysis was used. This approach, as a methodological tool, is an increasingly accepted robustness technique for the assessment of sample sensitivity of model descriptions and stability of estimate descriptions [12].
In addition, research papers addressing the stability and reliability of SHAP explanations emphasize the relevance of such distributional analyses [12,13,46].
For each bootstrap sample , the mean absolute SHAP contribution for the -th observation and the -th variable is calculated as in Equation (23).
This indicator captures the mean of absolute SHAP values for each subset of bootstraps. Next, the 25%, 50% (median), and 75% quantiles were computed for this series of values. In this way, not only the average SHAP value of the relevant variables but also the statistical properties of the distribution were examined. This quantile analysis allows not only the central tendency of SHAP values but also their stability under sample variation to be explored. Strong research in XAI emphasizes the need to evaluate both accuracy and stability in explanation models, as stabilizing SHAP values can enhance the stability of explanations [47,48].
2.7. Network-Based Interaction Structure
To analyze the structure of nonlinear interactions among variables, a weighted feature interaction network using SHAP interaction values was built. In this network, each node corresponds to an explanatory variable, and the weights on the edges connecting nodes are determined by the average absolute SHAP interaction values of the variable pairs:
In Equation (24), is the SHAP interaction value between the variables and , and is the expected value of the observations.
Representing the SHAP values of the interaction results as a weighted feature interaction network facilitates the structural understanding of the interdependencies among the innovation drivers. Instead of analyzing the results of the pairwise interactions individually, the network-based approach allows for the detection of clusters of highly interacting variables, as well as the identification of central nodes facilitating the coordination of the dynamics of the innovation system. This approach has been increasingly suggested in the literature on explainable artificial intelligence for the detection of interaction structures in complex machine learning models [49].
The global structural properties of the weighted network were examined using the graph Laplacian matrix. The Laplacian matrix is given by Equation (25).
In Equation (25), represents the weighted neighborhood matrix, and is the degree matrix, which holds the cumulative connection weights of the nodes. The eigenvalue spectrum of the Laplacian matrix is a widely used spectral feature for quantifying the degree of centralization of the graph, its structural concentration, and the extent to which connection weights are concentrated within the network.
This method is regarded as a best practice technique to identify whether the interactions of variables in complex systems are diffused or concentrated around a specific structural pattern [22,23,50]. Moreover, the use of SHAP interaction visualization based on network representation is recommended in the literature as a modern technique that enhances the structural interpretability of machine learning models [12,49].
On a broader scale, the integration of structural discovery, predictive modeling, and network analysis contributes to the robustness of the analytical framework. Although the machine learning model can detect nonlinear predictive relationships between innovation inputs and innovation performance, the interaction network based on SHAP values reveals the structural configuration of these relationships within the innovation system. This allows the analysis to transcend the limits of predictive modeling and provide a more robust theoretical basis [51].
In this case, groups of variables that interact strongly together form dense subgraphs of the weighted interaction network, while structurally central variables are chosen according to their strength of interaction and contribution to the connectivity of the network. A procedure for the identification of coordination structures may be formalized as an implicit algorithmic procedure which involves the following steps carried out in sequence: (i) formation of the weighted interaction matrix by SHAP interaction values, (ii) conversion of the matrix into the weighted undirected graph, (iii) calculation of node strength and edge density to find the group of highly interacting variables, (iv) discovery of densely interconnected subgraphs as coordination structures, and (v) calculation of eigenvalues of the Laplacian matrix of the graph as indicators of structurally important variables.
2.8. Information-Theoretic and Entropy Measures
The Shannon entropy was computed to quantify the concentration of information based on variables, using the probability matrix derived from the row-normalization of the interaction matrix as follows:
In Equation (26), is the normalized probability of interaction between the -th variable and the -th variable. The equation is derived from the definition of Shannon entropy, which is the foundation of information theory [24].
The node-based entropy values were employed to determine the degree of concentration of explanatory power in the network. A low entropy value indicates that information is concentrated in a few dominant interactions, while a high entropy value indicates a dispersed interaction pattern. This method is widely accepted as a standard procedure for quantifying structural concentration in complex networks [25,52,53].
3. Empirical Findings
3.1. Correlation Structure and Latent Dimensionality of the Global Innovation System
Pearson’s correlation was used to investigate the relationships among the critical components of the GII. The correlation was conducted based on the standardized components shown in Figure 2 to uncover the underlying structure of the global innovation system.
Figure 2.
Correlation matrix of GII pillars (lower triangle visualization).
As depicted in Figure 2, the GII Score has strong positive correlations with the pillar variables, especially Knowledge and Technology Outputs (r ≈ 0.92) and Creative Outputs (r ≈ 0.94), implying that output-oriented variables are the main drivers of the general performance in innovation. In addition, the input-related pillars show high interdependence, e.g., Human Capital and Research in Infrastructure (r ≈ 0.81) and Market Sophistication (r ≈ 0.79).
Furthermore, there is a highly correlated relationship (r ≈ 0.87) between Business Sophistication and Knowledge and Technology Outputs, which denotes a high degree of association between the two indicators. In general, the presence of highly correlated values of relationships (r > 0.75) indicates that innovation variables have high consistency and may develop through the same process or mechanism.
In this regard, it must be noted that the variable CRE is considered here only for exploratory correlations to demonstrate the structure of the GII methodology framework. In accordance with the model specification stated in Section 2.1, CRE will be dropped from all further analyses.
It is also worth noting that such high correlations suggest the existence of a phenomenon known as multicollinearity among the regressors. Indeed, from a statistical point of view, when linear relationships exist between variables, there is a redundancy of information within the vectorial space, and it might be challenging to apply classical regression methods. Thus, the presence of correlation suggests not only the consistency of the innovation system but also the phenomenon of multicollinearity, which makes it necessary to examine its lower-dimensional representations.
This, as shown in Figure 2, indicates the presence of multicollinearity, and there are latent structures of low dimensionality that underline the global innovation system. This conclusion can be further related to composite index approaches and the structural decomposition approach used in this study. Despite the ability of composite indexes to integrate various variables into one index, there may be some relationships between the variables that are hard to capture using composite index approaches. However, using correlation analysis, Principal Component Analysis, and cluster analysis, we are able to find some hidden structures in the innovation system. That is, through Principal Component Analysis, latent space is created to measure the innovation potential of a country, whereas, through cluster analysis, we find some innovation regimes.
In this study, Principal Component Analysis (PCA) was applied to examine the hidden structure underlying the core elements of the GII. The PCA analysis results are shown in Figure 3.
Figure 3.
PCA correlation circle plots of Global Innovation Index pillars: (a) PC1–PC2 projection; (b) PC1–PC3 pro-jection.
The explained variance results indicate that PC1 captures a dominant proportion of total variance, while other PCs capture a marginal proportion, such that PC2 captures ≈ 7.65%, PC3 captures ≈ 5.76%, PC4 captures ≈ 3.64%, and PC5 captures ≈ 2.73%. This result clearly indicates that the global innovation system is largely dominated by a single dimension, and higher-order components play a relatively less important role.
As indicated in Figure 3a, all the pillars of the GII have a high and positive loading value on PC1, and the value ranges from 0.43 to 0.46. Such uniformity in the loading values indicates the presence of a common factor. This common factor represents the underlying factor, and the underlying factor represents the overall innovation capacity. On the PC1–PC2 plane, the differentiation among the pillars is evident. Institutions have a high positive value on PC2, i.e., 0.76. Additionally, Institutions have the highest value for the vector length, i.e., ≈0.87. This indicates a strong presence on the second principal component. Human Capital and Research and Business Sophistication have negative values, −0.49 and −0.32, respectively, on the second principal component. Additionally, Infrastructure has a moderate value, i.e., 0.23, and Market Sophistication has a low value, i.e., −0.14, on the second principal component.
Figure 3b represents the PC1–PC3 plane. In this plane, Business Sophistication records a high loading at 0.68 with a high vector magnitude of about 0.82, while Infrastructure records a low negative loading of −0.54, and Market Sophistication records a low negative loading of −0.35, implying divergence between firm-level and market-level conditions. Institutions register a moderate loading at 0.33, while Human Capital and Research record a low loading of −0.08.
Linear regression with the principal components relating to KTOs was used in this study to test how well the underlying components explained the variation. The results from the regression analysis are illustrated in Figure 4 below.
Figure 4.
Observed versus predicted values of Knowledge and Technology Outputs using Principal Component Regression.
A high level of explanatory power is achieved with an R2 value of (0.839), indicating that about 83.90% of the variance in KTO is explained by the principal components. The root mean squared error is calculated to be (5.492), suggesting that the prediction error is low.
From the regression analysis, it is found that PC1 has the strongest influence on KTO, with a positive coefficient of 5.925. This confirms the dominant role of PC1 as the innovation factor. On the other hand, the negative signs of the coefficients of PC2 and PC5 (−5.213 and −5.636, respectively) suggest that these are the opposing dimensions of the innovation system. PC3 and PC4 have lower effects on KTO with coefficients of 1.686 and −1.708, respectively.
3.2. Clustering Structure and Segmentation of Countries Based on Innovation Inputs
For this research, to identify the homogeneous clusters of countries in terms of the innovation input structure, a K-means clustering algorithm was used considering the five variables of the GII pillars. The optimal number of clusters was identified through the Elbow and Silhouette approaches, which are illustrated in Figure 5.
Figure 5.
Elbow and Silhouette analysis for optimal number of clusters (K).
As depicted in Figure 5, the inertia values are decreasing monotonically with an increasing number of clusters. On the other hand, the Silhouette score is at its maximum level when the number of clusters is set to K = 2, while it is at an acceptable level when the number of clusters is set to K = 5. Moreover, the existence of an elbow point at K = 5, along with an acceptable level of the Silhouette score, verifies that the number of clusters is optimal when set to five. This implies that the countries in the dataset are partitioned into five distinct clusters based on the innovation input characteristics.
In study, to gain insight into the nature of the clusters, K-means with K = 5 is applied to map the clusters into two dimensions via PCA. The result is illustrated in Figure 6.
Figure 6.
PCA-based visualization of K-means clustering results (K = 5).
As shown in Figure 6 above, the differentiation between countries within each cluster is evident, hence validating the clustering model used. The heterogeneity arising from innovation systems around the world is founded on vast differences among nations with respect to input and output relationships within innovation processes. Heterogeneity does not arise because of any country’s size but rather due to the presence of various innovation regimes characterized by various institutional, human capital, infrastructure, and entrepreneurship capabilities. In accordance with our cluster results, it becomes clear that the regimes are easily distinguishable, hence implying that there are various ways through which innovation systems develop compared to a single route. Moreover, the high precision of the pseudo-supervised technique provides sufficient proof that the regimes exist and have distinctive structures. For instance, the differentiation of Cluster 4, having the highest average Knowledge and Technology Outputs (44.26), from other clusters is apparent. Examples of countries in Cluster 4 include the US, Germany, Japan, and Sweden.
On the contrary, countries such as those in Cluster 1, which has the lowest average KTO value (12.12), consist of countries such as Ethiopia, Niger, and Pakistan. These countries represent countries with weak innovation input structures. Specifically, these countries present low levels in all the pillars. The levels in the Human Capital and Research pillar (16.25) and the Infrastructure pillar (26.44) are low.
Clusters 0, 2, and 3 indicate different stages in the development of innovation, and they present different structural patterns. For instance, cluster 0, with a KTO score of 29.82, includes countries such as Italy, Spain, and Türkiye, and they indicate relatively balanced and moderately high levels of innovation inputs, especially in terms of Institutions (56.36) and Infrastructure (52.77). On the other hand, cluster 2, with a KTO score of 16.01, includes countries such as Indonesia, Morocco, and South Africa, and they indicate a mid-low innovation structure, especially in terms of relatively moderate levels of Institutions (51.67), while Business Sophistication is relatively lower (25.73). Lastly, cluster 3, with a KTO score of 19.79, includes countries such as Brazil, Mexico, and the Russian Federation, and they indicate a different pattern, especially in terms of relatively higher levels of Human Capital (36.77), while Institutions are relatively lower (25.17).
In the case of research, to explore the disparities with respect to input structure for innovations between countries, a K-means clustering technique was used to form 5 clusters from the five aspects of innovation inputs. Findings are presented in Figure 7.
Figure 7.
Heatmap of cluster profiles based on innovation input variables (K = 5).
From Figure 7, it is evident that there are significant and economically interpretable differences among clusters for each input variable. Cluster 4 has the most sophisticated innovation systems with consistently high ratings for all five pillars (Institutions: 76.54; Human Capital and Research: 55.41; Infrastructure: 58.98; Market Sophistication: 57.24; Business Sophistication: 53.80). On the other hand, Cluster 1 has the least developed innovation systems with low scores for almost all pillars, such as Human Capital (16.25) and Infrastructure (26.44). The structure of Cluster 0 is relatively balanced as well, with relatively high scores for Institutions (56.36) and Infrastructure (52.77). On the other hand, Cluster 2 indicates moderately developed innovation systems with relatively strong Institutions but poor Business Sophistication (Institutions: 51.67; Business Sophistication: 25.73). Finally, Cluster 3 indicates highly unbalanced systems with very high Human Capital but very weak Institutions (Human Capital: 36.77; Institutions: 25.17).
Boxplots were used for each independent variable to better evaluate the variation in innovation inputs among different clusters. The findings can be seen in Figure 8.
Figure 8.
Distribution of innovation input variables across clusters.
As seen in Figure 8 above, the distribution analysis has reinforced the identified patterns as seen in the previous section. Notably, Cluster 4 has the highest median and mean distribution for all the variables, while Cluster 1 has the lowest distribution. The mean distribution also supports the findings, e.g., Institutions, where Cluster 4 has a mean of 76.54 compared to Cluster 1 with a mean of 33.25. Similarly, Business Sophistication is also higher in Cluster 4 at 53.80 compared to Cluster 1 at 23.96.
3.3. Inter-Cluster Similarity and Distance Analysis
Various distance/similarity measures such as Euclidean Distance, Manhattan Distance, cosine similarity, and Pearson correlation, were used to thoroughly evaluate cluster cohesiveness and separability. The comparative analysis results using these measures are illustrated in Figure 9 below.
Figure 9.
Cluster similarity and distance matrices based on innovation inputs.
In the analysis of distances and similarities, there appear to be distinct structural differences among the clusters. The highest difference occurs between Cluster 4 and Cluster 1 using Euclidean Distance and Manhattan Distance. This shows the least level of similarity since the Euclidean Distance is 5.581 and Manhattan Distance is 12.461. Also, cosine similarity provides a higher negative correlation for Cluster 4 and Cluster 1 (−0.964) but shows high similarity between Cluster 0 and Cluster 4 (0.863). Likewise, Pearson Correlation provides higher negative correlation for Cluster 0 and Cluster 4 (−0.845) but gives a moderate positive correlation between Cluster 1 and Cluster 4 (0.705).
3.4. Robustness and Structural Separability of Innovation Regimes
Further verification of the separability of the detected clusters was performed using several different machine learning classifiers that classify the data into clusters depending on the characteristics used as the input. Such a strategy allows one to verify the clusters’ separability indirectly and enables detection of both linear and nonlinear separability.
From Figure 10, the nature of the clustering solution is highly separable, as indicated by the high degree of classification achieved by the various classification algorithms. The Logistic Regression, Gaussian Naïve Bayes, Artificial Neural Network, and CatBoost models have achieved perfect classification (accuracy = 1.000). The same is true for the Random Forest and Support Vector Machine models, as they have achieved high levels of classification (accuracy = 0.9643), although some misclassification is evident, especially in Cluster 2, as indicated by the recall value, which is approximately 0.875. However, the Decision Tree model is less accurate compared to the other models, as indicated by an accuracy value of 0.8571. Nevertheless, the high degree of classification achieved by the models confirms that the nature of the clustering solution is well-defined and stable.
Figure 10.
Confusion matrix comparison across machine learning models.
For this study, to verify the reliability and applicability of the model and its results, the accuracy obtained by the model is evaluated and analyzed through the grid search optimization technique, as illustrated in Figure 11.
Figure 11.
Model performance after GridSearch optimization (K = 5).
As shown in Figure 11, several models show near-perfect performance after tuning the hyperparameters. The models, such as Logistic Regression, Gaussian Naive Bayes, Artificial Neural Networks, and CatBoost, all show a perfect score for all evaluation metrics (accuracy = 1.000, F1-score = 1.000, AUC = 1.000). Other models, such as Random Forest and Support Vector Machines, also show high performance (accuracy ≈ 0.9643, F1-score ≈ 0.9733 and 0.9482, respectively). On the other hand, Decision Trees remains the worst-performing model (accuracy = 0.8571, F1-score ≈ 0.8635), again confirming that a simple tree structure may not be sufficient to capture the underlying boundaries for the clusters. The results again confirm the robustness of the clustering results and that the innovation regimes are highly distinguishable in the multidimensional input space.
Finally, to analyze the detailed structure of classification errors and inter-cluster confusion, the normalized confusion matrices for the best-performing models are analyzed. The analysis is intended to determine potential overlaps for the clusters and analyze structural proximity. The results are shown in Figure 12.
Figure 12.
Normalized confusion matrices for selected models (Random Forest, SVM, Logistic Regression).
Figure 12 demonstrates clear and distinct separability among the clusters. The results indicate that the Logistic Regression model is able to classify all instances with perfect accuracy, as all values on the diagonal are 1.000 and all off-diagonal values are zero, indicating no instances of misclassification. The Random Forest model also demonstrates low levels of confusion, with a low percentage of instances of misclassification between Cluster 2 and Cluster 1 (0.125). The results for the Support Vector Machine model also indicate low levels of confusion, with a low percentage of instances of misclassification within Cluster 3, where 33.3% are classified as Cluster 2, while all other instances are classified correctly. The results indicate that while the clusters are highly separable, there are several clusters that demonstrate a level of structural similarity, such as Cluster 2 and Cluster 3.
3.5. Model Selection Strategy and Feature Importance
The nonlinear model selection process was not just performed to extend the linear modeling framework but also to identify the best algorithms to be used for the feature importance analysis. The purpose of this step is to identify the models with the best performance, which are also capable of handling nonlinear relationships in the innovation system. Several machine learning models, such as neural networks, kernel models, and tree-based ensemble models, were utilized. The grid search optimization technique was employed for evaluating the models. The performance of the nonlinear models is presented in Table 2. As can be seen, these models can perform well, thus confirming their suitability for modeling innovation.
Table 2.
Optimal hyperparameters and performance metrics of regression models.
From the findings presented in Table 2, it is clear that the MLP has the best predictive performance compared to the other models, with an R2 value of 0.8836, followed by Gradient Boosting with an R2 value of 0.8576, Extra Trees with an R2 value of 0.8539, and finally Random Forest with an R2 value of 0.8487. On the other hand, Decision Trees with an R2 value of 0.7839 and LightGBM with an R2 value of 0.7830 have relatively weaker predictive performance compared to the other models. This implies that these models are less capable of describing the complexity of the innovation system.
Based on the results obtained in Table 2 above, the top four models are chosen for feature importance analysis. These models are chosen based on the assumption that these are the most accurate models in terms of predictive performance compared to the other models. The gap in terms of predictive performance between these models and the rest is very small, which shows that the innovation output structure is very learnable. Therefore, the use of these models is very strong methodologically for feature importance analysis. The models chosen are Multi-Layer Perceptron, Gradient Boosting, Extra Trees, and Random Forest.
To test the predictive capabilities of advanced nonlinear regression models and to determine the relative contribution of different dimensions of innovation input, a comparative analysis was performed among the top four models, namely MLP, Gradient Boosting, Extra Trees, and Random Forest. The analysis was performed to ensure that results obtained through feature importance are based on models that have high predictive accuracy and are able to generalize well. The models are optimized through a grid search and are validated on a hold-out test set, and the evaluation metrics are Mean Squared Error (MSE), Root Mean Squared Error (RMSE), Mean Absolute Error (MAE), and R2. The results obtained are shown in Figure 13.
Figure 13.
(a) MLP feature importance and performance; (b) Gradient Boosting feature importance and performance; (c) Extra Trees feature importance and performance; (d) Random Forest feature importance and performance.
Figure 13 indicates that the highest predictive performance is achieved by the Multi-Layer Perceptron model, followed by Gradient Boosting, Extra Trees, and Random Forest. The predictive performance is maximized for the MLP model with an R2 value of 0.8836, RMSE of 0.3931, and MAE of 0.3317. The feature importance chart shows that the feature contributing most to Knowledge and Technology Outputs prediction is ‘Business Sophistication,’ followed by ‘Infrastructure’ and ‘Human Capital and Research.’ However, ‘Market Sophistication’ and ‘Institutions’ have a low impact on Knowledge and Technology Outputs prediction. Thus, the results show that Knowledge and Technology Outputs are highly driven by Business Sophistication and Infrastructure supporting innovation activities.
Furthermore, as seen in Figure 13 above, though the model structure is different for neural network models and ensemble trees, the important features contributing to Knowledge and Technology Outputs prediction are similar for all models. This shows the robustness and consistency of the results. The robustness and consistency of results show that there is no bias towards a particular model and results are based on the intrinsic nature of innovation systems.
3.6. Model Explainability and Nonlinear Contribution Structure
SHAP analysis was performed using the MLP model that has been optimized to understand the nonlinear impact of the innovation inputs on Knowledge and Technology Outputs. Such an analysis allows for the understanding of global feature importance, nonlinear dependencies, linear relationships, and sensitivity scenarios. The findings from these analyses are presented in Figure 14, Figure 15, Figure 16, Figure 17 and Figure 18.
Figure 14.
MLP—global SHAP feature importance (5 GII Dimensions).
Figure 15.
MLP—SHAP dependence plots.
Figure 16.
MLP—SHAP interaction.
Figure 17.
Linear vs. SHAP importance comparison.
Figure 18.
MLP—scenario effects (±1 SD).
Figure 14 shows the global relevance of the five chosen dimensions of the GII, as measured by the SHAP values. The dimension “Business Sophistication” is the most important, with the highest value (mean |SHAP| = 0.4208), followed by “Infrastructure” (0.2268) and “Human Capital and Research” (0.1659). The dimensions “Institutions” and “Market Sophistication” have smaller SHAP values 0.1247 and 0.1068, respectively.
Figure 15 illustrates the SHAP dependence plots for all features, showing how changes in each input dimension affect predicted output values nonlinearly. The results indicate that increasing Business Sophistication and Infrastructure levels always positively contributes to predicted output values for innovation, while the effect of Institutions and Market Sophistication is less pronounced and context-dependent.
Figure 16 displays an approximate interaction matrix based on the correlation of SHAP values, aiming to approximate the interdependency between features. The results indicate strong positive correlations between Business Sophistication and Market Sophistication (r = 0.92), as well as between Human Capital and Research and Infrastructure (r = 0.64), indicating that these features tend to contribute to predicted output values for innovation jointly.
On the other hand, Institutions show negative correlations with a number of features (e.g., r = −0.63 for Business Sophistication), indicating a potentially more independent or even distinct contribution pattern for this element within the innovation system.
The results indicate that while some dimensions may be mutually supportive and reinforce one another in terms of driving innovation performance, others may be more independent.
It should be noted that the results obtained are based upon co-variation statistics and SHAP contribution, not real interaction effects in the strict sense of the term, as is the case with SHAP interaction values. The results obtained should be seen as indicative of real dependency in an approximate sense rather than in an exact sense. Future research can extend the present study by using SHAP interaction values to examine feature interaction more closely.
Figure 17 below compares the feature importance based on the coefficients obtained from the linear Ridge regression model and the SHAP values obtained from the nonlinear MLP model. While the coefficients from the linear model show Business Sophistication as the most dominant feature, the SHAP results show the same ranking, which indicates the robustness of the results obtained from the model.
Figure 18 displays the scenario analysis for each dimension of the input features, with features varying at ±1 standard deviation. Once again, Business Sophistication has the greatest impact, with the largest difference at +0.5148/−0.4775. Infrastructure and Human Capital and Research are again ranked second and third, with effects of +0.2005/−0.2486 and +0.1502/−0.1959, respectively. While the effects of Market Sophistication and Institutions are less significant, they are still significant.
To further explore whether the nonlinear relationships observed at the global level differ for various innovation regimes, a cluster-based SHAP analysis was carried out. In this part of the analysis, countries were first clustered into five groups based on the K-means method, where K = 5, and then SHAP values calculated for the optimized MLP model were aggregated at the cluster level. The results of this analysis are reported in Figure 19.
Figure 19.
Cluster-based SHAP contribution profiles (MLP, K = 5).
As presented in Figure 19 above, the contribution level differs in the clusters. This indicates that the driving forces behind the innovation output in the innovation clusters may not be the same. From Cluster 0, the main contributor in the innovation cluster is Business Sophistication, which contributes (0.3448). Human Capital and Research contributes (0.2125). The third contributor in the cluster is Market Sophistication, which contributes 0.1145. This indicates an innovation system driven by human capital and market conditions. Business Sophistication contributes negatively in Cluster 1, i.e., (−0.1793). Similarly, Market Sophistication contributes negatively in the cluster, i.e., −0.0209. However, Institutions contribute (0.0531) in the cluster. This indicates an underperforming innovation system in which the driving forces may not be transferred to the innovation output.
On the other hand, Cluster 3 shows high values for Business Sophistication (0.2868) and Market Sophistication (0.0926). This shows the impact of the market-driven innovation-dynamic effects. Furthermore, Cluster 4 shows high values for Business Sophistication (0.2347) and Infrastructure (0.1034). This shows the impact of infrastructural capacity on innovation outputs. On the contrary, Cluster 2 shows low values for Business Sophistication (−0.0130) and Infrastructure (0.0404). This shows the poor structure of the innovation regime.
Moreover, distributional robustness is achieved by analyzing the stability of SHAP-derived variable importance through data sampling iterations. This guarantees that the observed nonlinearities are not an artifact of specific samples but are based on structural dynamics of the innovation process.
3.7. Local Interpretability and Cross-Method Explainability Consistency
To verify the interpretability and validity of the explanations provided by the explainable AI approach, consistency was verified between multiple explanations generated through various techniques. In this study, consistency between SHAP, which is a global and model consistent technique, and LIME, which is a local and perturbation-based technique, was investigated based on the ranking of features. This consistency was measured using Spearman’s and Kendall’s τ.
To further examine the behavior of the optimized MLP model at the local level and validate the robustness of the feature importance at the global level, the LIME technique was utilized for the analysis. In summary, the objective was to examine the feature contributions for specific instances, observe the differences in the feature contributions for different predicted outputs, and examine the differences in the feature importance compared to the global feature importance calculated using the SHAP technique. The results obtained through the analysis are presented in Figure 20 and Figure 21.
Figure 20.
LIME global feature importance (MLP).
Figure 21.
LIME-based local contribution profiles (MLP).
Figure 20 displays the results for the average global importance for each input dimension, as provided by the LIME explainer tool. The input dimension with the largest contribution is Business Sophistication, at 0.4804, followed by Infrastructure at 0.2731 and then Human Capital and Research at 0.2011. The contributions for Institutions are 0.1743 and for Market Sophistication 0.0906. Again, these results mirror the previous analysis, where SHAP was used to examine the global contributions for each input dimension, and again business-related capabilities and infrastructure support are found to be the major drivers for Knowledge and Technology Outputs.
The results for Figure 20 also show that Business Sophistication is again the major input dimension, contributing close to half of the total, followed by Infrastructure and then Human Capital, while Market Sophistication and Institutions are less important. The results for the ranking are consistent for both SHAP and LIME, with Spearman and Kendall τ = 0.999.
In Figure 21, we show the explanations generated by LIME for two example instances, namely the instance with the highest innovation output prediction and the instance with the median prediction value. For the instance with the highest innovation output, the feature contributions are Business Sophistication (0.581), Infrastructure (0.263), and Human Capital (0.204), while Institutions have a negative value (−0.220). For instance, with the median innovation output, the feature contributions are Business Sophistication (0.457), Infrastructure (0.294), and Human Capital (0.205), while Institutions have a slightly negative value (−0.144). We observe that, while Business Sophistication is the most important feature in each instance and contributes to the highest innovation output, the contributions of the other features are instance-specific, indicating the nonlinear interactions among the features. The positive contributions of Infrastructure and Human Capital are consistent, while the feature contributions of Institutions might have nonlinear effects. Figure 21 confirms the heterogeneity in feature contributions and the stability of the globally determined features.
In further assessment of consistency, the global SHAP values are compared with the global importance values obtained using the LIME method (Figure 22). It is observed that the consistency of the ranking of the features is high: Business Sophistication > Infrastructure > Human Capital and Research > Institutions > Market Sophistication. This consistency (Spearman and Kendall τ = 0.999) affirms the reliability of the MLP model’s nonlinear assessment of the dominant factors of the innovation outputs.
Figure 22.
SHAP vs. LIME rank comparison.
Figure 22 demonstrates the consistency between the SHAP values and the LIME values of the global importance of the features: the SHAP value of Business Sophistication (0.4208) is similar to the LIME value of Business Sophistication (0.4804). Similarly, consistency is observed in the values of the other features.
The high degree of correlation between the rankings generated by SHAP and LIME methods (Spearman’s , Kendall’s τ ≈ 0.999) shows that there is a high level of structural stability in the trained MLP model. Despite the different theoretical foundations of SHAP and LIME, the fact that both approaches converge to similar results shows that the model is based on a very stable function, where a few important features, such as Business Sophistication and Infrastructure, play a major role.
3.8. Distributional Stability of Feature Contributions
To quantify distributional robustness, bootstrapping is adopted to generate various samples from the original dataset, with the computation of SHAP values performed on each of the generated samples. To assess the robustness and distributional stability of the contribution scores achieved through the optimized MLP, the bootstrap technique is adopted with the application of SHAP analysis. The purpose of this is to assess the variability in each of the features’ importance levels, thus generating an element of uncertainty. The results obtained from this analysis are shown in Figure 23.
Figure 23.
Bootstrap SHAP importance quantiles (MLP).
In Figure 23, we provide a plot showing the percentiles Q25, Q50, and Q75 for absolute SHAP values per dimension in our data set. We have computed this based on 30 bootstrap samples. We find that Business Sophistication has the highest contribution with a median importance Q50 = 0.4249, while Infrastructure contributes the second highest with an importance value of 0.2736. Human Capital and Research contribute equally with an importance value of 0.1578. Institutions contribute the least with an importance value of 0.1752, while Market Sophistication contributes the least with an importance value of 0.1169. We can also observe that while Business Sophistication and Infrastructure have a moderate level of variation with high and low contribution levels (STD = 0.0705 and 0.0813, respectively), the contribution levels for Market Sophistication are relatively stable with low contribution levels (STD = 0.0435).
In Figure 23, we note that Business Sophistication and Infrastructure, which have the highest contribution to the innovation output, appear in all the bootstrap samples, which is an indication that the nonlinear feature importance estimate we used is reliable. Moreover, we can estimate the uncertainty associated with the contribution of each feature using the standard deviation and interquartile range values; thus, we have a rigorous way of interpreting the results obtained in the study to draw policy implications in the heterogeneous innovation context.
The consistency of feature importance scores and the narrow range of SHAP scores between bootstrap samples show that the explainable artificial intelligence approach is distributionally stable and does not rely on sampling variation.
3.9. Network-Based Concentration and Structural Dominance of SHAP Interactions
Network-based SHAP analysis was performed to further analyze the structure and interaction between the input variables in the optimized MLP model. Network-based SHAP analysis allows for the study of the interdependence, domination, and aggregation of feature contribution in the SHAP interaction network. The output from network-based SHAP analysis is shown in Figure 24, Figure 25 and Figure 26.
Figure 24.
SHAP interaction matrix (MLP).
Figure 25.
Laplacian spectrum of SHAP network.
Figure 26.
Feature distance and curvature spectra.
Figure 24 shows the absolute correlation coefficients between the SHAP values of the input features, which represent the interaction between the input features. The absolute correlation matrix shows the strength of the interaction between the input features. The interaction is stronger between Market Sophistication and Business Sophistication (0.8450), followed by Human Capital and Research with Market Sophistication (0.8234) and Business Sophistication (0.8223). The interaction is lower between Institutions with Infrastructure (0.6908) and Business Sophistication (0.7133). The results show that the knowledge and technology outcomes not only depend upon the individual feature contribution but also upon the interaction between the input features.
The network structural properties are quantified by the Laplacian Spectrum in Figure 25. The eigenvalues indicate that the network is connected since there is only one zero eigenvalue (eigenvalue 1 = 0.0000). Also, the highest eigenvalue (eigenvalue 5 = 3.9418) shows moderate heterogeneity in the interconnections of features, verifying Business Sophistication, Market Sophistication, and Human Capital as key nodes in network cohesion, as confirmed by the interaction strengths in Figure 24.
Furthermore, Figure 26 presents the Euclidean Distance matrix, which shows the relationship between the SHAP contributions and the curvature spectrum. Based on the distance, the Business Sophistication feature is most differentiated from the Institutions (8.6509) and Human Capital (5.1468) features, thus reinforcing the relative importance of the Business Sophistication feature as an innovation output determinant. Furthermore, the curvature spectrum is presented, which shows the relative importance of each feature, where the first feature is the most dominant (0.8488). This shows that the SHAP network is mostly concentrated on the first structural axis, reinforcing the relative importance of the features as innovative drivers.
From the analysis, the SHAP contributions are individually important, while at the same time, there is dependency between the features. Furthermore, Business Sophistication, Market Sophistication, and Human Capital features have been consistently identified as the most important features, thus reinforcing their relative importance as features influencing the innovation output in knowledge and technology innovation.
Apart from the dependencies between the features, the relative information content of the SHAP contribution for each of the features was analyzed based on the node-wise entropy and entropy flow. This has been presented in Figure 27.
Figure 27.
Node-wise entropy and entropy flow (MLP-SHAP).
As shown in Figure 27, it is evident that all features have similar node-wise entropy values: Institutions 1.5970, Human Capital and Research 1.6007, Infrastructure 1.5983, Market Sophistication 1.6020, Business Sophistication 1.5995. This shows a similar pattern of information distribution in the network. In terms of entropy flow, this refers to the gradient of node entropy. This has minor differences in terms of direction: Institutions 0.00376, Human Capital 0.00065, Infrastructure 0.00063, Market Sophistication 0.00060, Business Sophistication −0.00254. The negative gradient for Business Sophistication indicates a converging effect, emphasizing Business Sophistication’s position as a structurally dominant and concentrated component in the network. This confirms the previous interaction and curvature analysis, emphasizing the position of the drivers in the output of innovation.
4. Conclusions and Discussion
The implications of the study indicate that the integrative analysis framework can be applied to global innovation systems using linear dimension reduction methods, clustering techniques, nonlinear machine learning algorithms, and artificial intelligence. The results obtained from the analysis indicate that there is a strong centralized structure in the global innovation system, where about 80% of the variance is accounted for by one dimension. The results validate the presence of a single-system spine, thus corroborating the systemic nature of innovation systems. The linear structure implies that there is a high level of global convergence in innovation capability, where nations have similar developmental structures based on structural capability. Generally, this implies that innovation performance across the globe is significantly determined by a single structural element.
However, the results go beyond the limits of linear relationships and reveal notable heterogeneity in the regimes. First, the existence of five very unique innovation regimes undermines the claim of convergence on the world scale and confirms the multiple-paths framework for understanding economic growth. The exceptional accuracy in the distinction between these innovation regimes is evidence that these regimes are structurally robust innovation regimes and not statistically robust innovation regimes. Secondly, the existence of nonlinear relations indicates that there is no convergence that takes place universally; rather, there is a convergence that depends on the specific institutions and the unique characteristics of the countries and their firms such as sophistication of business and infrastructural complementarities.
The results obtained from the modeling process through the application of a nonlinear method indicate that the output of innovations is characterized by complex and nonlinear relationships, and accurate predictions were obtained using the MLP method (R2 = 0.8836). Of all the variables tested for their influence on innovation, it can be stated that Business Sophistication is the leading variable alongside Infrastructure and Human Capital. This research demonstrates that the ability to absorb knowledge, or absorptive capacity, is a crucial factor that drives innovation at the organizational level. In practical terms, the findings imply that the same policy measures would have very different implications in various nations due to differences in structural preparedness. For example, developed nations can efficiently harness R&D expenditures and digital infrastructure to generate innovation outputs, but emerging nations would need corresponding institutional development and human resource capabilities to achieve the same results.
In terms of methodological contribution, the integration of explainable AI has been considered a major contribution. The high consistency between SHAP and LIME results ( supports the reliability of feature attribution, which has been considered a major issue in machine learning applications. Moreover, the network structure obtained from SHAP analysis shows a centralized structure, which supports the theory of complex systems, where a limited number of variables drives the system’s behavior.
Overall, the results indicate that global innovation systems are best conceptualized as hybrid systems, with a dominant linear backbone and nonlinear interactions and system-specific dynamics. The hybrid approach contributes to the literature by integrating structural and complexity-based approaches to innovation system analysis.
5. Policy Implications
These findings imply that innovation policy should be tailored to each regime rather than employing a universal approach. In advanced nations, policy should encourage frontier innovation and technology transfer; however, developing nations must improve their institutional framework, infrastructure, and human resources.
The importance of “Business Sophistication” suggests the necessity for specific programs for R&D cooperation and industry–academia collaboration. Likewise, the prominence of “Infrastructure” and “Human Capital” implies that innovation policy should not be limited only to research spending.
The nonlinear structure of the system also indicates threshold effects and spill-overs, suggesting that policies will affect the system differently at various levels of development. Concentrating on major structural determinants, such as Business Sophistication, thus enhances the efficiency of the entire system.
It is worth noting that explainable AI techniques (SHAP and interaction networks) enhance the formulation of effective policies by facilitating the transparent disaggregation of innovation performance into interpretable components.
6. Limitations and Future Research
This research has some limitations. Firstly, the data type does not allow for the exploration of dynamic evolution and path dependency. Future research can use panel data. Secondly, the type of machine learning technique, which is non-causal, does not allow for the exploration of cause–effect relations. Although the SHAP and LIME results are reliable, they cannot be considered causal. Future research can consider the inclusion of causal inference techniques. Thirdly, the use of composite indicators, like the Global Innovation Index, can be related to measurement biases. Finally, the results obtained through the application of the clustering analysis can be related to methodological choices, like the definition of clusters. Alternative methodologies, like hierarchical and density-based clustering, can be considered. The SHAP technique, which was applied for network analysis, only considered approximate interactions. Future research can consider the exploration of results obtained by analyzing exact interaction effects.
Author Contributions
Conceptualization, S.Ç., U.A. and M.Ü.Ş.; methodology, S.Ç., U.A. and M.Ü.Ş.; software, S.Ç.; validation, S.Ç., U.A. and M.Ü.Ş.; formal analysis—investigation, U.A.; resources, U.A.; data curation, U.A.; writing—original draft preparation, U.A. and M.Ü.Ş.; writing—review and editing, U.A. and M.Ü.Ş.; visualization, S.Ç.; supervision, U.A.; project administration, S.Ç. and U.A.; funding acquisition, U.A. and M.Ü.Ş. All authors have read and agreed to the published version of the manuscript.
Funding
This research received no external funding.
Data Availability Statement
The original contributions presented in this study are included in the article. Further inquiries can be directed to the corresponding author.
Conflicts of Interest
The authors declare no conflicts of interest.
References
- Aghion, P.; Howitt, P. A Model of Growth Through Creative Destruction. Econometrica 1992, 60, 323. [Google Scholar] [CrossRef] [Scilit]
- Romer, P.M. Endogenous Technological Change. J. Political Econ. 1990, 98, S71–S102. [Google Scholar] [CrossRef] [Scilit] [PubMed]
- Lundvall, B.-A. National Systems of Innovation: Toward a Theory of Innovation and Interactive Learning; Anthem: London, UK, 2010; ISBN 1843318822. [Google Scholar]
- Nelson, R.R. National Innovation Systems: A Comparative Analysis; Oxford University Press: Oxford, UK, 1993. [Google Scholar]
- Griliches, Z. R&D and Productivity; University of Chicago Press: Chicago, IL, USA, 1998; ISBN 9780226308869. [Google Scholar]
- Archibugi, D.; Coco, A. Measuring Technological Capabilities at the Country Level: A Survey and a Menu for Choice. Res. Policy 2005, 34, 175–194. [Google Scholar] [CrossRef] [Scilit]
- Castellacci, F. Closing the Technology Gap? Rev. Dev. Econ. 2011, 15, 180–197. [Google Scholar] [CrossRef] [Scilit]
- Castellacci, F.; Archibugi, D. The Technology Clubs: The Distribution of Knowledge across Nations. Res. Policy 2008, 37, 1659–1673. [Google Scholar] [CrossRef] [Scilit]
- Fagerberg, J.; Knell, M.; Srholec, M. The Competitiveness of Nations: Economic Growth in the ECE Region; Working Papers on Innovation Studies; United Nations Economic Commission for Europe (UNECE): Geneva, Switzerland, 2004. [Google Scholar]
- Hastie, T.; Tibshirani, R.; Friedman, J. The Elements of Statistical Learning; Springer: New York, NY, USA, 2009; ISBN 978-0-387-84857-0. [Google Scholar]
- Lundberg, S.M.; Lee, S.I. A Unified Approach to Interpreting Model Predictions. Adv. Neural Inf. Process. Syst. 2017, 30, 4766–4775. [Google Scholar]
- Molnar, C. Interpretable Machine Learning: A Guide for Making Black Box Models Explainable; Christoph Molnar: Munich, Germany, 2022; ISBN 9798411463330. [Google Scholar]
- Molnar, C. Interpreting Machine Learning Models with SHAP: A Guide with Python Examples and Theory on Shapley Values; Christoph Molnar: Munich, Germany, 2025; ISBN 9798857734445. [Google Scholar]
- Athey, S.; Imbens, G.W. Machine Learning Methods That Economists Should Know About. Annu. Rev. Econom. 2019, 11, 685–725. [Google Scholar] [CrossRef] [Scilit]
- WIPO. Global Innovation Index 2025: Innovation at a Crossroads; WIPO: Geneva, Switzerland, 2025. [Google Scholar]
- Salandra, R. Knowledge Dissemination in Clinical Trials: Exploring Influences of Institutional Support and Type of Innovation on Selective Reporting. Res. Policy 2018, 47, 1215–1228. [Google Scholar] [CrossRef] [Scilit]
- Jolliffe, I.T.; Cadima, J. Principal Component Analysis: A Review and Recent Developments. Philos. Trans. R. Soc. A Math. Phys. Eng. Sci. 2016, 374, 20150202. [Google Scholar] [CrossRef] [Scilit] [PubMed]
- Hennig, C. What Are the True Clusters? Pattern Recognit. Lett. 2015, 64, 53–62. [Google Scholar] [CrossRef] [Scilit]
- Jain, A.K. Data Clustering: 50 Years beyond K-Means. Pattern Recognit. Lett. 2010, 31, 651–666. [Google Scholar] [CrossRef] [Scilit]
- Goodfellow, I.; Bengio, Y.; Courville, A. Deep Learning; MIT Press: Cambridge, MA, USA, 2016. [Google Scholar]
- Ribeiro, M.T.; Singh, S.; Guestrin, C. “Why Should I Trust You?”: Explaining the Predictions of Any Classifier. In Proceedings of the NAACL-HLT 2016—2016 Conference of the North American Chapter of the Association for Computational Linguistics: Human Language Technologies, Proceedings of the Demonstrations Session; Association for Computational Linguistics (ACL): Kerrville, TX, USA, 2016; pp. 97–101. [Google Scholar]
- Chung, F. Spectral Graph Theory; American Mathematical Society: Providence, RI, USA, 1996; Volume 92, ISBN 9780821803158. [Google Scholar]
- Newman, M. Networks; Oxford University Press: Oxford, UK, 2010; ISBN 9780199206650. [Google Scholar]
- Shannon, C.E. A Mathematical Theory of Communication. Bell Syst. Tech. J. 1948, 27, 379–423. [Google Scholar] [CrossRef] [Scilit]
- Cover, T.M.; Thomas, J.A. Elements of Information Theory; Wiley: Hoboken, NJ, USA, 2005; ISBN 9780471241959. [Google Scholar]
- Efron, B.; Tibshirani, R.J. An Introduction to the Bootstrap, 1st ed.; Chapman & Hall/CRC: Boca Raton, FL, USA, 1994. [Google Scholar]
- Pençe, İ.; Kalkan, A.; Çeşmeli, M.Ş. Estimation of the Country Ranking Scores on the Global Innovation Index 2016 Using the Artificial Neural Network Method. Int. J. Innov. Technol. Manag. 2019, 16, 1940007. [Google Scholar] [CrossRef] [Scilit]
- Carpita, M.; Ciavolino, E. A Generalized Maximum Entropy Estimator to Simple Linear Measurement Error Model with a Composite Indicator. Adv. Data Anal. Classif. 2017, 11, 139–158. [Google Scholar] [CrossRef] [Scilit]
- Jankowska, B.; Matysek-Jędrych, A.; Mroczek-Dąbrowska, K. Efficiency of National Innovation Systems—Poland and Bulgaria in the Context of the Global Innovation Index. Comp. Econ. Res. Cent. East. Eur. 2017, 20, 77–94. [Google Scholar] [CrossRef] [Scilit]
- Pearson, K. LIII. On Lines and Planes of Closest Fit to Systems of Points in Space. Lond. Edinb. Dublin Philos. Mag. J. Sci. 1901, 2, 559–572. [Google Scholar] [CrossRef] [Scilit]
- Hotelling, H. Analysis of a Complex of Statistical Variables into Principal Components. J. Educ. Psychol. 1933, 24, 417–441. [Google Scholar] [CrossRef] [Scilit]
- Shiryev, S.A.; Papadopoulos, J.S.; Schäffer, A.A.; Agarwala, R. Improved BLAST Searches Using Longer Words for Protein Seeding. Bioinformatics 2007, 23, 2949–2951. [Google Scholar] [CrossRef] [Scilit] [PubMed]
- Çelik, S.; Öztürk, Ö.F.; Akkucuk, U.; Şaşmaz, M.Ü. Global Sustainability Performance and Regional Disparities: A Machine Learning Approach Based on the 2025 SDG Index. Sustainability 2025, 17, 7411. [Google Scholar] [CrossRef] [Scilit]
- MacQueen, J. Some Methods for Classification and Analysis of Multivariate Observations. Proc. Fifth Berkeley Symp. Math. Stat. Probab. 1967, 1, 281–298. [Google Scholar]
- Lloyd, S. Least Squares Quantization in PCM. IEEE Trans. Inf. Theory 1982, 28, 129–137. [Google Scholar] [CrossRef] [Scilit]
- Çelik, S. Multidimensional Analysis of Global Economic Freedom Performances: Structural Findings and Machine Learning Approaches. Qual. Quant. 2026, 60, 7581–7612. [Google Scholar] [CrossRef] [Scilit]
- Rousseeuw, P.J. Silhouettes: A Graphical Aid to the Interpretation and Validation of Cluster Analysis. J. Comput. Appl. Math. 1987, 20, 53–65. [Google Scholar] [CrossRef] [Scilit]
- Çelik, S.; Çimen, G.; Yavan, S. Global Cost of Living Patterns: Machine Learning Insights and Structural Economic Interpretation. Qual. Quant. 2026, 1–33. [Google Scholar] [CrossRef] [Scilit]
- Rencher, A.C.; Christensen, W.F. Methods of Multivariate Analysis; Wiley: Hoboken, NJ, USA, 2012; ISBN 9780470178966. [Google Scholar]
- Jolliffe, I.T. Principal Component Analysis; Springer: New York, NY, USA, 2002; ISBN 0-387-95442-2. [Google Scholar]
- Perry, T.; Bader-El-Den, M.; Cooper, S. Imbalanced Classification Using Genetically Optimized Cost Sensitive Classifiers. In Proceedings of the 2015 IEEE Congress on Evolutionary Computation (CEC); IEEE: Piscataway, NJ, USA, 2015; pp. 680–687. [Google Scholar]
- Von Luxburg, U.; Williamson, R.C. Clustering: Science or Art? In Proceedings of the JMLR: Workshop and Conference Proceedings; PMLR: New York, NY, USA, 2012; Volume 27, pp. 65–79. [Google Scholar]
- Handl, J.; Knowles, J.; Kell, D.B. Computational Cluster Validation in Post-Genomic Data Analysis. Bioinformatics 2005, 21, 3201–3212. [Google Scholar] [CrossRef] [Scilit] [PubMed]
- Çelik, S.; Doğanl, B.; Cengiz, A. Citation Classification and Key Phrase Extraction in Legal Texts Using Machine Learning: An Examination of the Legal Text Classification Dataset. Qual. Quant. 2026, 60, 6645–6681. [Google Scholar] [CrossRef] [Scilit]
- Shapley, L.S. A Value for N-Person Games. In Contributions to the Theory of Games (AM-28), Volume II; Princeton University Press: Princeton, NJ, USA, 1953; pp. 307–318. [Google Scholar]
- Marzouk, R.; Higuera, C.D. La On the Tractability of SHAP Explanations under Markovian Distributions. In Proceedings of the 41st International Conference on Machine Learning; PMLR: New York, NY, USA, 2024; pp. 34961–34986. [Google Scholar]
- Alangari, N.; El Bachir Menai, M.; Mathkour, H.; Almosallam, I. Exploring Evaluation Methods for Interpretable Machine Learning: A Survey. Information 2023, 14, 469. [Google Scholar] [CrossRef] [Scilit]
- Alvarez-Melis, D.; Jaakkola, T.S. Towards Robust Interpretability with Self-Explaining Neural Networks. In Proceedings of the 32nd Conference on Neural Information Processing Systems (NeurIPS 2018), Montréal, QC, Canada, 3–8 December 2018; pp. 1–11. [Google Scholar]
- Lundberg, S.M.; Erion, G.; Chen, H.; DeGrave, A.; Prutkin, J.M.; Nair, B.; Katz, R.; Himmelfarb, J.; Bansal, N.; Lee, S.-I. From Local Explanations to Global Understanding with Explainable AI for Trees. Nat. Mach. Intell. 2020, 2, 56–67. [Google Scholar] [CrossRef] [Scilit]
- von Luxburg, U. A Tutorial on Spectral Clustering. Stat. Comput. 2007, 17, 395–416. [Google Scholar] [CrossRef] [Scilit]
- Barabási, A.-L. Network Science. Philos. Trans. R. Soc. A Math. Phys. Eng. Sci. 2013, 371, 20120375. [Google Scholar] [CrossRef] [Scilit]
- Rosvall, M.; Bergstrom, C.T. Maps of Random Walks on Complex Networks Reveal Community Structure. Proc. Natl. Acad. Sci. USA 2008, 105, 1118–1123. [Google Scholar] [CrossRef] [Scilit] [PubMed]
- Han, T.; Zhao, D. Energy Efficiency of User-Centric, Cell-Free Massive MIMO-OFDM with Instantaneous CSI. Entropy 2022, 24, 234. [Google Scholar] [CrossRef] [Scilit] [PubMed]
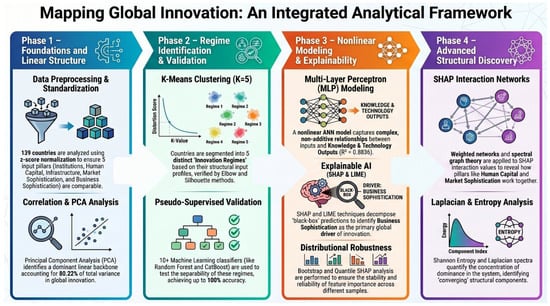
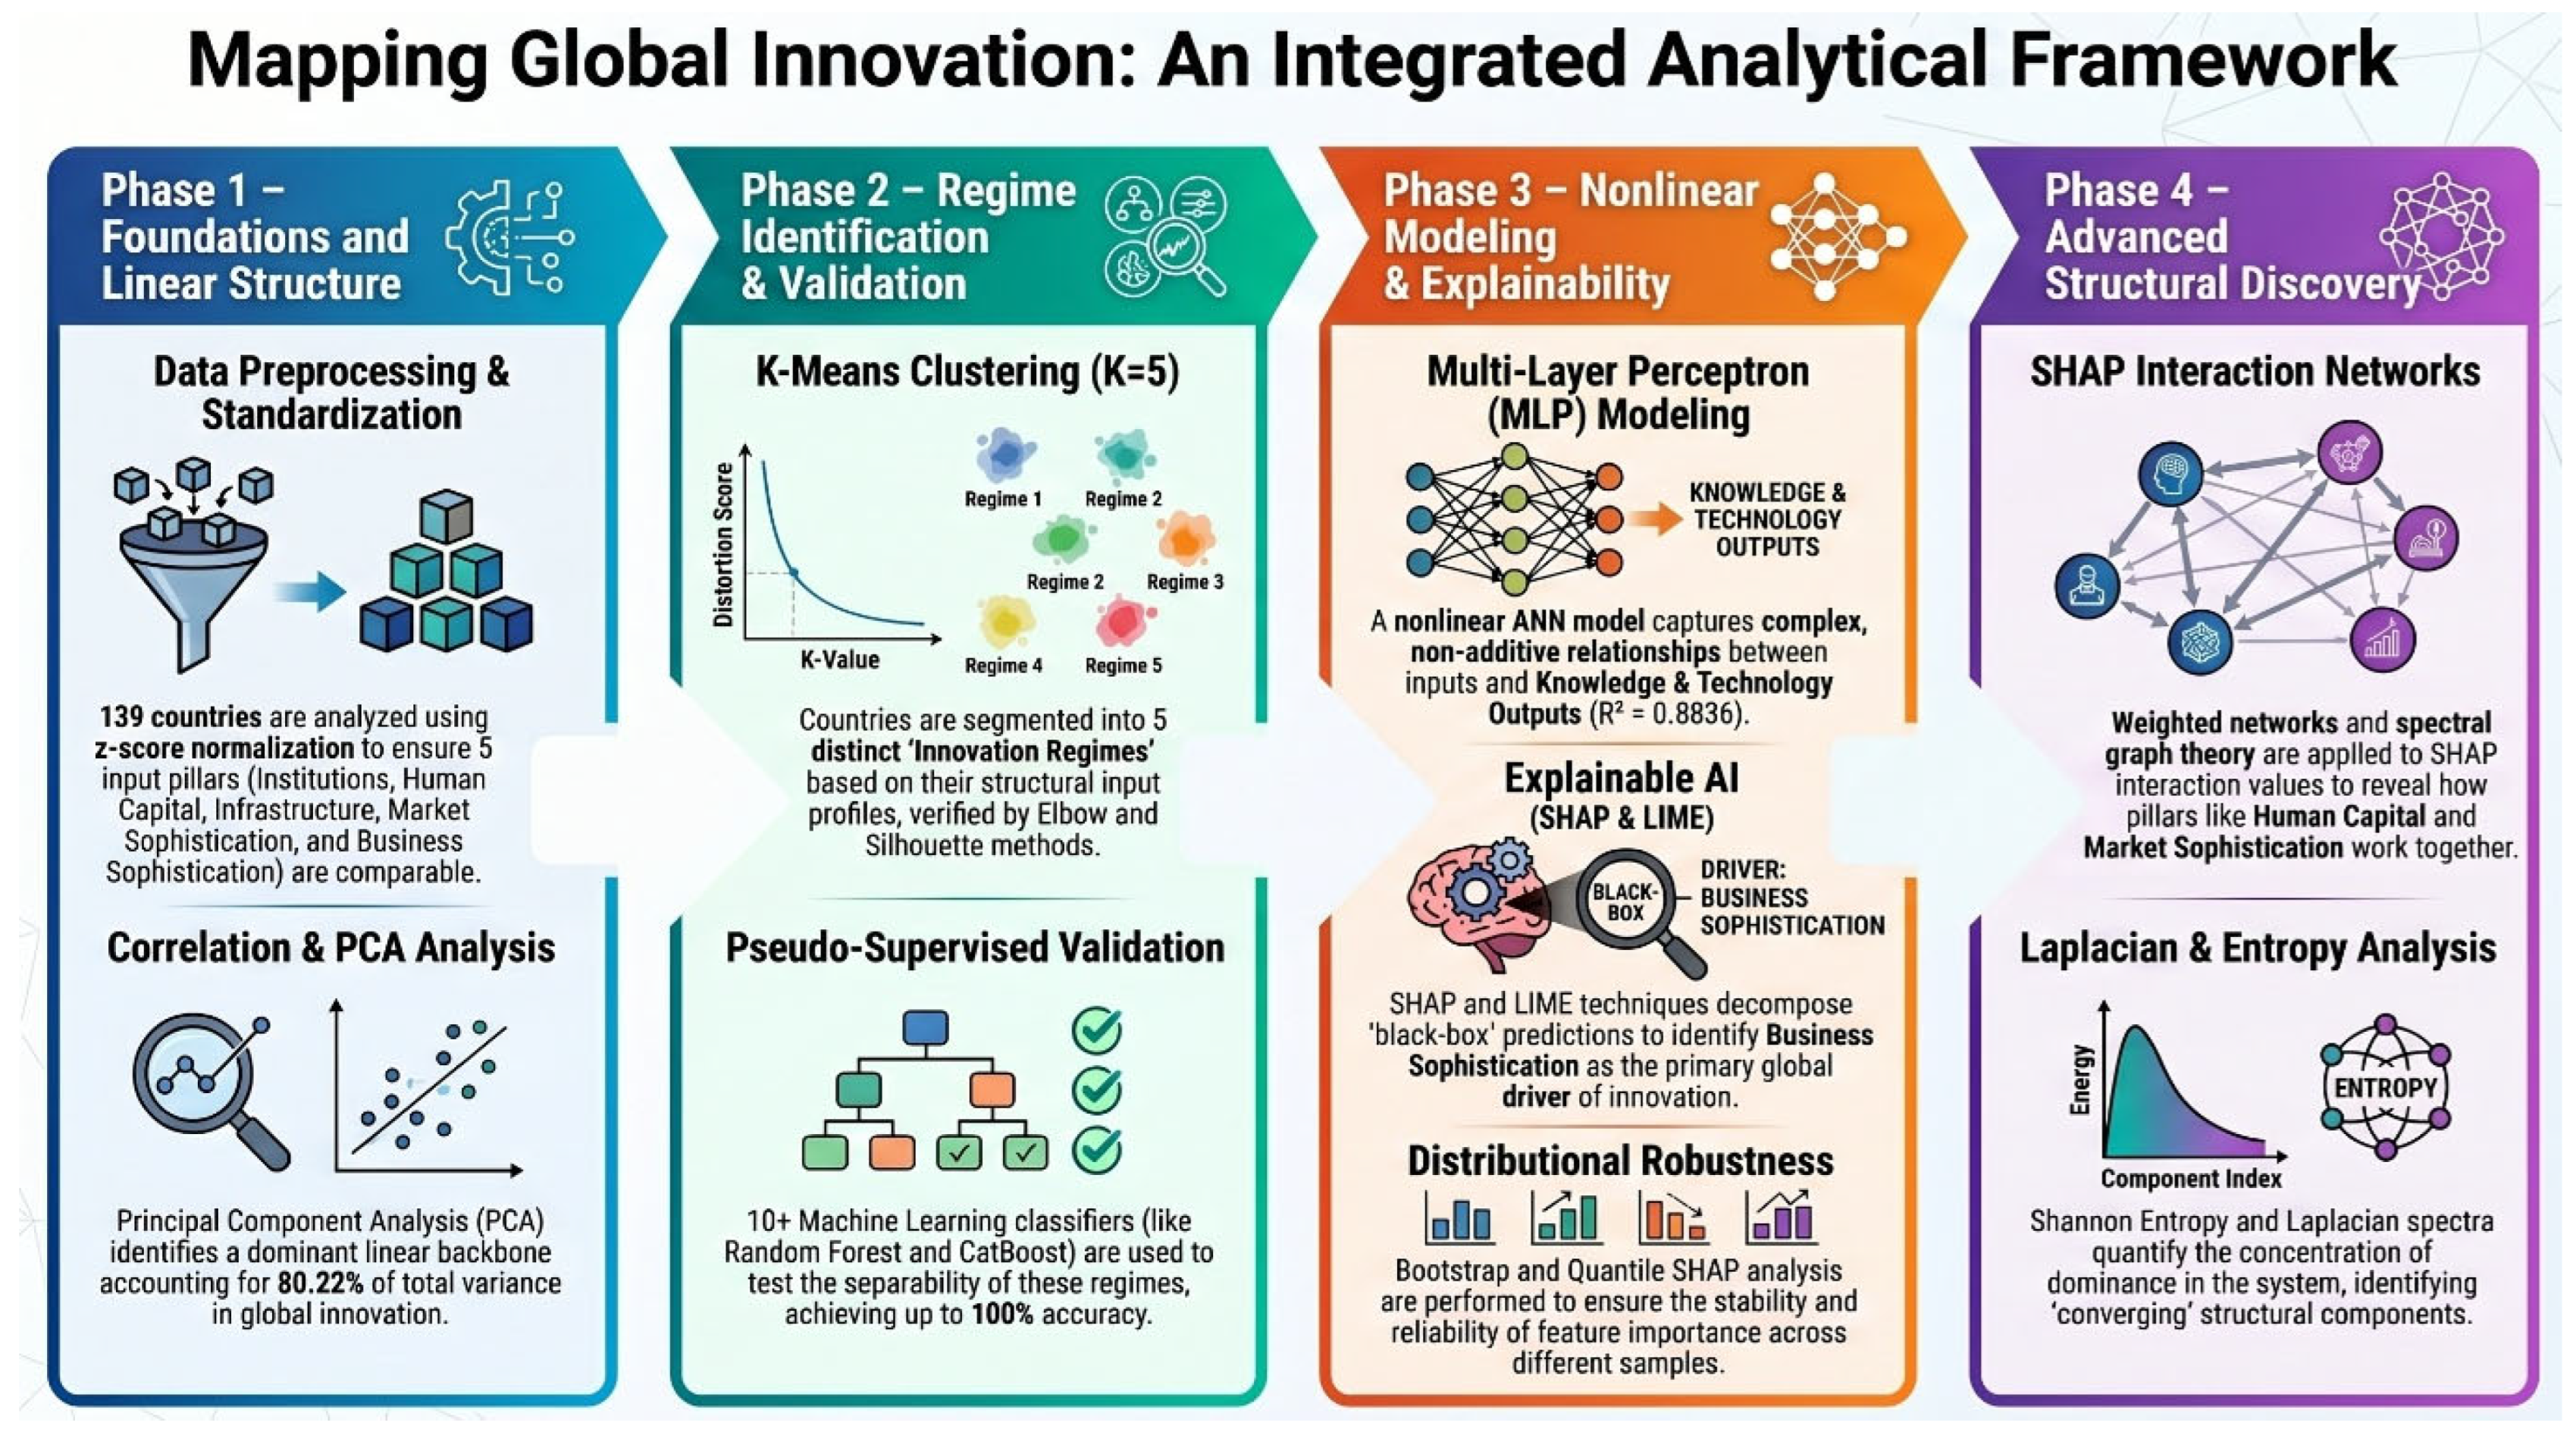
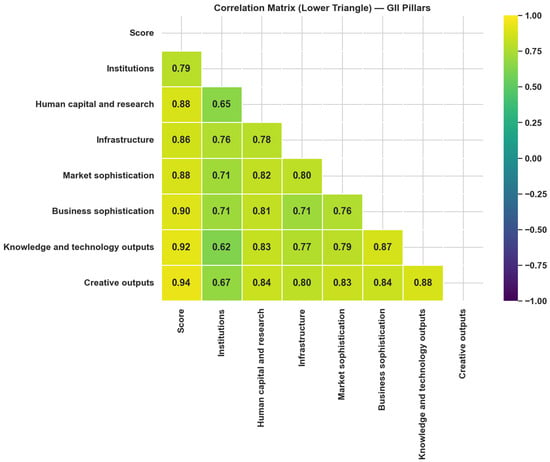
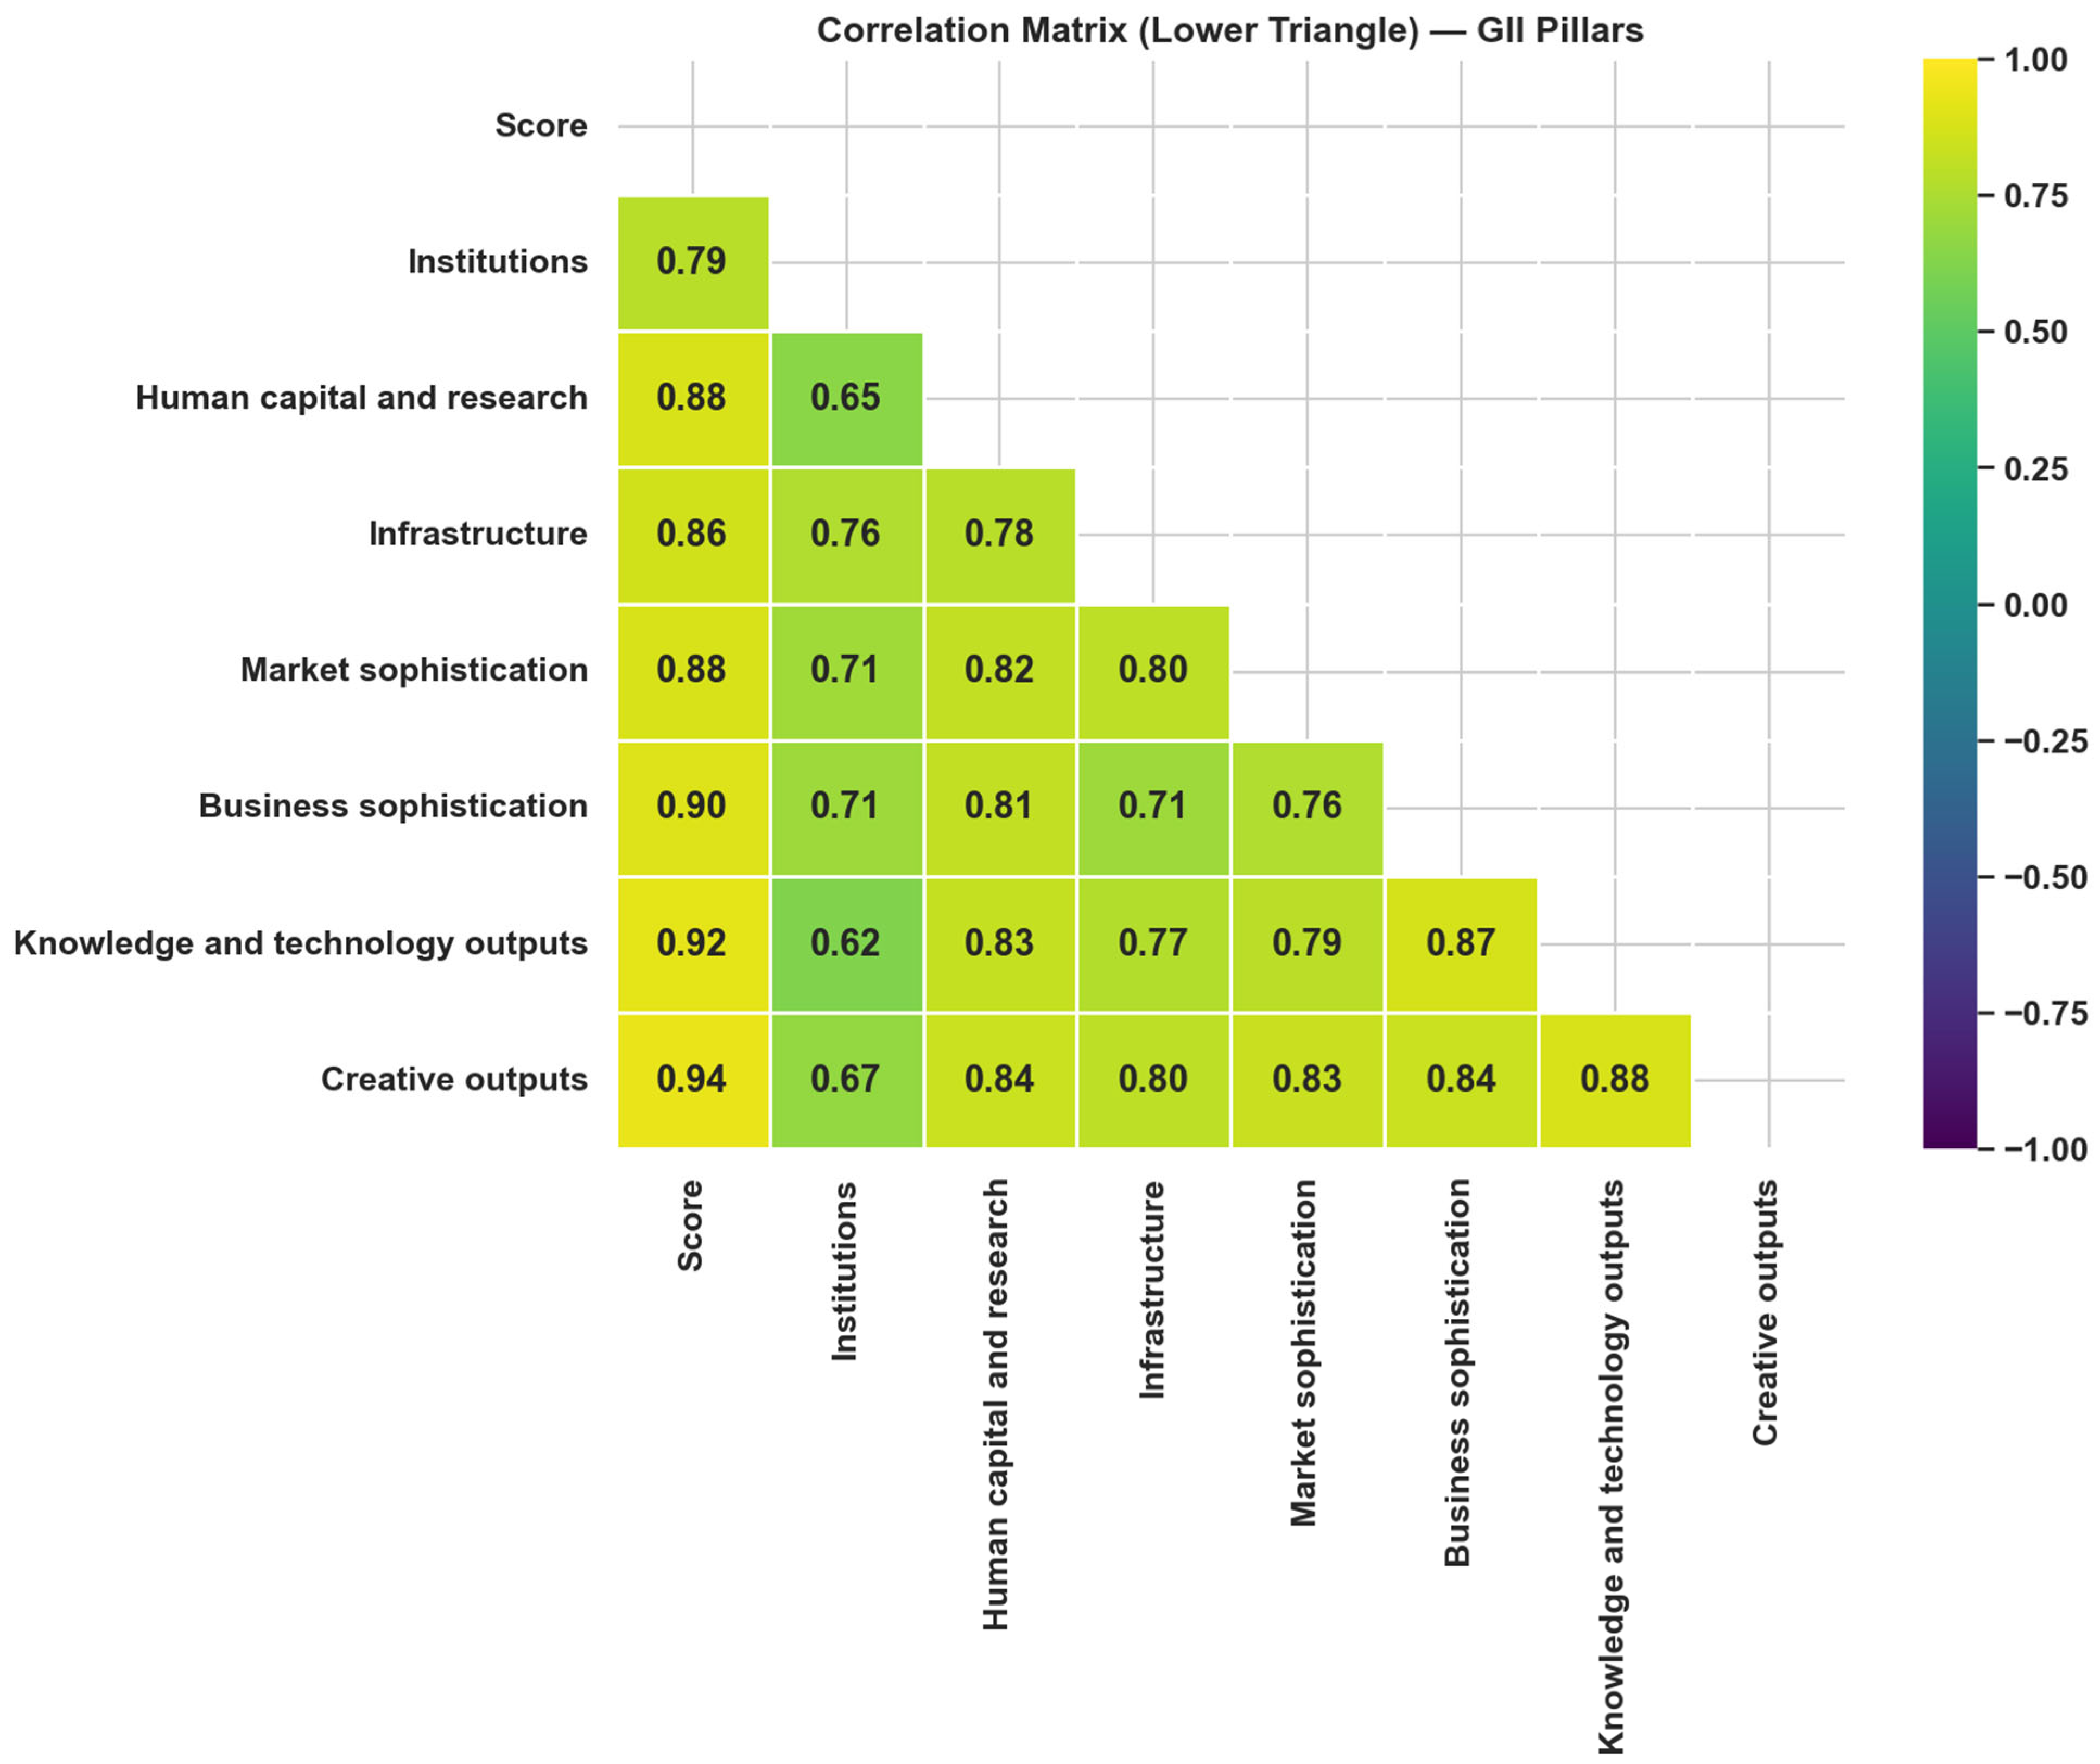
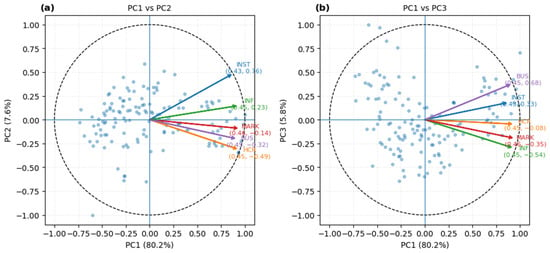
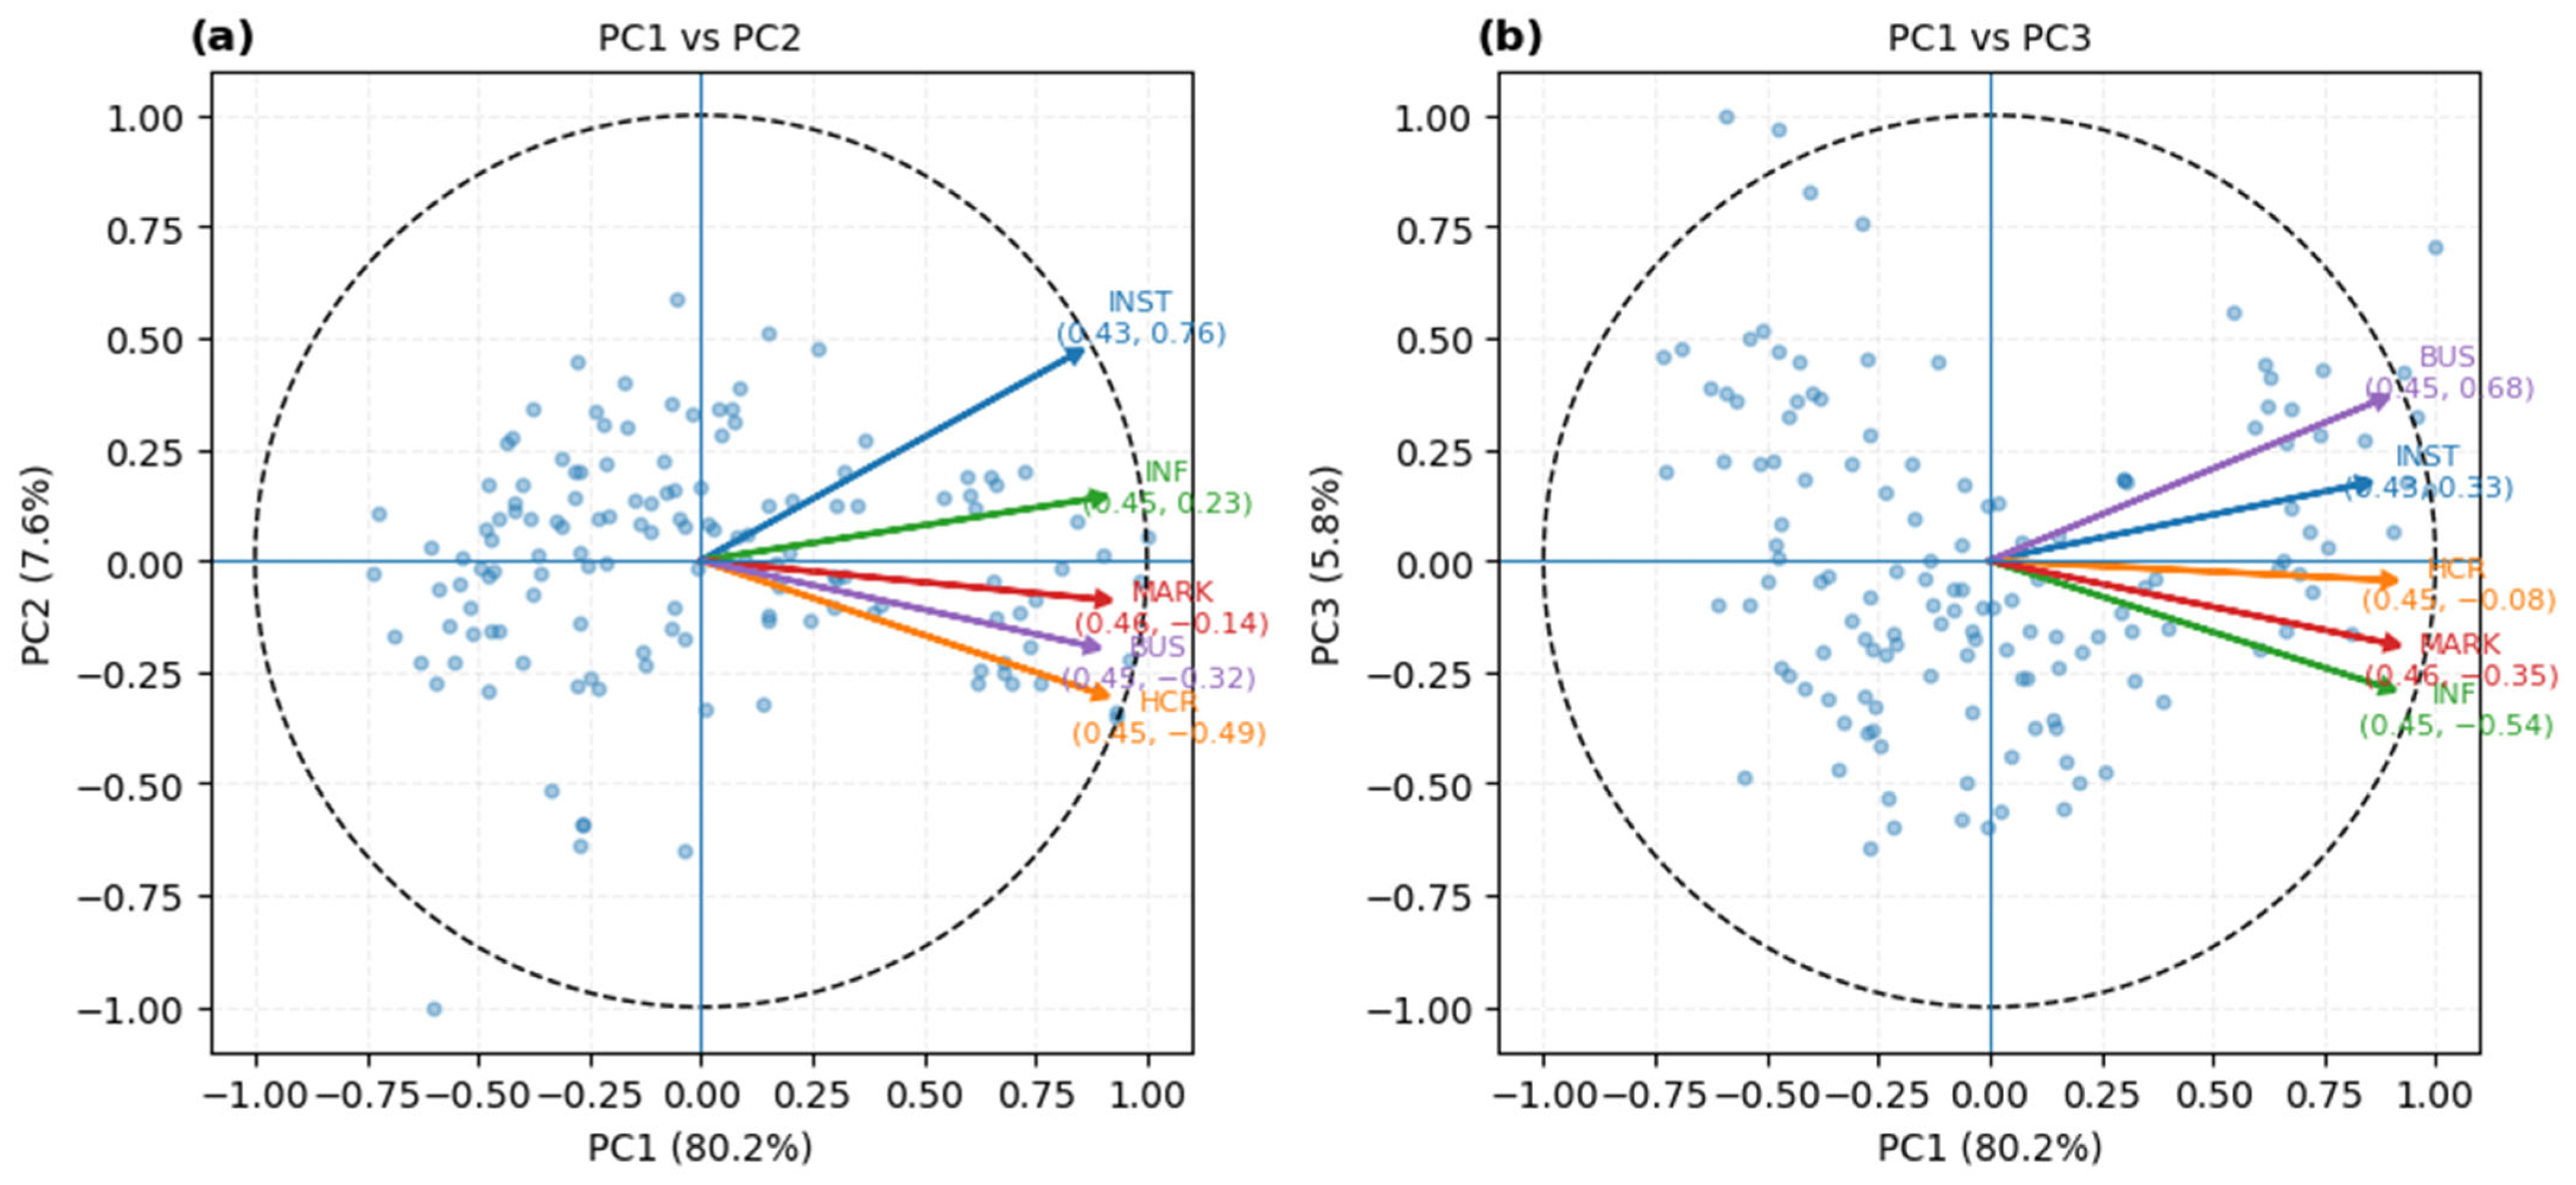
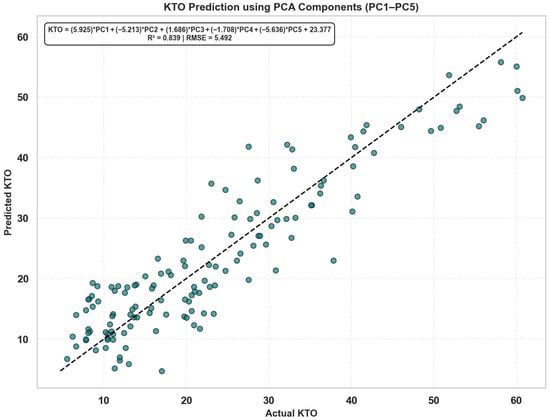
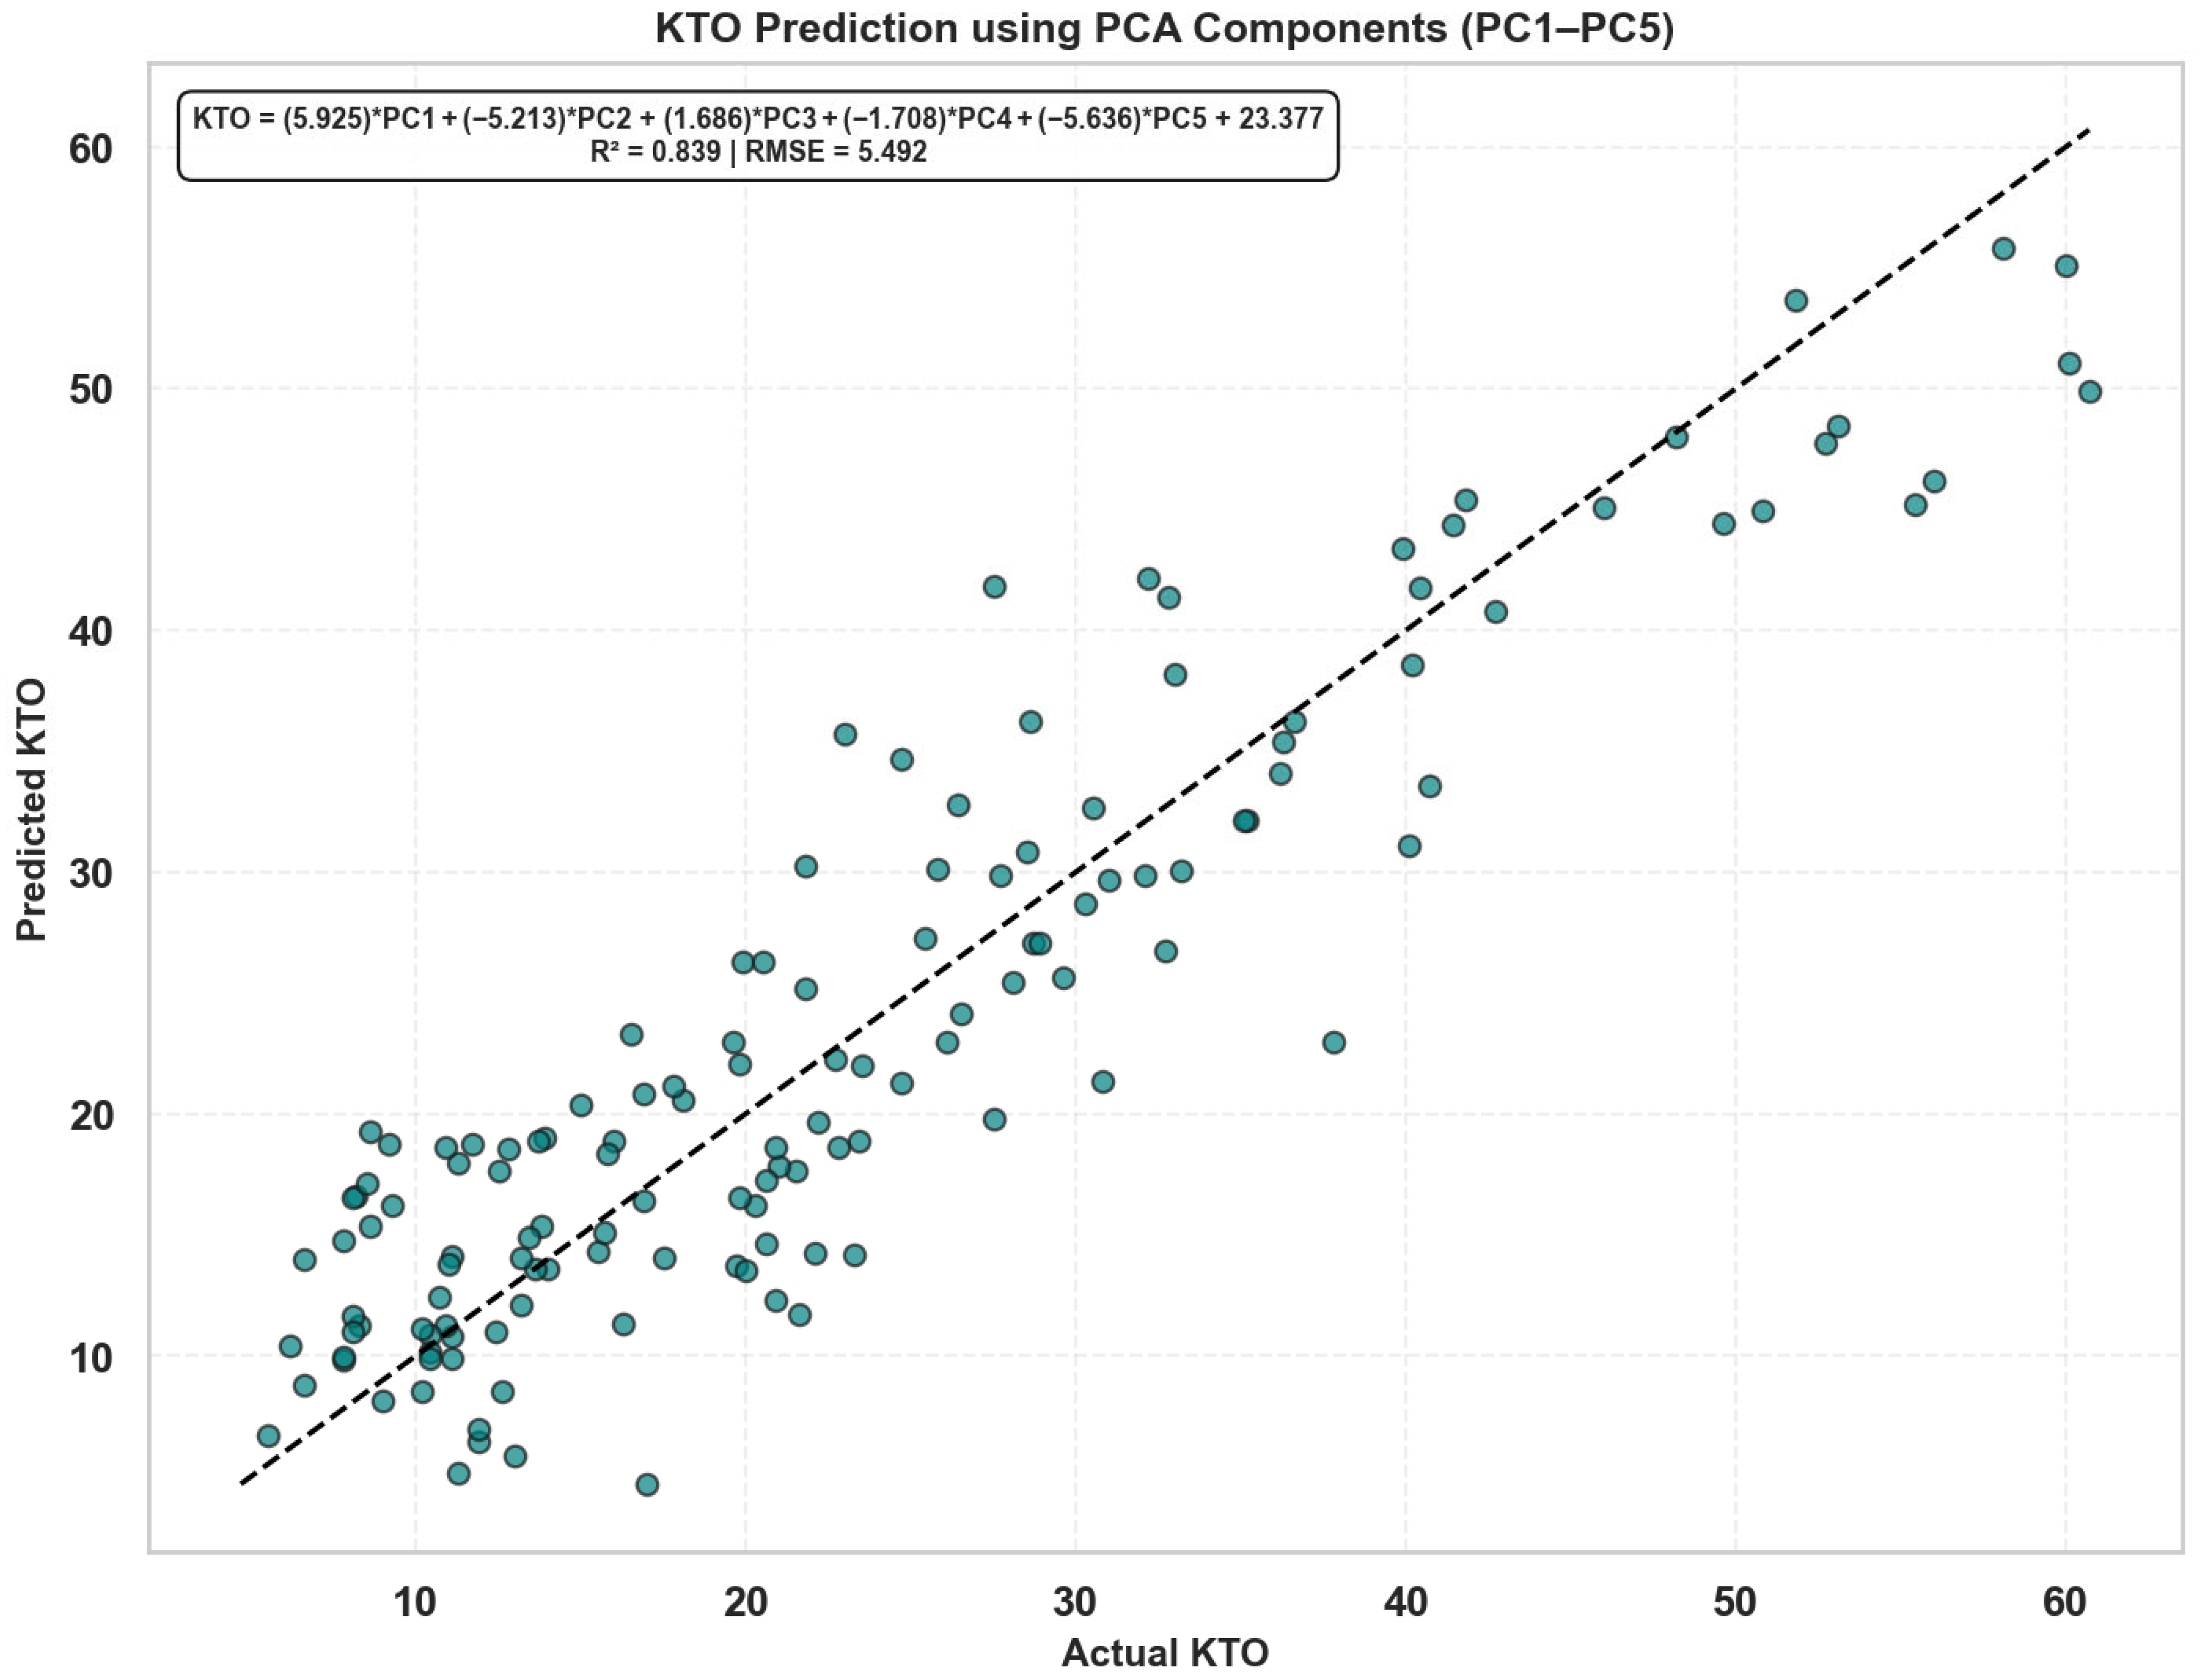
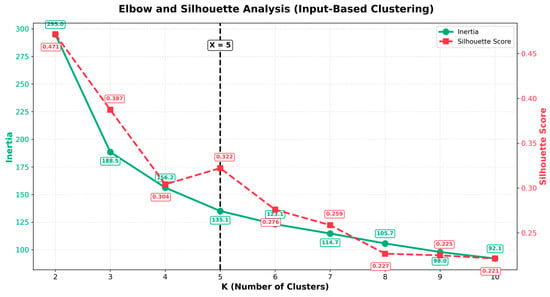
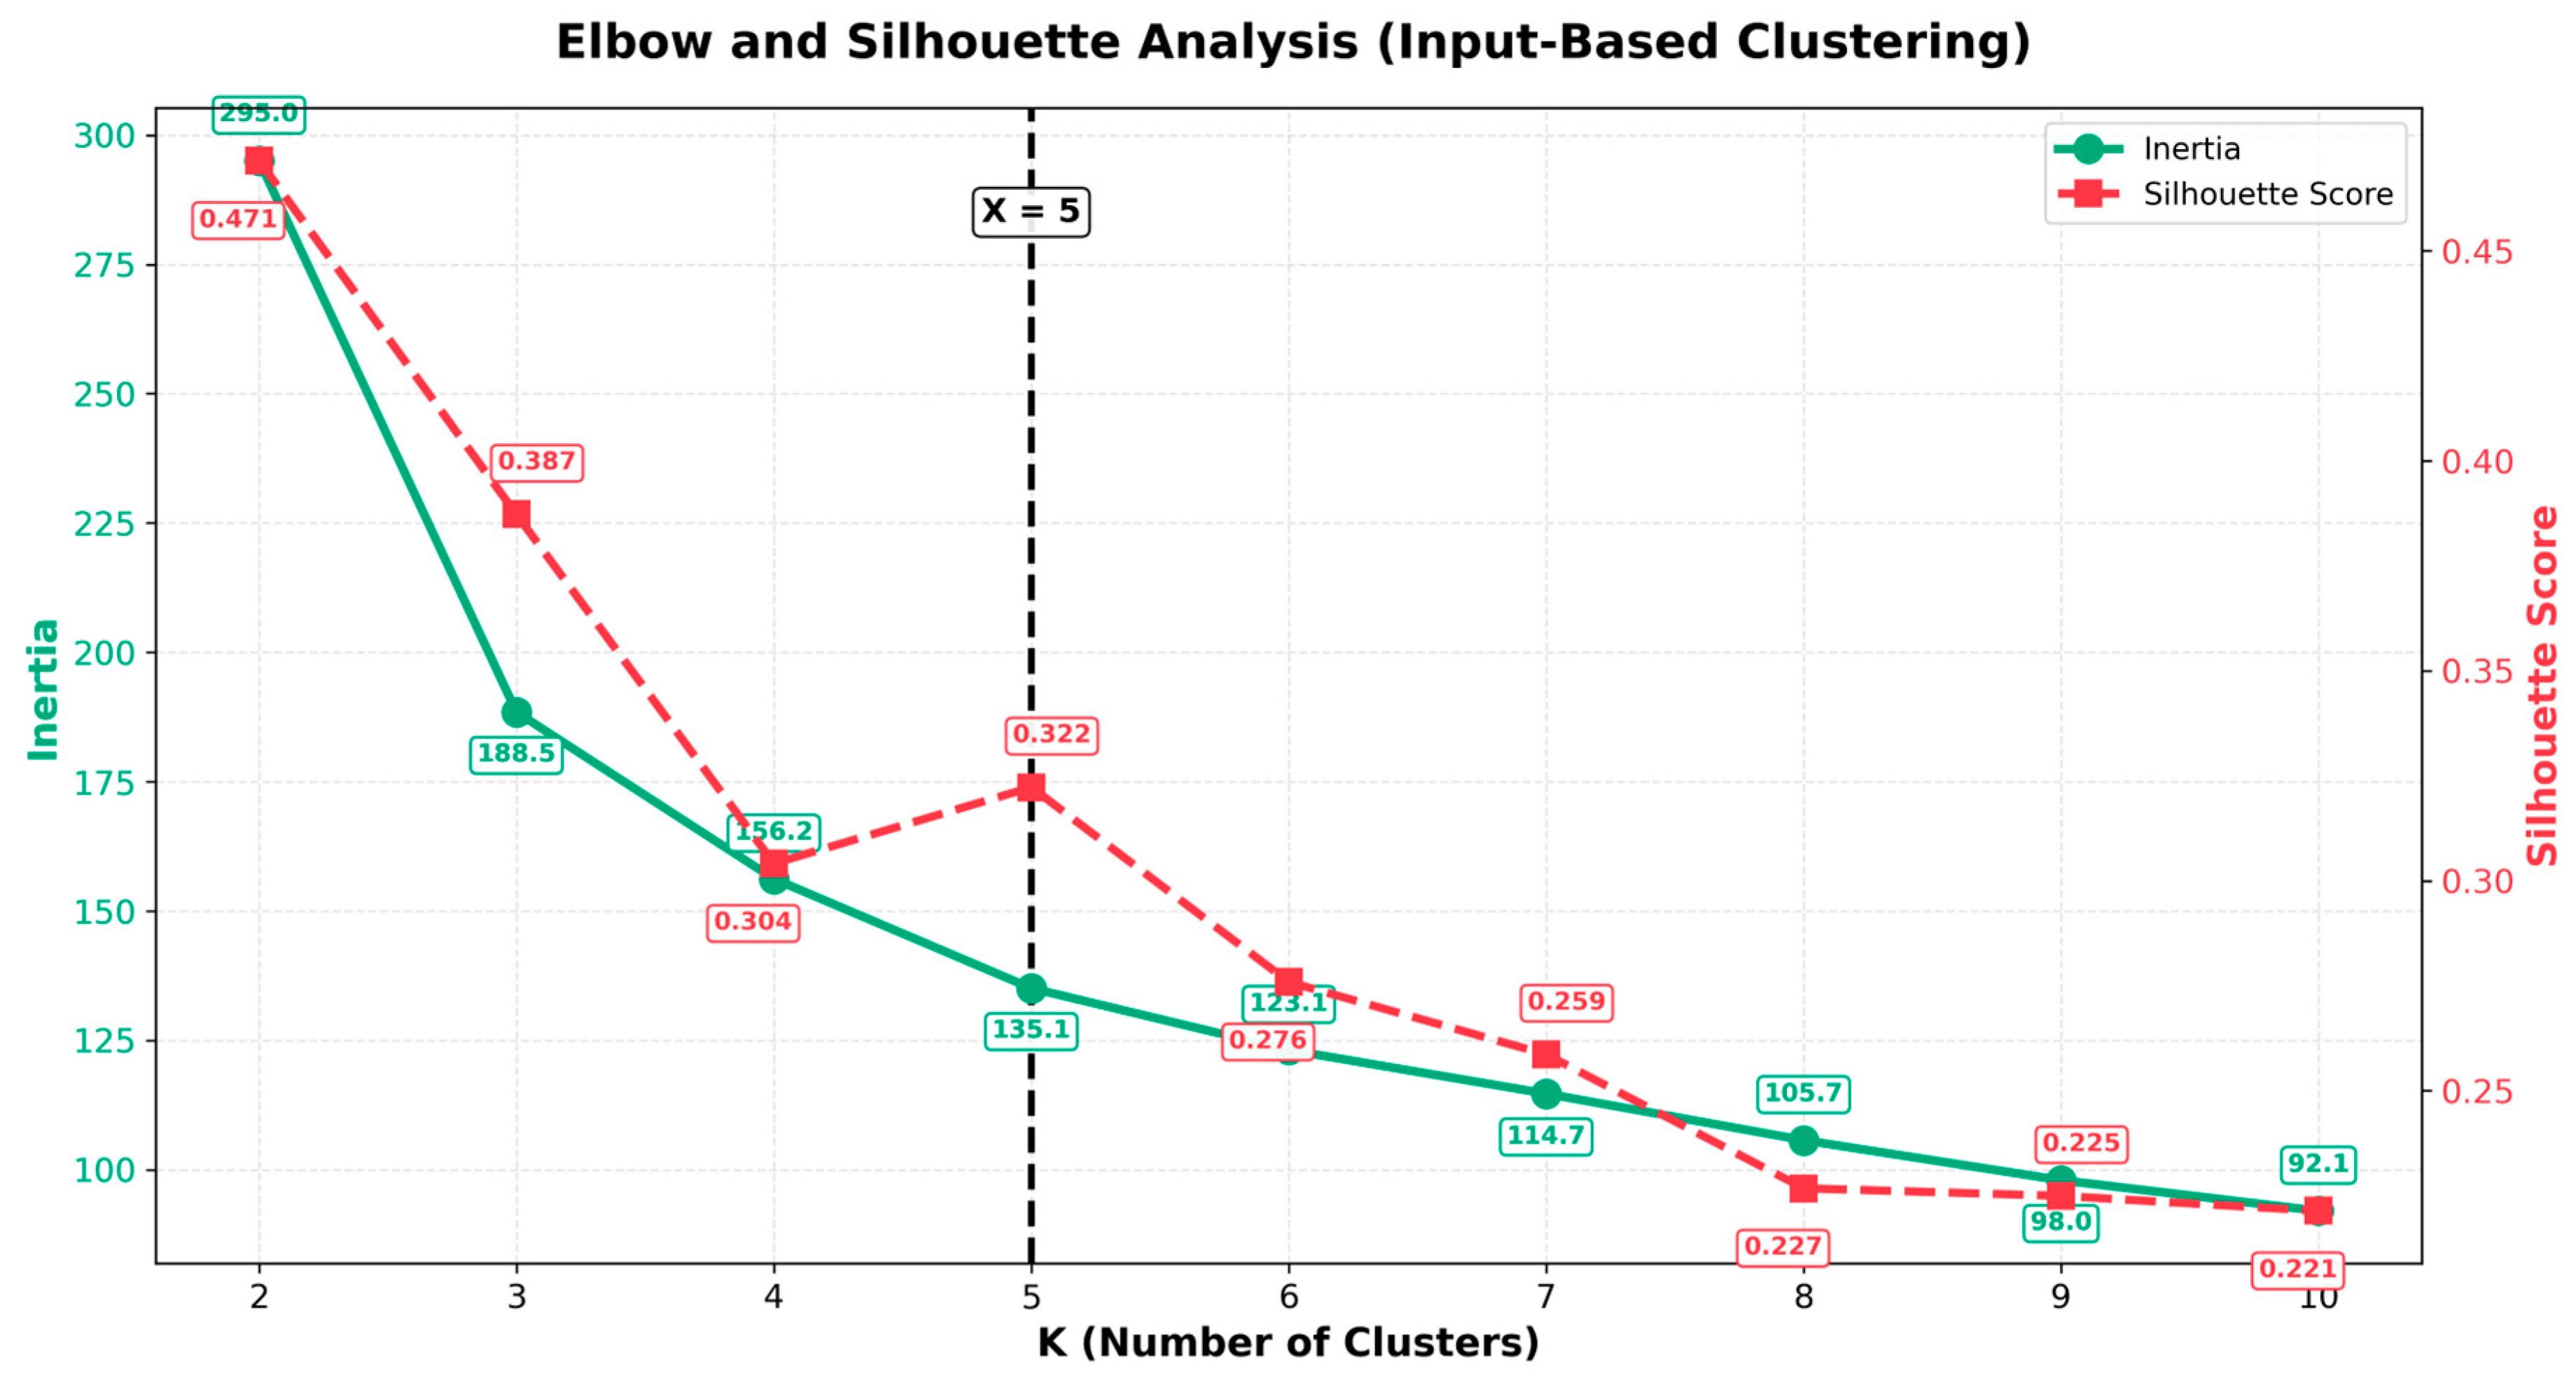
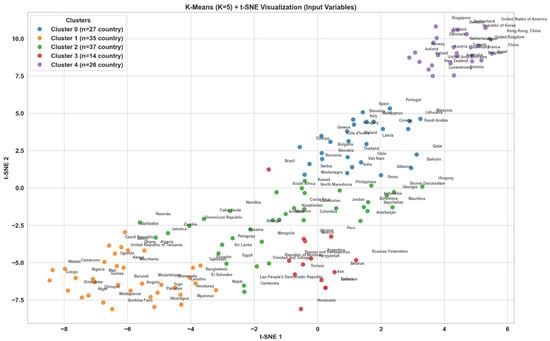
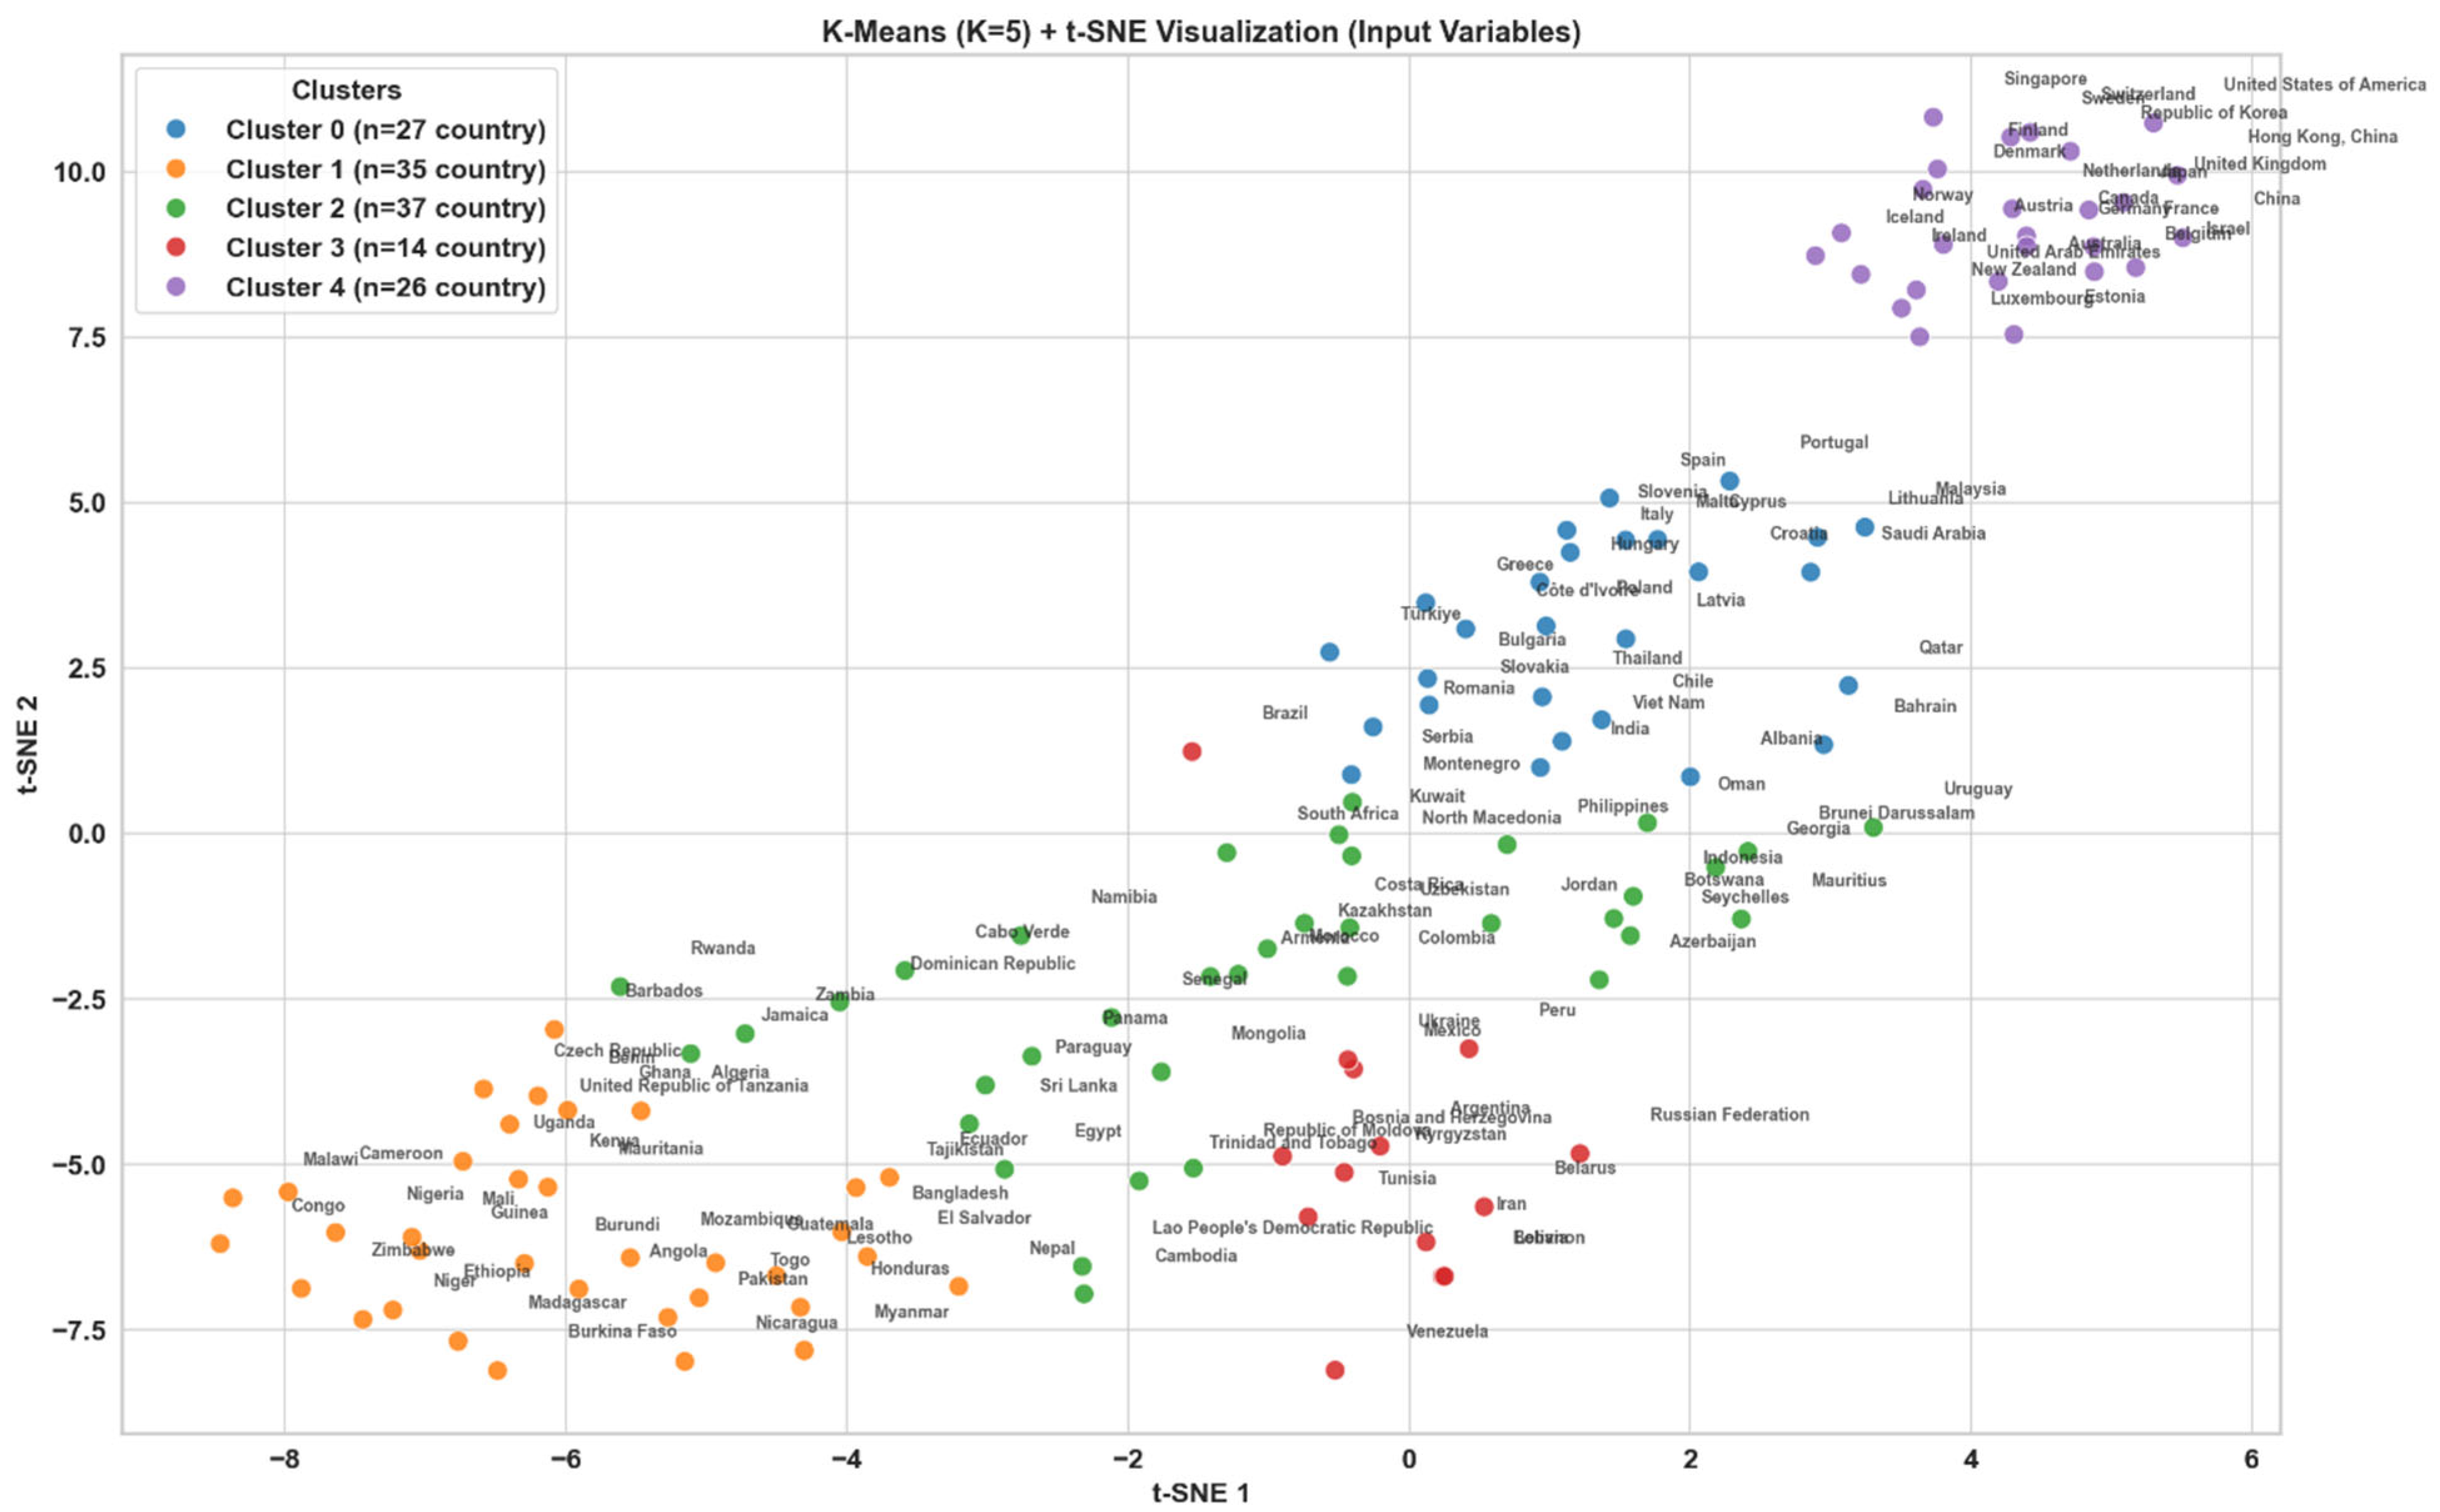
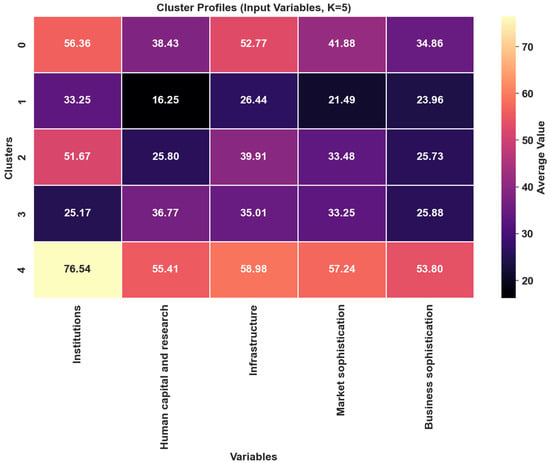
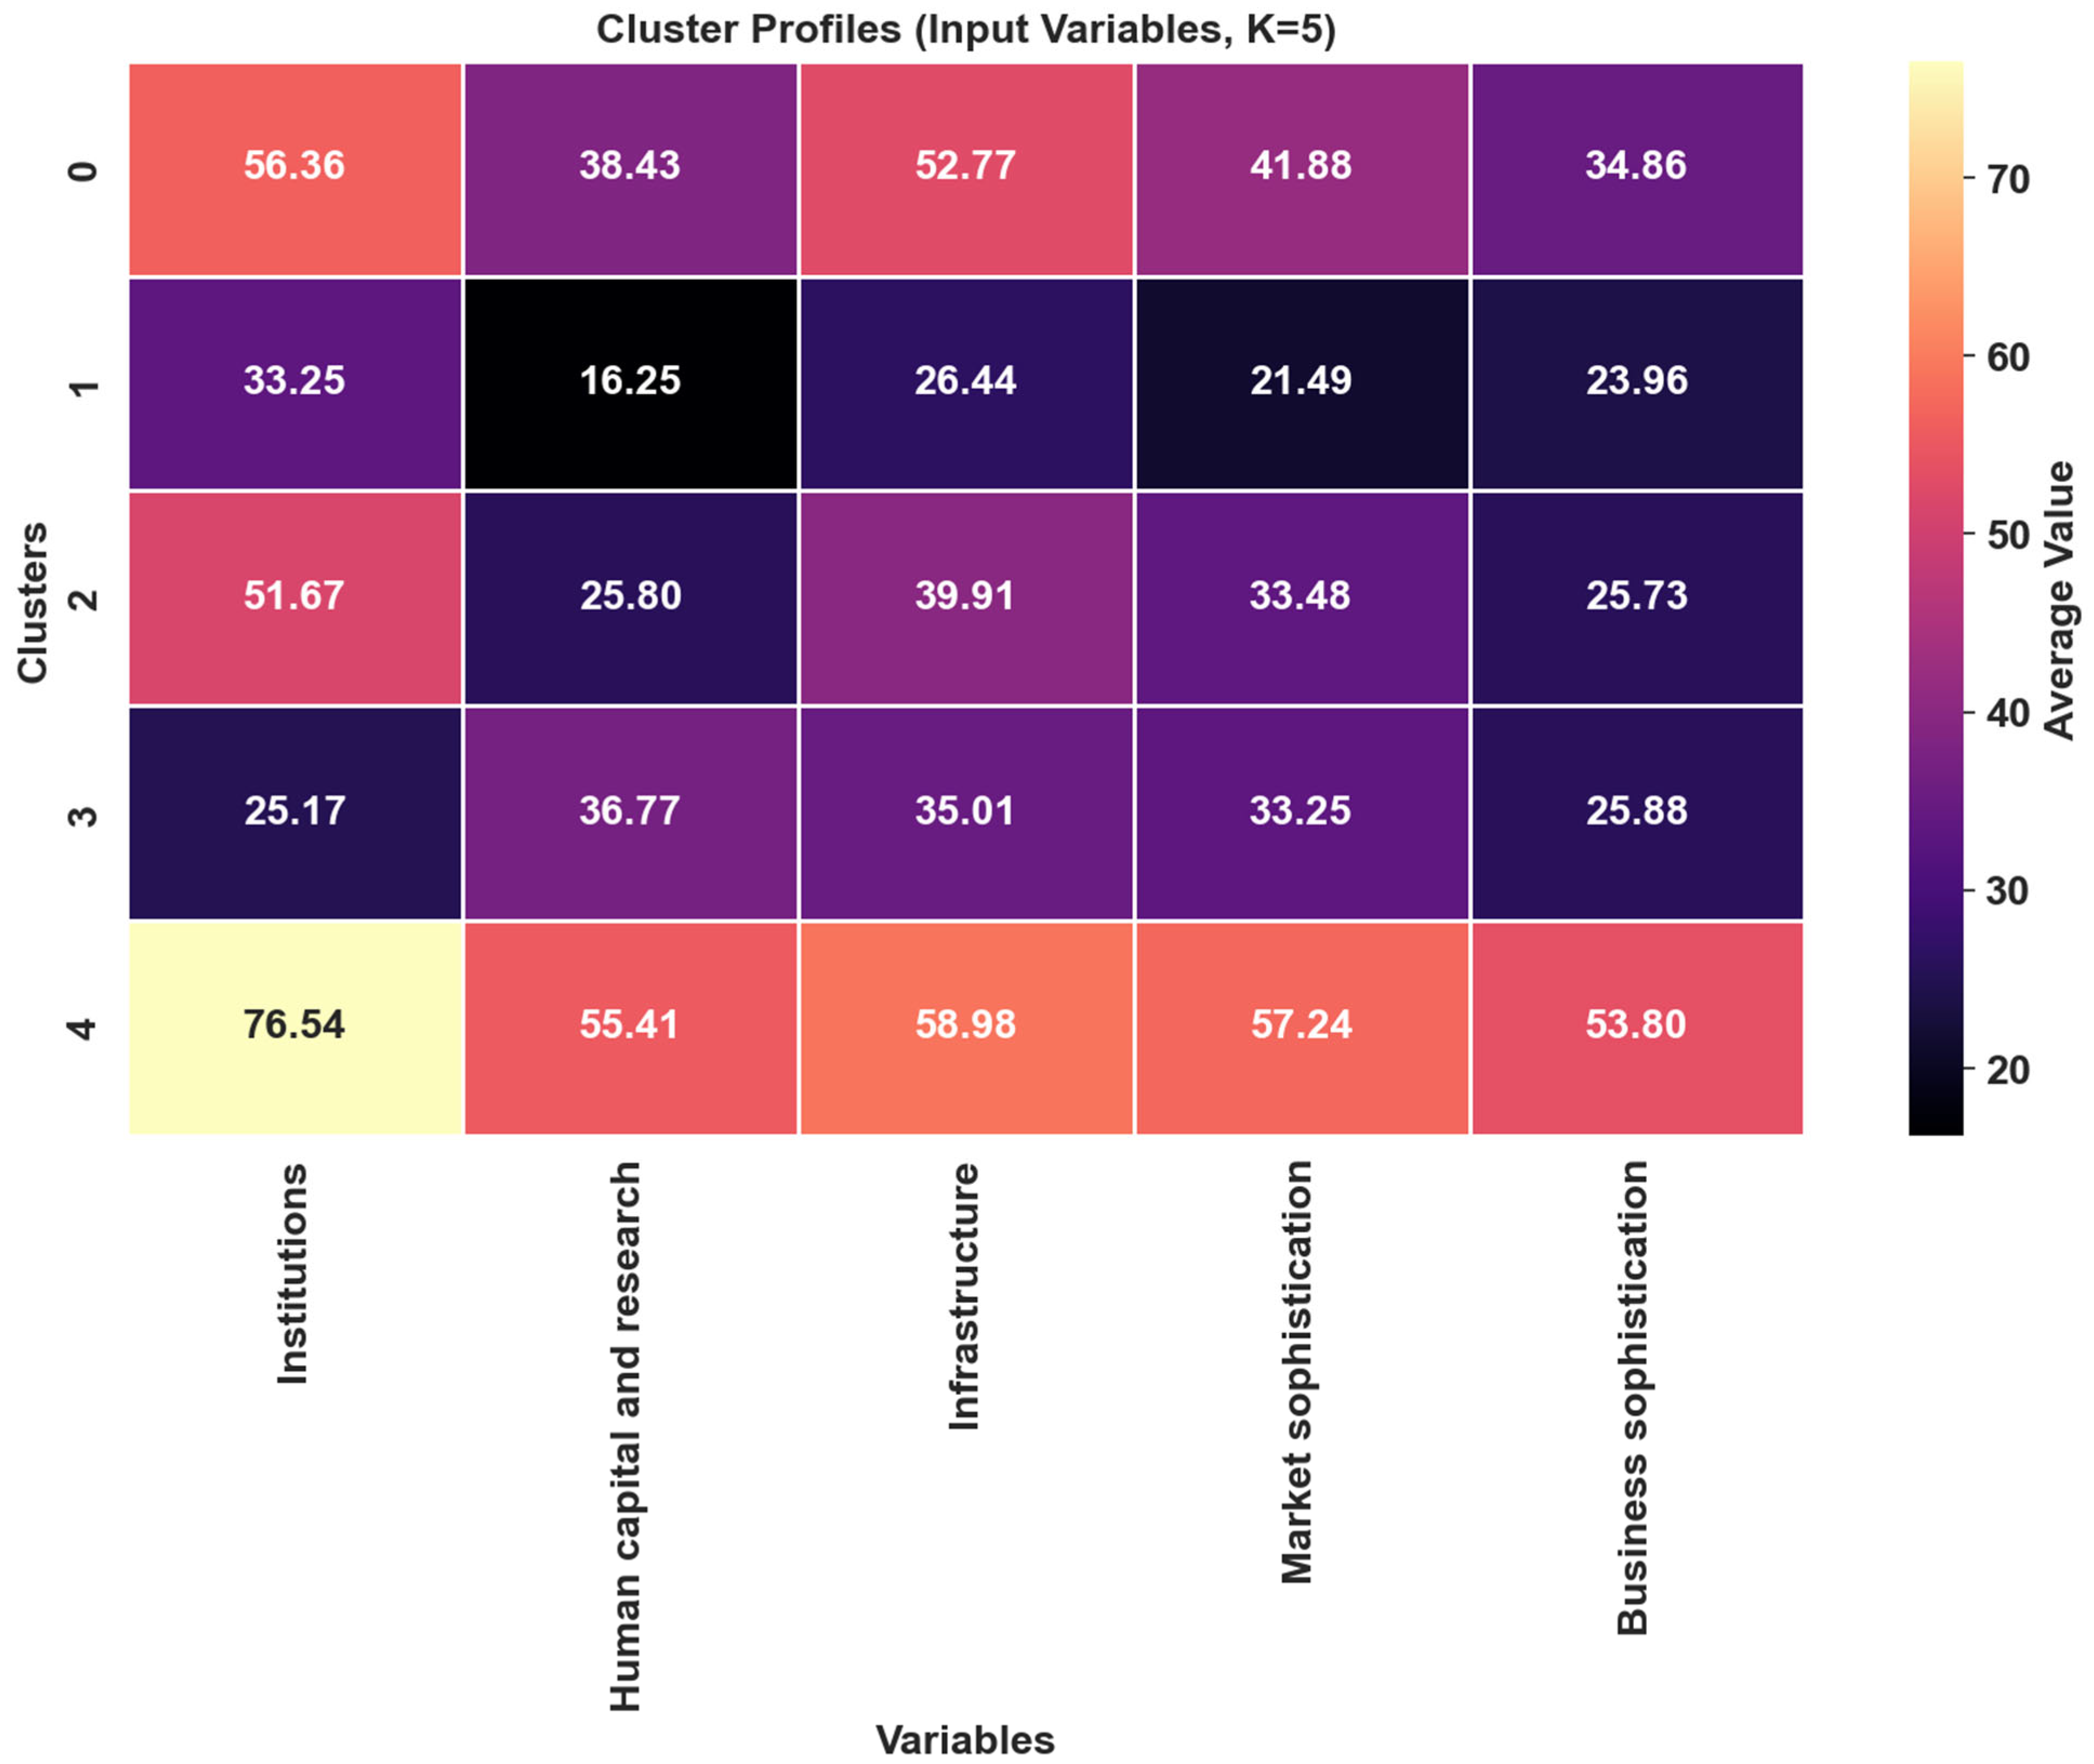
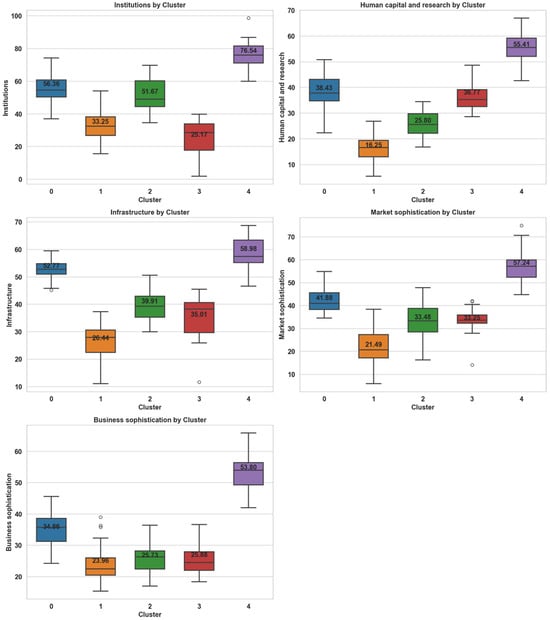
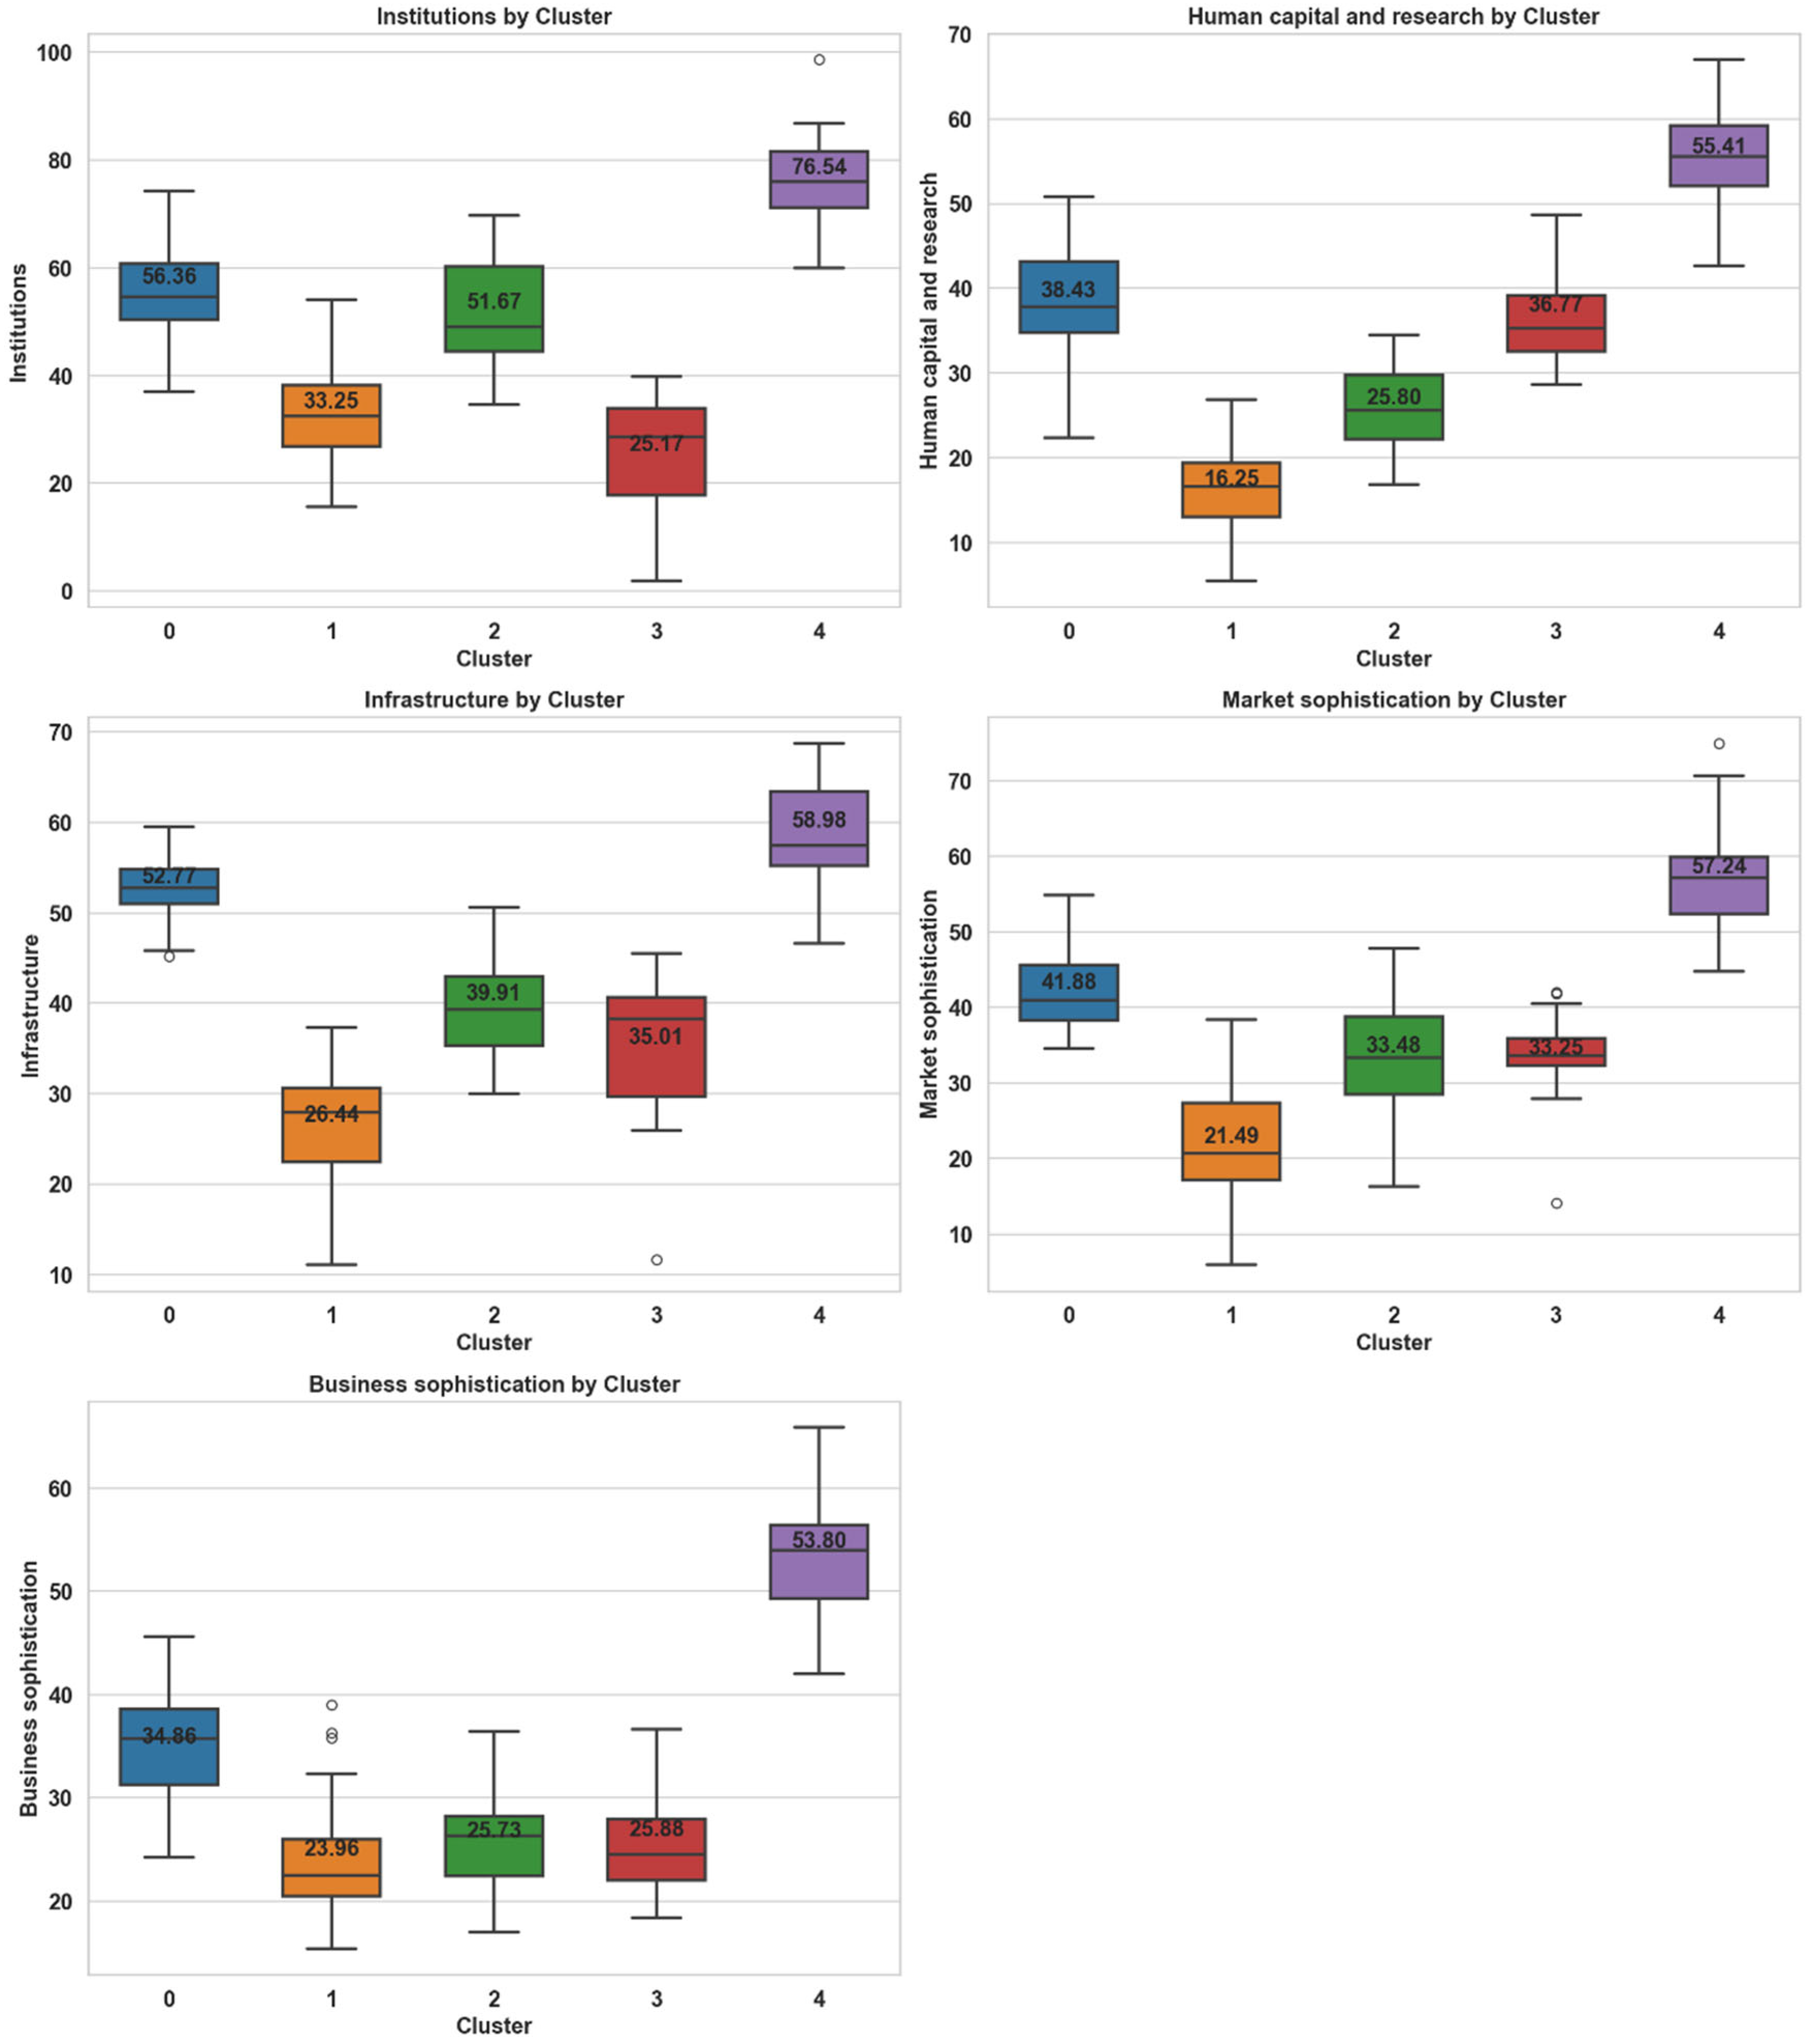
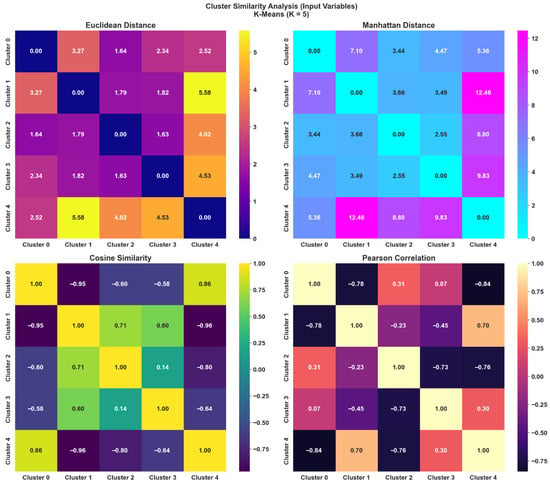
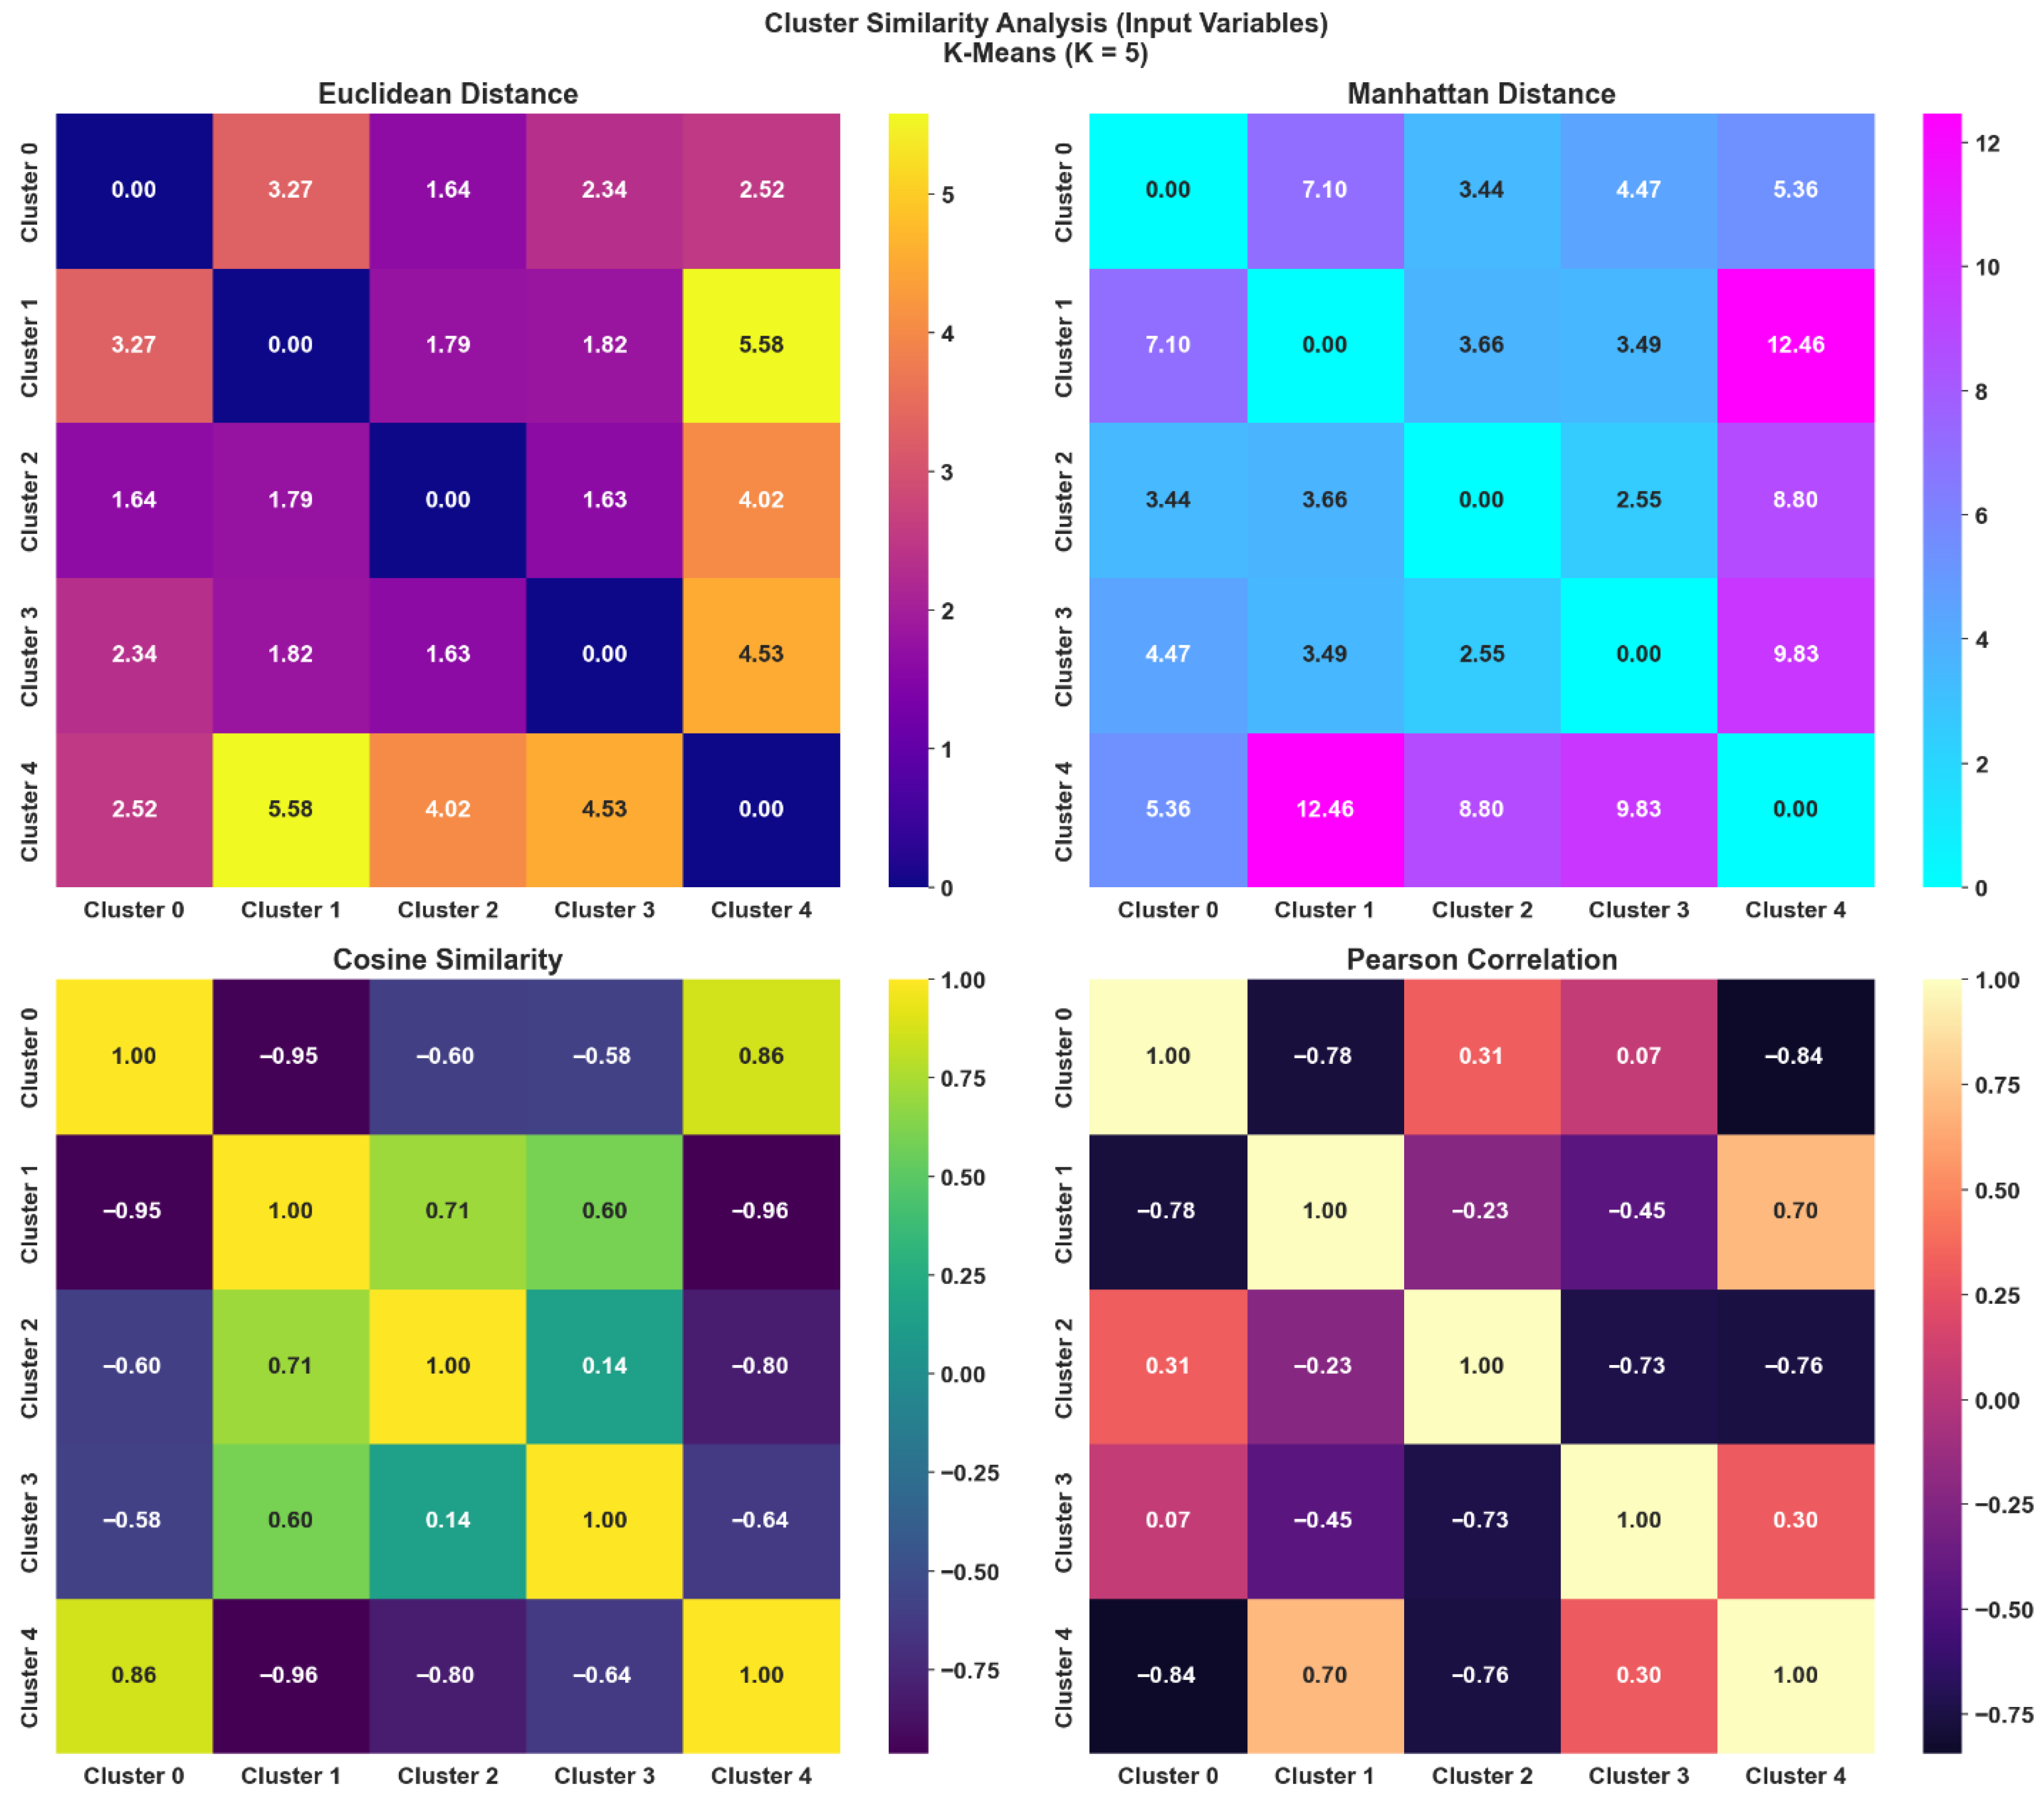
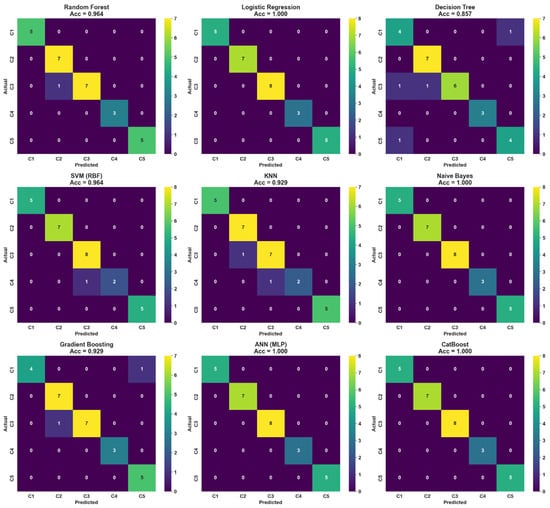
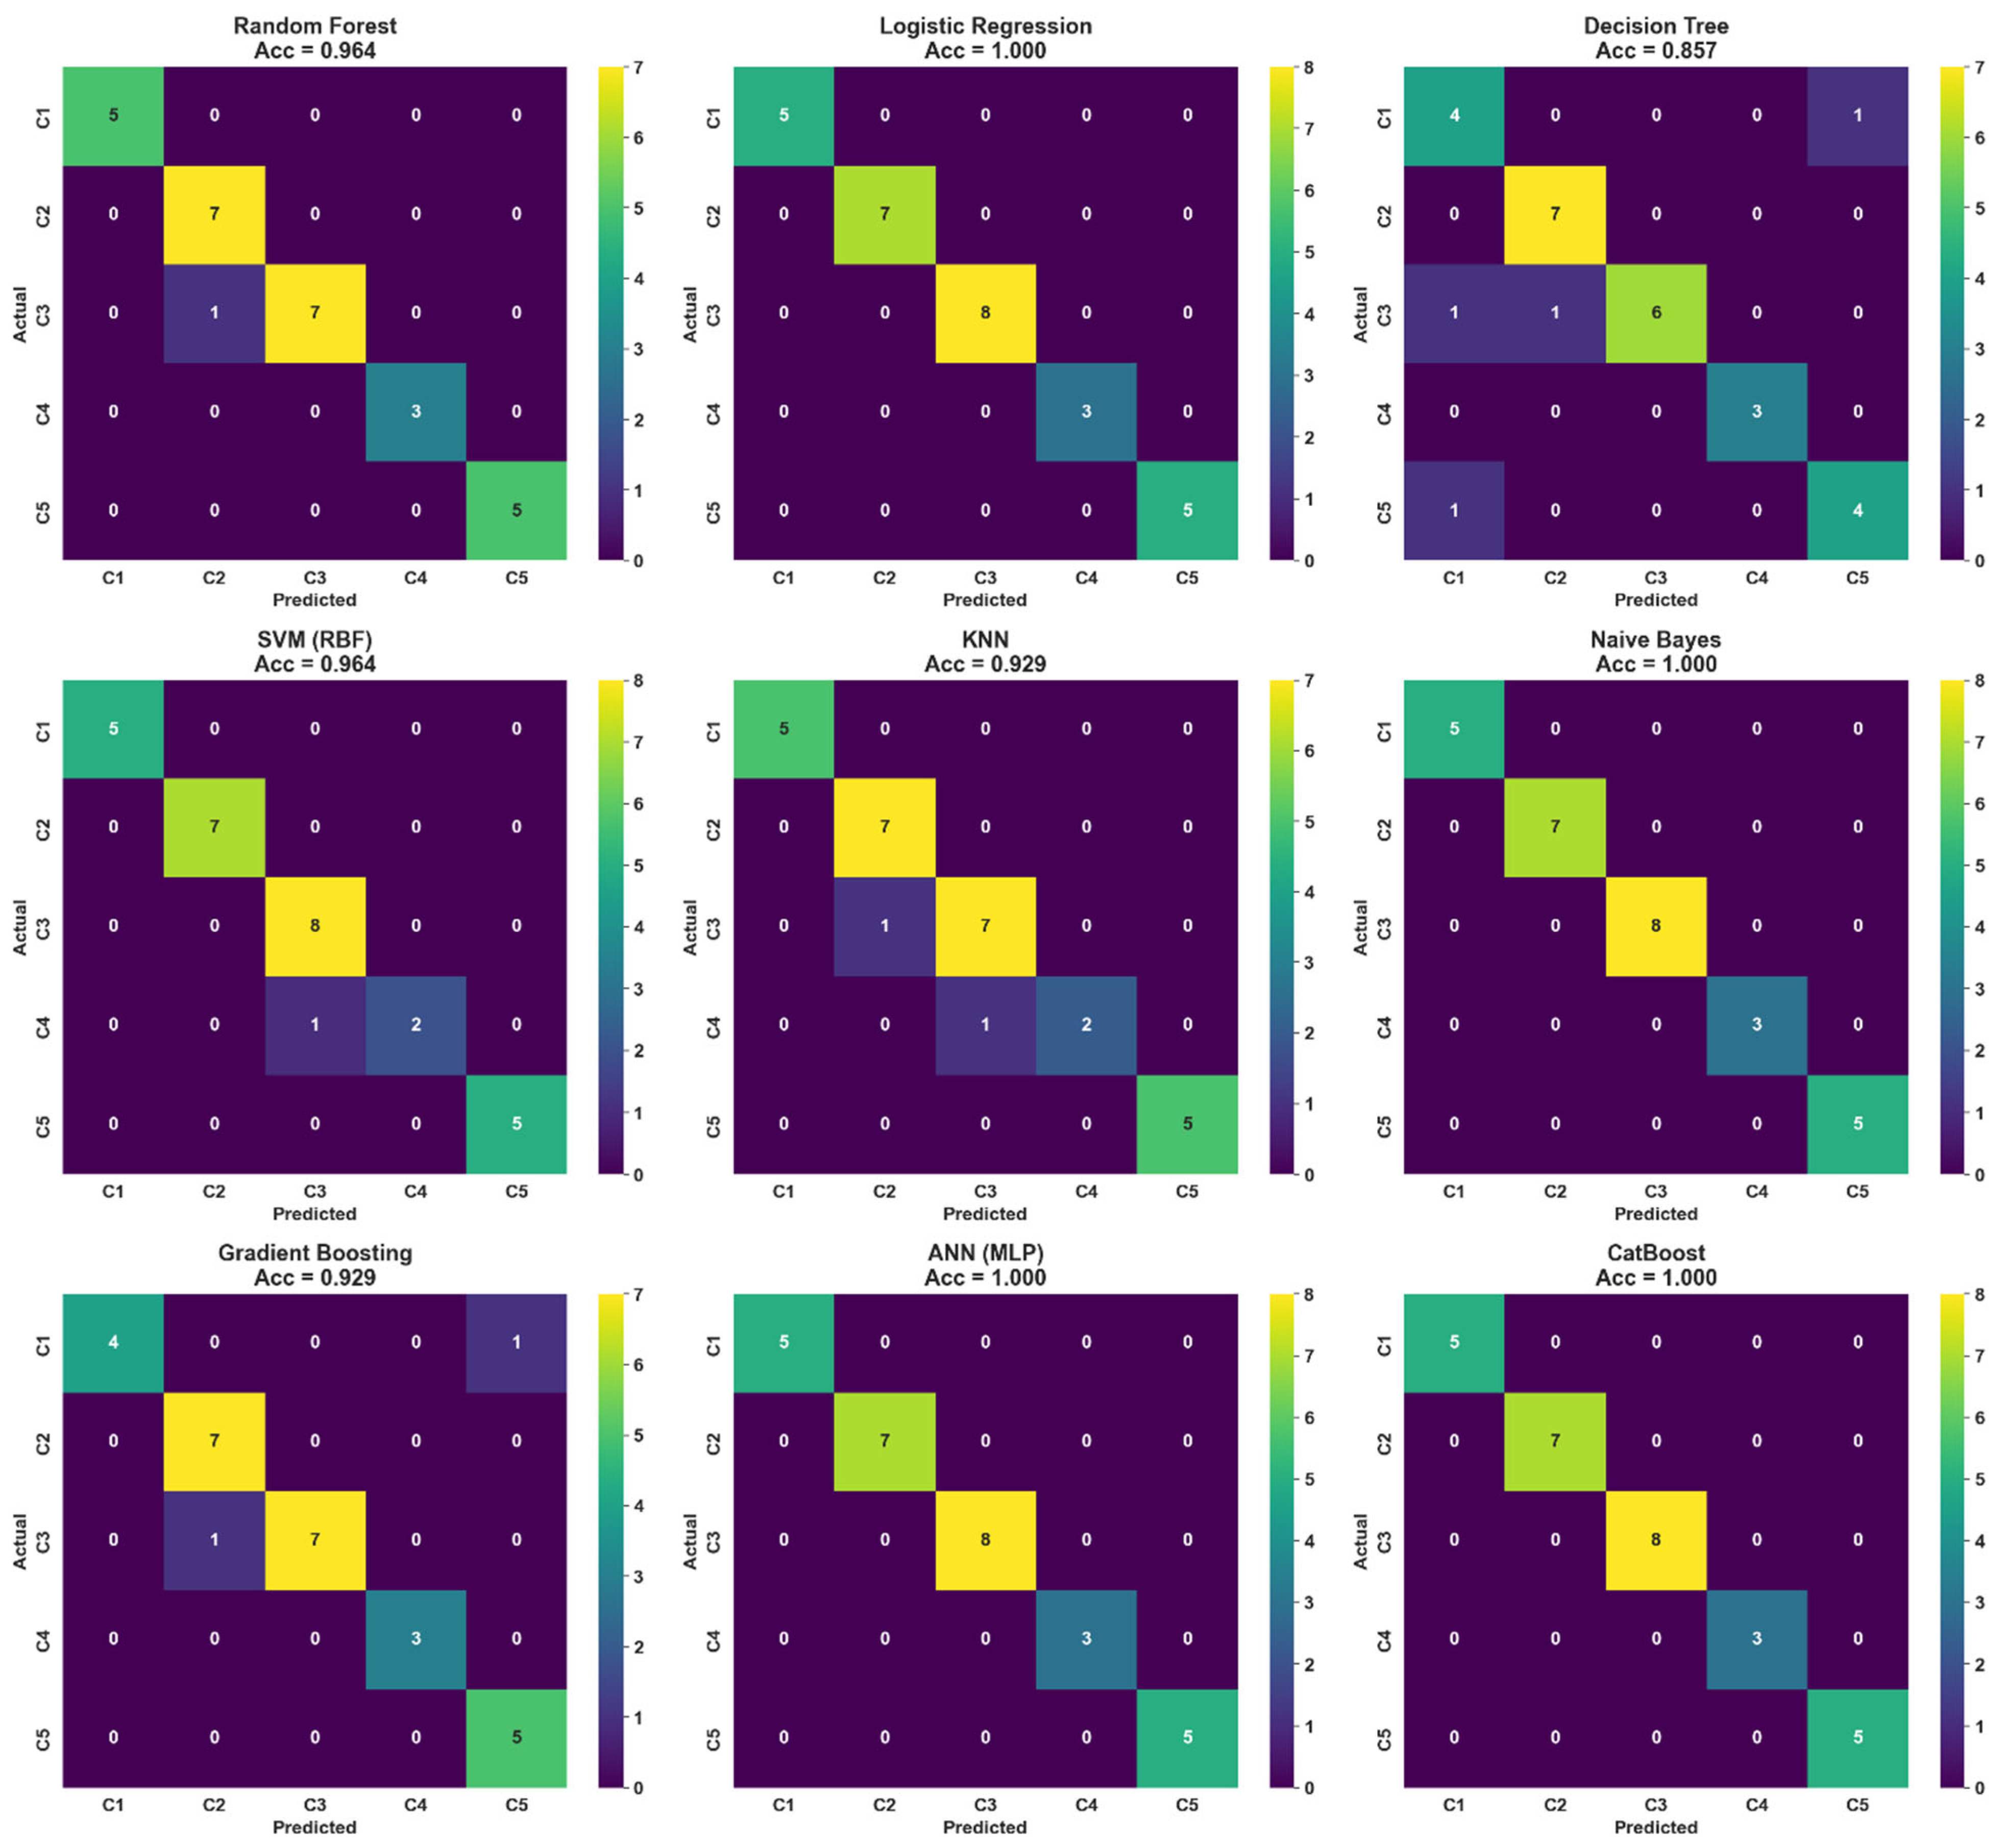
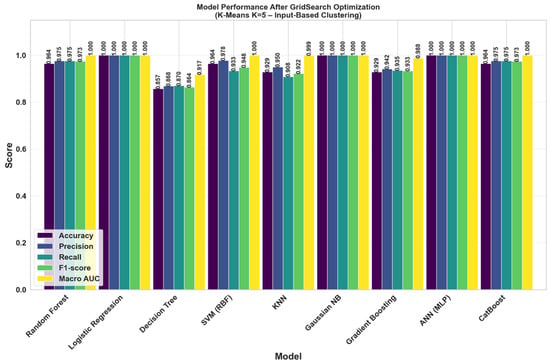
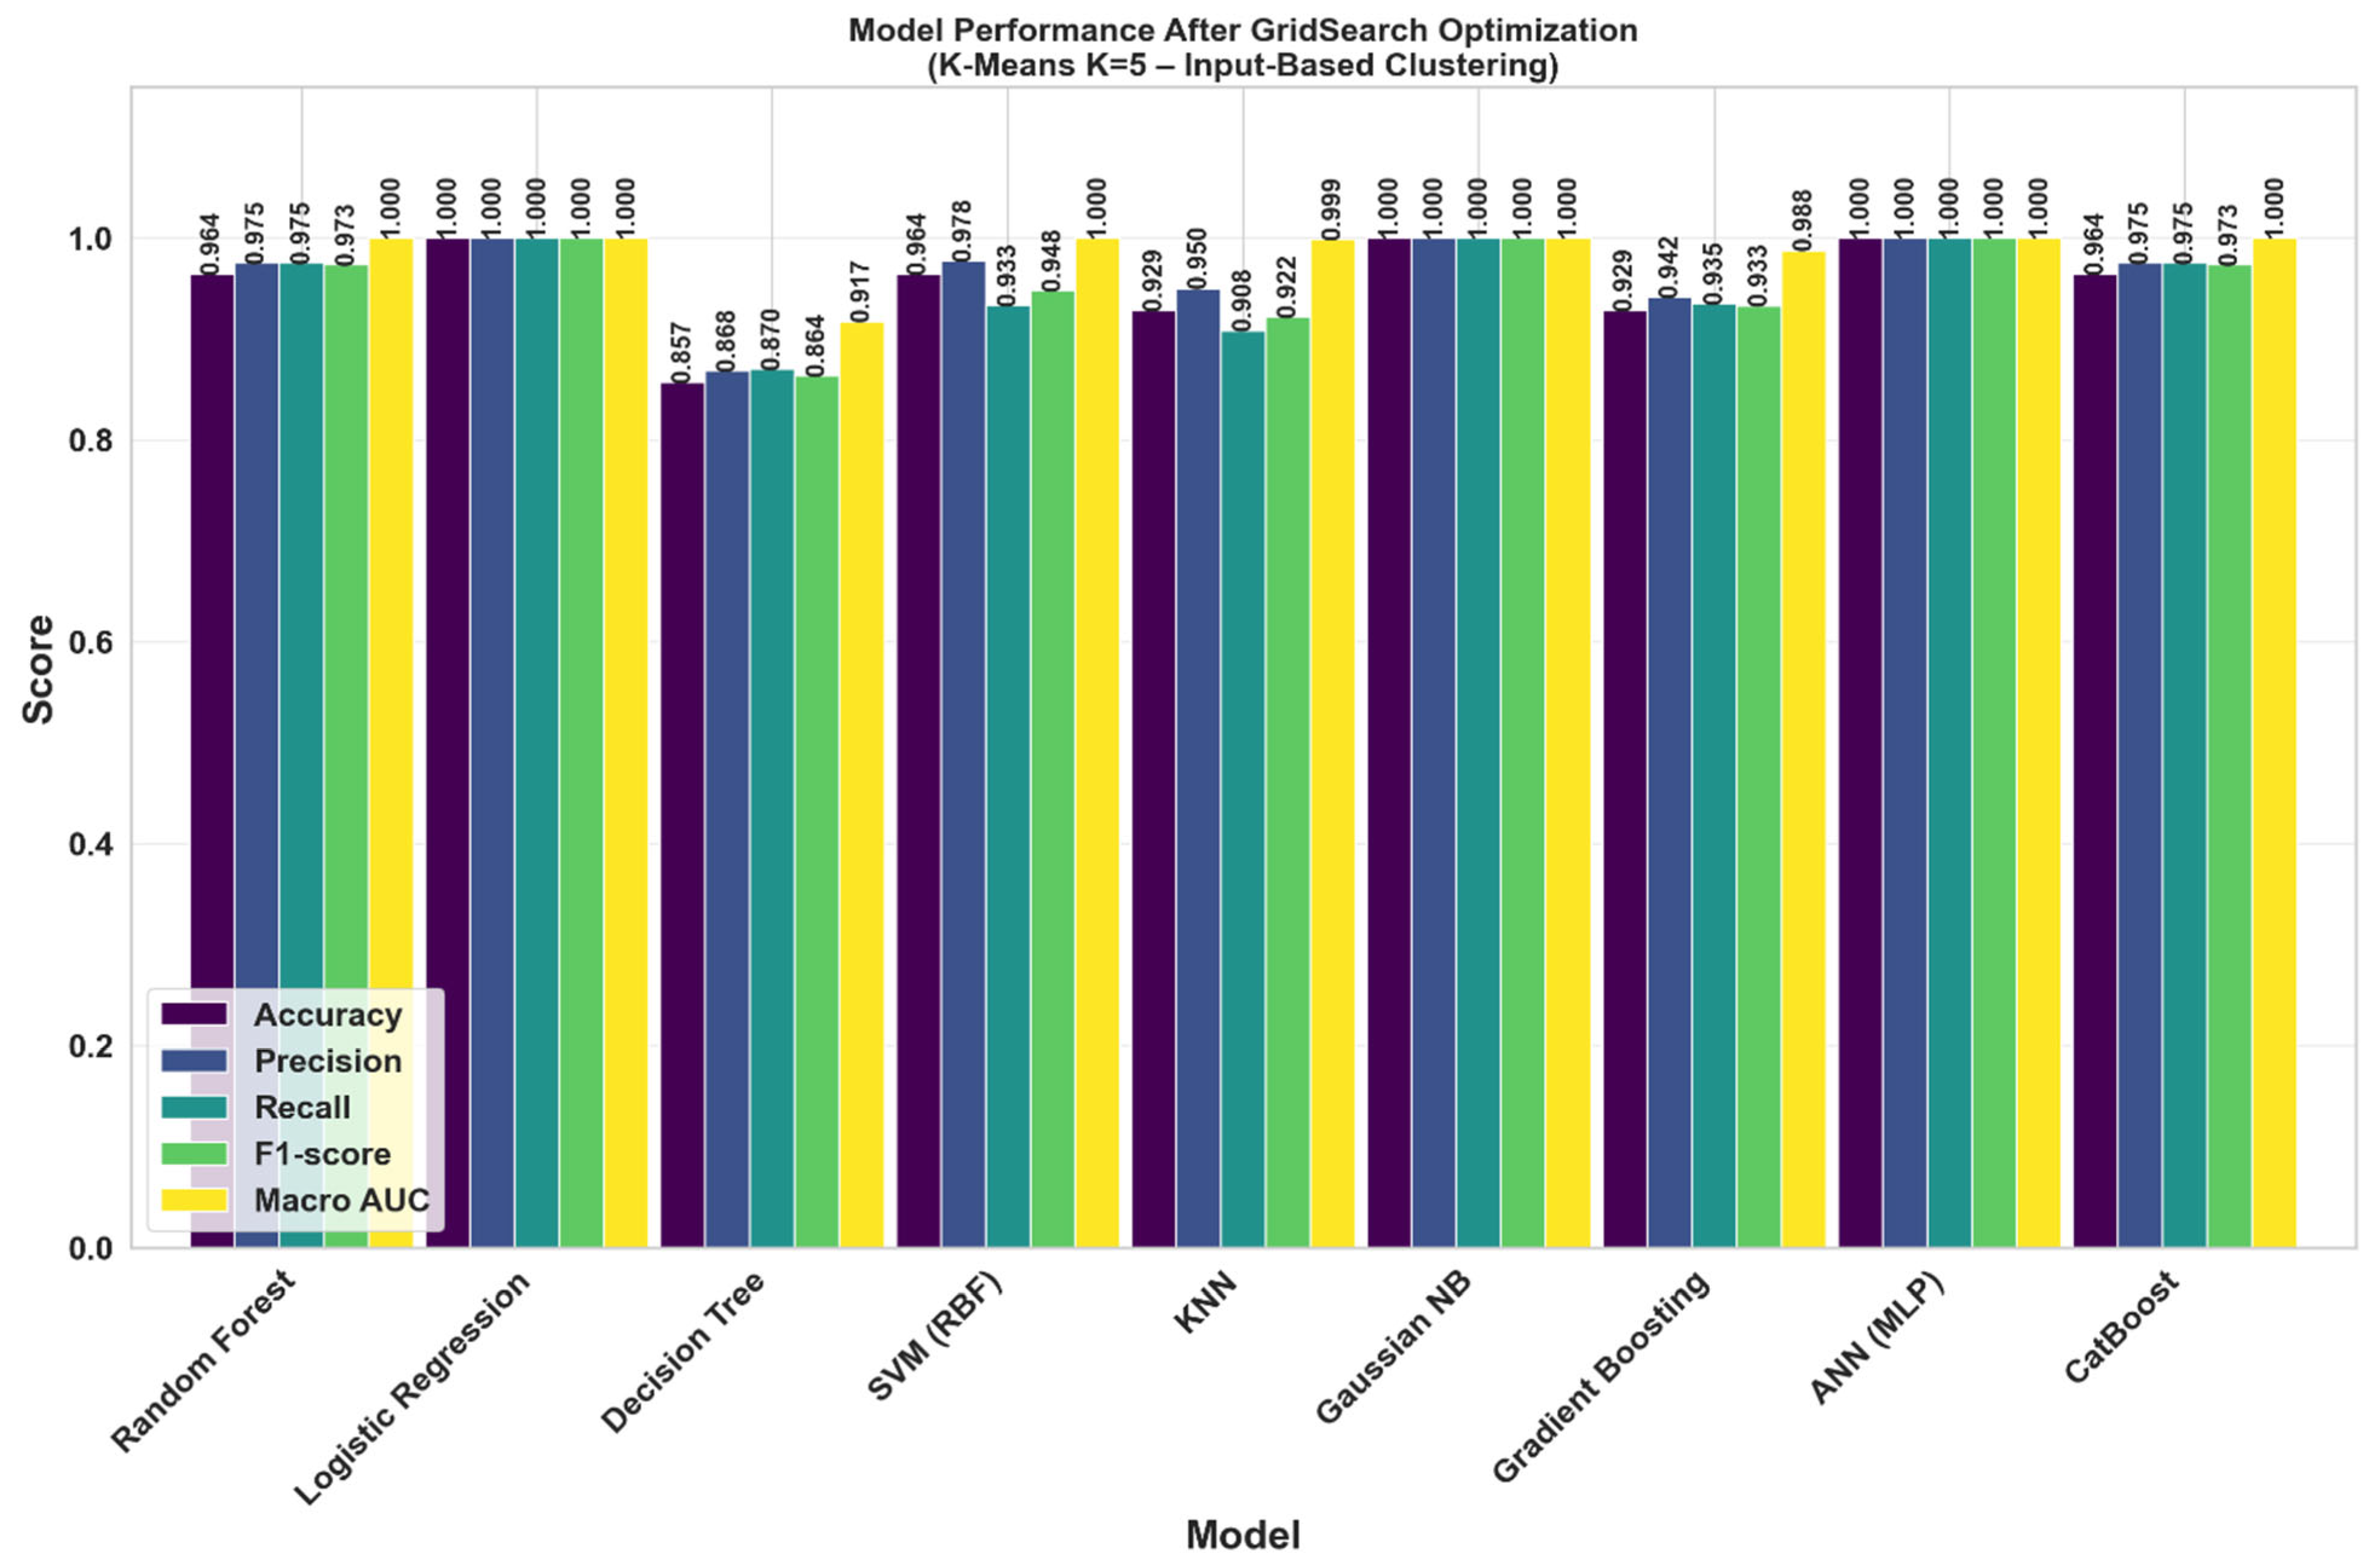
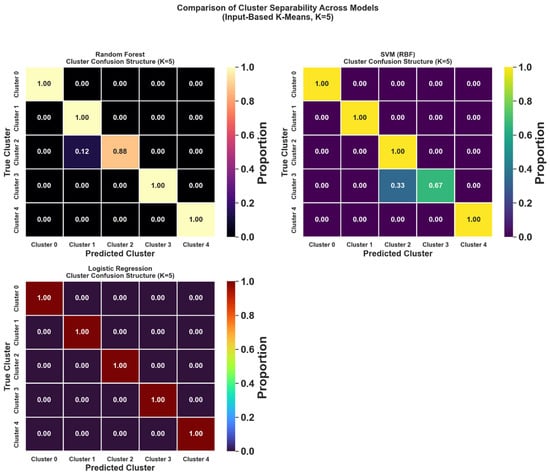
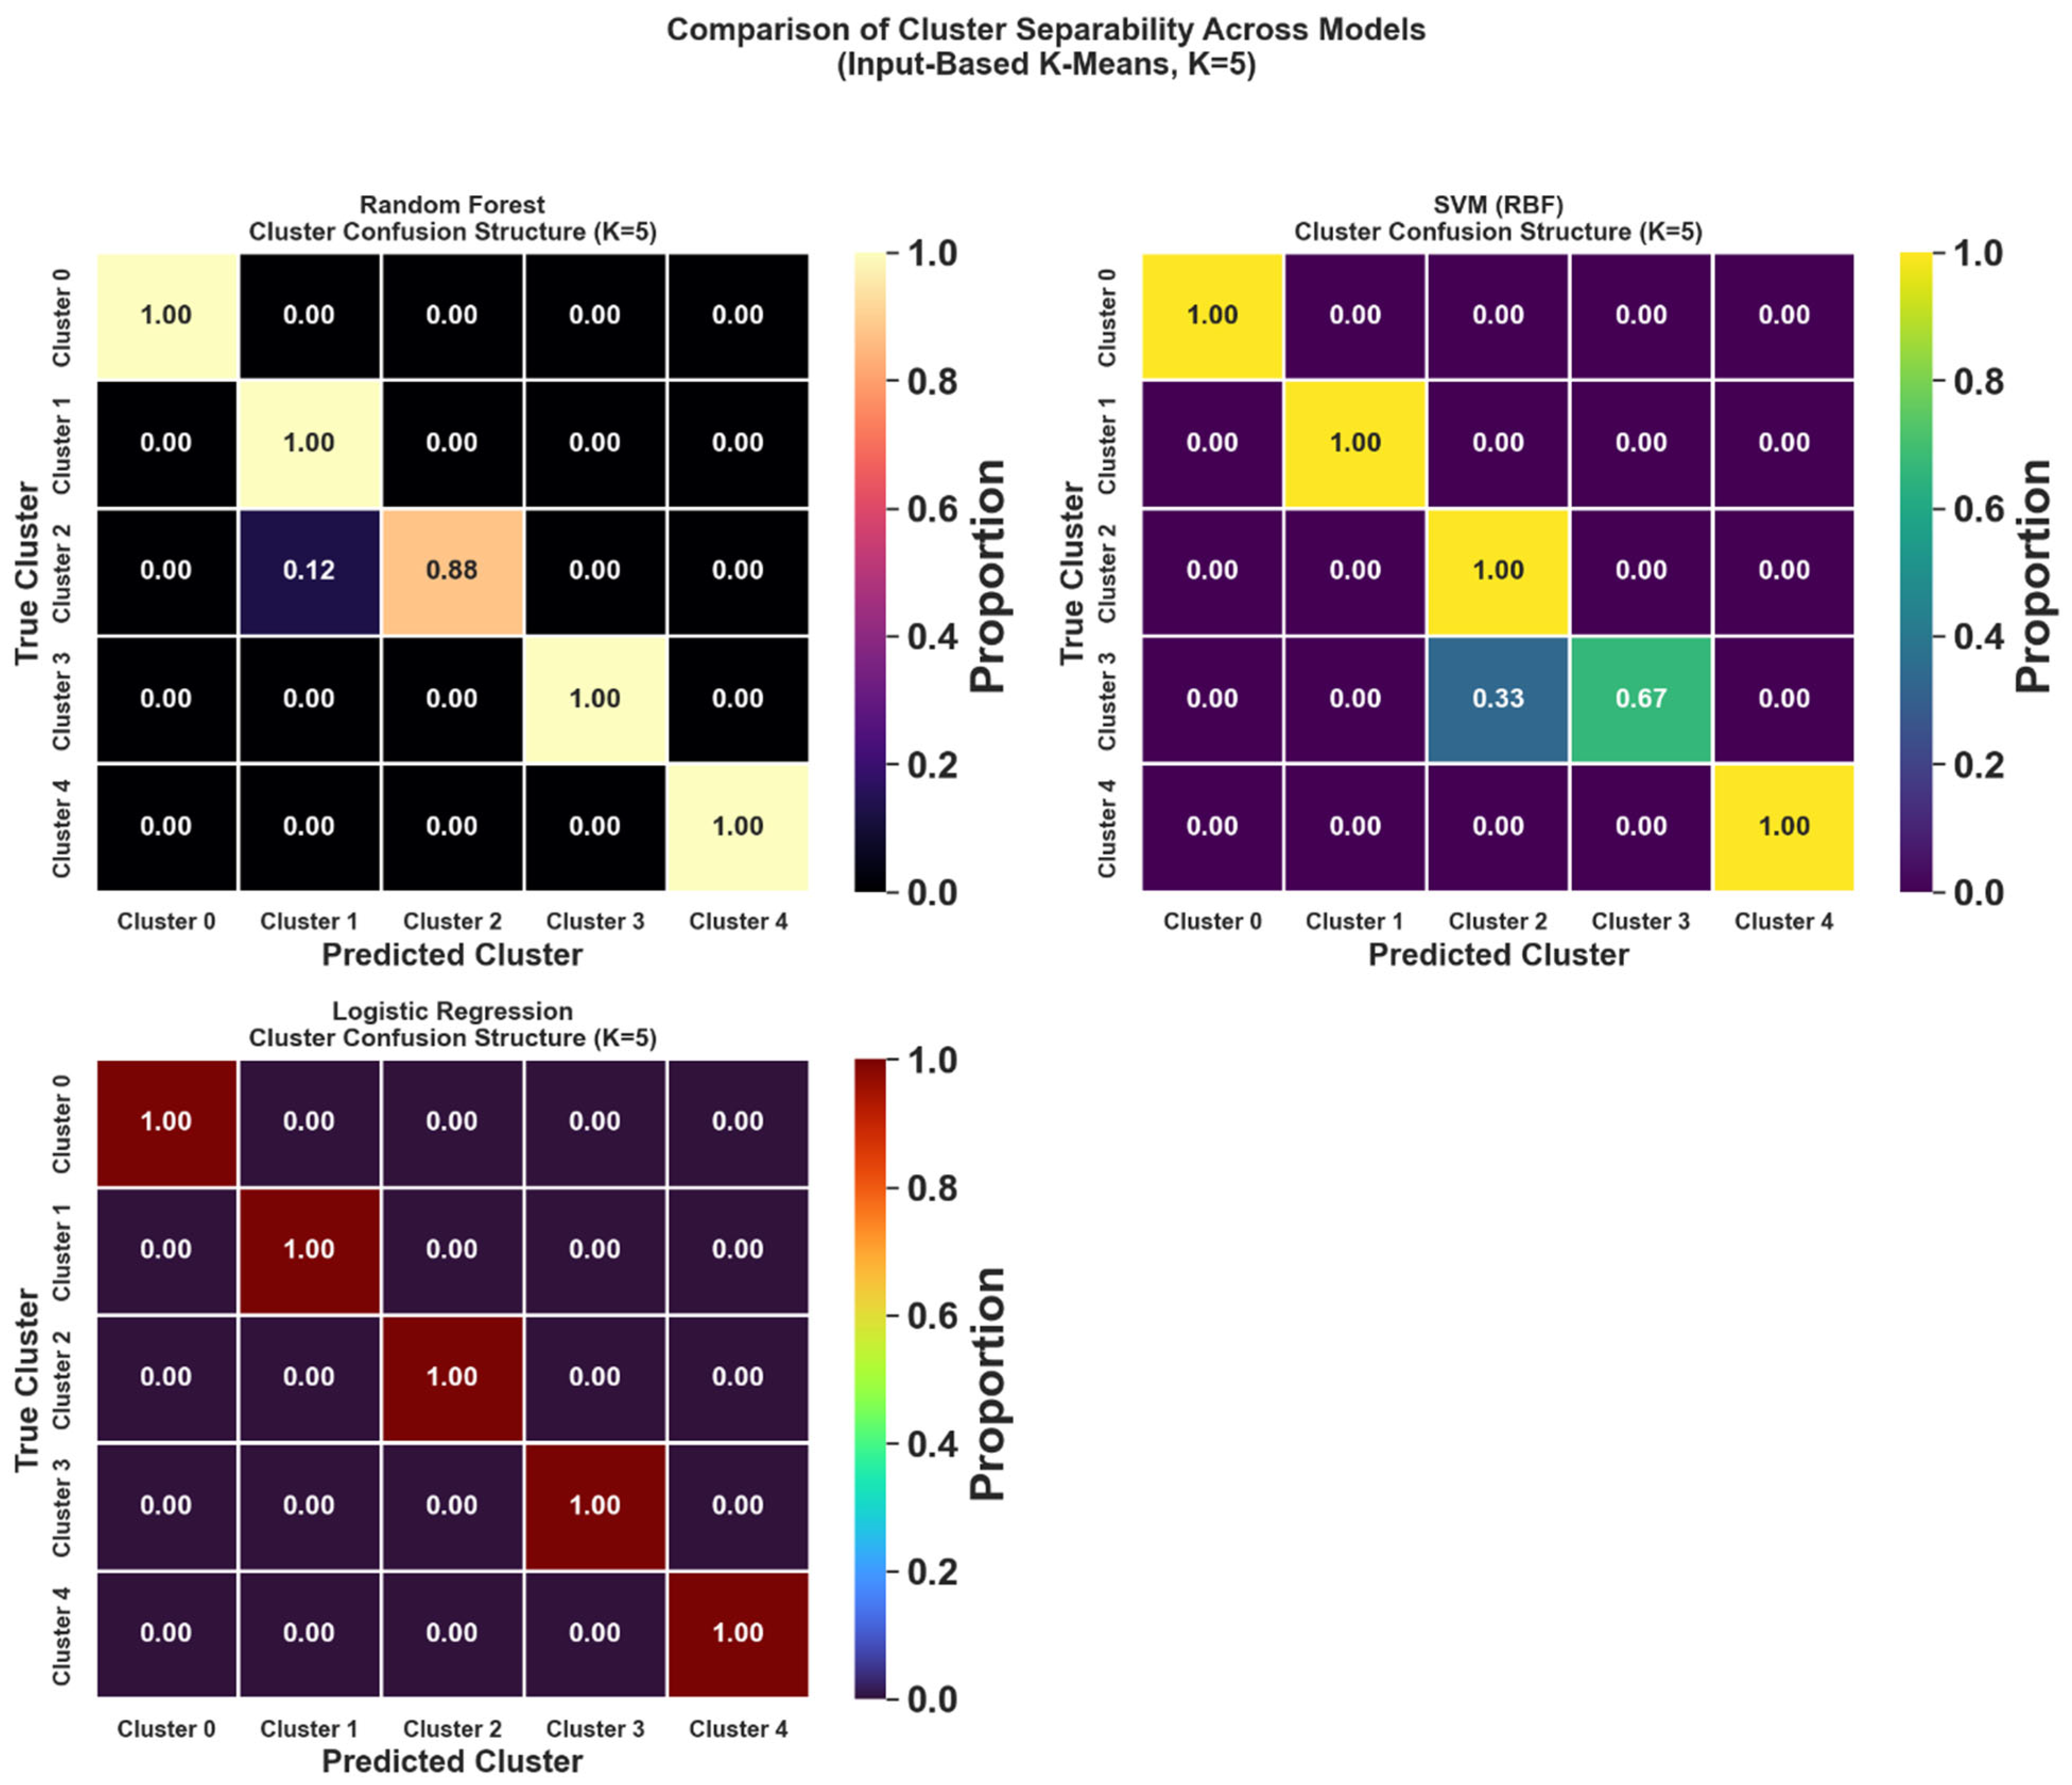
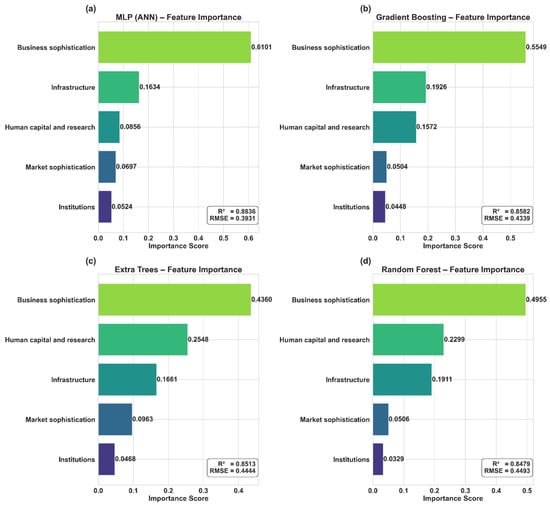
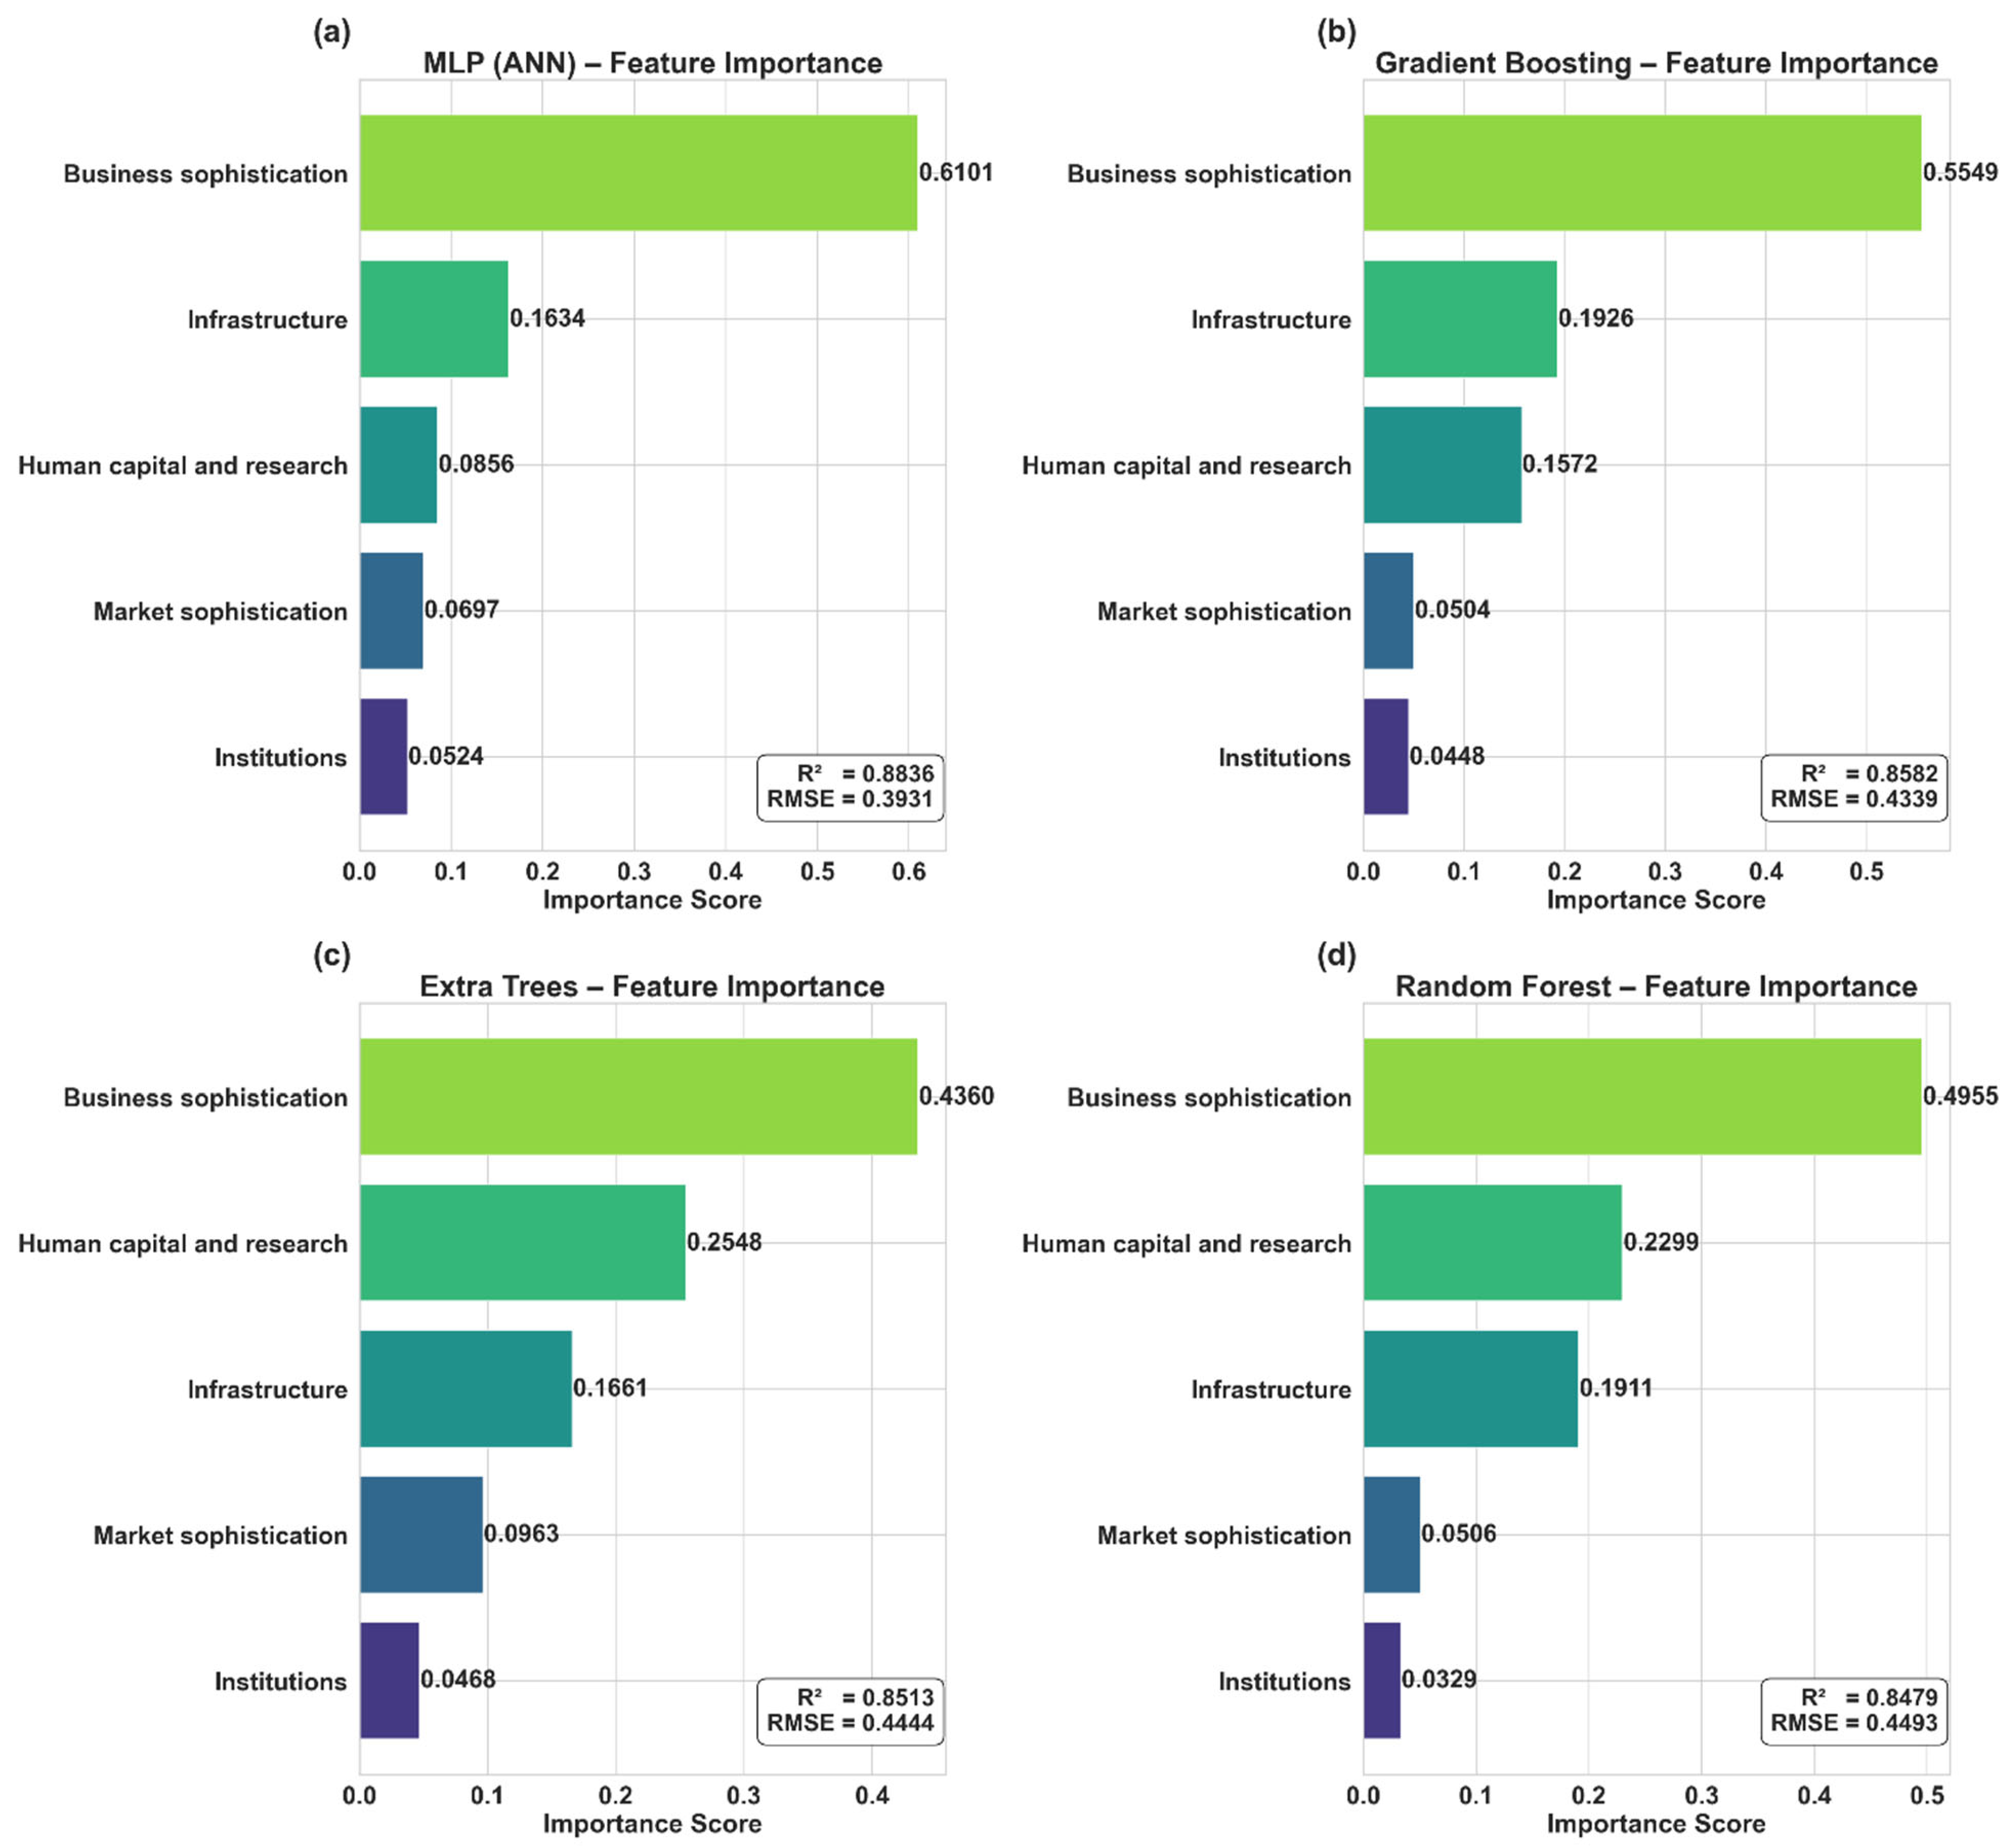
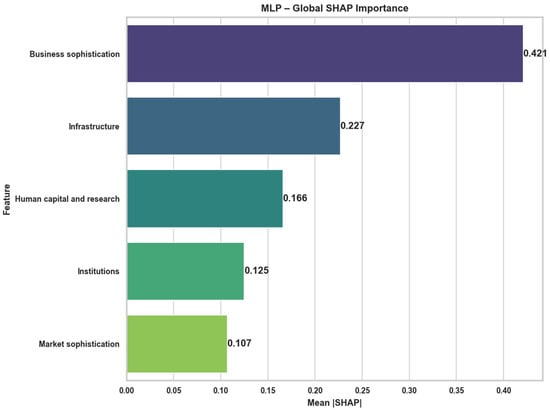
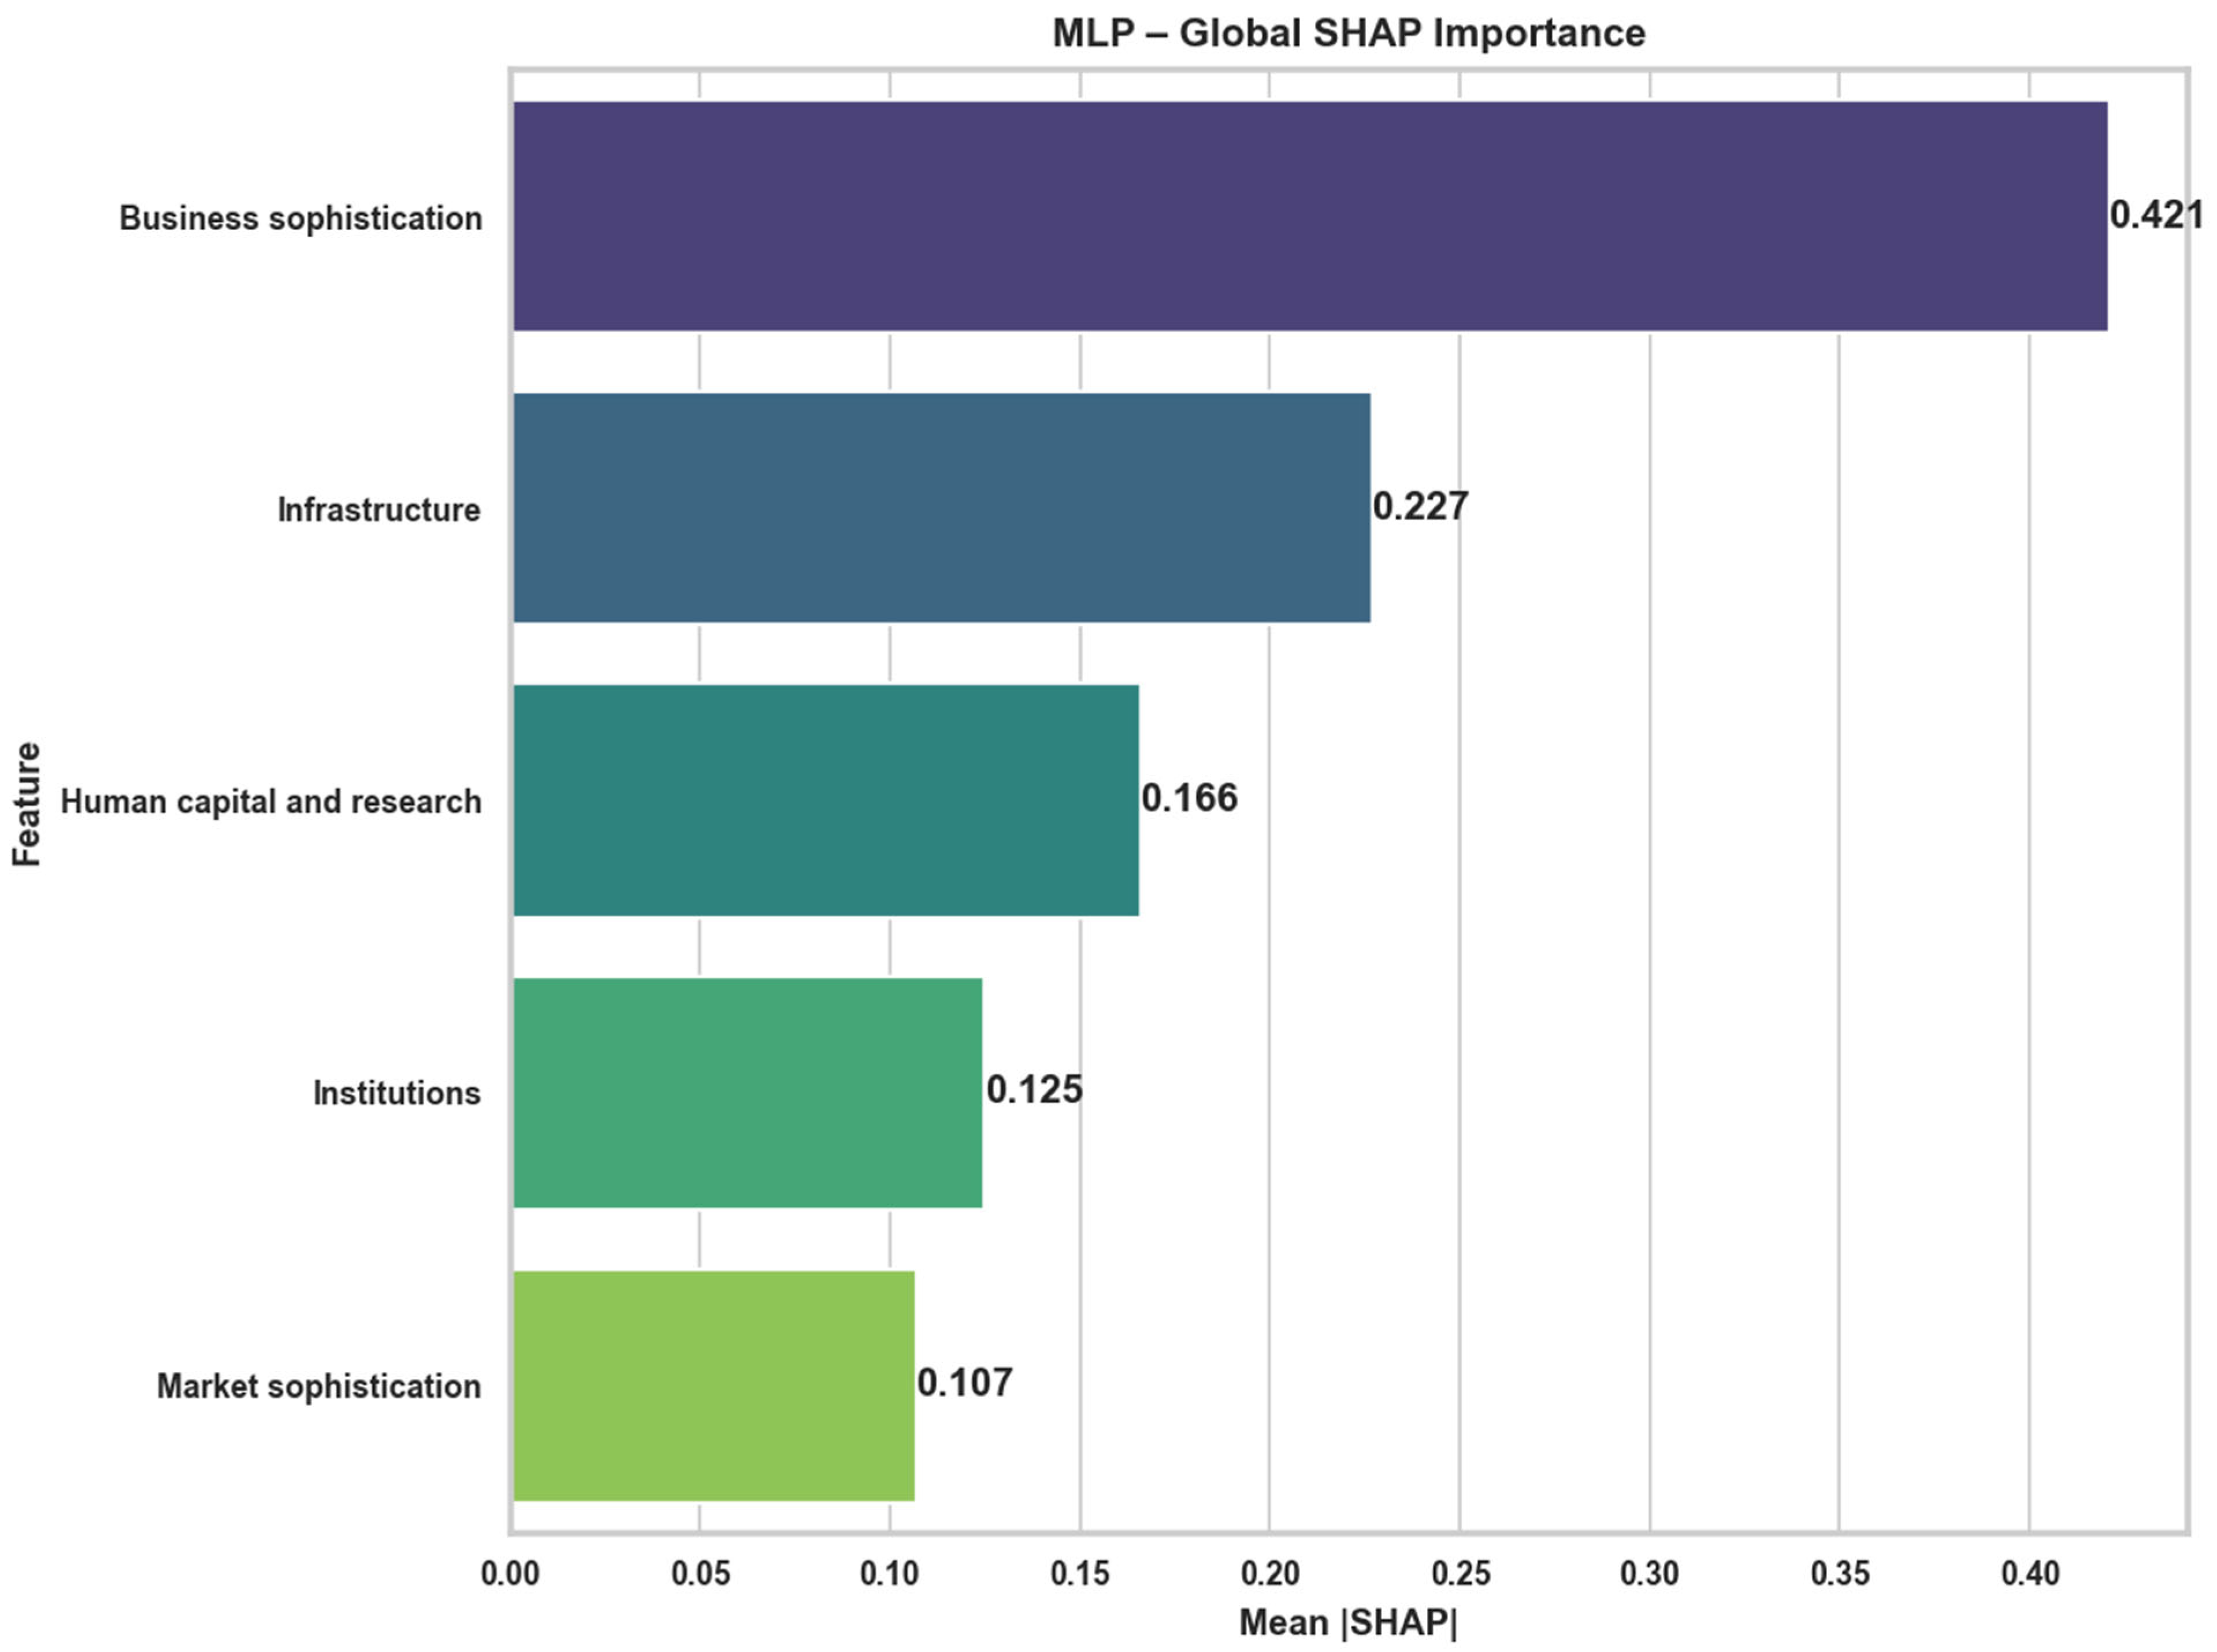
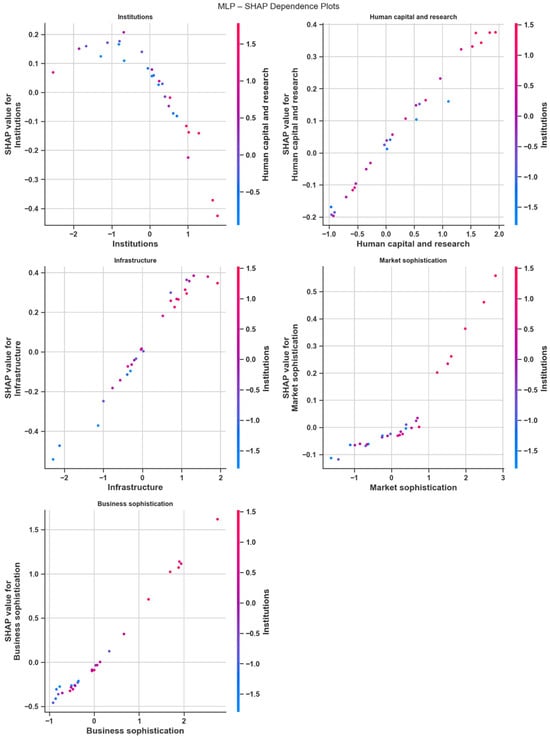
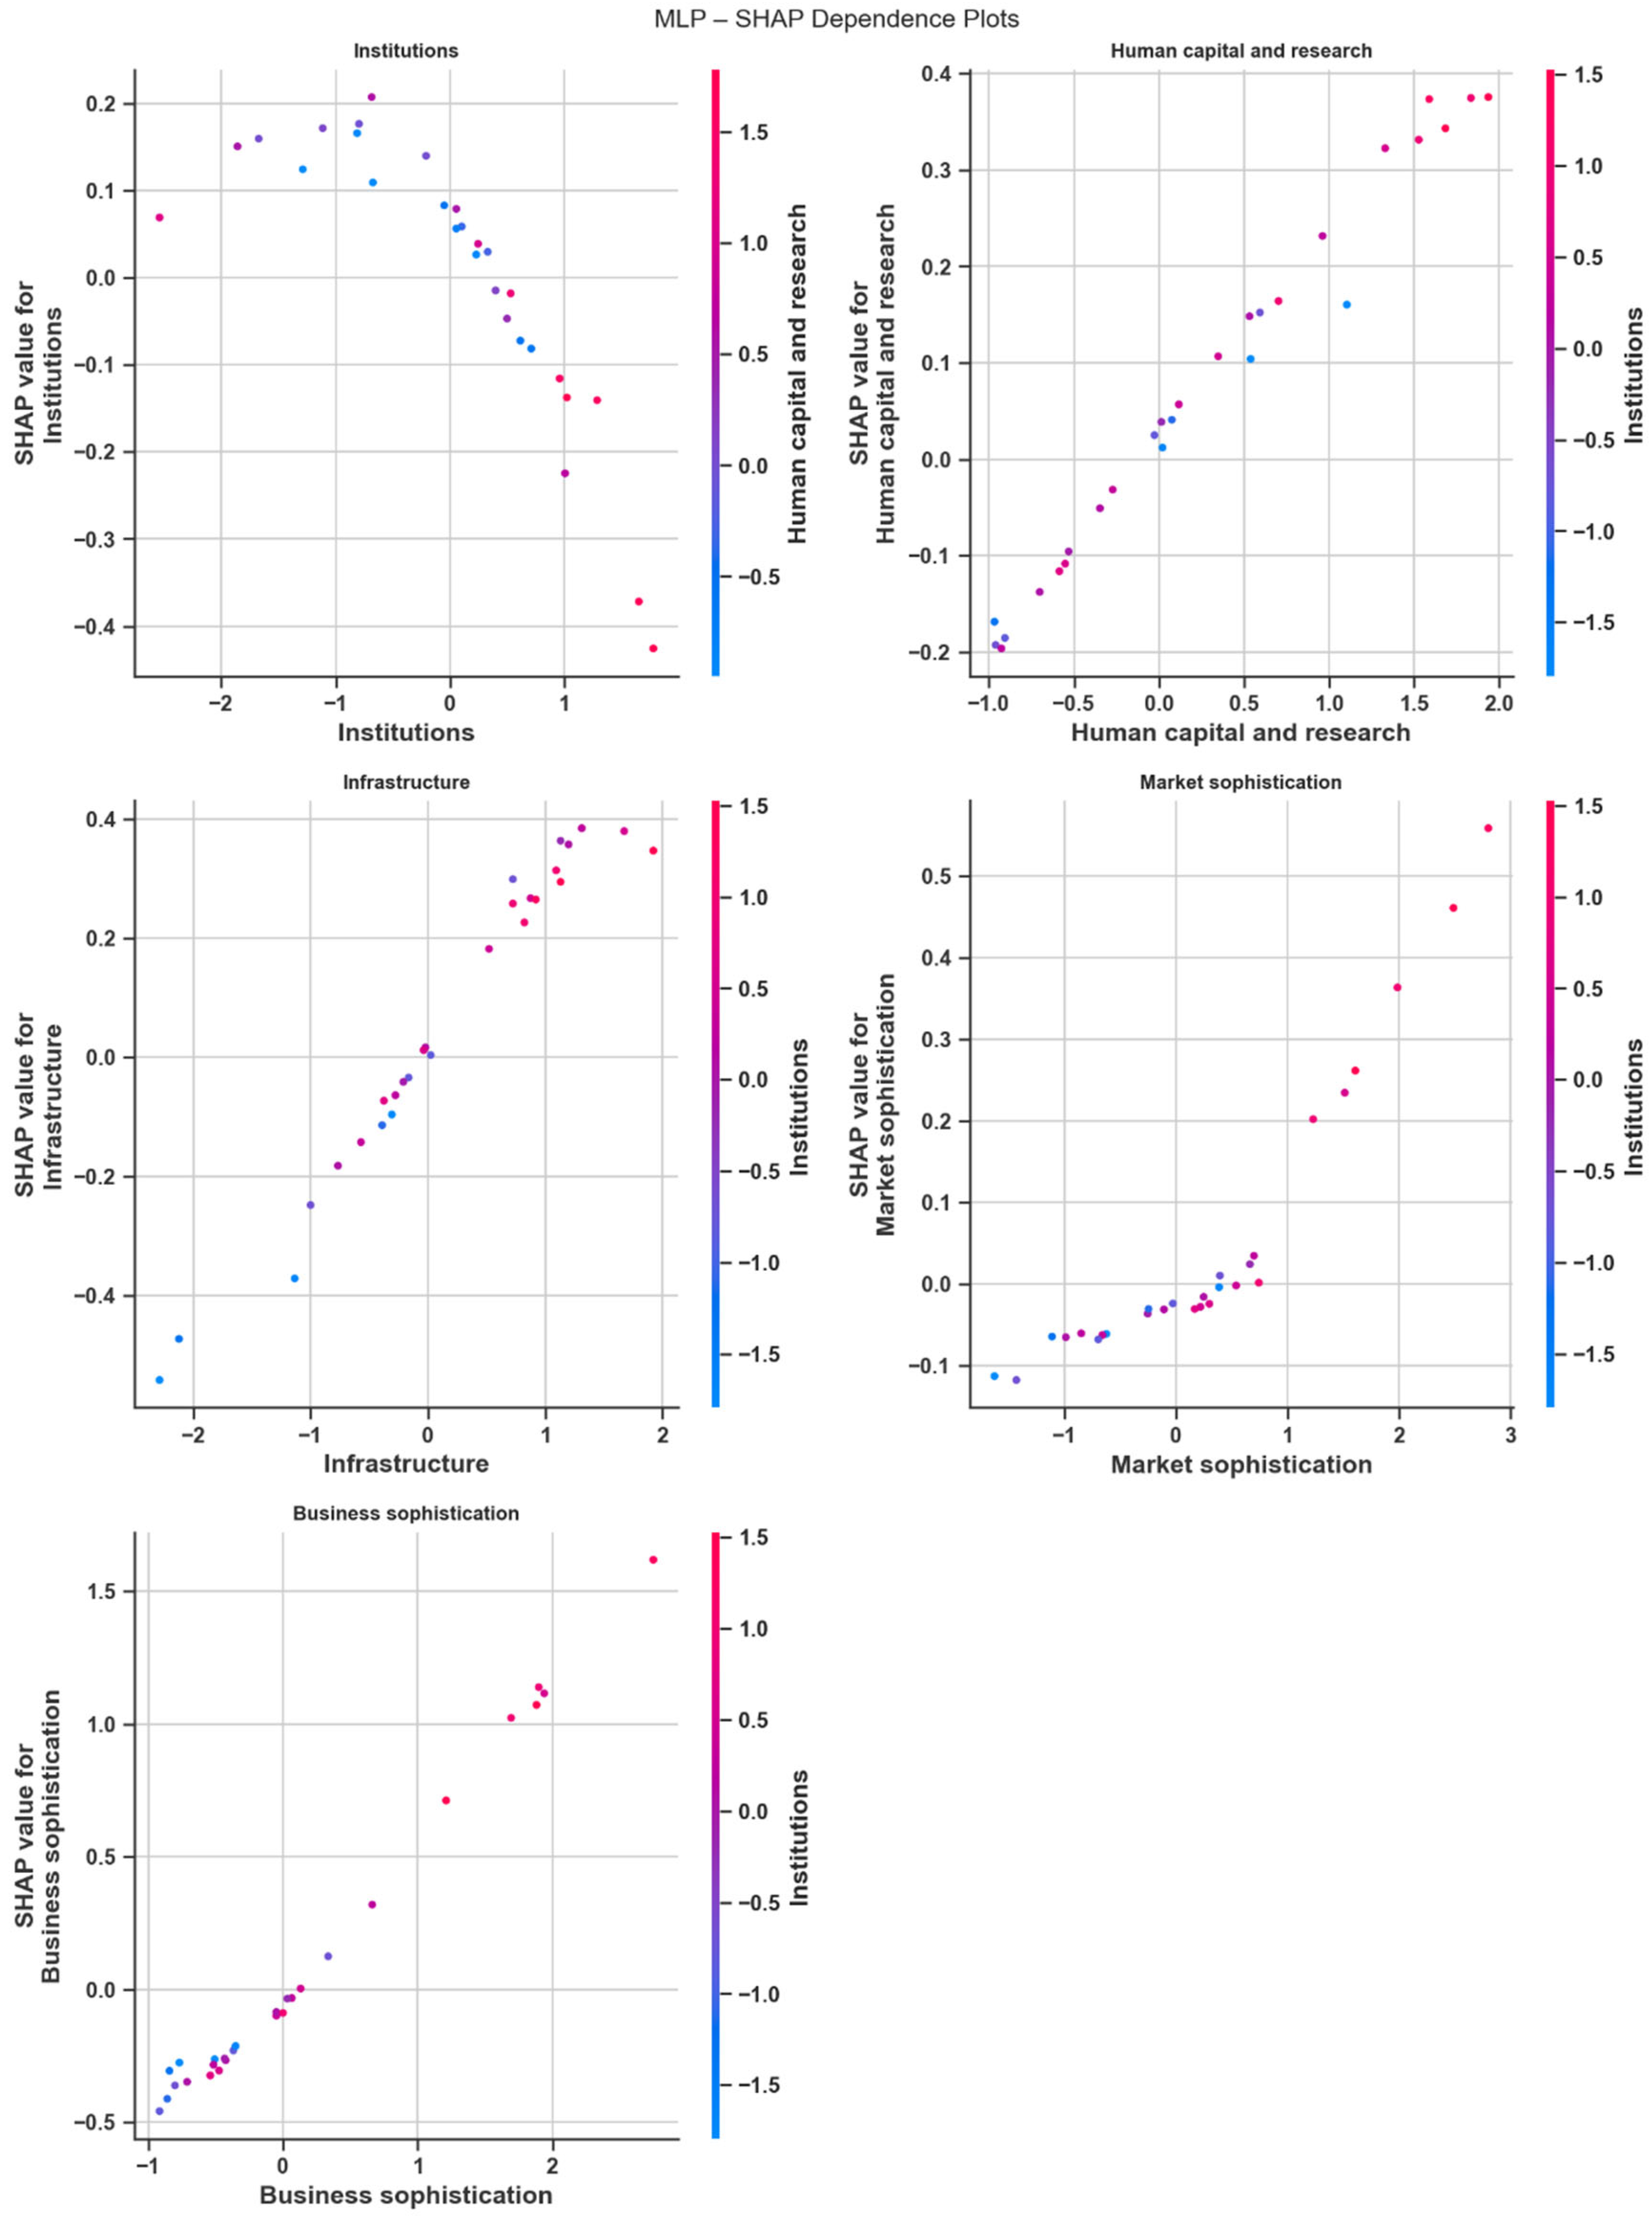
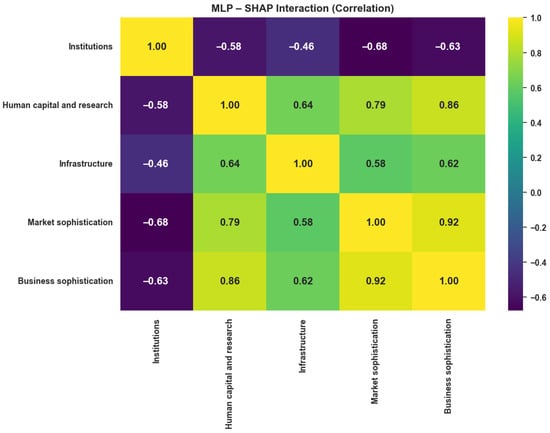
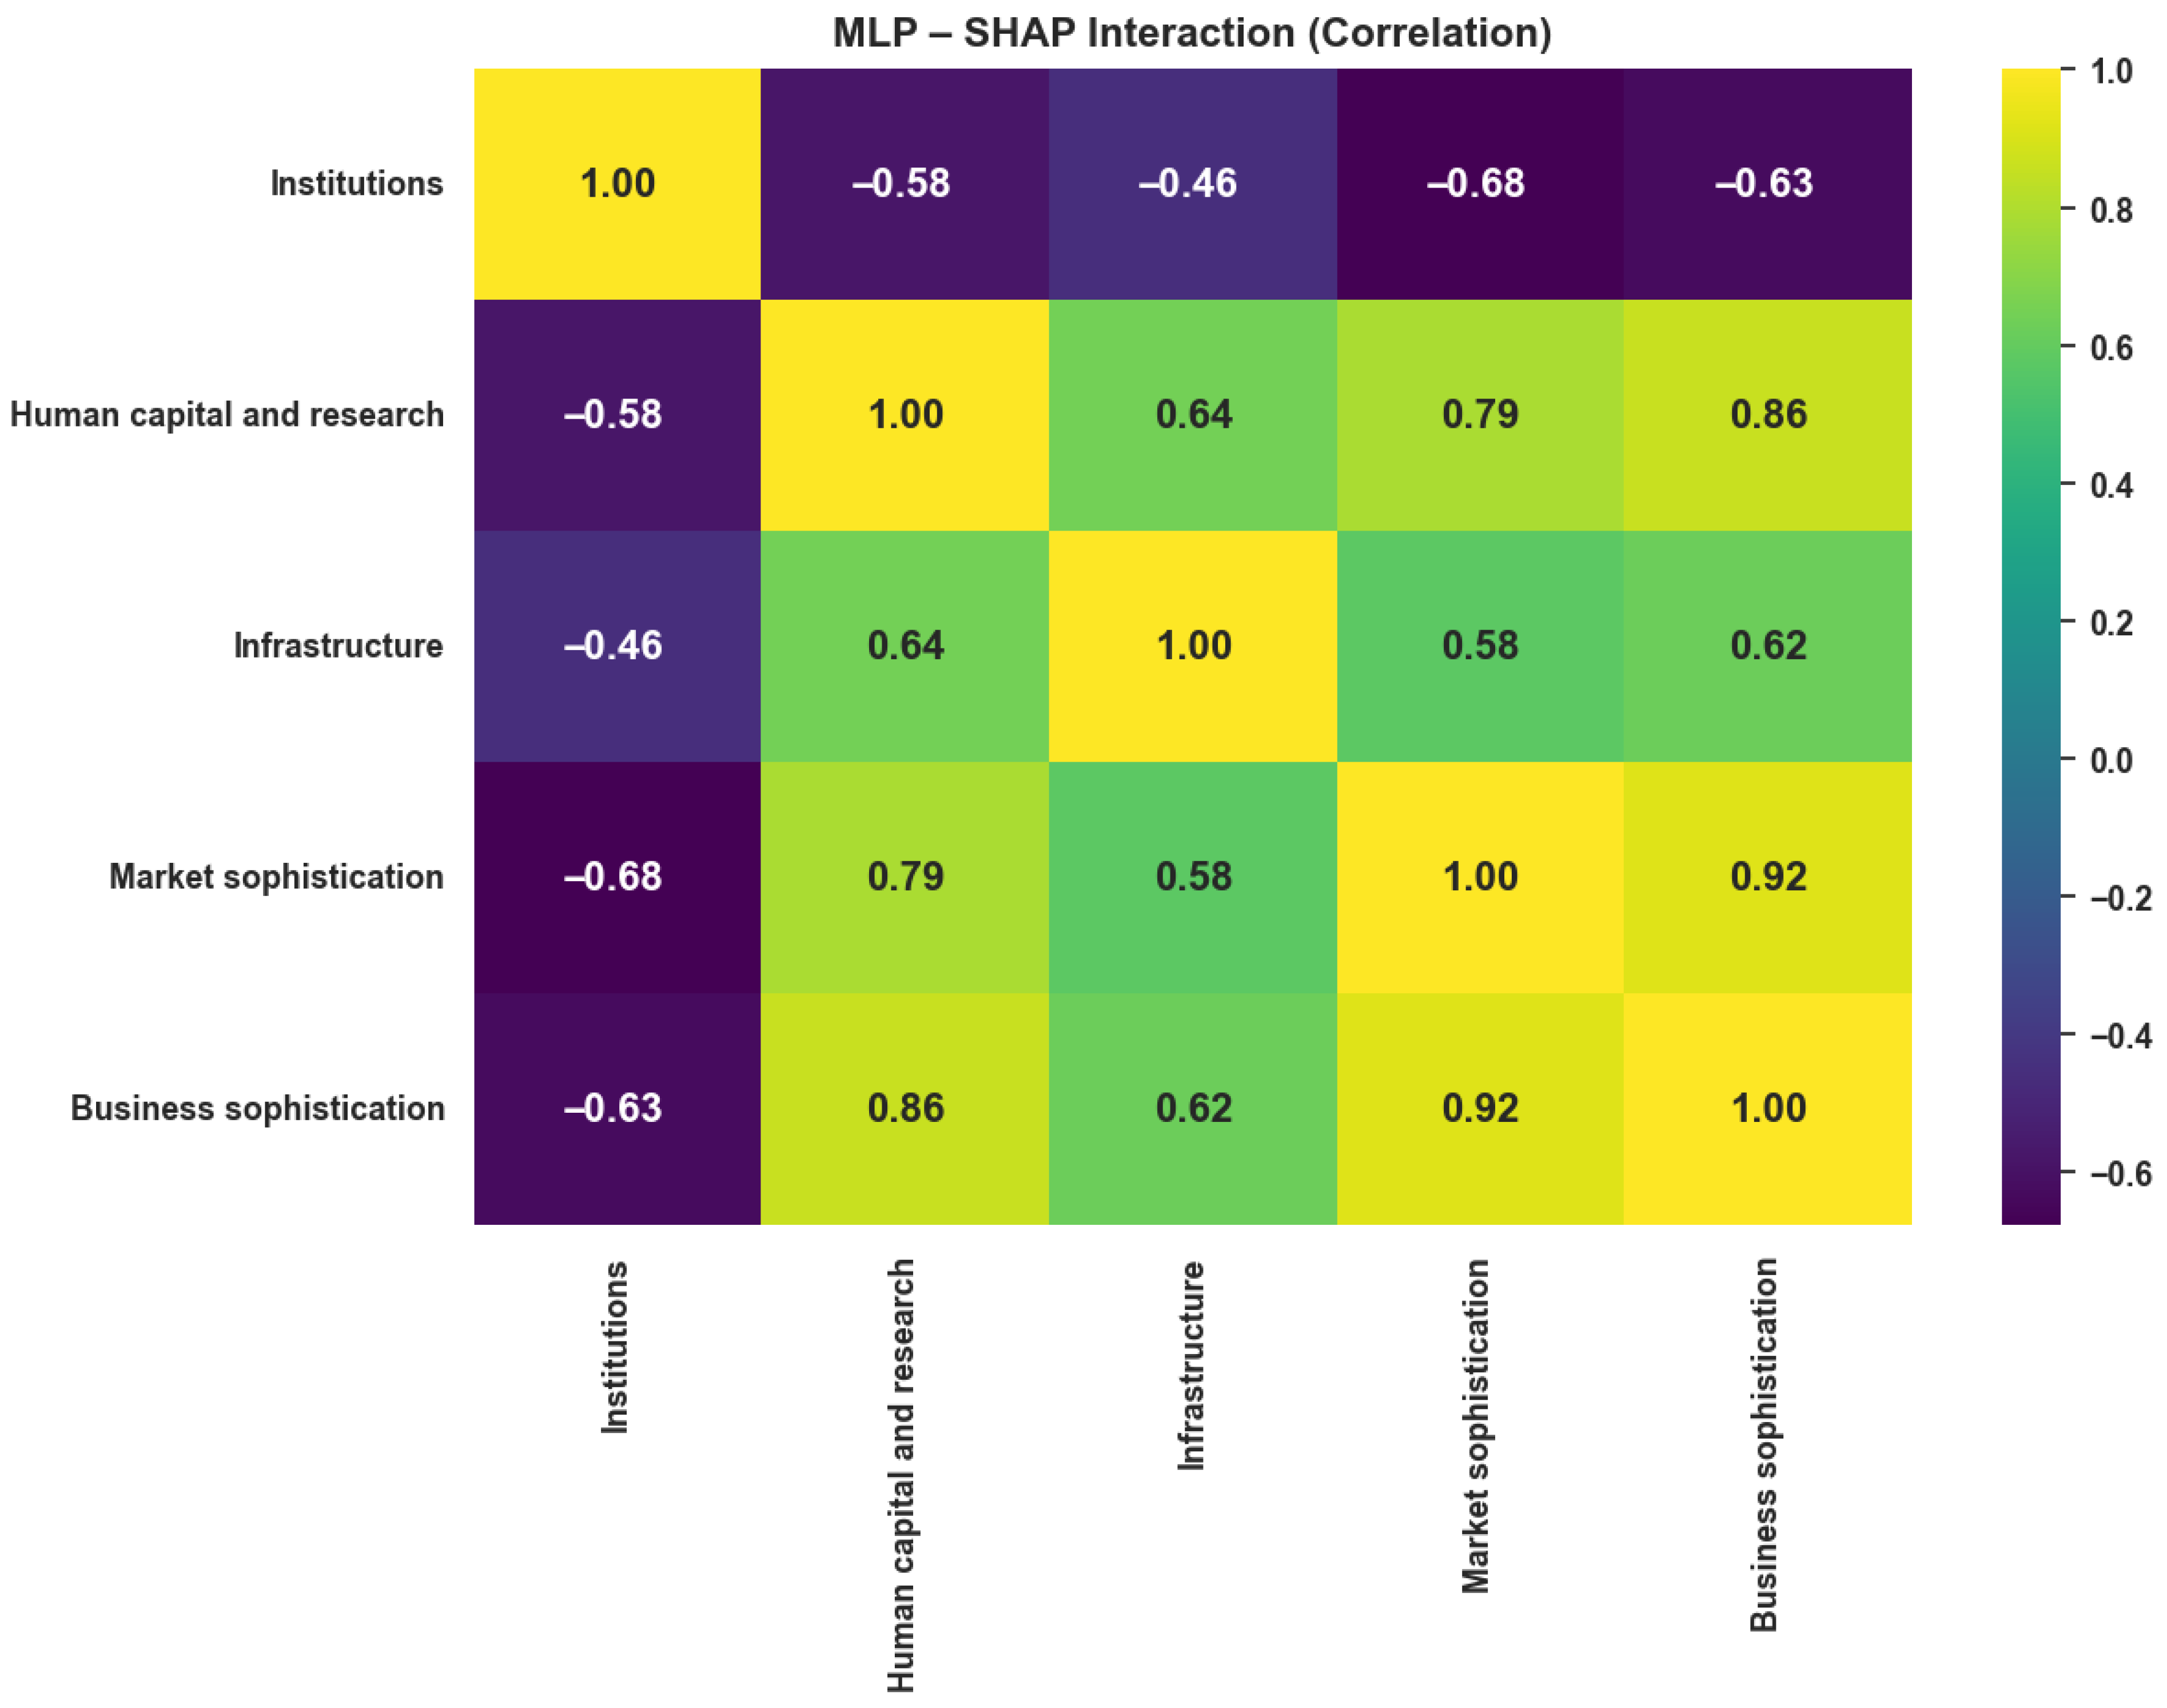
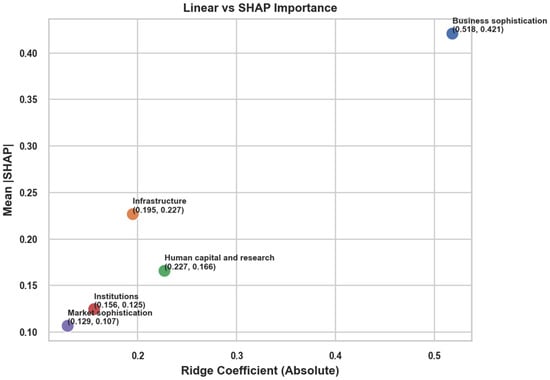
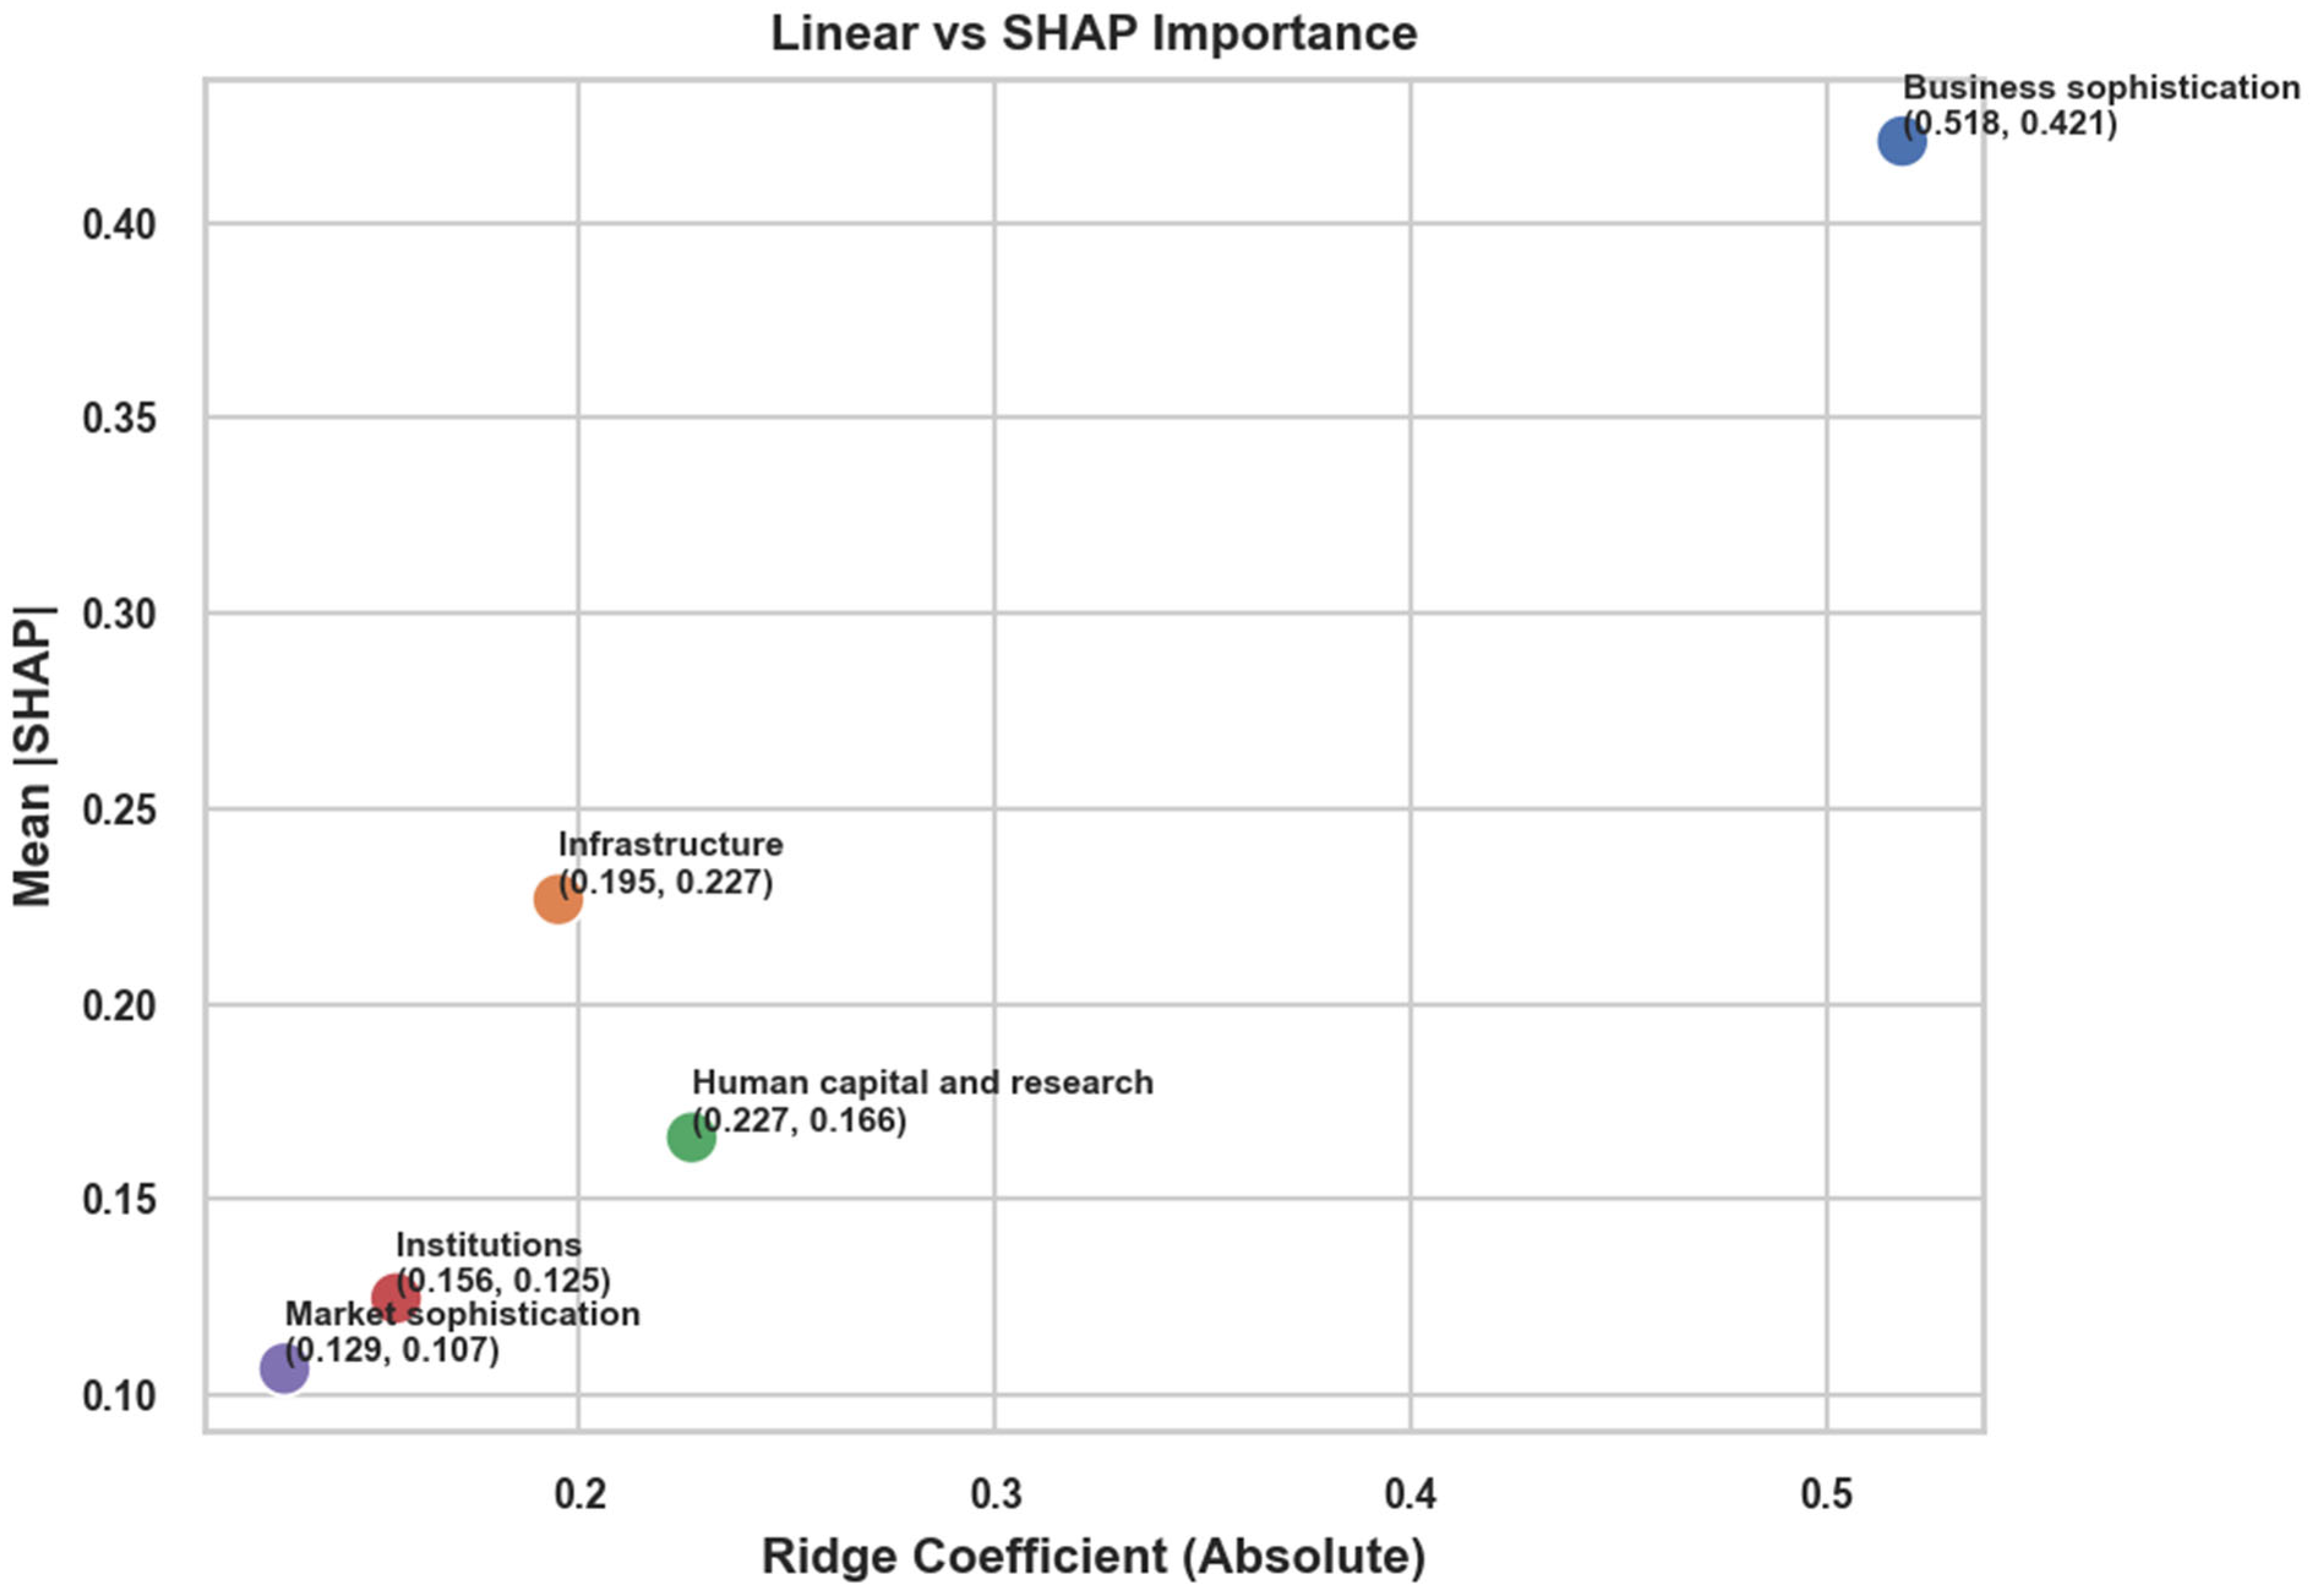
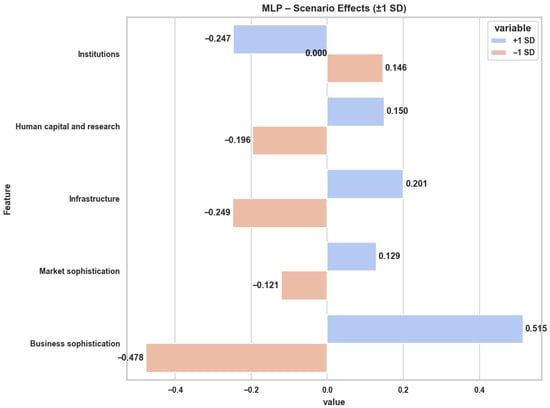
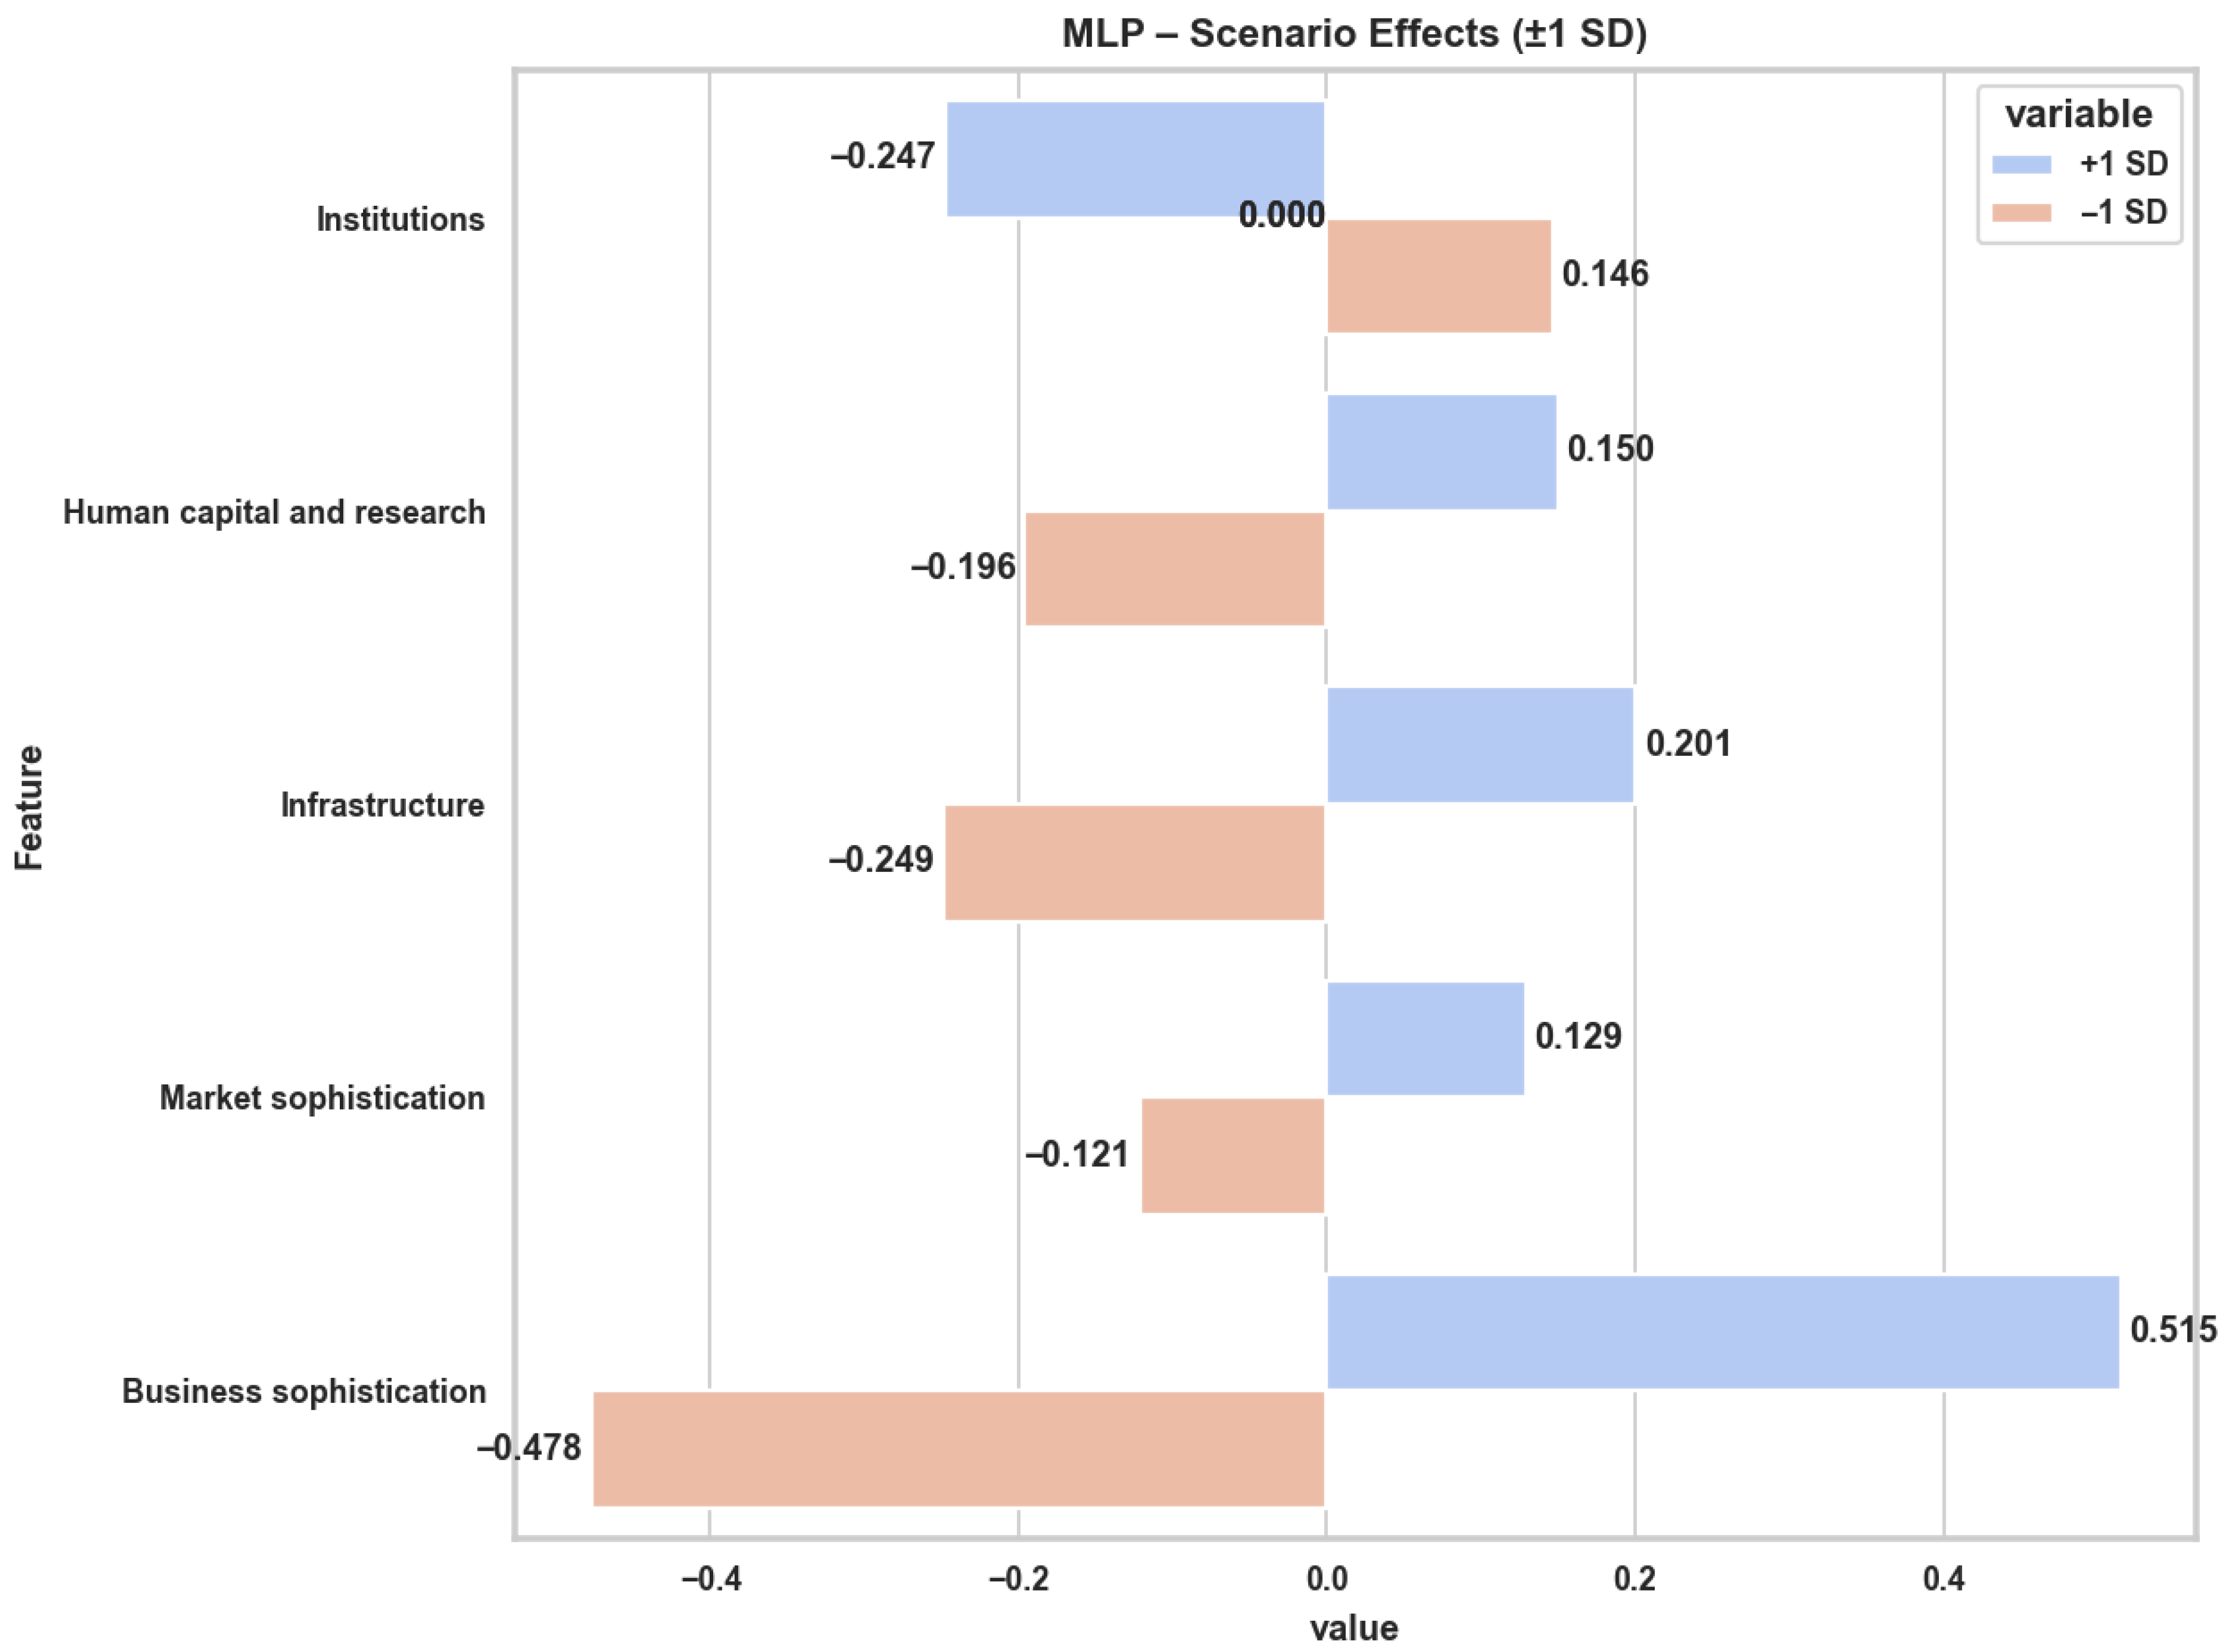
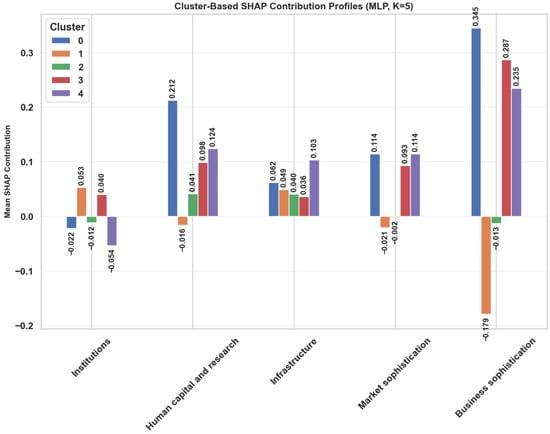
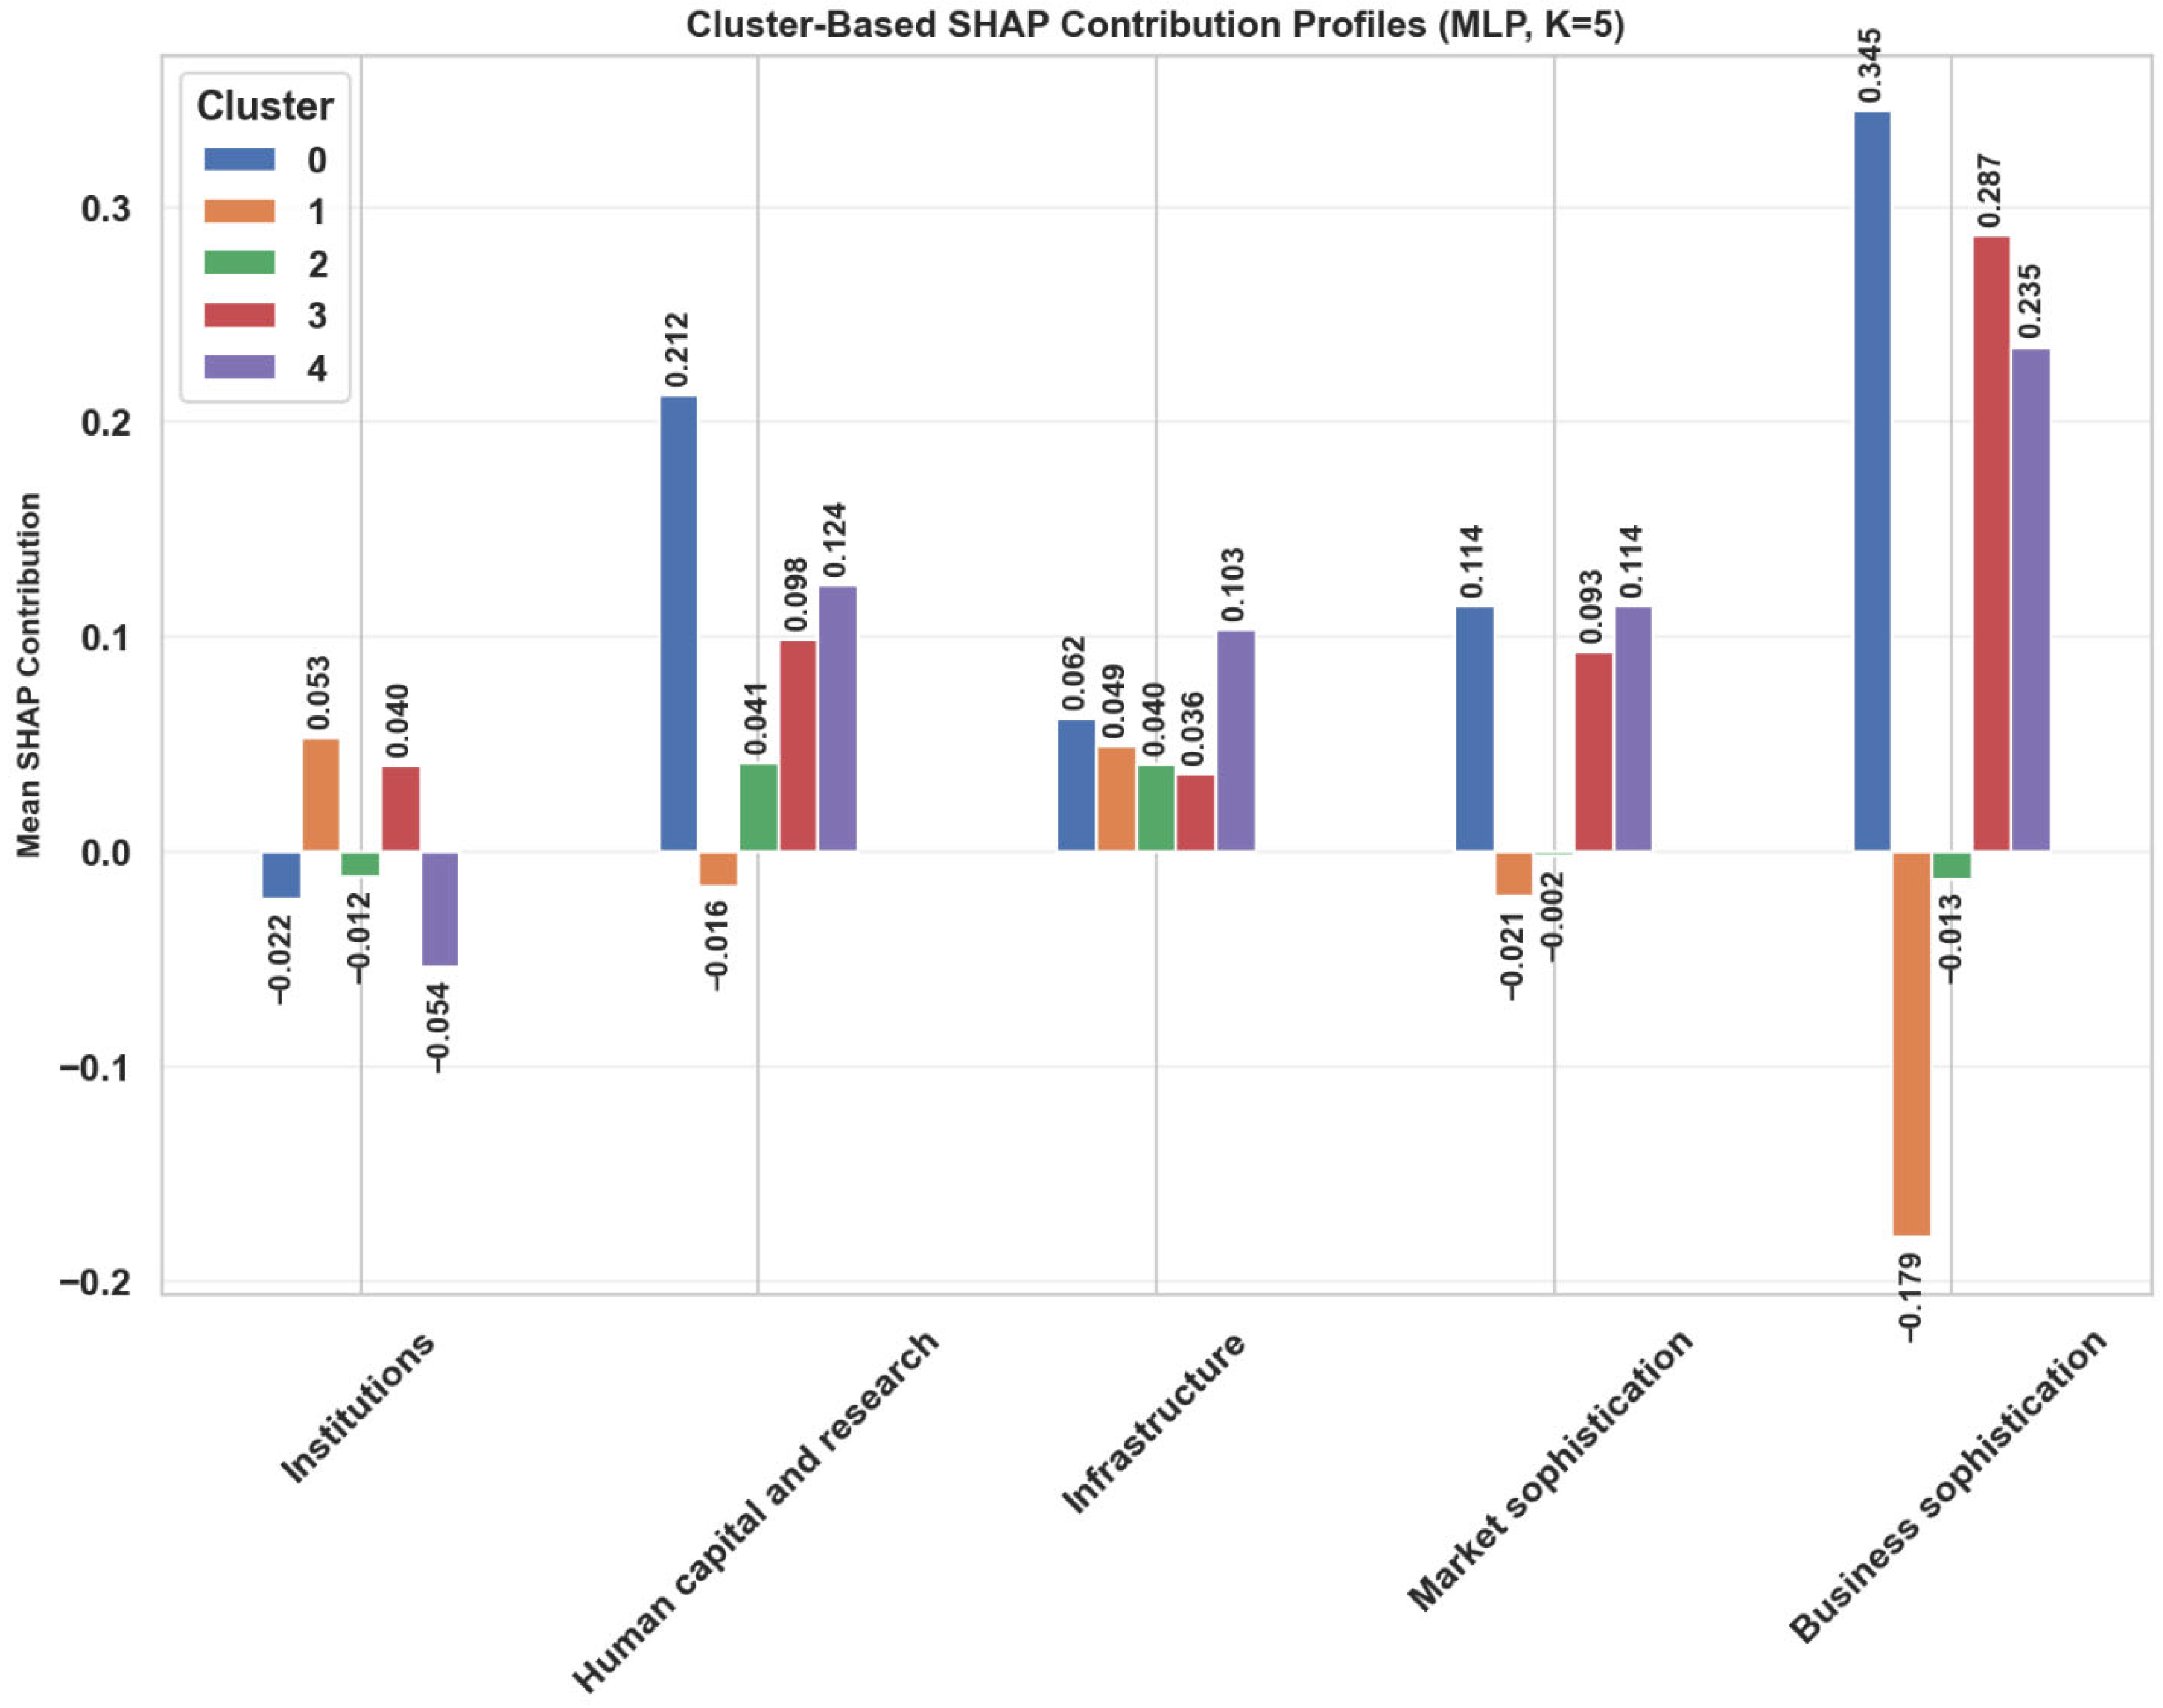
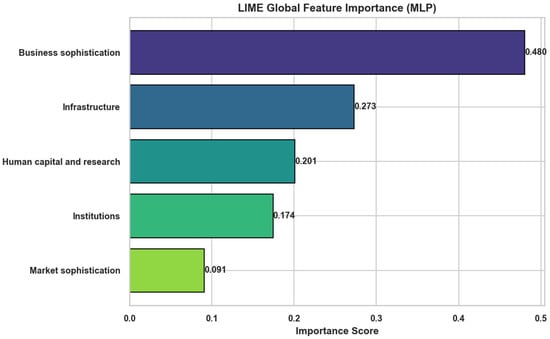
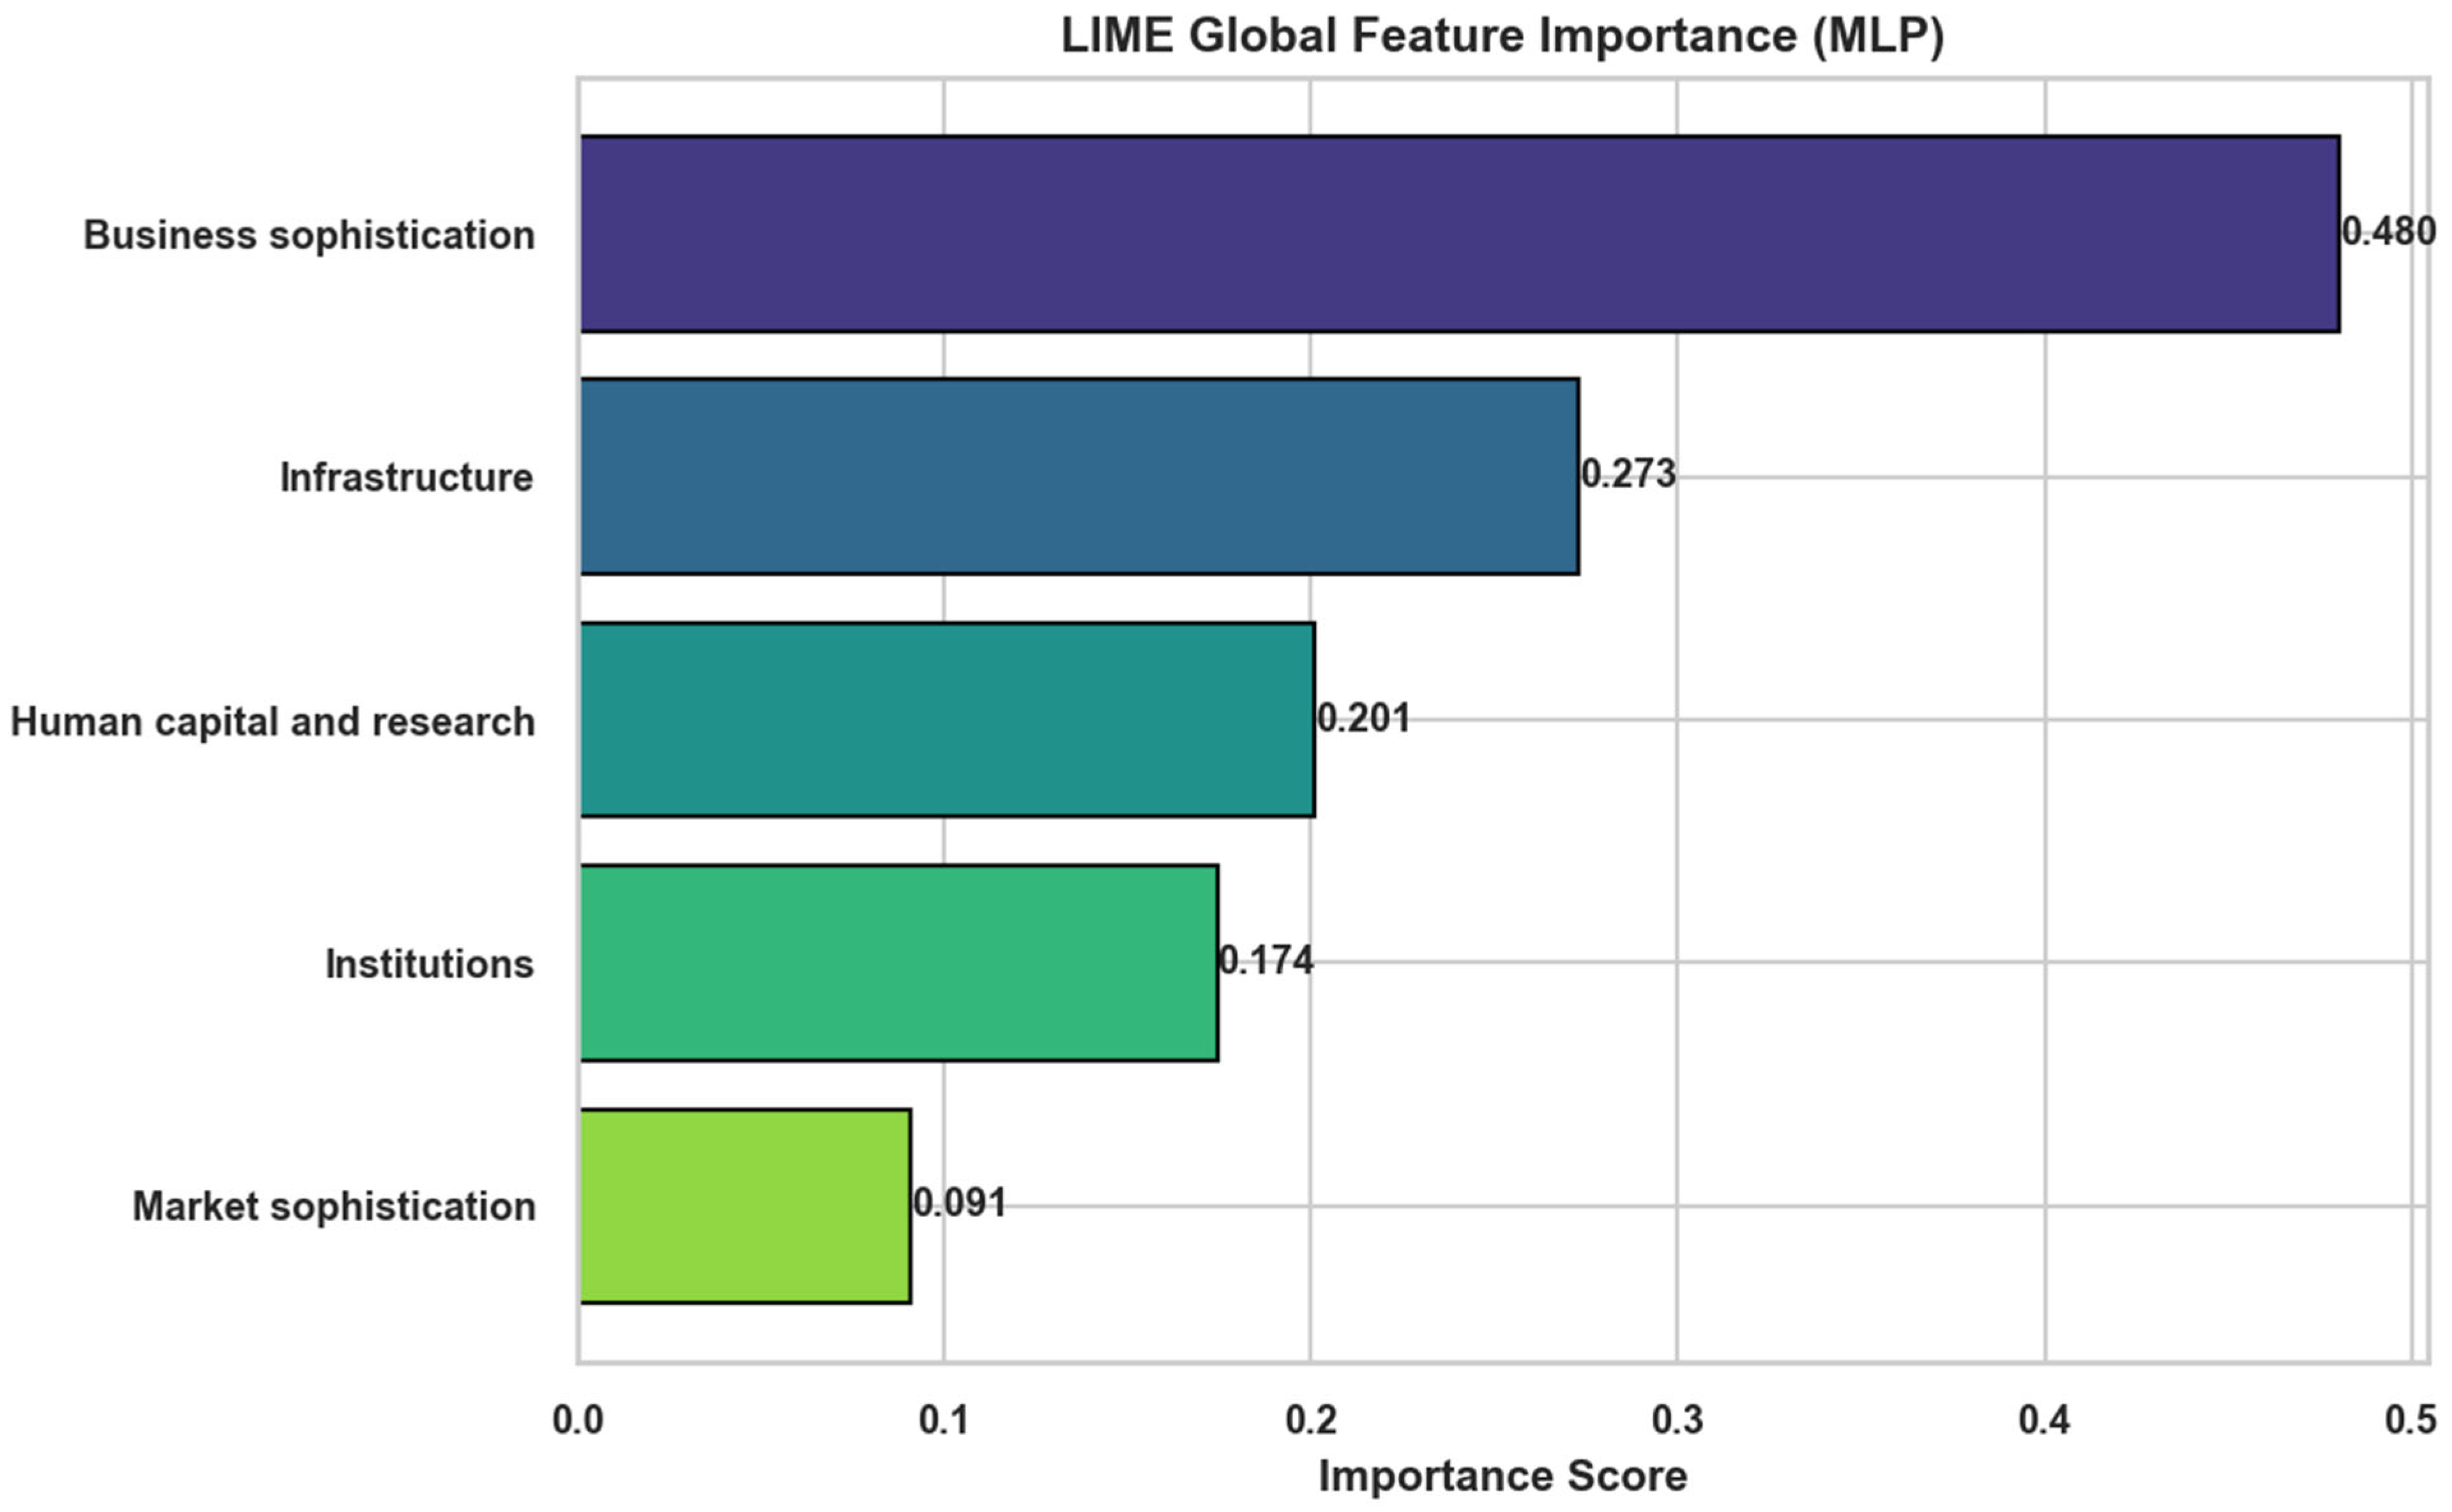
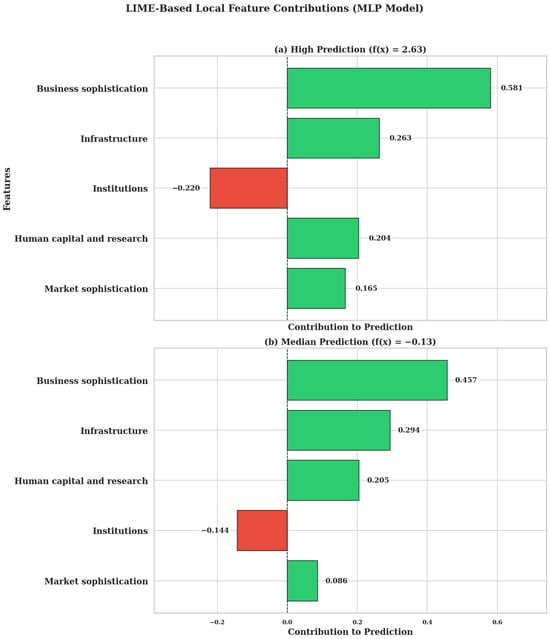
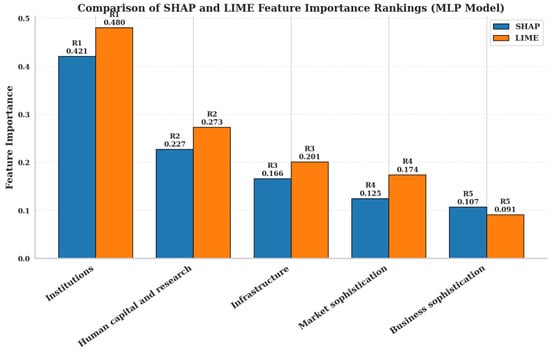
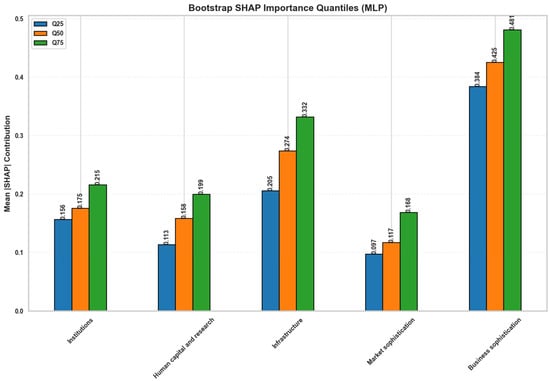
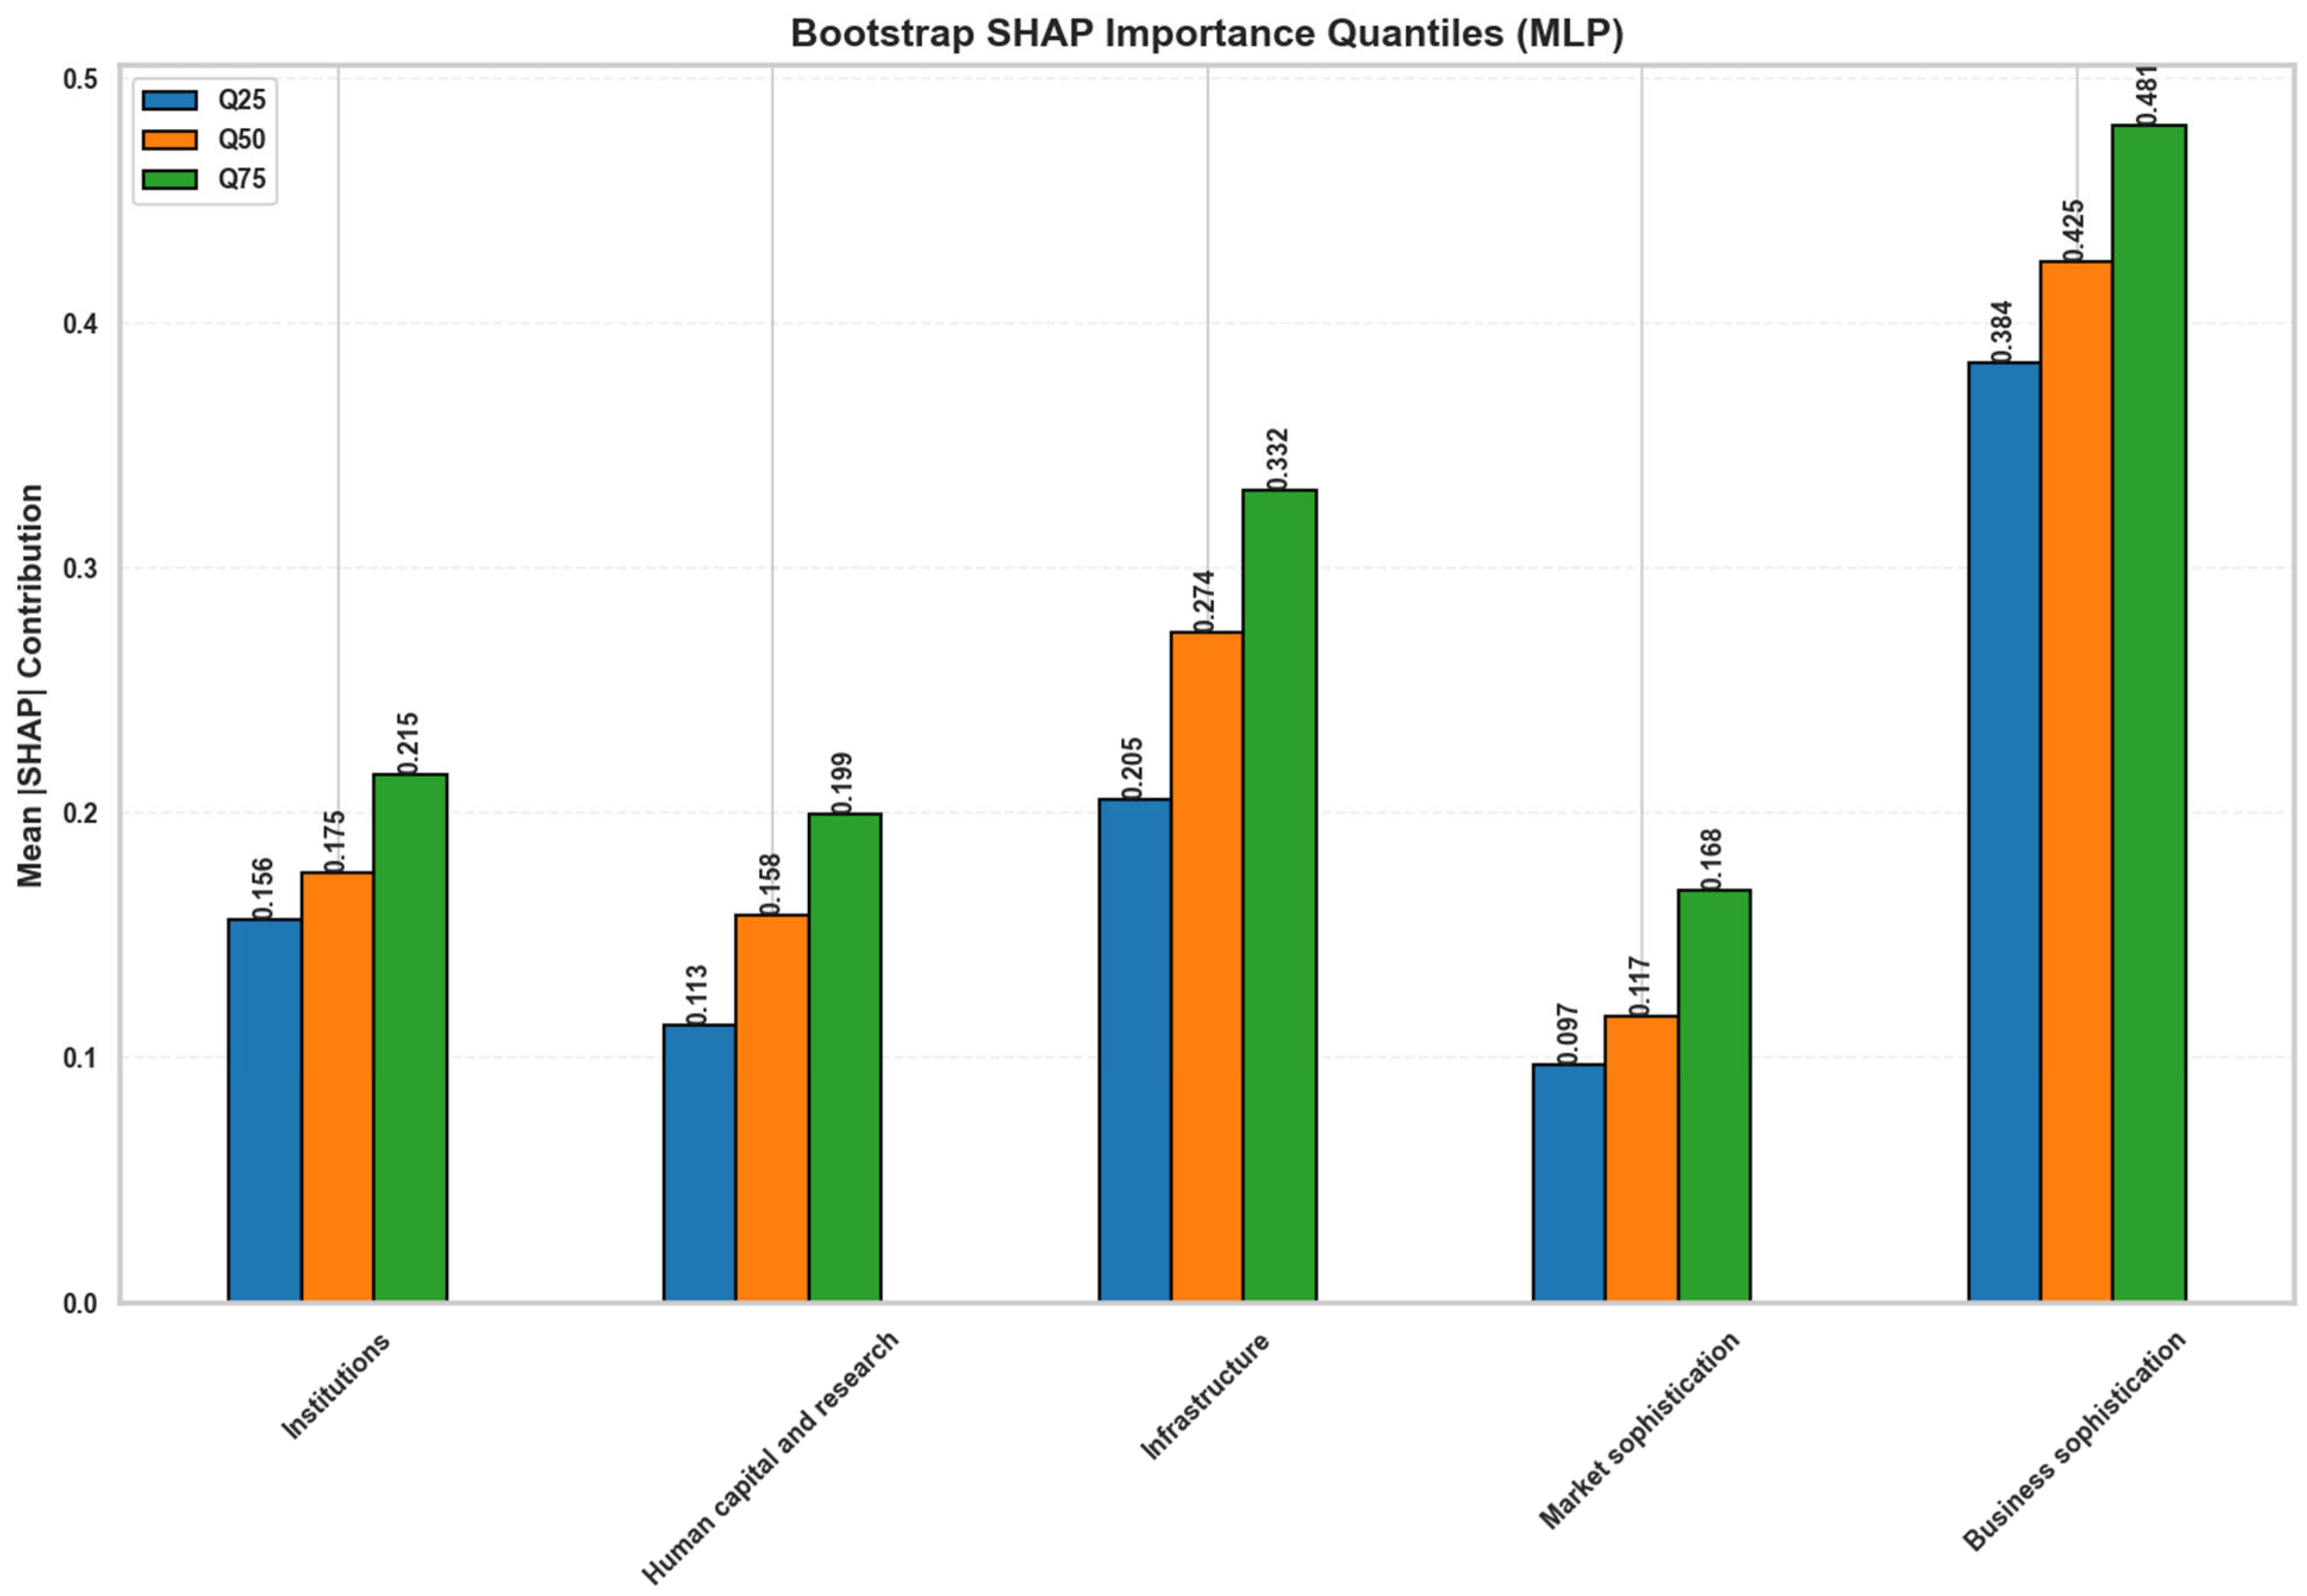
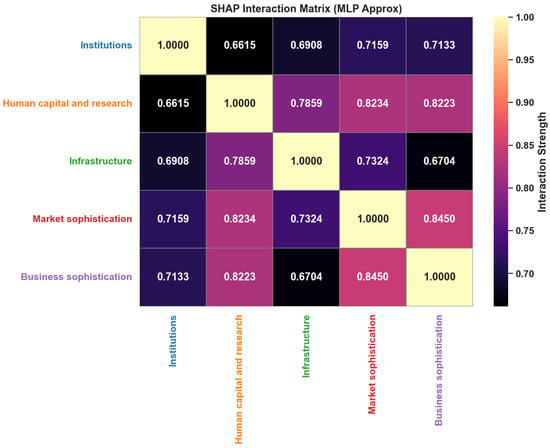
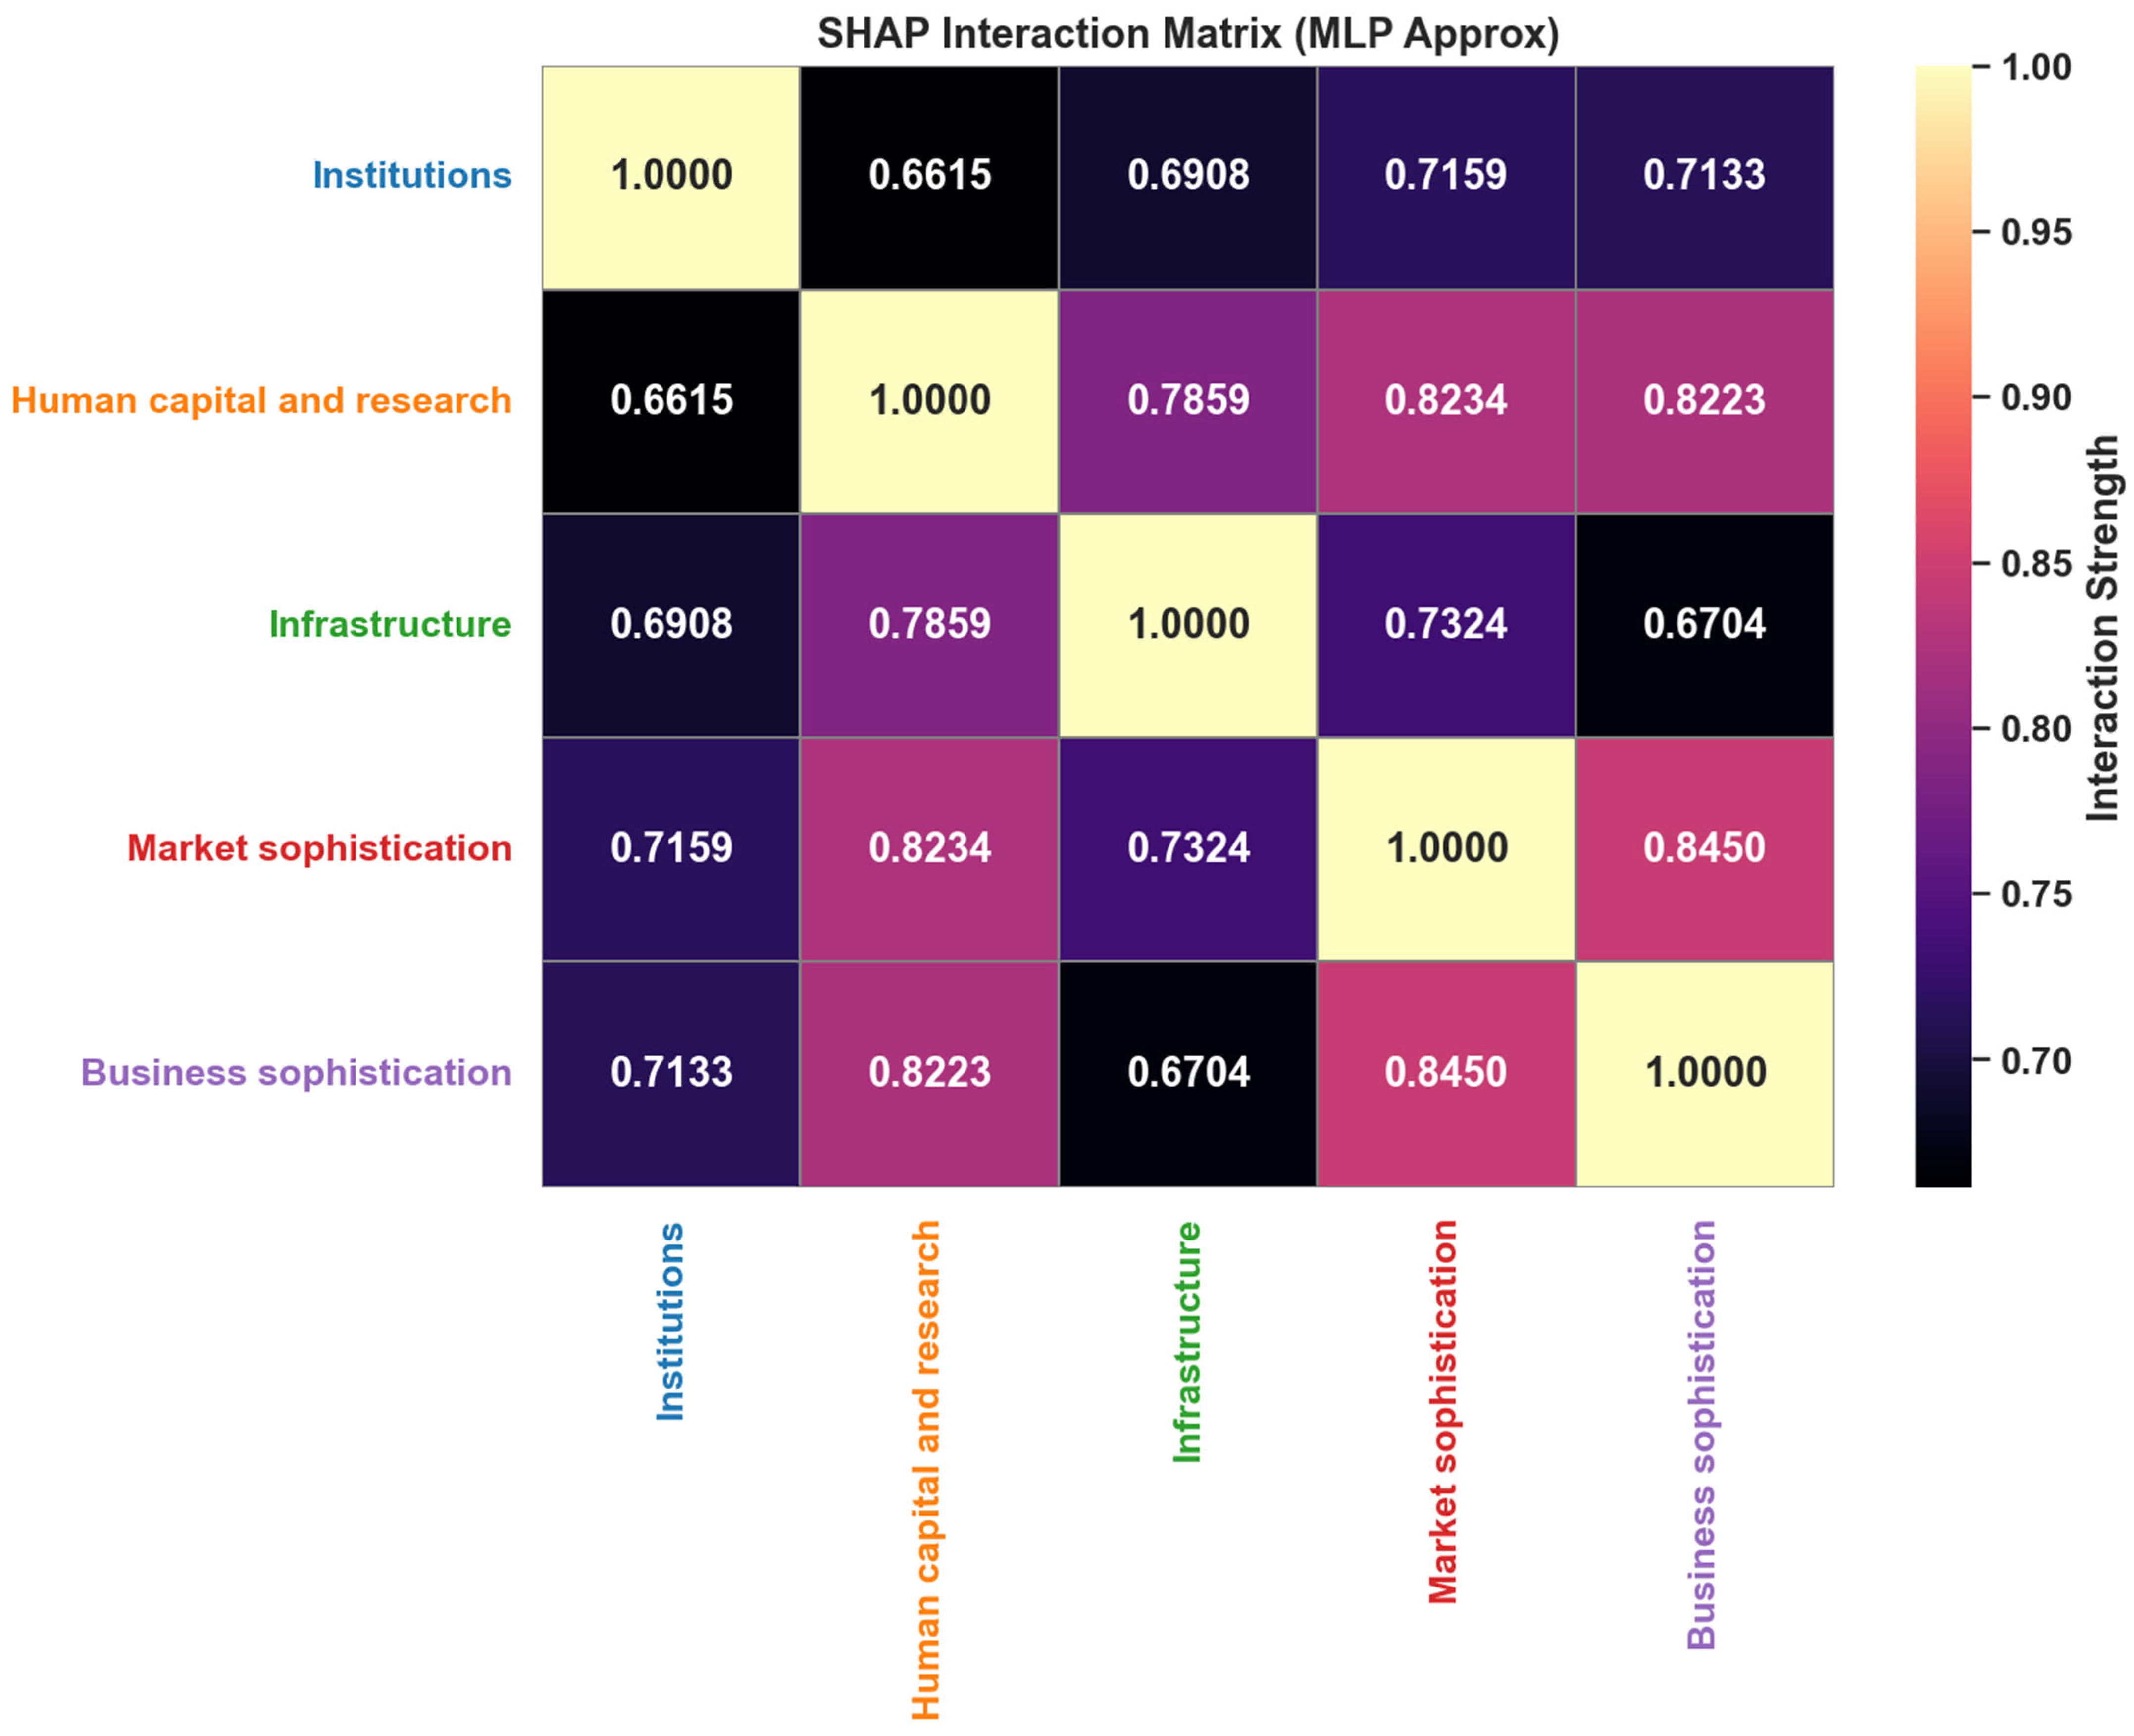
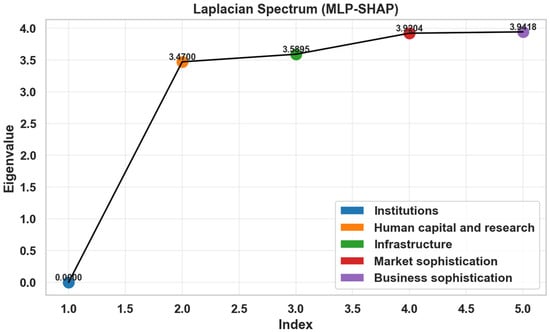
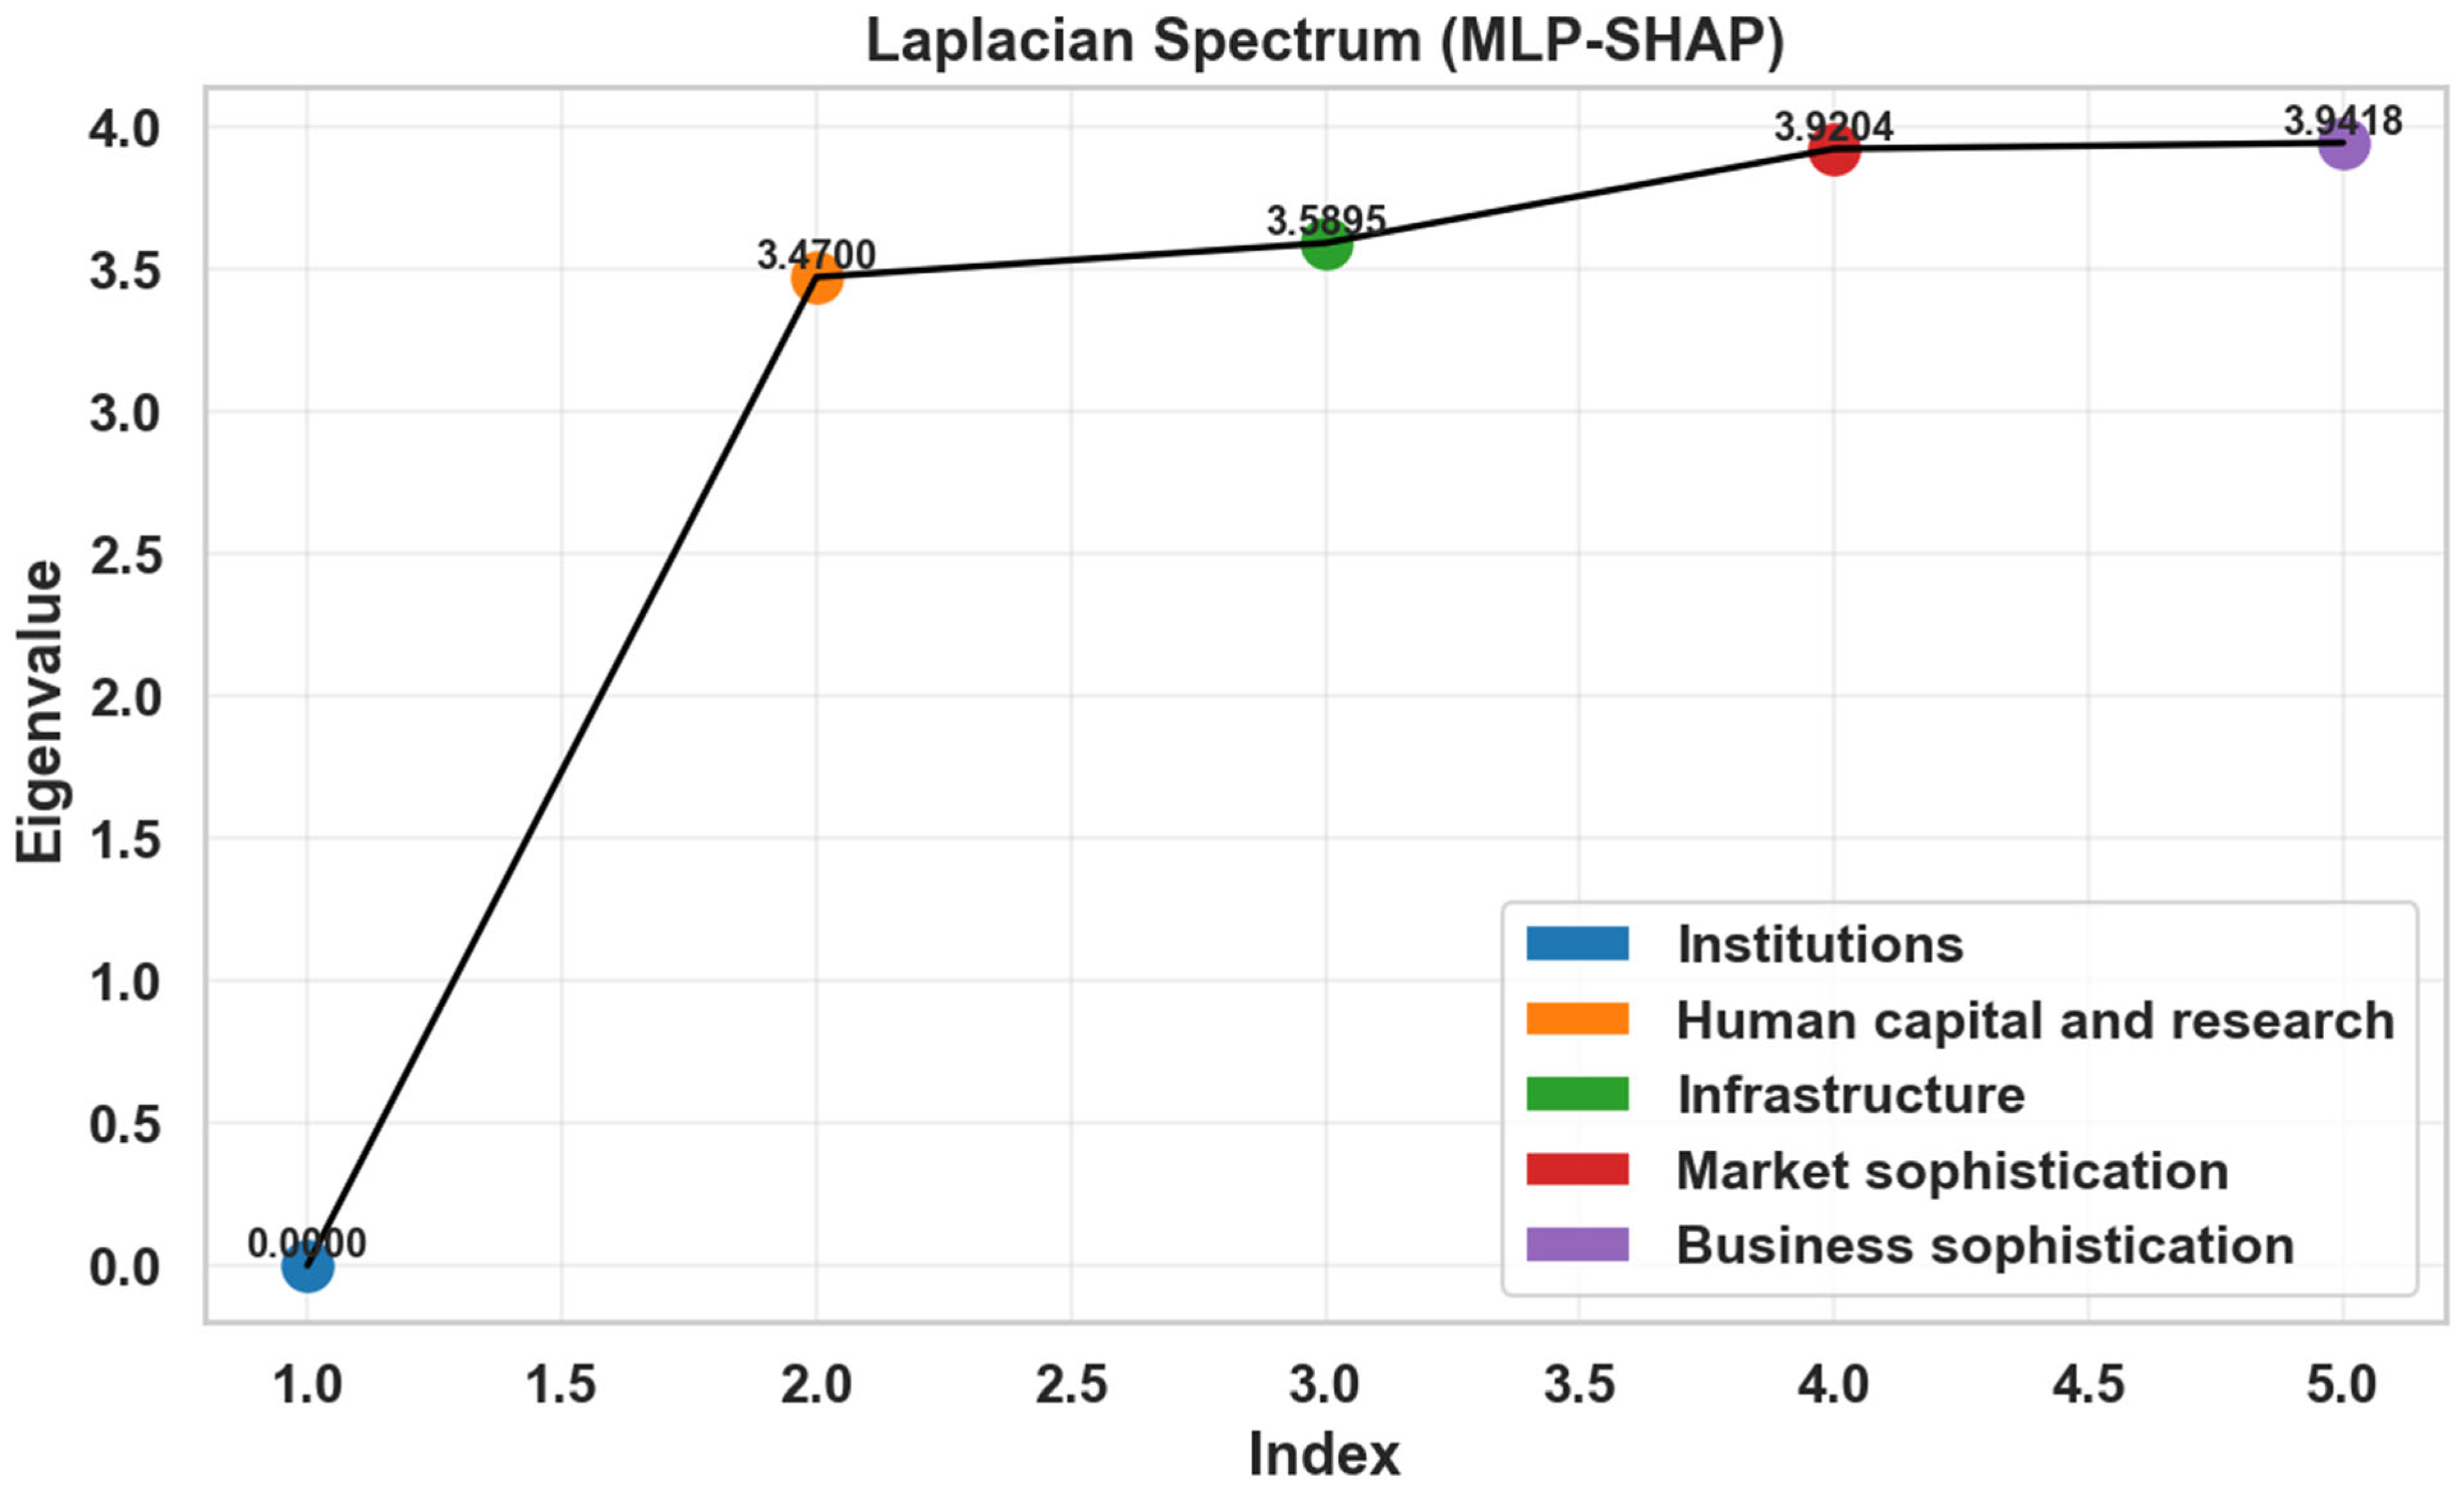
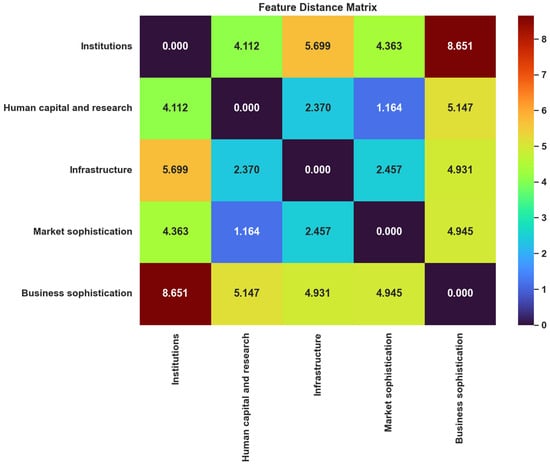
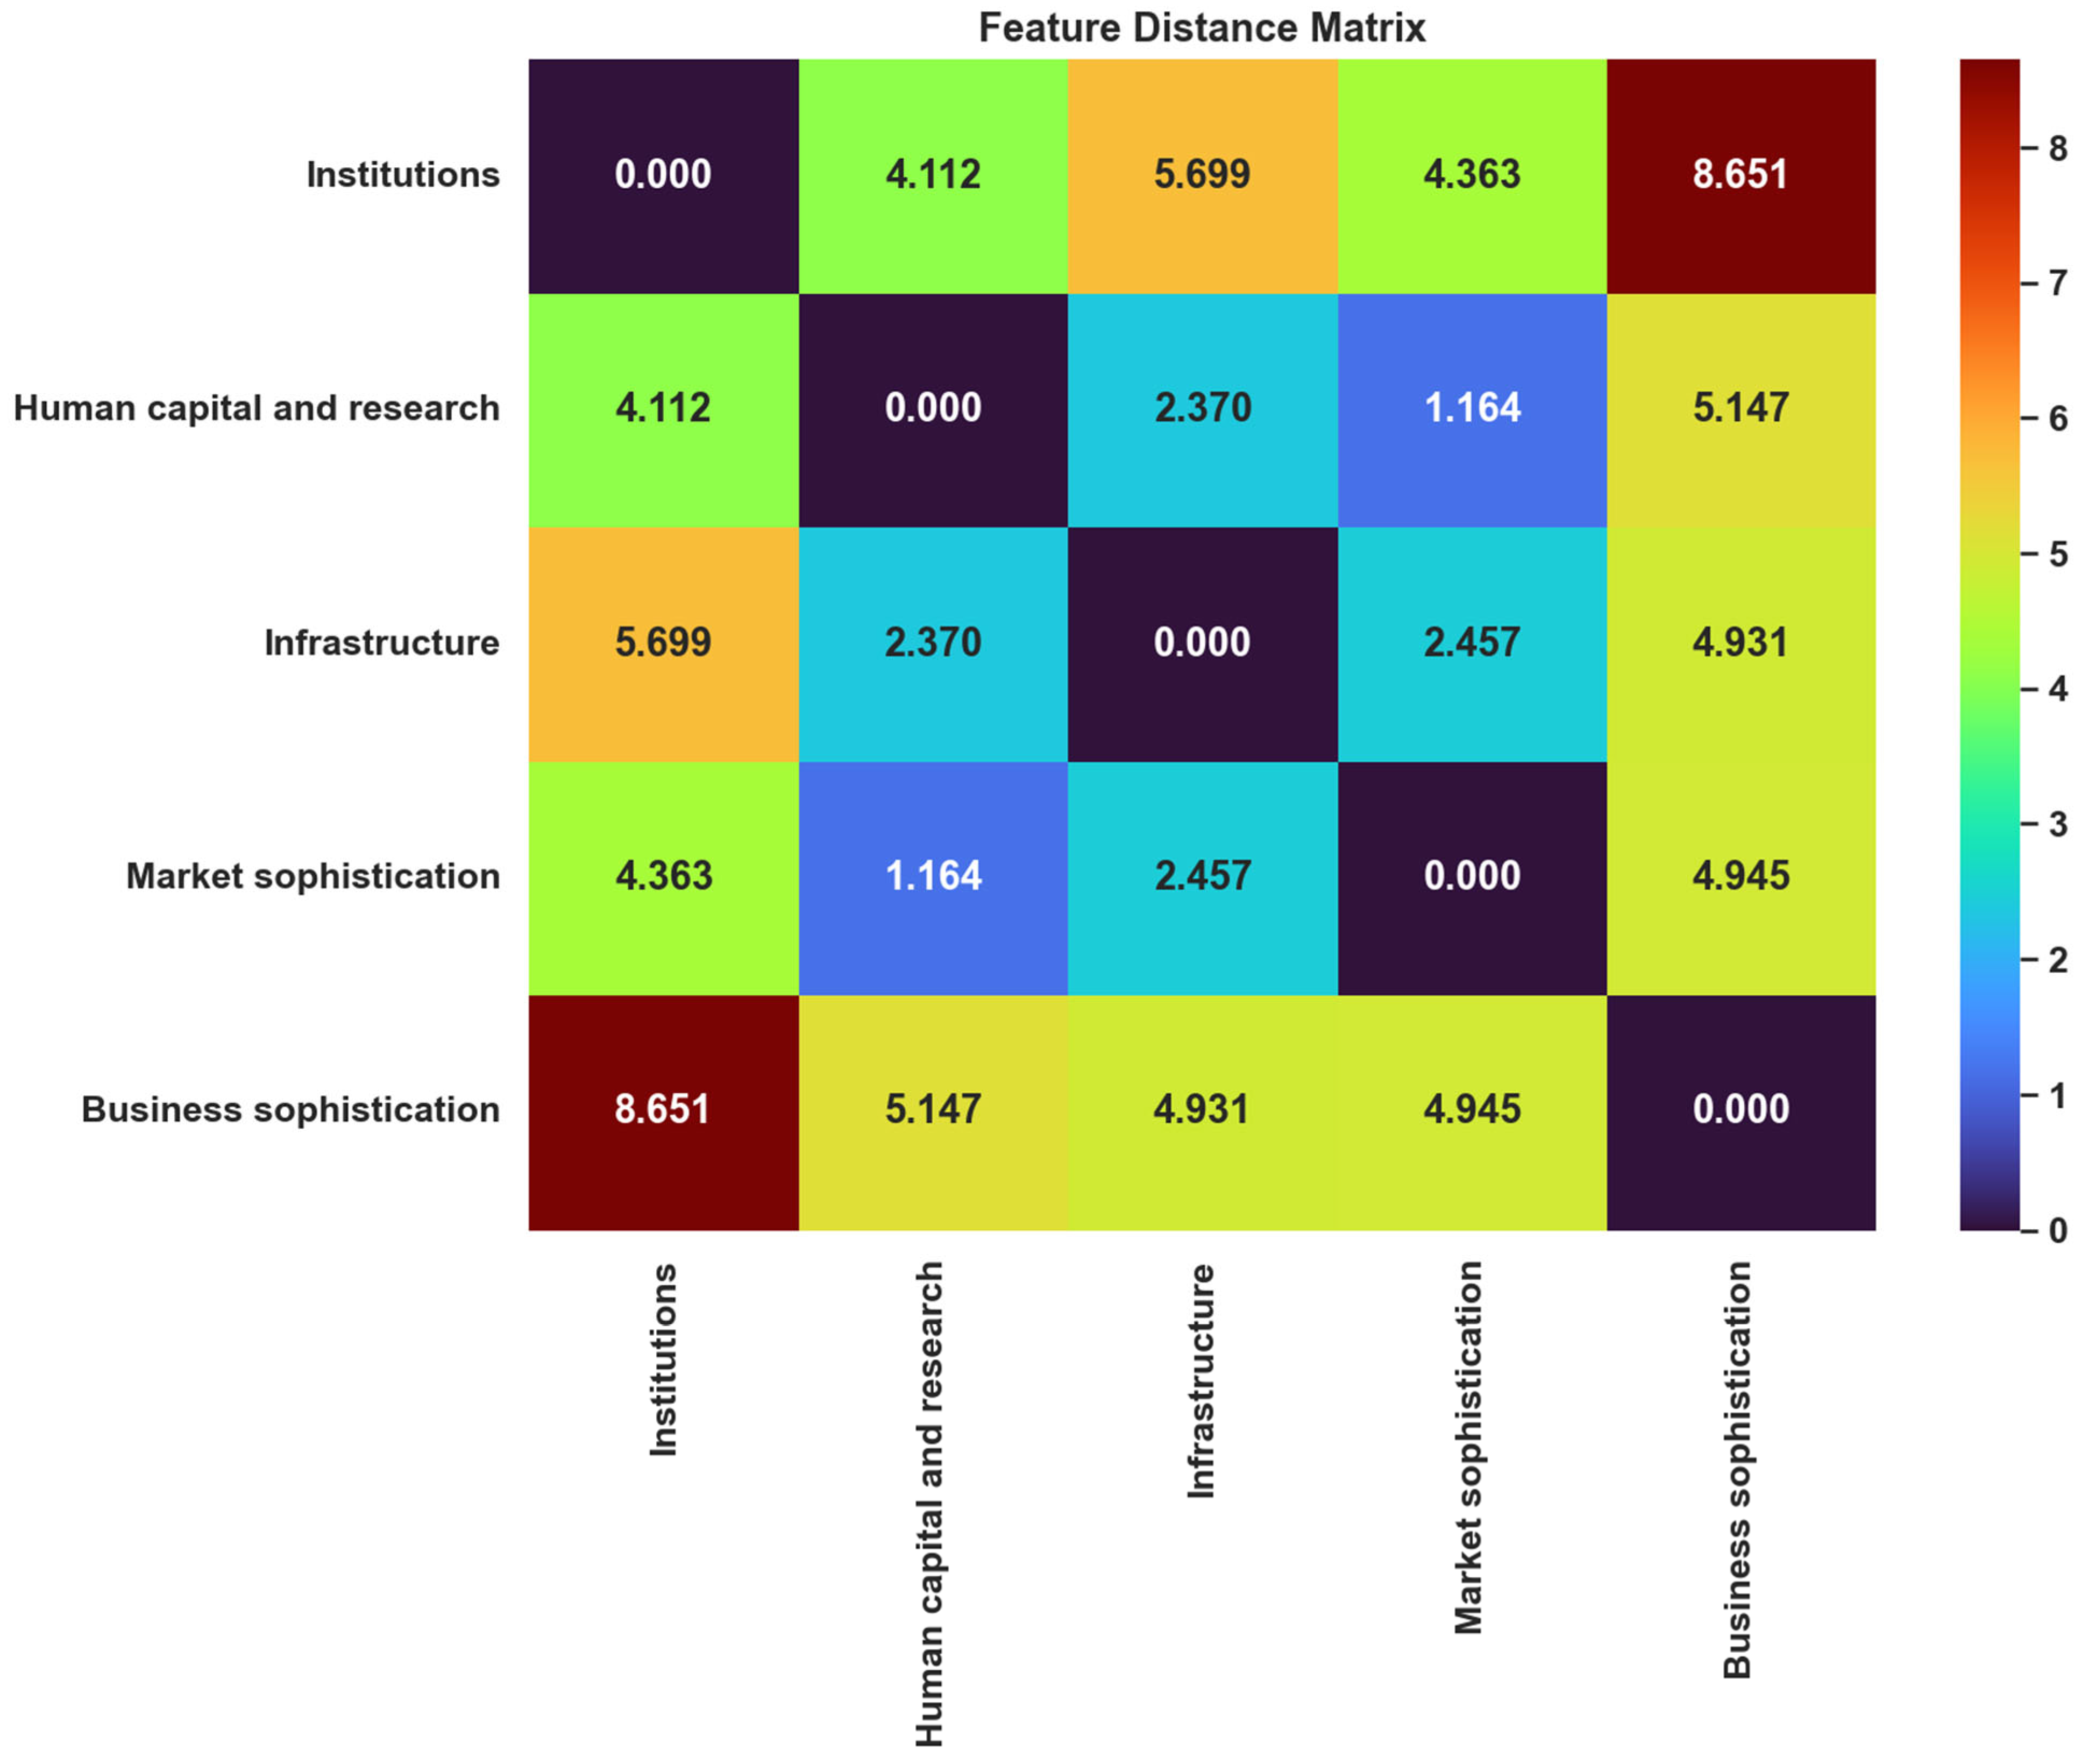
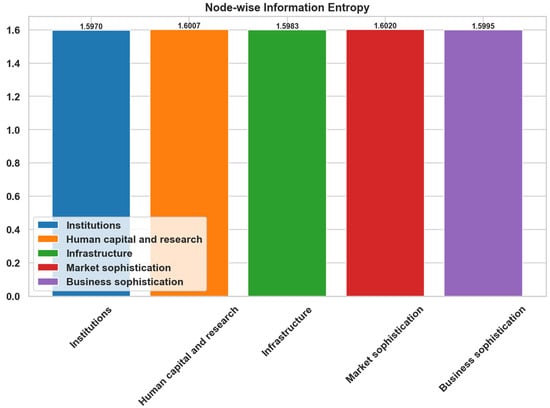
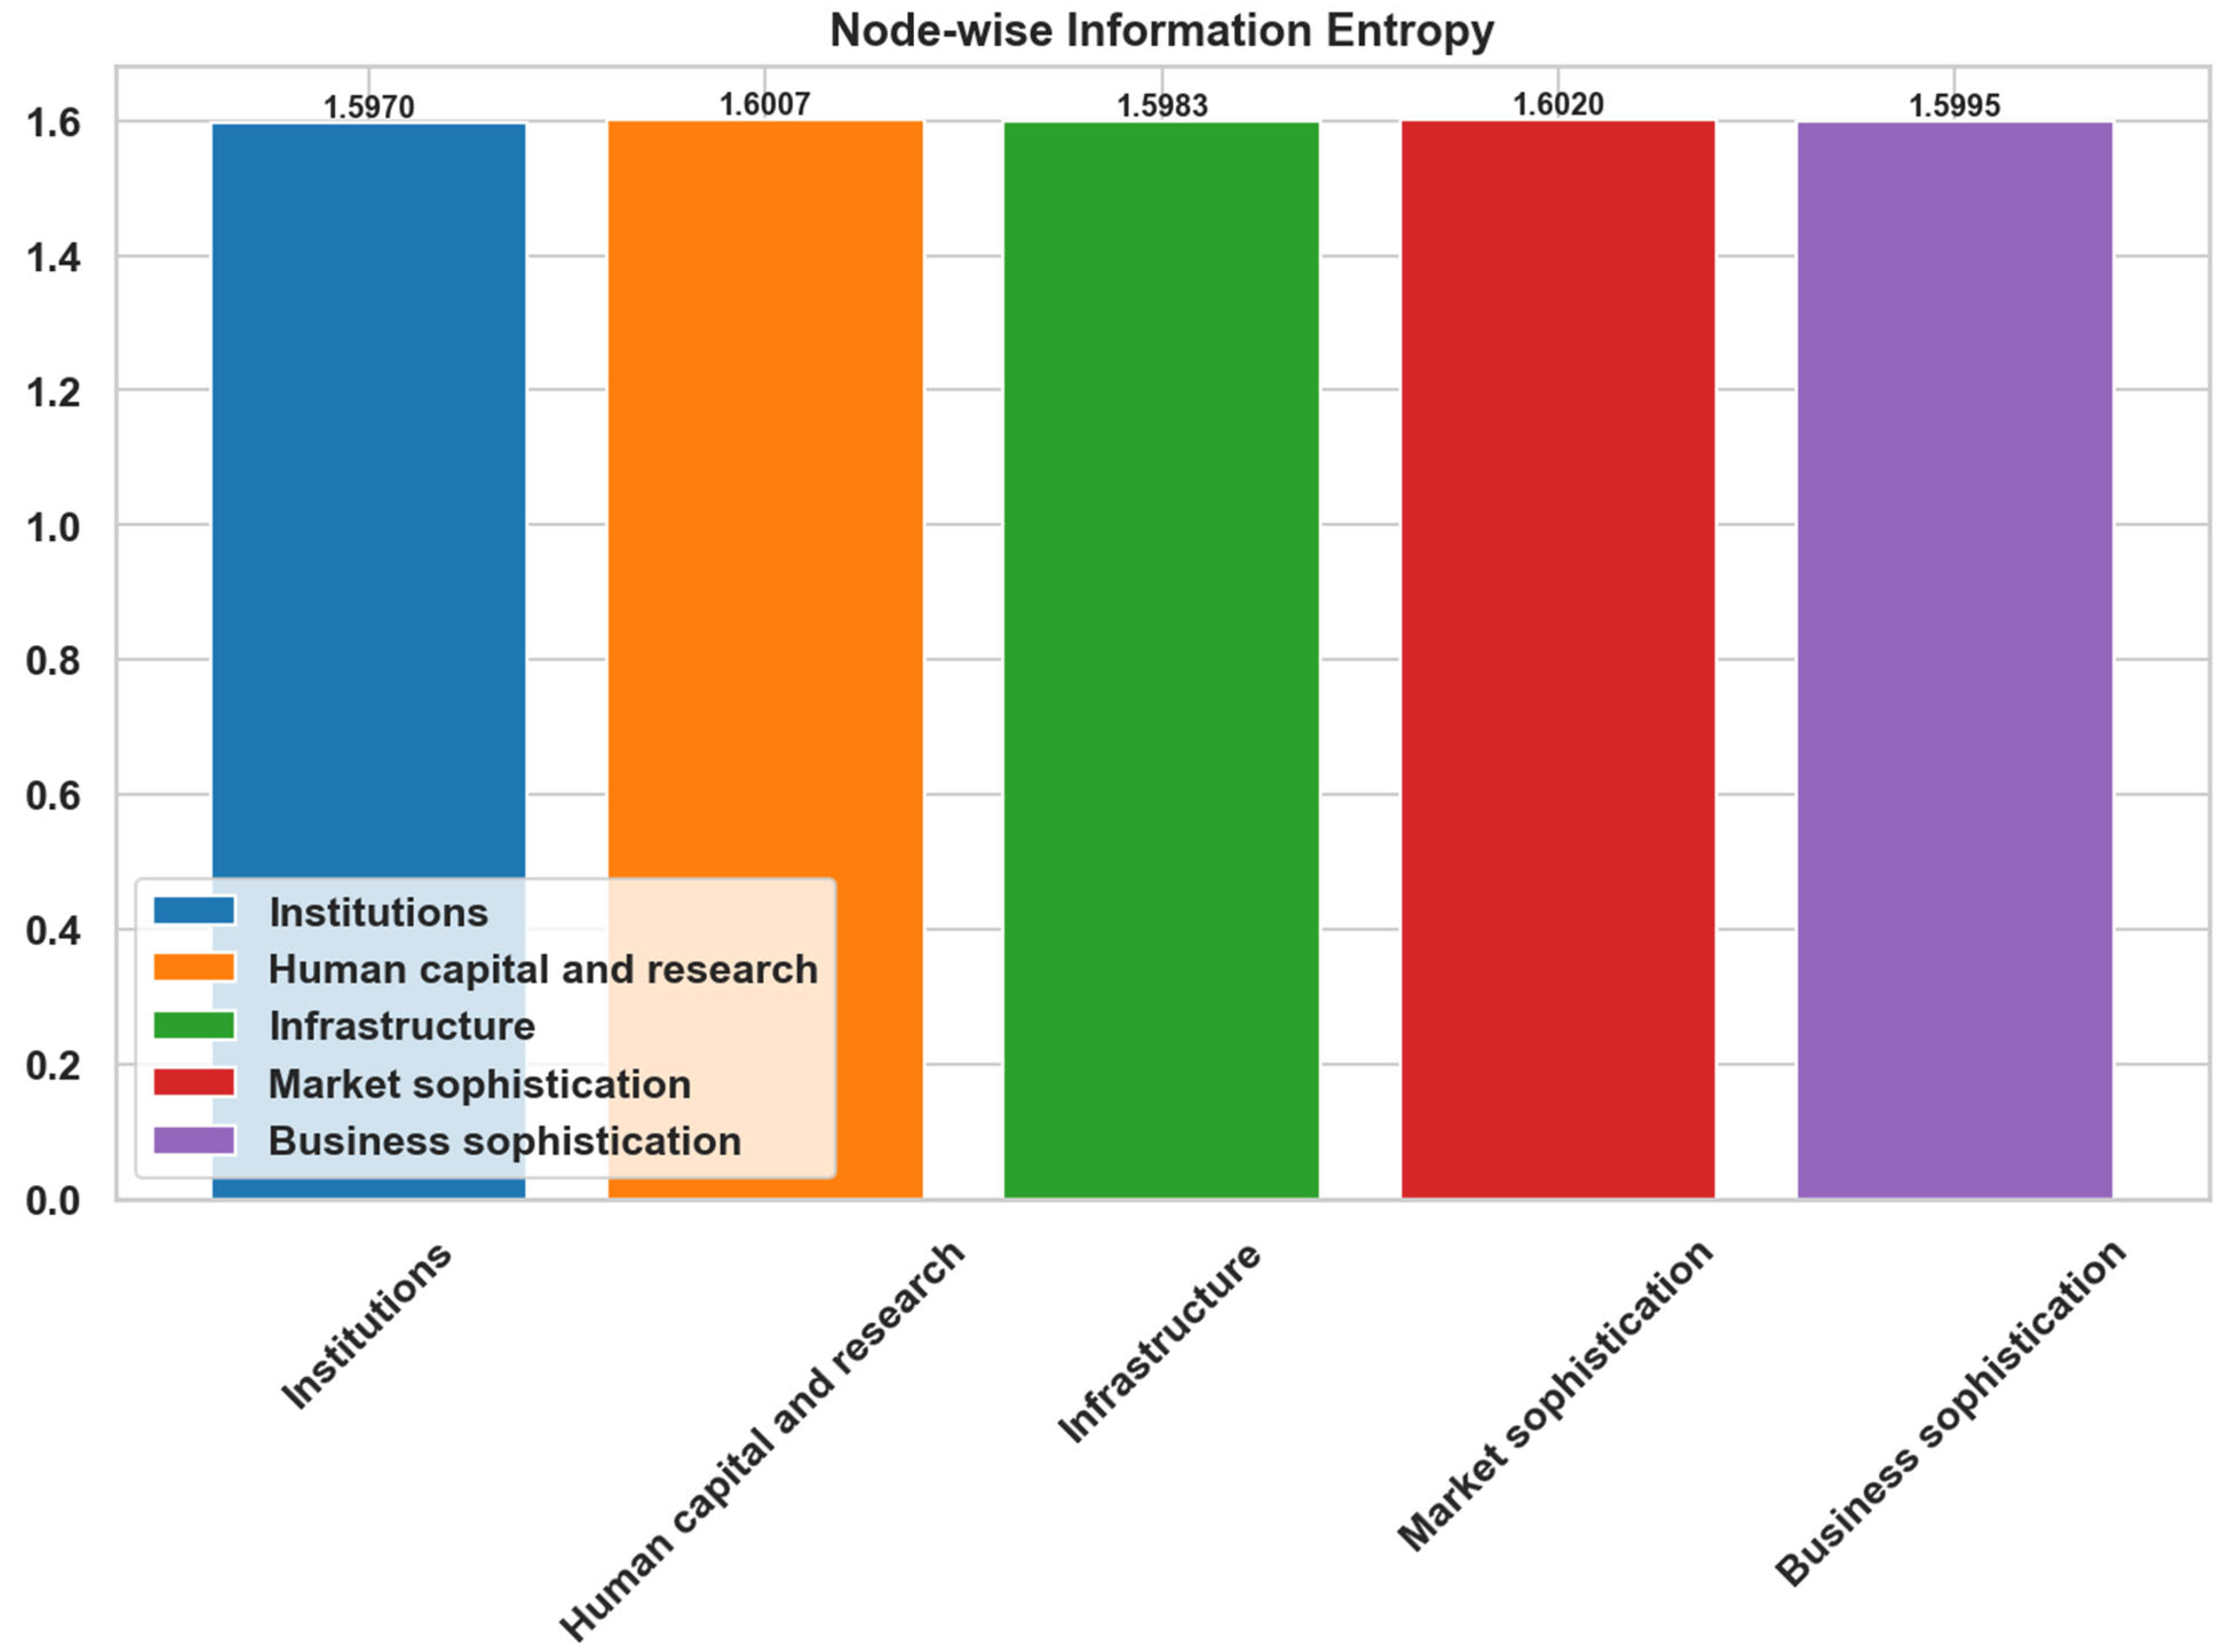

Disclaimer/Publisher’s Note: The statements, opinions and data contained in all publications are solely those of the individual author(s) and contributor(s) and not of MDPI and/or the editor(s). MDPI and/or the editor(s) disclaim responsibility for any injury to people or property resulting from any ideas, methods, instructions or products referred to in the content. |
© 2026 by the authors. Licensee MDPI, Basel, Switzerland. This article is an open access article distributed under the terms and conditions of the Creative Commons Attribution (CC BY) license.