Article

Integrating Sequential Hybrid Oversampling with Decision-Theoretic Threshold Design for Credit Risk Assessment

by
Boulbaba Ben Ammar
1,* and
Zainab Saad Rubaidi
2
1
Department of Computer Science, College of Computer, Qassim University, Buraydah 52571, Saudi Arabia
2
College of Agriculture, Al-Muthanna University, Samawah 66001, Iraq
*
Author to whom correspondence should be addressed.
Mathematics 2026, 14(9), 1467; https://doi.org/10.3390/math14091467
Submission received: 14 March 2026 / Revised: 21 April 2026 / Accepted: 22 April 2026 / Published: 27 April 2026

Abstract

Credit risk assessment under severe class imbalance requires both structured imbalance correction and principled decision rules, yet most studies treat these as independent steps. This study develops a general integrated three-layer framework for credit risk assessment under class imbalance. The first layer introduces Sequential Hybrid Data Oversampling (SHDO), which sequentially applies five complementary oversampling techniques to enrich minority-class representation in mixed-type credit data. The second layer formulates credit approval as a decision-theoretic optimisation problem: a closed-form optimal threshold is derived under asymmetric costs, extended to constrained portfolios via a Lagrangian formulation with Karush–Kuhn–Tucker conditions, and further extended to minimax-robust decision making under estimation uncertainty. The third layer compares eleven classifiers under a unified evaluation protocol with an ablation isolating the effect of SHDO. The framework is empirically validated on the Home Credit Default Risk dataset, which is used as an illustrative case study rather than defining the scope of the contribution. On the held-out test set, XGBoost trained with SHDO achieves the highest minority-class F1 (0.254), while gradient-boosted models collectively attain ROC-AUC values of 0.713–0.750, outperforming classical baselines (0.540–0.620). The ablation confirms that without SHDO, all models exhibit near-zero minority-class recall despite adequate ranking ability. SHAP analysis on XGBoost confirms that the learned risk structure aligns with established creditworthiness determinants. The decision framework converts these probability estimates into analytically justified approval thresholds responsive to economic parameters, institutional constraints, and estimation uncertainty.

1. Introduction

1.1. Background and Motivation

Credit risk assessment remains central to contemporary financial risk management [1]. For many years, practical credit decisioning relied on logistic regression and linear discriminant analysis—models valued for their interpretability and regulatory acceptance [2]. However, modern lending generates large, heterogeneous datasets where nonlinearities and interaction effects carry substantial predictive information. This has motivated flexible machine learning approaches [3,4,5].
Among gradient boosting methods, XGBoost [6] extends the gradient boosting framework with regularised objective functions and efficient parallel tree construction. LightGBM [7] achieves efficiency through histogram-based splitting and gradient-based one-side sampling. CatBoost [8] handles categorical features natively. All three methods scale well to large tabular credit datasets [9,10].
Two practical challenges remain underexplored. First, severe class imbalance—defaults typically represent fewer than 10% of observations—degrades minority-class detection even when ranking performance is adequate. Most studies address imbalance through a single technique, but sequential hybrid strategies for mixed-type data have received limited attention. Second, most studies focus on predictive benchmarking without providing a formal decision-theoretic bridge between estimated probabilities and approval policies.

1.2. Research Objectives

The primary objective of this study is to develop a general integrated framework for credit risk assessment under class imbalance, combining imbalance correction, probability estimation, and economically optimal decision making within a single analytical structure. The Home Credit Default Risk dataset serves as an empirical validation setting for instantiating and evaluating the framework, rather than defining its scope of applicability. The framework is pursued through three layers:
1.
Imbalance correction: Sequential Hybrid Data Oversampling (SHDO; [11]), a structured pipeline applying five complementary oversampling techniques to progressively enrich minority-class representation.
2.
Decision-theoretic optimisation: A mathematical framework deriving closed-form approval thresholds under asymmetric costs, portfolio constraints, and estimation uncertainty.
3.
Multi-model evaluation: A comparative analysis of eleven classifiers with ablation isolating the contribution of SHDO and SHAP-based interpretability on the best-performing model.
Because the default rate is approximately 8.1%, the evaluation emphasises threshold-independent ranking metrics, minority-class-sensitive measures, and model interpretability. The predicted probabilities can also be used to segment applicants into homogeneous risk groups analogous to credit-rating categories.

1.3. Contribution to the Literature

The contribution is threefold.
  • First (algorithmic): SHDO combines five oversampling methods—RandomOver-Sampler, SMOTE, SMOTEN, BorderlineSMOTE, and SVMSMOTE—in a controlled sequential pipeline for mixed-type credit data. An ablation demonstrates that SHDO converts near-zero minority-class recall into operationally meaningful default detection.
  • Second (mathematical): Credit approval is formulated as an expected-value optimisation problem with closed-form threshold, constrained portfolio extension (Lagrangian with KKT conditions), opportunity-cost generalisation, and minimax-robust decision rule under estimation uncertainty. A formal precision–recall trade-off analysis places threshold sensitivity on rigorous analytical ground. These results are individually standard but their systematic integration provides an analytically complete treatment not available in this consolidated form.
  • Third (empirical): Eleven classifiers are compared on the Home Credit Default Risk dataset with stratified cross-validation, held-out testing under natural imbalance, controlled ablation, and SHAP analysis. XGBoost trained with SHDO achieves the best minority-class F1 (0.254). Unlike [12,13], the present study integrates imbalance handling, decision-theoretic threshold design, and multi-model evaluation within a single framework. Hurlin et al. [14] addresses fairness, which is acknowledged as an important subject in future work.

1.4. Paper Structure

Section 2 reviews the literature. Section 3 introduces the mathematical decision framework. Section 4 presents SHDO, data, preprocessing, and model specifications. Section 5 reports results including the ablation and SHAP analysis. Section 6 discusses implications and limitations. Section 7 concludes the paper.

2. Literature Review

2.1. Evolution of Credit-Scoring Methods

Credit scoring has evolved from expert-driven heuristics through logistic regression [15] and discriminant analysis [16] to modern machine learning ensembles [2,4,17]. Recent work continues along multiple directions: Kwon et al. [12] proposes multi-task Siamese networks, Yan et al. [18] surveys advanced methods, Abi [19] examines behavioural data, and Roy et al. [20] reviews practical implications.

2.2. Gradient Boosting in Finance

Gradient boosting [21] constructs sequential ensembles of weak learners. XGBoost [6], LightGBM [7], and CatBoost [8] differ in regularisation, split-search, and categorical handling. Recent studies report competitive credit-scoring performance [9,10], and Ayari et al. [22] provides a comprehensive review. More broadly, adaptive-boosting frameworks have been shown to substantially raise base-classifier performance across diverse classification domains [23], reinforcing the general effectiveness of boosting-based ensembling for difficult prediction tasks with heterogeneous features.

2.3. Class Imbalance in Credit Risk

Class imbalance is structural in credit data [24], and broad empirical evidence confirms that dataset balancing materially improves downstream classifier performance across large-scale tabular tasks [25]. Strategies include SMOTE [26]—whose variants have been widely deployed in adjacent imbalanced-classification domains such as intrusion detection [27]—ADASYN [28], cost-sensitive learning, and algorithm-specific weighting. Alternative data-augmentation paradigms based on deep generative models have also been explored [29], though they remain less naturally suited to mixed-type tabular credit records. Xia et al. [13] proposes confidence-driven under-sampling; Bai et al. [30] reviews imbalance handling in financial fraud detection. Closely related work has applied hybrid augmentation strategies to imbalanced vehicle-insurance fraud detection [31] and to imbalanced software-requirements classification [32,33], suggesting that combining multiple oversampling mechanisms can be more effective than any single technique in isolation. Sequential hybrid methods show promise [34], but systematic application to mixed-type credit data through a structured pipeline has received limited attention. SHDO [11] addresses this gap.

2.4. Model Evaluation and Interpretability

Accuracy is misleading under imbalance [35]: predicting every applicant as non-default achieves 91.9% accuracy with zero default detection. ROC-AUC [36], precision–recall analysis [37,38], and MCC [39] provide more informative assessments. SHAP [40,41] has become essential for credit-risk model governance [14].

2.5. Research Gap

Two gaps remain. First, imbalance correction and threshold selection are treated as independent steps rather than integrated within a formal decision-theoretic framework. Second, comparative evaluations rarely combine sequential oversampling, multi-model benchmarking, ablation, and SHAP interpretability within a single study.

3. Mathematical Decision Framework

3.1. Expected-Value Formulation

Let p i = P ( default i ∣ x i ) ∈ [ 0 , 1 ] denote the true conditional default probability given observed characteristics x i , and p ^ i ∈ [ 0 , 1 ] the model estimate. Let R G > 0 denote the net return from a performing loan and L D > 0 the loss given default. Under risk neutrality [2], the expected value of approving applicant i is
E [ V i ( 1 ) ∣ p i ] = R G − p i ( R G + L D ) ,
with E [ V i ( 0 ) ∣ p i ] = 0 for rejection. The decision problem is max a i ∈ { 0 , 1 } a i ( R G − p i ( R G + L D ) ) .

3.2. Closed-Form Optimal Threshold

Proposition 1 
(Bayes-Optimal Approval Threshold). The optimal rule is a i * = 1 if p i < τ * , a i * = 0 if p i ≥ τ * , where τ * = R G / ( R G + L D ) .
Proof. 
Since E [ V i ( 0 ) ∣ p i ] = 0 , approving applicant i is (weakly) optimal if and only if E [ V i ( 1 ) ∣ p i ] ≥ 0 , i.e., R G − p i ( R G + L D ) ≥ 0 , which rearranges to p i ≤ R G / ( R G + L D ) = τ * . Strict inequality gives strict approval; equality is a tie-breaking boundary case.    □
Corollary 1 
(Monotonicity and Boundary Behaviour). (1)  ∂ τ * / ∂ R G > 0 , ∂ τ * / ∂ L D < 0 . (2)  τ * → 0 as L D → ∞ ; τ * → 1 as R G → ∞ . (3)  τ * < 1 / 2 iff L D > R G , the typical case in practice.

3.3. Extension with Opportunity Cost

With outside-option value R 0 , the threshold becomes τ † = ( R G − R 0 ) / ( R G + L D ) .
Proposition 2 
(Opportunity-Cost Tightening). R 0 > 0 ⇒ τ † < τ * , with ∂ τ † / ∂ R 0 = − 1 / ( R G + L D ) < 0 .

3.4. Constrained Portfolio Optimisation

max a 1 , … , a N ∈ { 0 , 1 } ∑ i = 1 N a i ( R G − p i ( R G + L D ) ) s . t . ∑ a i ≤ K .
Lemma 1 
(Ranking Characterisation). The optimum approves the K largest positive m i : = R G − p i ( R G + L D ) . The LP relaxation is exact.
The Lagrangian yields a i * ( λ ) = 1 ⇔ p i < ( R G − λ ) / ( R G + L D ) .
Proposition 3 
(Shadow Price and Complementary Slackness). (1)  λ * ( ∑ a i * − K ) = 0 , λ * ≥ 0 ; binding ⇒ τ ( λ * ) < τ * . (2)  λ * ( K ) non-increasing. (3)  K ≥ N ⇒ λ * = 0 , recovering the unconstrained rule.
Remark 1. 
The structure extends to risk-budget constraints ∑ a i p i ≤ B .

3.5. Robust Threshold Under Estimation Uncertainty

Proposition 4 
(Minimax-Robust Approval Rule). If p i ∈ [ p ^ i − ε i , p ^ i + ε i ] , then a i * = 1 ⇔ p ^ i + ε i < τ * .
Corollary 2. 
Under uniform ε, the robust region { p ^ i < τ * − ε } shrinks monotonically with ε. Better calibration supports wider approval.

3.6. Precision–Recall Trade-Off Analysis

Proposition 5 
(Precision–Recall Trade-Off). Let F 0 , F 1 be score CDFs with densities f 0 , f 1 . (1)  Recall ( τ ) = 1 − F 1 ( τ ) is strictly decreasing. (2)  Precision ( τ ) is locally increasing if f 1 ( τ ) / f 0 ( τ ) < ( 1 − F 1 ( τ ) ) / ( 1 − F 0 ( τ ) ) .
Proposition 6 
(Optimality of τ * ). Among all threshold rules, τ * uniquely maximises population expected value.

4. Methodology

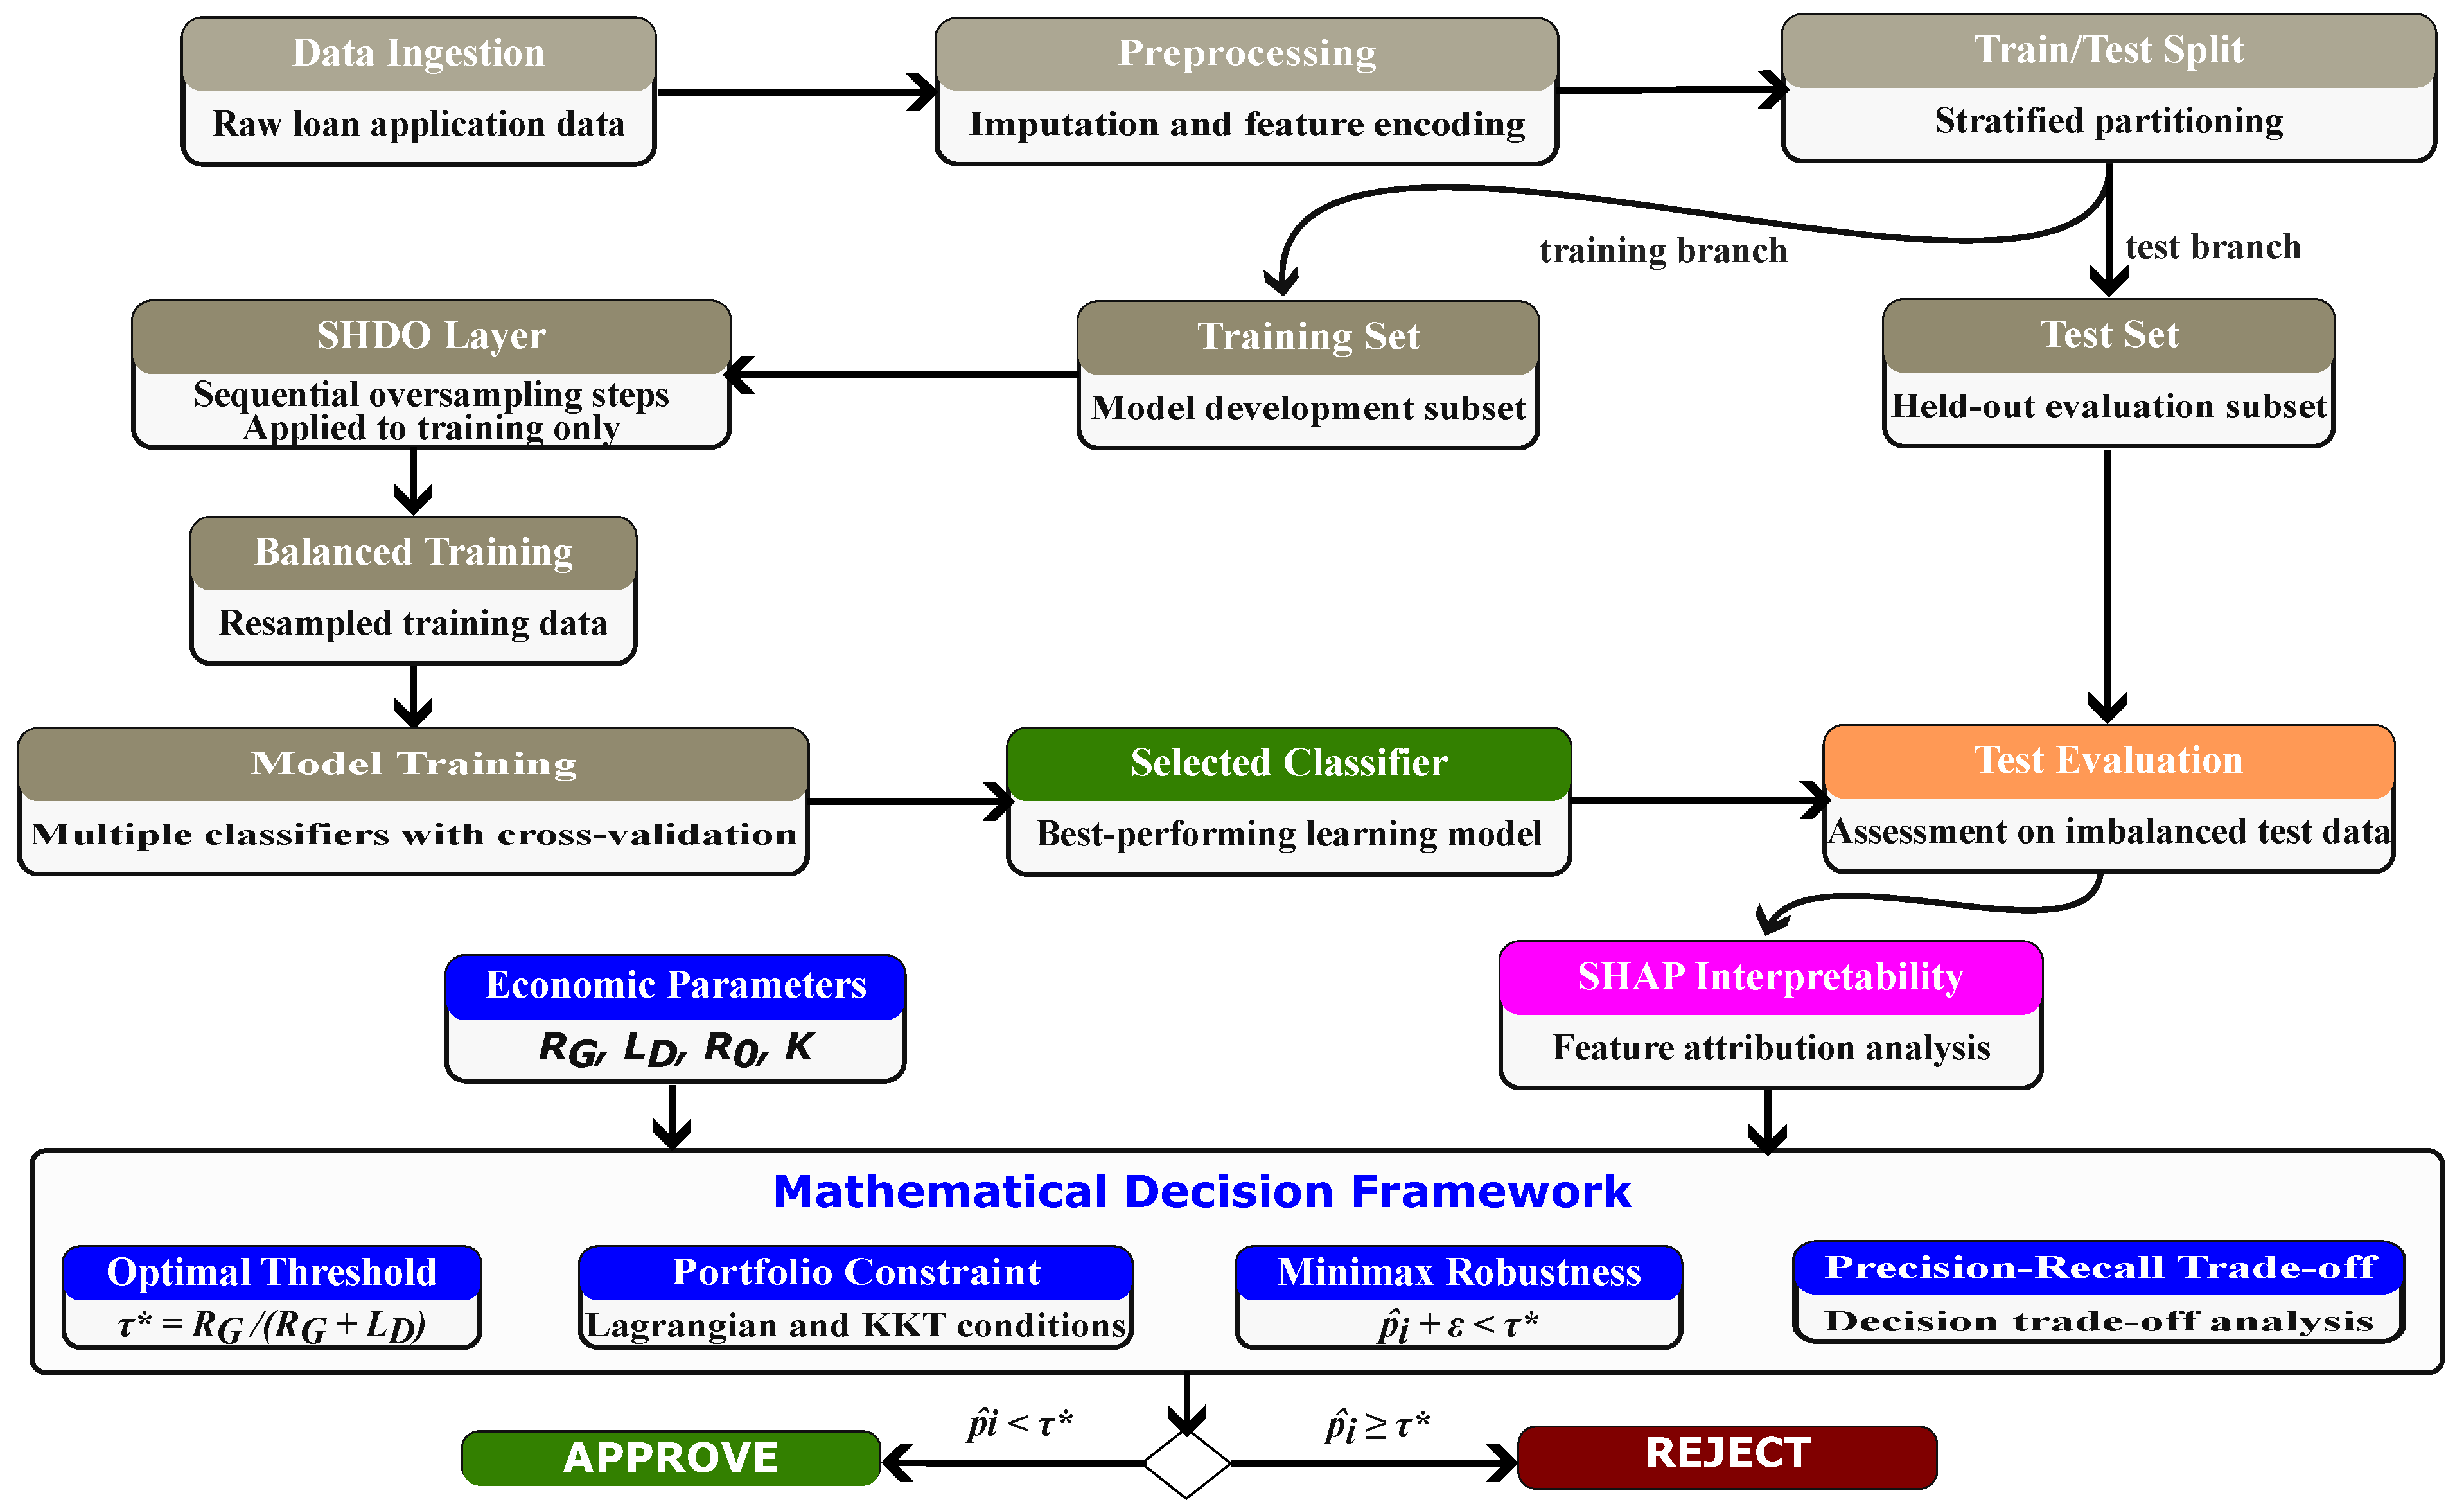
Figure 1 presents an overview of the integrated three-layer framework. SHDO is applied exclusively to the training partition after the train–test split; the test set remains untouched at its original class imbalance throughout.

4.1. Data Description

The Home Credit Default Risk dataset [42] comprises 307,511 consumer loan applications—primarily cash loans and revolving credit—described by 122 features drawn from application forms, credit bureau information, and behavioural records. The binary target variable indicates whether the applicant defaulted on the loan during its term: defaults represent 24,825 observations (8.07% of the sample), reflecting the severe class imbalance characteristic of retail credit portfolios.
The dataset was released publicly by Home Credit Group as part of the Kaggle Home Credit Default Risk competition in 2018 [42] and represents a cross-section of loan applications submitted to the institution prior to that date. Temporal features are expressed as relative day offsets from the application date (e.g., DAYS_BIRTH, DAYS_EMPLOYED, DAYS_ID_PUBLISH) rather than absolute calendar dates, which anonymises the specific application window while preserving the temporal structure needed for risk modelling.
The 122 features can be grouped by type into three broad categories. Continuous financial variables—including applicant income (AMT_INCOME_TOTAL), requested credit amount (AMT_CREDIT), annuity (AMT_ANNUITY), and goods price (AMT_GOODS_PRICE)—characterise loan size and applicant capacity. Temporal variables, encoded as negative day offsets, capture age, employment tenure, and identity-document age. Sixteen categorical variables describe contract type, education level, occupation, family status, housing type, and organisation of employment. Three external bureau scores (EXT_SOURCE_1, EXT_SOURCE_2, EXT_SOURCE_3) summarise creditworthiness signals aggregated from external credit agencies; these consistently rank among the most predictive features in the empirical analysis (see Section 5.3).

4.2. Preprocessing

The raw dataset exhibits heterogeneous missingness, with feature-wise missing-value rates ranging from 0% for core identifiers and the target label up to approximately 70% for certain auxiliary variables; the largest observed rate is 69.87% for the COMMONAREA_* feature group. To ensure that each retained observation provides a sufficiently complete feature profile for model training, a row-level missingness filter was applied that retains only observations with fewer than 40 missing values (out of 122 features, i.e., fewer than approximately one-third of the features missing). This filter reduces the sample from 307,511 to 155,367 records, a retention rate of 50.5%. The filter removes applications with sparse feature coverage while preserving the class distribution: within the filtered set, defaults represent 10,823 observations (6.97%), close to the original default rate of 8.07% and preserving the severe imbalance that the framework is designed to address. The client identifier (SK_ID_CURR) is then removed because it carries no predictive signal, leaving 121 features (120 predictors and the binary target).
Remaining missing values are imputed separately for numerical and categorical variables. Of the 120 predictors, 105 are numerical and are imputed using feature-wise median replacement, which is robust to outliers in financial and temporal variables. The 16 categorical variables are imputed using feature-wise mode (most-frequent) replacement. These simple imputation strategies were selected over model-based alternatives (e.g., iterative or nearest-neighbour imputation) on reproducibility and simplicity grounds: they require no tuning, produce deterministic results given the same input data, and are standard for benchmark reporting.
Categorical variables are then transformed using integer (label) encoding, which maps each distinct category value to a non-negative integer. Label encoding was preferred over one-hot encoding for two reasons. First, several categorical variables in this dataset have high cardinality—ORGANIZATION_TYPE contains 58 distinct categories and OCCUPATION_TYPE contains 18—so one-hot encoding would have substantially expanded the feature space. Second, the subsequent modelling suite is dominated by tree-based learners (XGBoost, LightGBM, CatBoost, Random Forest, Extra Trees, GBDT, Decision Tree), for which integer-encoded categorical variables are handled natively through split-search and do not require explicit one-hot expansion. No feature scaling or standardisation is applied, as tree-based models are invariant to monotonic transformations of their inputs.
The preprocessed dataset is partitioned into training and test subsets using a stratified random split with a 75%/25% ratio, yielding 116,525 training observations and 38,842 test observations. Stratification on the binary target preserves the class prevalence (6.97% defaults) in both partitions, so that the imbalance observed during training is representative of the deployment environment reflected in the held-out test set. A fixed random seed (random_state = 42) is used so that the split is reproducible. All subsequent oversampling, model training, and threshold-tuning operations are performed exclusively on the training partition; the test set is held out in its original imbalanced form and used only for the final evaluation reported in Section 5.1.

4.3. Sequential Hybrid Data Oversampling (SHDO)

SHDO [11] addresses class imbalance through a structured sequential pipeline of five complementary oversampling techniques: RandomOverSampler, SMOTE, SMOTEN, BorderlineSMOTE, and SVMSMOTE. In the original SHDO algorithmic formulation (Algorithm 1), these methods are applied in this order, with each stage generating an equal fraction of the required minority-class increase until class balance is achieved.
The rationale for this sequence is progressive refinement. RandomOverSampler is applied first to provide an initial enlargement of the minority class without imposing geometric assumptions on the feature space. SMOTE is then used to enrich the continuous-feature structure through interpolation between minority neighbours, while SMOTEN extends this enrichment to nominal features. After this broader representation has been established, BorderlineSMOTE focuses on minority samples located near difficult decision regions, where misclassification risk is highest. Finally, SVMSMOTE performs a boundary-sensitive refinement guided by support-vector structure, strengthening minority representation in the most critical classification zones. The sequence therefore moves from general class rebalancing to increasingly targeted boundary-aware synthesis rather than combining the methods arbitrarily.
This design is empirically motivated by prior SHDO validation across three imbalanced binary-classification datasets and repeated experiments with Random Forest and XGBoost classifiers. In that evaluation, SHDO achieved F1-scores statistically equivalent to the best competing oversampling method overall (reported p-value = 0.75 ), yielded positive relative improvement in more than 20% of the experiments, and remained within 5% of the best competing method in 93% of cases. These results support the robustness and practical effectiveness of the chosen sequence across different data settings, although they do not imply that this ordering is uniquely optimal in a formal theoretical sense.
Algorithm 1 Sequential Hybrid Data Oversampling (SHDO)
1:
Input: Imbalanced binary classification dataset
2:
Output: Balanced dataset with equal class representation
3:
Let N = majority class size, M = minority class size, Δ = N − M
4:
Apply RandomOverSampler: minority becomes M + Δ / 5
5:
Apply SMOTE: minority becomes M + 2 Δ / 5
6:
Apply SMOTEN: minority becomes M + 3 Δ / 5
7:
Apply BorderlineSMOTE: minority becomes M + 4 Δ / 5
8:
Apply SVMSMOTE: minority becomes N (balanced)
In the present study, SHDO is applied only to the training partition after the train–test split. The test set is kept at its original class imbalance throughout, ensuring that reported results reflect realistic deployment conditions rather than performance on an artificially balanced evaluation set. This design isolates the contribution of training-time imbalance correction while preserving the integrity of the held-out assessment.

4.4. Model Suite

Eleven classifiers are evaluated under default hyperparameter settings: Logistic Regression, Gaussian Naïve Bayes, k-NN ( k = 15 ), SVM-RBF, Decision Tree, Random Forest (800 trees), Extra Trees (800 trees), GBDT (sklearn), XGBoost, LightGBM, and CatBoost. Stratified five-fold cross-validation is performed on the SHDO-balanced training set. Final evaluation uses the held-out test set under natural class imbalance.

4.5. Evaluation Metrics

The primary metrics are ROC-AUC (ranking quality) and minority-class F1 (threshold-dependent detection). Complementary metrics include accuracy, precision, recall, PR-AUC, MCC, log loss, and Brier score. The McNemar test is applied to assess whether performance differences between leading models are statistically significant.

5. Results and Analysis

Section 5.1 and Section 5.2 evaluate predictive performance under a common classification protocol at the conventional threshold to compare models and isolate the contribution of SHDO. The decision-theoretic threshold τ * derived in Section 3 serves a different, complementary purpose. Once a model has been selected and its predicted probabilities obtained, τ * is applied as a deployment rule to convert those probabilities into economically justified approval or rejection decisions. In other words, the predictive benchmarking identifies the most suitable probability estimator, whereas τ * calibrates how the resulting scores should be translated into actions. This deployment application is illustrated in Section 5.4.

5.1. Multi-Model Comparison

Table 1 reports test-set results for all eleven classifiers trained with SHDO, evaluated under natural class imbalance ( n = 38 , 842 ; 2706 defaults).
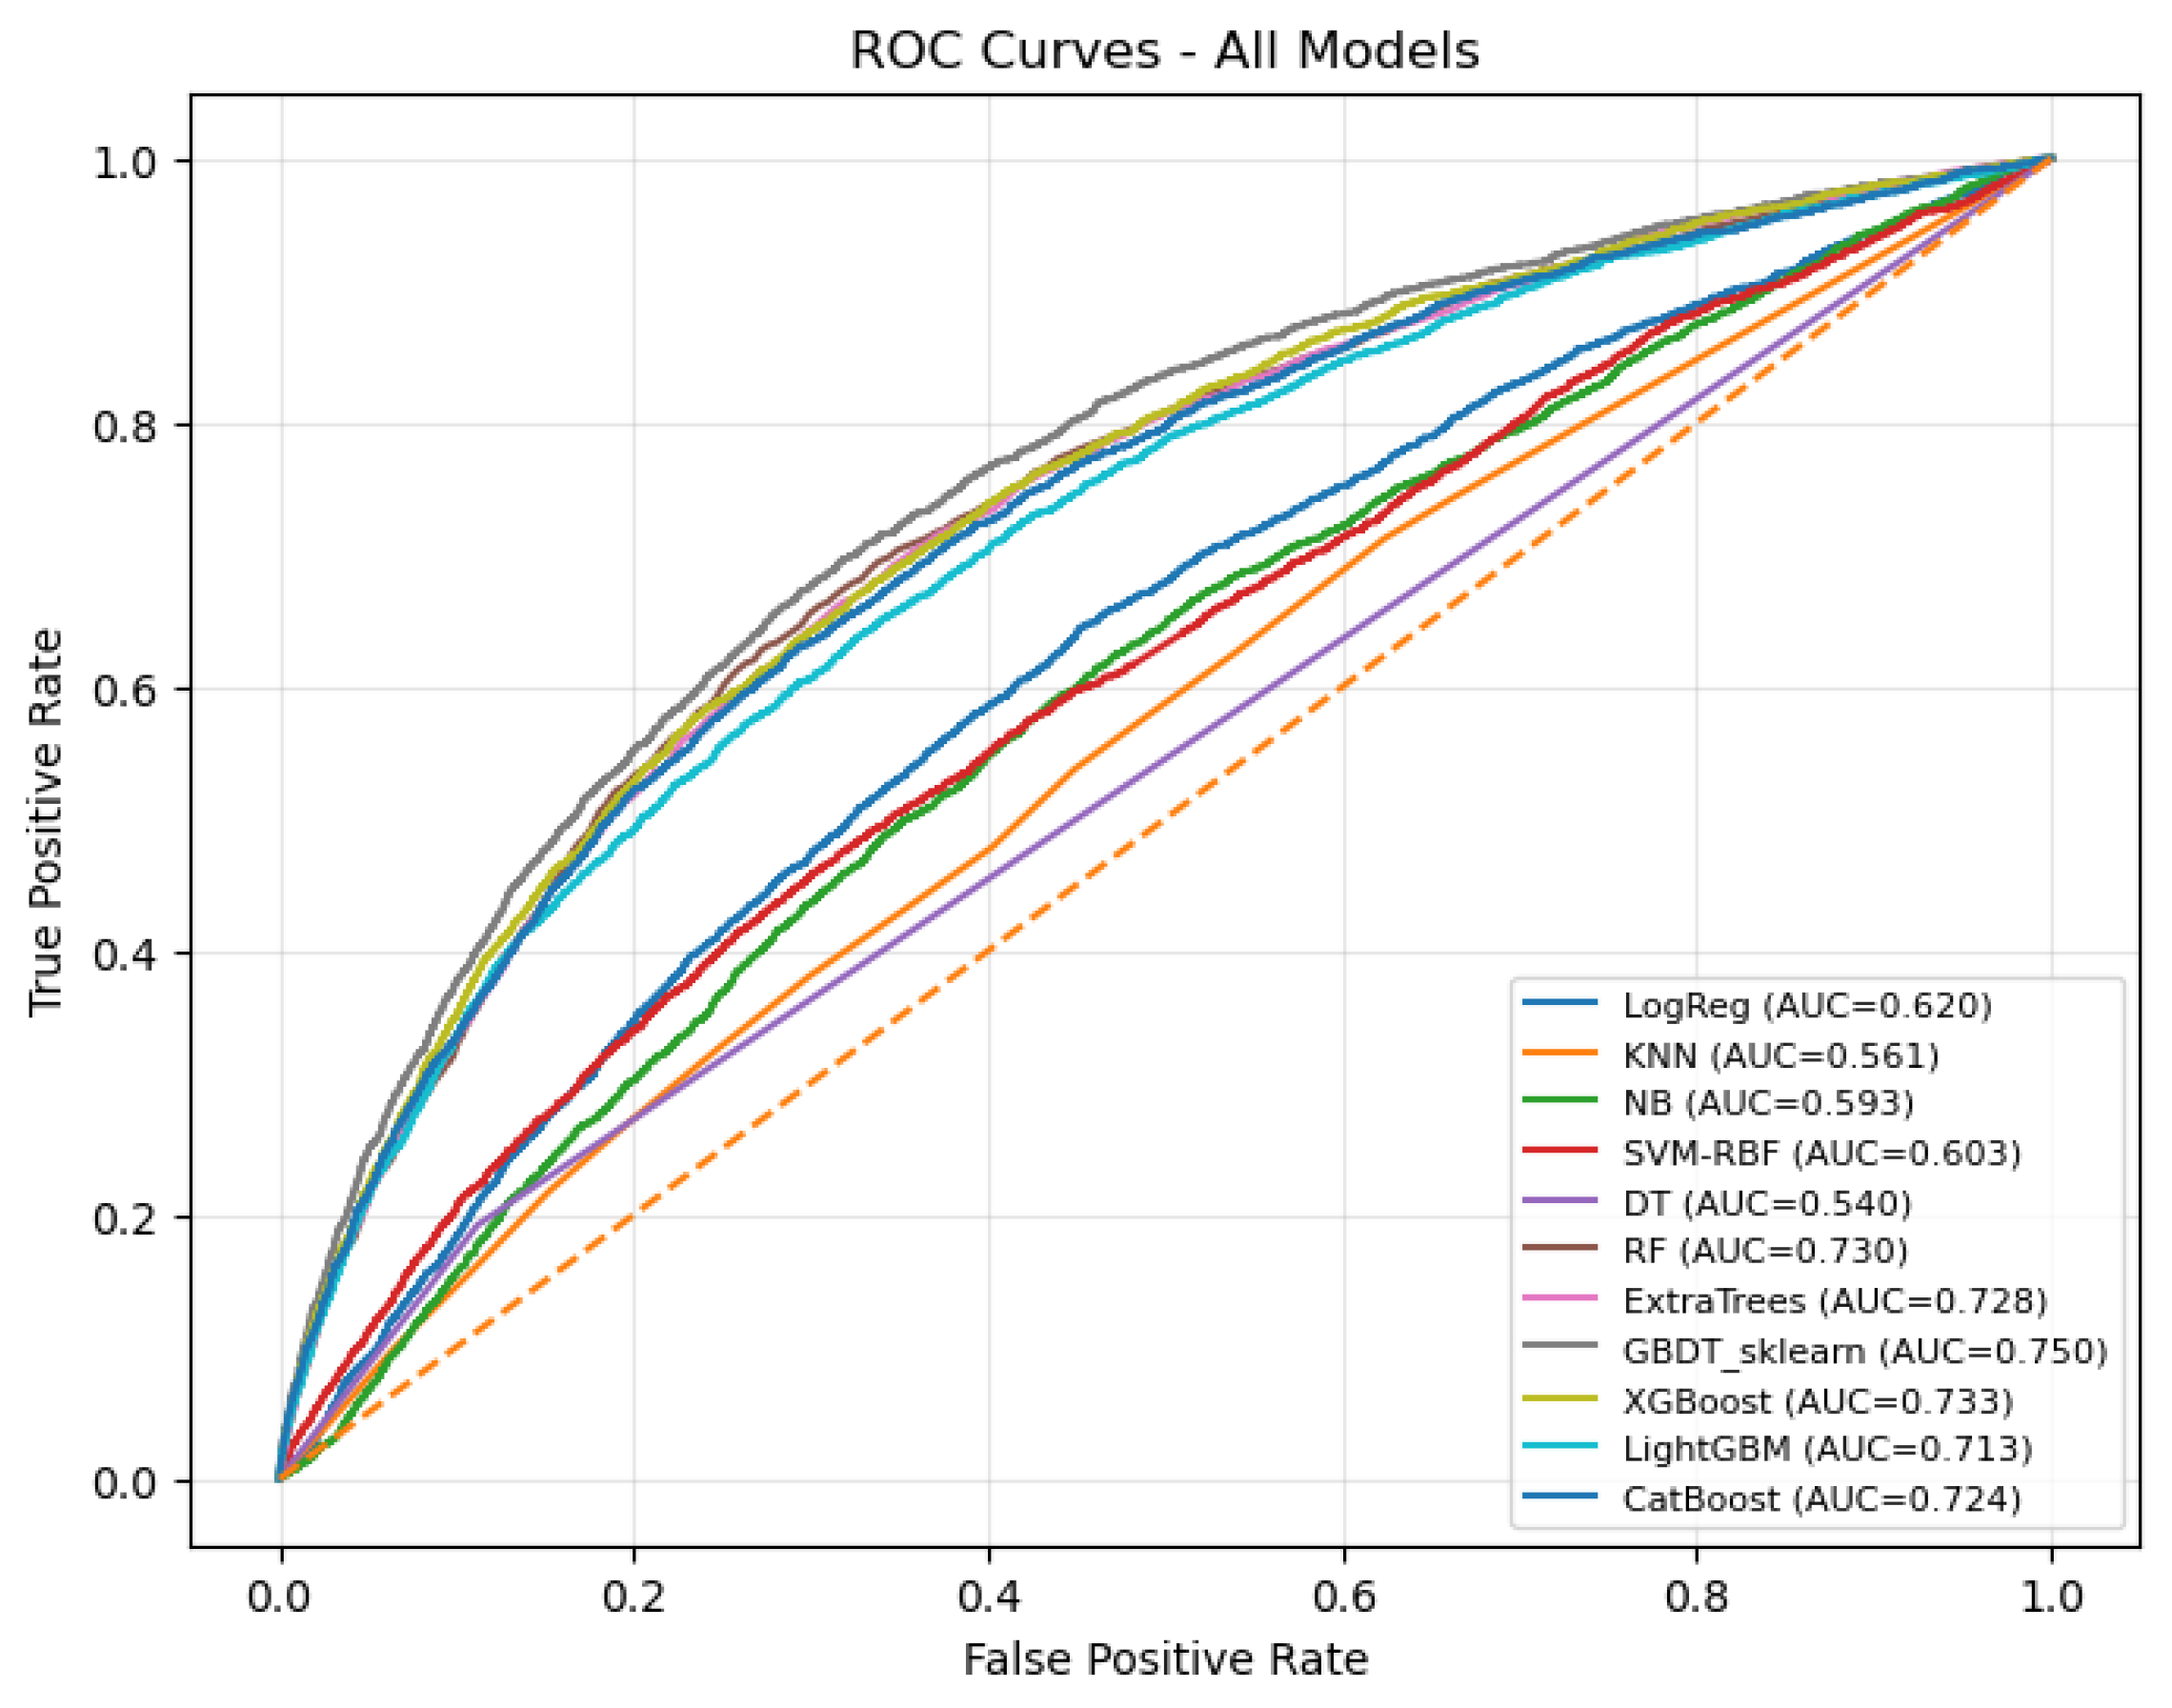
XGBoost achieves the best minority-class F1 (0.254) with precision 0.220 and recall 0.300, representing the strongest balance between default detection and false-alarm suppression. GBDT attains the highest ROC-AUC (0.750) and recall (0.629) but at substantially lower precision (0.153). Among the four gradient-boosted models, ROC-AUC ranges from 0.713 (LightGBM) to 0.750 (GBDT), confirming that all substantially outperform classical baselines (0.540–0.620). Notably, the bagging ensembles (Random Forest, Extra Trees) achieve high ROC-AUC (0.730, 0.728) but near-zero recall under SHDO, indicating that their ranking ability does not translate into effective default detection at the standard threshold. The McNemar test confirms that the difference between XGBoost and GBDT is statistically significant ( p < 0.001 ). Figure 2 shows the ROC curves for all models.

5.2. The Effect of SHDO: A Controlled Ablation

To determine the specific impact of SHDO on default detection, the four gradient-boosted ensemble models were retrained using the original imbalanced training partition without any oversampling. The imbalanced training set contains 116,525 observations, of which 8117 belong to the default class and 108,408 to the non-default class, yielding a class ratio of approximately 13.4:1. All other components of the modelling workflow—preprocessing, feature encoding, missing-value treatment, train–test split, and evaluation protocol—remained identical. Any observed performance variation is therefore attributable solely to the presence or absence of SHDO.

5.2.1. Ranking Ability Is Preserved Without SHDO

Without SHDO, the ensemble models retain moderate ranking capability. The held-out test ROC-AUC values remain largely unchanged: GBDT achieves 0.751, CatBoost 0.748, XGBoost 0.746, and LightGBM 0.738. These values are comparable to those obtained with SHDO (0.750, 0.724, 0.733, and 0.713, respectively), indicating that SHDO does not substantially alter the models’ ability to order applicants by relative default risk.

5.2.2. Default Detection Collapses Without SHDO

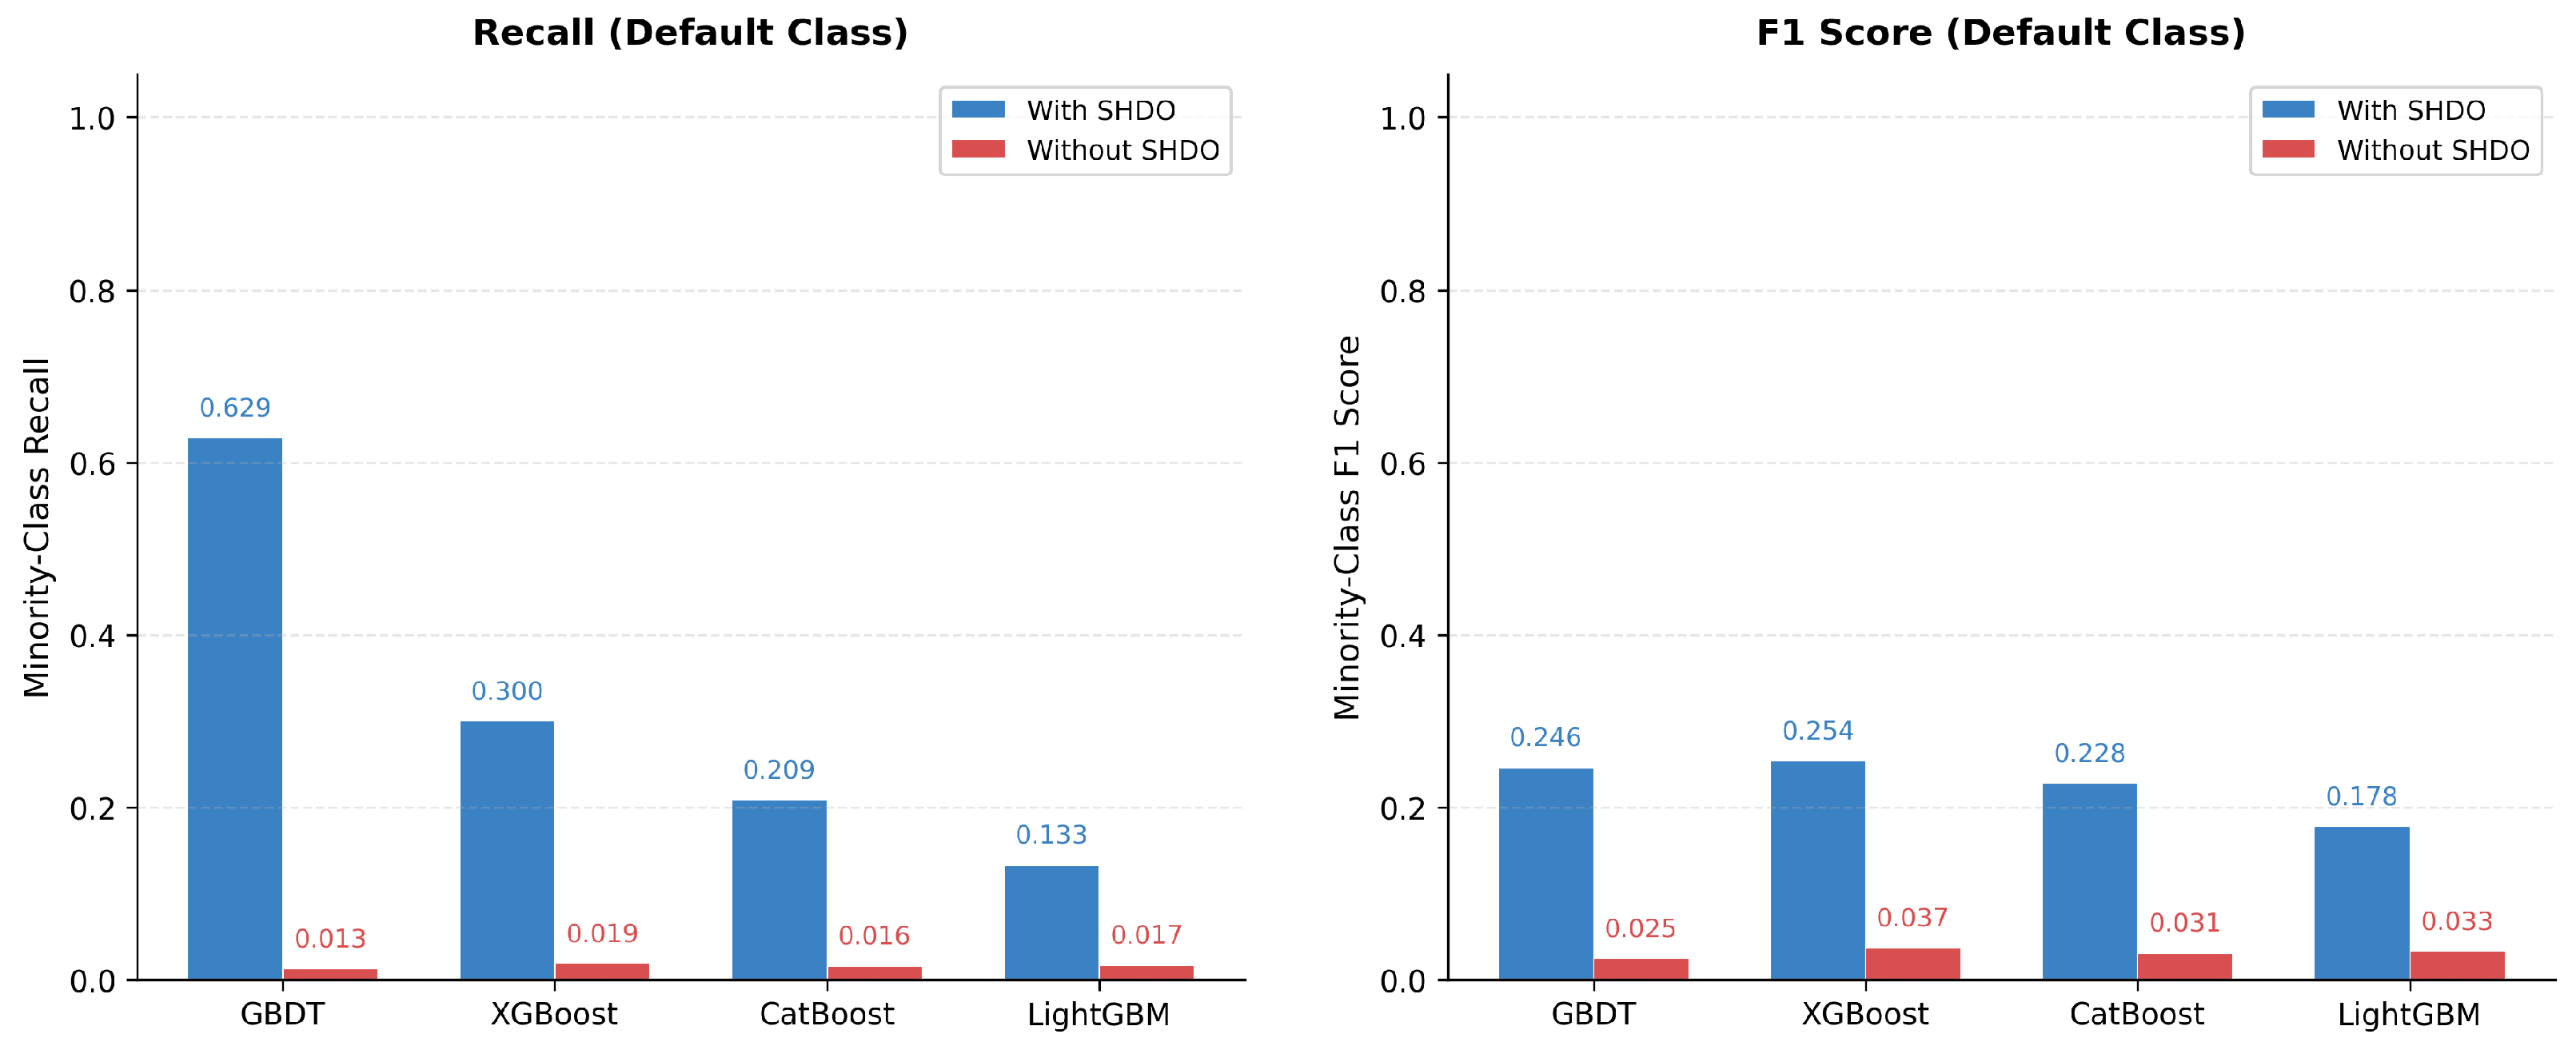
However, these adequate ranking scores conceal poor minority-class identification at the conventional decision threshold. Without SHDO, the recall scores are 0.013 for GBDT, 0.019 for XGBoost, 0.016 for CatBoost, and 0.017 for LightGBM. The corresponding F1-scores remain between 0.025 and 0.037. In practical terms, the models trained on imbalanced data fail to flag more than 2% of actual defaulters—rendering them operationally useless for default detection despite their apparently acceptable ROC-AUC.

5.2.3. SHDO Restores Operationally Meaningful Detection

Applying SHDO changes this behaviour substantially. Table 2 reports the comparison across the four gradient-boosted models.
The improvement is dramatic across all models. XGBoost’s recall increases from 0.019 to 0.300 (a 15.8-fold improvement) and its F1 rises from 0.037 to 0.254 (6.9-fold). GBDT exhibits an even larger recall gain, improving from 0.013 to 0.629 (48.4-fold), although its F1-score remains slightly below XGBoost’s due to its more aggressive positive-prediction behaviour that sacrifices precision for recall. Figure 3 makes this contrast visually clear.

5.2.4. Interpretation of the SHDO Effect

An important insight emerges from the joint behaviour of threshold-independent and threshold-dependent metrics. Across the four gradient-boosted models, ROC-AUC remains broadly stable between the no-SHDO and SHDO settings, whereas recall and minority-class F1 improve substantially after SHDO is applied. This pattern indicates that SHDO materially improves operational default detection, even when overall ranking ability changes only modestly. In practical terms, models trained on the original imbalanced data are able to distinguish applicants to some extent in a pairwise ranking sense. However, they fail to translate that ranking signal into useful minority-class identification at the conventional classification threshold. By contrast, training on the SHDO-balanced data leads to a substantially higher recovery of default cases on the unchanged imbalanced test set.
At the same time, the present results do not by themselves establish the precise internal mechanism by which SHDO produces this improvement. In particular, while the observed gain is consistent with more favourable minority-class discrimination at the classification stage, the current analysis does not include score-distribution plots, calibration curves, or probability-density diagnostics that would allow that mechanism to be verified directly. Therefore, the most appropriate conclusion from the present evidence is empirical rather than mechanistic: SHDO preserves competitive ranking performance while substantially improving threshold-based minority-class detection under realistic class imbalance.
From a deployment perspective, this finding is complementary to the decision-theoretic framework developed in Section 3. SHDO improves the practical detectability of the minority class during model training, whereas the threshold analysis provides a principled rule for converting predicted probabilities into approval decisions under asymmetric returns, losses, and institutional constraints. The two components therefore address different stages of the decision-making workflow: SHDO improves classification usefulness under imbalance, and the mathematical framework determines how the resulting scores should be translated into economically justified actions.

5.3. SHAP-Based Interpretability Analysis

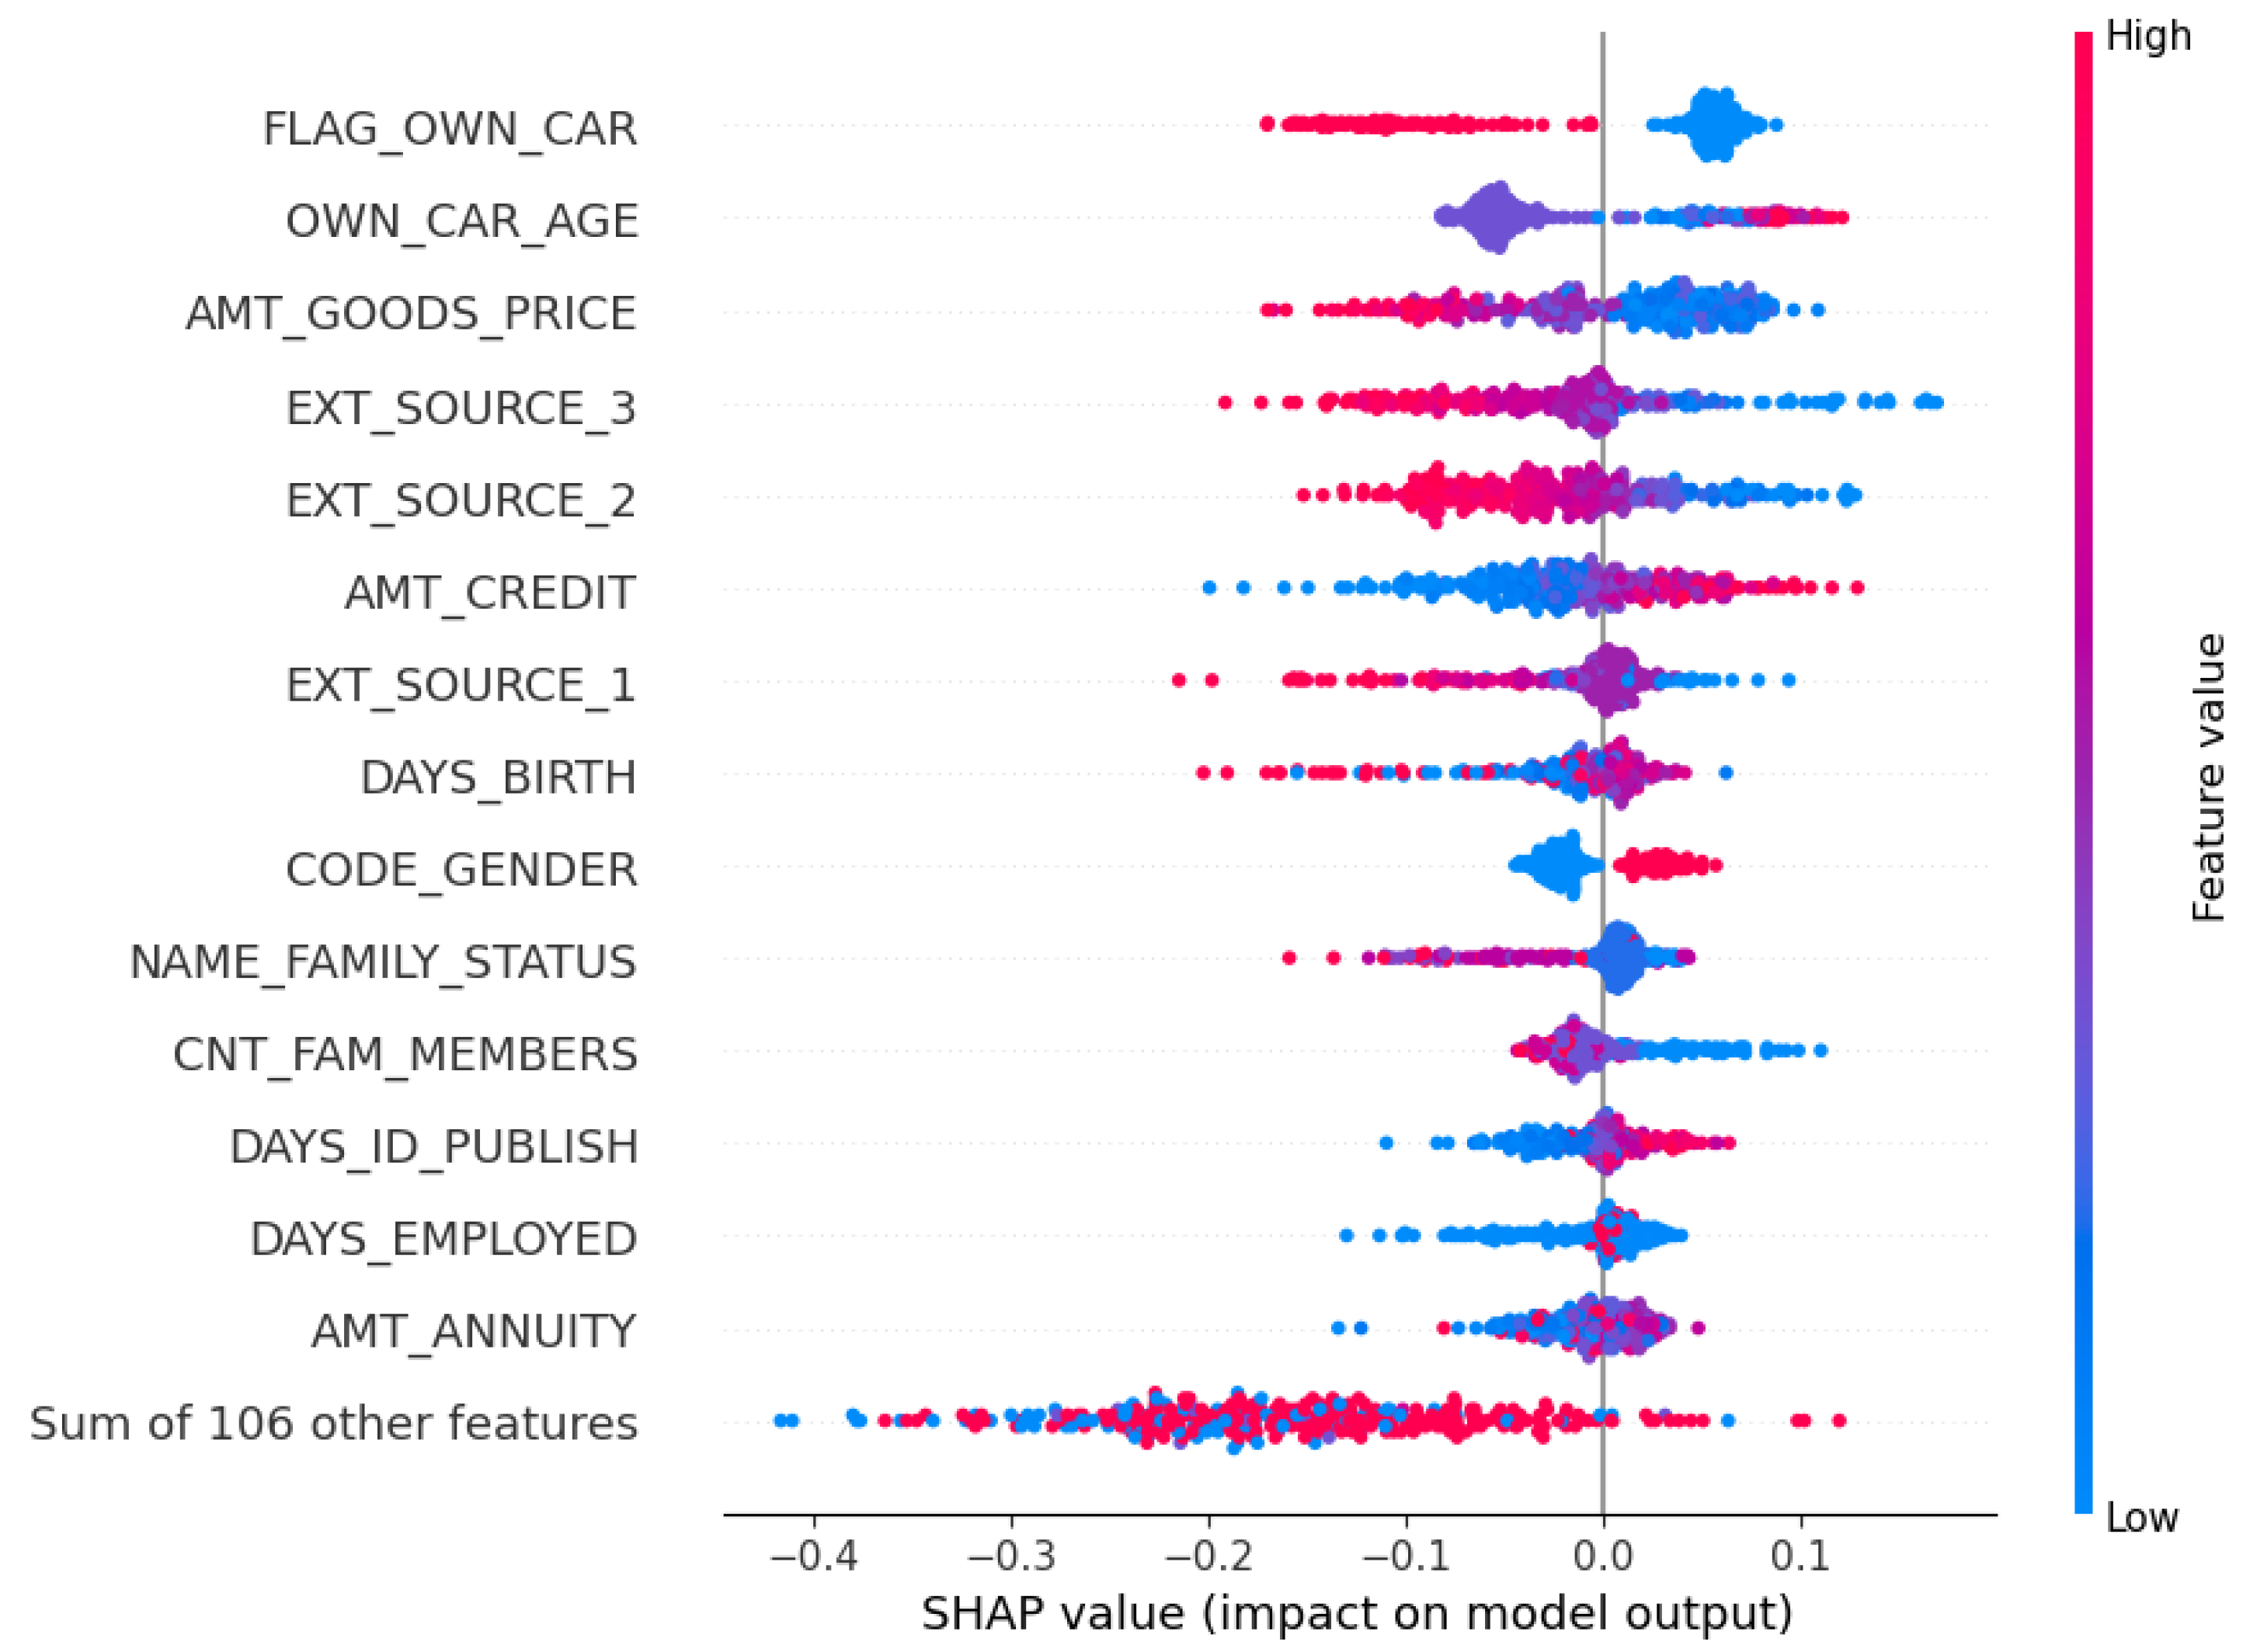
SHAP analysis [40] was conducted on the XGBoost classifier—the best model by minority-class F1—using a permutation-based explainer on a stratified subsample of 300 test observations (Figure 4).
The analysis reveals an economically coherent attribution structure. The most influential feature is FLAG_OWN_CAR (car ownership), followed by OWN_CAR_AGE and AMT_GOODS_PRICE (loan-financed goods value). The three external credit bureau scores (EXT_SOURCE_3, EXT_SOURCE_2, EXT_SOURCE_1) rank among the top seven features: higher values push predictions toward non-default (negative SHAP), consistent with the established role of bureau-derived variables in retail credit scoring. The applicant’s age (DAYS_BIRTH, coded as negative day offsets so that larger values correspond to younger applicants) also contributes: younger applicants receive slightly higher default predictions, consistent with the common finding that repayment stability improves with age. Supporting variables include AMT_CREDIT, CODE_GENDER, NAME_FAMILY_STATUS, and DAYS_EMPLOYED, each with narrower SHAP spreads indicating secondary roles.
The model’s decision logic operates in three layers: asset ownership and external creditworthiness signals anchor the risk assessment, loan exposure variables refine it, and demographic indicators provide secondary adjustment. This structure aligns with conventional underwriting logic, providing evidence that XGBoost captures genuine risk patterns rather than spurious correlations.

5.4. Economic Value Assessment

The decision framework from Section 3 is model-agnostic: it converts any classifier’s calibrated probabilities into optimal approval rules. Applied to XGBoost with SHDO, the framework yields the following. Under illustrative payoffs ( R G = $ 1000 , L D = $ 10 , 000 ), Proposition 1 gives the economically optimal approval threshold τ * = R G / ( R G + L D ) = 1000 / 11 , 000 ≈ 0.091 —well below the conventional 0.5 cutoff, consistent with Corollary 1(3) since L D > R G .
To provide an interpretable empirical benchmark, we first evaluate the realised classification outcomes at the conventional threshold of 0.5. Let v T N = $ 1000 denote the value of a correctly approved performing applicant, v T P = $ 200 denote the value of a correctly rejected defaulting applicant, c F P = $ 500 the opportunity cost of incorrectly rejecting a performing applicant, and c F N = $ 10 , 000 denote the loss from incorrectly approving a defaulting applicant. At threshold 0.5, the XGBoost confusion matrix yields 33,266 true negatives, 2870 false positives, 1895 false negatives, and 811 true positives. The expected value per application at this benchmark threshold is
E V 0.5 = v T N × 33 , 266 38 , 842 + v T P × 811 38 , 842 − c F P × 2870 38 , 842 − c F N × 1895 38 , 842 ≈ $ 336 .
Compared to an accept-all strategy ( E V all = 1000 × 0.9193 − 10 , 000 × 0.0807 ≈ $ 112 ), the benchmark threshold improves the expected value by approximately $224 per application. The economically optimal deployment threshold implied by the decision-theoretic analysis is, however, τ * ≈ 0.091 rather than 0.5. Accordingly, the 0.5 result should be interpreted as a benchmark comparison, whereas τ * provides the approval rule that should be used in practice once calibrated predicted probabilities are available. A full empirical evaluation at τ * would require re-thresholding the model outputs and recomputing the confusion matrix and expected value under that rule.

6. Discussion

6.1. Integrated Framework Interpretation

The three layers produce a coherent result chain. SHDO converts XGBoost’s near-zero minority-class recall (0.019) into operationally meaningful detection (0.300). SHAP confirms the learned risk structure is economically interpretable. The decision framework then converts XGBoost’s probabilities into optimal approval thresholds responsive to R G , L D , portfolio constraints, and estimation uncertainty.
From an operational perspective, the framework implies that lenders should not treat model training, model selection, and approval-rule design as a single undifferentiated step. SHDO addresses the first problem by improving minority-class detectability during training. The comparative analysis addresses the second by identifying the most suitable probability estimator. The decision-theoretic threshold addresses the third by aligning the final approval rule with institutional returns, losses, and capacity constraints. This separation has direct managerial value because it allows institutions with different risk appetites to use the same predictive architecture but implement different approval policies. Under realistic default-loss environments where L D ≫ R G , the optimal threshold τ * becomes substantially more conservative than the conventional 0.5 rule, which materially changes approval behaviour. Conversely, institutions prioritising early risk capture may prefer high-recall models such as GBDT, whereas those prioritising a more balanced precision–recall trade-off may prefer XGBoost. The trade-off introduced by SHDO should be evaluated against this risk appetite. Substantially higher default capture is achieved at the cost of more false positives that require manual review, and the acceptable balance is an institution-specific managerial choice rather than a purely statistical one.

6.2. Model Selection

XGBoost achieves the best F1 (0.254) by balancing precision and recall; GBDT offers higher recall (0.629) for loss-averse settings. The choice is deployment-specific and should be driven by the institution’s cost structure—precisely the analysis formalised in Section 3. SHDO is model-agnostic and benefits all ensemble methods, but the magnitude of improvement varies: XGBoost and GBDT gain most, while LightGBM shows more modest improvement under SHDO.

6.3. Deployment Considerations

The optimal threshold τ * ≈ 0.091 (for R G = $ 1000 , L D = $ 10 , 000 ) lies well below 0.5, illustrating why ad hoc threshold selection is economically suboptimal. SHAP analysis confirms that XGBoost’s top features—external credit scores, asset ownership, loan amount, and applicant age—are economically interpretable, supporting regulatory governance requirements.

6.4. Limitations and Scope of Applicability

First, the analysis uses a single dataset; external validity remains to be established. Second, walk-forward temporal validation would strengthen evidence of stability under changing economic conditions. Third, hyperparameters use default settings; formal optimisation may improve results. Fourth, a fairness audit was not performed [14]. Fifth, SHAP was conducted on XGBoost only; extending it would broaden interpretability evidence.
Although the empirical evaluation is conducted on a single benchmark dataset, the proposed framework is designed for a broader class of problems characterised by imbalanced binary outcomes, tabular borrower-level records, and mixed numerical and categorical predictors. SHDO is particularly suitable for such settings because it combines oversampling mechanisms designed for both continuous and nominal structures, while the decision-theoretic threshold layer is model-agnostic and transferable wherever calibrated default probabilities and asymmetric economic payoffs are available. The framework is therefore expected to be most relevant for retail credit, consumer lending, SME lending, peer-to-peer lending, and fraud-related underwriting—any portfolio-screening problem with severe class imbalance (<15% positive rate), mixed-type tabular features, and asymmetric misclassification costs. Additional validation on independent and temporally separated datasets remains necessary to confirm this expected transferability. Because borrower data is inherently sensitive, a further promising direction is to embed the proposed framework within privacy-preserving and federated learning architectures for multi-institutional deployment, building on recent advances in reliable collaborative AI across distributed computing layers [43].

6.5. Comparative Context

Gradient-boosted models achieve ROC-AUC 0.713–0.750; classical baselines reach 0.540–0.620. The XGBoost–GBDT difference is statistically significant ( p < 0.001 via McNemar). These results reinforce that gradient boosting methods scale effectively in applied credit-risk settings and that structured imbalance correction is necessary for minority-class detection.

7. Conclusions

This study develops an integrated framework for credit risk assessment that addresses three problems that are often treated separately in practice: class imbalance during training, predictive model selection, and approval-threshold design at deployment. The empirical results show that without structured imbalance correction, even models with acceptable ranking ability may fail to detect default cases in operationally meaningful terms—recall below 2% across all four gradient-boosted models tested. SHDO recovers that detectability, raising recall by factors of 7.8 to 48.4, while the decision-theoretic threshold framework converts predicted probabilities into approval decisions that reflect institutional returns, losses, and constraints.
The main practical implication is that credit-risk systems should not rely on ranking performance alone, nor on arbitrary classification thresholds such as 0.5. Instead, they should combine imbalance-aware training with economically grounded decision calibration. Under realistic default-loss environments—where L D ≫ R G —the optimal threshold τ * is typically an order of magnitude below 0.5, which materially alters approval behaviour and expected portfolio value. The proposed framework therefore improves current practice by linking prediction and decision within a single coherent structure, making default-risk screening both more actionable under severe imbalance and more defensible under economic scrutiny. For researchers, the same structure provides a template for integrating data-level, decision-theoretic, and empirical considerations. For practitioners, it offers a transparent sequence in which imbalance handling, model choice, and threshold calibration are treated as distinct but coordinated managerial decisions. Future work should address temporal validation, fairness constraints, hyperparameter optimisation, portfolio-level credit allocation, and privacy-preserving federated extensions suitable for multi-institutional credit environments.

Author Contributions

Conceptualisation, B.B.A.; methodology, B.B.A.; validation, B.B.A.; formal analysis, B.B.A.; investigation, B.B.A.; resources, B.B.A.; writing—original draft, Z.S.R.; writing—review and editing, Z.S.R.; project administration, B.B.A. All authors have read and agreed to the published version of the manuscript.

Funding

This research received no external funding.

Data Availability Statement

Code and materials are available at https://github.com/boulbaba1981/ (accessed on 5 March 2026). The Home Credit Default Risk dataset is publicly available from Kaggle [42].

Acknowledgments

The Researchers would like to thank the Deanship of Graduate Studies and Scientific Research at Qassim University for financial support (QU-APC-2026).

Conflicts of Interest

The authors declare no conflicts of interest.

References

  1. Hsu, C.C.; Chia, K.C.; Chang, C.Y. Basel III Finalising Post-Crisis Reforms: A Cross-Jurisdictional Assessment of Capital and Risk-Weighted Asset Frameworks and Their Implications for Financial Stability. SSRN 2025, 5719346. [Google Scholar] [CrossRef] [Scilit]
  2. Thomas, L.; Crook, J.; Edelman, D. Credit Scoring and Its Applications; SIAM: Bangkok, Thailand, 2017. [Google Scholar]
  3. Khandani, A.E.; Kim, A.J.; Lo, A.W. Consumer credit-risk models via machine-learning algorithms. J. Bank. Financ. 2010, 34, 2767–2787. [Google Scholar] [CrossRef] [Scilit]
  4. Lessmann, S.; Baesens, B.; Seow, H.V.; Thomas, L.C. Benchmarking state-of-the-art classification algorithms for credit scoring: An update of research. Eur. J. Oper. Res. 2015, 247, 124–136. [Google Scholar] [CrossRef] [Scilit]
  5. Noriega, C.; Torres, J.; García, P. Machine learning in credit scoring: A systematic literature review. Data 2023, 8, 169. [Google Scholar] [CrossRef] [Scilit]
  6. Chen, T.; Guestrin, C. XGBoost: A scalable tree boosting system. In Proceedings of the 22nd ACM SIGKDD International Conference on Knowledge Discovery and Data Mining, San Francisco, CA, USA, 13–17 August 2016; pp. 785–794. [Google Scholar]
  7. Ke, G.; Meng, Q.; Finley, T.; Wang, T.; Chen, W.; Ma, W.; Ye, Q.; Liu, T.Y. LightGBM: A highly efficient gradient boosting decision tree. Adv. Neural Inf. Process. Syst. 2017, 30, 1–9. [Google Scholar]
  8. Prokhorenkova, L.; Gusev, G.; Vorobev, A.; Dorogush, A.V.; Gulin, A. CatBoost: Unbiased boosting with categorical features. Adv. Neural Inf. Process. Syst. 2018, 31, 1–11. [Google Scholar]
  9. Ma, X.; Sha, J.; Wang, D.; Yu, Y.; Yang, Q.; Niu, X. Study on a prediction of P2P network loan default based on the machine learning LightGBM and XGBoost algorithms according to different high dimensional data cleaning. Electron. Commer. Res. Appl. 2018, 31, 24–39. [Google Scholar] [CrossRef] [Scilit]
  10. Zhang, W.; Yang, D.; Zhang, S. A new hybrid ensemble model with voting-based outlier detection and balanced sampling for credit scoring. Expert Syst. Appl. 2021, 174, 114744. [Google Scholar] [CrossRef] [Scilit]
  11. Saad Rubaidi, Z.; Ben Ammar, B.; Masmoudi, K.; Ben Aouicha, M.; Masmoudi, A. Developing SHDO. In Mitigating the Risks of AI Deepfakes; CRC Press: Boca Raton, FL, USA, 2026; pp. 215–234. [Google Scholar] [CrossRef] [Scilit]
  12. Kwon, S.; Jang, J.; Kim, C.O. Credit scoring using multi-task Siamese neural network for improving prediction performance and stability. Expert Syst. Appl. 2025, 259, 125327. [Google Scholar] [CrossRef] [Scilit]
  13. Xia, M.; Wang, Z.; Lan, X.; Liu, W.; Wu, J. Confidence-driven under-sampling decision forest for imbalanced credit scoring. Eng. Appl. Artif. Intell. 2025, 147, 110278. [Google Scholar] [CrossRef] [Scilit]
  14. Hurlin, C.; Pérignon, C.; Saurin, S. The Fairness of Credit Scoring Models. Manag. Sci. 2026, 72, 406–425. [Google Scholar] [CrossRef] [Scilit]
  15. Durand, D. Risk Elements in Consumer Instalment Financing; Number dura41-1; National Bureau of Economic Research: Cambridge, MA, USA, 1941. [Google Scholar]
  16. Altman, E.I. Financial ratios, discriminant analysis and the prediction of corporate bankruptcy. J. Financ. 1968, 23, 589–609. [Google Scholar] [CrossRef]
  17. Wang, G.; Hao, J.; Ma, J.; Jiang, H. A comparative assessment of ensemble learning for credit scoring. Expert Syst. Appl. 2011, 38, 223–230. [Google Scholar] [CrossRef] [Scilit]
  18. Yan, C.; Zhang, X.; Shen, J. Credit score classification using advanced machine learning: A comprehensive approach. J. Softw. Eng. Appl. 2025, 18, 98–112. [Google Scholar] [CrossRef]
  19. Abi, R. Machine learning for credit scoring and loan default prediction using behavioral and transactional financial data. World J. Adv. Res. Rev. 2025, 26, 884–904. [Google Scholar] [CrossRef] [Scilit]
  20. Ayari, H.; Guetari, R.; Kraïem, N. Machine learning powered financial credit scoring: A systematic literature review. Artif. Intell. Rev. 2026, 59, 13. [Google Scholar] [CrossRef] [Scilit]
  21. Friedman, J.H. Greedy function approximation: A gradient boosting machine. Ann. Stat. 2001, 29, 1189–1232. [Google Scholar] [CrossRef] [Scilit]
  22. Ayari, I.; Fakhfakh, A.; Jarboui, S. Machine learning in credit risk prediction and optimization: A comprehensive review and future directions. Artif. Intell. Rev. 2026, 59, 1–58. [Google Scholar]
  23. Nayab, D.; Khan, R.U.; Qamar, A.M. Performance Augmentation of Base Classifiers Using Adaptive Boosting Framework for Medical Datasets. Appl. Comput. Intell. Soft Comput. 2023, 2023, 5542049. [Google Scholar] [CrossRef] [Scilit]
  24. He, H.; Garcia, E.A. Learning from imbalanced data. IEEE Trans. Knowl. Data Eng. 2009, 21, 1263–1284. [Google Scholar] [CrossRef] [Scilit]
  25. Albattah, W.; Khan, R.U. Impact of imbalanced features on large datasets. Front. Big Data 2025, 8, 1455442. [Google Scholar] [CrossRef] [Scilit] [PubMed]
  26. Chawla, N.V.; Bowyer, K.W.; Hall, L.O.; Kegelmeyer, W.P. SMOTE: Synthetic minority over-sampling technique. J. Artif. Intell. Res. 2002, 16, 321–357. [Google Scholar] [CrossRef] [Scilit]
  27. Alfrhan, A.A.; Alhusain, R.H.; Khan, R.U. SMOTE: Class Imbalance Problem in Intrusion Detection System. In Proceedings of the 2020 International Conference on Computing and Information Technology (ICCIT-1441), Tabuk, Saudi Arabia, 9–10 September 2020; pp. 1–5. [Google Scholar] [CrossRef] [Scilit]
  28. He, H.; Bai, Y.; Garcia, E.A.; Li, S. ADASYN: Adaptive synthetic sampling approach for imbalanced learning. In Proceedings of the 2008 IEEE International Joint Conference on Neural Networks (IEEE World Congress on Computational Intelligence), Hong Kong, China, 1–8 June 2008; pp. 1322–1328. [Google Scholar]
  29. Harby, F.; Thaljaoui, A.; Nayab, D.; Aladhadh, S.; Khediri, S.; Khan, R. Data augmentation and random multi-model deep learning for data classification. Comput. Mater. Contin. 2023, 74, 5191–5207. [Google Scholar] [CrossRef] [Scilit]
  30. Baisholan, N.; Dietz, J.E.; Gnatyuk, S.; Turdalyuly, M.; Matson, E.T.; Baisholanova, K. A Systematic Review of Machine Learning in Credit Card Fraud Detection Under Original Class Imbalance. Computers 2025, 14, 437. [Google Scholar] [CrossRef] [Scilit]
  31. Rubaidi, Z.S.; Ben Ammar, B.; Ben Aouicha, M. Vehicle Insurance Fraud Detection Based on Hybrid Approach for Data Augmentation. J. Inf. Assur. Secur. 2023, 18, 135–146. [Google Scholar]
  32. Rubaidi, Z.S.; Ben Ammar, B.; Ben Aouicha, M. Handling Imbalance Functional and Non-Functional Software Requirement Classification Based on Machine Learning Algorithms. In International Conference on Hybrid Intelligent Systems; Springer: Cham, Switzerland, 2023; pp. 199–209. [Google Scholar]
  33. Ben Ammar, B.; Almatrafi, N.F. Classification of Requirements from Software Requirement Specification Documents: TAOS: A Novel TextAttack Oversampling Approach for Fine-Grained Classification of Software Requirements. Eng. Technol. Appl. Sci. Res. 2025, 15, 29872–29879. [Google Scholar] [CrossRef] [Scilit]
  34. Zhao, Z.; Cui, T.; Ding, S.; Li, J.; Bellotti, A.G. Resampling techniques study on class imbalance problem in credit risk prediction. Mathematics 2024, 12, 701. [Google Scholar] [CrossRef] [Scilit]
  35. Provost, F.; Fawcett, T. Robust classification for imprecise environments. Mach. Learn. 2001, 42, 203–231. [Google Scholar] [CrossRef] [Scilit]
  36. Fawcett, T. An introduction to ROC analysis. Pattern Recognit. Lett. 2006, 27, 861–874. [Google Scholar] [CrossRef] [Scilit]
  37. Saito, T.; Rehmsmeier, M. The precision-recall plot is more informative than the ROC plot when evaluating binary classifiers on imbalanced datasets. PLoS ONE 2015, 10, e0118432. [Google Scholar] [CrossRef] [Scilit]
  38. Davis, J.; Goadrich, M. The relationship between Precision-Recall and ROC curves. In Proceedings of the 23rd International Conference on Machine Learning, Pittsburgh, PA, USA, 25–29 June 2006; pp. 233–240. [Google Scholar]
  39. Chicco, D.; Jurman, G. The advantages of the Matthews correlation coefficient (MCC) over F1 score and accuracy in binary classification evaluation. BMC Genom. 2020, 21, 6. [Google Scholar] [CrossRef] [Scilit]
  40. Lundberg, S.M.; Lee, S.I. A unified approach to interpreting model predictions. Adv. Neural Inf. Process. Syst. 2017, 30, 4765–4774. [Google Scholar]
  41. Lundberg, S.M.; Erion, G.; Chen, H.; DeGrave, A.; Prutkin, J.M.; Nair, B.; Katz, R.; Himmelfarb, J.; Bansal, N.; Lee, S.I. From local explanations to global understanding with explainable AI for trees. Nat. Mach. Intell. 2020, 2, 56–67. [Google Scholar] [CrossRef] [Scilit]
  42. Montoya, A.; Reade, W.; Odintsov, K.; Kotek, M. Home Credit Default Risk. Kaggle. 2018. Available online: https://kaggle.com/competitions/home-credit-default-risk (accessed on 10 January 2026).
  43. Saidi, R.; Moulahi, T.; Zidi, S.; Mahfoudhi, S. Reliable and privacy-preserving collaborative AI in multi-tier distributed architectures. Sustain. Comput. Inform. Syst. 2026, 50, 101354. [Google Scholar] [CrossRef] [Scilit]
Figure 1. Methodology workflow of the proposed credit risk assessment framework.
Mathematics 14 01467 g001
Figure 2. ROC curves for all models versus the random classifier baseline (orange dashed line, AUC = 0.5).
Mathematics 14 01467 g002
Figure 3. Comparison of minority-class recall and F1-score on the held-out test set for gradient-boosted models trained with and without SHDO.
Mathematics 14 01467 g003
Figure 4. SHAP feature impact summary plot for XGBoost with SHDO.
Mathematics 14 01467 g004
Table 1. Test-set performance with SHDO (sorted by minority-class F1).
ModelAccuracyF1PrecisionRecallPR-AUCROC-AUC
XGBoost0.87730.25400.22030.29970.19280.7327
GBDT (sklearn)0.73170.24610.15300.62860.21180.7498
CatBoost0.90130.22800.25060.20920.18920.7242
LightGBM0.91470.17810.27070.13270.18000.7129
Logistic Regression0.58790.16780.09760.59650.10150.6200
SVM-RBF0.47670.15040.08480.66480.10550.6034
Decision Tree0.83970.14310.11400.19220.07820.5402
KNN0.63340.14040.08390.42980.08350.5606
Naïve Bayes0.88630.08040.09200.07130.08990.5932
Random Forest0.92990.02010.37840.01030.18200.7304
Extra Trees0.93050.00740.76920.00370.18050.7277
Table 2. Ablation: minority-class metrics with and without SHDO.
ModelWithout SHDOWith SHDOImprovement Factor
Recall F1 Recall F1 Recall F1
XGBoost0.0190.0370.3000.254×15.8×6.9
GBDT0.0130.0250.6290.246×48.4×9.8
CatBoost0.0160.0310.2090.228×13.1×7.4
LightGBM0.0170.0330.1330.178×7.8×5.4
Disclaimer/Publisher’s Note: The statements, opinions and data contained in all publications are solely those of the individual author(s) and contributor(s) and not of MDPI and/or the editor(s). MDPI and/or the editor(s) disclaim responsibility for any injury to people or property resulting from any ideas, methods, instructions or products referred to in the content.