


Abstract
Mine ventilation network (MVN) regulation faces severe challenges: strong variable coupling, high search dimensionality, and the inherent conflict between energy conservation and safety constraints. To address these issues, we propose a novel airflow optimization framework integrating a Minimum Influence Spanning Tree (MIST), sensitivity attenuation boundaries, and an Improved Dung Beetle Optimizer (IDBO). Initially, high-influence co-tree chords are strategically extracted via MIST to compress the mathematical optimization dimensionality. Subsequently, effective ventilation resistance search intervals are bounded using sensitivity attenuation, preventing the algorithm from performing invalid searches in high-resistance regions. Furthermore, the standard DBO is enhanced via Fuchs chaotic initialization, Golden Sine and Lens Imaging collaborative learning, and differential mutation to minimize system power consumption. A 46-branch MVN case study validates the approach, identifying an 8-dimensional control combination as the absolute minimum requirement for full compliance. Compared to state-of-the-art baselines (DBO, SSA, WOA, DE), IDBO achieved the lowest power consumption. Post-optimization, the airflow constraint satisfaction rate improved from 89.13% to 100%, and total system power decreased by 11.87% (from 185.03 kW to 163.08 kW). Ultimately, this method robustly achieves Ventilation on Demand (VoD), providing a reliable computational tool for intelligent underground mining.
Keywords:
mine ventilation network (MVN); Ventilation on Demand (VoD); topological dimensionality reduction; airflow sensitivity; improved dung beetle optimizer (IDBO); energy conservation MSC:
90C35; 90C59; 05C90
1. Introduction
In the contemporary energy supply paradigm, coal remains structurally indispensable as a primary energy source in the near term [1]. Characterized by a coal-dominated fossil fuel endowment where coal accounts for over 90% of reserves, China’s resource structure dictates coal’s fundamental supporting role in ensuring energy security and steady economic operation [2]. Although the “Dual Carbon” strategic goals are driving the restructuring of the energy mix, the high-intensity exploitation of coal will inevitably persist during the current transitional phase [3]. Consequent to the progressive depletion of shallow resources, mining depths are extending downward at an annual rate of 10 to 25 m, with dozens of domestic collieries already operating at depths exceeding 1000 m [4,5]. In deep mining environments, the continuous elevation of surrounding rock stress exacerbates a nonlinear increase in gas emission rates at the working face, thereby elevating the proportion of highly gassy and outburst-prone mines [6]. Given that gas and thermal hazards account for a substantial proportion of historical major coal mine accidents, the timely dilution and extraction of toxic gases, alongside the active regulation of the underground thermal-hygrometric environment, have emerged as critical technical bottlenecks in the safe exploitation of deep coal [7].
The mine ventilation network (MVN) is tasked with continuously delivering fresh air to various operational zones, serving as the foundational safeguard for sustaining safe underground production [8,9]. Driven by the continuous advancement of intelligent mining construction, intelligent ventilation has evolved into a crucial subsystem. Its functionalities span not only Ventilation on Demand (VoD) and airflow balancing under normal production states, but also auxiliary decision-making and emergency regulation during catastrophic scenarios [10]. Nevertheless, at the current juncture, the implementation of intelligent ventilation in the majority of Chinese coal mines remains in an embryonic or transitional phase, exhibiting constrained coordinated regulatory capabilities at the systemic level. Fundamentally, the MVN constitutes a multivariable, large-scale, and strongly nonlinearly coupled system, frequently comprising hundreds or even thousands of interconnected roadway branches [11]. Within such complex topologies, minute perturbations in local ventilation resistance parameters can trigger a cascading reconfiguration of the global air pressure distribution and airflow allocation [12]. Furthermore, the frequent alterations in mining and excavation dynamics lead to continuous fluctuations in both the network topology and the air demand of individual branches. Consequently, conventional passive regulation paradigms, which rely predominantly on localized sensory data, are increasingly inadequate to meet the stringent requirements for precise airflow distribution and rapid response in deep mine environments.
Historically, airflow regulation relied predominantly on empirical manual interventions, typically reallocating airflow by installing ventilation regulators or adjusting the operating conditions of fan blades. Such static and passive regulation paradigms inherently struggle to manage the coupled linkage responses of network-wide airflow redistribution, particularly as the number of network branches increases and topological coupling becomes highly complex [13]. Following the integration of computational numerical simulations into mine ventilation research, network resolution based on the loop airflow method and nodal pressure method has gradually emerged as the mainstream technical trajectory [14]. Building upon this foundation, researchers began incorporating conventional mathematical programming methodologies to solve the airflow allocation problem. Wen et al. [15] proposed a Mixed-Integer Nonlinear Programming (MINLP) regulation approach to minimize local ventilation resistance, while Li et al. [12] conducted energy-reduction computations for fundamental pipe networks utilizing an airflow asymptotic calculation model. Although these analytical methods demonstrate rigorous mathematical formulations, their solving processes are highly susceptible to becoming trapped in local optima when applied to real-world mine ventilation networks characterized by high-dimensionality, strong nonlinearity, and multi-modal landscapes, exhibiting profound sensitivity to initial parameter configurations.
With the advancement of mine automation, the “Ventilation-on-Demand (VoD)” concept has shifted airflow regulation from traditional empirical adjustments toward research paradigms focused on control and verification [16]. Within this context, various studies have explored the application of data-driven methodologies for the dynamic regulation of mine ventilation systems. Hao et al. [17] experimentally demonstrated that the coordinated speed control of multiple main fans facilitates the reduction in system energy consumption, while Ihsan et al. [18] validated the feasibility of dynamic airflow distribution using neuro-fuzzy models at a laboratory scale. To address the complex and volatile environments of deep mines, Yang et al. [19] proposed a five-dimensional digital twin architecture that employs LSTM-Attention hybrid neural networks to characterize the temporal evolution of airflow, integrated with adaptive Model Predictive Control (MPC) to achieve dynamic management and closed-loop regulation. To further characterize the spatial topological features of the network, Zhang et al. [20] utilized Graph Neural Networks (GNNs) to extract structural dependencies and combined them with the Actor-Critic algorithm in Deep Reinforcement Learning (DRL) to identify optimal decision paths within complex regulation spaces. Overall, while these data-driven studies exhibit significant potential in real-time sensing, dynamic prediction, and online optimization, their decision-making processes remain heavily dependent on training datasets and model architectures. Consequently, their physical interpretability is relatively limited, making it challenging to provide intuitive and traceable regulatory evidence for personnel in practical engineering applications.
In contrast, swarm intelligence (SI) optimization algorithms, characterized by their gradient-free nature and robust global search capabilities, have increasingly emerged as a pivotal methodology for addressing nonlinear airflow optimization problems [21]. Wang et al. [22] developed a modified sooty tern optimization algorithm (mSTOA) and incorporated the minimum spanning tree (MST) method to preprocess decision variables, achieving optimal airflow distribution aimed at minimizing the total power consumption of complex networks. Sun and Wang [23] introduced a multi-objective beluga whale optimization (MOBWO) algorithm, which significantly improved the uniformity of airflow distribution among network branches. Furthermore, Li et al. [24] proposed an enhanced bare-bones particle swarm optimization (BBPSO) algorithm, enhancing both solution accuracy and convergence efficiency through the construction of a multi-objective intelligent decision-making model.
Nevertheless, existing swarm intelligence (SI) algorithms exhibit three primary limitations when addressing large-scale and complex mine ventilation networks (MVNs) [25]. First, regulation variables are typically selected directly from all adjustable branches across the network without a pre-screening mechanism based on network topology and airflow transmission relationships; this subjects the algorithms to the “curse of dimensionality” within a vast combinatorial space and potentially neglects significant aerodynamic coupling effects between branches. Second, the upper search bounds for branch resistance are predominantly determined by empirical constants, failing to adequately account for the sensitivity attenuation phenomenon in airflow distribution under high-resistance conditions; consequently, the search process frequently enters ineffective “high-resistance, low-response” regions [26]. Third, when solving high-dimensional MVN optimization problems subject to multiple physical constraints, fundamental SI algorithms are susceptible to insufficient early-stage exploration, premature mid-term search contraction, and terminal local stagnation.
To resolve the aforementioned challenges, this paper proposes an intelligent mine airflow regulation method that integrates topological dimensionality reduction, sensitivity boundary definition, and an improved dung beetle optimizer (IDBO). Specifically, regarding the screening of regulation variables, a Minimum Influence Spanning Tree (MIST) strategy is proposed by synthesizing graph-theoretic structures with airflow response characteristics. This strategy leverages the topological interrelationship between the spanning tree and the cotree to assign low-impact branches to the spanning tree while retaining high-response branches—acting as regulation hubs—within the cotree, thereby achieving dimensionality reduction with clear physical interpretability prior to optimization. Secondly, the law of airflow sensitivity attenuation is introduced to replace empirical constant boundaries, quantitatively establishing effective resistance search upper limits for candidate branches to circumvent the “sensitivity dead zone.” Finally, to address the susceptibility of the standard dung beetle optimizer (DBO) to local optima in complex ventilation network optimization, an improved version (IDBO) is developed. The algorithm enhances global search performance within complex ventilation networks by incorporating hybrid initialization, Golden Sine-Lens Imaging synergistic learning, and random differential mutation strategies. This study integrates topological screening, resistance interval definition, and heuristic search into a unified framework to achieve coordinated optimization among airflow constraints, fan operating boundaries, and system energy consumption. The theoretical framework is illustrated in Figure 1, and the subsequent sections will elaborate on the ventilation network model, candidate branch screening, boundary definition, algorithm enhancement, and numerical case validation.
Figure 1.
Theoretical framework and solution procedure for mine ventilation network optimization.
2. Optimization Model and Solving Strategy for Mine Ventilation Networks
2.1. Mathematical Model for MVN Optimization
A mine ventilation network (MVN) can be mathematically abstracted as a directed graph system comprising nodes and branches, where the internal airflow distribution is strictly constrained by fluid dynamics principles and topological connectivities. To formulate an optimization model that synergistically balances safety-critical airflow supply and energy consumption, the physical ventilation network is initially mapped onto a mathematical graph structure, denoted as . Assuming the network consists of nodes and branches, the ventilation resistances of specific adjustable roadways are designated as the decision variables for airflow regulation, denoted by the vector .
The primary objective of this optimization model is to facilitate “Ventilation on Demand” (VoD). Aligned with practical production requirements, the mine roadways are categorized into three distinct classes: target airflow branches, secondary airflow branches, and general branches. Specifically, target airflow branches represent critical operational areas, such as coal mining faces, where the airflow volume must be tightly regulated to approximate predefined target values. In the context of Swarm Intelligence (SI) optimization algorithms, the direct imposition of hard constraints with rigid boundaries often precipitates population stagnation or induces cyclical iterations proximate to infeasible regions. To circumvent this limitation, the airflow constraints and equipment operational limits are transformed into penalty functions. These are subsequently aggregated with the total system power consumption to formulate a comprehensive fitness function, , which governs the outer-loop evaluation of the SI algorithm. This fitness function comprises the following three fundamental components:
- (1)
- Airflow Deviation Penalty
To quantify the extent to which the calculated actual airflow, , deviates from the permissible interval stipulated by the Coal Mine Safety Regulations, an airflow penalty term, , is formulated. This term evaluates to zero when the branch airflow falls within the allowable interval; conversely, if the airflow violates the upper or lower boundaries, the penalty value grows quadratically with the deviation, thereby reinforcing the algorithm’s preference for the feasible solution region. Its mathematical expression is given by Equation (1):
- (2)
- Total System Power Consumption
The operational state of the main ventilation fan fundamentally dictates the overall energy consumption level of the ventilation system. Given that this study focuses on the relative variations in network ventilation burdens under diverse resistance regulation schemes, the product of the fan’s operating pressure and its passing airflow volume is utilized to construct an equivalent energy consumption index, , which characterizes the system’s ventilation power demands across various operating conditions. Consequently, the minimization of this index is established as the primary optimization objective. Let denote the operating pressure of the branch where the main fan is located, and represent the total airflow volume passing through the fan. The system’s baseline energy consumption function, , can be expressed as Equation (2):
- (3)
- Fan Anti-Surge Penalty
During the airflow regulation process, a continuous increase in the total network resistance may cause the fan’s operating point to drift toward a high-pressure, low-airflow region. In accordance with the classification standards for mine ventilation resistance, the maximum allowable static pressure threshold for the mine is set at Pa in this study. If the calculated fan pressure exceeds this threshold, a one-sided quadratic penalty term, , is introduced to prevent the optimization solutions from entering operating intervals associated with potential surge risks. Its formulation is represented as Equation (3):
Integrating the aforementioned three components, the outer-loop comprehensive fitness function of the swarm intelligence algorithm can be formulated as Equation (4):
A hierarchical configuration is adopted for the penalty factors. This study conceptualizes the fan static pressure boundary as an equipment operational constraint and the lower limit of airflow as a safety supply constraint, both of which take absolute precedence over the energy consumption objective. Based on this hierarchy, the penalty factors are empirically set to and . The objective here is not to optimize the penalty parameters themselves, but rather to utilize order-of-magnitude differentiation to heavily penalize out-of-bound solutions during fitness evaluation, thereby guaranteeing that the search process prioritizes regions where both fan boundaries and airflow constraints are simultaneously satisfied.
Although the outer-loop swarm intelligence algorithm addresses airflow and equipment threshold constraints via penalty functions, the actual internal airflow distribution, denoted as , must inherently be determined by solving the governing ventilation network equations. Consequently, this paper formulates a nested computational framework: the inner-loop ventilation network solver is tasked with satisfying the three fundamental ventilation balance principles, while the outer-loop IDBO algorithm searches within the prescribed resistance boundaries to identify the optimal combination of regulation variables that minimizes the comprehensive fitness function.
The corresponding mathematical model is formulated as Equation (5):
where denotes the set of branches incident to node ; represents the set of branches constituting the -th fundamental mesh (independent loop); is the frictional resistance of branch ; and signify the natural ventilation pressure (NVP) and the fan pressure within the -th loop, respectively; defines the filtered set of branches targeted for regulation; and specifies the feasible search interval dictated by the roadway attributes and sensitivity attenuation characteristics.
2.2. Screening of Regulation Variables and Solving Strategy
2.2.1. Branch Selection Strategy Guided by Co-Tree Chords
According to graph theory, for the topological graph of a mine ventilation network (MVN), any spanning tree, , comprises tree edges, while the remaining edges constitute the co-tree set, denoted as . Structurally, each chord within the co-tree, in conjunction with its corresponding path in the spanning tree, uniquely defines a fundamental cycle [27]. According to mesh analysis principles, deploying regulation facilities (e.g., ventilation windows) on the co-tree set ensures that a single regulatory action primarily influences its designated fundamental cycle. Compared to direct regulation on arbitrary branches, this strategic placement facilitates a clearer mapping between regulatory variables and cycle responses, thereby significantly mitigating cross-variable coupling interference [23].
Let the column vector of the network airflow be defined as , where represents the airflow vector of the tree edges and denotes the airflow vector of the chords. Defining the fundamental cycle matrix as , its canonical block form can be expressed as , where is the identity matrix corresponding to the chords. Governed by the principle of airflow conservation, the relationship between the branch airflow and the chord airflow satisfies the following linear transformation:
Expanding Equation (6) according to its block matrix formulation yields the explicit relationship between the tree edge airflow and the chord airflow:
Equation (7) elucidates that variations in the chord airflow, , propagate directly to the tree edge airflow, , thereby subsequently governing the global airflow distribution, . Consequently, prioritizing the placement of regulatory variables on the chords is highly advantageous for delineating the network-wide airflow redistribution process utilizing a minimal set of control variables. In contrast to directly imposing regulations on spanning tree edges, this chord-based variable organization inherently possesses superior topological independence, thereby facilitating a substantial reduction in the computational dimensionality. From the perspective of optimization algorithms, this mathematical treatment effectively eliminates redundant search spaces and mitigates the solver instability typically induced by cross-variable entanglement.
2.2.2. Branch Screening Strategy Based on the Minimum Influence Spanning Tree (MIST)
Although any arbitrary co-tree set can mathematically characterize network-wide airflow control, the response intensities of individual branches to airflow redistribution vary significantly in practical engineering regulation. To systematically extract branch locations endowed with superior regulatory efficacy from the vast combinatorial space of spanning trees, this study introduces a metric termed “branch influence degree,” denoted as . This metric quantifies the cumulative response elicited by a resistance variation in a singular branch across the global airflow distribution of all branches. It is rigorously defined as the sum of the absolute values of the elements comprising the -th column within the airflow sensitivity matrix :
In practical regulation scenarios, a higher influence degree typically signifies that even marginal perturbations in the branch’s ventilation resistance can precipitate profound global airflow responses. For regulatory objectives oriented towards energy consumption mitigation, such highly sensitive branches inherently constitute optimal candidates for prioritized regulation. Given that regulatory facilities are strategically deployed within the co-tree set, the fundamental imperative of variable screening is to ensure the maximum retention of high-influence branches within the co-tree.
Motivated by this rationale, this paper proposes a novel screening strategy grounded in the Minimum Influence Spanning Tree (MIST). Let denote the set encompassing all permissible spanning trees within the network topology. The determination of the MIST can then be mathematically transformed into the following optimization problem, which seeks a specific spanning tree that minimizes the aggregate influence degree of its constituent tree edges:
By assigning the influence degree of each branch as its corresponding graph edge weight, this optimization problem can be efficiently solved utilizing Prim’s algorithm [28]. During the algorithmic construction of the spanning tree, low-sensitivity branches with minimal influence degrees are preferentially incorporated, thereby forming the fundamental transmission backbone of the network. Conversely, the high-influence branches—systematically excluded from the spanning tree to prevent cycle formation—constitute the optimal co-tree set , which functionally serves as the candidate set for subsequent regulation variables:
Through this topological bifurcation, low-sensitivity branches are securely retained within the spanning tree to sustain the network’s basic transport framework, whereas high-sensitivity co-tree chords are prioritized as focal positions for active regulation. Consequently, the regulatory variables are intensely concentrated on branches exhibiting profound responsiveness to global airflow dynamics. This strategically facilitates the precise redistribution of airflow in target zones with minimal required resistance adjustments, simultaneously diminishing the proportion of invalid searches during the algorithmic execution. From the perspective of engineering implementation, this topological partitioning paradigm is highly advantageous for synergistically reconciling regulation efficiency with rigorous energy consumption control.
2.3. Delineation of Resistance Modification Boundaries Based on Sensitivity Attenuation Characteristics
During practical resistance-increasing regulation, the sensitivity coefficient, , is not a static constant. As the resistance of the regulated branch, , continuously increases, its response to the airflow of the target branch, , typically attenuates; that is, the variation in airflow induced by a unit increase in resistance exhibits a diminishing trend [13]. If continuous resistance increments are applied based solely on the initial sensitivity information, subsequent regulations may fail to yield commensurate airflow compensation, but rather unnecessarily superimpose ventilation resistance and escalate system energy consumption. Recognizing this phenomenon, this paper introduces a sensitivity attenuation model to rigorously delineate the resistance search boundaries within the optimization solving process.
To mathematically characterize this progressive attenuation of regulatory response with respect to resistance variations, the sensitivity is formulated as a continuous function of resistance. Previous studies indicate that a power function form effectively captures such attenuation relationships, while its concise analytical expression facilitates subsequent derivation and boundary inversion. Therefore, a power function is adopted in this study to mathematically represent the sensitivity attenuation law. Specifically, equal-step resistance-increasing perturbations are applied to each candidate regulation branch around its initial resistance. The variation sequence of the target branch’s airflow sensitivity under corresponding conditions is then recorded, formulating the following fitting model:
where , , and denote the fitting parameters. In the context of this study, a condition of signifies an overall declining trend in sensitivity as resistance increases. Taking the first-order derivative of Equation (11) yields the analytical expression for the sensitivity attenuation rate:
Based on the aforementioned attenuation model, the effective resistance interval, , for the regulated branch is further delineated. The lower limit, , is predominantly determined by the intrinsic physical conditions of the roadway. In the absence of supplementary pressurization equipment, the roadway resistance is typically no less than its initial frictional resistance; hence, the initial resistance is designated as the lower regulation limit, namely .
Regarding the upper limit, , this study delineates it based on the concept of a sensitivity deadband. As resistance continuously escalates, the absolute value of sensitivity, , gradually diminishes and asymptotically approaches zero. Once it attenuates to a specific engineering threshold of its initial value , further resistance increments yield highly limited airflow compensation. Drawing upon the treatment of diminishing marginal regulation benefits in related research, this study establishes as the criterion for the effective regulation endpoint; that is, the resistance corresponding to a sensitivity attenuation to of its initial value is regarded as the effective upper regulation limit. Thus, establishing the critical condition , and substituting it into the fitting model for inversion, yields the effective upper regulation limit:
Consequently, by integrating the initial roadway resistance with the sensitivity attenuation characteristics, the effective resistance regulation interval for the -th branch can be deterministically established. This interval furnishes the subsequent swarm intelligence algorithm with a priori search boundaries imbued with engineering significance, rigorously constraining the solving process to resistance ranges that still generate pronounced airflow responses and averting continuous expansion into high-resistance, low-response regions. For the MVN optimization problem discussed herein, this mathematical treatment significantly compresses the search space and mitigates the superfluous energy consumption and on-site regulatory burdens potentially induced by excessive resistance increments.
3. Design and Analysis of the Improved Dung Beetle Optimizer (IDBO)
3.1. The Standard Dung Beetle Optimizer (DBO)
The Dung Beetle Optimizer (DBO) is a swarm intelligence (SI) optimization method inspired by the natural behaviors of dung beetles, specifically ball-rolling, dancing, breeding, foraging, and stealing [29]. The algorithm strategically partitions the population into four distinct agent types: ball-rolling dung beetles, brood balls, small dung beetles, and thieves. Each role is assigned specific search tasks during the iterative process. Through the synergistic coordination of these behaviors, the algorithm establishes an effective division of labor between global exploration and local exploitation, thereby accomplishing a comprehensive iterative search of the solution space.
- (1)
- Ball-Rolling and Dancing Behaviors
During the early stages of the algorithm, ball-rolling dung beetles roll continuously in a given direction guided by celestial light sources; upon encountering obstacles, they dynamically adjust their movement trajectory via dancing and rotating. This behavior predominantly corresponds to the global exploration phase of the algorithm. The position update mechanism can be mathematically unified as Equation (14):
where denotes the current iteration number; represents the spatial position of the -th dung beetle at the -th iteration; is the deflection coefficient, and is a defined constant; acts as the natural coefficient; denotes the perturbation term induced by the global worst position, ; and is the deflection angle, where the position remains strictly unupdated if or .
- (2)
- Breeding Behavior
During the breeding phase, the algorithm dynamically delineates the spawning area boundaries utilizing the current local optimal solution, , and subsequently updates the positions of the brood balls:
where and denote the lower and upper search boundaries of the problem space, respectively; is a dynamic coefficient; represents the position of the brood ball; and and are independent random vectors.
- (3)
- Foraging Behavior
Small dung beetles conduct localized searches within a foraging area guided by the global optimal position, . This biological process corresponds mathematically to local exploitation within the neighborhood of the optimal solution. The mathematical formulation for its position update is given by:
where and represent the lower and upper boundaries of the dynamic foraging area; is a random scalar following a standard normal distribution; and is a randomly generated vector.
- (4)
- Stealing Behavior
In the stealing phase, the agent’s positional update is synergistically guided by both the global optimal position, , and the local optimal position, , formulated as:
where is a predefined constant; and is a normally distributed random vector utilized to mathematically characterize the random walk perturbation intrinsic to this phase.
3.2. Design of the Improvement Strategies
3.2.1. Hybrid Initialization Strategy Based on Fuchs Chaos and Dynamic Opposition-Based Learning
The optimization of mine ventilation networks diverges fundamentally from conventional unconstrained continuous optimization problems. Its search space is simultaneously strictly bounded by resistance limits and fan static pressure constraints, and compressed by airflow compliance conditions, resulting in an exceptionally narrow feasible region. Furthermore, local resistance adjustments propagate across multiple branches via network topological coupling, frequently causing the search trajectory to prematurely contract toward a limited number of feasible subspaces. Tailored to these specific problem characteristics, this study strategically embeds enhancements across three pivotal phases: initial coverage, local updating, and late-stage perturbation. Each strategy is meticulously designed to target the most vulnerable stages of the optimization process, rather than being appended as isolated, disjointed modules.
The conventional DBO typically initializes its population utilizing a pseudo-random approach, which frequently yields an uneven distribution of individuals within the solution space, rendering certain regions inadequately covered during the crucial initial phase [30]. To mitigate this deficiency, this paper proposes a hybrid initialization strategy integrating the Fuchs chaotic map with dynamic Opposition-Based Learning (OBL) [31]. Primarily, the ergodicity and extreme sensitivity to initial conditions inherent in chaotic maps are leveraged to replace standard pseudo-random functions, thereby substantially enhancing the initial population’s coverage across the complex solution space. The iterative formulation of the Fuchs chaotic map is defined as Equation (20):
where denotes the chaotic sequence value generated at the -th iteration. By mapping this generated sequence onto the feasible solution space of the problem, the initial chaotic population is formulated as Equation (21):
where signifies the spatial coordinate of the -th individual in the -th dimension; and and represent the strict lower and upper search boundaries of that dimension, respectively.
Subsequently, the algorithm incorporates a dynamic OBL mechanism to construct candidate solutions positioned on the exact diametrical opposite of the current population within the solution space. For the chaotic population generated via the Fuchs map, the corresponding opposite solution, , is computed based on its dynamic boundaries across each dimension:
where is a uniformly distributed random scalar within the interval . Compared to conventional OBL paradigms bounded by fixed upper and lower limits, dynamic boundaries adaptively adjust alongside spatial variations in the population distribution, thereby generating highly targeted opposing perturbations strictly within the current search vicinity. Finally, the original chaotic population and the opposition-based population are coalesced to form a comprehensive candidate pool of size . Following a rigorous fitness evaluation and sorting, the top individuals are optimally retained to constitute the final initial population. Through this mathematically rigorous treatment, the candidate sources for the initial population are significantly broadened, which instrumentally ameliorates the search coverage landscape during the critical early iterations.
3.2.2. Golden Sine and Lens Imaging Collaborative Learning Mechanism
To dynamically modulate the algorithmic updates of the DBO between local exploitation and global exploration, this paper devises a dual-strategy collaborative mechanism driven by a control factor, . Serving as a state-switching threshold, dictates whether an agent executes the local exploitation strategy or the opposition-based learning strategy during the current iteration.
When , the algorithm executes the Golden Sine Strategy (GSS) [32]. This strategy leverages the periodic variations of the cosine function to contract the search space and integrates the golden ratio to guide agents in conducting intensive local exploitation adjacent to the current optimal solution. The corresponding position update formulation is expressed as Equation (23):
where denotes the adaptive convergence factor utilized to govern the variations in the search step size; and are independent random weights uniformly distributed within the interval ; and and represent two dynamically generated contraction nodes based on the golden ratio , which strictly bound the local search vicinity.
Conversely, when , the algorithm activates the Lens Imaging Opposition-Based Learning (LIOBL) strategy [33]. Taking the current global optimal solution, , as the focal reference point, this strategy constructs an opposite candidate solution on the diametric side of the search space via a scaling factor, . The positional mapping is mathematically formulated as Equation (24):
where signifies the lens imaging scaling coefficient. Through this oppositional mapping paradigm, agents can effectively escape the local aggregation state proximate to the current optimal neighborhood, thereby providing novel candidate trajectories for subsequent explorations.
3.2.3. Random Differential Mutation and Greedy Retention Strategy
During the later stages of iteration, the progressive spatial convergence of the population may precipitate a decline in diversity, concomitantly elevating the risk of premature convergence. To persistently maintain an adequate perturbation capacity during the convergence phase, a random differential mutation mechanism [34] is introduced to recombine individual spatial coordinates. The update formulation is defined as Equation (25):
where represents the newly generated candidate solution post-mutation; denotes a distinct individual randomly selected from the current population, ensuring it differs from the active agent; and and are uniformly distributed random weights within the interval . Within this equation, the second term leverages the information from the current optimal individual to direct the search trajectory, whereas the third term introduces supplementary perturbations via random individual variations to actively preserve population dispersion during the late-stage search.
Following the mutation operation, the algorithm employs a Greedy Selection mechanism to deterministically dictate whether an individual’s position is updated:
where represents the comprehensive fitness function defined previously. This mechanism exclusively executes a replacement if the new candidate solution exhibits a superior fitness relative to the original position. Consequently, it guarantees the monotonic and orderly progression of the population’s overall fitness despite the continuous introduction of mutational perturbations.
3.3. Algorithmic Procedure of the IDBO
Building upon the multi-role collaborative framework of the standard DBO, the proposed IDBO restructures three pivotal phases: initialization, main loop updating, and late-stage population reconstruction. As illustrated in Figure 2, the algorithmic procedure is delineated into four sequential stages: high-quality initialization, iterative role updating, mutational reconstruction, and termination evaluation with result output. The respective enhancement strategies are seamlessly embedded into their corresponding steps and executed sequentially throughout the iterative process.
Figure 2.
Flowchart of the IDBO algorithm.
The comprehensive execution flow is detailed as follows. First, during the initialization phase, the algorithm eschews the singular pseudo-random generation method of the standard DBO. Instead, it utilizes the Fuchs chaotic map to generate initial candidate individuals, followed by the construction of corresponding opposite solutions via dynamic opposition-based learning, thereby formulating the initial population, .
Second, in the main loop and role updating phase, the algorithm preserves the fundamental updating mechanisms for the ball-rolling, dancing, foraging, and stealing agents, completing a standard cycle of swarm spatial evolution. For the local exploitation process during the breeding phase, the IDBO additionally introduces an adaptive factor, , to serve as a strategy-switching condition. When , the agent executes the Golden Sine local search; conversely, when , it transitions to Lens Imaging Opposition-Based Learning to generate novel candidate positions outside the current superior region. The alternate application of these two updating modalities on the breeding agents yields a temporary population, denoted as . This design liberates the search direction of the breeding phase from being rigidly confined to the original spawning boundaries. Instead, it dynamically calibrates between neighborhood exploitation and oppositional expansion in response to the iterative state, thereby alleviating local search stagnation under complex, multi-modal conditions.
Subsequently, once all agent types have completed a full cycle of position updates, the algorithm applies random differential mutation to the temporary population. This procedure constructs a new candidate solution, , utilizing the spatial information of the current individual, the global optimal individual, and a randomly selected individual. A greedy selection mechanism is then employed to determine whether should replace the original position, thereby yielding the updated population, . Rather than altering the aforementioned division of roles, this phase superimposes supplementary perturbations and screening processes. This ensures that the population retains sufficient diversity during the late stages of iteration, significantly mitigating the probability of premature convergence induced by excessive individual aggregation.
In summary, the IDBO retains the multi-role collaborative updating framework of the DBO while strategically refining the initialization, the breeding phase search, and the late-stage population reconstruction processes. At the conclusion of each iteration, the algorithm evaluates the termination criterion, , to determine whether to cease the search. If the termination condition is satisfied, the current optimal resistance solution, , is outputted; otherwise, the process loops back to the main iterative cycle. This rigorous architecture is perfectly adapted to the iterative solving demands of the MVN optimization model.
3.4. Performance Evaluation of the Algorithm
To evaluate the search performance of the IDBO, comparative experiments are conducted against DBO, DE, GWO, and SSA using benchmark functions under unified parameter configurations. Given the stochastic nature of swarm intelligence algorithms, each test function is executed for 30 independent runs, with the minimum (Min), average (Avg), and standard deviation (Std) recorded for subsequent statistical evaluation. Furthermore, average convergence curves, the Wilcoxon signed-rank test, and the rank-sum test are employed to facilitate a comprehensive analysis of convergence behavior, result stability, and the statistical significance of performance disparities across the selected algorithms. Regarding function selection, F5, F21, F24, and F27 are extracted from classical benchmark sets to investigate algorithm performance across diverse scenarios, specifically focusing on unimodal convergence, multimodal search, and the capability to bypass local optima interference.
As illustrated in Figure 3, IDBO exhibits a rapid initial descent across F5, F21, and F27, indicating its superior capability to navigate toward promising regions during the early stages of iteration. During the mid-to-late stages, the convergence curves of several comparative algorithms tend to plateau on F21, F24, and F27, whereas IDBO maintains a consistent descent, demonstrating robust continuous optimization performance even within complex search landscapes. Overall, IDBO demonstrates distinct advantages in both initial search efficiency and the avoidance of premature stagnation during later stages, underscoring an effective equilibrium between exploration and exploitation throughout the evolutionary process.
Figure 3.
Landscapes and convergence curves of benchmark functions. (warmer colors indicate higher function values, while cooler colors indicate lower function values).
According to the statistical results from 30 independent runs (Table 1), IDBO yielded the optimal mean and best values across F21, F24, and F27, recorded as 14,829.97, 2969.84, 3340.96 and 13,584.41, 2600.34, 3224.34, respectively. On function F5, the mean value of IDBO was 639.80; although it did not surpass DE, it remains highly competitive among the evaluated algorithms. Regarding the standard deviation (Std), IDBO maintained consistently low levels on F21 and F27, indicating robust stability under complex multimodal search landscapes and strong local optima interference. On F24, although the standard deviation was not the minimum among the compared algorithms, the mean and best values remained superior to most others, suggesting that the algorithm effectively secures superior global outcomes while maintaining search efficacy. In summary, IDBO simultaneously achieved the optimal mean and best values on three out of the four representative test functions, demonstrating a robust comprehensive optimization performance across diverse search scenarios.
Table 1.
Statistical results of 30 independent runs for benchmark functions.
Further non-parametric statistical tests (Table 2 and Table 3) indicate that the performance disparities between IDBO and most comparative algorithms possess statistical significance. Taking the Wilcoxon rank-sum test as an example, the -values for IDBO relative to DBO, DE, and SSA on function F21 are , , and , respectively. On F24, the corresponding -values are , , and , while in F27, all comparisons with DBO, DE, and GWO consistently yield -values below the 0.05 threshold. The results of the Wilcoxon signed-rank test are fundamentally consistent with these findings, demonstrating that the performance enhancement of IDBO is not primarily attributable to stochastic fluctuations but maintains statistical robustness across the majority of comparisons.
Table 2.
Wilcoxon signed-rank test results.
Table 3.
Wilcoxon rank-sum test results.
In summary, the benchmark function testing results demonstrate that IDBO exhibits faster convergence, superior result stability, and robust comprehensive search capabilities across representative unimodal, multimodal, and high local-interference functions, thereby establishing a solid algorithmic foundation for subsequent applications in mine ventilation network optimization.
4. Experimental
4.1. Case Background and Experimental Setup
4.1.1. Description of Ventilation Parameters
To evaluate the applicability of the proposed model and optimization algorithm in practical mining environments, a coal mine is selected as a representative engineering case study. The mine has a designed annual capacity of 900,000 tons, with primary extraction occurring across the upper and lower coal seams. Although categorized as a low-gas mine, the coal seams present inherent risks of spontaneous combustion and coal dust explosion. Consequently, the ventilation system must not only satisfy routine air supply requirements but also ensure precise safety air distribution for both key working areas and auxiliary air-demand locations.
The ventilation system is abstracted into a directed network comprising 30 nodes and 46 branches, the topological structure and branch numbering of which are illustrated in Figure 4. Within this network, Node 1 serves as the intake source, and the main fan is positioned on Branch 26, which corresponds to the return airway. Branch categories, including general roadways, key air-demand locations, auxiliary locations, and the main fan loop, are explicitly distinguished in the topology. To characterize the physical parameters and airflow distribution states of the network, Table 4 summarizes the initial resistance values, lower limits of safety airflow, and the calculated airflow volumes under natural distribution, obtained using the Hardy–Cross iterative method.
Figure 4.
Topology of case mine ventilation network. (black numbers denote node numbers, and blue numbers denote branch numbers).
Table 4.
Initial parameters of ventilation network.
The specific geometric parameters of the case roadways, such as length and cross-sectional area, are equivalently represented in the frictional resistance values listed in Table 3 via the relevant resistance formulas. Consequently, the fundamental inputs for the case analysis in this study are the branch resistance parameters rather than the individual geometric dimensions of each roadway. From the perspective of the network’s physical context, the high resistance values of branches 7 and 29 correspond to locations designated for airflow-blocking structures, such as air doors. Conversely, branches 5, 9, 15, 21, 35, 36, and 43, which exhibit relatively excessive initial airflows, are identified as candidate locations for the subsequent installation of regulating windows and the implementation of resistance-increasing regulation. The resistance values across the 46 branches of the network exhibit a significant span, ranging from a minimum of 0.0024 (e.g., branches 9, 15, 35, and 36) to a maximum of 100.0000 (branches 7 and 29).
Regarding the topological structure, the network is composed of a main intake airway, airflow demand branches in both wings, and a main fan loop. Specifically, key air-demand sites are primarily distributed along the upper-right and lower mining area branches, while auxiliary demand branches are mostly integrated into the main network as low-resistance parallel systems. This structural configuration establishes the network foundation for an initial distribution pattern characterized by the coexistence of local airflow surpluses and deficiencies.
Additionally, the lower thresholds for safety airflow requirements for each branch in Table 4 are established in accordance with the statutory mandates of Article 136 in the Coal Mine Safety Regulations (2022 Edition) regarding permissible airflow velocities in underground roadways. For instance, the mandated minimum airflow velocity for a coal mining face must not fall below 0.25 m/s. On this basis, this study defines the minimum required airflow as the baseline compliance boundary within the case network, ensuring that the optimized airflow distribution strictly adheres to the minimum ventilation standards necessitated for safe production.
4.1.2. Initial Calculation Results and Supply–Demand Imbalance Analysis
As evidenced by the initial computational results in Table 3, the mine ventilation network (MVN) exhibits a pronounced supply–demand deviation under the natural airflow distribution state. Regarding distribution characteristics, certain auxiliary ventilation locations and service roadways acquire excessive airflow, whereas the actual airflow allocated to several production-related branches falls alarmingly below the lower safety bounds. Taking auxiliary ventilation branches as an illustrative example, the lower bound of airflow demand for branch 5 is 2.25 m3/s, yet its initial calculated airflow surges to 12.55 m3/s; similarly, while the lower demand bounds for branches 15, 35, and 36 are uniformly 2.25 m3/s, their actual airflow volumes reach 9.21 m3/s, 26.98 m3/s, and 9.04 m3/s, respectively. Correspondingly, the initial ventilation resistance of these branches is exceptionally low—for instance, branches 15 and 35 both register a resistance of 0.0024 Ns2/m8. Consequently, airflow is naturally biased to distribute toward such low-resistance pathways within parallel systems.
In stark contrast, several coal mining faces and their associated rise branches suffer from severe airflow deficiencies. The lower safety bounds for branches 7 and 29 are both 15.00 m3/s, yet their naturally distributed airflow volumes are merely 0.80 m3/s and 0.85 m3/s, respectively; furthermore, branch 18 has a lower bound of 3.75 m3/s but an initial airflow of 2.48 m3/s; branch 19 requires 2.25 m3/s but receives 2.24 m3/s; and branch 38 demands 3.75 m3/s but secures only 3.00 m3/s. Analyzing the resistance parameters, these deficient branches exhibit significantly higher resistances than the aforementioned surplus branches. Specifically, the resistances of branches 18, 19, and 38 are 0.3678, 0.4529, and 0.5887 Ns2/m8, respectively, while branches 7 and 29 reach an extreme of 100.0000 Ns2/m8. Given the current network topology and resistance distribution, airflow inherently gravitates toward low-resistance pathways, thereby precipitating this initial configuration characterized by the coexistence of localized airflow surpluses and deficiencies.
Predicated on these initial airflow allocation results, it is imperative to strictly delineate the scope of adjustable branches prior to formulating the optimization model. First, branches deemed unsuitable as targets for active resistance addition must be systematically excluded. The first category comprises critical branches situated along the main intake and return trunks, as well as those within the main fan circuit, such as branches 1, 2, and 26. Located on the primary arterial ventilation pathways, directly imposing resistance increases on these branches would inevitably elevate the total network resistance and detrimentally alter the operating point of the main fan. The second category encompasses branches that currently suffer from airflow deficiencies, such as branches 7, 18, 19, 29, and 38. Since the actual airflow in these branches is already proximate to or below the lower safety bounds, further increasing their resistance would solely exacerbate the localized airflow shortage; hence, they are strictly precluded from the active regulation set.
Following the exclusion of these branches, priority among the remaining candidates is assigned to auxiliary roadways and service branches that currently exhibit relative airflow surpluses and possess an adequate regulation margin. Referencing Table 3, the initial calculated airflows for branches 5, 9, 15, 21, 35, 36, and 43 substantially exceed their respective lower safety bounds. Notably, branch 21 records an initial airflow of 24.06 m3/s against a minimal bound of 2.25 m3/s; branch 9 registers 19.15 m3/s against a 2.25 m3/s bound; and branch 43 demonstrates 19.86 m3/s against a 3.75 m3/s bound. This quantitative evidence verifies that these branches possess a substantial airflow reduction margin under the natural distribution state, thereby qualifying them as optimal candidate targets for subsequent resistance-increasing regulation.
The screening of candidate branches in this study is not executed as a monolithic step; rather, it follows a rigorous multi-stage procedure. First, guided by the attributes of primary ventilation channels and critical safety constraints, the main intake/return branches and currently under-ventilated branches are methodically eliminated. Second, from the remaining pool of adjustable branches, the MIST algorithm is deployed to selectively retain high-influence co-tree chords, forming the topological candidate set. Finally, these candidate branches are rigorously sorted according to their respective influence degree metrics, providing the foundational sequence for conducting systematic ablation experiments wherein variables are progressively introduced. Following this rigorous multi-stage procedure, the finalized candidate set inherently satisfies practical engineering adjustability constraints while preserving the priority regulation positions in terms of network topological response.
4.2. Optimization Process and Result Validation
4.2.1. Branch Selection and Sensitivity Analysis Results
- (1)
- Global Sensitivity Feature Identification and Branch Influence Ranking
The initial-state airflow sensitivity matrix, D, of the entire network is computed utilizing the finite difference method; its spatial distribution is visually depicted in Figure 5. Macroscopically, the high-response regions within the matrix are predominantly concentrated along a sparse subset of column branches, whereas a vast majority of elements approximate zero. This substantiates that variations in ventilation resistance across different branches do not uniformly impact the network-wide airflow redistribution. Regarding the candidate regulation branches, the columns corresponding to branches 15, 35, and 36 exhibit substantial magnitudes across the rows of specific key receptor branches. Notably, continuous high-response bands are observable proximate to branches 18 and 38, indicating a robust airflow transmission correlation between these auxiliary branches and the under-ventilated zones. Conversely, the expansive near-zero regions within the heatmap denote weak sensitivity correlations among certain branches. For subsequent variable screening, this implies that concentrating the regulatory variables on a minority of high-influence co-tree chords is profoundly advantageous for mitigating collateral perturbations to irrelevant branches.
Figure 5.
Heatmap of the airflow sensitivity matrix.
- (2)
- Branch Influence Ranking
Integrating the initial airflow allocation outcomes from Section 4.1.2 with the co-tree screening results, branches 5, 9, 15, 21, 35, 36, and 43 are deliberately selected as candidate targets for resistance increment. These are subsequently ranked utilizing the branch influence metric. Computational results reveal that the influence degrees of these seven branches, in descending order, are: branch 15 (317.51), branch 36 (285.31), branch 21 (166.70), branch 9 (113.35), branch 35 (70.31), branch 43 (40.21), and branch 5 (9.85). Analyzing the numerical distribution, a pronounced disparity exists between the top three branches and the ensuing ones, signifying that the response intensities of disparate candidate branches in global airflow redistribution are highly heterogeneous. Guided by this ranking, the subsequent optimization solving process will strictly prioritize branches exhibiting higher influence degrees, thereby establishing the basis for tests that progressively introduce decision variables according to their systemic impact.
- (3)
- Sensitivity Attenuation Laws and Regulation Boundary Delineation
Having established the priorities of the candidate branches, continuous resistance increments, , are, respectively, applied to branches 5, 9, 15, 21, 35, 36, and 43. The resulting airflow variations in the receptor branches are meticulously recorded, upon which a power function fitting is performed to model the sensitivity attenuation process. The results are illustrated in Figure 6. The coefficients of determination for all fitted curves strictly exceed 0.93, verifying that the power function formulation accurately characterizes the sensitivity attenuation relationship within this case study.
Figure 6.
Fitted curves of sensitivity attenuation.
As depicted in Figure 6, the absolute sensitivity values, , of all candidate branches universally decline with the augmentation of , albeit at varying rates of descent: the majority of the curves exhibit a precipitous drop during the initial phase, subsequently transitioning to a gradual plateau. This delineates that as the regulatory resistance continues to escalate, the marginal airflow response corresponding to a unit change in resistance progressively attenuates.
To furnish operational resistance boundaries for the ensuing optimization solver, the effective upper regulation limit, , is formally defined as the resistance value corresponding to the point where the sensitivity attenuates to 10% of its initial value, . In conjunction with Table 4, it is evident that the upper limits across different candidate branches vary substantially: the recommended upper limits for branches 5 and 9 are 71.0840 and 18.7620 Ns2/m8, respectively, indicating their capacity to sustain responsiveness toward specific target branches over a relatively expansive domain. In stark contrast, the recommended upper limit for branch 36 is a mere 0.0337 Ns2/m8, underscoring a significantly more rapid sensitivity attenuation and a correspondingly narrower adjustable interval. The recommended upper limits for branches 15, 21, 35, and 43 are 3.2671, 0.1911, 11.8500, and 0.2922 Ns2/m8, respectively, effectively bridging the extremes of the aforementioned scenarios.
A deeper examination of the upper limits corresponding to disparate receptor branches in Table 4 reveals that the effective regulation interval of a singular branch is not strictly uniform when targeting different branches. For instance, the upper limit of branch 5 relative to target branches 18 and 19 is 9.0492 Ns2/m8 for both, whereas its upper limit oriented toward target branch 38 extends to 71.0840 Ns2/m8. Similarly, the upper limit of branch 21 toward targets 18 and 19 is 0.1672 Ns2/m8, yet its limit regarding target 40 is 0.1911 Ns2/m8. Given this non-uniformity in the effective response intervals of a single regulation branch toward various receptor branches, this paper adopts the maximum value among the respective upper limits as the recommended upper search bound for that regulation branch. The explicit objective of this mathematical treatment is to guarantee that the effective response interval under multi-objective airflow allocation conditions is not prematurely truncated, rather than presupposing that the optimal resistance inevitably resides near this upper bound; the actual optimal resistance value remains to be deterministically identified by the subsequent optimization solver.
4.2.2. Ablation Experiments on Regulation Dimensions and Comparative Algorithm Optimization
The experiments detailed in this section are bifurcated into two primary components. Initially, ablation experiments are conducted by incrementally augmenting the number of regulated branches to investigate the variations in system airflow deviation and power consumption across varying regulation dimensions, thereby determining the minimal regulation dimensionality requisite for satisfying network-wide airflow constraints. Subsequently, under this established optimal working condition, the IDBO is benchmarked against DBO, SSA, WOA, and DE to comparatively analyze the convergence trajectories and final optimization outcomes of disparate algorithms on the MVN mathematical model. Across all experimental setups, the population size is uniformly fixed at 20, with a maximum iteration limit of 100. The specific parameter configurations for the comparative algorithms are delineated in Table 5.
Table 5.
Recommended upper bounds of regulated resistance.
- (1)
- Ablation Experiments on Regulation Dimensions and the Establishment of Optimal Conditions
To empirically validate the efficacy of the previously established branch influence ranking during the variable integration process, a systematic series of ablation experiments—ranging from low-dimensional to high-dimensional configurations—is designed, uniformly deploying the IDBO algorithm. Experiments 1 and 2 initially target the core main branches, 7 and 29. Specifically, Experiment 1 relaxes the ventilation resistance of both branches strictly to their lower regulation bounds, whereas Experiment 2 further subjects them to joint optimization based on this relaxation. Experiments 3 through 9 progressively integrate branches 15, 36, 21, 9, 35, 43, and 5 in sequential accordance with the influence degree ranking elucidated in Section 4.2.1. A comprehensive summary of the performance metrics across disparate regulation scales is presented in Table 6, while the corresponding evolutionary trends are depicted in Figure 7.
Table 6.
Parameter settings of optimization algorithms.
Figure 7.
System performance across different control dimensions.
As evidenced by Figure 7, alongside the augmentation of the regulation dimension, the variations in system airflow deviation, , and total power consumption, , are not strictly synchronized; instead, they manifest distinct stage-wise characteristics. Under the baseline natural state, exactly five branches within the system fail to satisfy the prescribed airflow constraints. In Experiment 1, after merely relaxing the resistances of branches 7 and 29 to their lower limits, the system power consumption decreases to 162.09 kW; however, the number of non-compliant branches paradoxically increases to six, demonstrating that unilaterally reducing main trunk resistance cannot directly ameliorate network-wide airflow allocation. In Experiments 2 through 4, where the regulation dimensionality does not exceed 4, the airflow deviation plateaus around 8.64, while the power consumption stabilizes near 162.97 kW. This substantiates that with a deficient number of decision variables, the system inherently lacks sufficient regulatory degrees of freedom; relying exclusively on localized resistance reduction or minimal resistance addition is manifestly inadequate to eliminate the airflow allocation deviations induced by network coupling.
Upon the sequential incorporation of branches 21, 9, and 35 into the control variable set, exhibits a precipitous decline. Throughout Experiments 5 to 7, successively drops from 4.43 and 4.39 down to 1.96. Concurrently, the number of non-compliant branches remains stagnant at 2, yet the aggregate magnitude of deviation continuously diminishes. Notably, in Experiment 7, following the integration of branch 35, the system power consumption falls to 162.62 kW, providing a highly advantageous intermediate state for subsequently achieving a globally feasible solution. Progressing to the inclusion of branch 43 in Experiment 8, converges strictly to 0 for the first time, accompanied by a total power consumption of 163.08 kW; at this juncture, all 46 branches across the network rigorously satisfy their minimum airflow demand constraints. Within the context of this ablation study, the 8-dimensional regulation paradigm proves fully capable of achieving network-wide airflow compliance; hence, it can be formally designated as the minimal regulation dimensionality required to satisfy all constraints.
A comparative analysis of Experiments 8 and 9 reveals that, following the further introduction of branch 5, predictably remains at 0, but the total power consumption unnecessarily escalates from 163.08 kW to 164.40 kW. Correlating this with the influence ranking established in Section 4.2.1, branch 5 exhibits the lowest influence degree among the seven candidates. Its superfluous incorporation yields zero supplementary improvement in constraint satisfaction, yet detrimentally inflates the search variable space. For this specific case study, branch 5 can be definitively classified as a redundant regulation branch; consequently, the 8-dimensional combinatorial configuration excluding branch 5 is conclusively determined as the optimal regulation condition yielding superior comprehensive performance.
- (2)
- Analysis of Algorithm Convergence Performance in Experiment 8
Figure 8 illustrates the convergence trajectories of the comparative algorithms under the conditions of Experiment 8, with the final results systematically summarized in Table 7. As observed in Figure 8a, the total fitness, , of the IDBO rapidly descends into a stable interval within the initial 20 generations, ultimately converging near 163.08. In comparison, while DE and SSA concurrently approach feasible solutions, their descent trajectories are noticeably more gradual, reaching the stable plateau at substantially later generations. WOA, conversely, essentially plateaus after approximately 40 generations, yielding a final fitness significantly inferior (higher value) to the other evaluated algorithms. Furthermore, Figure 8b,c elucidate that the IDBO successfully nullifies the airflow deviation at an early stage and subsequently persists in minimizing the system power consumption. This distinctively contrasts with curve profiles that merely satisfy constraints initially but exhibit highly constrained subsequent improvements.
Figure 8.
Convergence process of different optimization algorithms.
Table 7.
System performance under different control dimensions.
Table 7 delineates that the final results for the IDBO are , , and kW, unequivocally corresponding to the lowest power consumption among all algorithms satisfying the airflow constraints. The airflow deviations for DBO, SSA, and DE uniformly equal 0, yet their total power consumptions equate to 163.79 kW, 163.94 kW, and 163.27 kW, respectively, all exceeding that of the IDBO. The system power consumption for WOA is 163.71 kW, yet it retains a residual airflow deviation of 0.0861, indicating that its finalized solution fails to rigorously satisfy the network-wide minimum airflow demand constraints. Evaluating the comparative outcomes under this specific operational condition, the IDBO achieves a demonstrably superior equilibrium between strict constraint satisfaction and systemic power consumption control.
- (3)
- Analysis of Differences in Resistance Regulation Strategies
The optimal resistance values determined across the eight key regulated branches are presented in Figure 9 and tabulated in Table 8. The configurations generated by the diverse algorithms across these branches do not manifest uniform divergence; rather, they bifurcate predominantly on a select few critical variables. Notably, branch 35 demonstrates the most pronounced strategic divergence, whereas branch 21 remains virtually consistent across all methods, with the remaining branches situating between these two extremes.
Figure 9.
Comparison of optimal resistance strategies.
Table 8.
Optimization results of different algorithms.
Scrutinizing the specific outcomes, branch 35 constitutes the primary locus of strategic contention among the evaluated algorithms. The optimal resistance determined by the IDBO on this branch is a mere 0.0232 Ns2/m8, and 0.0089 Ns2/m8 for WOA; conversely, DBO, SSA, and DE abruptly escalate to 1.5896, 0.8955, and 0.3302 Ns2/m8, respectively. In essence, certain algorithms are predisposed to imposing substantial resistance increments on this highly sensitive branch to forcefully drive network-wide airflow redistribution; the IDBO, conversely, deliberately avoids such single-point drastic modifications. Correlating this observation with the total power consumption results reveals that massive localized resistance increments fail to translate into lower systemic energy consumption. This convincingly substantiates that, within this specific case study, aggressively concentrating the regulatory burden onto a single highly sensitive branch does not constitute an optimal airflow distribution pathway.
By stark contrast, the resistance value allocated to branch 21 is absolutely identical across all five algorithms, unanimously converging at 0.1911 Ns2/m8. This signifies that the adjustable topological interval for this branch is rigidly confined, compelling all algorithms to iteratively converge upon the identical configuration point. Its resistance magnitude is predominantly constrained by its structural position within the network and the predefined search boundaries, rather than being dictated by divergent optimization heuristics. This unequivocally demonstrates that algorithmic disparities do not manifest uniformly across all variables simultaneously; instead, they are highly concentrated on a select minority of key branches that retain substantial regulatory degrees of freedom.
The analytical outcomes observed in the remaining branches provide further corroboration of this phenomenon. On branch 7, IDBO, DBO, and DE unanimously target the lower bound of 0.0200 Ns2/m8, while SSA and WOA yield 0.0319 Ns2/m8 and 0.0472 Ns2/m8, respectively, systematically maintaining an overall low resistance level. The configured values for branch 29 are distributed between 0.0868 and 0.2081 Ns2/m8, and for branch 15 between 0.0375 and 0.1493 Ns2/m8. Although inter-algorithmic discrepancies exist, their degree of statistical dispersion is significantly weaker than that observed in branch 35. The optimization results for branch 9 also exhibit a degree of strategic differentiation: 0.5290, 0.4701, 0.7718, 0.0445, and 0.1760 Ns2/m8 for IDBO, DBO, SSA, WOA, and DE, respectively. This signifies that, alongside branch 35, branch 9 serves as a crucial topological locus influencing the resistance configuration styles of the disparate algorithms, albeit with a lower degree of divergence than the former.
Observing the overarching resistance structure, the results generated by the IDBO more closely resemble a decentralized configuration achieved through multi-branch collaborative regulation, systematically eschewing reliance on aggressive resistance increments at any single bottleneck branch. Among the eight regulation variables, with the exclusive exception of branch 9 (0.5290 Ns2/m8), all remaining branches do not exceed a ceiling of 0.20 Ns2/m8; notably, branches 35, 36, and 43 register remarkably low values of merely 0.0232, 0.0030, and 0.0526 Ns2/m8, respectively. In stark contrast, DBO assigns 1.5896 and 0.2874 Ns2/m8 to branches 35 and 43, respectively, while SSA reaches 0.7718 and 0.8955 Ns2/m8 on branches 9 and 35. This empirically indicates that these baseline algorithms are predominantly predisposed to achieving constraint compliance through aggressive, concentrated resistance modifications on individual branches.
Consequently, the profound disparities highlighted by this set of results do not merely reside in the absolute magnitude of isolated values, but fundamentally reflect the systemic allocation strategy of the regulatory resistance burden across all key branches. For the case study presented herein, the IDBO adeptly avoids relying on single-point strong interventions to secure globally feasible solutions; instead, it accomplishes network-wide airflow redistribution via synchronized, small-scale collaborative modifications distributed across multiple key branches. This decentralized configuration paradigm successfully satisfies all stringent constraints while strictly circumventing excessive localized resistance build-up. Consequently, it aligns perfectly with the practical engineering imperatives of step-by-step implementation and iterative, branch-by-branch regulation in real-world mine ventilation systems (see Table 9).
Table 9.
Optimal resistance of 8-dimensional variables.
- (4)
- Validation of Airflow Optimization Efficacy
Figure 10 presents a comparative analysis of the network-wide airflow distribution before and after the implementation of the IDBO-based regulation scheme. As illustrated in the figure, several branches in the initial state fall below the minimum airflow requirements, specifically Branches 7, 18, 19, 29, and 38, which are denoted by red “×” markers. Following the optimization process, the airflow rates in these under-ventilated branches were successfully elevated above the prescribed safety constraint boundary. For instance, the airflow volumes in Branches 7 and 29 were increased from less than 1 m3/s to approximately 17.9 m3/s and 10.8 m3/s, respectively. Simultaneously, the airflow allocated to auxiliary branches with initial surpluses, such as Branches 15 and 35, underwent corresponding downward adjustments to maintain the overall network equilibrium.
Figure 10.
Comparison of initial and optimized airflow.
It should be noted that the airflow rates in most fundamental branches across the network remained fundamentally stable post-optimization, with negligible variations observed specifically in the main intake and return airways. This indicates that the proposed method achieves constraint satisfaction not through extensive alterations of the global airflow distribution, but primarily via localized regulation to provide targeted compensation for under-ventilated areas. For complex parallel ventilation networks, inducing substantial global airflow fluctuations to rectify a limited number of deficient branches often results in auxiliary energy consumption and disrupts the pre-existing distribution pattern. In contrast, the proposed algorithm concentrates regulatory effects on a limited number of pivotal branches through variable screening and localized resistance augmentation. Consequently, it achieves effective rectification of the target under-ventilated branches while preserving the structural stability of the original reasonable airflow distribution.
According to the statistical results in Table 7, the total system power consumption under IDBO operating conditions is 163.08 kW, representing an 11.87% reduction compared to the 185.03 kW observed in the natural distribution state. This demonstrates that the proposed optimization scheme achieves regulatory airflow compliance not through global resistance increases or universal network-wide adjustments, but rather by implementing targeted compensation for under-ventilated branches alongside the strategic re-adjustment of surplus airflow. Consequently, this localized redistribution mechanism ensures that, for the case study presented, all branches within the network strictly satisfy the prescribed minimum airflow requirements while significantly enhancing energy efficiency.
5. Discussion
Analyzing the solving process of the 46-branch case study, the relationship between the regulation dimensionality and the airflow allocation results is inherently non-monotonic. With an inadequate number of variables, the available branches for regulation are limited, restricting the network’s capacity for sufficient airflow redistribution and consequently hindering the timely compensation of under-ventilated branches. Conversely, as candidate variables continue to augment, the marginal airflow allocation benefits derived from newly integrated branches begin to diminish, whereas the search space simultaneously expands, proliferating the combinations of localized resistance increments. Under such circumstances, the degree of constraint satisfaction may not necessarily improve; instead, the overall ventilation cost can be inadvertently elevated. In this case, study, the airflow constraints are initially satisfied precisely under the 8-dimensional operational condition. This unequivocally underscores the critical importance of front-end candidate variable screening. By systematically contracting the candidate set via MIST and sensitivity attenuation boundaries, the search process is effectively concentrated on branches that exhibit tangible responses to airflow redistribution.
Even under identical regulation dimensions and strict search boundaries, the final resistance configurations generated by disparate algorithms fail to converge to a singular paradigm. The strategic disparities are predominantly localized on a minority of highly sensitive branches that retain substantial regulatory margins. Branch 35 serves as a highly representative example: DBO, SSA, and DE all impose disproportionately high resistance values at this locus, whereas the IDBO applies only a marginal modification. Correlating this strategic divergence with the total system power consumption reveals that aggressively concentrating the compensation burden onto a single branch does not yield lower ventilation energy consumption. For strongly coupled ventilation networks like the one investigated herein, globally feasible solutions do not correspond exclusively to a singular resistance allocation pathway. Compared to forcing under-ventilated compensation onto isolated key branches, distributing the regulation task cooperatively across multiple branches achieves a state significantly closer to low-energy airflow allocation in this case study.
These strategic divergences in resistance configuration ultimately translate into tangible engineering outcomes. Following the implementation of the IDBO scheme, all network branches rigorously satisfy the minimum airflow demand requirements, elevating the airflow compliance rate from an initial 89.13% to a perfect 100%. Compared to the natural distribution baseline, the total system power consumption is substantially reduced from 185.03 kW to 163.08 kW, representing a decrement of 11.87%. Furthermore, the computational results consistently remain safely within the static pressure boundaries of the main fan. In conjunction with the before-and-after comparisons in Figure 9, it is evident that this optimization process does not rely on indiscriminately elevating the overall network resistance to achieve compliance. Instead, it meticulously executes targeted airflow reallocation by suppressing surplus branches and compensating under-ventilated ones. The discussions presented herein are predicated on the strict assumptions of steady-state ventilation networks and continuous resistance regulation. If discrete ventilation window control or abnormal operational perturbations are further incorporated in future studies, both the mathematical representations of regulatory variables and the bounds of the feasible solution regions will necessitate rigorous redefinition.
6. Conclusions
Targeting the complex solving scenarios in mine ventilation networks—characterized by strong variable coupling, high search dimensionality, and prominent energy consumption control requirements—this study constructs a comprehensive airflow optimization framework integrating the Minimum Influence Spanning Tree (MIST), sensitivity attenuation boundaries, and the Improved Dung Beetle Optimizer (IDBO). Based on the computational results of the case study and comparative algorithmic analyses, the following principal conclusions are drawn:
(1) The ablation experiment results demonstrate that augmenting the number of regulated branches does not yield continuous improvements in the system’s solving efficacy alongside dimensional expansion. Conversely, prioritizing the screening of candidate variables based on branch influence degrees and sensitivity attenuation boundaries effectively compresses the search space while progressively satisfying airflow constraints. For the specific network investigated herein, an 8-dimensional regulation combination suffices to achieve network-wide airflow compliance. This indicates that further introducing regulatory variables under such conditions is not a necessary prerequisite for obtaining a globally feasible solution.
(2) Among the evaluated algorithms, the IDBO uniquely secures the lowest total system power consumption while rigorously satisfying all airflow constraints. Taking branch 35 as a representative locus, the regulatory resistance prescribed by the DBO is 1.5896 Ns2/m8, whereas the IDBO applies a mere 0.0232 Ns2/m8; the former is approximately 68.52 times the magnitude of the latter. This substantial discrepancy illustrates that divergent algorithms exhibit distinct intensities of resistance allocation on highly sensitive branches, ultimately yielding fundamentally different airflow redistribution outcomes. Benchmarked against the natural distribution state, the total system power consumption under the IDBO configuration is effectively reduced from 185.03 kW to 163.08 kW, representing a significant reduction of approximately 11.87%.
(3) The engineering case study unequivocally demonstrates that, following the implementation of the IDBO regulatory scheme, all network branches strictly satisfy their minimum airflow demand constraints, elevating the systemic airflow compliance rate from an initial 89.13% to a perfect 100%. Analyzing typical branch variations, the initially under-ventilated branches 7 and 29 are augmented from sub-1.0 m3/s to approximately 17.9 m3/s and 10.8 m3/s, respectively; simultaneously, branches 18 and 38 are elevated from 2.48 m3/s and 3.00 m3/s to roughly 3.8 m3/s. Concurrently, the allocated airflow in branches exhibiting initial surpluses is strategically curtailed; for instance, branch 15 is reduced from 9.21 m3/s to approximately 2.2 m3/s, branch 35 from 26.98 m3/s to nearly 3.8 m3/s, and branch 36 from 9.04 m3/s to roughly 3.8 m3/s. These empirical results confirm that the proposed scheme successfully executes a targeted network-wide airflow reallocation—reclaiming surplus airflow to seamlessly compensate under-ventilated branches—while ensuring the computational solutions persistently remain within the static pressure bounds of the main fan. Within the specific context of this study, the methodology proves highly adept at simultaneously satisfying both airflow compliance constraints and fan operational boundaries.
Ultimately, by cohesively integrating network topology screening, sensitivity boundary delineation, and heuristic search into a unified computational framework, this paper provides a highly implementable solution pathway for Ventilation on Demand (VoD) computation in complex mine ventilation networks. Future research trajectories should focus on integrating discrete ventilation window control, developing rapid recalculation algorithms under abnormal operational perturbations, and incorporating real-time monitoring data, thereby fostering a more seamless synthesis between mathematical model outputs and on-site physical regulation parameters.
Author Contributions
Conceptualization, Z.Y. and L.Z.; methodology, L.Z.; software, L.Z. and T.F.; validation, Z.Y., L.Z. and Y.W.; formal analysis, L.D.; investigation, T.F.; resources, Z.Y. and L.D.; data curation, L.Z.; writing—original draft preparation, L.Z.; writing—review and editing, Z.Y. and Y.W.; visualization, L.Z. and T.F.; supervision, Z.Y.; project administration, Z.Y.; funding acquisition, Z.Y. and L.D. All authors have read and agreed to the published version of the manuscript.
Funding
This research was funded by the National Natural Science Foundation of China, grant number 52074214; the “Scientists + Engineers” Team Construction Project of Qin Chuang Yuan, Shaanxi Province, grant number 2024QCY-KXJ-190; and the Key Research and Development Program of Shaanxi Province, grant number 2023-YBSF-190.
Data Availability Statement
All data generated or analyzed during this study are included in this published article.
Acknowledgments
Thanks to the strong support from the Xi’an University of Science and Technology platform, as well as the support from other members of the Intelligent Ventilation Team research group.
Conflicts of Interest
Authors Lipeng Dang and Tianhe Fu were employed by the company Shaanxi Coal and Chemical Industry Group Huangling Mining Co., Ltd. The remaining authors declare that the research was conducted in the absence of any commercial or financial relationships that could be construed as a potential conflict of interest.
References
- Fan, J.; Yan, Z.; Li, C. Research and Application of Cooperative Control Theory and Key Technologies for Intelligent Coal Mining. J. China Coal Soc. 2026, 51, 813–825. [Google Scholar] [CrossRef]
- Jing, Z.; Min, X.; Li, S.; Li, J.; Song, W. Trade-off or Synergy? The Impacts of Coal Energy Consumption on Compound System Vulnerability: A Perspective from Coal Resource Base Assessment. Ecol. Indic. 2025, 170, 113124. [Google Scholar] [CrossRef] [Scilit]
- Liu, Y.; Wang, R.; Zhou, J.; Wu, L.; Huo, S. Novel Models and Improved Algorithms for Fuzzy Joint Replenishment Problem with Carbon Cap-and-Trade Policy. Fuzzy Optim. Dec. Mak. 2026, 25, 109–133. [Google Scholar] [CrossRef] [Scilit]
- Liu, S.; Li, M.; Xie, L.; Huang, P.; Guo, Q.; Yin, Z. Study on the Alleviation of Mining-Induced Surface Deformation via Goaf Solid Waste Backfill Mining in a Deep Coal Mine. Appl. Sci. 2025, 15, 8823. [Google Scholar] [CrossRef] [Scilit]
- Yang, B.; Yao, H.; Wang, F. A Review of Ventilation and Environmental Control of Underground Spaces. Energies 2022, 15, 409. [Google Scholar] [CrossRef] [Scilit]
- Wang, Y. TCN–Transformer Spatio-Temporal Feature Decoupling and Dynamic Kernel Density Estimation for Gas Concentration Fluctuation Warning. Fire 2025, 8, 175. [Google Scholar] [CrossRef] [Scilit]
- Liang, Y.; Yang, Y.; Guo, S.; Tian, F.; Wang, S. Combustion Mechanism and Control Approaches of Underground Coal Fires: A Review. Int. J. Coal Sci. Technol. 2023, 10, 24–49. [Google Scholar] [CrossRef] [Scilit]
- Yan, Z.; Wang, Y.; Fan, J.; Huang, Y.; Zhong, Y. An Efficient Method for Optimizing Sensors’ Layout for Accurate Measurement of Underground Ventilation Networks. IEEE Access 2023, 11, 72630–72640. [Google Scholar] [CrossRef] [Scilit]
- Zhong, D.; Wen, L.; Liu, Y.; Wu, Z.; Wang, L.; Ji, X. Research on Key Technologies and Integrated Solutions for Intelligent Mine Ventilation Systems. Technologies 2025, 13, 451. [Google Scholar] [CrossRef] [Scilit]
- Wang, G.; Ren, H.; Zhao, G.; Zhang, D.; Wen, Z.; Meng, L.; Gong, S. Research and Practice of Intelligent Coal Mine Technology Systems in China. Int. J. Coal Sci. Technol. 2022, 9, 24–41. [Google Scholar] [CrossRef] [Scilit]
- Wan, Y. Design and Optimization of Intelligent Ventilation System in Coal Mine. E3S Web Conf. 2024, 528, 03020. [Google Scholar] [CrossRef] [Scilit]
- Li, B.-R.; Inoue, M.; Shen, S.-B. Mine Ventilation Network Optimization Based on Airflow Asymptotic Calculation Method. J. Min. Sci. 2018, 54, 99–110. [Google Scholar] [CrossRef] [Scilit]
- Hou, J.; Nie, G.; Li, G.; Zhao, W.; Sheng, B. Optimization of Branch Airflow Volume for Mine Ventilation Network Based on Sensitivity Matrix. Sustainability 2023, 15, 12427. [Google Scholar] [CrossRef] [Scilit]
- Niubó, M.; De Felipe, J.J.; Bascompta, M.; Pérez-Ràfols, F.; Vives-Costa, J.; Sanmiquel, L.; López, J.-A. Assessing Mine Ventilation Optimization and Friction Factor Determination for Underground Mines. Arab. J. Geosci. 2025, 18, 72. [Google Scholar] [CrossRef] [Scilit]
- Wen, L.; Zhong, D.; Bi, L.; Wang, L.; Liu, Y. Optimization Method of Mine Ventilation Network Regulation Based on Mixed-Integer Nonlinear Programming. Mathematics 2024, 12, 2632. [Google Scholar] [CrossRef] [Scilit]
- Sun, Q.; Yang, X.; Wu, J.; Gao, Y.; Ma, J. A New Proportional-Integral-Derivative Automatic Control Method Complemented by Computational Fluid Dynamics for Gas Concentration in the Tunneling Face. Arab. J. Sci. Eng. 2025. [Google Scholar] [CrossRef] [Scilit]
- Hao, H.; Jiang, S.; Wu, Z.; Wang, K.; Xi, X. Experimental Study on Precise Control Air Quantity on Demand by the Cooperation of Multiple Main Fans in Mine. J. Clean. Prod. 2023, 414, 137626. [Google Scholar] [CrossRef] [Scilit]
- Ihsan, A.; Widodo, N.P.; Cheng, J.; Wang, E. Ventilation on Demand in Underground Mines Using Neuro-Fuzzy Models: Modeling and Laboratory-Scale Experimental Validation. Eng. Appl. Artif. Intell. 2024, 133, 108048. [Google Scholar] [CrossRef] [Scilit]
- Yang, X.; Li, H. Digital Twin-Driven Deep Learning Prediction and Adaptive Control for Coal Mine Ventilation Systems. Sci. Rep. 2025, 16, 940–960. [Google Scholar] [CrossRef] [Scilit] [PubMed]
- Zhang, K.; Li, H. Intelligent Decision-Making for Mine Ventilation Systems Based on Graph Neural Network and Deep Reinforcement Learning Fusion. Sci. Rep. 2026, 16, 6704. [Google Scholar] [CrossRef] [Scilit] [PubMed]
- Rajwar, K.; Deep, K.; Das, S. An Exhaustive Review of the Metaheuristic Algorithms for Search and Optimization: Taxonomy, Applications, and Open Challenges. Artif. Intell. Rev. 2023, 56, 13187–13257. [Google Scholar] [CrossRef] [Scilit]
- Wang, Y.; Pan, Q.; Gao, L.; Cao, Y.; Liu, P.; Yi, H.; Gao, C. Analysis of Distribution Method of Designed Air Quantity in Coal Mine Ventilation—A Case Study. Sci. Rep. 2024, 14, 10917. [Google Scholar] [CrossRef] [Scilit]
- Sun, Q.; Wang, Y. Optimization of Airflow Distribution in Mine Ventilation Networks Using the MOBWO Algorithm. Processes 2025, 13, 2193. [Google Scholar] [CrossRef] [Scilit]
- Li, J.; Li, Y.; Zhang, W.; Dong, J.; Cui, Y. Multi-Objective Intelligent Decision and Linkage Control Algorithm for Mine Ventilation. Energies 2022, 15, 7980. [Google Scholar] [CrossRef] [Scilit]
- Semin, M.; Kormshchikov, D. Application of Artificial Intelligence in Mine Ventilation: A Brief Review. Front. Artif. Intell. 2024, 7, 1402555. [Google Scholar] [CrossRef] [Scilit] [PubMed]
- Shang, W.; Jia, J. Theoretical Knowledge Enhanced Genetic Algorithm for Mine Ventilation System Optimization Considering Main Fan Adjustment. Complex Intell. Syst. 2025, 11, 16. [Google Scholar] [CrossRef] [Scilit]
- Zhong, D.; Wang, L.; Wang, J.; Jia, M. An Efficient Mine Ventilation Solution Method Based on Minimum Independent Closed Loops. Energies 2020, 13, 5862. [Google Scholar] [CrossRef] [Scilit]
- Wang, B.; Liu, Q.; Wu, W. Prim Algorithm Based on Heap for Finding Minimal Spanning Tree of Ventilation Network; Atlantis Press: Zhengzhou, China, 2015. [Google Scholar]
- Xue, J.; Shen, B. Dung Beetle Optimizer: A New Meta-Heuristic Algorithm for Global Optimization. J. Supercomput. 2023, 79, 7305–7336. [Google Scholar] [CrossRef] [Scilit]
- Lv, W.; He, Y.; Yang, Y.; Ma, X.; Chen, J.; Zhang, Y. Improving the Dung Beetle Optimizer with Multiple Strategies: An Application to Complex Engineering Problems. Biomimetics 2025, 10, 717. [Google Scholar] [CrossRef] [Scilit]
- Lei, W.; Han, J.; Wu, X. Improved Osprey Optimization Algorithm with Multi-Strategy Fusion. Biomimetics 2024, 9, 670. [Google Scholar] [CrossRef] [Scilit]
- Liu, Q.; Li, N.; Jia, H.; Qi, Q.; Abualigah, L.; Liu, Y. A Hybrid Arithmetic Optimization and Golden Sine Algorithm for Solving Industrial Engineering Design Problems. Mathematics 2022, 10, 1567. [Google Scholar] [CrossRef] [Scilit]
- Cai, Y.; Guo, C.; Chen, X. An Improved Sand Cat Swarm Optimization with Lens Opposition-Based Learning and Sparrow Search Algorithm. Sci. Rep. 2024, 14, 20690. [Google Scholar] [CrossRef] [Scilit] [PubMed]
- Wang, X.; Yu, X. Differential Evolution Algorithm with Three Mutation Operators for Global Optimization. Mathematics 2024, 12, 2311. [Google Scholar] [CrossRef] [Scilit]
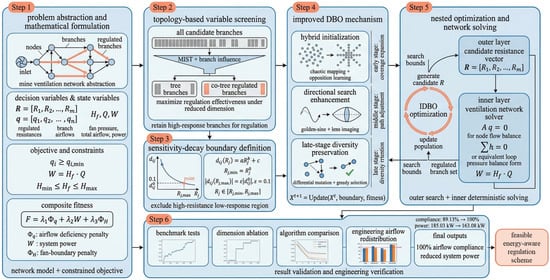
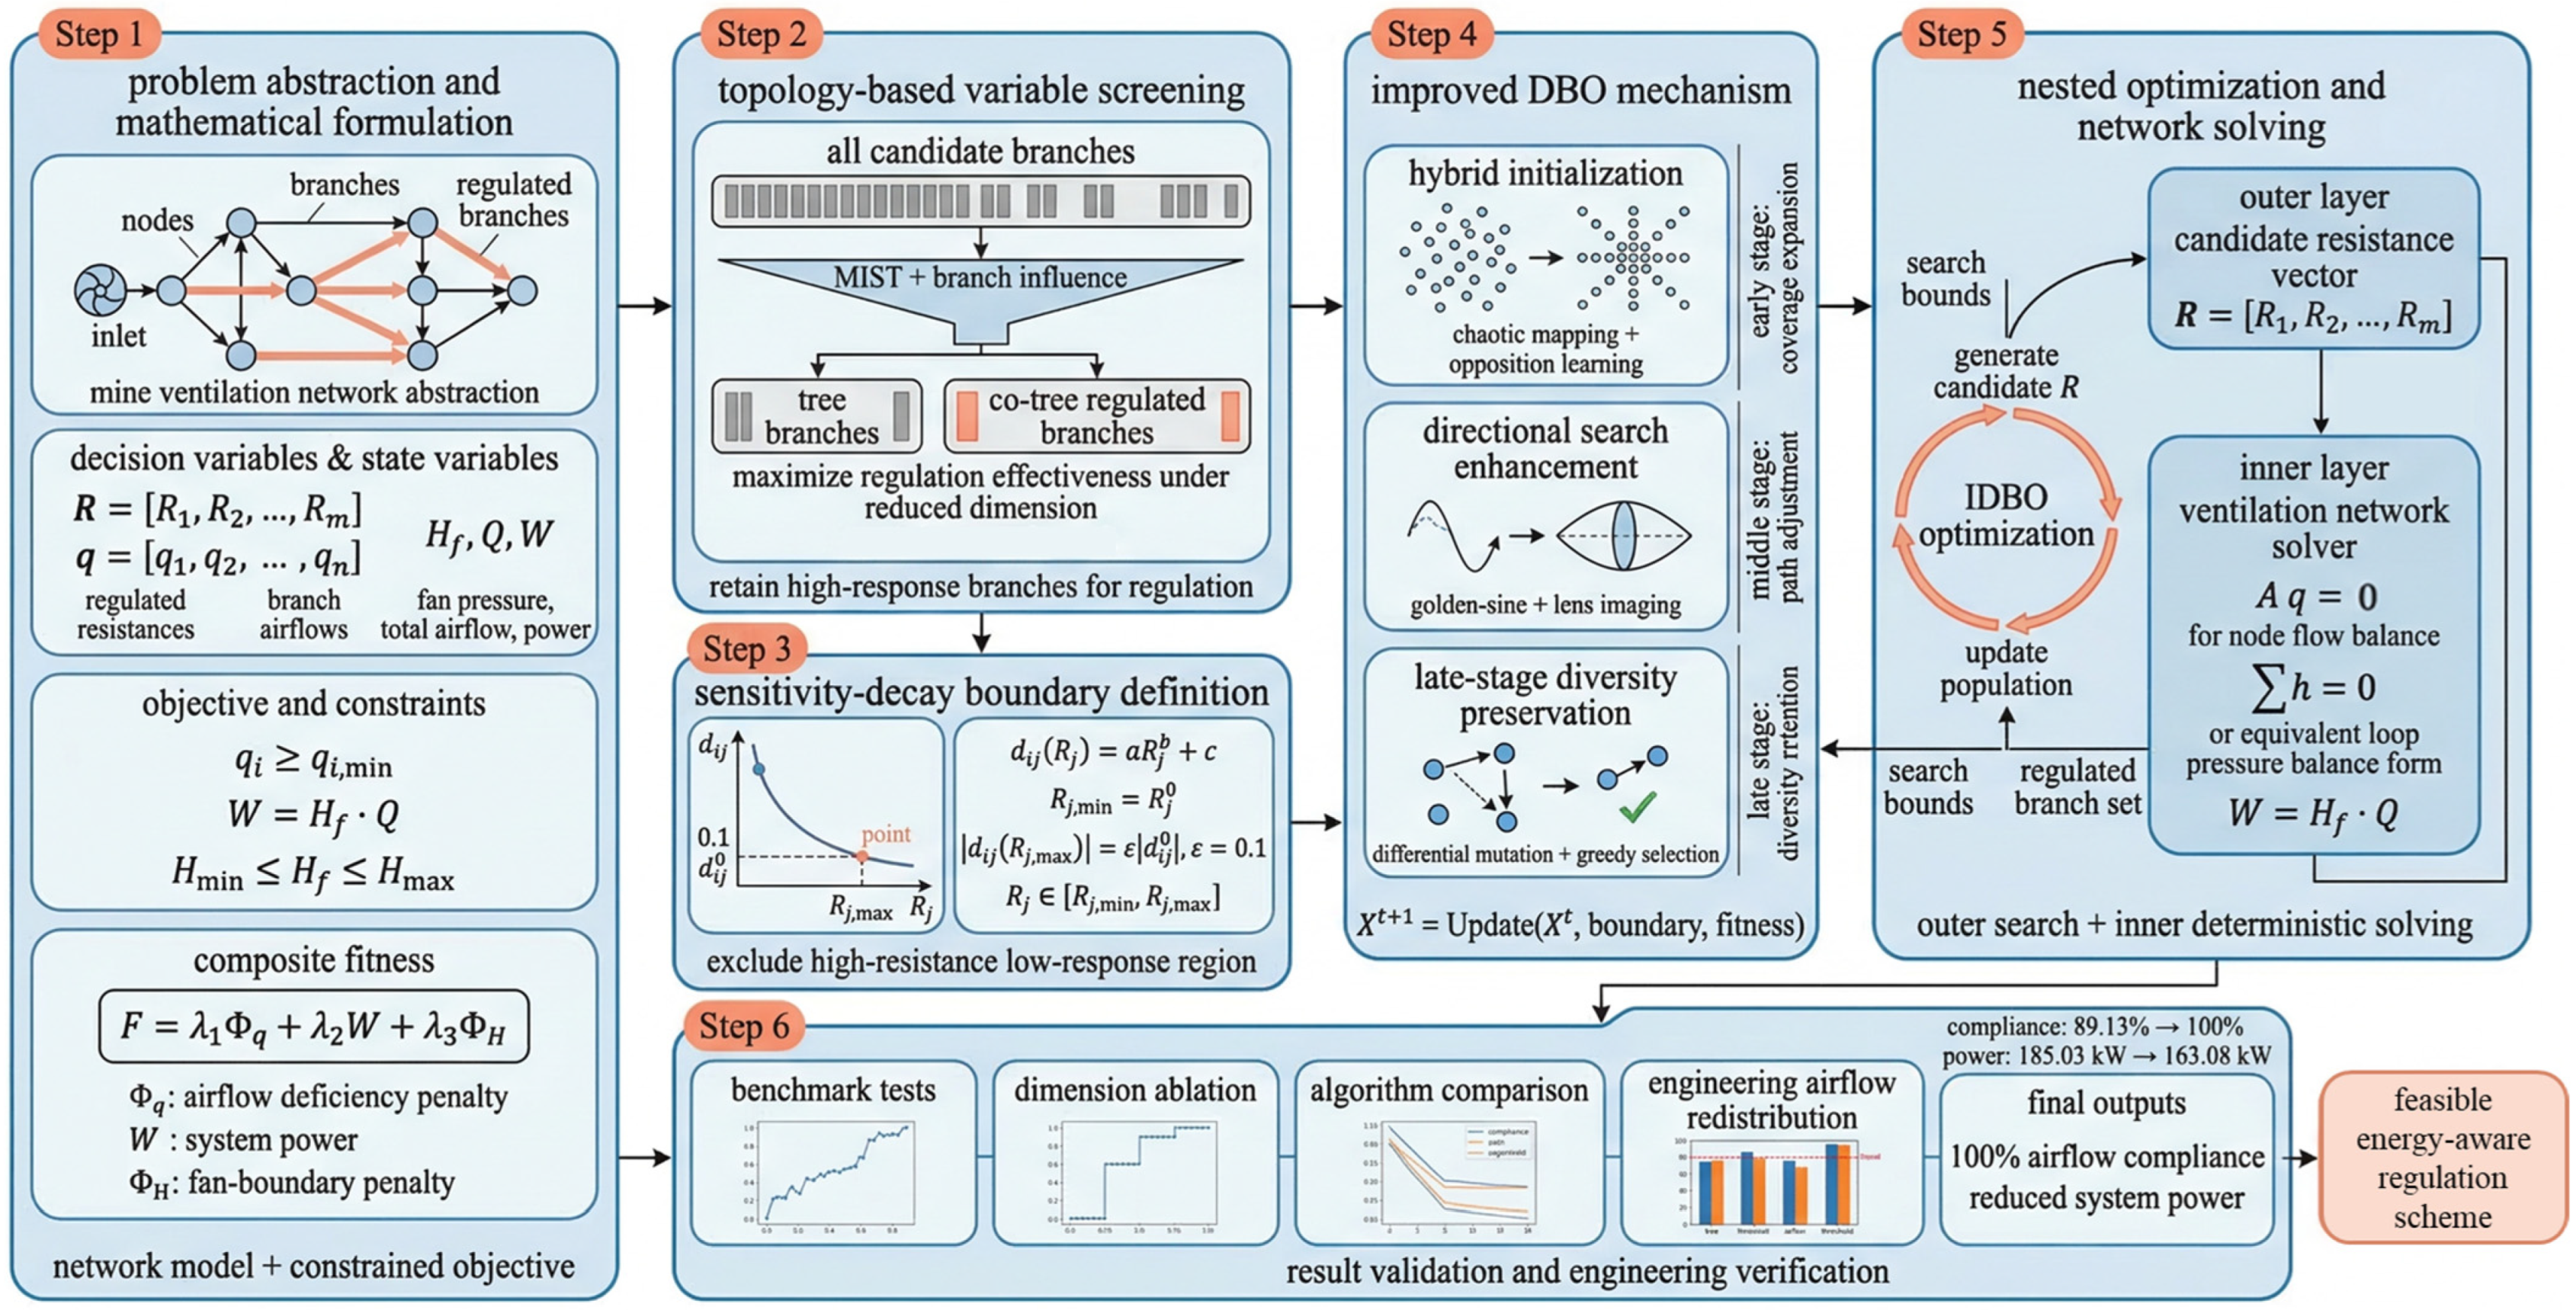
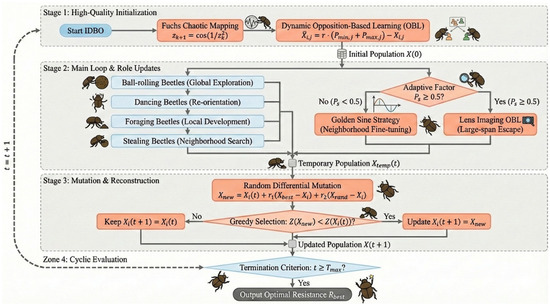
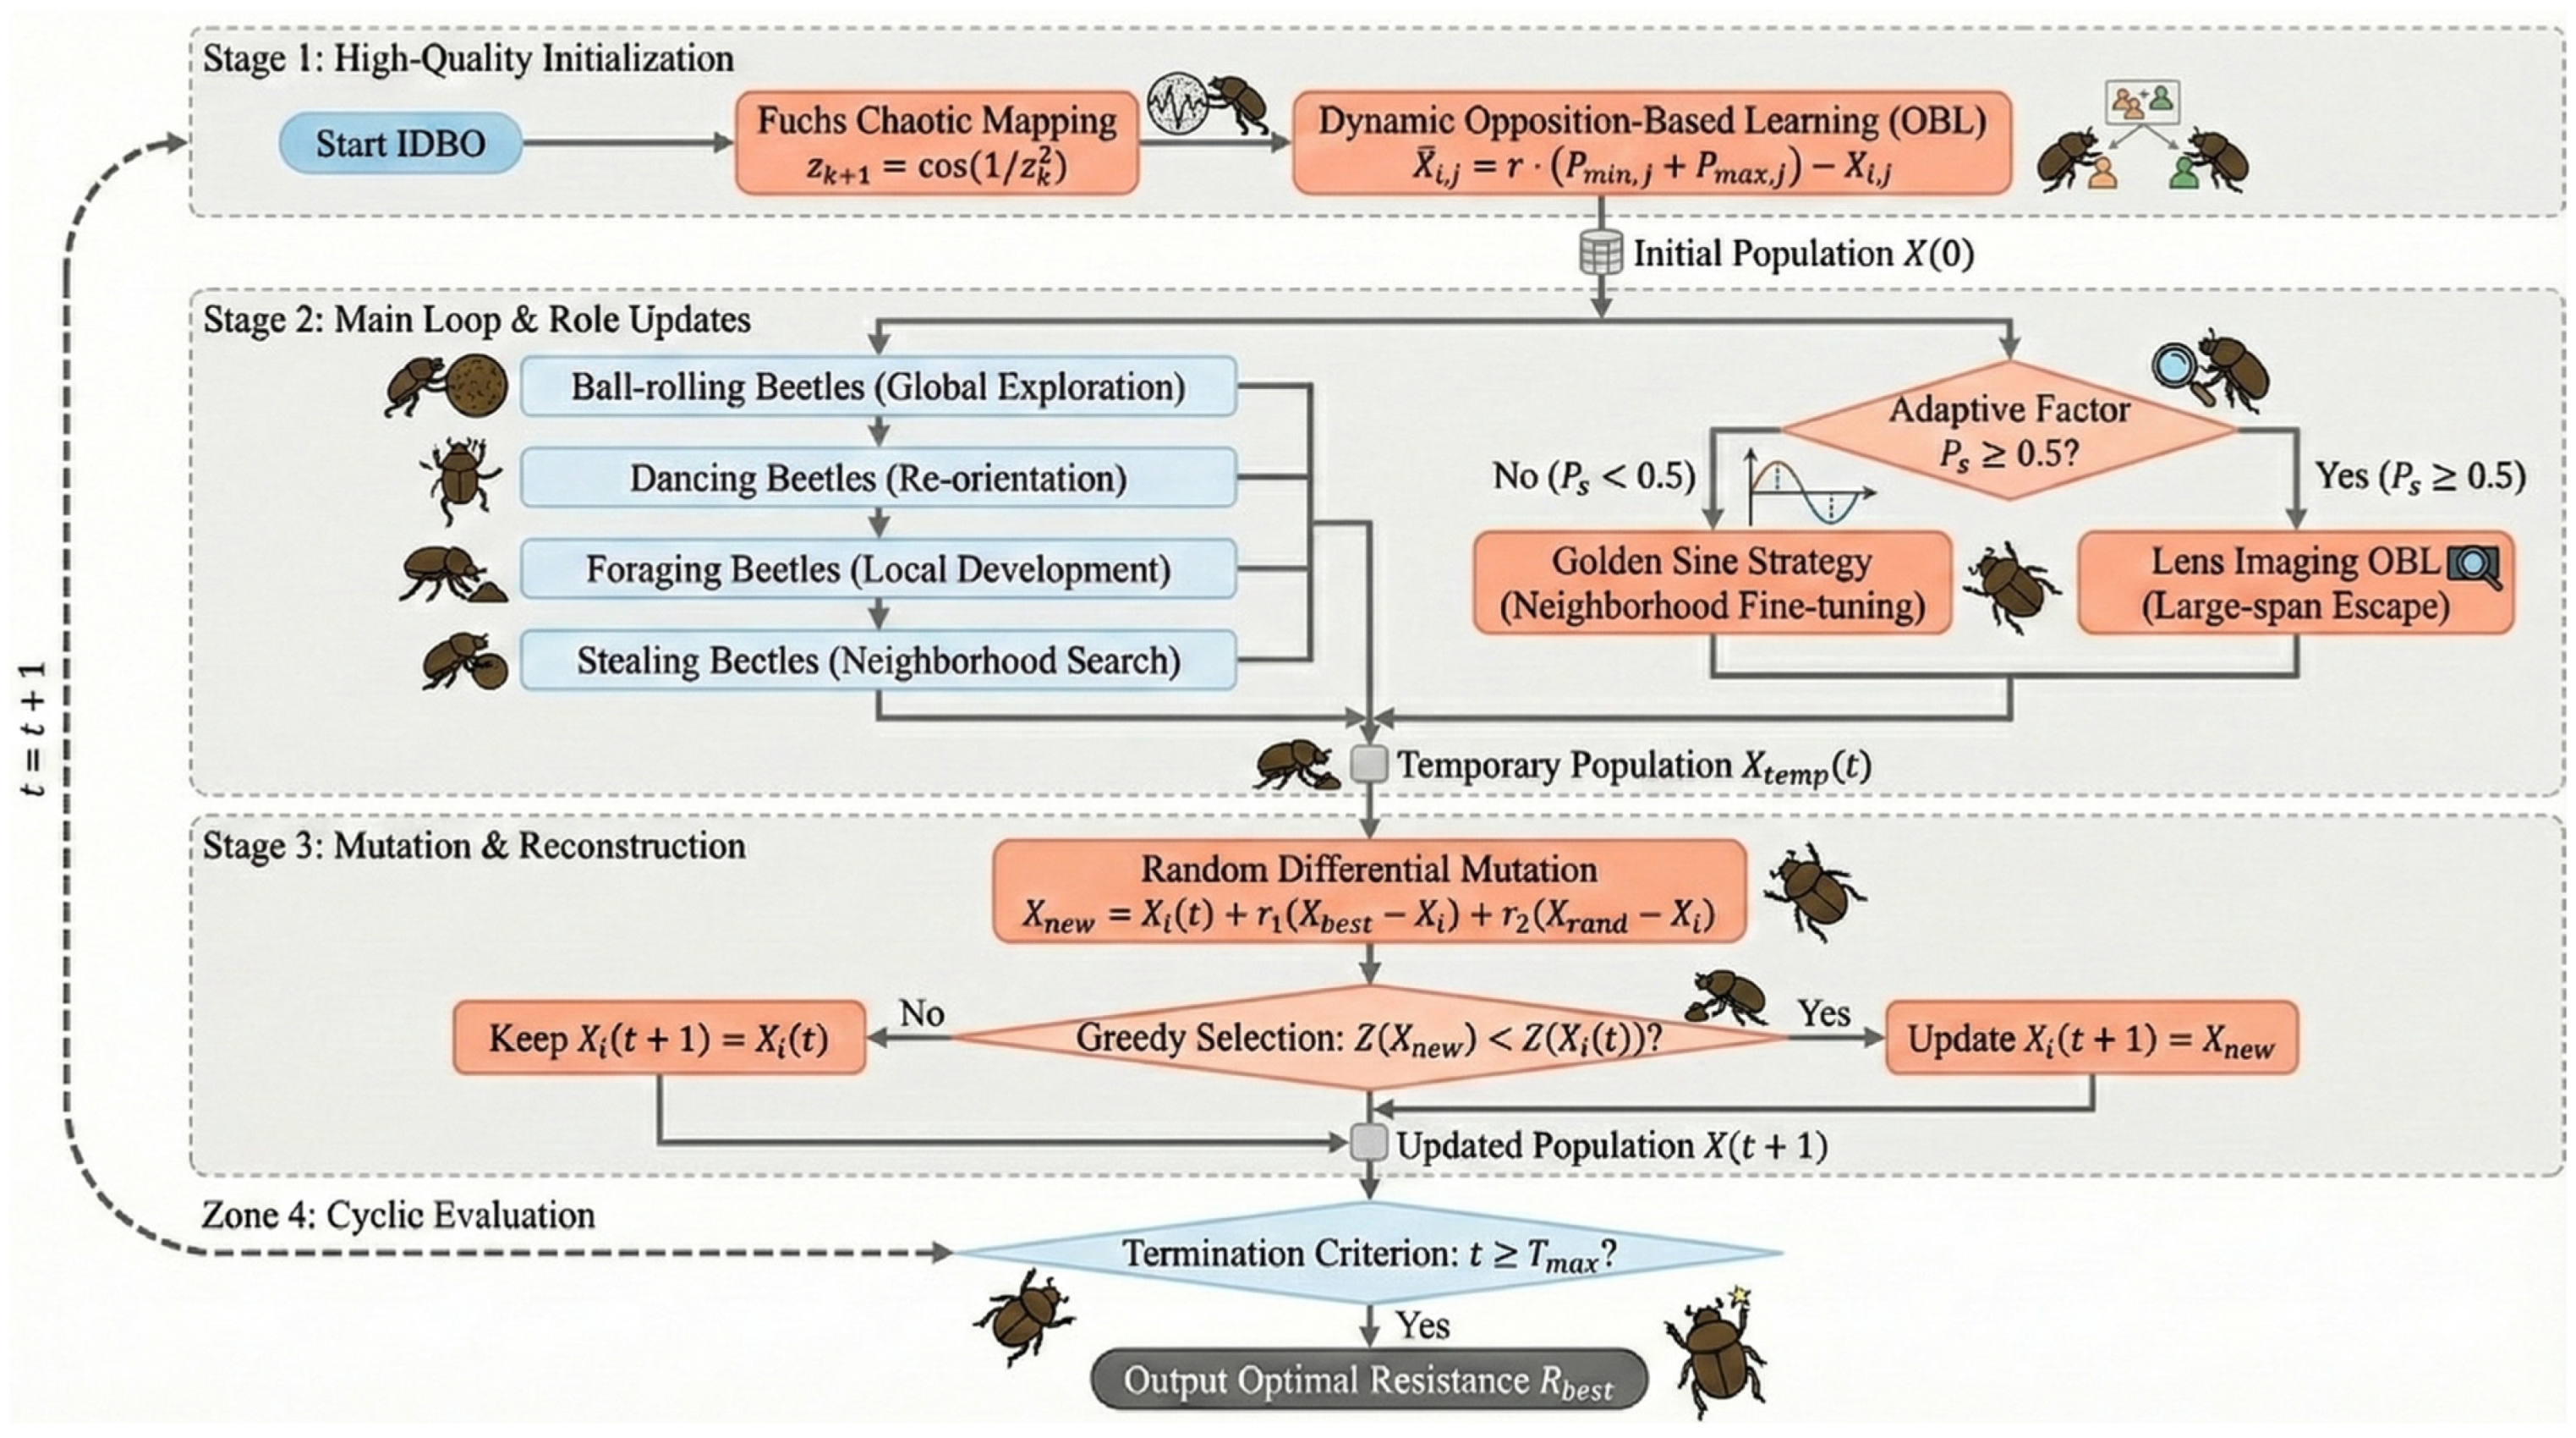
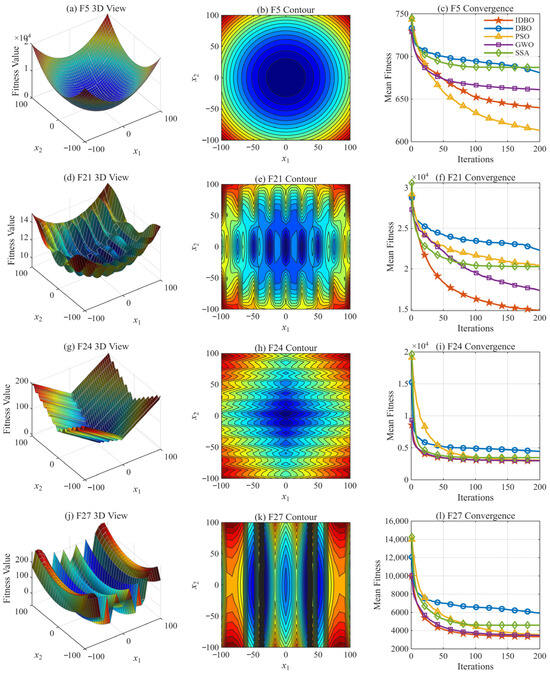
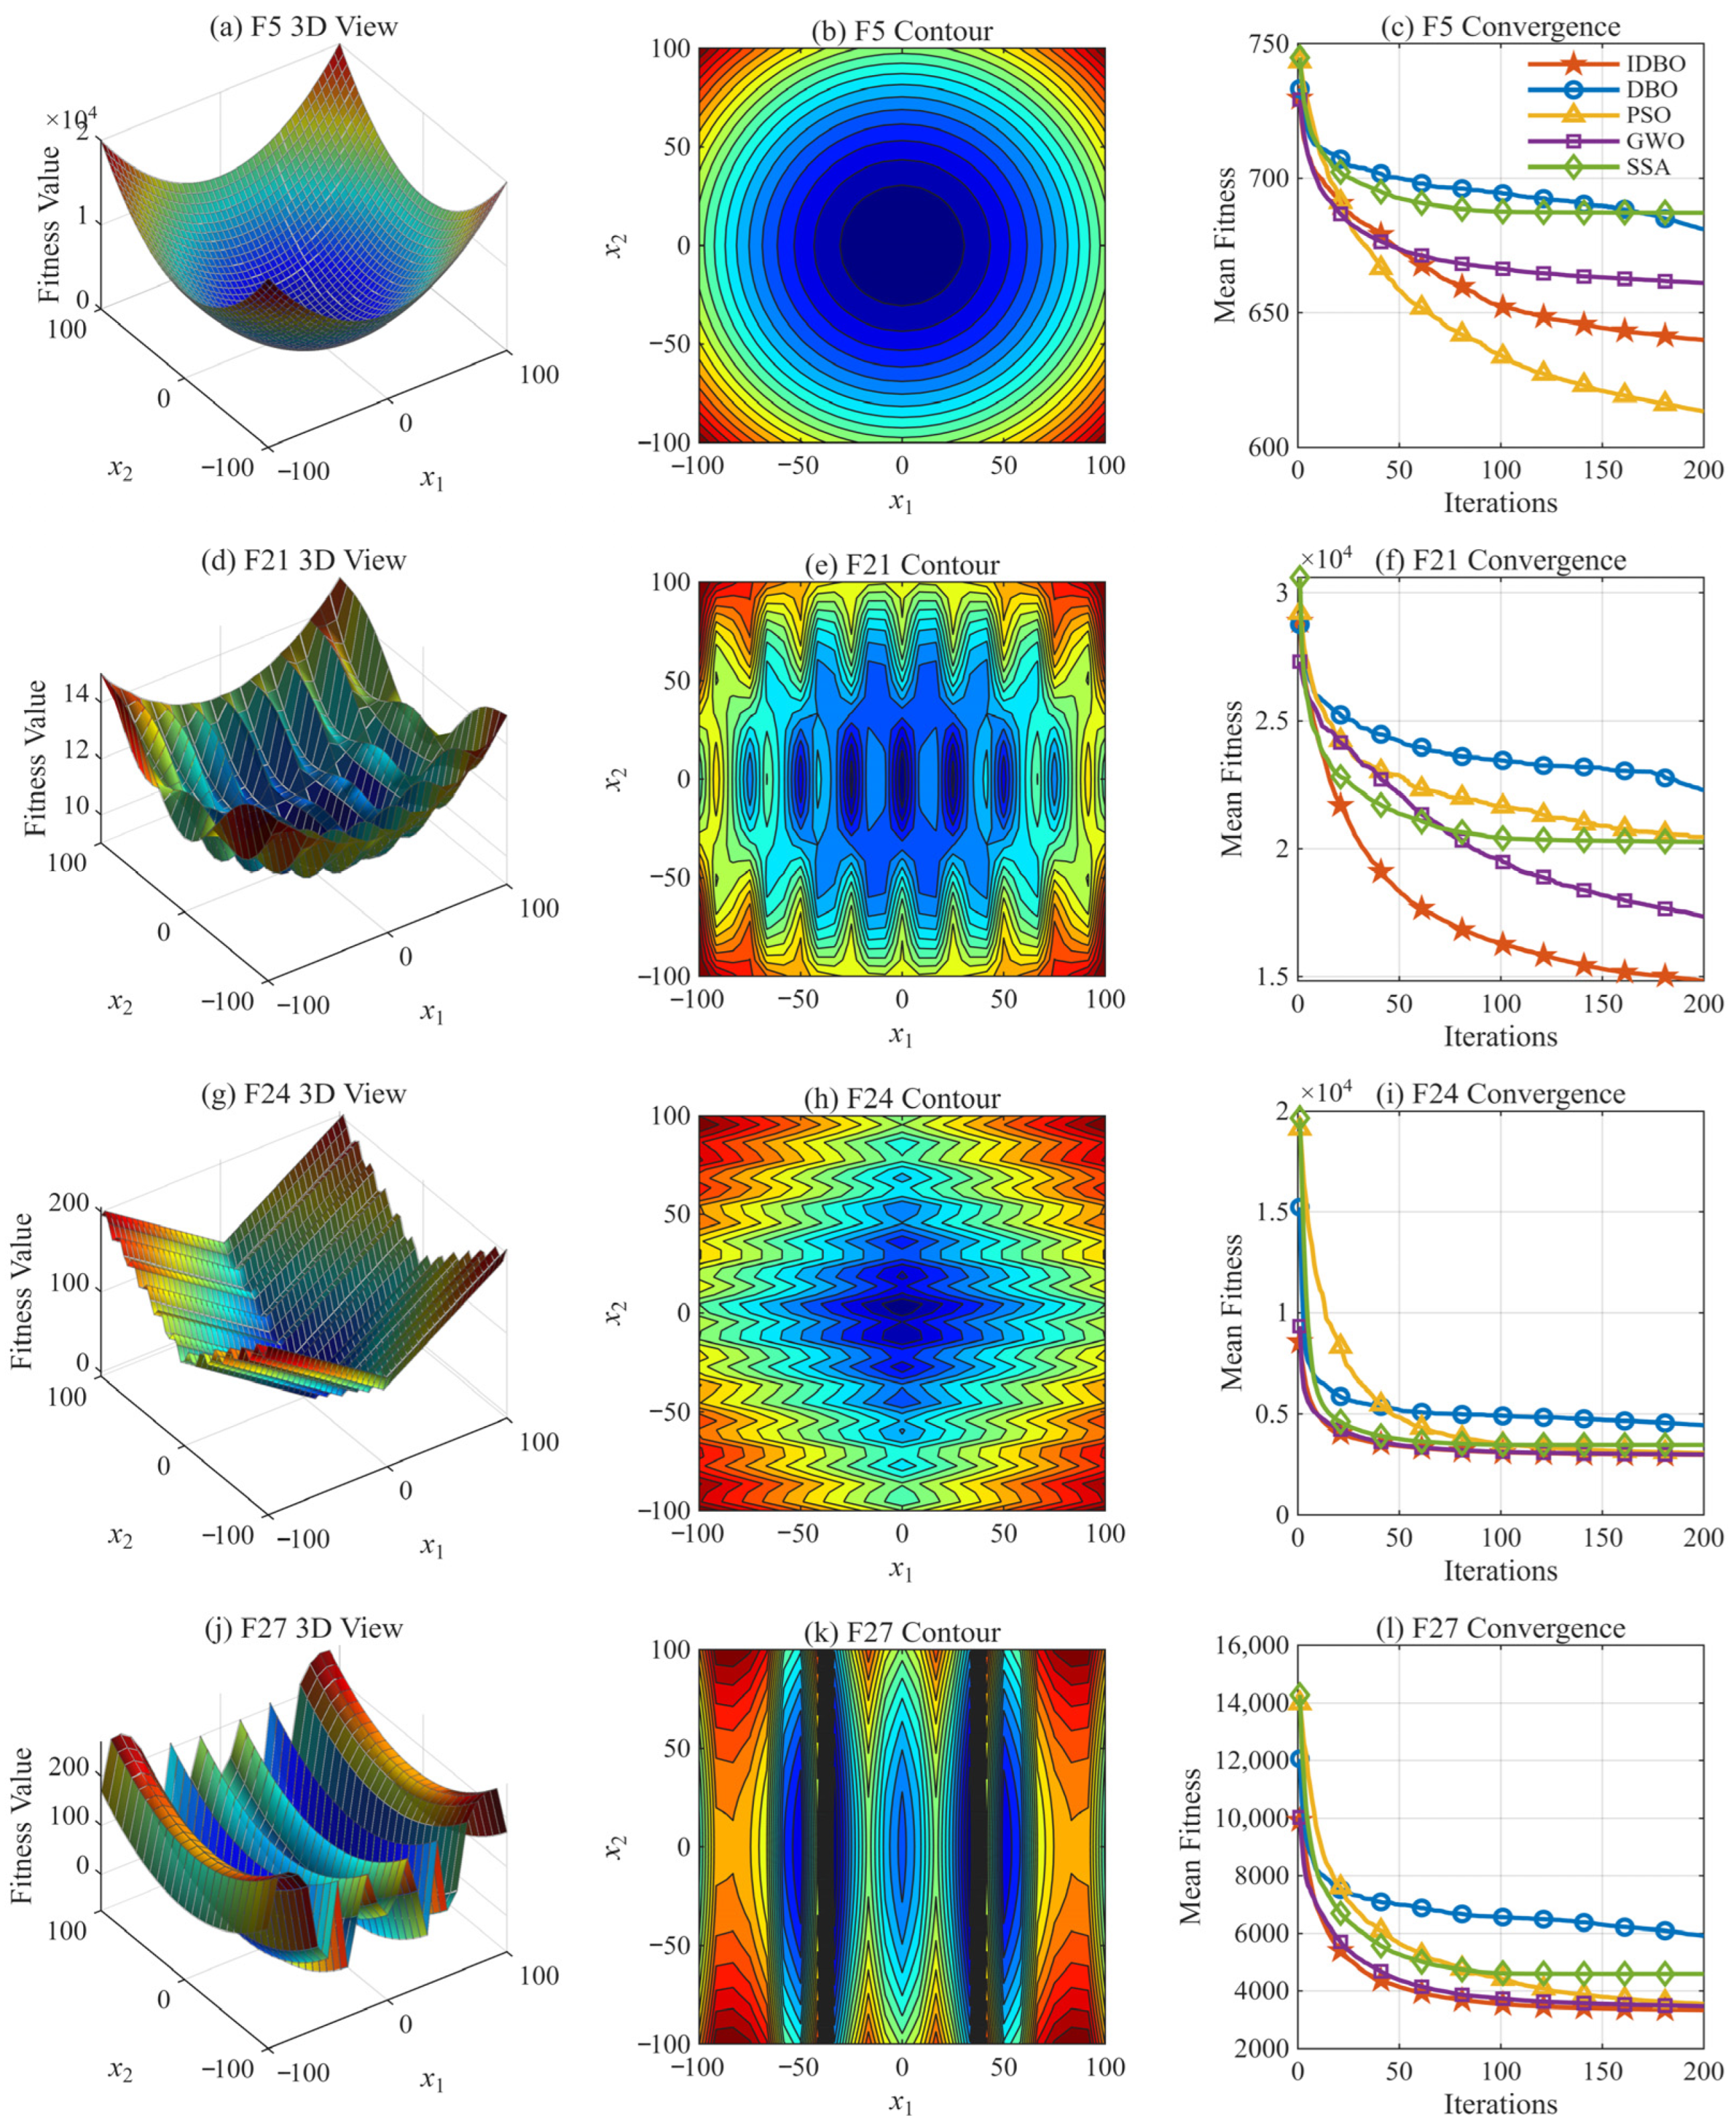
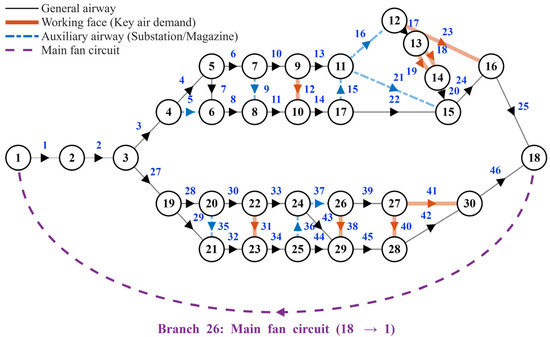
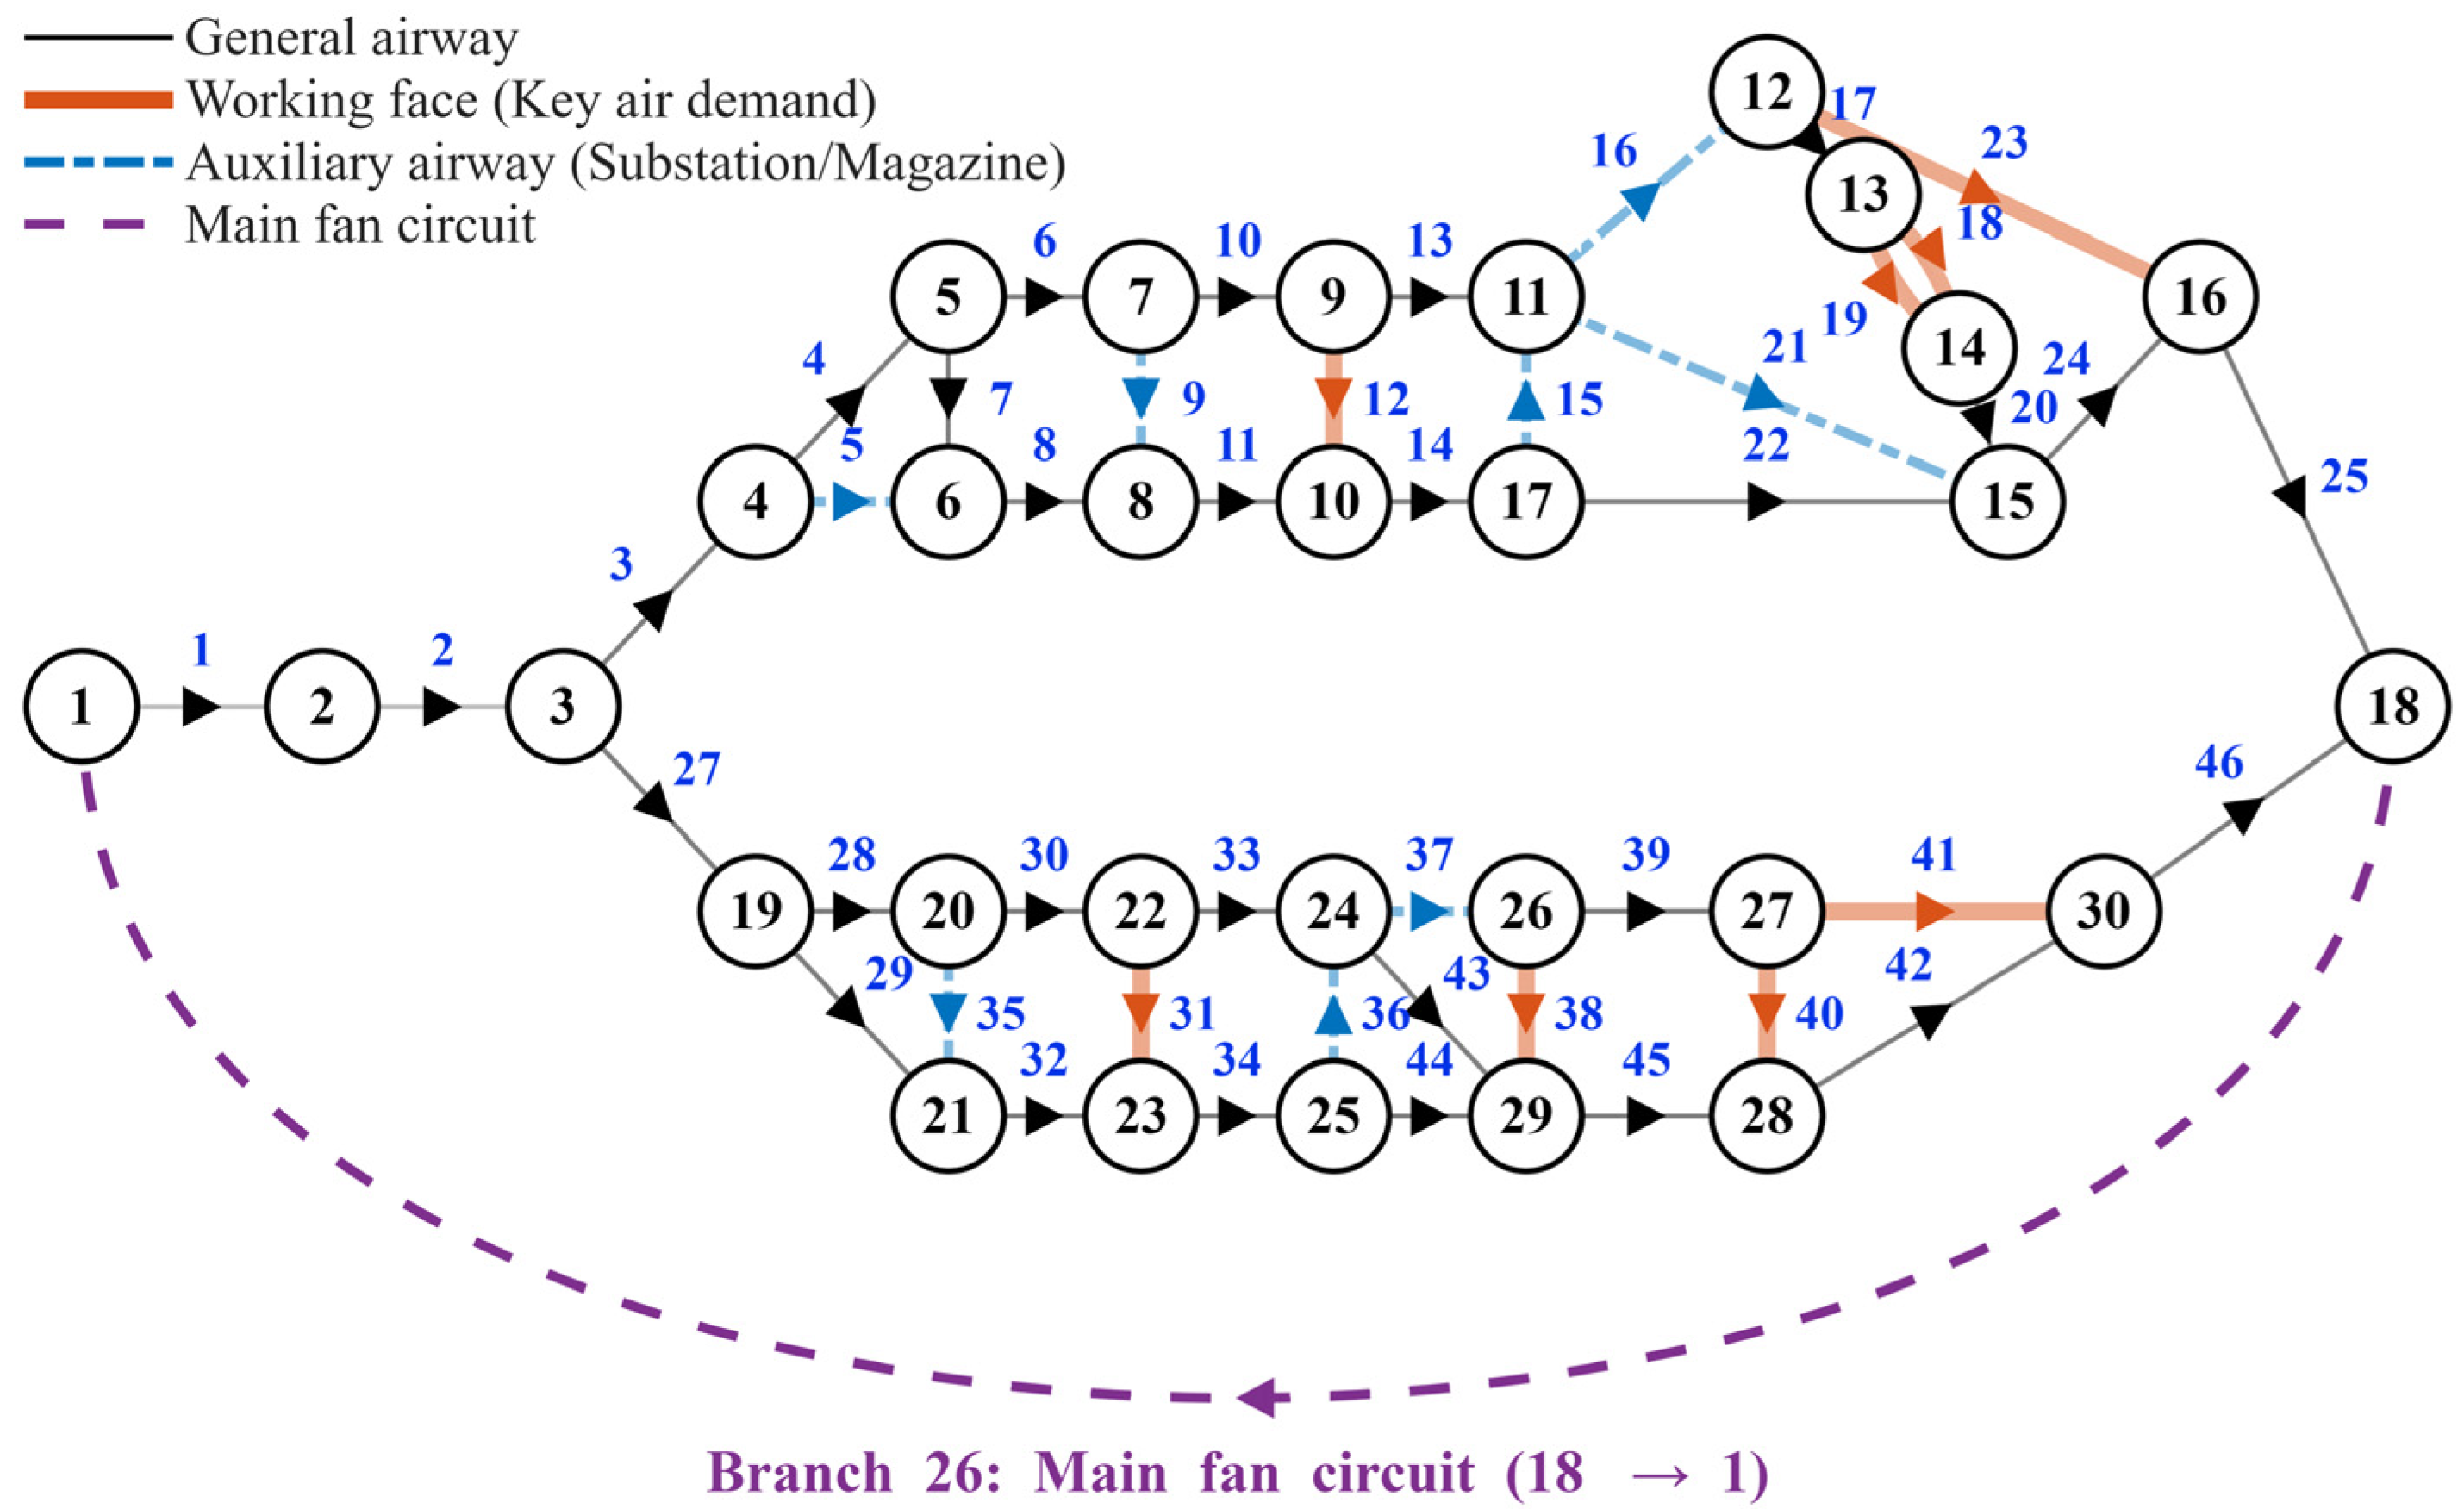
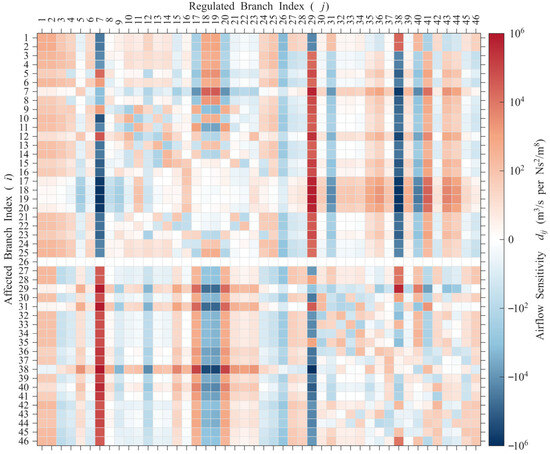
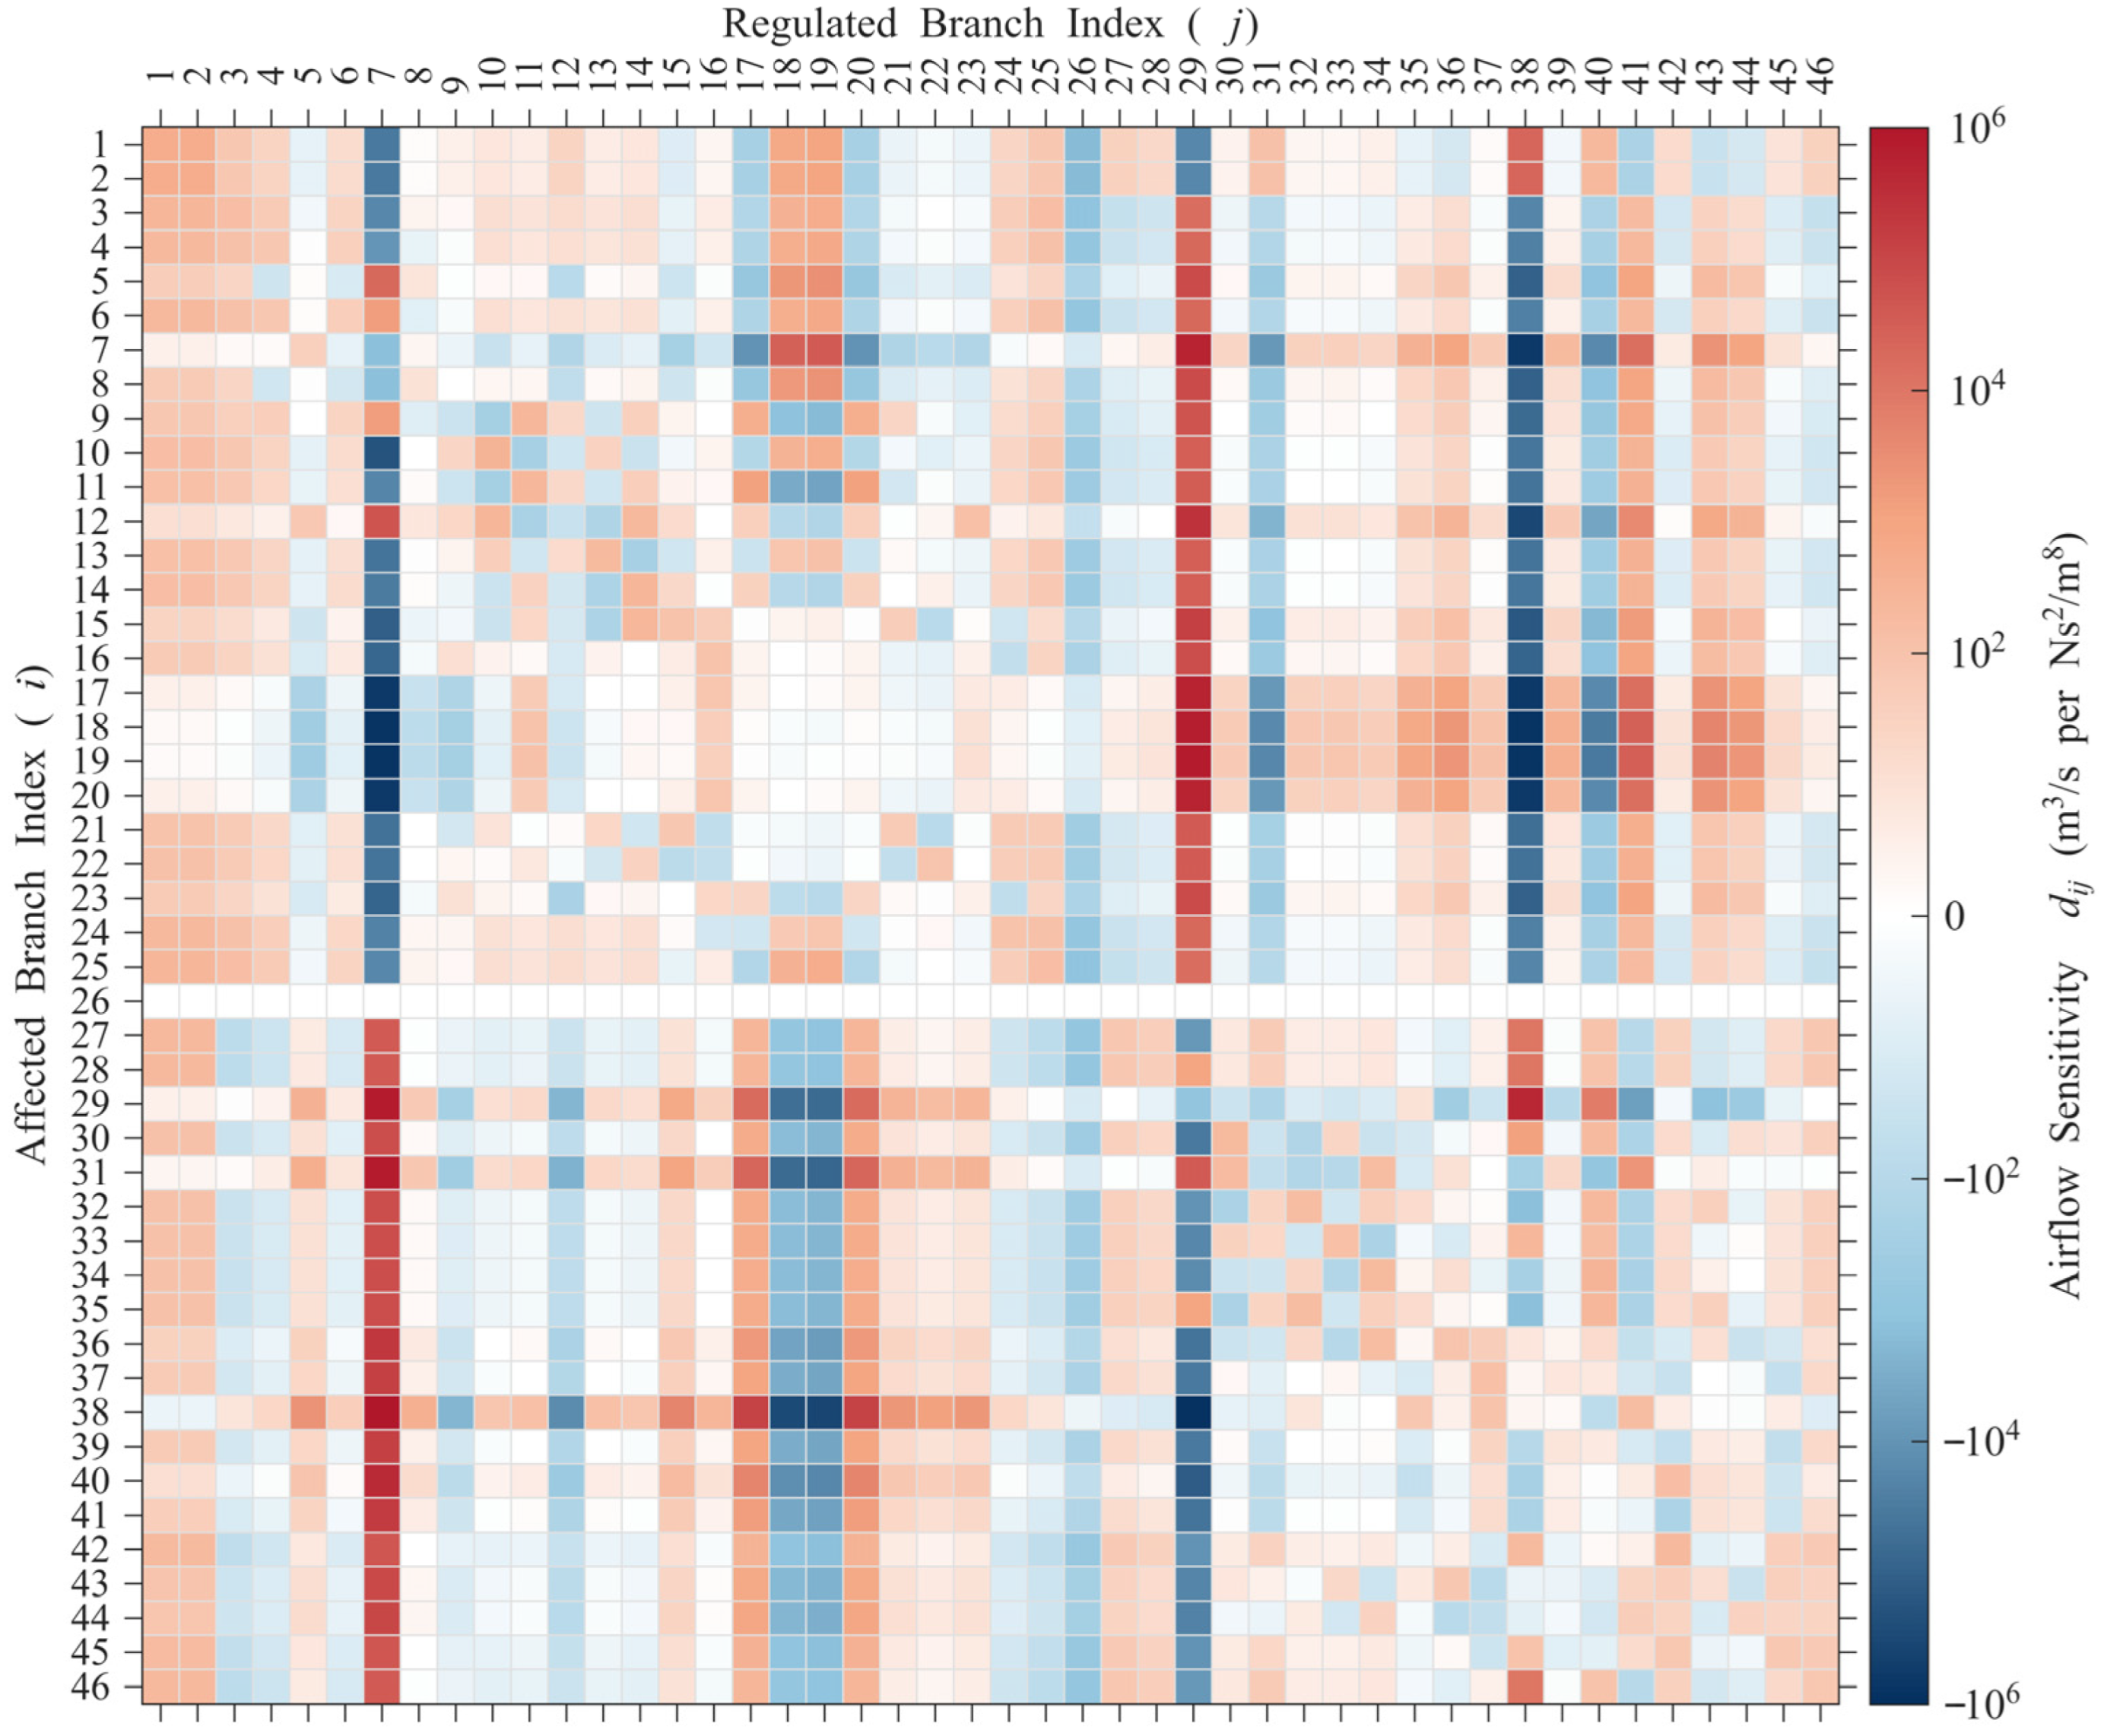
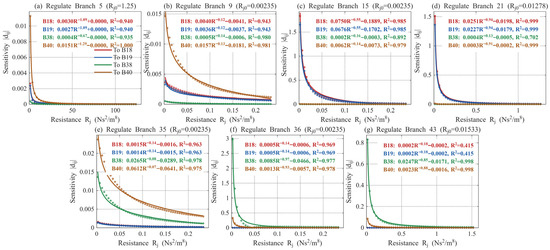
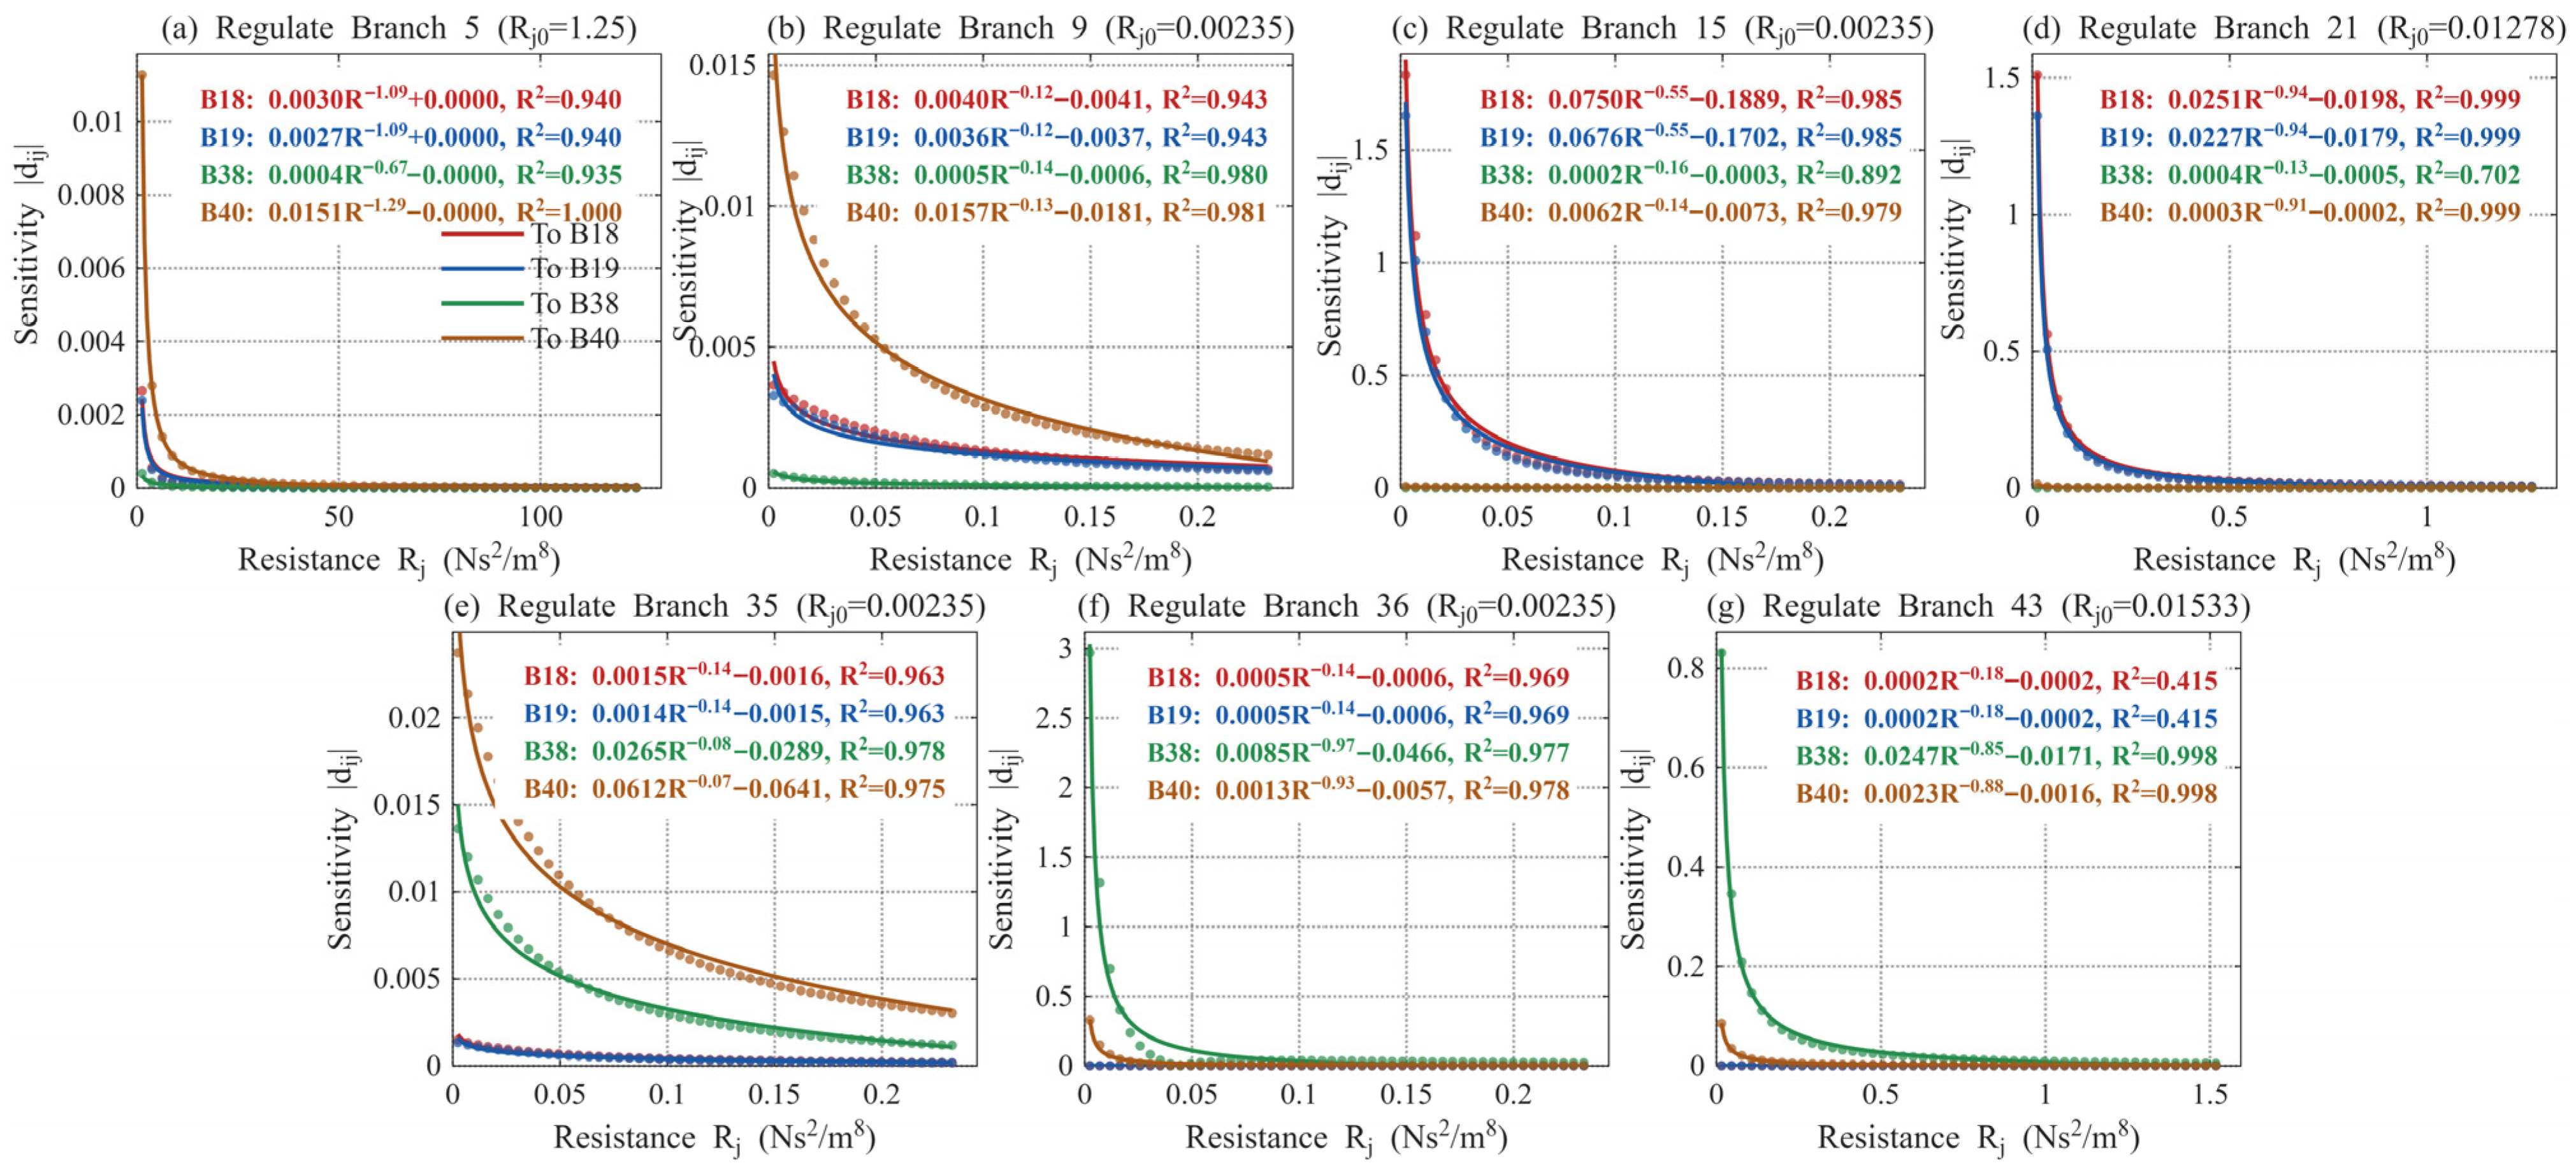
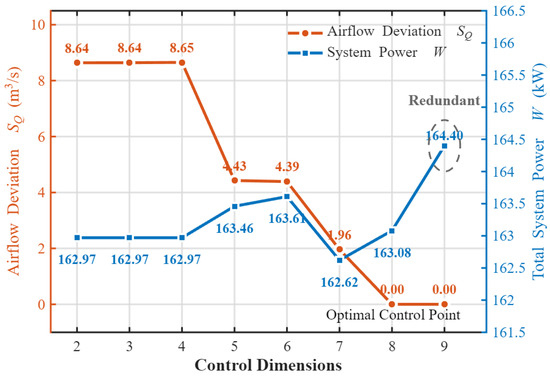
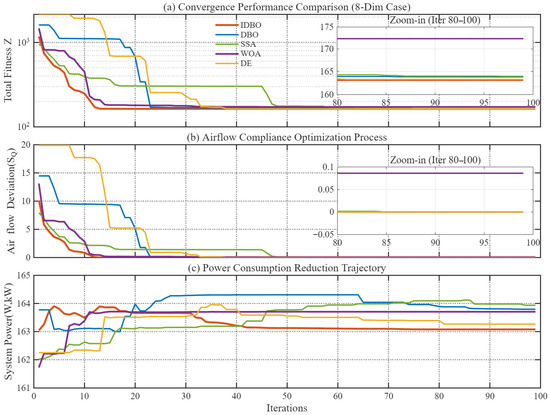
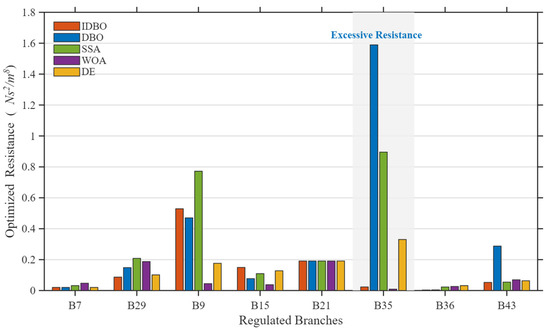
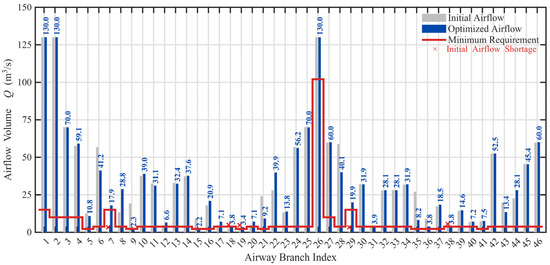

Disclaimer/Publisher’s Note: The statements, opinions and data contained in all publications are solely those of the individual author(s) and contributor(s) and not of MDPI and/or the editor(s). MDPI and/or the editor(s) disclaim responsibility for any injury to people or property resulting from any ideas, methods, instructions or products referred to in the content. |
© 2026 by the authors. Licensee MDPI, Basel, Switzerland. This article is an open access article distributed under the terms and conditions of the Creative Commons Attribution (CC BY) license.