


Abstract
Impact craters are among the most abundant geological structures on solid planetary surfaces and provide valuable information about impact processes and surface evolution. However, the systematic characterization of crater morphology remains challenging due to dataset heterogeneity, measurement uncertainty, and gradual transitions between morphological classes. This study proposes FAS-XAI, an interpretable framework for the comparative analysis of planetary crater datasets that combines fuzzy clustering and explainable artificial intelligence (XAI). The methodology combines exploratory data analysis, measurement-uncertainty assessment, unsupervised learning, supervised consistency analysis, and interpretable machine learning to identify and characterize crater morphologies through a structured workflow. The framework is applied to the Moon Crater Database v1 and the Robbins Mars Crater Database, two large-scale crater catalogs sharing a common geometric parameterization of crater properties. Using the variables available in both datasets, Fuzzy C-Means identifies morphological crater groups, while XGBoost assesses how consistently the resulting dominant cluster labels can be reconstructed from the same descriptor space. XAI techniques are then used to explain the contribution of each variable to the identified groups. The results reveal distinct structural patterns in the organization of lunar and Martian crater populations.
Keywords:
fuzzy C-Means clustering; explainable artificial intelligence (XAI); machine learning; planetary craters; planetary surface analysis; uncertainty analysis MSC:
62H30; 68T37; 85A35
1. Introduction
Impact craters are among the most abundant geological structures on the surfaces of solid planetary bodies and provide key information about impact processes, surface evolution, and the physical properties of planetary regolith. Because craters accumulate over geological timescales and experience different degrees of degradation, their morphology and spatial distribution constitute essential evidence for reconstructing the geological history of planetary surfaces. For this reason, systematic crater catalogs have become fundamental resources in planetary science and comparative planetology.
Advances in planetary missions and remote sensing technologies have enabled the creation of large-scale crater databases containing detailed geometric measurements of crater structures. Among the most widely used datasets are the Moon Crater Database v1 [1] and the Robbins Mars Crater Database [2], both compiled at the USGS Astrogeology Science Center. These catalogs provide consistent geometric descriptions of crater morphology, including circular and elliptical diameter estimates, eccentricity parameters, and measurement uncertainties derived from orbital imagery.
Despite the richness of these datasets, the systematic characterization of crater morphology remains challenging. Traditional approaches often rely on discrete morphological classifications, assigning each crater to a single category. In practice, however, planetary surfaces frequently exhibit gradual transitions between morphological states because of processes such as erosion, infilling, tectonic deformation, or resurfacing. Under these conditions, crater morphologies are more naturally described as continuous distributions rather than sharply separated classes.
Recent developments in artificial intelligence have emphasized the importance of interpretability and careful uncertainty assessment when analyzing complex scientific datasets. Fuzzy clustering methods, such as Fuzzy C-Means, allow gradual transitions between classes to be represented through soft membership values [3]. At the same time, explainable artificial intelligence (XAI) techniques provide tools for interpreting the contribution of individual variables to model outcomes and for understanding the factors that structure the resulting classifications [4].
In this work, we apply the FAS-XAI framework [5] to the study of planetary crater datasets, combining exploratory data analysis, uncertainty assessment, fuzzy clustering, supervised reconstruction, and explainable AI techniques. The contribution of this study lies in combining these methods within a single workflow for the comparative analysis of large planetary crater catalogs. Applied to more than 1.6 million lunar and Martian impact craters described by a shared set of geometric variables, the framework allows crater groupings to be identified and compared across both planetary surfaces. The same workflow may also be adapted to other problems in planetary geomorphology.
The remainder of this paper is organized as follows. Section 2 reviews related work on crater morphology analysis, fuzzy clustering, and explainable artificial intelligence. Section 3 describes the datasets and the proposed methodology. Section 4 presents experimental results. Section 5 discusses the implications of the findings and outlines possible directions for future research. Finally, Section 6 summarizes the main conclusions.
2. Related Work
2.1. Unsupervised Learning and Clustering Methods in Crater Analysis
Research on clustering and unsupervised learning in crater analysis has expanded gradually over the last two decades. Clustering and other unsupervised learning approaches have been explored as tools to identify patterns in crater morphology and spatial distributions.
To examine this trend, a Web of Science topic search was conducted using the query TS = (crater* OR “impact crater*”) AND TS = (cluster* OR “fuzzy c-means” OR “unsupervised learning”). The results reveal a steadily expanding body of the literature over the past two decades. As illustrated in Figure 1, the number of publications remained very limited until the early 2000s, reflecting the historical manual nature of crater analysis in planetary geology. During this period, most studies relied on geomorphological interpretation and manual cataloging of crater structures.
Figure 1.
Publications (415) and citations (10,226). TS = (crater* OR “impact crater*”) AND TS = (cluster* OR “fuzzy c-means” OR “unsupervised learning”).
From approximately 2005 onward, publication activity began to increase gradually, coinciding with the expansion of high-resolution planetary datasets obtained from orbital missions and with the broader adoption of machine learning techniques in geoscience research. A more pronounced growth phase becomes visible after 2015, when the availability of large planetary databases and improvements in computational methods enabled the systematic application of clustering and other unsupervised learning approaches to planetary surface analysis.
Despite this increasing research activity, most existing studies remain primarily focused on crater detection, cataloging, or basic morphological classification. Clustering methods are often used to group crater properties or to identify spatial patterns in crater distributions. However, comparatively few studies investigate the interpretability of these groupings or attempt to explain which variables most strongly define the observed morphological structures.
2.2. Explainable Artificial Intelligence in Planetary Science
Recent advances in machine learning have emphasized the importance of interpretability when applying predictive models to scientific datasets. In this context, explainable artificial intelligence (XAI) has emerged as a methodological framework aimed at providing transparent insights into the behavior of complex models.
To evaluate the current adoption of these techniques in planetary science, a bibliographic search was conducted in Web of Science using the query: TS = (“explainable AI” OR “explainable artificial intelligence” OR XAI) AND TS = (planet* OR mars OR lunar OR moon OR crater* OR “planetary surface”). The results suggest that the application of XAI techniques within planetary science remains relatively limited, as illustrated in Figure 2.
Figure 2.
Publications (29) and Citations (278). TS = (“explainable AI” OR “explainable artificial intelligence” OR XAI) AND TS = (planet* OR mars OR lunar OR moon OR crater* OR “planetary surface”).
Several studies explore interpretable machine learning in the context of remote sensing datasets. For example, recent work has applied XAI techniques to satellite imagery to predict winter wheat parameters using Planet SuperDove data [6], as well as to analyze vegetation water status and vine growth through interpretable models based on high-resolution imagery [7]. Other contributions address broader space science applications, including methodological frameworks for developing explainable artificial intelligence models in space science and the interpretable analysis of exoplanet atmospheric parameters [8].
Within the planetary domain, however, only a small number of studies apply explainable machine learning techniques directly to planetary datasets. Examples include research on Martian dust displacement detection using explainable machine learning methods [9], as well as recent work applying the FAS-XAI framework to the interpretable vetting of Kepler exoplanet candidates [5].
Overall, these studies illustrate the growing interest in interpretable machine learning within space science and remote sensing. Nevertheless, the application of XAI techniques to the morphological analysis of planetary surfaces, and particularly to the interpretation of crater morphology patterns, remains largely unexplored.
2.3. Explainable Fuzzy Clustering and Interpretable Cluster Characterization
Recent research has begun to explore the integration of fuzzy clustering methods with explainable artificial intelligence (XAI) to provide interpretable insights into data-driven groupings. This trend was examined through a Web of Science search using the query: TS = (“fuzzy c-means” OR “fuzzy clustering”) AND TS = (“explainable AI” OR XAI OR “interpretable machine learning”).
The results identify 24 publications with a total of 55 citations, indicating that the combination of fuzzy clustering and explainable AI remains a relatively recent and still limited research area. As illustrated in Figure 3, most contributions have appeared only in the last few years, reflecting the growing interest in interpretable machine learning approaches.
Figure 3.
Publications (24) and citations (55). TS = (“fuzzy c-means” OR “fuzzy clustering”) AND TS = (“explainable AI” OR XAI OR “interpretable machine learning”).
Existing studies apply explainable fuzzy clustering frameworks across a variety of domains. Reported applications include energy demand analysis [10], medical imaging and neurological studies [11,12,13], clinical decision support in intensive care [14], customer segmentation [15], and decision-support systems [16]. Additional research explores the combination of fuzzy clustering and interpretability techniques to model complex datasets in areas such as education, chemical process analysis, and quantum systems.
Despite this diversity of applications, the literature reveals a clear gap in the application of explainable fuzzy clustering methods to planetary science and planetary surface analysis. A more restrictive query: TS = (crater* OR “planetary surface”) AND TS = (“fuzzy c-means” OR “fuzzy clustering”) AND TS = (“explainable AI” OR XAI) returns no publications, suggesting that the integration of fuzzy clustering and explainable artificial intelligence has not yet been explored for the interpretable characterization of planetary surface morphology.
This absence of prior work highlights the novelty of the FAS-XAI framework to planetary crater analysis in this study, which integrates fuzzy clustering with explainable AI techniques to analyze crater morphological patterns in large planetary datasets.
3. Materials and Methods
This section describes the methodological design adopted to comparatively analyze the morphology of lunar and Martian impact craters using an analytical framework. The objective is to establish a workflow that integrates fuzzy clustering, supervised consistency analysis, and explainable artificial intelligence techniques to identify and interpret morphological patterns across planetary surfaces.
The proposed approach explores crater morphology through an analytical framework that combines geometric measurements extracted from planetary crater catalogs with unsupervised learning and interpretable modeling techniques. In the present study, measurement uncertainty was assessed descriptively from the catalog metadata, whereas assignment uncertainty was explicitly represented through the fuzzy membership structure of Fuzzy C-Means. This design enables the identification of descriptor-based morphological patterns and the interpretation of the variables that characterize them.
The methodology was applied to two large-scale crater catalogs: the Moon Crater Database v1 [1] and the Robbins Mars Crater Database [2], which provide consistent geometric parameterizations of crater properties. Analyzing both datasets within a unified analytical pipeline allows the comparative examination of crater morphology across different planetary environments.
The workflow was organized as a sequence of analytical phases, ranging from data preparation and exploratory analysis to clustering, supervised reconstruction, and interpretable machine learning. Figure 4 summarizes the overall workflow.
Figure 4.
Framework methodological architecture.
The design of this pipeline follows a stepwise strategy in which unsupervised learning is used to identify potential morphological structures, supervised learning evaluates their statistical separability, and explainable artificial intelligence techniques provide interpretability of the resulting patterns. The methodological process unfolds as follows:
- Exploratory Data Analysis (EDA). Before applying clustering methods, the dataset was examined through exploratory data analysis techniques (EDA). Descriptive statistics, distributional analysis, and correlation exploration were used to understand the behavior of crater morphological variables. This stage allows the identification of distributional asymmetries, potential noise measurement, and structural heterogeneity within the data. The insights obtained during EDA guide the selection of variables and parameters used in the subsequent modeling stages.
- Error Modeling and Measurement Assessment. Crater measurements derived from orbital imagery may contain uncertainties associated with image resolution, projection effects, and manual or semi-automatic identification procedures. To evaluate the potential impact of these uncertainties, an intermediate stage was introduced to model measurement error as a function of crater size. The relative error in crater localization and geometric measurements is estimated as a function of crater diameter, enabling the characterization of scale-dependent measurement uncertainty.
- Fuzzy Clustering (Fuzzy C-Means). To identify morphological crater regimes, Fuzzy C-Means (FCM) clustering was applied to the selected feature space. Cluster centroids and membership distributions were analyzed to characterize the dominant morphological patterns. The fuzzy membership representation also allows the identification of transitional crater structures that lie between these groups.
- Supervised Predictive Model. To assess the internal consistency of the clustering results, XGBoost, a supervised machine learning algorithm, was trained to predict cluster assignments using the same input variables. This step evaluates whether the fuzzy partition identified in the unsupervised stage can be consistently reconstructed from the original feature space. Model performance metrics therefore provide a quantitative measure of partition coherence and feature-space separability, rather than an independent external validation of geological categories.
- Explainable Analytics. To interpret the variables driving cluster formation and predictive performance, explainable artificial intelligence techniques were applied to the supervised model. SHAP (SHapley Additive exPlanations) values were computed to estimate the contribution of each feature to the model predictions. This stage provides interpretable insights into the morphological characteristics defining each crater cluster and allows the identification of key geometric variables influencing planetary surface morphology.
- Comparative Morphological Interpretation. Finally, the clustering results and XAI interpretations were analyzed comparatively for the lunar and Martian crater datasets. By examining similarities and differences in cluster structures and feature importance profiles, the methodology enables the identification of morphological patterns associated with different planetary environments. This comparative perspective provides insights into the geological processes that shape crater morphology across planetary surfaces.
3.1. Data Sources
This study relies on two large-scale planetary crater catalogs that provide systematic geometric measurements of impact structures on the Moon and Mars: the Moon Crater Database v1 [1] and the Robbins Mars Crater Database [2]. Both datasets were compiled and curated by the USGS Astrogeology Science Center and represent two of the most comprehensive publicly available resources for planetary crater analysis.
The Moon Crater Database v1 contains a global inventory of lunar impact craters derived from high-resolution orbital imagery. The catalog includes geometric parameters obtained through circular and elliptical fitting procedures applied to crater rims identified in remote sensing images. For each crater, the dataset provides information on crater location, circular diameter, elliptical geometry, rim detection quality, and associated measurement uncertainties.
Similarly, the Robbins Mars Crater Database provides a global inventory of Martian impact craters constructed from multiple orbital datasets acquired by Mars missions. The database includes circular and elliptical measurements of crater geometry, positional information, rim detection metrics, and uncertainty estimates derived from image-based crater identification and fitting procedures.
Both catalogs share a largely consistent geometric parameterization of crater morphology, which makes them particularly suitable for comparative planetary analysis. The datasets report circular crater diameter estimates, elliptical shape descriptors, and standard deviations associated with measurement uncertainty. These common attributes allow the application of a unified analytical pipeline across both planetary surfaces.
Together, the two catalogs describe more than 1.6 million impact craters, spanning a wide range of crater diameters and morphological conditions. The scale and consistency of these datasets make them well suited for data-driven morphological analysis using machine learning and clustering techniques.
For the purposes of this study, only variables present in both catalogs were retained to ensure methodological consistency and comparability between lunar and Martian crater morphology. The selected variables and their definitions are described in the following section.
3.2. Variable Selection and Description
The variables selected for the analysis can be grouped into four main categories: positional variables, geometric descriptors, detection-quality indicators, and derived uncertainty metrics.
Positional variables describe the geographic location of each crater on the planetary surface. These include the latitude and longitude associated with both the circular and elliptical crater fits. Although positional information is not directly related to crater morphology, it allows the spatial distribution of craters to be analyzed and supports the interpretation of regional patterns across planetary surfaces.
Geometric descriptors capture the overall size and shape of the crater. These variables include circular diameter, the major and minor axes of the elliptical fit, eccentricity, and ellipticity. Together, these parameters provide a quantitative representation of crater morphology and allow the identification of structural variations associated with impact geometry, degradation processes, and rim deformation.
Detection-quality indicators quantify the reliability of the crater detection procedure. These variables describe the fraction of the crater rim successfully identified in the imagery and the number of rim points used during the fitting process. These metrics provide additional information about the completeness and reliability of the geometric measurements derived from orbital images.
Finally, additional derived variables are computed during preprocessing to quantify spatial localization error and relative measurement uncertainty. These variables help characterize measurement reliability and provide context for preprocessing and interpretation.
Table 1 summarizes the variables used in the morphological analysis.
Table 1.
Variables used in the morphological analysis of lunar and Martian crater datasets.
3.3. Data Preparation and Harmonization
The first stage of the analysis focuses on preparing and harmonizing the crater datasets obtained from the Moon Crater Database v1 and the Robbins Mars Crater Database. Although both catalogs provide consistent geometric descriptions of crater morphology, raw entries may contain coordinate inconsistencies, extreme measurement artifacts, or incomplete detections that must be addressed before statistical analysis.
The preprocessing pipeline begins by standardizing the geographic coordinate system. Longitudes originally expressed in the range 0–360° were transformed into the interval −180–180°, ensuring compatibility with conventional planetary mapping frameworks. All variables used in the analysis were then converted to numeric format to avoid parsing inconsistencies and ensure compatibility with numerical modeling procedures.
Following harmonization, the datasets were filtered using a common set of physically reasonable conditions. Craters with circular diameters smaller than 1 km were excluded to reduce resolution-related uncertainty. Additional filters retain only records with positive latitude and longitude standard deviations below 0.01 degrees, positive rim-arc fraction values, and at least one detected rim point. These criteria remove clearly implausible or incomplete entries while preserving a consistent preprocessing strategy across both catalogs. Under these criteria, the final datasets retained for analysis comprised 1,293,016 lunar craters and 384,781 Martian craters.
Localization uncertainty was estimated from the angular standard deviations provided in the catalogs. More generally, angular uncertainties can be converted into spatial errors using a planet-specific factor , where denotes the mean radius of the planetary body. In the present study, however, common reference scaling was used for descriptive comparison across both datasets. The corresponding error components are therefore computed as:
where and denote the angular standard deviations of latitude and longitude measurements, respectively, and represents the crater latitude.
A single localization uncertainty measure is obtained by combining both components using the Euclidean distance:
where represents the estimated localization error of each crater in kilometers.
To account for the large range of crater diameters, a normalized error metric is also defined as:
where represents the circular crater diameter. This relative error provides a scale-normalized proxy of positional uncertainty for descriptive comparison and is used in the subsequent exploratory and error-assessment stages.
Through this process, the lunar and Martian crater datasets are transformed into harmonized and numerically consistent datasets suitable for statistical exploration and clustering. The derived uncertainty metrics are used as descriptive proxies to characterize measurement reliability and support preprocessing and interpretation. They are not included among the clustering variables.
3.4. Exploratory Data Analysis (EDA)
After preprocessing, an exploratory data analysis (EDA) stage was conducted to examine the statistical and geometric structure of the lunar and Martian crater datasets prior to clustering.
The analysis begins with the distribution of crater diameters. For both datasets, histograms of circular crater diameter were computed using logarithmic frequency scaling to account for the strong imbalance between small and large craters. As expected, the distributions are dominated by small craters, with frequencies progressively decreasing toward larger diameters.
To evaluate measurement precision, the relative uncertainty associated with diameter estimates was computed according to Equation (3). Scatter plots of relative diameter error versus crater diameter were examined on a logarithmic scale for both datasets, allowing the identification of potential scale-dependent measurement effects.
Crater shape characteristics were further explored using parameters derived from elliptical fitting. Histograms of crater eccentricity were used to evaluate the prevalence of near-circular versus elongated crater geometries, while scatter plots of eccentricity versus crater diameter were inspected to identify possible size-dependent trends. The relationship between the major and minor axes of the fitted ellipses was also analyzed to visualize deviations from circular morphology.
Detection quality was assessed using the rim-detection indicators provided in the catalogs. In particular, the variable ARC_IMG, representing the fraction of detected crater rim, was analyzed through frequency distributions. The number of rim points (PTS_RIM_IMG) provides an additional indicator of detection completeness and geometric reliability.
Relationships between the main morphological variables were further examined using correlation matrices computed for both datasets. The correlation coefficient between two variables and is defined as:
where denotes the covariance between the variables and and represent their respective standard deviations. Heatmap visualizations of these matrices provide a compact overview of variable dependencies and help identify potential redundancies among morphological descriptors.
Spatial exploratory analysis was also performed by projecting craters larger than 10 km onto planetary coordinates, with marker size scaled according to crater diameter. These maps provide a global overview of the spatial distribution of large impact structures. In addition, interactive cartographic visualizations were generated for the 5000 largest craters in each dataset, integrating planetary basemaps with crater geometry and localization error estimates to enable object-level inspection.
Finally, the distributions of localization error were compared between the lunar and Martian datasets using logarithmic scaling, providing a direct assessment of positional uncertainty across both catalogs.
Overall, the EDA stage provides a statistical and spatial characterization of the crater datasets and establishes the empirical basis for the subsequent clustering and interpretability analyses.
3.5. Error Modeling and Measurement Assessment
To assess the relative behavior of localization uncertainty across crater sizes, an explicit error-modeling stage was performed for both the lunar and Martian datasets. The objective was to quantify how the adopted localization-error proxy scales with crater size and to determine whether the observed error structure follows a systematic pattern rather than random dispersion.
Only craters with strictly positive circular diameter and non-zero localization error were retained for this stage. The combined localization-error proxy previously defined as was modeled as a function of crater diameter . Because both variables span several orders of magnitude, the relationship was examined in logarithmic space. Specifically, the following linear model was fitted:
where is a scale coefficient and is the exponent describing the dependence of localization error on crater diameter. Rewriting the model in its original form yields the power-law expression:
which provides an interpretable representation of scale-dependent measurement uncertainty.
For both the Moon and Mars datasets, the parameters and were estimated using ordinary least squares linear regression in log–log space. This approach captures the dominant scaling trend while reducing the influence of strong asymmetries in the raw distributions. The goodness of fit of each model was evaluated using the coefficient of determination , defined as:
where denotes the observed logarithmic localization error, denotes the predicted value from the regression model, and denotes the average of the observed values.
To visually assess the quality of the fit, scatter plots of localization error versus crater diameter were generated in log–log scale together with the fitted power-law curve. In addition, residuals were computed as:
where is the observed localization error for crater and is the value predicted by the fitted model. Residual plots were then examined to evaluate whether systematic deviations remained across the diameter range.
This modeling stage serves two main purposes. First, it provides an empirical description of how the adopted localization-error proxy varies with crater size in each dataset. Second, it supports a descriptive comparison of the scaling behavior of this proxy between lunar and Martian craters. Because the proxy is based on a common reference conversion rather than planet-specific geodesic scaling, these results should be interpreted comparatively rather than as exact physical localization errors in kilometers.
3.6. Fuzzy Clustering Process
3.6.1. Fuzzy Clustering
To identify descriptor-based crater groupings within the datasets while accounting for gradual transitions between crater structures, Fuzzy C-Means (FCM) clustering was applied to the selected geometric feature space [17,18]. Unlike hard clustering approaches, which assign each observation to a single cluster, FCM allows soft memberships, enabling each crater to belong to multiple clusters with varying degrees of association. This property is particularly suitable for planetary surface morphology, where crater characteristics often exhibit continuous variation rather than sharply defined classes.
Given a dataset , where each vector represents the set of morphological variables describing crater , the FCM algorithm partitions the data into clusters by minimizing the objective function:
where
- denotes the membership degree of crater to cluster .
- represents the centroid of cluster .
- is the fuzzification parameter (set to in this study).
- denotes the Euclidean norm.
The membership matrix satisfies the constraint:
Optimization proceeds iteratively by alternating between centroid updates:
and membership updates:
until convergence of the objective function is achieved.
For interpretative purposes, dominant cluster labels were derived as:
while retaining the full fuzzy membership matrix for uncertainty analysis. This dual representation preserves the information contained in the soft clustering while enabling compatibility with subsequent supervised modeling and interpretability analyses.
3.6.2. Selection of the Number of Clusters
The number of clusters was examined using an internal cluster validity index. In particular, the Fuzzy Partition Coefficient (FPC) was used to assess the clarity of the fuzzy partition [19]:
where denotes the number of observations and represents the membership degree of observation to cluster . Larger values of the FPC show clearer cluster separation and more stable fuzzy partitions.
The index was computed for different candidate values of . The selected configuration corresponds to the value that preserves partition clarity while maintaining an analytically interpretable distinction between clusters.
3.7. Supervised Predictive Model
To assess the separability and recoverability of the dominant labels derived from the fuzzy partition identified in Section 3.6, supervised classification models based on Extreme Gradient Boosting (XGBoost) were trained using the same morphological variables employed in the clustering stage [20]. The purpose of this step is to assess whether the dominant cluster assignments obtained through fuzzy clustering can be consistently recovered from the original descriptor space.
Dominant hard labels were obtained by selecting, for each crater, the cluster with the maximum fuzzy membership as defined in Equation (13). These labels constitute the target variable for the supervised assessment stage.
Let denote the morphological feature vector describing crater . The input variables of the supervised model correspond to the subset of crater descriptors listed in Table 1, including geometric parameters and detection-quality indicators derived from the crater catalogs.
These variables describe the physical structure of each crater through measurements related to crater size, elliptical geometry, and rim detection quality. Formally, the feature vector can be written as:
where each component corresponds to one of the morphological descriptors reported in Table 1.
The target variable represents the dominant cluster assignment obtained from fuzzy clustering as defined in Equation (13).
The supervised model estimates a mapping:
that predicts the cluster label from the morphological feature vector.
The model parameters are optimized through gradient boosting by minimizing a regularized loss function of the form:
where
- denotes the multi-class classification loss.
- represents the individual decision trees composing the boosted ensemble.
- is a regularization term controlling model complexity.
- denotes the number of boosting iterations.
To ensure reproducibility and a consistent evaluation, the dataset was partitioned into training and test subsets 80/20, using stratified sampling, preserving the relative cluster proportions, with a fixed random seed of 42. Because the lunar and Martian datasets differ in size and class structure, the XGBoost configurations were adjusted separately for each case. For the lunar dataset, the classifier was trained with 200 trees, maximum depth 6, learning rate 0.1, subsampling of 0.8 for both observations and features, and the hist tree method. For the Martian dataset, the classifier was trained with 200 trees, maximum depth 5, learning rate 0.05, and the same subsampling settings (subsample = 0.8, colsample_bytree = 0.8). No explicit class-balancing procedure or cross-validation was applied. Model performance was evaluated on the held-out test subsets using confusion matrices and standard classification metrics including precision, recall, and F1-score.
Predictive performance was interpreted as an internal assessment of label recoverability and feature-space separability. If the cluster assignments derived from fuzzy clustering can be accurately predicted from the original morphological variables, the partition can be interpreted as structurally coherent and separable within the selected feature space. However, this supervised stage is not intended as an independent external validation of geological categories. Conversely, systematic confusion between clusters may indicate transitional crater groupings or overlapping descriptor patterns.
This supervised stage therefore complements fuzzy clustering as a reconstruction-based measure of feature-space separability, rather than as an external validation of crater morphology classes.
3.8. Explainable Analysis of Cluster Structure
To ensure interpretability and transparency of the clustering structures, SHAP (SHapley Additive Explanations) was applied to the supervised XGBoost models introduced in Section 3.7 [21,22]. Since fuzzy clustering does not inherently provide feature attribution, interpretability was obtained indirectly by analyzing the classifiers trained to predict cluster assignments from crater morphological variables.
Let denote the trained supervised model and the morphological feature vector describing crater . SHAP assigns to each feature a contribution value such that the model output can be expressed as:
where
- represents the expected model output over the dataset.
- measures the marginal contribution of feature for crater .
These contributions correspond to Shapley values derived from cooperative game theory and are defined as:
where denotes the full set of features and represents a subset of features excluding . This formulation evaluates the marginal contribution of each variable across all possible feature subsets, ensuring a fair and consistent attribution of model predictions.
Because the crater datasets contain hundreds of thousands of observations, SHAP values were computed on a randomly sampled subset of the test data to ensure computational tractability while preserving representative statistical structure.
3.8.1. Global Interpretability
Global SHAP values were aggregated across all observations to evaluate the overall importance of each morphological parameter in distinguishing crater clusters. This analysis identifies which geometric descriptors and detection-quality indicators most strongly contribute to cluster separability [23].
The global SHAP importance was computed as the mean absolute contribution of each feature:
where denotes the overall importance of feature across the dataset.
These global importance scores provide a direct interpretation of which crater properties drive the morphological partition obtained through fuzzy clustering.
For comparison, model-based importance metrics derived from the XGBoost ensemble were also examined. Specifically, the gain-based importance of each feature was extracted from the trained model and compared with SHAP-based attribution scores. This comparison allows evaluation of the consistency between model-internal importance measures and game-theoretic feature attribution [22].
3.8.2. Cluster-Level Interpretability
In addition to global importance analysis, SHAP values were computed separately for each predicted cluster class. This class-specific analysis provides insight into which variables most strongly influence the assignment of craters to each morphological regime.
For each cluster , the distribution of SHAP values across the feature space was examined through summary plots, allowing visualization of both the magnitude and direction of feature contributions. This analysis reveals how variations in crater diameter, ellipse geometry, or rim detection indicators influence the probability of belonging to a particular cluster.
Together, these interpretability analyses provide a transparent explanation of the morphological structures identified through fuzzy clustering and analyzed through supervised reconstruction.
4. Results
This section presents the empirical results obtained by applying the methodological framework described in Section 3. The analysis follows the main stages of the proposed pipeline, allowing a systematic examination of the crater datasets and the morphological structures identified through fuzzy clustering.
For each stage, quantitative metrics and corresponding visualizations are reported to characterize the statistical properties of the datasets, evaluate measurement uncertainty, analyze clustering behavior, assess predictive separability through supervised assessment, and interpret the contribution of morphological variables using explainable artificial intelligence techniques.
Taken together, these results provide an assessment of the internal consistency of the fuzzy partitions and identify the crater properties that most strongly influence the morphological structures observed in the lunar and Martian crater populations.
4.1. Exploratory Data Analysis Results
4.1.1. Lunar Crater Morphological Structure
The exploratory analysis of the lunar crater catalog provides an initial characterization of crater size distributions, geometric properties, and measurement uncertainty prior to the clustering stage.
Figure 5 presents the distribution of lunar crater diameters. The dataset is strongly dominated by small craters, while the frequency of larger structures decreases rapidly with increasing diameter. The logarithmic scale highlights the long-tailed nature of the distribution, with a small number of craters extending to several hundred kilometers in diameter.
Figure 5.
Distribution of lunar crater diameters.
The relationship between crater diameter and relative measurement uncertainty is shown in Figure 6 (logarithmic scale). A clear scale-dependent pattern emerges: smaller craters exhibit higher relative diameter uncertainty, whereas larger craters display progressively lower measurement variability.
Figure 6.
Lunar relative error vs. crater diameter.
Crater geometry is further examined through the distribution of eccentricity and its relationship with crater diameter (Figure 7 and Figure 8). Most craters show intermediate eccentricity values, indicating slight deviations from perfect circularity when fitted with elliptical models. The scatter plot suggests greater variability among smaller craters, while larger structures exhibit more stable geometric characteristics.
Figure 7.
Distribution of lunar crater eccentricity.
Figure 8.
Lunar crater eccentricity vs. diameter.
Detection quality indicators and positional uncertainties are summarized in Figure 9. The rim detection fraction is concentrated near high values, indicating that most craters have sufficiently complete rims for geometric analysis. Latitude and longitude uncertainty distributions remain strongly concentrated with sparse long tails, suggesting generally low positional error across the catalog.
Figure 9.
Lunar detection quality indicators and positional measurement uncertainties.
Finally, relationships among the main morphological variables are summarized in the correlation matrix shown in Figure 10. Circular diameter and the major and minor axes of the elliptical fit show extremely strong correlations (≈0.99–1.00), reflecting the geometric consistency of crater size representations. The number of rim points (PTS_RIM_IMG) is also strongly associated with crater size (≈0.79–0.90), indicating that larger craters tend to be represented by a denser rim contour.
Figure 10.
Correlation matrix of the morphological variables of lunar craters.
Shape descriptors such as eccentricity and ellipticity exhibit weak correlations with crater size but are strongly correlated with each other (≈0.89), indicating that they capture related aspects of crater deformation. Positional uncertainty variables show moderate internal correlations (≈0.72–0.75). In addition, the detected rim fraction (ARC_IMG) displays a moderate negative correlation with positional errors (≈−0.31 to −0.34), suggesting that craters with more complete rim detection tend to present lower localization uncertainty.
4.1.2. Martian Crater Morphological Structure
The exploratory analysis of the Martian crater catalog reveals structural patterns broadly consistent with those observed in the lunar dataset. Figure 11 shows the distribution of crater diameters, which is strongly dominated by small craters, while the frequency of large impact structures decreases rapidly with increasing diameter. The logarithmic scaling highlights the long-tailed nature of the distribution, with only a limited number of craters exceeding several hundred kilometers in diameter.
Figure 11.
Distribution of Martian crater diameters.
Figure 12 illustrates the relationship between crater diameter and relative measurement uncertainty. As in the lunar dataset, a clear scale-dependent pattern is observed: smaller craters exhibit larger relative diameter errors, whereas measurement variability decreases progressively for larger structures.
Figure 12.
Mars relative error vs. crater diameter.
Crater geometry is further characterized through the distribution of eccentricity and its relationship with crater diameter (Figure 13 and Figure 14). The eccentricity distribution is centered around intermediate values, indicating that most Martian craters deviate moderately from perfect circularity. The scatter plot suggests that geometric variability is larger for small craters, whereas larger craters tend to exhibit more stable morphological structures.
Figure 13.
Distribution of Martian crater eccentricity.
Figure 14.
Mars crater eccentricity vs. diameter.
Detection quality and positional uncertainties are summarized in Figure 15. The fraction of detected crater rim is strongly concentrated near values close to one, indicating that most craters present sufficiently complete rims for geometric characterization. Latitude and longitude uncertainty distributions remain highly concentrated with long but sparse tails, suggesting generally low localization error across the catalog.
Figure 15.
Mars detection quality indicators and positional measurement uncertainties.
Finally, relationships between the main morphological variables are summarized through the correlation matrix shown in Figure 16. As expected, crater size variables, including circular diameter and the major and minor axes of the elliptical fit, show extremely strong correlations (≈0.99–1.00), reflecting the internal geometric consistency of the measurements. The number of rim points (PTS_RIM_IMG) is also strongly correlated with crater size (≈0.84–0.94), indicating that larger craters tend to be represented by a greater number of contour points.
Figure 16.
Correlation matrix of the morphological variables of mars craters.
Shape descriptors such as eccentricity and ellipticity present weak correlations with crater diameter but remain strongly correlated with each other (≈0.85), indicating that they capture related aspects of crater deformation. Positional uncertainty variables show moderate correlations with crater size (≈0.52–0.58) and strong correlations among relative error measures (≈0.95). In addition, the detected rim fraction (ARC_IMG) exhibits a weak negative correlation with crater size and positional uncertainties, suggesting that craters with more complete rim detection tend to present lower measurement variability.
4.1.3. Comparative Analysis of Lunar and Martian Crater Morphology
A comparison of the lunar and Martian crater datasets reveals a remarkably consistent statistical structure across both planetary surfaces. In both cases, crater diameter distributions are strongly right-skewed and dominated by small craters, with a long-tailed distribution extending toward large impact structures.
The relationship between crater diameter and relative measurement uncertainty also follows a similar scale-dependent pattern in both datasets: smaller craters exhibit larger relative errors, whereas measurement variability decreases for larger structures. Likewise, eccentricity distributions peak around intermediate values (≈0.35–0.45), indicating that most craters deviate moderately from perfect circularity when represented by elliptical models.
Correlation matrices further confirm the structural similarity between the two datasets. Size-related variables, including circular diameter and the major and minor axes of the elliptical fit, show extremely strong correlations (≈0.99–1.00). In contrast, shape descriptors such as eccentricity and ellipticity remain weakly correlated with crater size but strongly correlated with each other (≈0.85–0.89), indicating that they capture related aspects of crater deformation.
Some differences can nevertheless be observed. In the Martian dataset, positional uncertainty variables exhibit slightly stronger correlations with crater diameter (≈0.53–0.58) compared to the lunar catalog (≈0.41–0.49). In addition, relative latitude and longitude errors are more strongly correlated in the Martian data (≈0.95 versus ≈0.75 in the lunar dataset). These differences may reflect variations in imaging conditions, surface processes, or crater preservation states between the two planetary environments.
Overall, however, the similarity of the statistical structure across both datasets suggests that the selected morphological descriptors capture general geometric properties of impact craters, supporting their use in comparative clustering analysis.
To complement the statistical analysis, interactive spatial visualizations of the lunar and Martian crater catalogs were developed to explore the geographic distribution of crater morphology across both planetary surfaces. These interactive maps are available in the Supplementary Material.
4.1.4. Scaling Relationship Between Crater Diameter and Localization Error
To investigate the relationship between crater size and positional uncertainty in greater depth, a combined metric for localization error was computed using the uncertainty quantities defined in Equations (1)–(3), and analyzed through the modeling framework introduced in Equations (5)–(8) of Section 3.3 and Section 3.5. This metric integrates latitude and longitude positional uncertainties into a single scalar quantity, allowing a direct comparison between crater diameter and overall localization error.
A log–log linear regression was then fitted between crater diameter and the localization error . The resulting empirical scaling relations are:
Moon:
Mars:
These results indicate that localization uncertainty increases with crater diameter in both planetary datasets, although the scaling behavior differs slightly between them (Figure 17 and Figure 18). The exponent obtained for the lunar catalog suggests a stronger dependence between crater size and positional uncertainty than in the Martian dataset.
Figure 17.
Lunar localization error vs. crater diameter.
Figure 18.
Mars localization error vs. crater diameter.
Figure 19 compares the distributions of localization error obtained for the Moon and Mars. The results show that both datasets exhibit localization uncertainties of a similar order of magnitude, although the lunar catalog presents a slightly broader distribution. This comparison highlights the overall consistency of positional uncertainty scales across the two planetary crater catalogs.
Figure 19.
Comparison of localization error distributions: Moon vs. Mars.
In the present study, this analysis is used to characterize scale-dependent measurement behavior and to contextualize the quality of the underlying crater catalogs through a common descriptive proxy. These error metrics support preprocessing and interpretation, but they are not directly propagated into the clustering variables, supervised reconstruction, or SHAP analysis.
4.2. Fuzzy C-Means Results
Following the exploratory analysis, fuzzy clustering was applied to identify groups of craters sharing similar morphological characteristics within each planetary dataset. This approach enables the detection of underlying structural patterns in crater geometry while accounting for gradual transitions between crater types through soft cluster memberships.
The clustering procedure was performed independently for the lunar and Martian catalogs using the morphological descriptors defined in Section 3. The resulting clusters summarize the main geometric properties of craters and provide an interpretable representation of crater morphology on each planetary surface.
Section 4.2.1 and Section 4.2.2 describe the clusters obtained for the Moon and Mars, respectively, while Section 4.2.3 presents a comparative analysis of the clustering structures observed in both datasets.
4.2.1. Lunar Crater Clusters
Fuzzy C-Means clustering was applied to the lunar crater dataset using the morphological descriptors defined in Section 3. Prior to clustering, the variables were standardized to ensure comparable scaling across geometric features. The number of clusters was examined using the Fuzzy Partition Coefficient (FPC) for different cluster configurations, Table 2. Although the maximum FPC value is obtained for a two-cluster solution, this configuration provides a relatively coarse partition of the lunar crater population. In this study, a four-cluster configuration was retained as a working analytical resolution, allowing additional differences in crater shape and rim preservation to be represented without introducing excessive fragmentation of the data. The centroid values for the resulting clusters are summarized in Table 3.
Table 2.
Lunar fuzzy cluster indices.
Table 3.
Lunar crater cluster centroids.
The centroid analysis reveals four main morphological crater groups. Cluster 0 corresponds to the smallest craters in the dataset, characterized by relatively low eccentricity and a nearly complete rim detection fraction (ARC_IMG ≈ 0.99). These craters are generally well-preserved and display nearly circular geometries. Cluster 1 represents craters of intermediate size with moderate eccentricity and slightly reduced rim detection, suggesting structures that may have undergone mild geometric deformation or partial degradation. Cluster 2 groups craters with the highest eccentricity and ellipticity values, indicating elongated crater morphologies. Such geometries may be associated with oblique impacts, post-impact deformation, or interactions with surrounding topography. In contrast, Cluster 3 contains craters of similar size to clusters 1 and 2 but with lower eccentricity and the highest number of rim points, indicating more regular and geometrically stable crater shapes.
To examine the sensitivity of the selected four-cluster lunar solution to initialization, the Fuzzy C-Means procedure was repeated using ten different random seeds. Nine of the ten runs converged to essentially the same partition structure, with nearly identical FPC values (≈0.5118), final objective values (Jm ≈ 2.082 × 10⁶), and cluster-size distributions up to cluster-label permutation. One run yielded an alternative partition with lower agreement relative to the dominant solution (pairwise ARI ≈ 0.41). These results indicate that the lunar four-cluster configuration is largely reproducible, while still showing some sensitivity to initialization.
Figure 20 shows the distribution of clusters in the diameter–eccentricity space. The selected partition reveals a triangular morphological envelope in which small craters exhibit a wide range of eccentricities, whereas larger craters tend to display progressively lower eccentricity values. This pattern suggests that crater shape variability decreases with increasing crater size. Within this four-cluster analytical resolution, the partition also distinguishes between elongated, moderately deformed, and more regular crater forms that would be merged under a coarser two-cluster solution.
Figure 20.
Fuzzy clustering of lunar craters.
Supplementary interactive maps were generated to enable crater-level inspection of the identified lunar clusters. For visualization purposes, a balanced subsample of 2000 craters per cluster was selected to improve readability and reduce overplotting.
The distribution of craters across clusters is also uneven. Cluster 0 contains the largest number of craters (469,053), followed by cluster 1 (316,089) and cluster 2 (313,949), while cluster 3 contains the smallest number of craters (193,925). This distribution suggests that moderately circular craters dominate the lunar crater population, while strongly elongated crater morphologies appear less frequently. The same cluster-size structure was recovered in 9 of the 10 repeated runs, up to cluster-label permutation.
4.2.2. Mars Crater Clusters
Fuzzy C-Means clustering was applied to the Martian crater dataset using the same morphological descriptors as in the lunar analysis. The number of clusters was first examined using the Fuzzy Partition Coefficient (FPC), as summarized in Table 4.
Table 4.
Martian fuzzy cluster indices.
Although the maximum FPC value is obtained for a two-cluster solution, the decrease across the tested range is gradual, indicating that several cluster solutions remain analytically plausible. In this study, a four-cluster configuration was retained to preserve a comparable level of analytical resolution with the lunar dataset and to facilitate direct cross-planetary interpretation. The centroid values for the resulting clusters are summarized in Table 5.
Table 5.
Mars crater cluster centroids.
The Martian clusters reveal a morphological structure largely organized by crater size. Cluster 3 contains approximately 89% of the craters and corresponds to the smallest structures in the dataset, with an average diameter of approximately 1.76 km. These craters exhibit the highest eccentricity values and a nearly complete rim detection fraction, suggesting relatively irregular shapes typical of small impact structures influenced by local surface conditions.
Cluster 1 groups craters of intermediate size (approximately 10.5 km in diameter) with moderate eccentricity and well-preserved rims. Cluster 0 represents larger craters with diameters around 31.7 km and slightly lower eccentricity values, while Cluster 2 contains the largest structures in the dataset (≈73 km). The largest craters show the lowest eccentricity values, indicating geometries closer to circular symmetry.
To examine the sensitivity of the selected four-cluster Martian solution to initialization, the Fuzzy C-Means procedure was repeated over the full Martian dataset using five different random seeds. The resulting partitions were highly consistent across runs. In all cases, the Fuzzy Partition Coefficient remained constant at 0.931383, the final objective value showed negligible variation (Jm ≈ 7.66 × 10⁷), and the silhouette score remained very stable (mean = 0.8114, SD = 0.0024). The dominant hard assignments derived from the fuzzy memberships were identical across runs up to cluster-label permutation, yielding a mean pairwise Adjusted Rand Index of 1.0. The same four cluster-size groups were reproduced in all cases (344,155; 30,897; 8136; and 1593 craters), supporting the use of the Martian four-cluster solution as a stable working resolution under repeated initializations.
To assess the sensitivity of the Martian partition to PTS_RIM_IMG, the four-cluster solution was recomputed after removing this variable from the feature set. The resulting partition remained broadly similar to the original one. In particular, the Adjusted Rand Index between the original and reduced partitions was 0.8581, the overall cluster-size structure remained comparable, and the Fuzzy Partition Coefficient increased from 0.9314 to 0.9454. The centroid structure also preserved the same general size hierarchy, with clusters still corresponding to small, intermediate, large, and very large craters. These results indicate that the Martian partition does not depend exclusively on PTS_RIM_IMG, although this variable does affect the exact organization of the clusters and should therefore be interpreted with caution.
Overall, the clustering structure suggests that the Martian partition remains largely associated with crater scale, although the exact organization of the clusters is partially influenced by descriptor selection. As crater diameter increases, eccentricity tends to decrease and crater geometry becomes progressively more circular. An interactive visualization of the Martian crater clusters is provided as Supplementary Material, allowing spatial exploration of the identified crater groups across the Martian surface.
Supplementary interactive maps were also generated to support crater-level inspection of the identified Martian clusters. To improve readability and reduce overplotting, these visualizations were constructed from a balanced subsample of 1500 craters per cluster.
4.2.3. Comparative Cluster Analysis
A comparison of the clustering structures obtained for the lunar and Martian datasets reveals notable differences in the morphological organization of crater populations. In the lunar dataset, craters are more evenly distributed among clusters, indicating a broader representation of multiple morphological patterns. In contrast, the Martian dataset is strongly dominated by a single cluster corresponding to small craters, which accounts for approximately 89% of the observations, while the remaining clusters represent progressively larger and less frequent crater populations.
The variables structuring the partition also differ between the two planetary datasets. In the lunar case, clusters are primarily distinguished by geometric characteristics such as eccentricity, ellipticity, and rim-preservation properties. This suggests that crater morphology on the Moon is strongly influenced by variations in shape and rim definition, with crater diameter playing a less dominant role in the selected partition.
By contrast, the Martian clustering structure appears to be more strongly organized by crater scale. The clusters identified on Mars correspond to distinct size regimes ranging from small craters to very large impact structures, with eccentricity values tending to decrease as crater diameter increases. This hierarchical organization suggests that crater size plays a more prominent role in structuring the Martian crater population under the adopted clustering resolution.
These differences may reflect the distinct geological and impact histories of the two planetary surfaces, although part of the observed contrast may also be influenced by catalog-specific measurement and sampling characteristics. Within this analytical framework, the Moon exhibits a more morphologically diverse population of craters, characterized by geometric variability, whereas the Martian dataset shows a clearer distinction between crater populations based on their scale.
4.3. Supervised Reconstruction of Cluster Labels Using XGBoost
To assess the recoverability of the dominant labels derived from Fuzzy C-Means, a supervised classification model was trained to predict cluster membership using the same morphological variables employed in the clustering stage. In this context, the supervised model is intended to assess whether the fuzzy partition can be consistently reconstructed from the original descriptor space.
For this purpose, an XGBoost classifier was trained using crater diameter, elliptical geometry descriptors, and rim detection indicators as predictive features. Model performance was evaluated using a standard train–test split and quantified through accuracy, precision, recall, and F1-score. Confusion matrices were also analyzed to examine the separability of the partition in the selected feature space.
The following sections report the results obtained for the lunar and Martian datasets.
4.3.1. Lunar Cluster-Label Recoverability
The supervised model achieved very high predictive performance when applied to the lunar crater labels derived from fuzzy clustering. Overall classification accuracy reached 99.72%, with precision, recall, and F1-scores exceeding 99.6% for all clusters.
The confusion matrix in Figure 21 shows that most observations are assigned to their corresponding dominant labels, with only a small number of misclassifications occurring between neighboring groups. Clusters with similar descriptor profiles occasionally exhibit minor overlaps, but these cases represent a very small fraction of the dataset.
Figure 21.
Confusion matrix—XGBoost lunar clusters.
These results indicate that the assigned lunar cluster labels are highly recoverable within the selected morphological feature space. The high classification accuracy suggests that crater diameter, geometric descriptors, and rim-detection properties contain sufficient information to reconstruct the dominant labels obtained from fuzzy clustering.
Accordingly, the supervised stage is interpreted here as an internal assessment of label recoverability and feature-space separability.
4.3.2. Martian Cluster-Label Recoverability
The same supervised assessment procedure was applied to the Martian crater dataset to assess the separability of the clusters obtained through Fuzzy C-Means. An XGBoost classifier was trained using the same set of geometric variables describing crater morphology, including diameter, elliptical geometry descriptors, and rim detection indicators.
The model achieved an overall classification accuracy of 99.8%, indicating that the assigned labels are highly recoverable within the selected feature space. Precision, recall, and F1-scores exceed 96% for all clusters, with the dominant cluster achieving near-perfect classification performance.
The confusion matrix shown in Figure 22 reveals a strong concentration of observations along the diagonal, confirming the close agreement between the predicted cluster assignments and those obtained through fuzzy clustering. Minor misclassifications occur primarily between clusters representing neighboring size regimes, which is consistent with gradual transitions between crater morphologies.
Figure 22.
Confusion matrix—XGBoost Martian clusters.
An important characteristic of the Martian dataset is the strong imbalance in cluster distribution, with one cluster representing most craters. This dominant group corresponds mainly to small and relatively circular craters, which constitute the most common morphological regime on the Martian surface. Despite this imbalance, the classifier maintains very high predictive performance across all clusters.
Overall, these results indicate that the Martian fuzzy partition is highly recoverable from the selected descriptor space. This should be interpreted as evidence of separability and reconstruction consistency within the adopted analytical framework, not as independent external validation of geological crater classes.
4.4. SHAP-Based Interpretation of Cluster Structure
To support the morphological interpretation of the clusters identified through fuzzy clustering, an explainable AI analysis was performed using SHAP (SHapley Additive exPlanations) applied to the XGBoost classifier. While the supervised model shows that the assigned labels are recoverable within the selected feature space, SHAP helps identify which variables contribute most strongly to that reconstruction.
4.4.1. Interpretation of Lunar Clusters
The SHAP summary and average importance plots for the lunar model (Figure 23) reveal a clear hierarchy of feature influence. The dominant variables are ARC_IMG, DIAM_ELLI_ECCEN_IMG, and DIAM_ELLI_ELLIP_IMG, indicating that rim preservation and geometric deformation play an important role in structuring the lunar partition. In contrast, variables directly related to crater size, such as circular diameter and elliptical axes, show comparatively smaller contributions.
Figure 23.
Global SHAP Importance—Lunar Craters.
Cluster-specific SHAP importance values (Figure 24) provide further detail on the descriptor structure of the lunar clusters. Cluster 0 is dominated by ARC_IMG, consistent with craters showing highly complete rim detection. Clusters 1 and 2 are more strongly associated with eccentricity and ellipticity, whereas Cluster 3 reflects a combined influence of ellipticity and rim-detection variables. Together, these patterns support the interpretation of the lunar partition in terms of rim preservation and geometric deformation.
Figure 24.
Cluster-specific SHAP importance values for the lunar crater model.
The comparison between cluster centroids and SHAP feature importance reveals strong correspondence between the geometric properties defining each cluster and the variables driving the supervised classification. Clusters characterized by high eccentricity and ellipticity values are primarily explained by the same geometric variables in the SHAP analysis, while clusters with nearly complete rim detection are dominated by ARC_IMG. This agreement indicates that the supervised model captures the same descriptor-based structure identified by fuzzy clustering, supporting the interpretability of the proposed FAS-XAI framework in the lunar dataset.
4.4.2. Interpretation of Martian Clusters
The SHAP summary and average importance plots for the Martian model (Figure 25) reveal a feature importance hierarchy markedly different from that observed in the lunar dataset. The dominant variable is PTS_RIM_IMG, followed by variables related to crater size, including DIAM_CIRC_IMG, DIAM_ELLI_MAJOR_IMG, and DIAM_ELLI_MINOR_IMG. In contrast, variables describing geometric deformation, such as DIAM_ELLI_ECCEN_IMG and DIAM_ELLI_ELLIP_IMG, show comparatively smaller contributions.
Figure 25.
Global SHAP importance—Martian craters.
This pattern suggests that cluster membership in the Martian dataset is more strongly associated with crater scale and rim-sampling descriptors than with subtle deviations from circular geometry. At the same time, the prominence of PTS_RIM_IMG must be interpreted with caution, since this variable is influenced not only by crater structure but also by the image-based detection and fitting procedure.
Cluster-level SHAP importance values (Figure 26) provide further insight into the morphological interpretation of the clusters. In all groups, PTS_RIM_IMG emerges as the dominant explanatory variable, reflecting the number of points detected along the crater rim during geometric fitting. Since larger craters naturally produce a greater number of rim points, this variable acts in part as an indirect indicator of crater scale, although it may also capture catalog-specific sampling characteristics.
Figure 26.
Cluster-specific SHAP importance values for the Martian crater model.
The comparison with the clustering centroids is consistent with this interpretation. Cluster 2, which contains the largest craters in the dataset (mean diameter ≈ 73 km), exhibits the highest number of rim points and is therefore strongly influenced by PTS_RIM_IMG and the elliptical diameter variables. Cluster 0, representing large craters of intermediate scale (≈31 km), shows a similar pattern, with rim-point density and crater diameter contributing strongly to the supervised reconstruction.
Cluster 1 corresponds to medium-sized craters (≈10 km) with moderate rim sampling density, while Cluster 3, representing nearly 90% of the dataset, groups the smallest craters (≈1.7 km). In this dominant cluster, PTS_RIM_IMG and DIAM_CIRC_IMG make the largest contributions to the classification stage, indicating that the Martian partition is mainly structured by scale-related and rim-sampling descriptors within the selected analytical framework.
The SHAP analysis suggests that the Martian partition is primarily structured by crater size and rim-sampling descriptors, while geometric deformation appears to play a secondary role. Given the correlation structure among several geometric and scale-related variables, these SHAP rankings should be interpreted as contributions within the selected descriptor space rather than as independent causal drivers. The correspondence between cluster centroids and SHAP contributions suggests that the supervised model is capturing the same descriptor structure identified by fuzzy clustering.
5. Discussion and Future Works
5.1. Discussion
The comparative analysis of lunar and Martian crater populations reveals clear differences in the descriptor patterns that organize the two partitions. Although both datasets were analyzed using the same methodological pipeline, combining fuzzy clustering, supervised reconstruction with XGBoost, and explainable artificial intelligence techniques based on SHAP values, the results suggest that the dominant variables organizing the lunar and Martian partitions differ substantially.
In the lunar dataset, the identified clusters are primarily associated with variables related to crater geometry and rim preservation, particularly eccentricity, ellipticity, and the fraction of the rim arc detected (ARC_IMG). These variables capture deviations from circularity as well as the degree of structural integrity of the crater rim. Their prominence suggests that the lunar partition is strongly differentiated by geometric deformation and rim-preservation properties.
This pattern is broadly consistent with the geological context of the Moon. The absence of an atmosphere and the relatively low level of geological activity favor the long-term preservation of impact structures. As a result, the original morphology of many craters remains comparatively intact, allowing geometric properties and rim-preservation descriptors to play a central role in the differentiation of crater forms.
In contrast, the Martian crater population exhibits a different hierarchy of explanatory variables. The SHAP analysis indicates that the most influential features in the classification process are the number of detected rim points (PTS_RIM_IMG) and crater diameter (DIAM_CIRC_IMG), followed by the major and minor axes of the fitted ellipse. Variables describing geometric deformation, such as eccentricity and ellipticity, contribute less significantly to classification.
This pattern suggests that the Martian partition is more strongly associated with crater scale and rim-sampling descriptors than the lunar partition. At the same time, the prominence of PTS_RIM_IMG must be interpreted with caution, since this variable is influenced not only by crater structure but also by the image-based detection and fitting procedure. Its importance may therefore reflect, at least in part, catalog-specific sampling and measurement characteristics in addition to morphological differences. Even so, the combined influence of crater diameter, rim-point density, and ellipse geometry indicates that crater scale plays a major role in organizing the Martian partition obtained in this study.
An additional pattern observed in the lunar dataset is the relationship between crater diameter and eccentricity. Smaller craters display a wide range of eccentricities, whereas larger craters tend to be significantly more circular. This triangular structure in the diameter–eccentricity space suggests the presence of a scaling relationship associated with crater deformation. Such behavior may be consistent with impact-formation models in which larger structures tend to approach more symmetric crater geometries, although this interpretation remains tentative within the scope of the present descriptor-based analysis. The error-modeling stage also showed that the adopted positional-error proxy scales with crater diameter in both datasets, providing additional context on measurement behavior in the lunar and Martian catalogs.
The supervised models used in this study should be interpreted as tools for assessing the internal consistency of the fuzzy partition rather than as an independent external validation of geological crater categories. In both planetary datasets, the XGBoost classifiers were able to reconstruct cluster membership with very high accuracy, indicating that the partitions obtained through fuzzy clustering are highly recoverable within the selected descriptor space. This result indicates that the assigned labels are highly recoverable within the selected feature space.
The SHAP analysis adds an additional layer of interpretability by identifying which variables contribute most strongly to the supervised reconstruction of the partition. Given the correlation structure among several descriptors, these rankings should be interpreted as contributions within the selected feature space rather than as independent causal drivers. Accordingly, the contrast observed between the lunar and Martian datasets should therefore be understood as a comparative pattern within the selected descriptor space, rather than as a definitive statement about intrinsic geological controls alone.
These results highlight the value of integrating fuzzy clustering with explainable artificial intelligence techniques for the analysis of large planetary datasets. The combination of unsupervised structure discovery, supervised recoverability assessment, and explainable interpretation enables the identification of latent morphological organization while also clarifying which descriptors contribute most strongly to that organization.
More broadly, the proposed FAS-XAI framework shows how interpretable machine learning can support planetary geomorphology by revealing structure in large observational datasets and linking those patterns to measurable crater descriptors in a transparent way.
5.2. Future Work
Several directions may extend and strengthen the results presented in this study.
A first natural extension involves expanding the crater datasets analyzed in this work. Although the current study includes large lunar and Martian crater catalogs, incorporating additional datasets from other planetary bodies would allow testing the generality of the proposed framework across different geological environments. Applying the methodology to crater populations on Mercury, Ceres, or icy moons could reveal whether similar descriptor-based patterns emerge under different gravity conditions, surface compositions, and geological histories.
A second line of future work concerns the integration of additional morphological and topographic variables. The present analysis relies primarily on geometric properties derived from crater outlines. However, crater morphology is also influenced by structural characteristics such as crater depth, rim height, wall slopes, and ejecta distribution. Incorporating digital elevation models (DEMs) or altimetric datasets could provide richer morphological descriptors and potentially reveal new clustering structures associated with crater degradation stages or complex crater formation processes. Future work should also examine more explicitly the role of catalog-specific sampling and detection variables to distinguish more clearly between intrinsic morphological descriptors and measurement-related effects.
Another promising direction involves extending the analysis to temporal and geological context variables. Crater morphology evolves through degradation processes such as erosion, sediment deposition, or tectonic activity. Integrating geological maps, stratigraphic information, or surface age estimates could help explore how crater morphologies evolve over time and how clustering patterns relate to planetary surface evolution.
From a methodological perspective, an important extension of the proposed framework is the incorporation of deep learning approaches for crater analysis. While the current study focuses on geometric descriptors derived from crater outlines, transformer-based models applied to crater contour-point sequences could capture relational geometric patterns that are not fully represented by aggregated descriptors. In parallel, vision transformers applied to crater imagery may provide complementary visual information, enabling the extraction of latent morphological features directly from images.
These approaches naturally lead to multimodal frameworks that combine geometric, image-based, and topographic inputs. Such integration could improve the characterization of crater morphology and provide more stable clustering structures under uncertainty. Future work should also include a more systematic assessment of computational efficiency and scalability, particularly for large crater catalogs and multimodal extensions of the proposed framework.
Another potential research direction involves exploring multi-scale crater analysis. The results obtained for Mars suggest that crater morphology may be strongly structured by crater size patterns. Future work could investigate whether distinct clustering structures emerge when analyzing crater populations at different spatial scales or when separating simple and complex craters.
Finally, the framework presented in this study could be extended to other planetary geomorphological structures beyond impact craters. Features such as volcanic calderas, tectonic structures, or collapse features may also exhibit latent morphological patterns that could be explored using the same combination of fuzzy clustering, supervised consistency analysis, and explainable AI techniques.
6. Conclusions
This study presented a comparative analysis of lunar and Martian impact craters using an interpretable machine learning framework that combines fuzzy clustering, supervised consistency analysis through XGBoost, and explainable artificial intelligence techniques based on SHAP values.
The results suggest that the lunar and Martian partitions are organized by different descriptor hierarchies within the selected analytical framework. In the lunar dataset, the identified groups are more strongly associated with geometric deformation and rim-preservation variables, particularly eccentricity, ellipticity, and the fraction of detected rim arc. This pattern is consistent with the comparatively preserved morphology of lunar impact structures.
In contrast, the Martian partition is more strongly associated with crater scale and rim-sampling descriptors, with the number of detected rim points and crater diameter emerging among the most influential variables. These results should be interpreted with caution, since some of these descriptors may also reflect catalog-specific sampling and measurement characteristics in addition to crater morphology.
The high predictive performance obtained by the supervised models indicates that the fuzzy partitions are highly recoverable within the selected morphological feature space. Moreover, the agreement between clustering centroids, supervised reconstruction, and SHAP explanations suggests that the identified groups are associated with consistent descriptor patterns within the selected feature space.
The results highlight the value of combining fuzzy clustering with explainable artificial intelligence techniques for the analysis of large planetary datasets. The proposed FAS-XAI framework enables the identification of descriptor structure while providing interpretable descriptor contributions of the descriptors contributing to the resulting partitions.
Overall, this study shows how interpretable machine learning can support planetary geomorphology by identifying and comparing descriptor-based patterns in large crater catalogs across different planetary surfaces.
Supplementary Materials
The following supporting information can be downloaded at: https://www.mdpi.com/article/10.3390/math14091445/s1, The repository includes the datasets used in this study, namely lunar_crater_database_robbins_2018.csv and Catalog_Mars_Release_2020_1kmPlus_FullMorphData.csv, derived from publicly available crater databases. In addition, the repository provides interactive visualizations of lunar and Martian crater distributions, including clustering results, enabling exploratory analysis of spatial patterns and morphological groupings derived from the proposed framework.
Author Contributions
Conceptualization, G.M.D.; methodology, G.M.D.; software, G.M.D.; validation, G.M.D., E.M.A.N. and A.M.R.-R.; formal analysis, G.M.D.; investigation, G.M.D.; resources, G.M.D.; data curation, G.M.D.; writing—original draft preparation, G.M.D.; writing—review and editing, G.M.D.; visualization, G.M.D.; supervision, G.M.D., E.M.A.N. and A.M.R.-R.; project administration, G.M.D. All authors have read and agreed to the published version of the manuscript.
Funding
This research received no external funding.
Data Availability Statement
Publicly available datasets were used in this study. Moon Crater data are accessible at https://astrogeology.usgs.gov/search/map/moon_crater_database_v1_robbins (accessed on 10 March 2026) and Mars Craters are accessible at https://craters.sjrdesign.net/ (accessed on 10 March 2026).
Conflicts of Interest
The authors declare no conflicts of interest.
References
- Robbins, S.J. A New Global Database of Lunar Impact Craters >1–2 km: 1. Crater Locations and Sizes, Comparisons with Published Databases, and Global Analysis. J. Geophys. Res. Planets 2019, 124, 871–892. [Google Scholar] [CrossRef] [Scilit]
- Robbins, S.J.; Hynek, B.M. A new global database of Mars impact craters ≥1 km: 1. Database creation, properties, and parameters. J. Geophys. Res. 2012, 117, E05004. [Google Scholar] [CrossRef] [Scilit]
- Ghosh, A.; Mishra, N.S.; Ghosh, S. Fuzzy clustering algorithms for unsupervised change detection in remote sensing images. Inf. Sci. 2011, 181, 699–715. [Google Scholar] [CrossRef] [Scilit]
- Molnar, C. Interpretable Machine Learning. In A Guide for Making Black Box Models Explainable. 2019. Available online: https://christophm.github.io/interpretable-ml-book (accessed on 15 March 2026).
- Díaz, G.M. FAS-XAI: Fuzzy and Explainable AI for Interpretable Vetting of Kepler Exoplanet Candidates. Mathematics 2025, 13, 3796. [Google Scholar] [CrossRef] [Scilit]
- De Carolis, G.; Giannico, V.; Costanza, L.; Ardito, F.; Stellacci, A.M.; Thameur, A.; Ruggieri, S.; Tangaro, S.; Mastrorilli, M.; Sanitate, N.; et al. Prediction of Winter Wheat Parameters with Planet SuperDove Imagery and Explainable Artificial Intelligence. Agronomy 2025, 15, 241. [Google Scholar] [CrossRef] [Scilit]
- Costanza, L.; Salcedo, F.P.; Martinez, C.M.M.; Lorente, B.; Maldera, F.; Lopriore, G.; Garofalo, S.P. Use of explainable artificial intelligence with high-resolution satellite imagery to assess water status and vine shoot growth in grapevine (Vitis vinifera L.). Model. Earth Syst. Environ. 2026, 12, 25. [Google Scholar] [CrossRef] [Scilit]
- Agarwal, A.K.; Aljohani, A.A.; Tiwary, G.; Bhardwaj, R.; Kawatra, R.; Das, A. Developing Explainable Artificial Intelligence Models for Space Science Applications. Space Sci. Technol. 2025, 5, 0255. [Google Scholar] [CrossRef] [Scilit]
- Lomashvili, A.; Rammelkamp, K.; Gasnault, O.; Bhattacharjee, P.; Clavé, E.; Egerland, C.H.; Schröder, S.; Demir, B.; Lanza, N.L. Optimized Martian Dust Displacement Detection Using Explainable Machine Learning. In 2024 IEEE/CVF Conference on Computer Vision and Pattern Recognition Workshops; IEEE: Piscataway, NJ, USA, 2024; pp. 6779–6788. [Google Scholar] [CrossRef] [Scilit]
- Kallel, S.; Amayri, M.; Bouguila, N. Clustering and Interpretability of Residential Electricity Demand Profiles. Sensors 2025, 25, 2026. [Google Scholar] [CrossRef] [Scilit]
- Vetrithangam, D.; Arunadevi, B.; Pegada, N.K.; Mehta, A.; Kumar, P.; Neha; Parihar, P.; Selvakumar, S. Towards Explainable Detection of Alzheimer’s Disease: A Fusion of Deep Convolutional Neural Network and Enhanced Weighted Fuzzy C-Mean. Curr. Med. Imaging 2024, 20, e15734056317205. [Google Scholar] [CrossRef] [Scilit] [PubMed]
- Ellis, C.A.; Miller, R.L.; Calhoun, V.D. Explainable fuzzy clustering framework reveals divergent default mode network connectivity dynamics in schizophrenia. Front. Psychiatry 2024, 15, 1165424. [Google Scholar] [CrossRef] [Scilit]
- Shobayo, O.; Saatchi, R.; Ramlakhan, S. Adaptive Neuro-Fuzzy Inference System Framework for Paediatric Wrist Injury Classification. Multimodal Technol. Interact. 2025, 9, 104. [Google Scholar] [CrossRef] [Scilit]
- Samadi, M.E.; Nikulina, K.; Fritsch, S.; Schuppert, A. GPT-4o and the quest for machine learning interpretability in ICU risk of death prediction. BMC Med. Inform. Decis. Mak. 2025, 25, 373. [Google Scholar] [CrossRef] [Scilit]
- Díaz, G.M. A Unified Fuzzy–Explainable AI Framework (FAS-XAI) for Customer Service Value Prediction and Strategic Decision-Making. AI 2025, 7, 3. [Google Scholar] [CrossRef] [Scilit]
- Díaz, G.M.; Medina, R.G.; Jiménez, J.A.A. A Methodological Framework for Business Decisions with Explainable AI and the Analytic Hierarchical Process. Processes 2025, 13, 102. [Google Scholar] [CrossRef] [Scilit]
- Bezdek, J.C.; Ehrlich, R.; Full, W. FCM: The fuzzy c-means clustering algorithm. Comput. Geosci. 1984, 10, 191–203. [Google Scholar] [CrossRef] [Scilit]
- Bezdek, J.C. Pattern Recognition with Fuzzy Objective Function Algorithms; Springer: New York, NY, USA, 1981. [Google Scholar]
- Verma, R.K.; Tiwari, R.; Thakur, P.S. Partition Coefficient and Partition Entropy in Fuzzy C Means Clustering. J. Sci. Res. Rep. 2023, 29, 1–6. [Google Scholar] [CrossRef] [Scilit]
- Chen, T.; Guestrin, C. XGBoost: A scalable tree boosting system. In Proceedings of the 22nd ACM SIGKDD International Conference on Knowledge Discovery and Data Mining; ACM: New York, NY, USA, 2016; pp. 785–794. [Google Scholar] [CrossRef] [Scilit]
- Lundberg, S.M.; Lee, S.I. A unified approach to interpreting model predictions. Adv. Neural Inf. Process. Syst. 2017, 30, 4766–4775. [Google Scholar]
- Lundberg, S.M.; Erion, G.G.; Lee, S.-I. Consistent Individualized Feature Attribution for Tree Ensembles. arXiv 2018, arXiv:1802.03888. [Google Scholar]
- Sirapangi, M.D.; Gopikrishnan, S. MAIPFE: An Efficient Multimodal Approach Integrating Pre-Emptive Analysis, Personalized Feature Selection, and Explainable AI. Comput. Mater. Contin. 2024, 79, 2229–2251. [Google Scholar] [CrossRef] [Scilit]
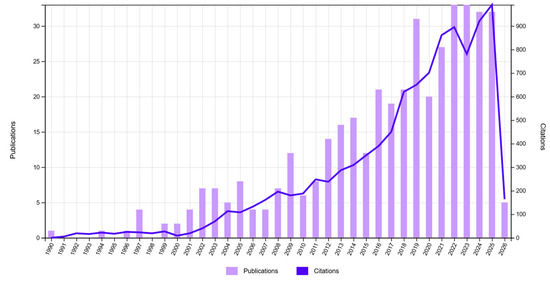
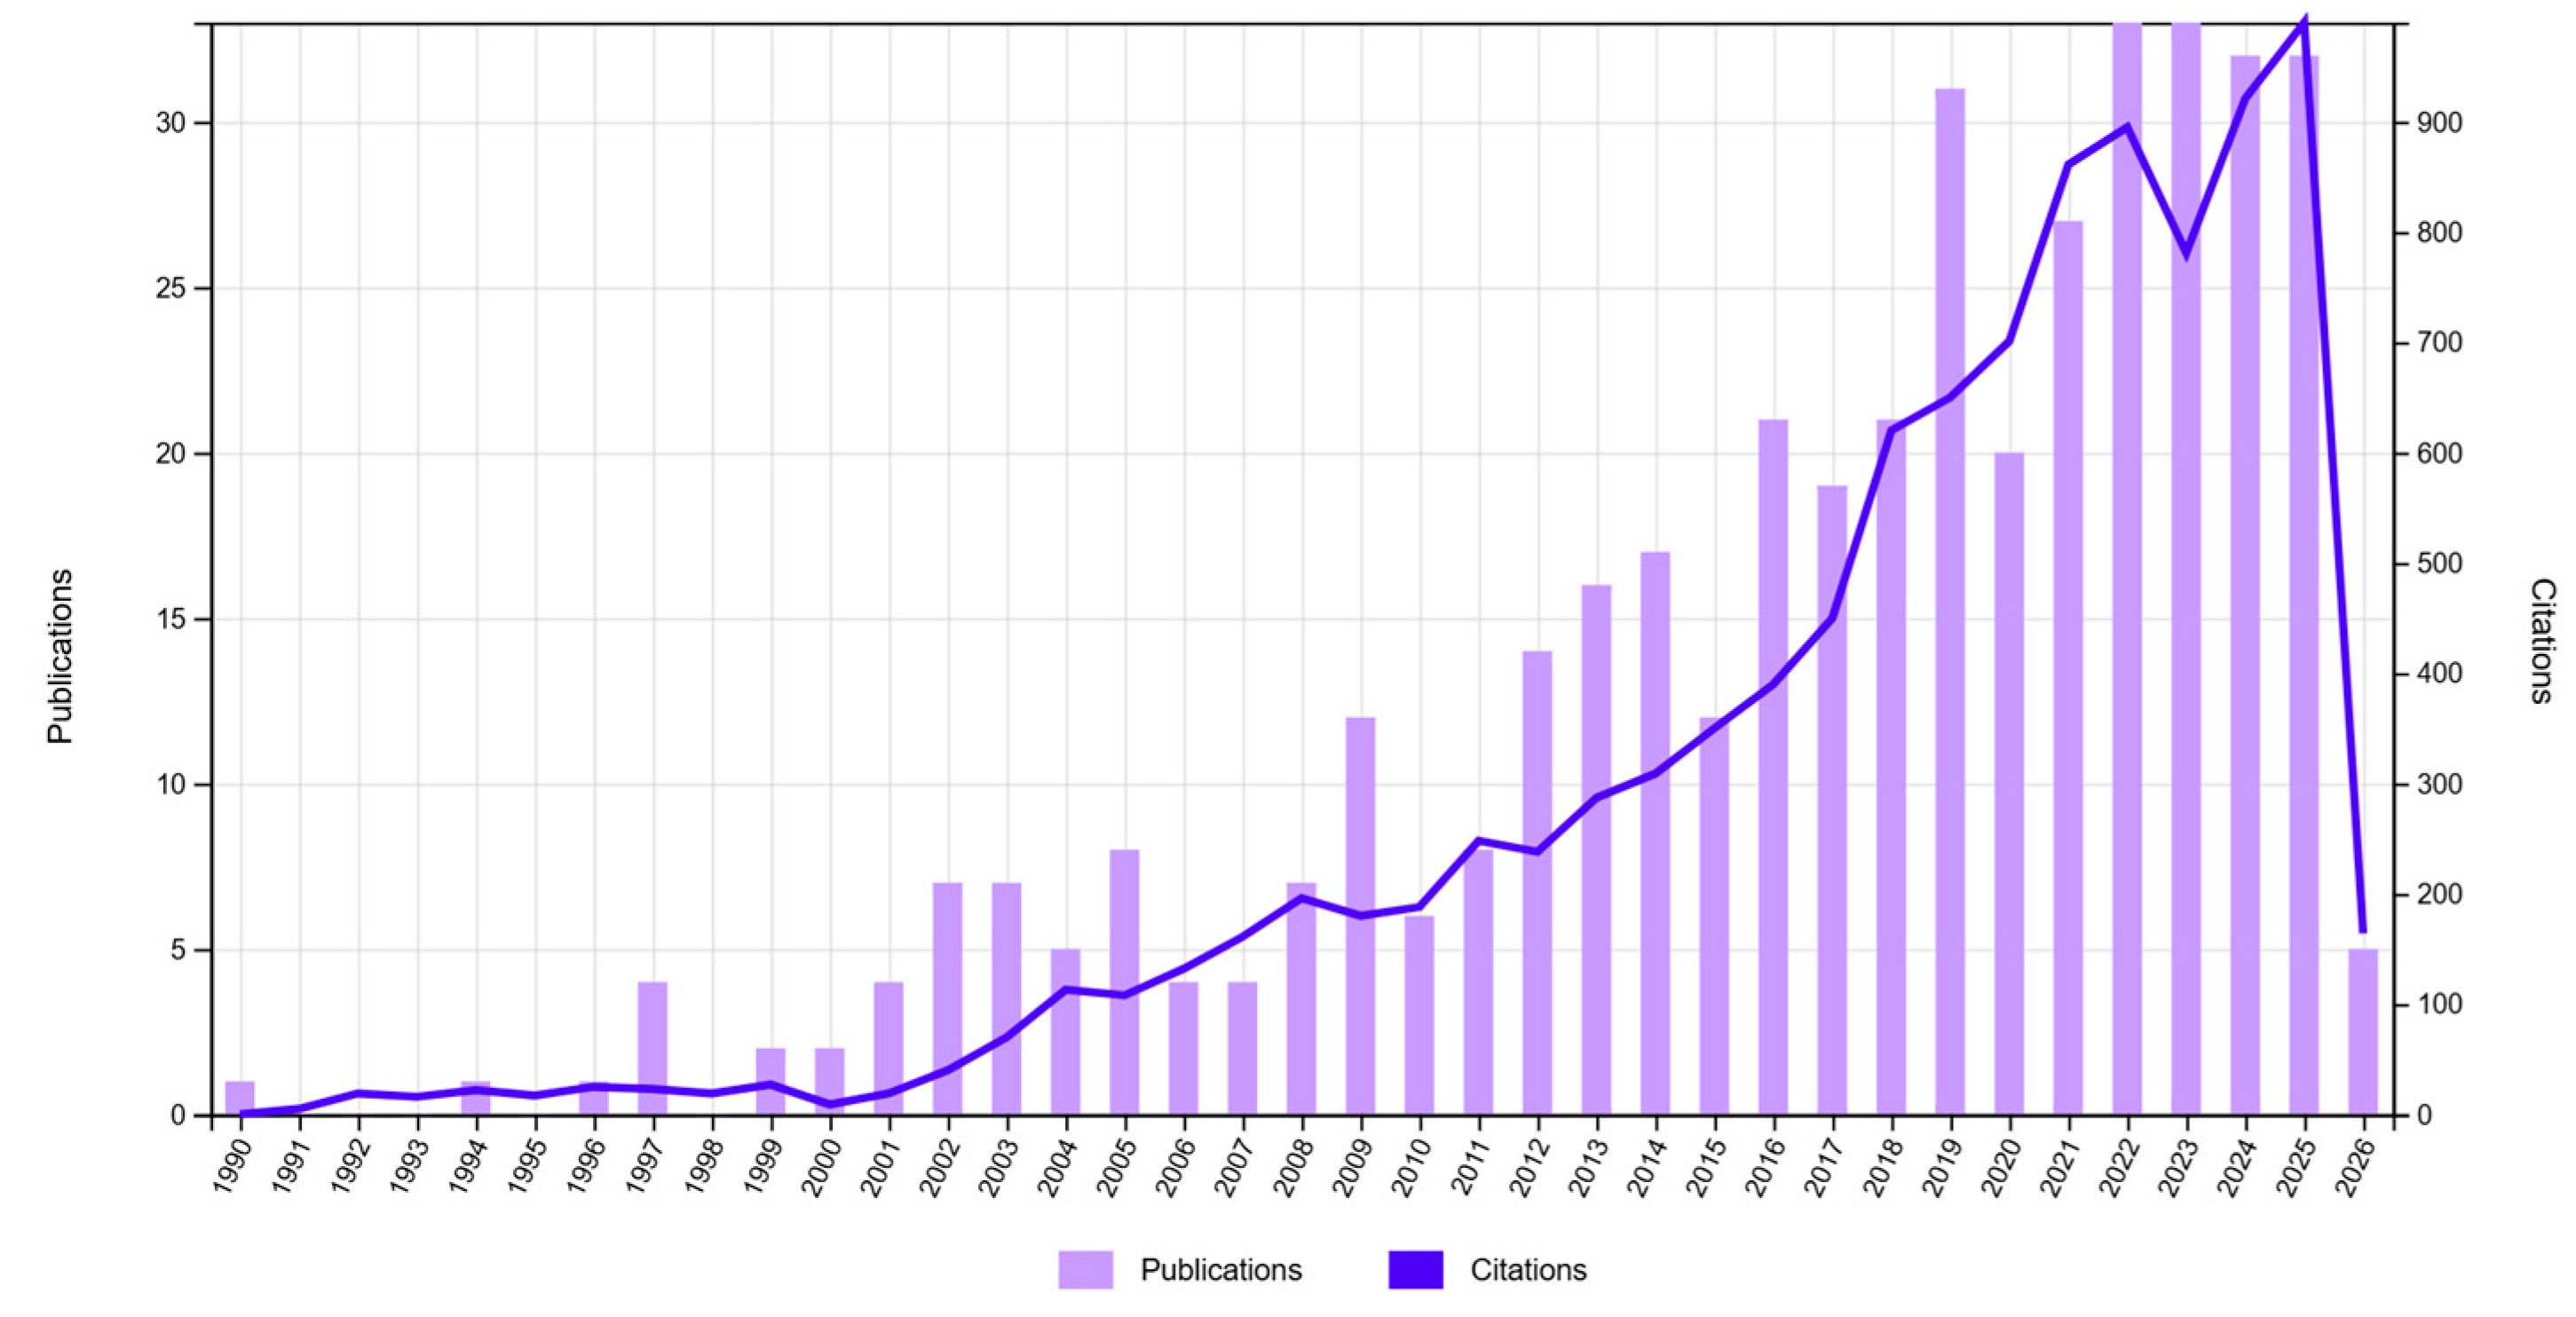
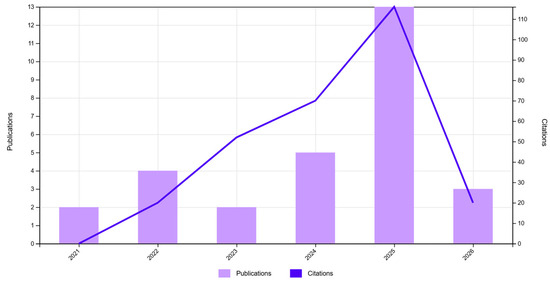
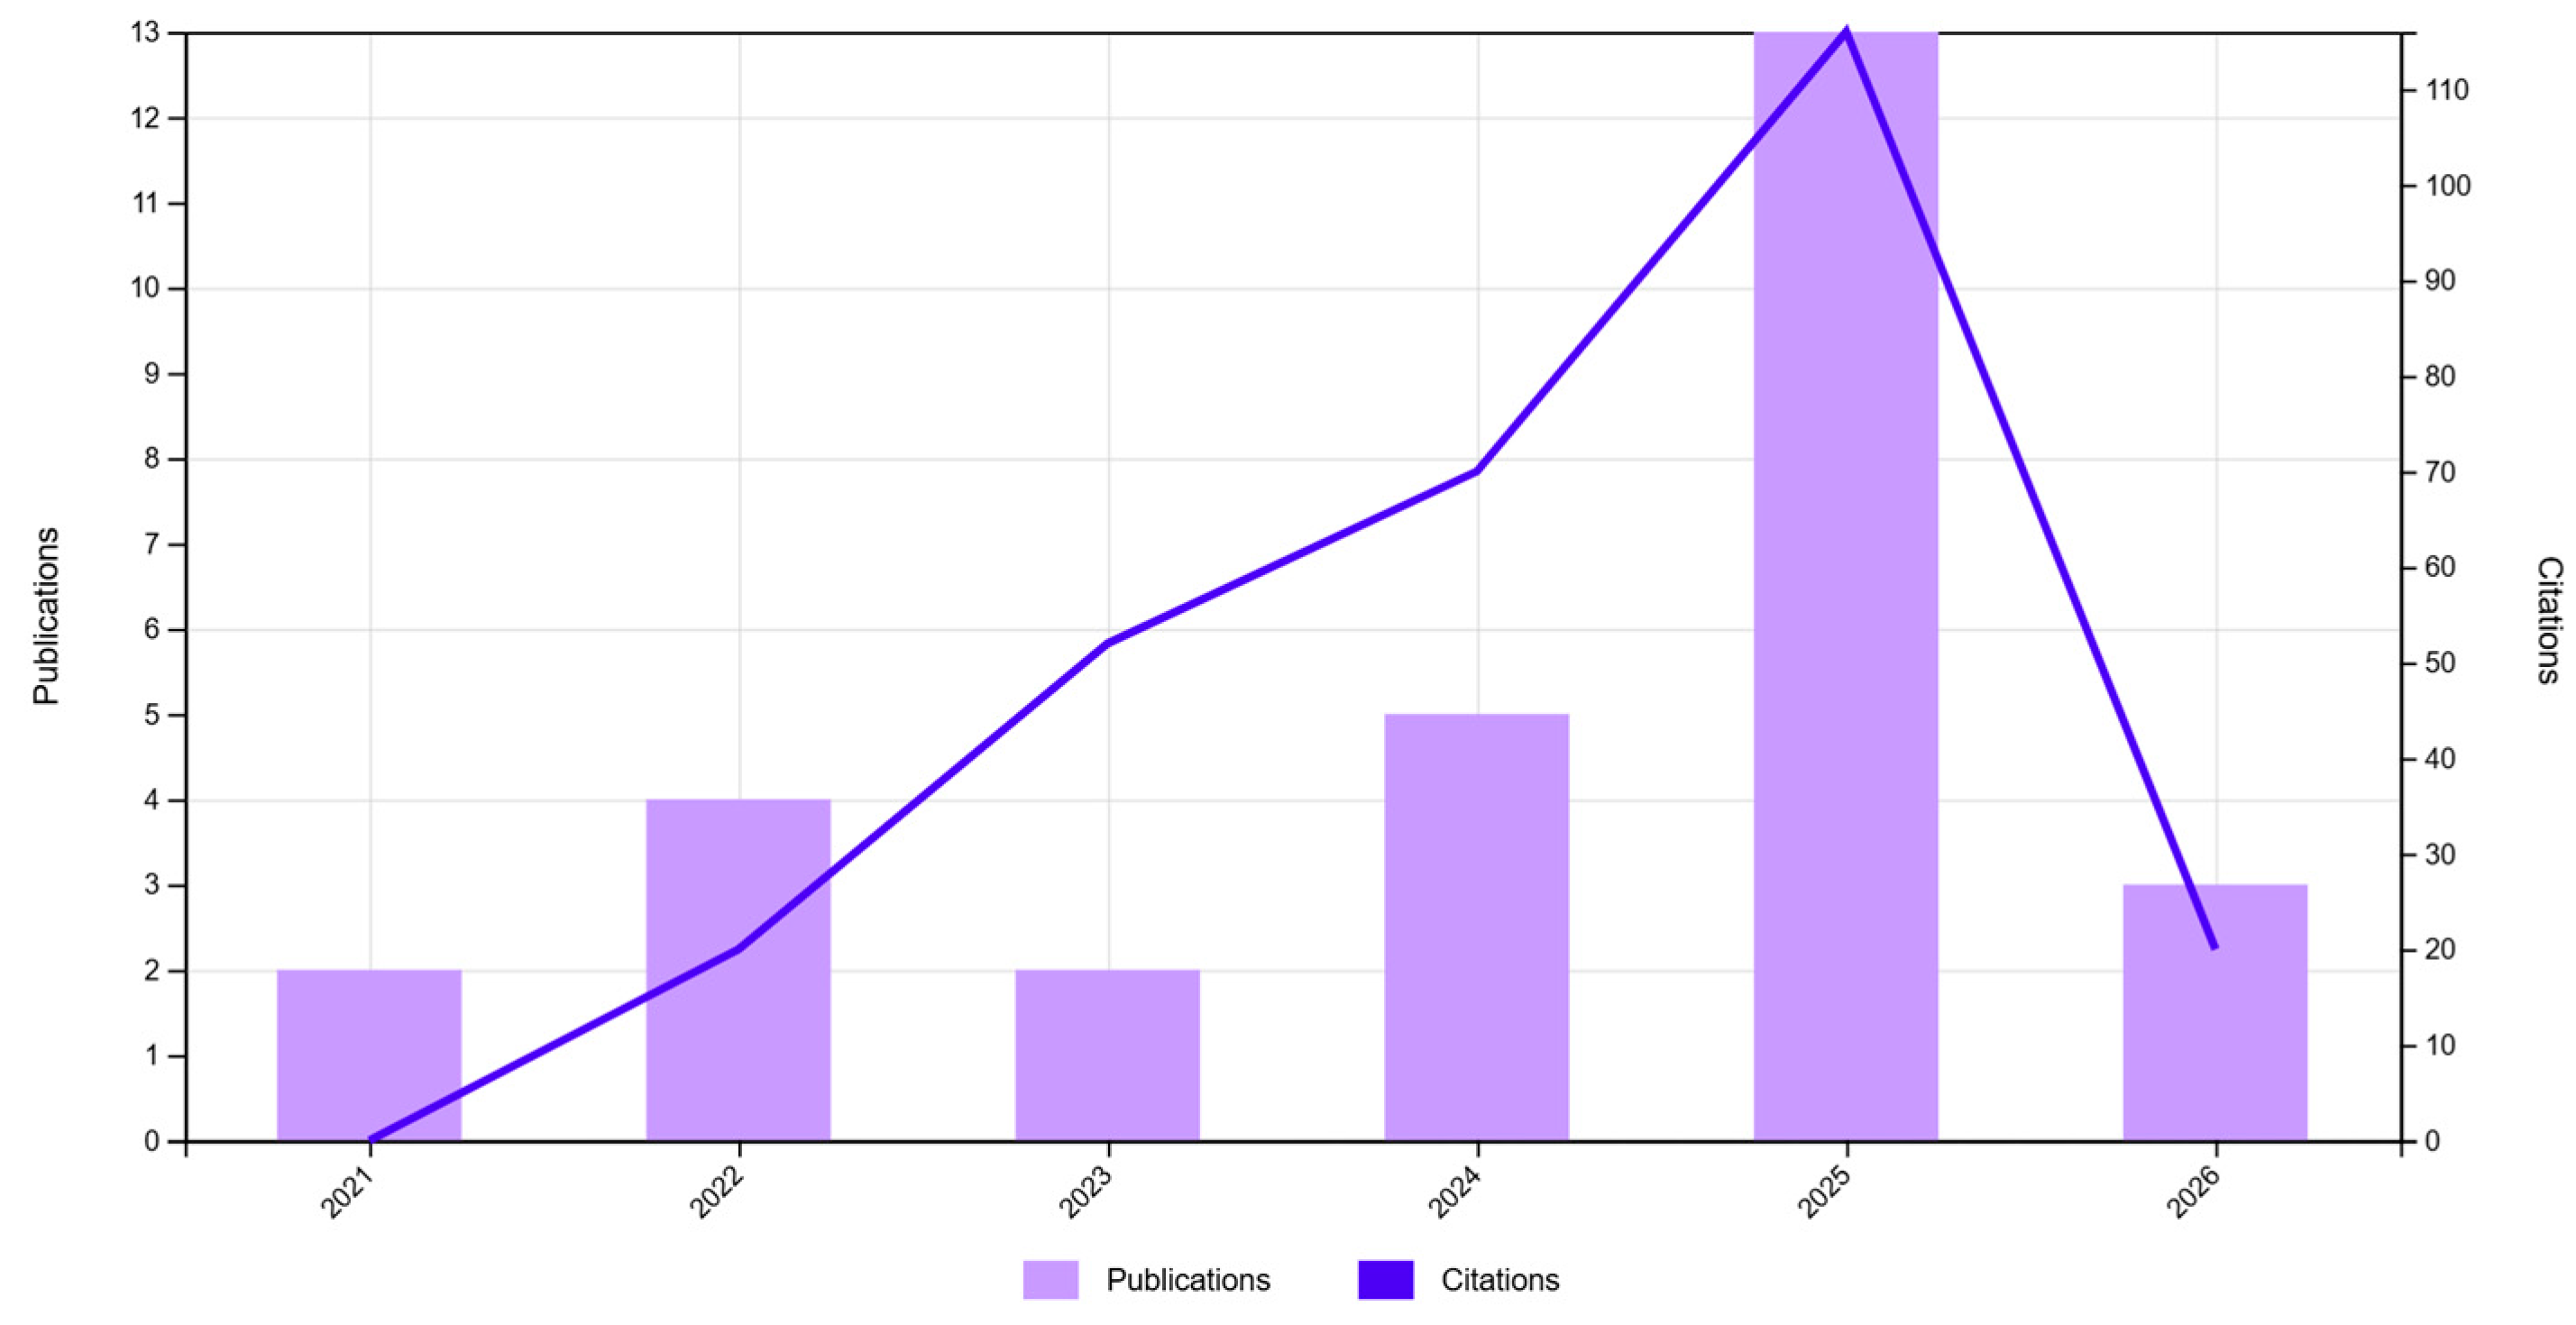
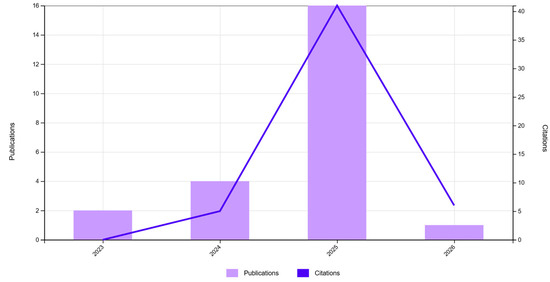
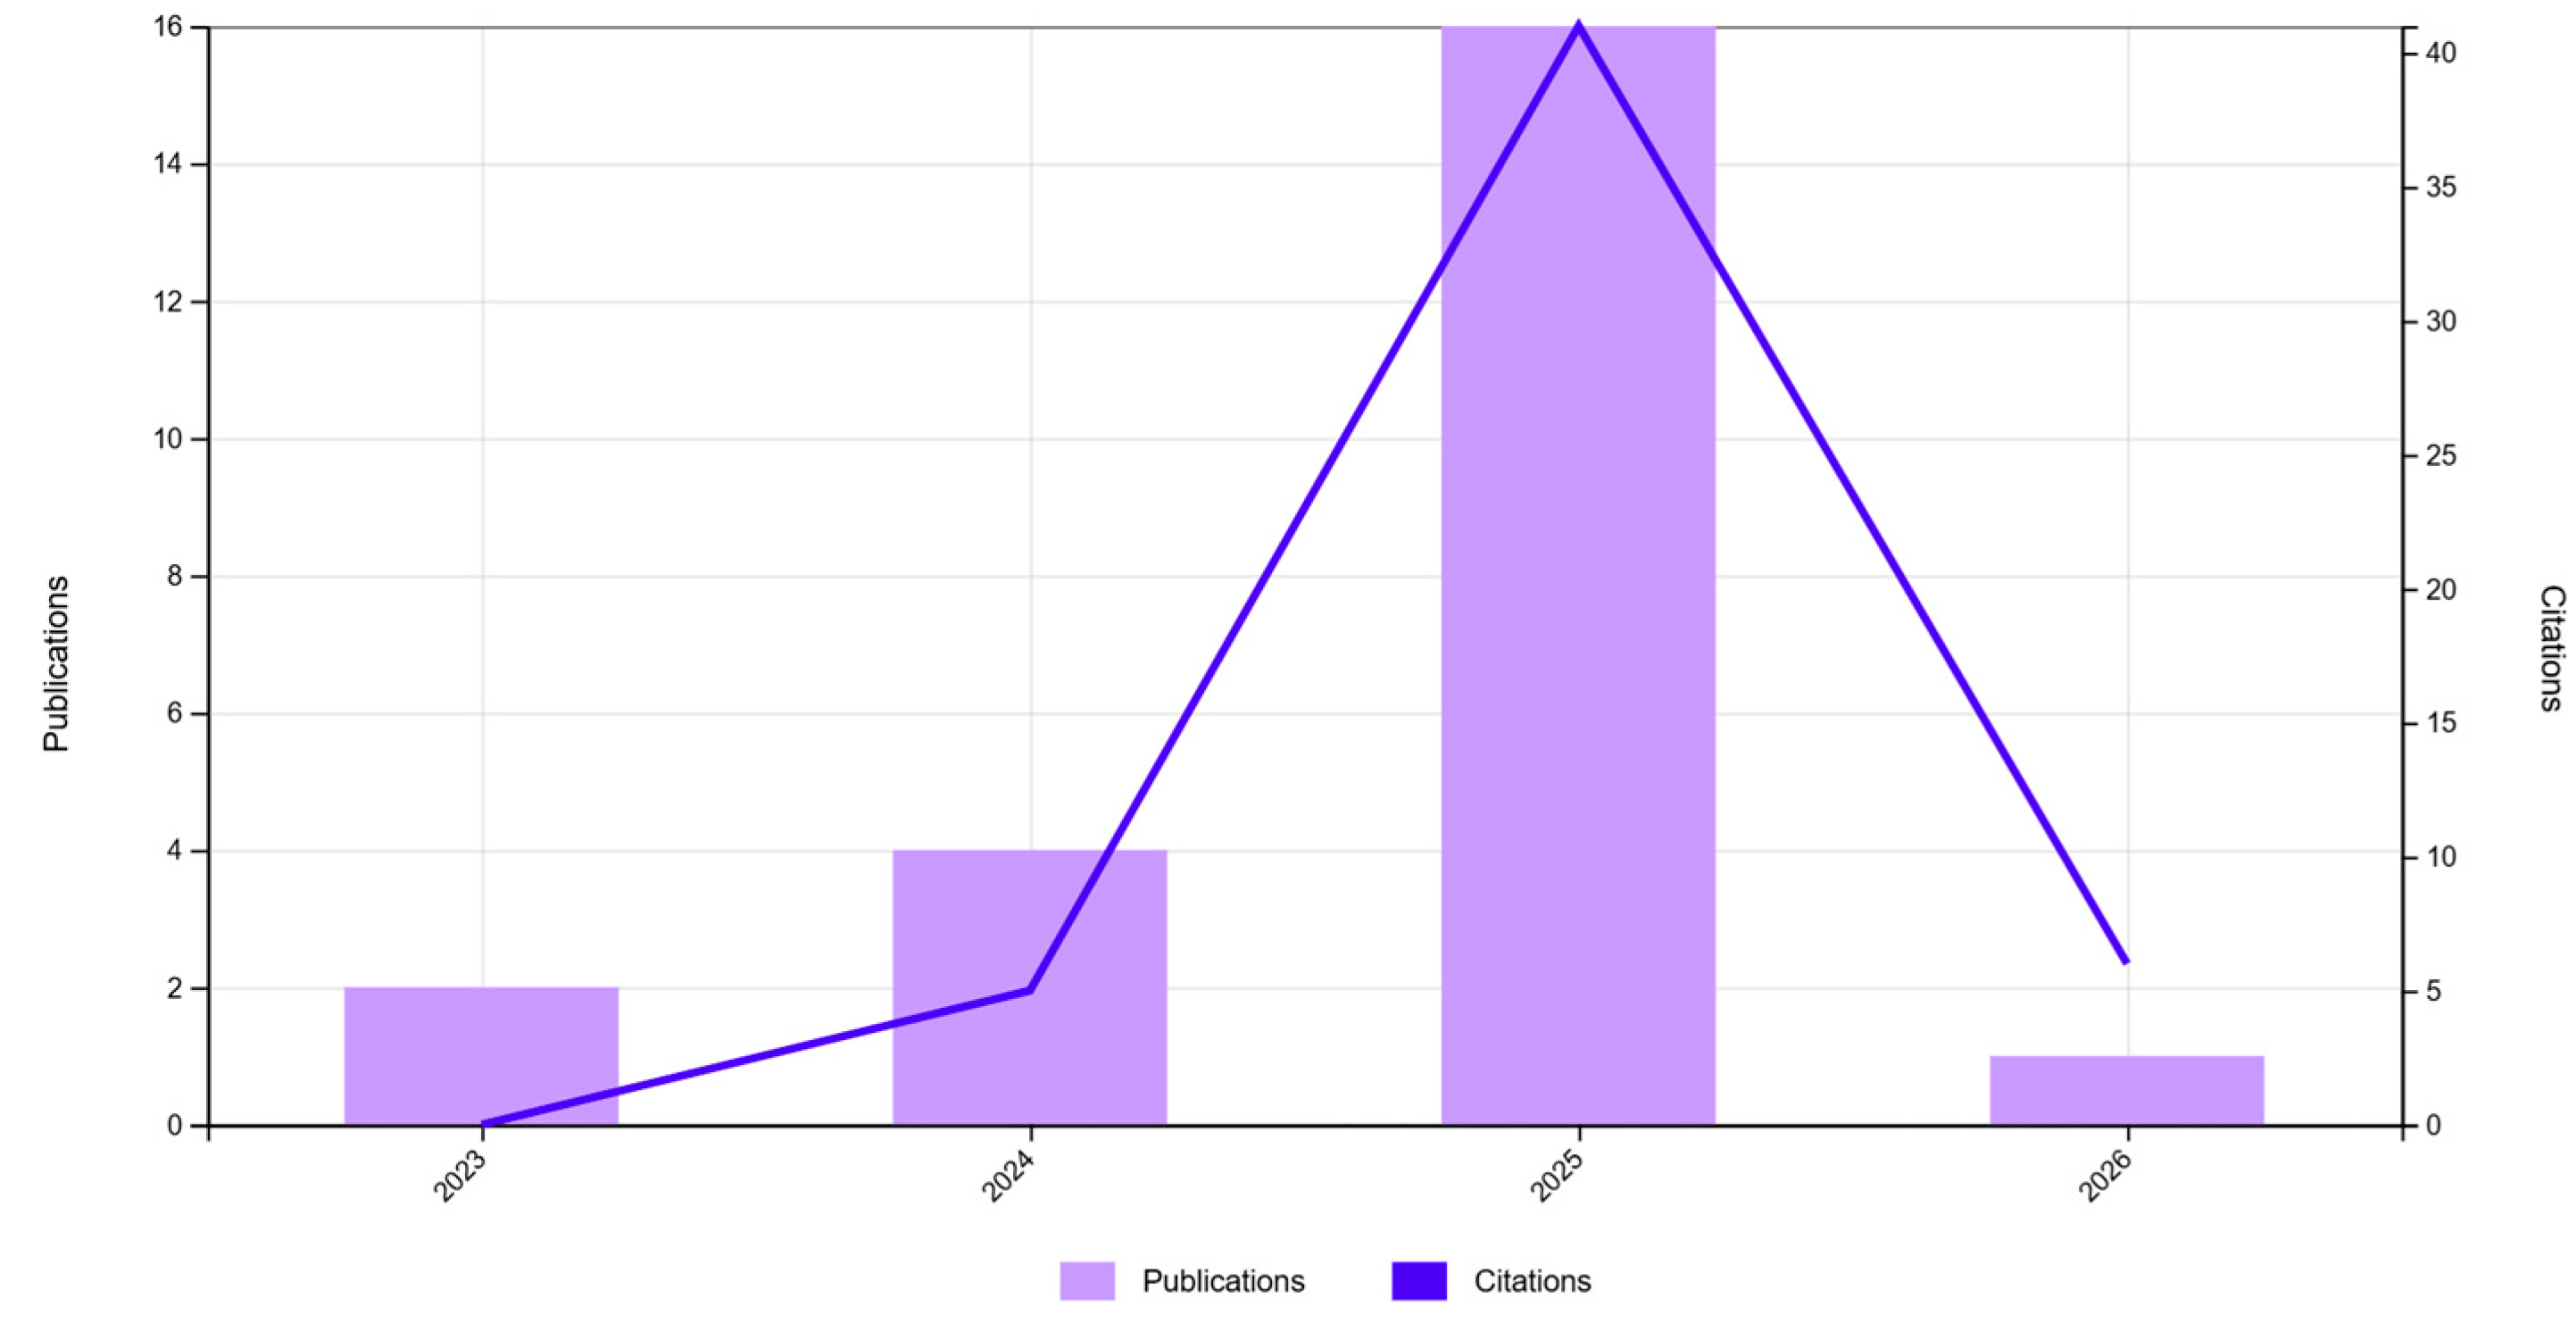
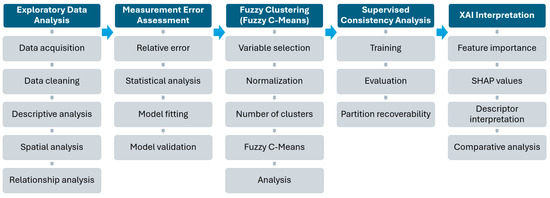
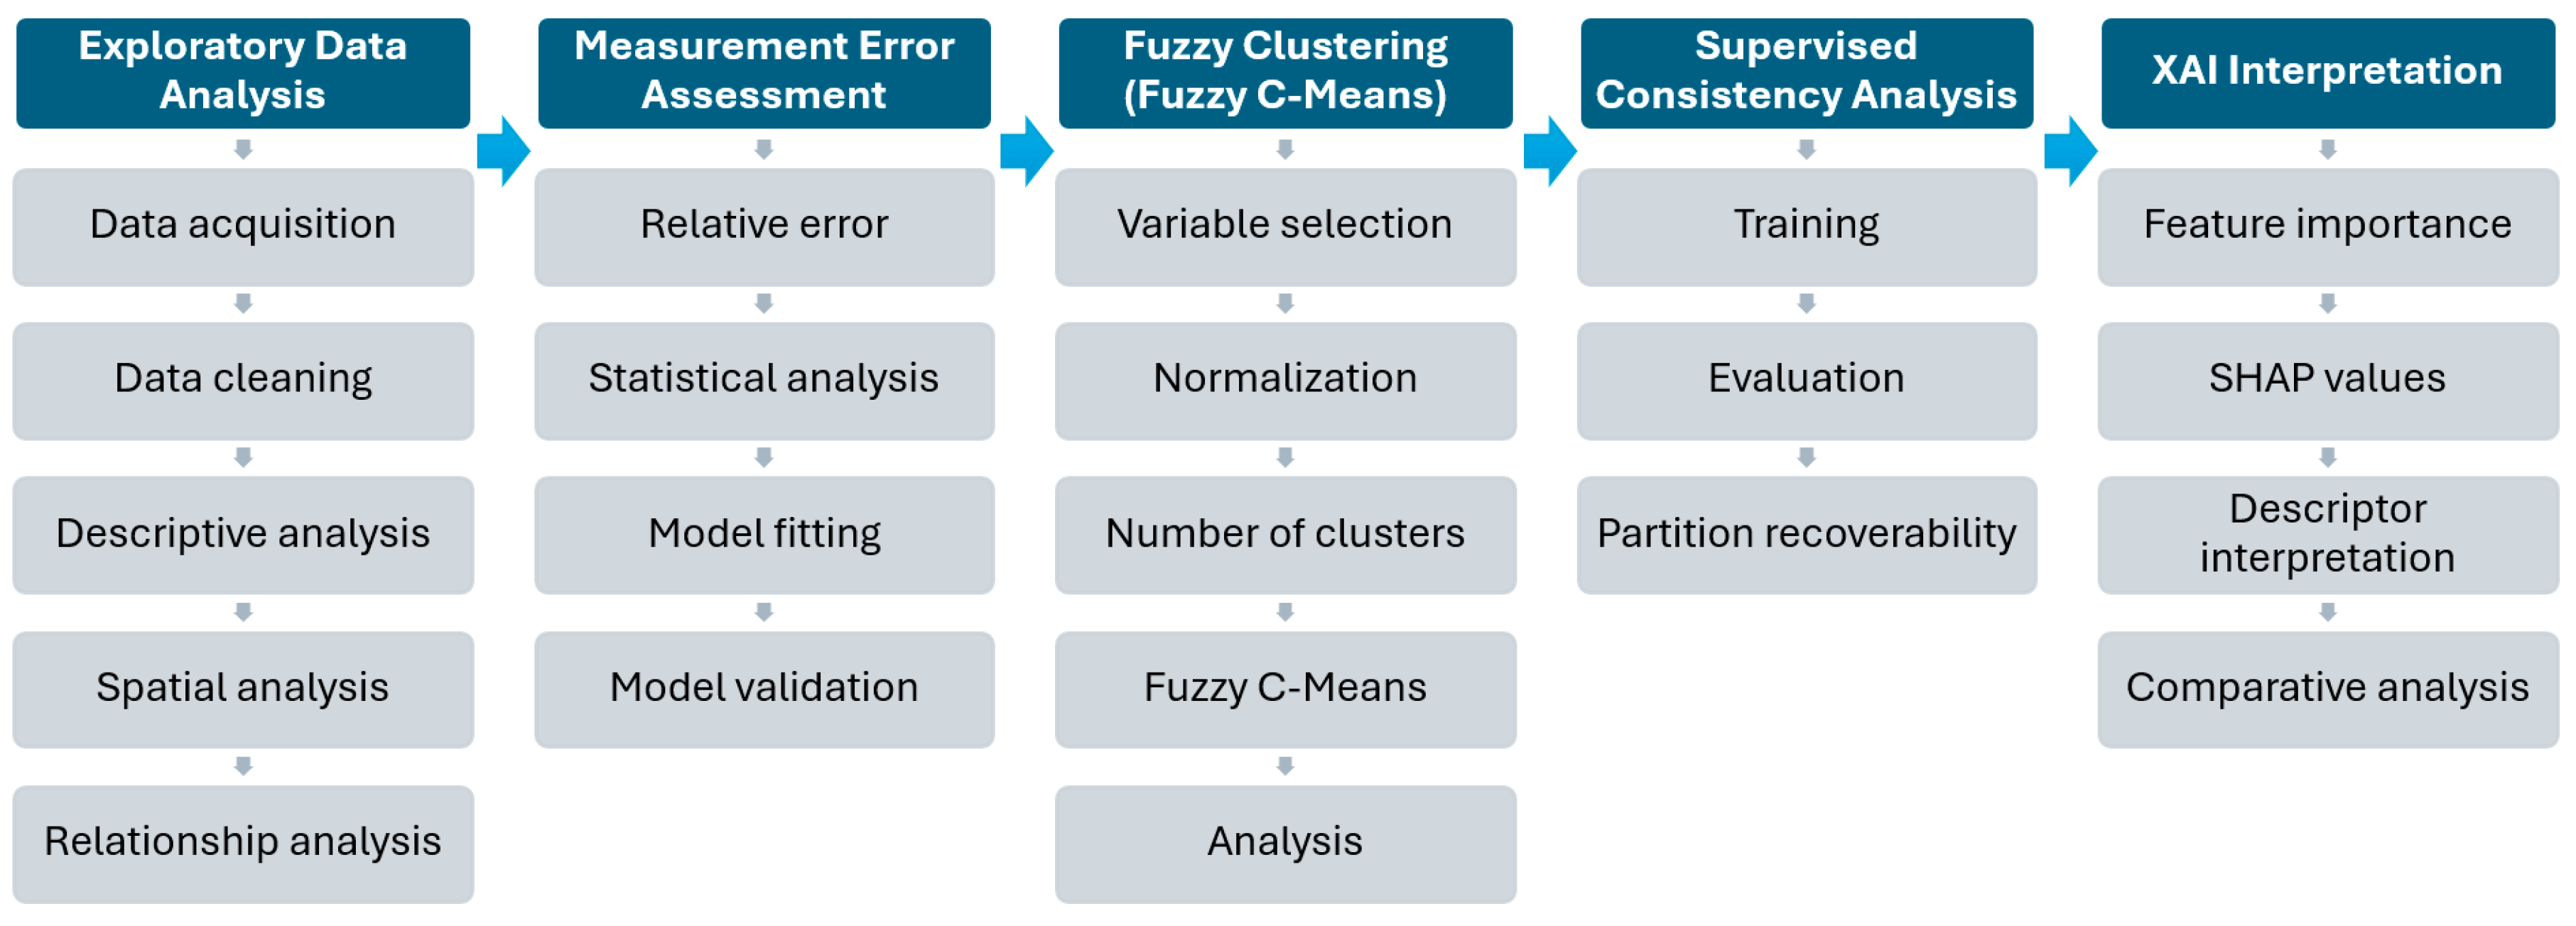
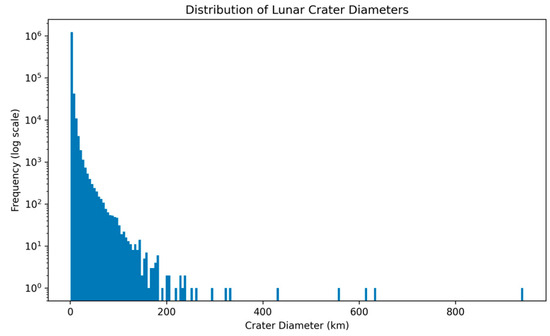
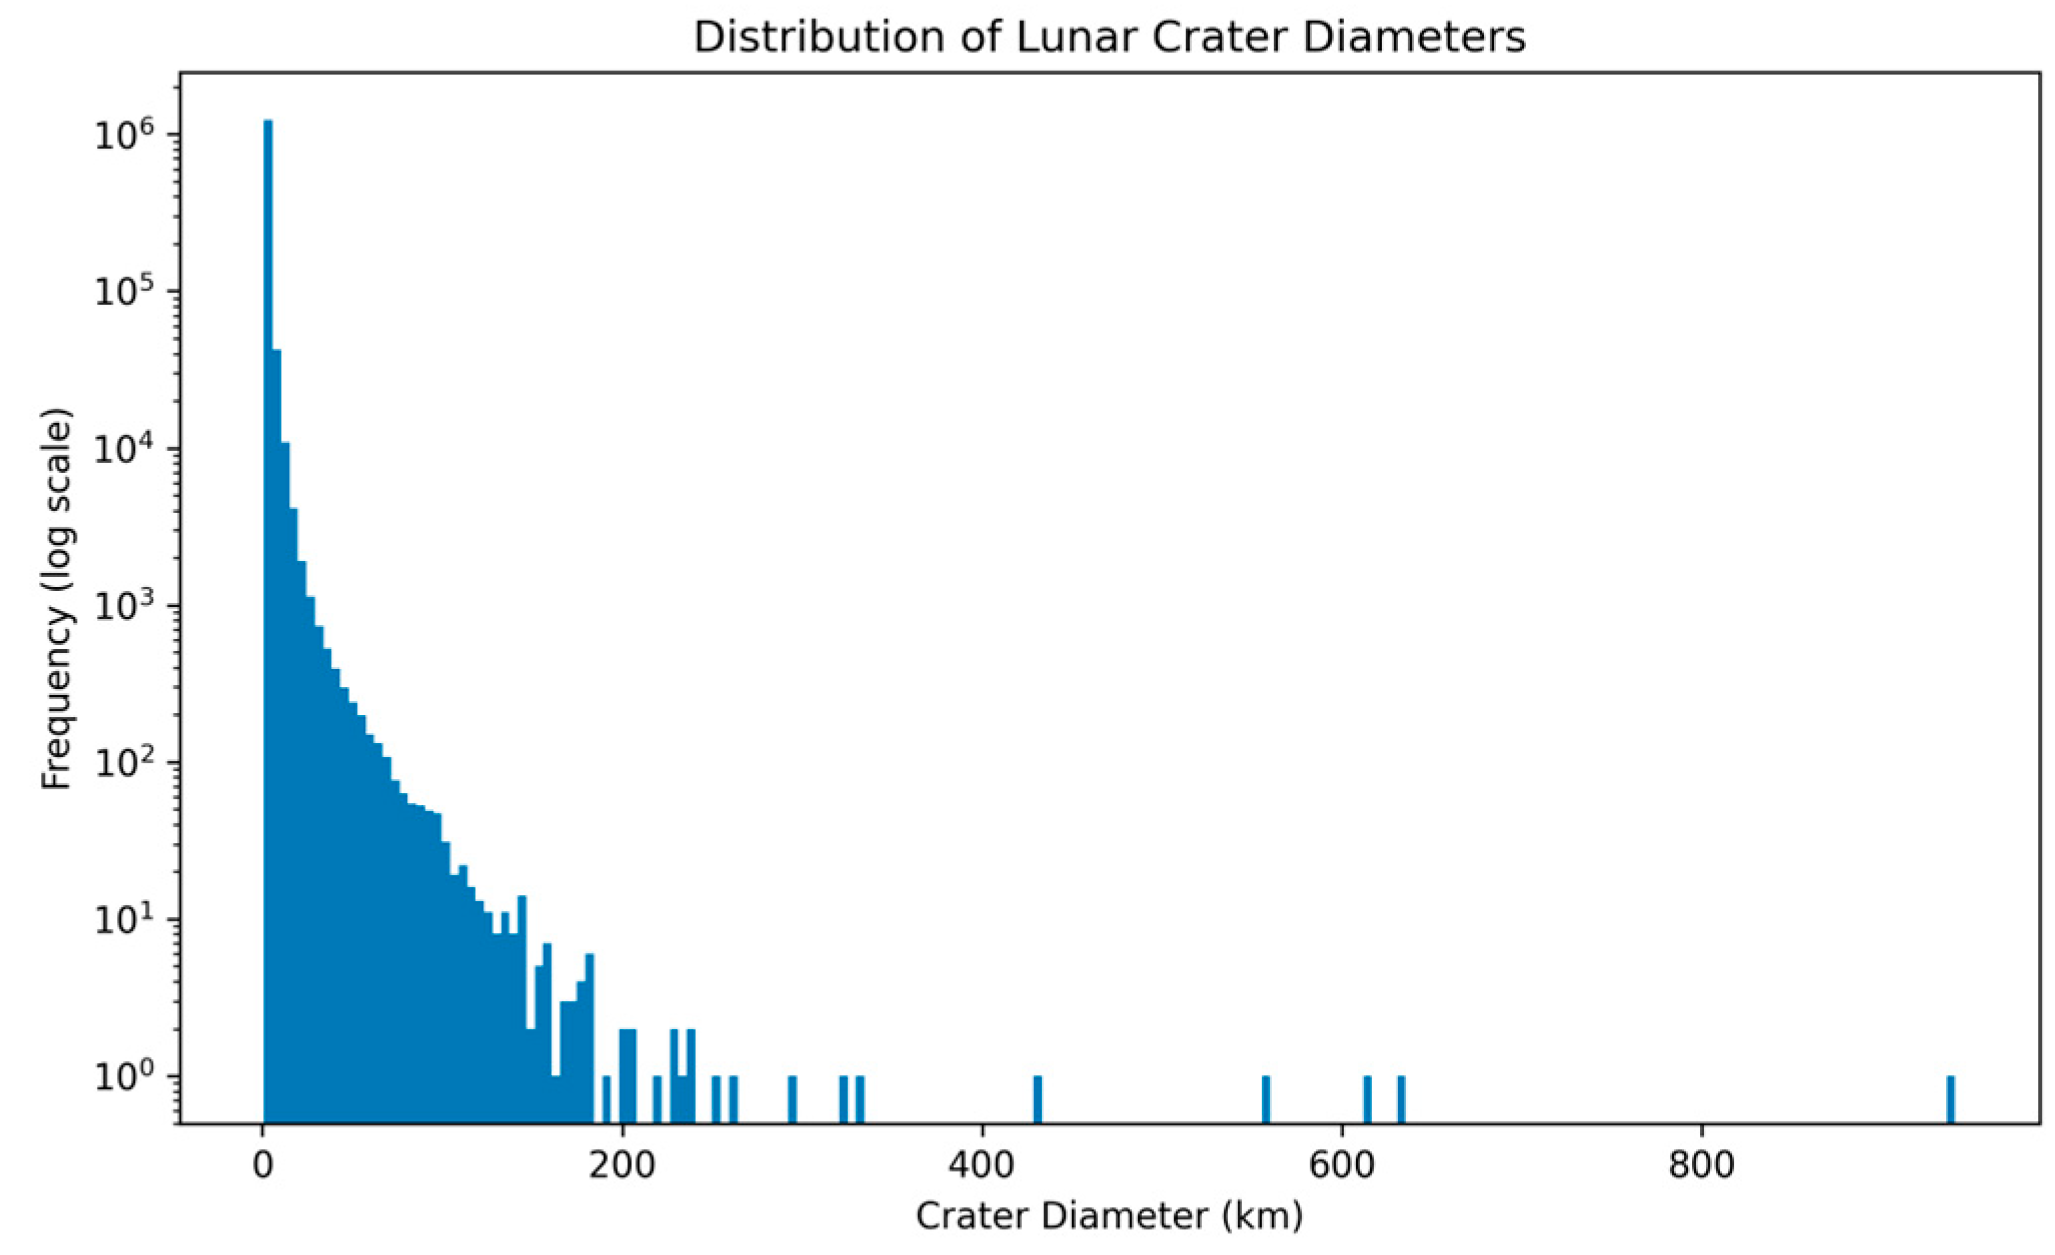
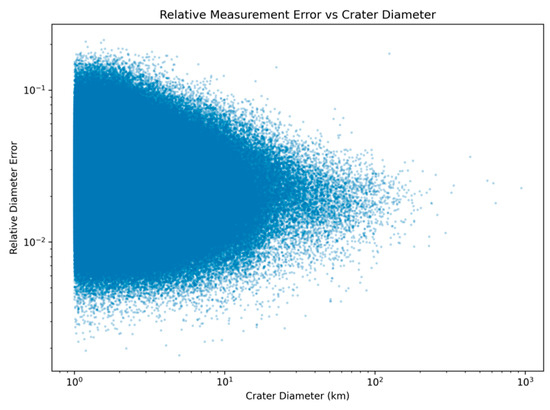
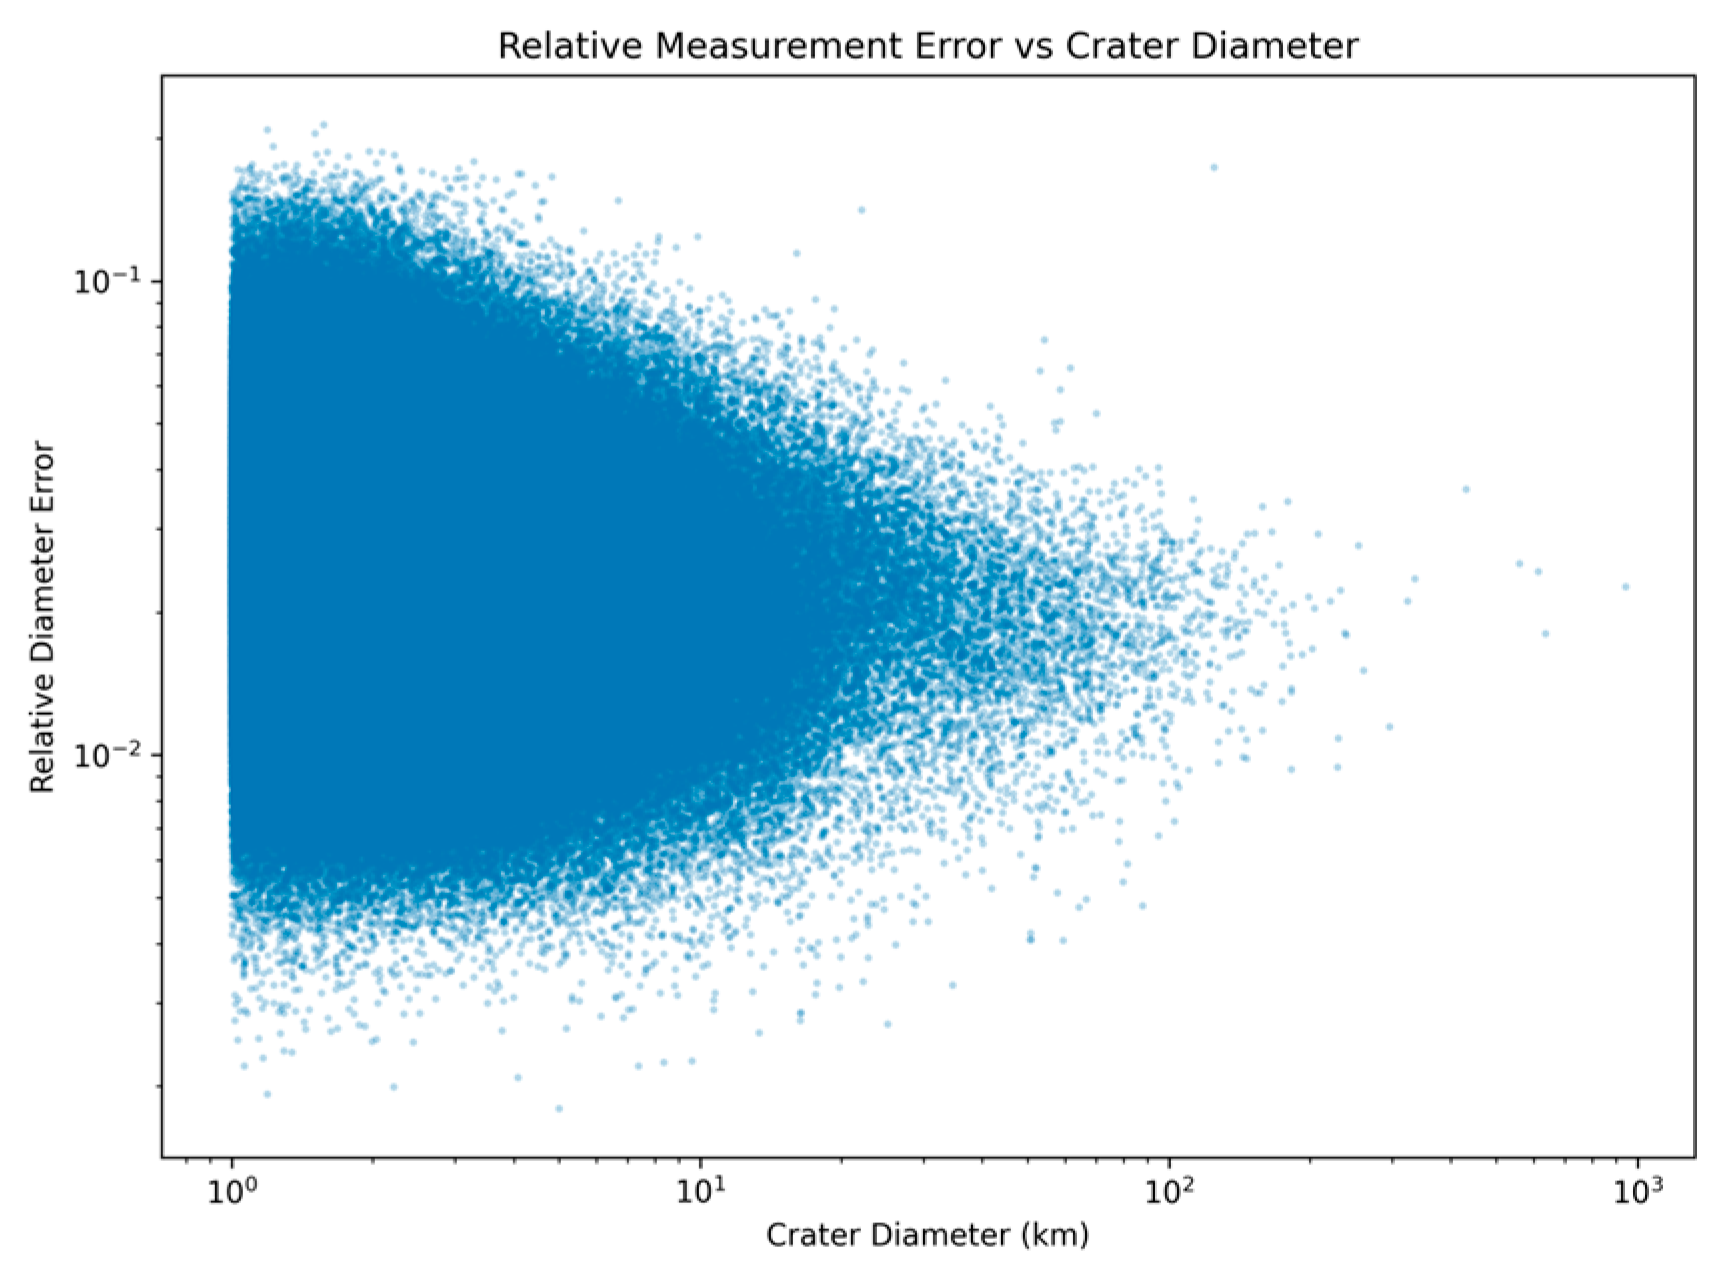
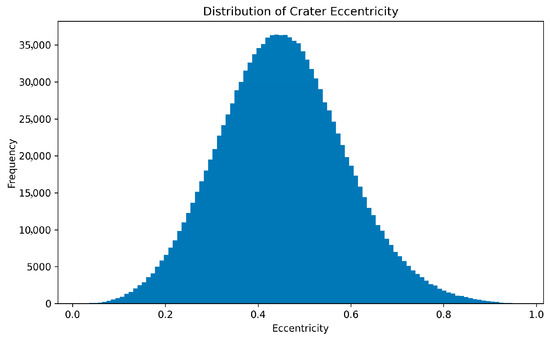
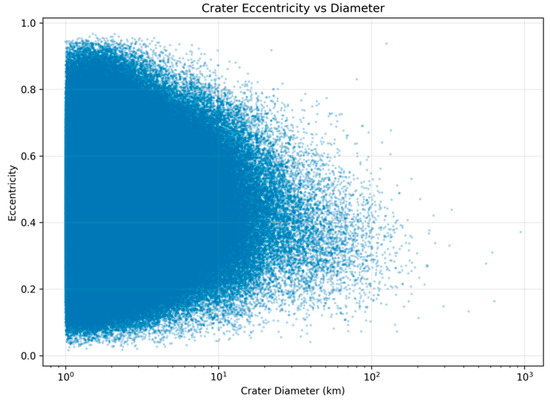
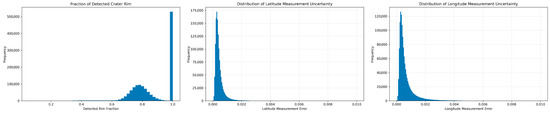
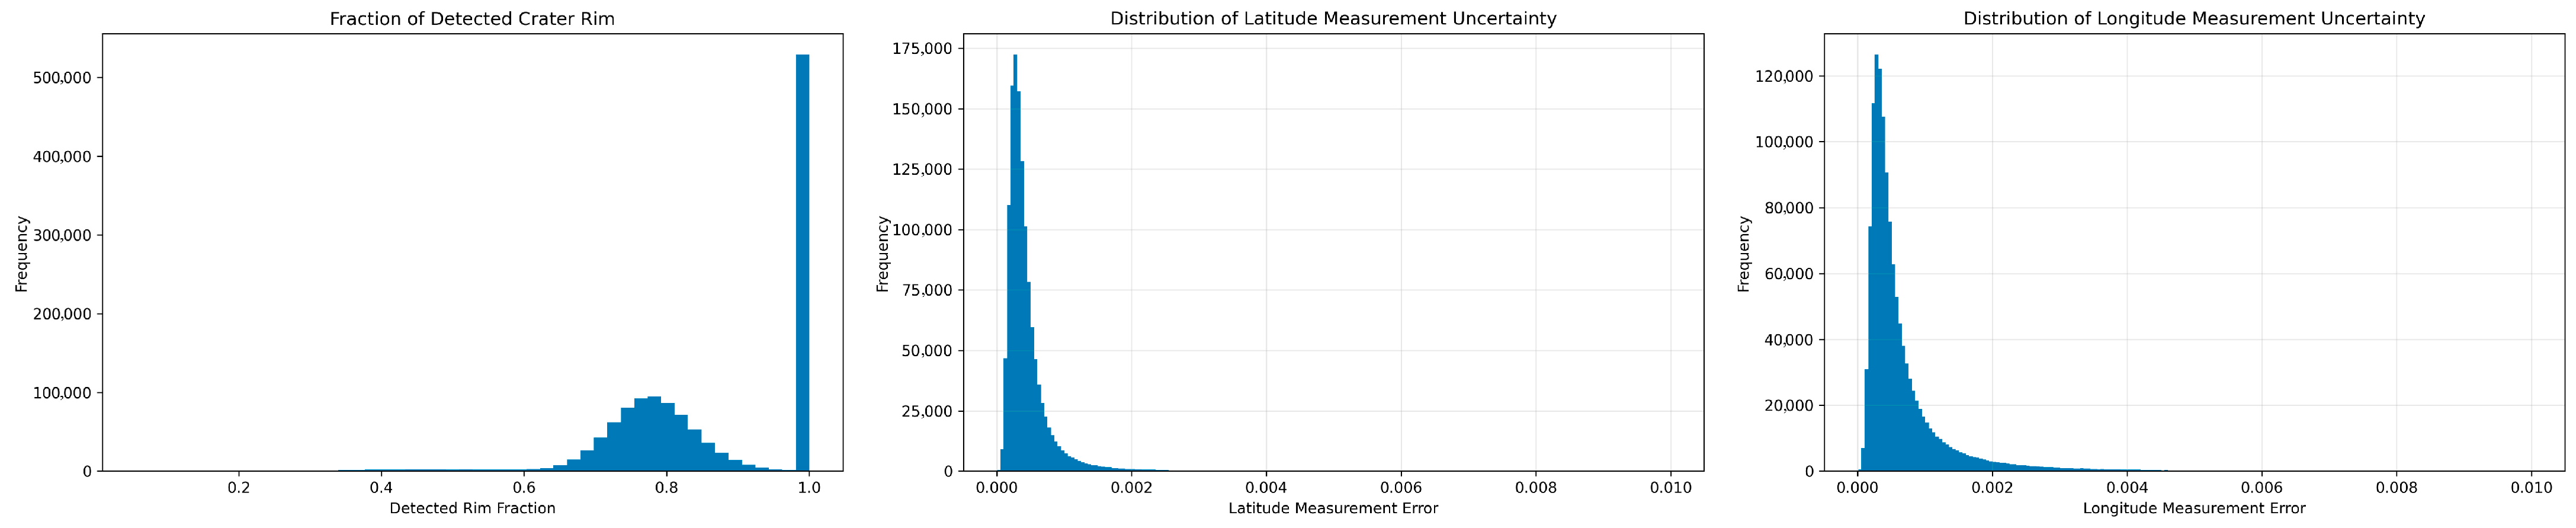
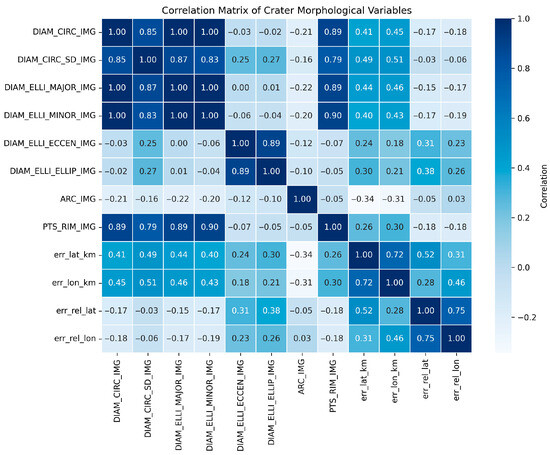
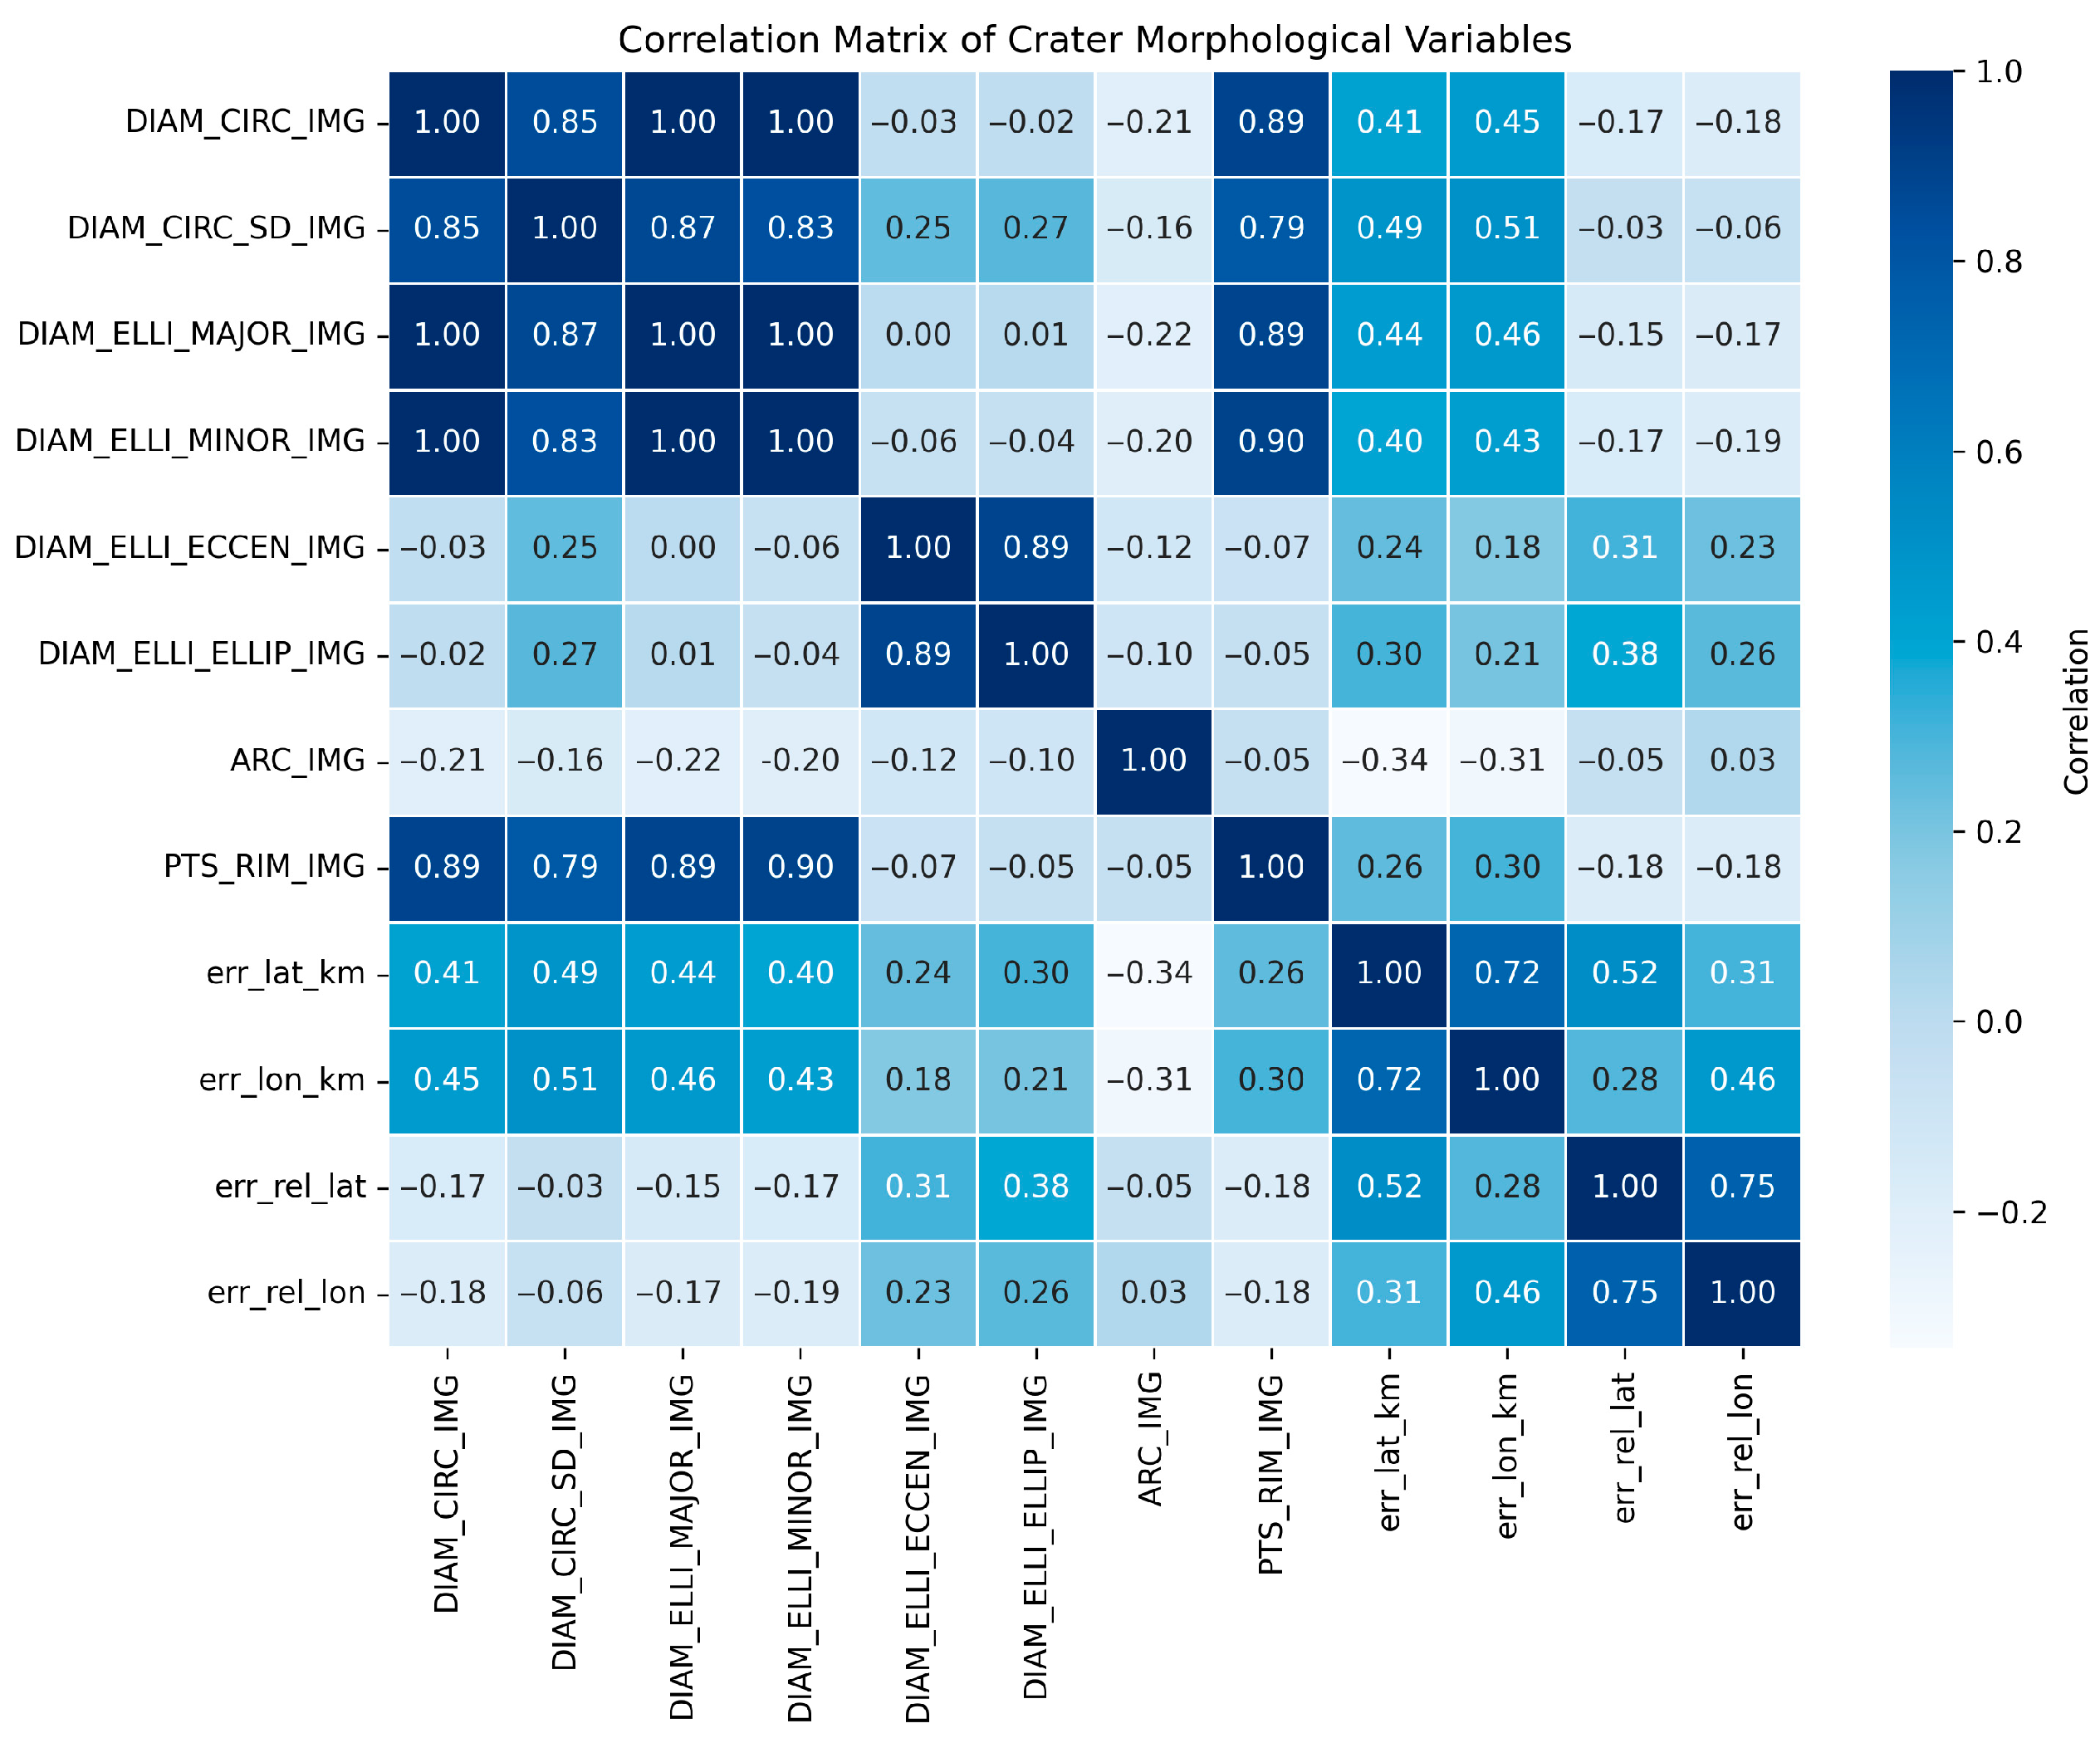
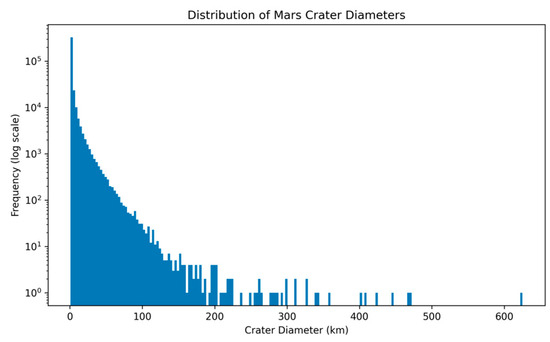
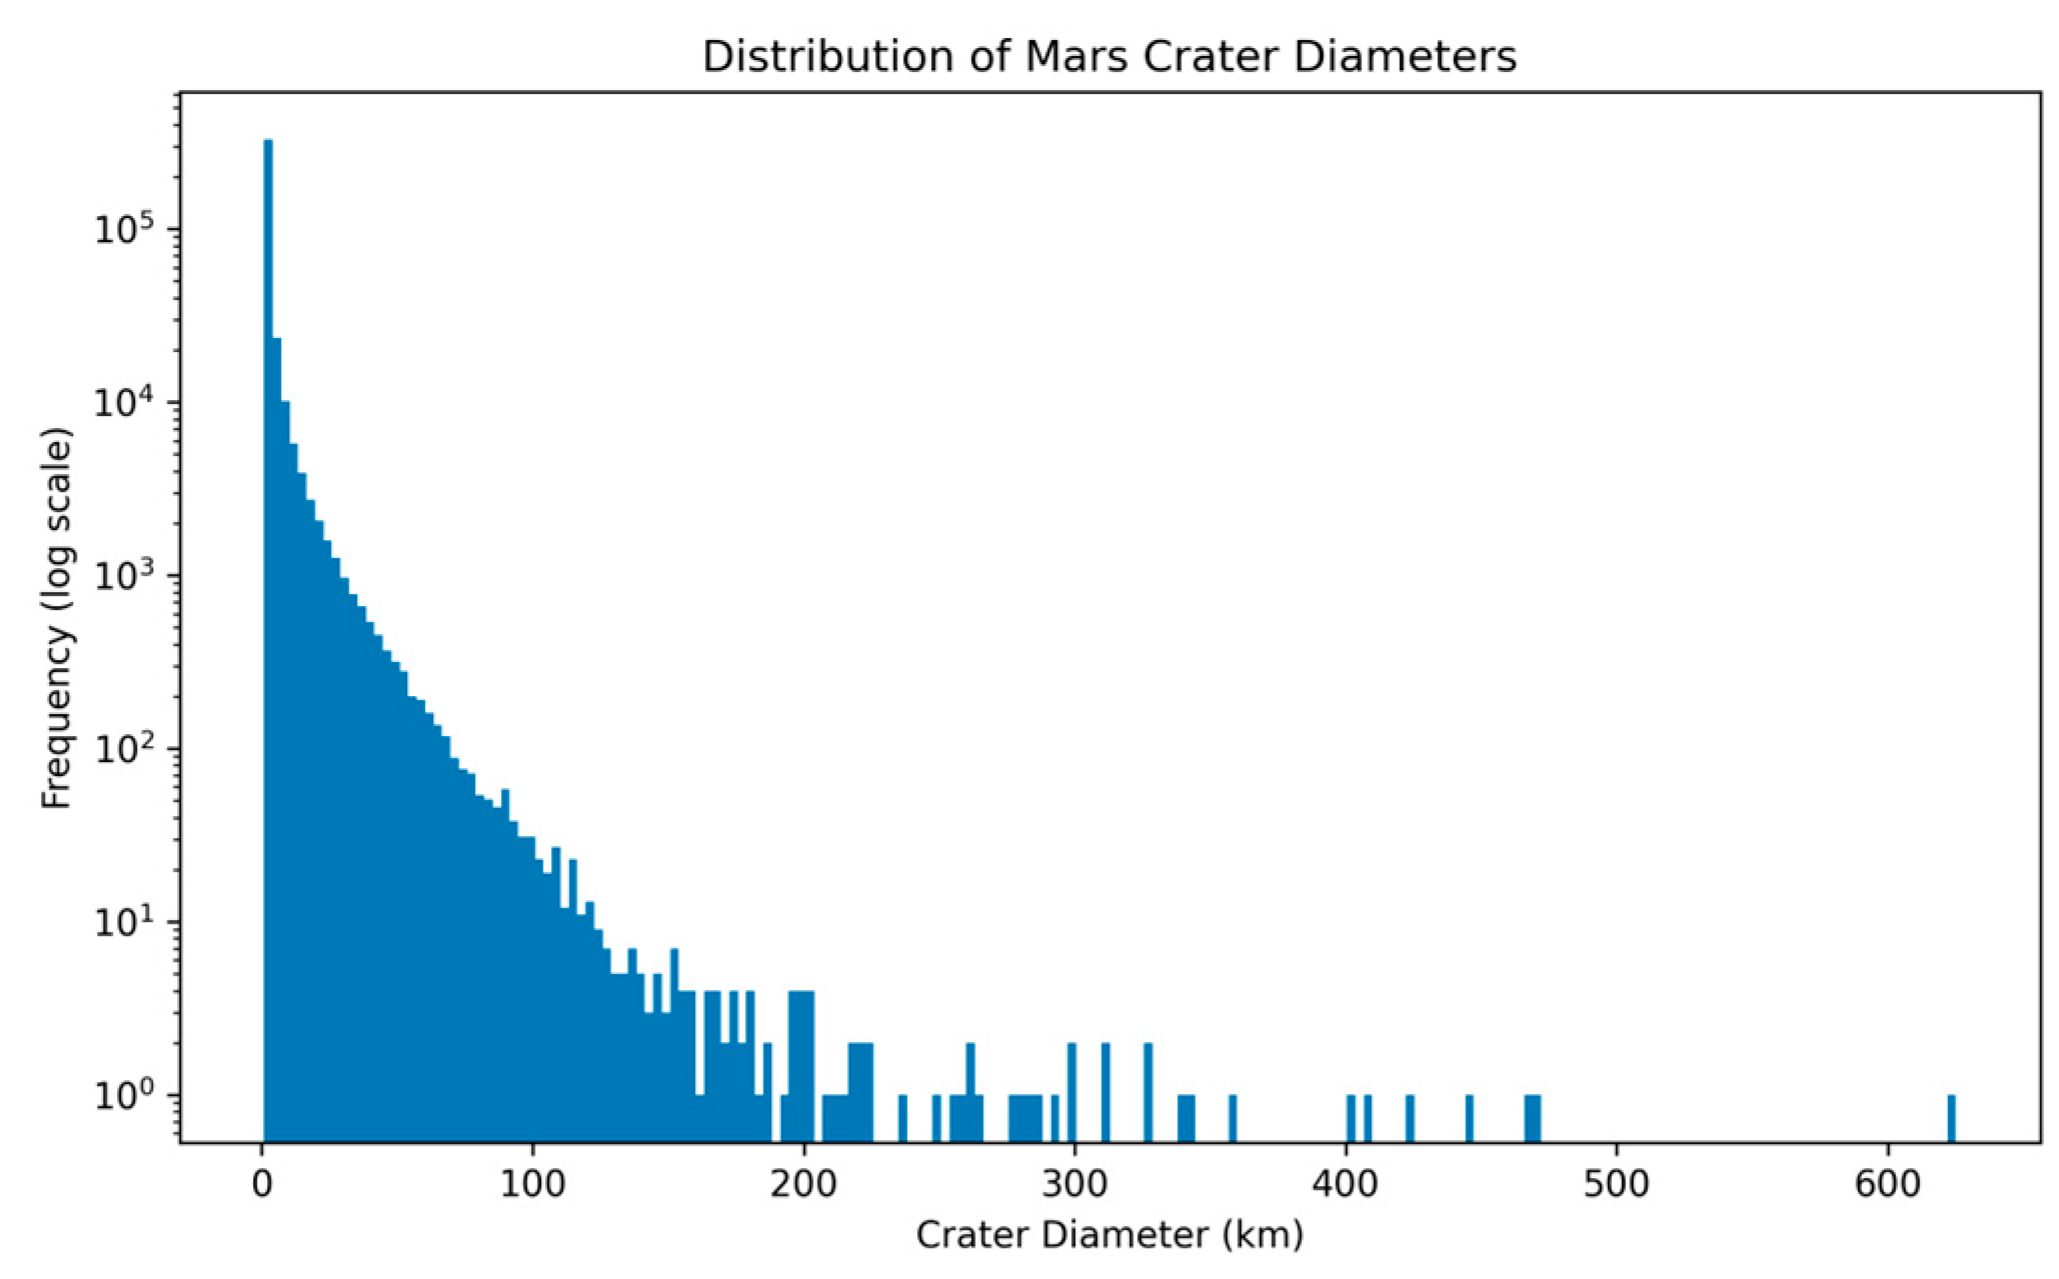
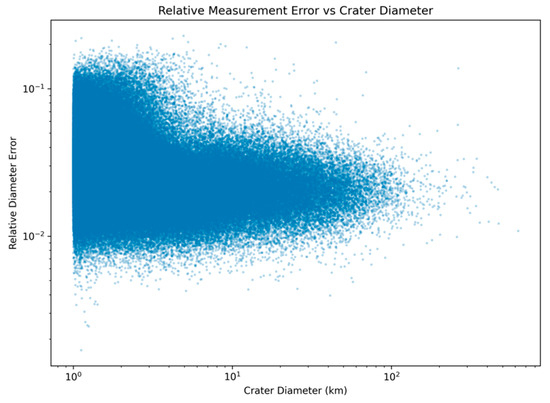
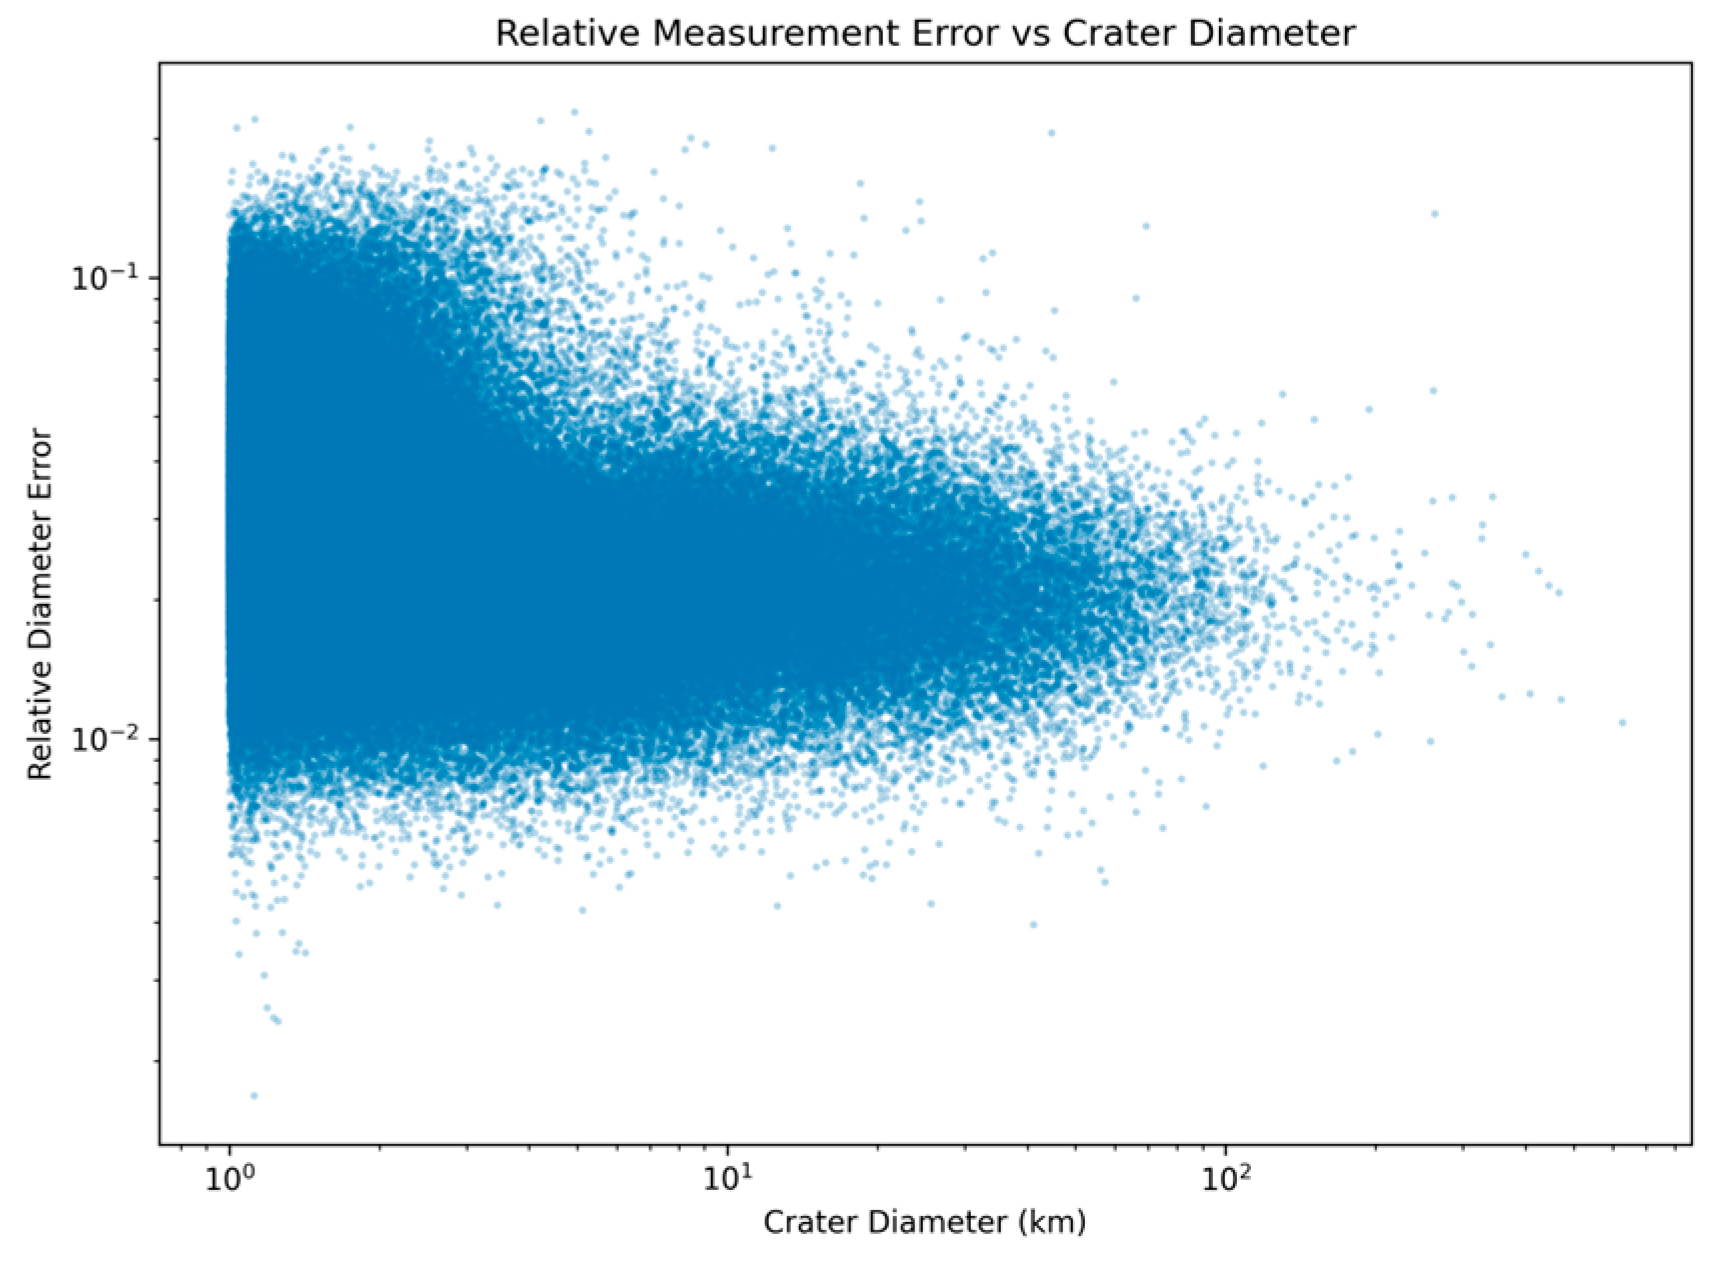
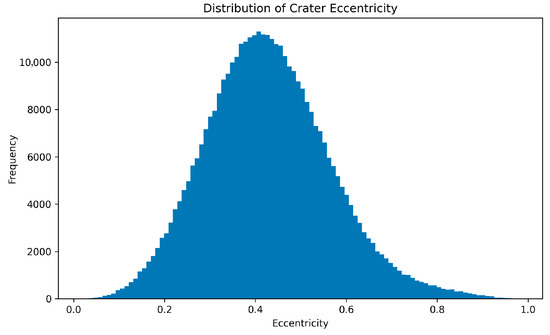
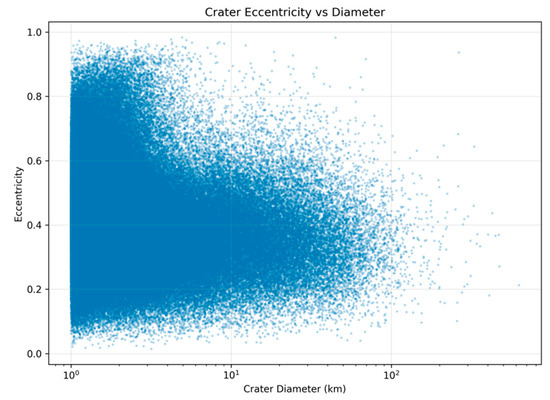
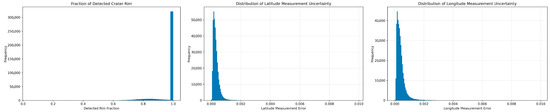
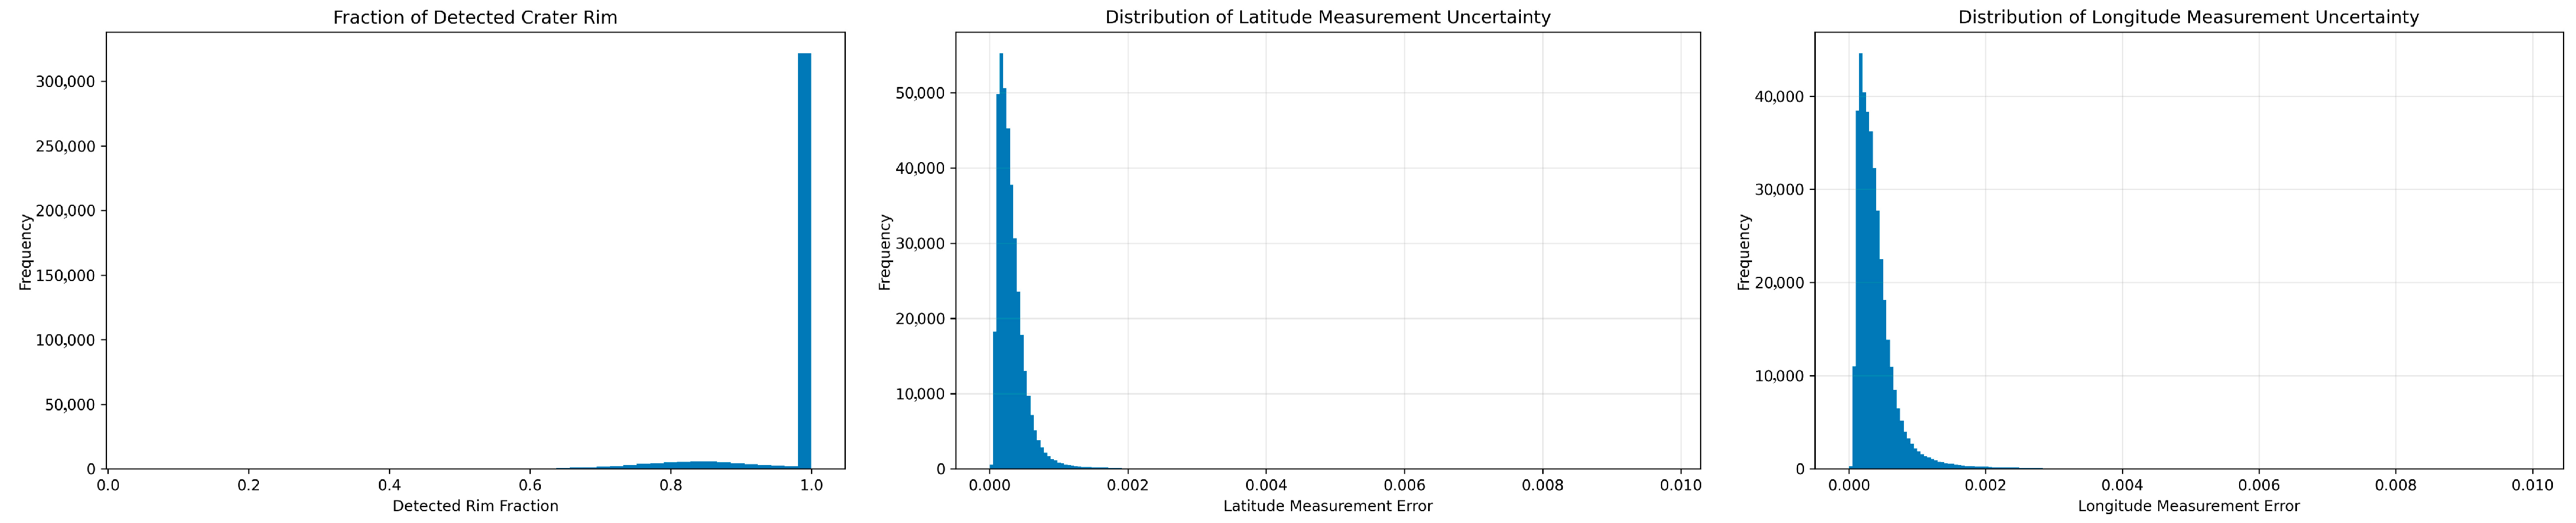
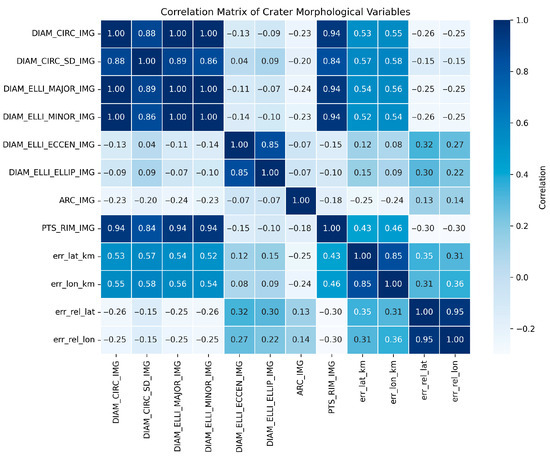
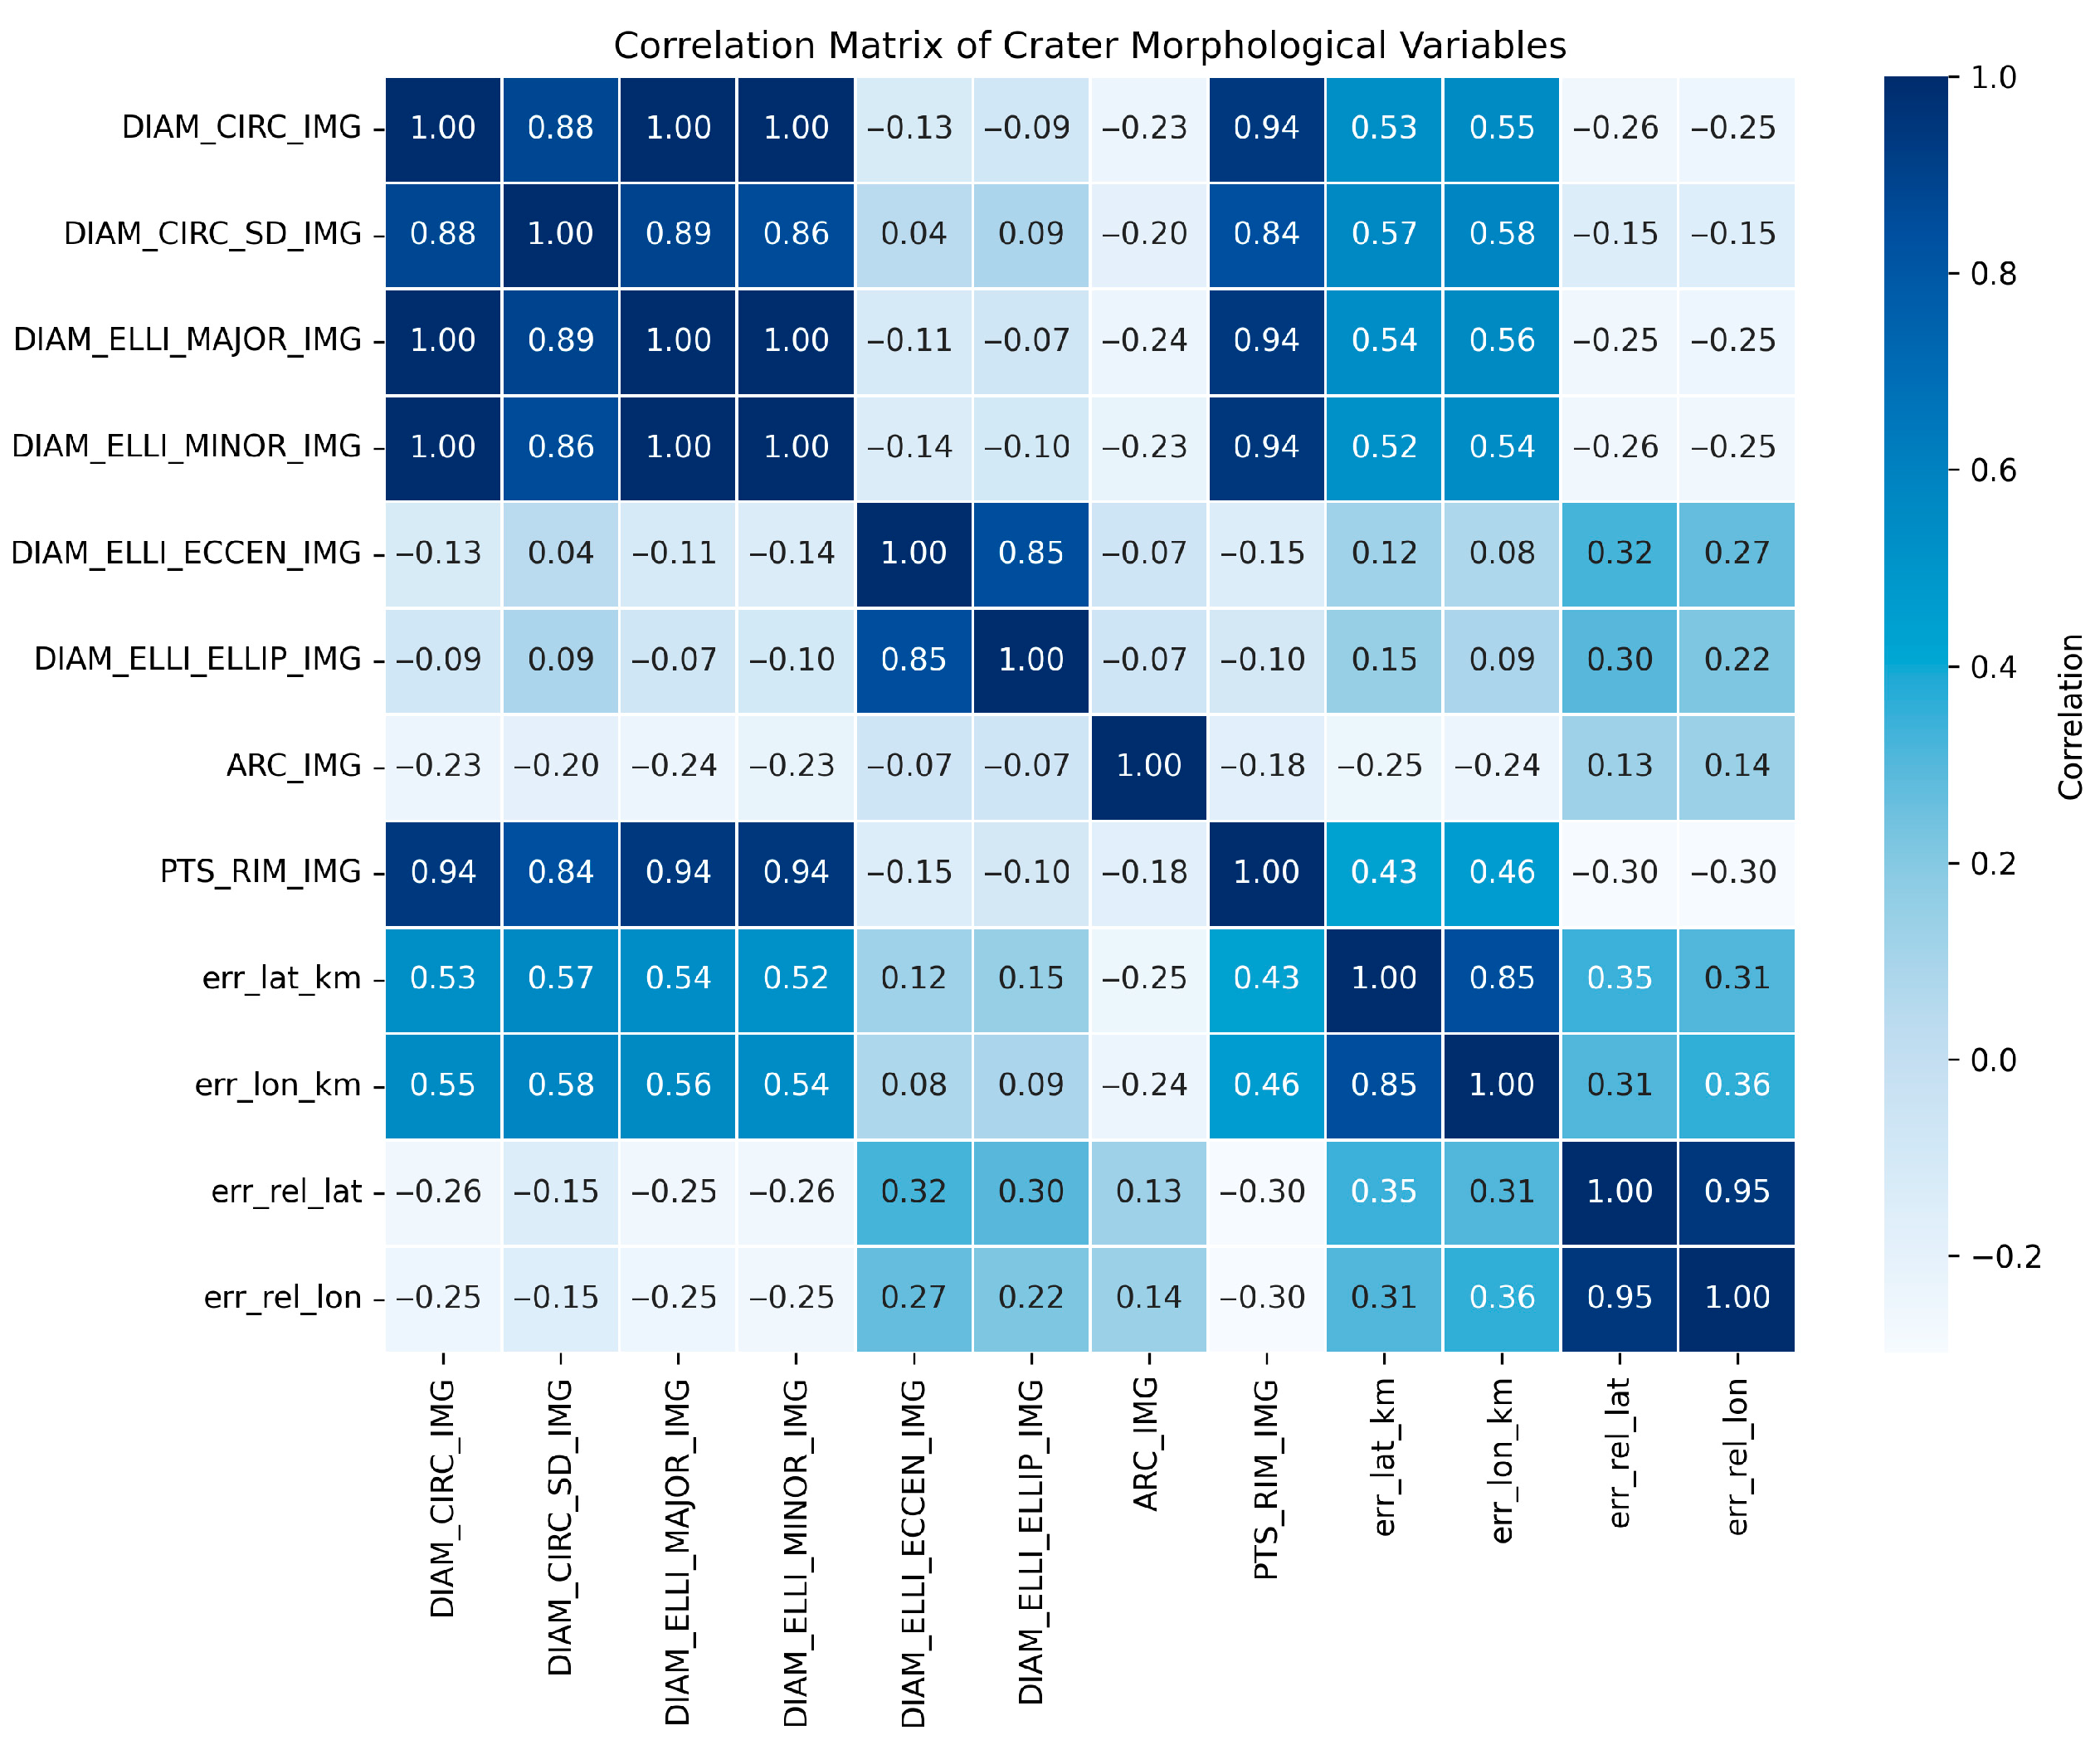
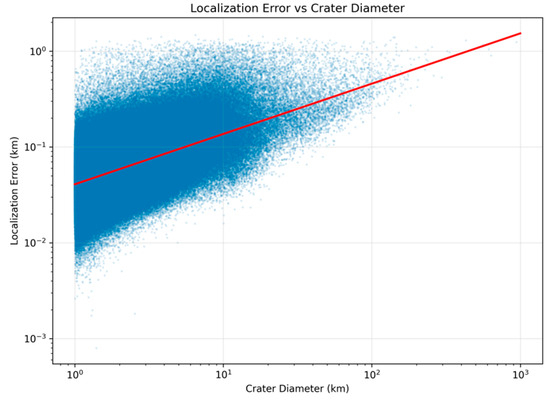
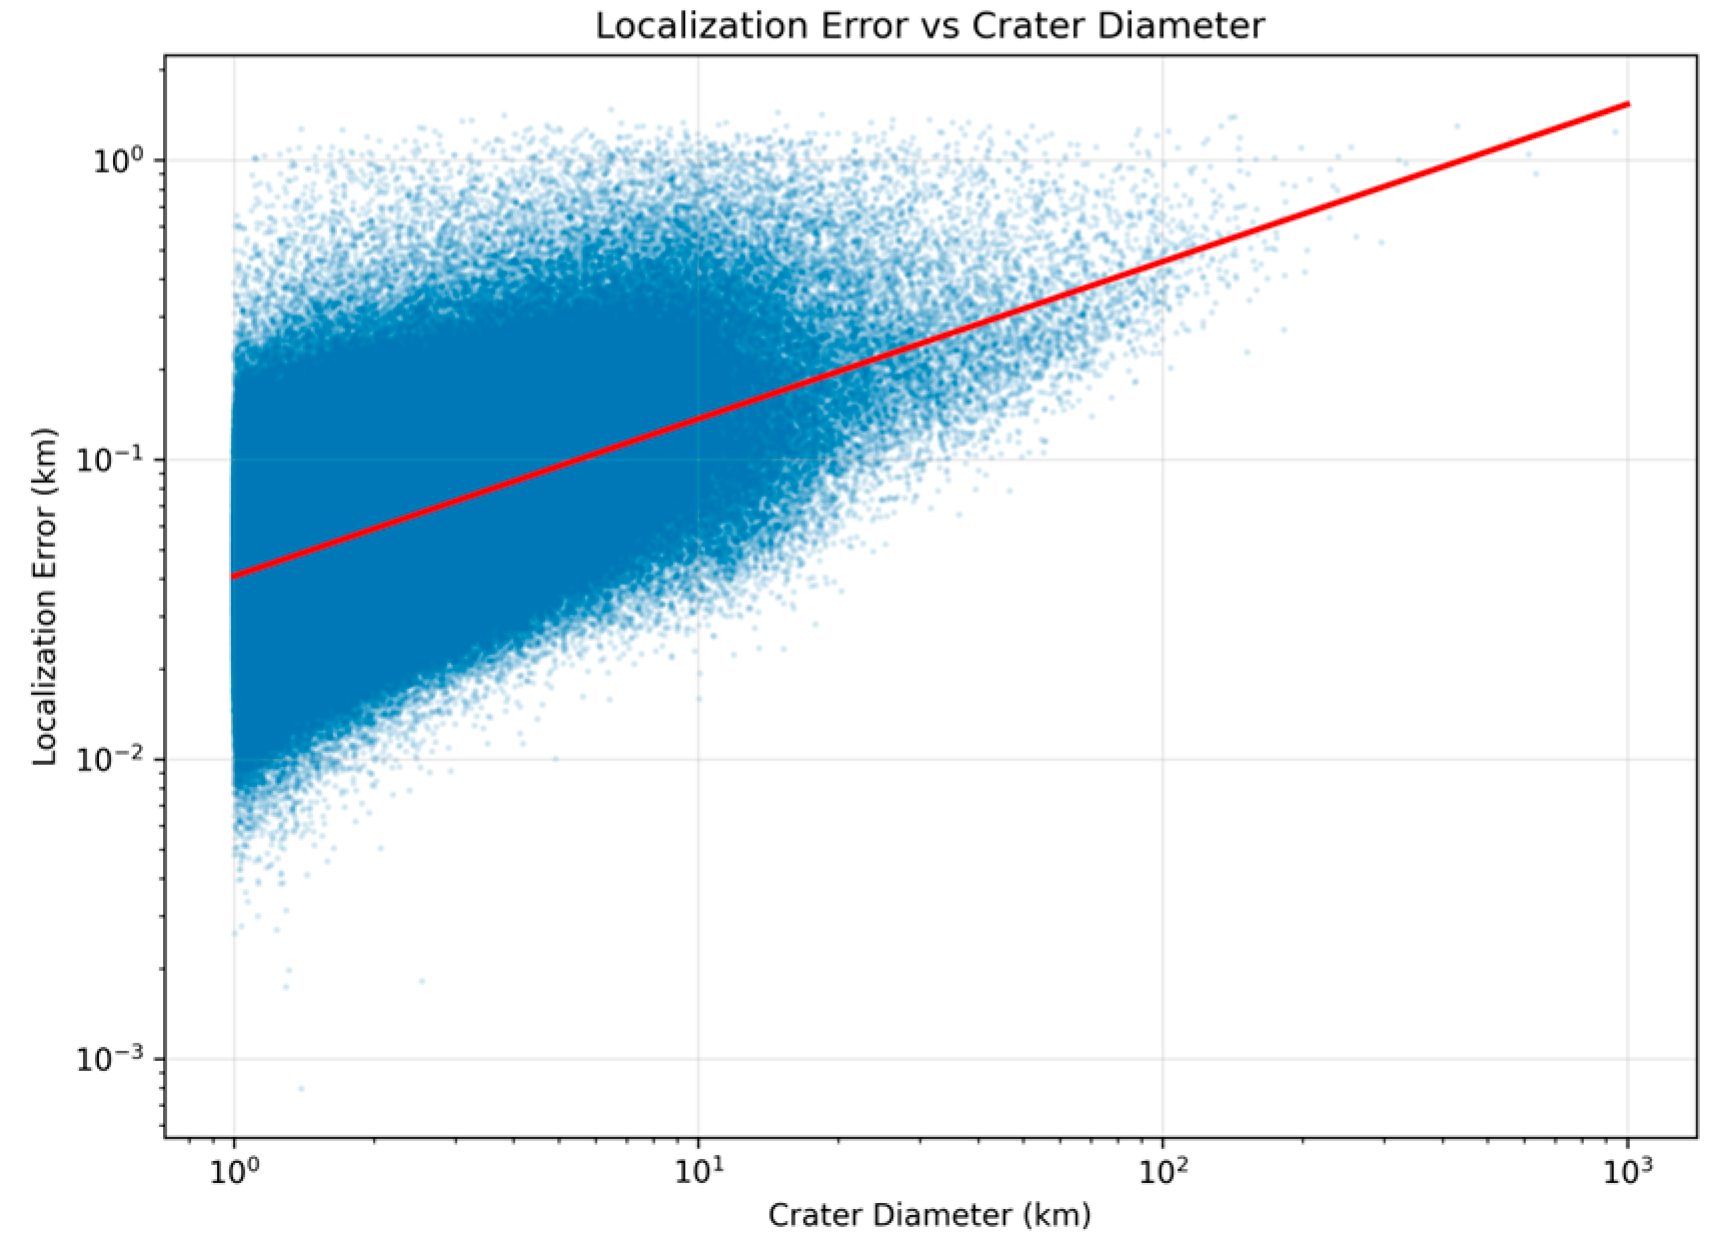
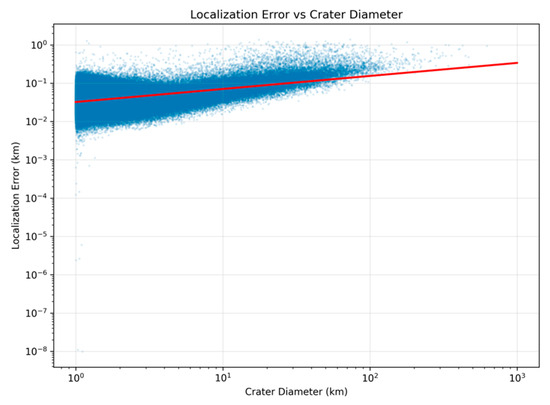
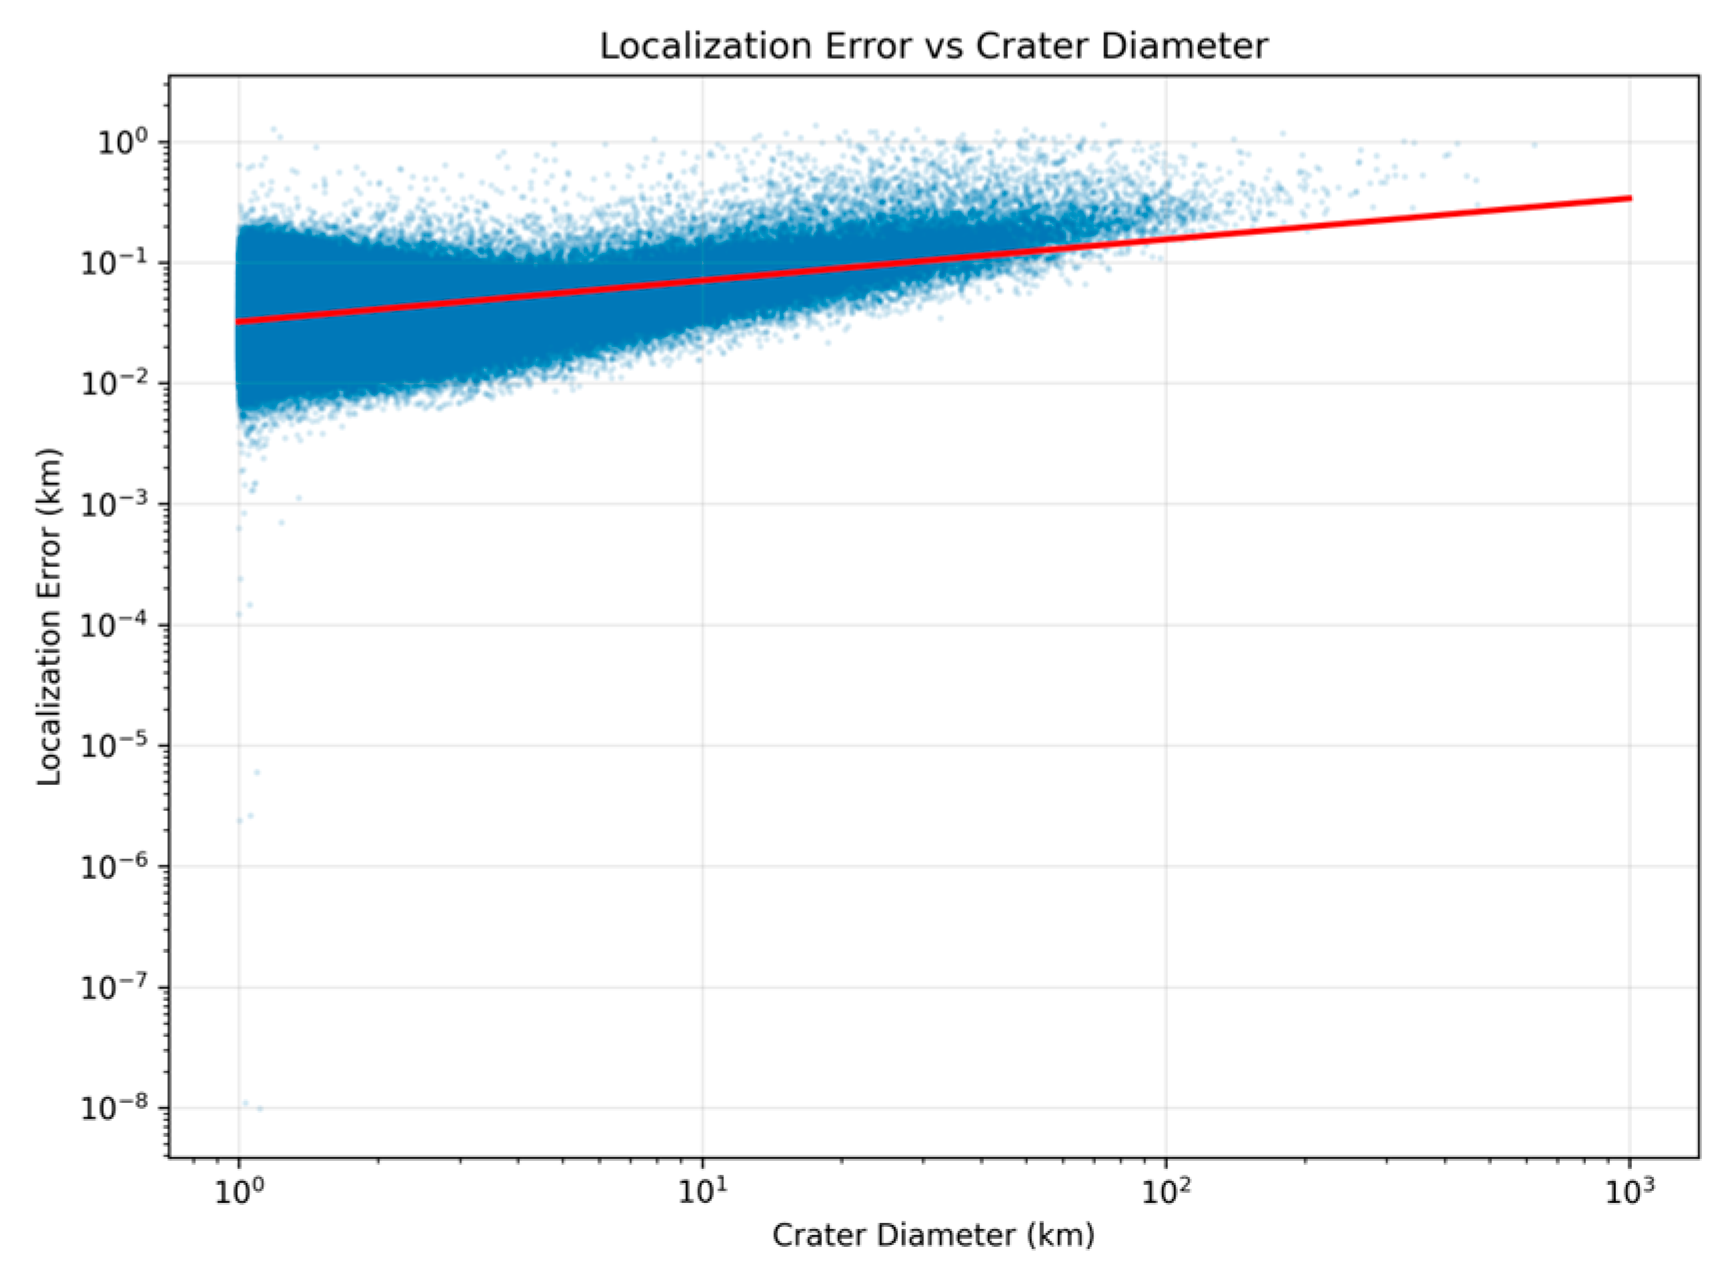
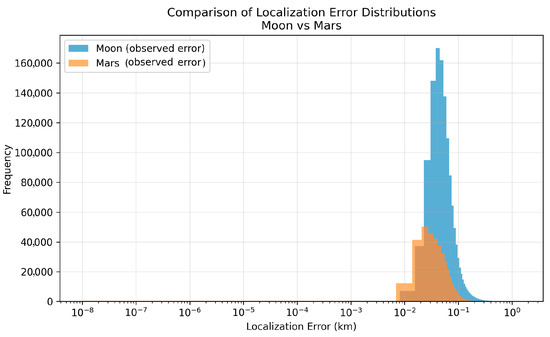
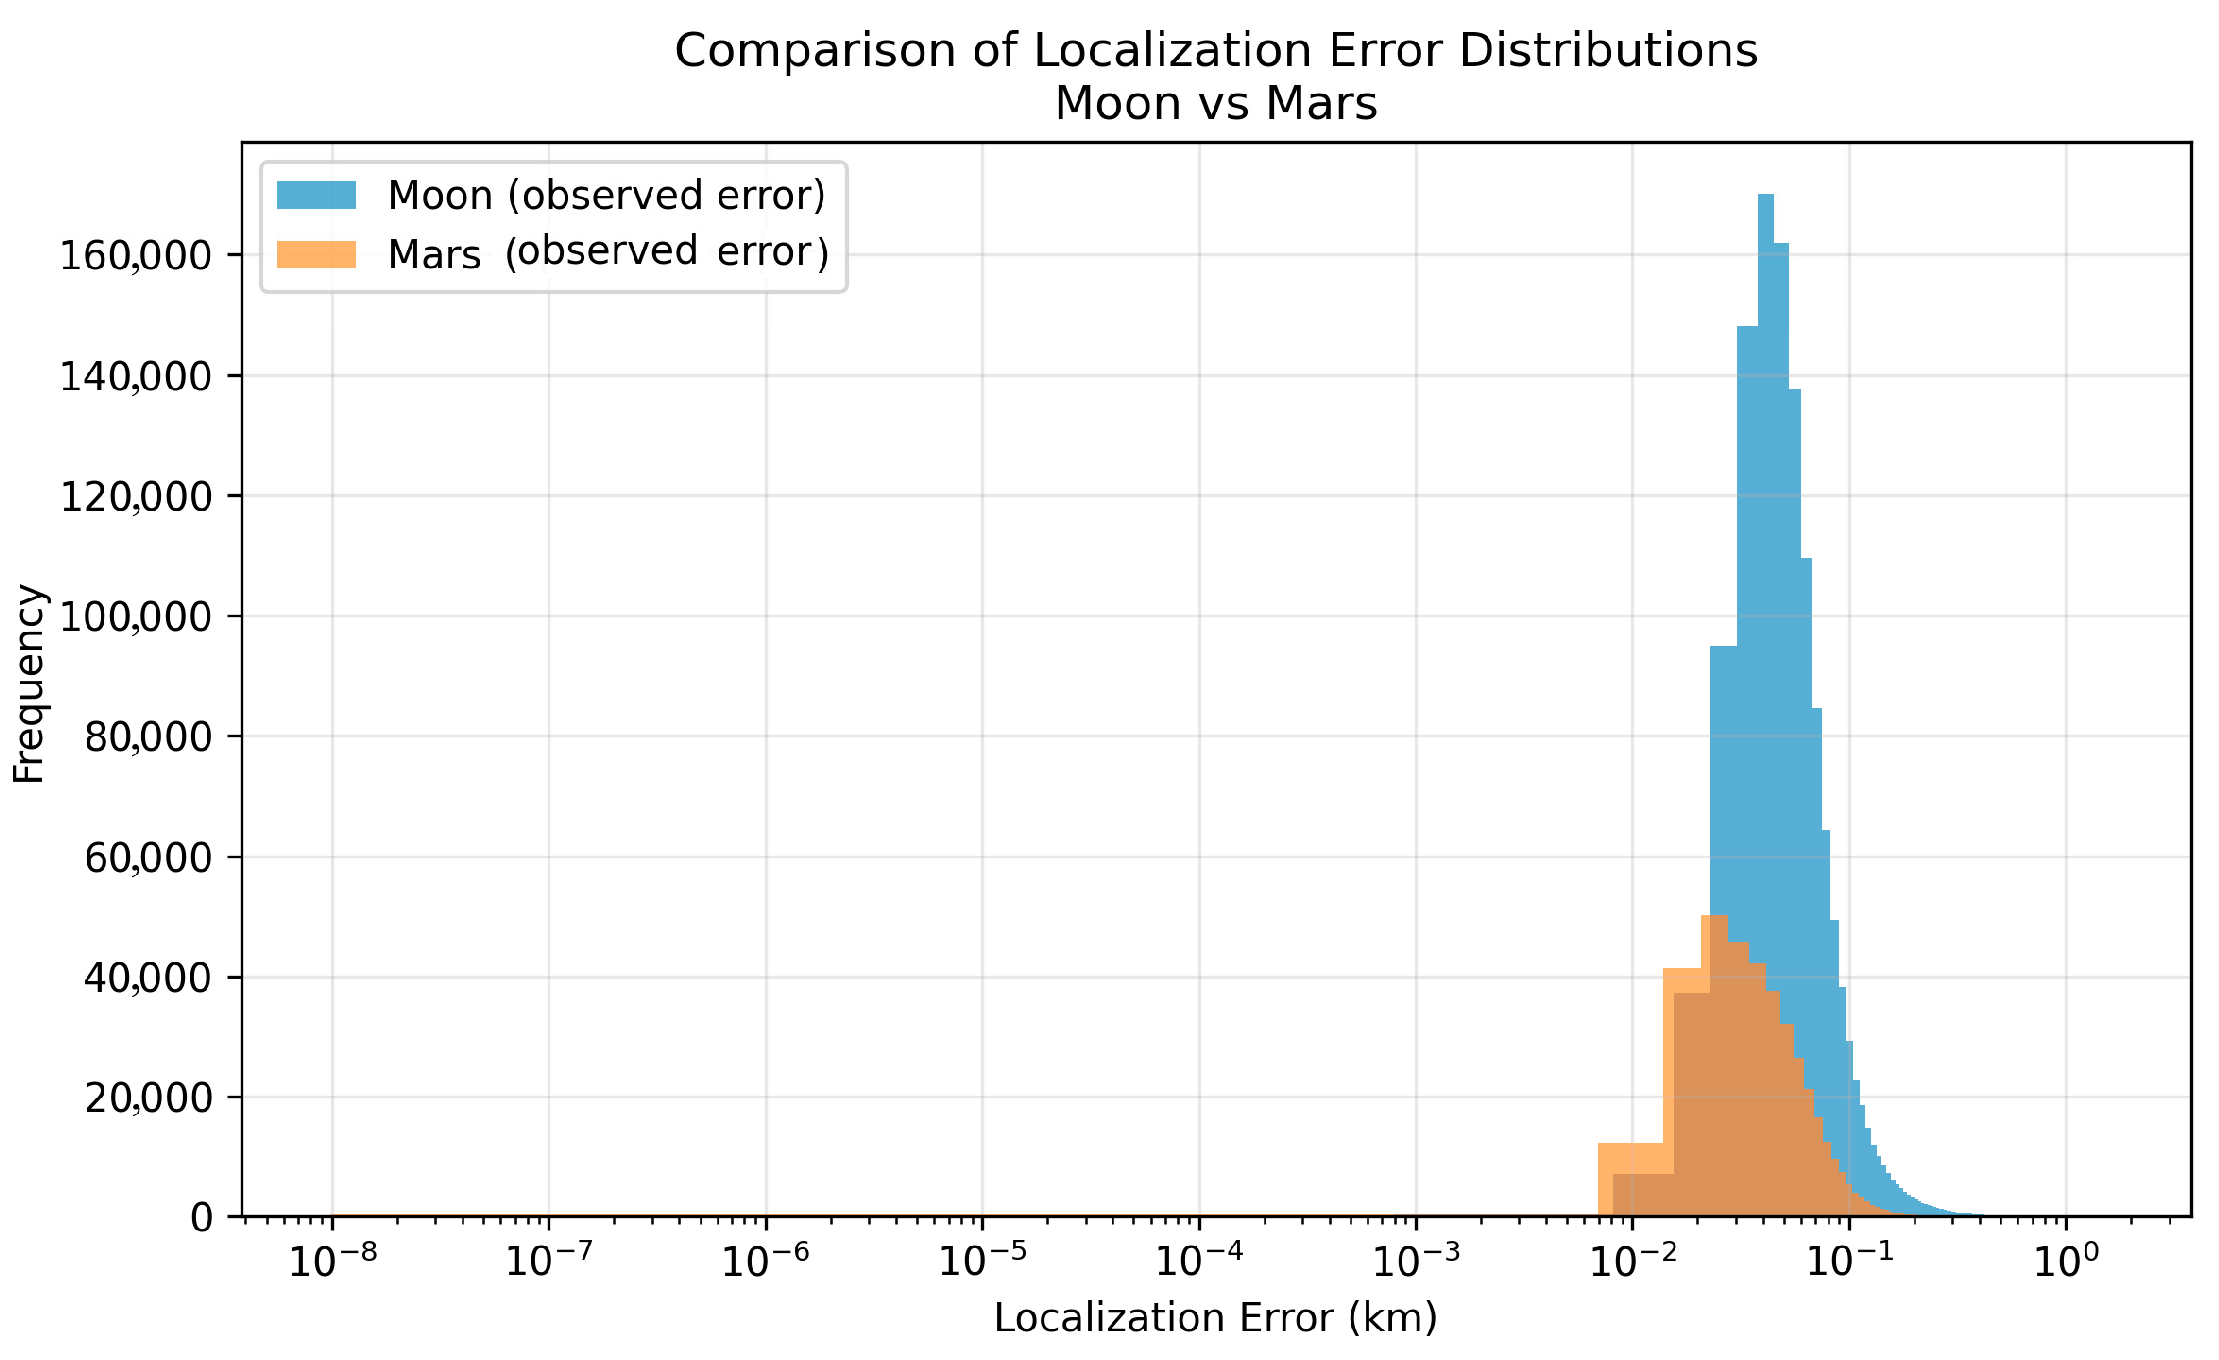
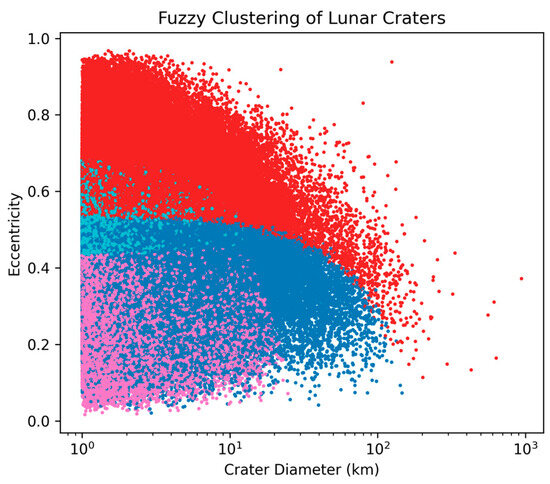
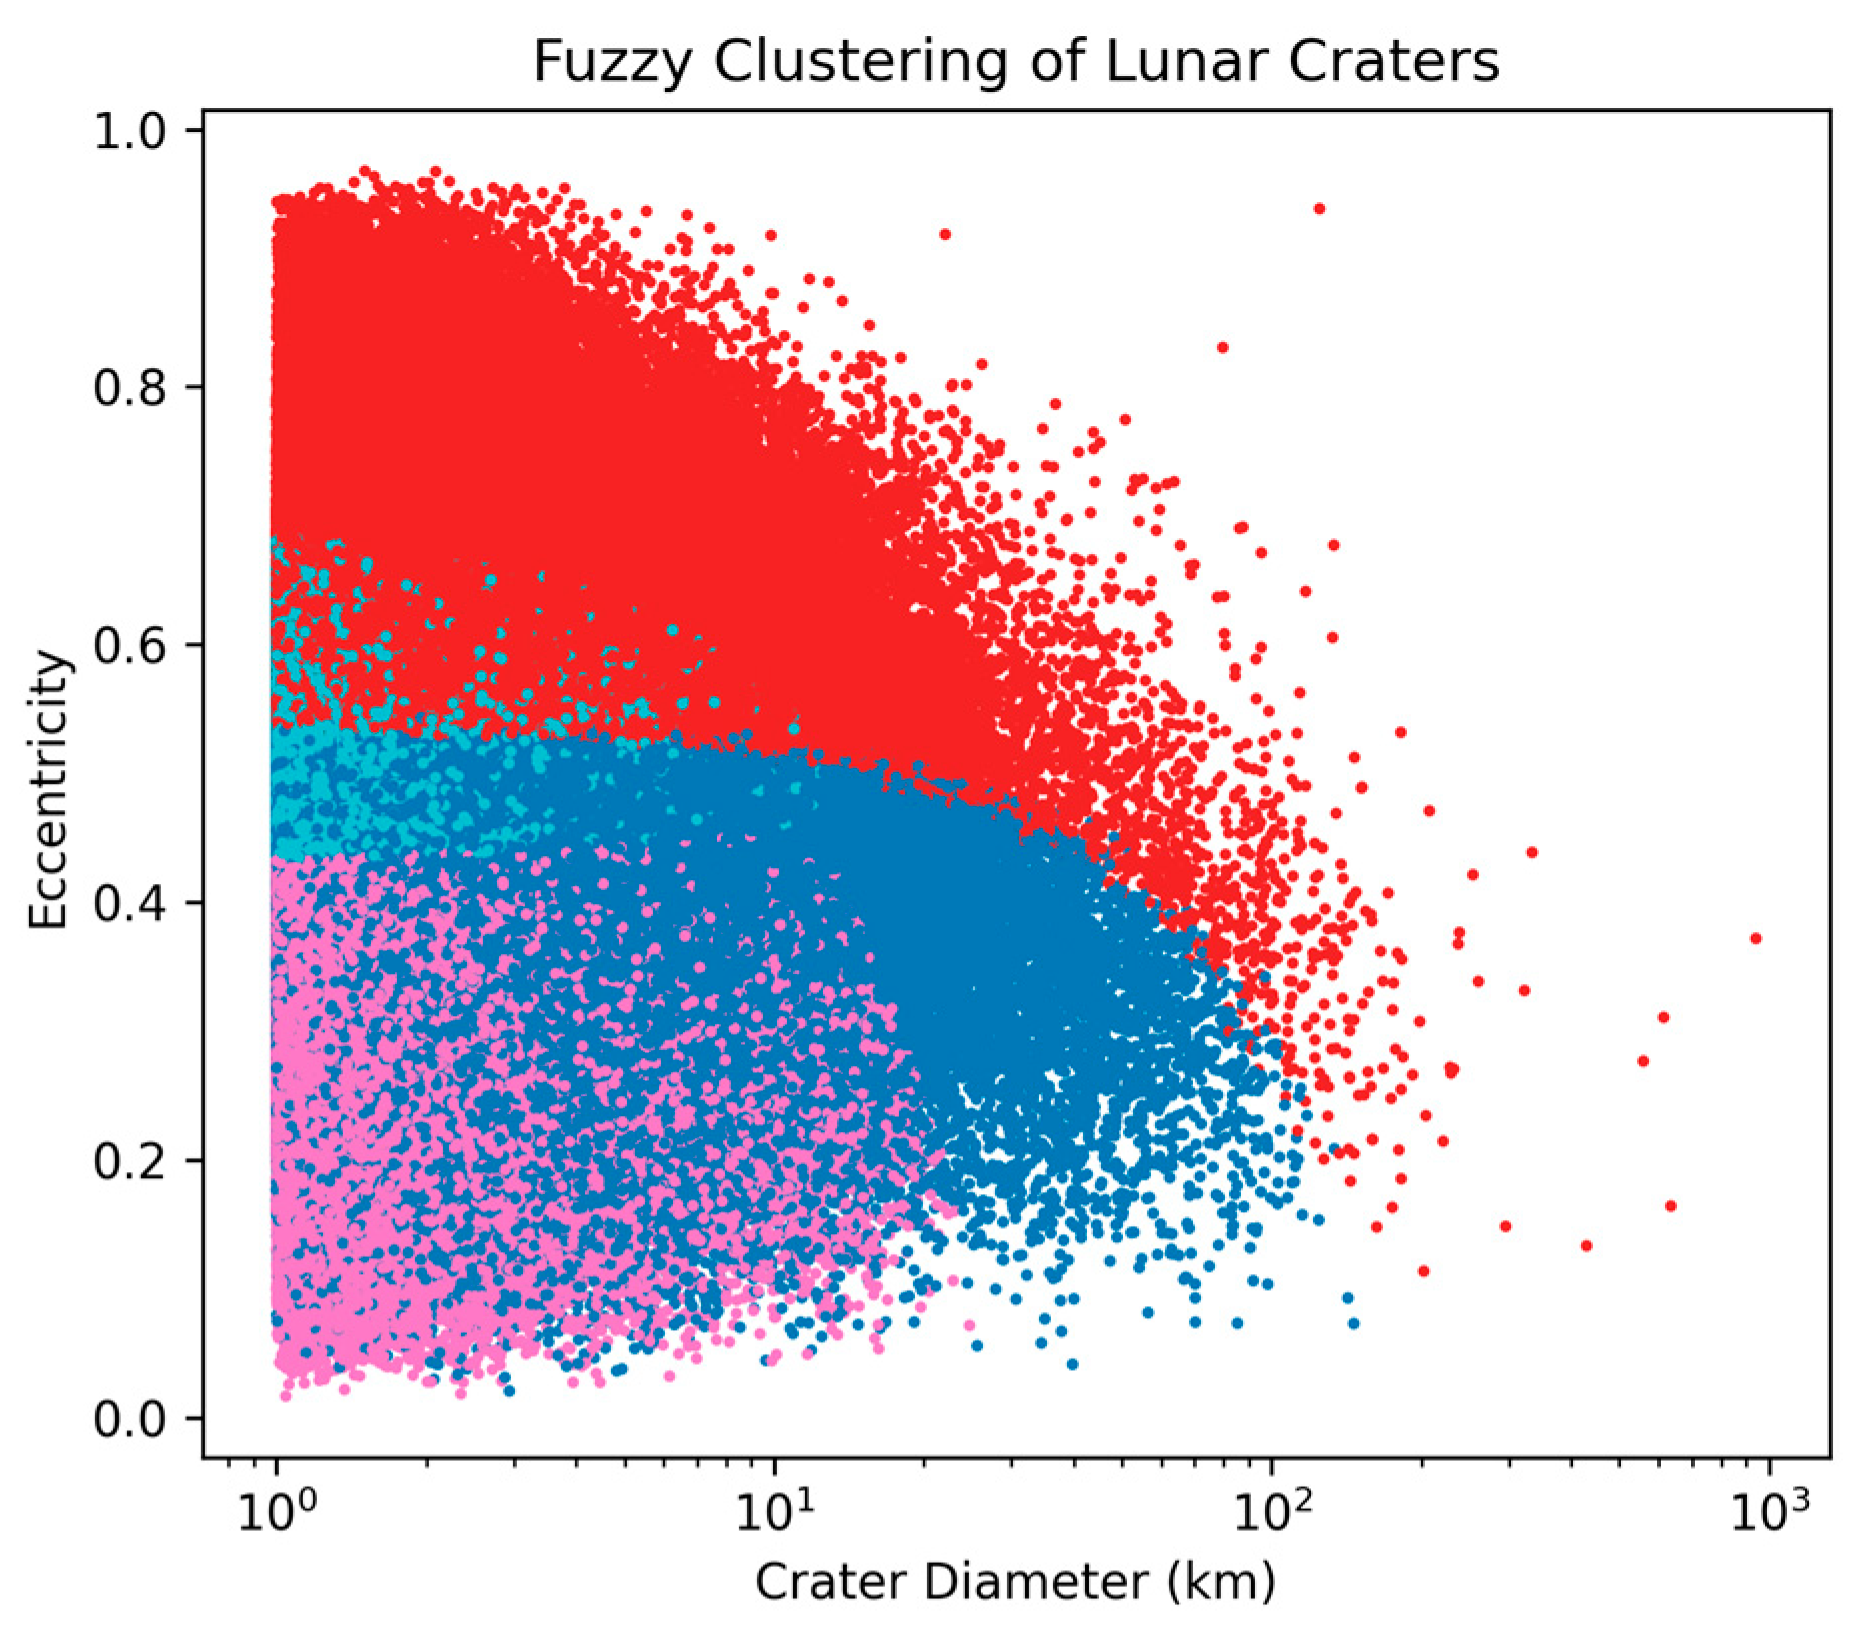
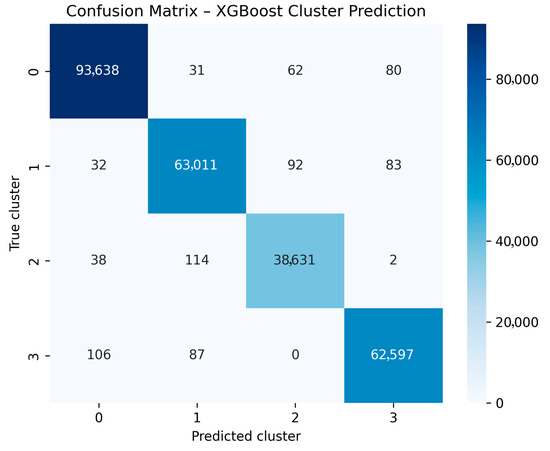
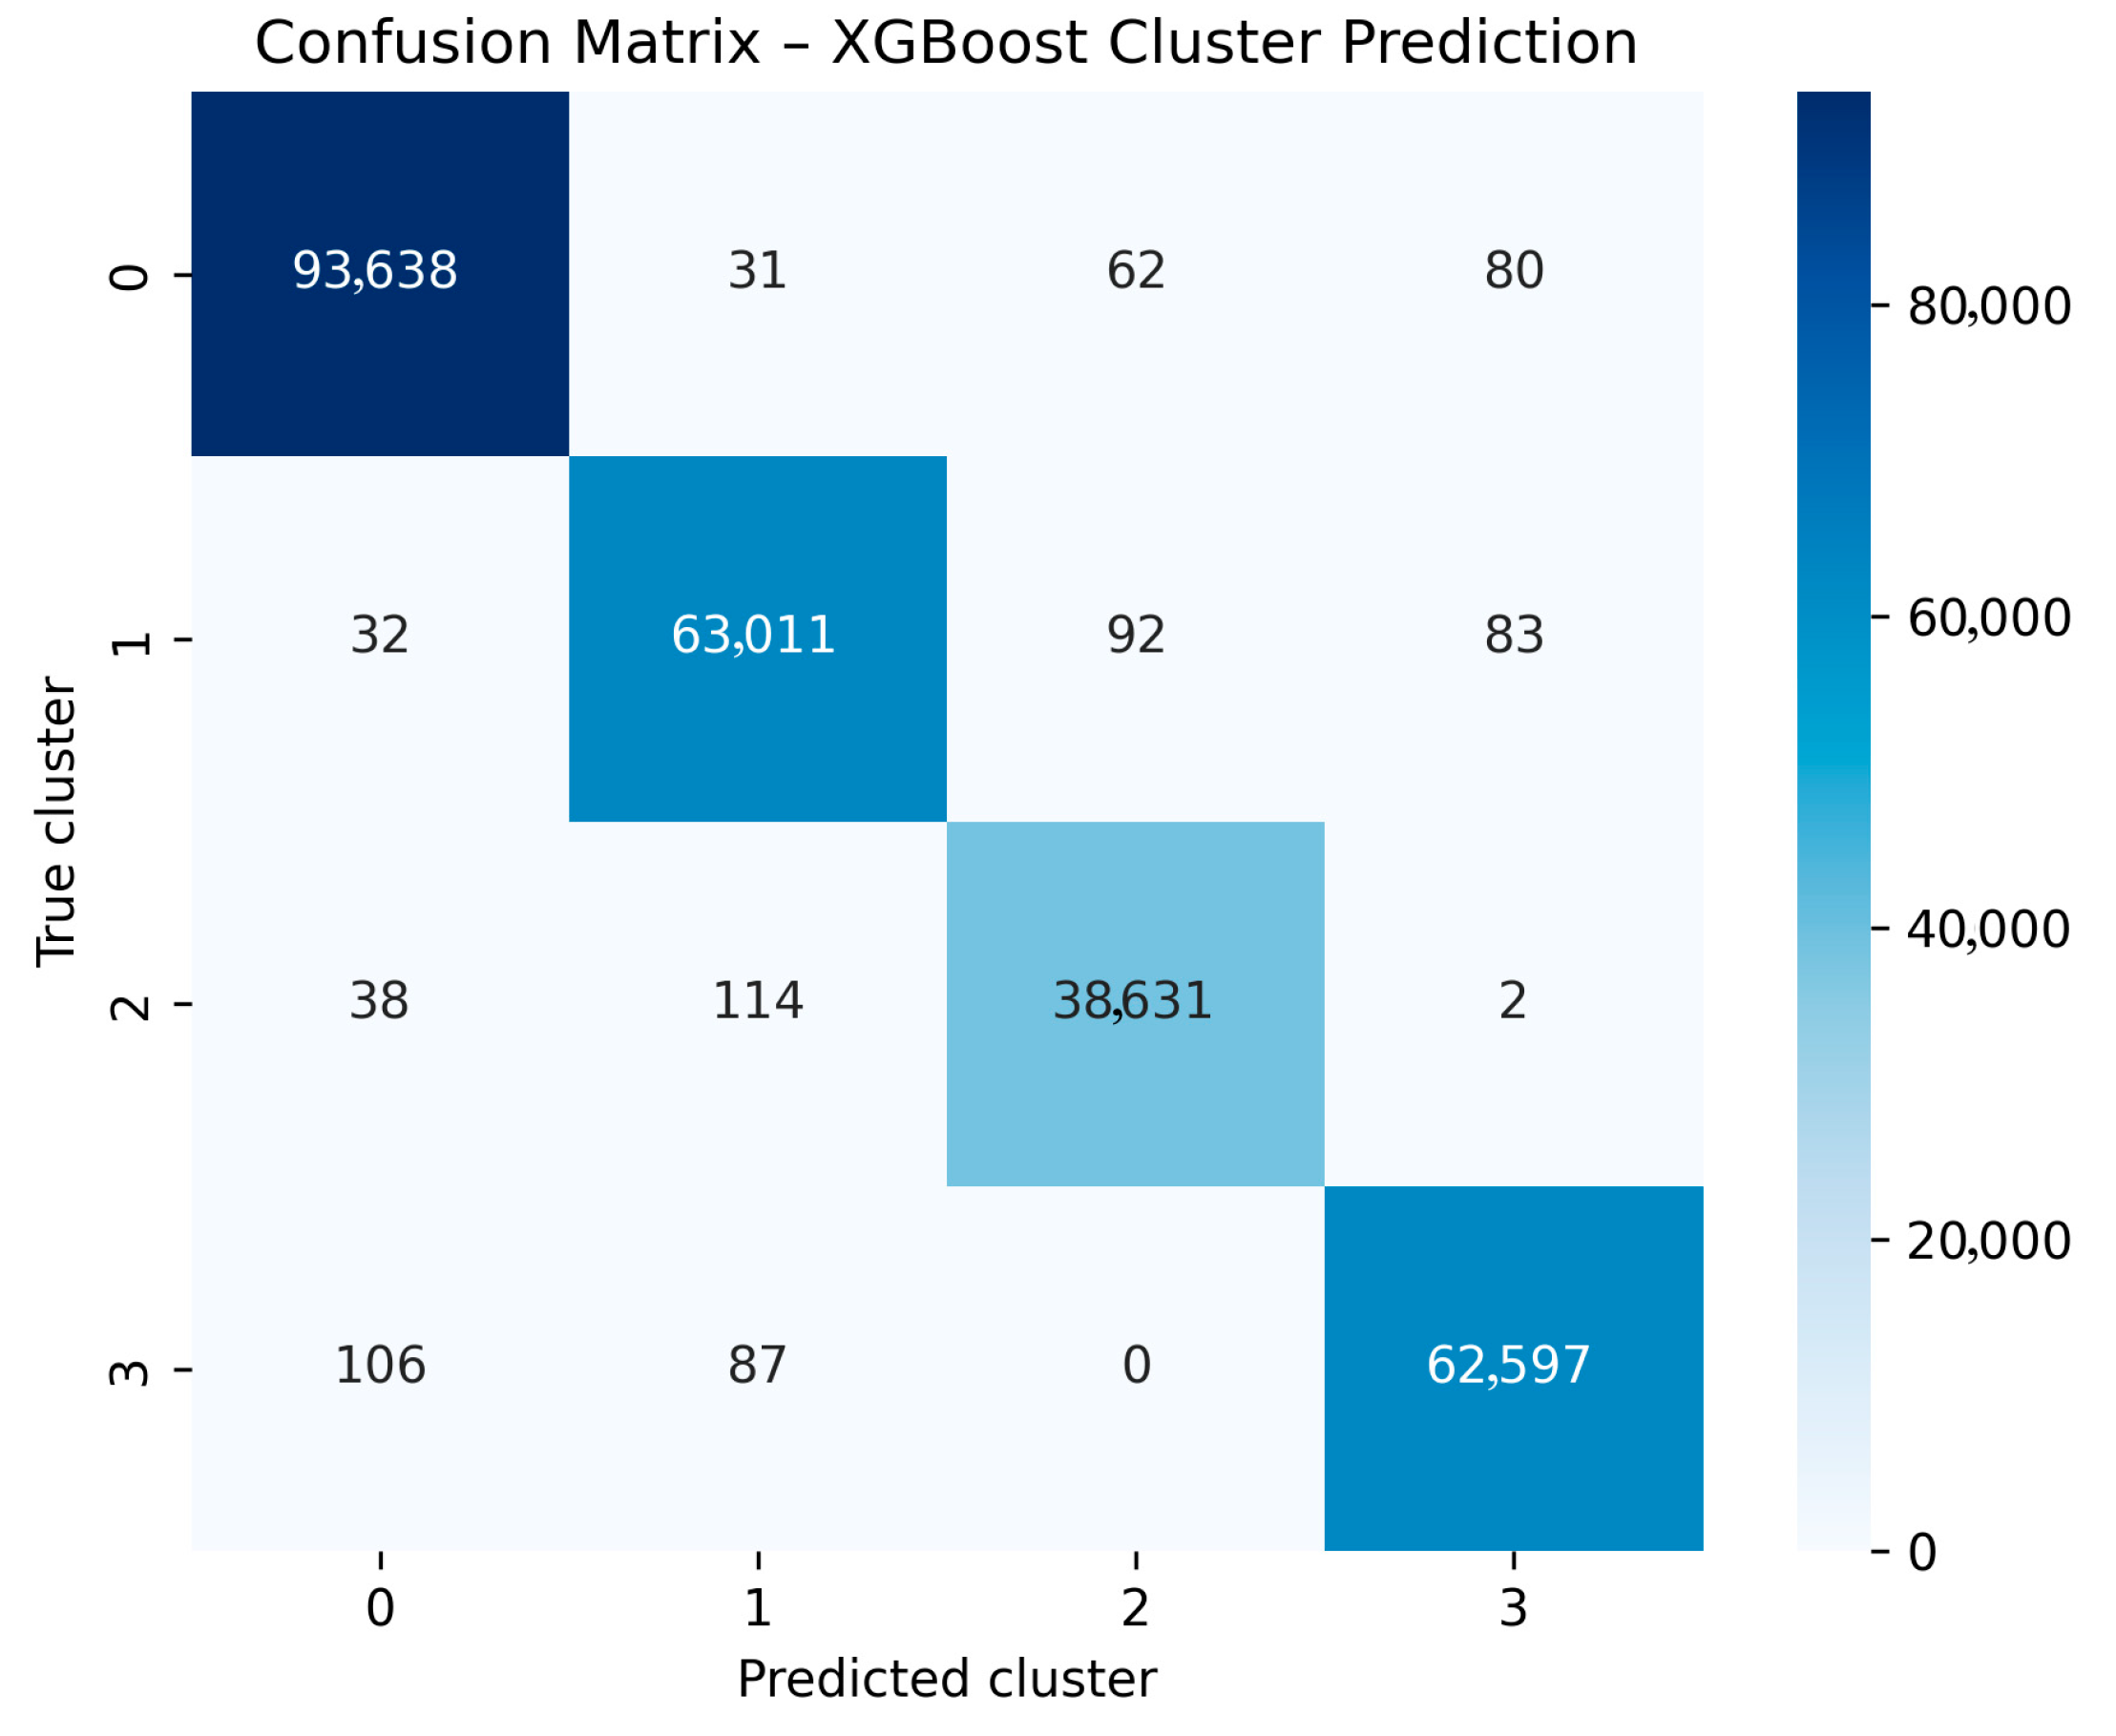
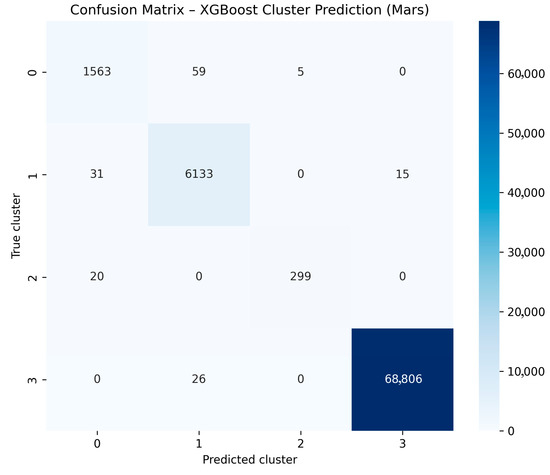
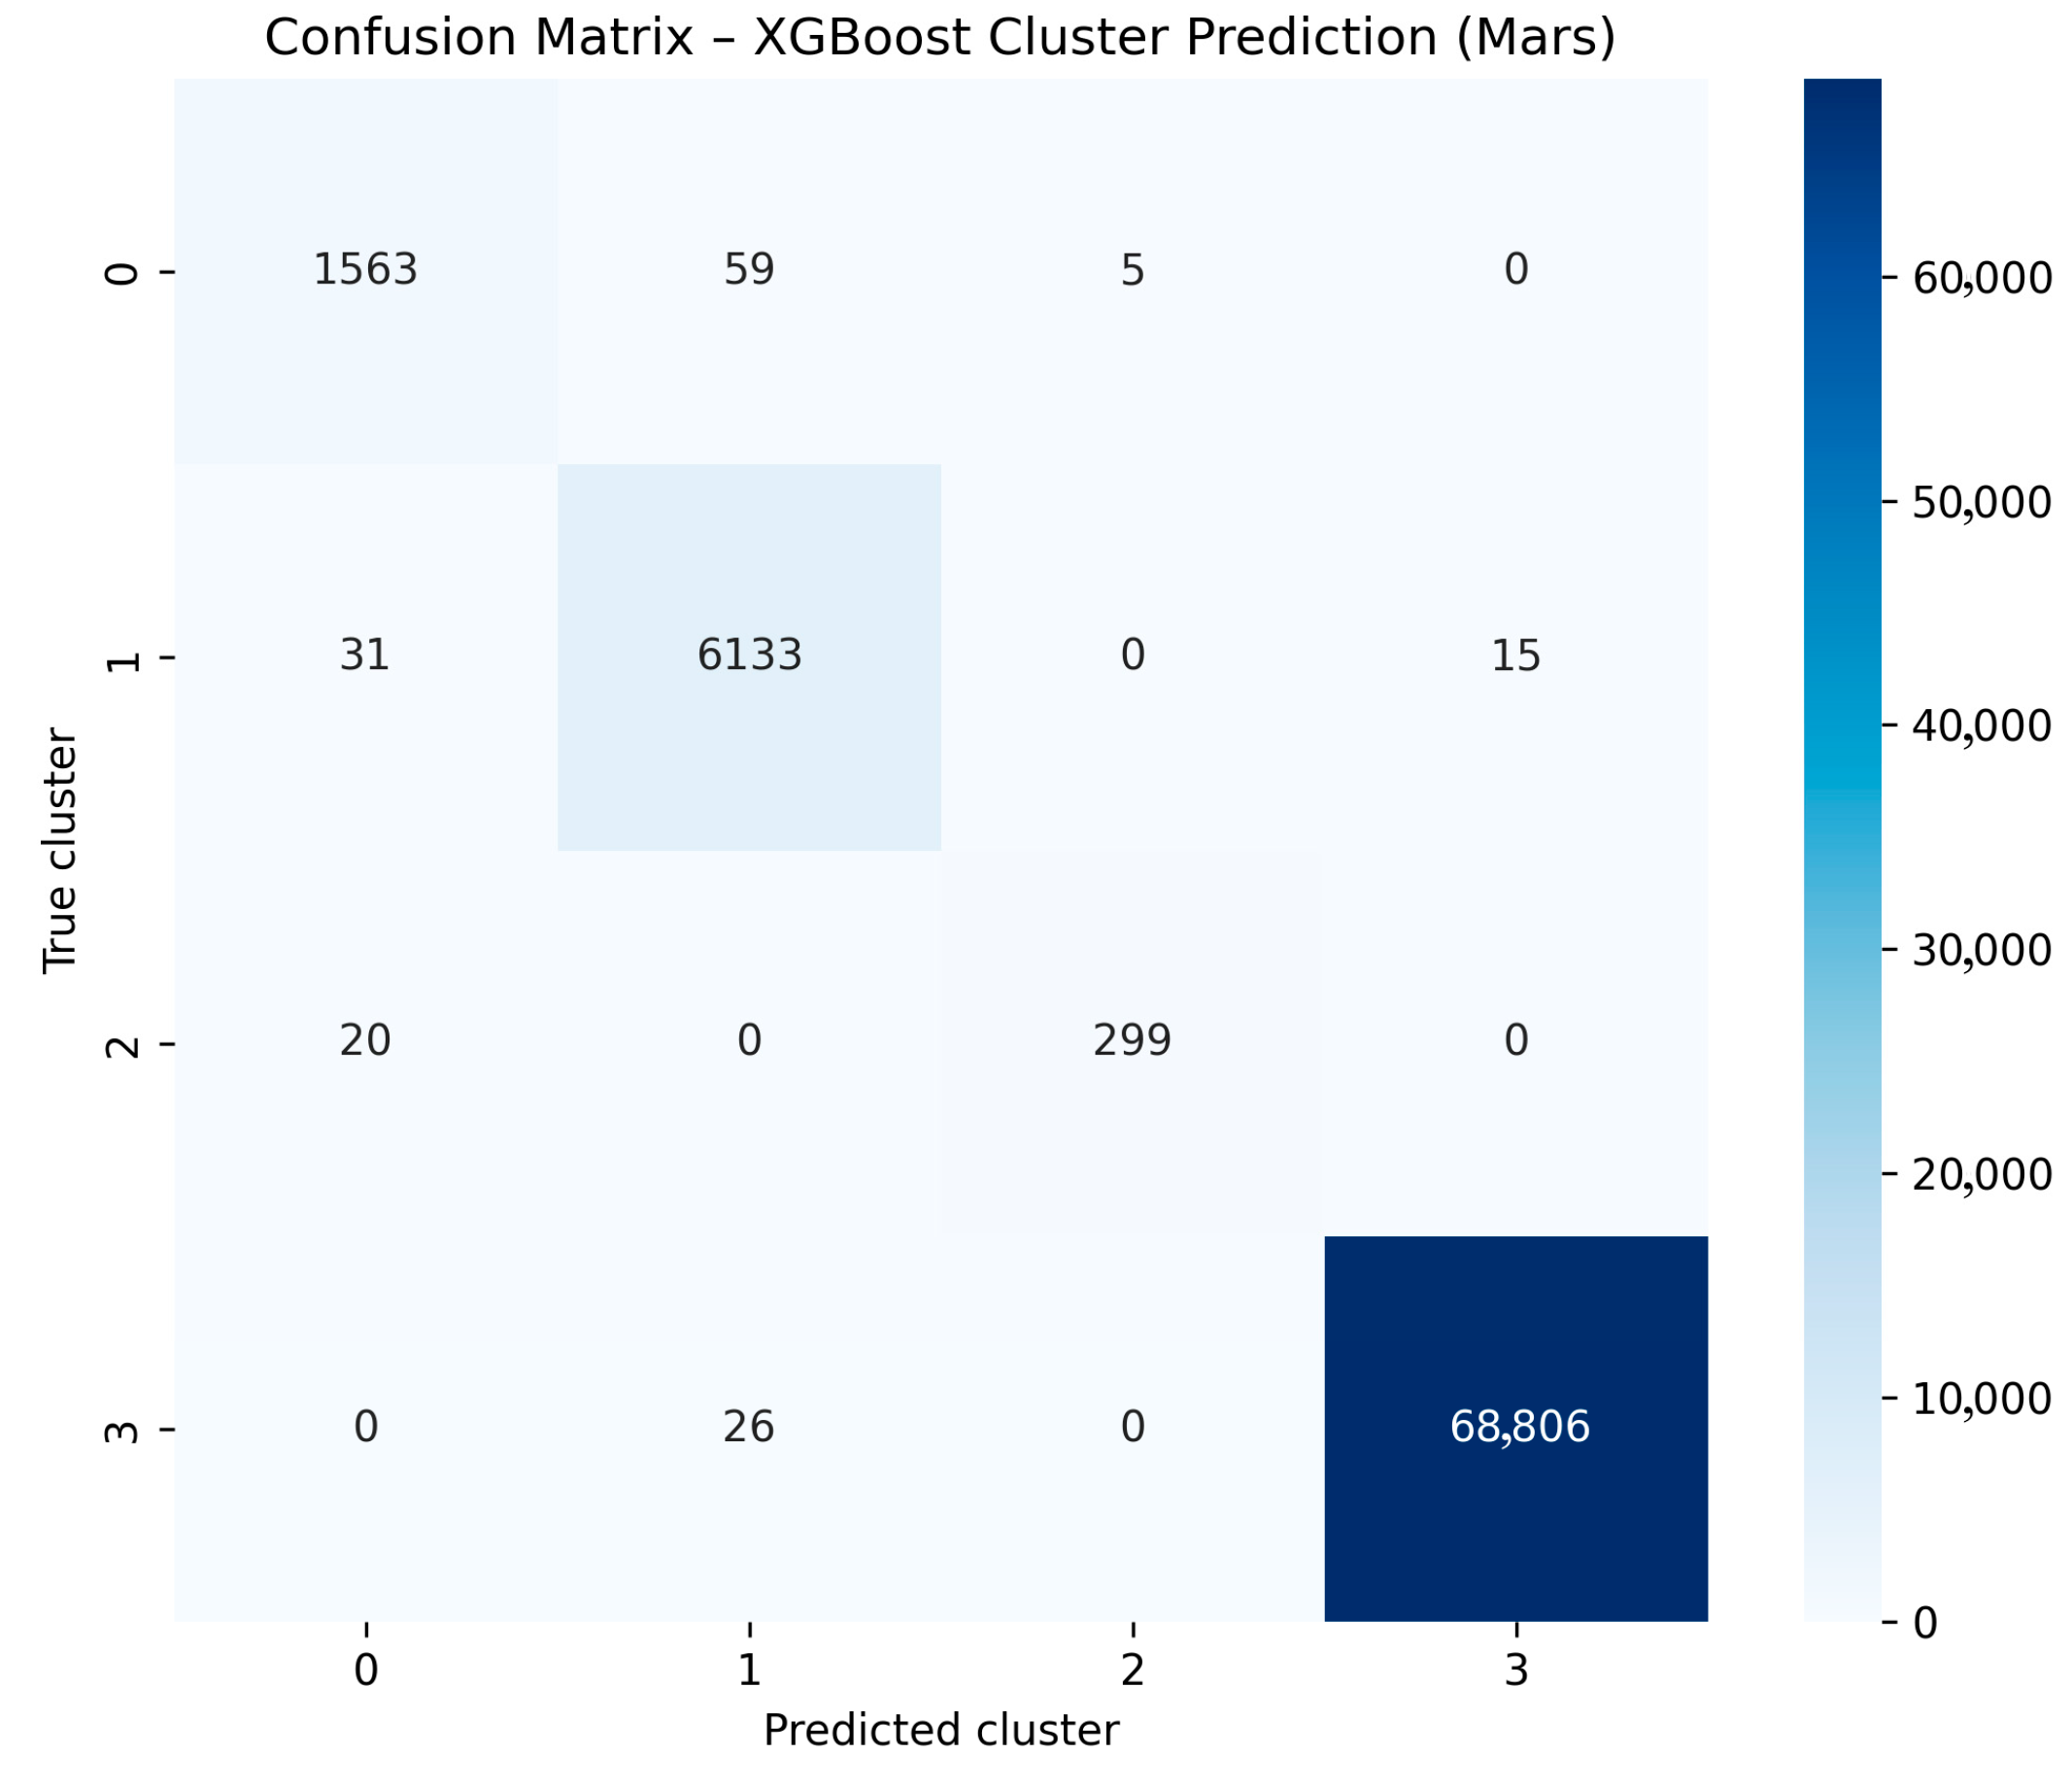
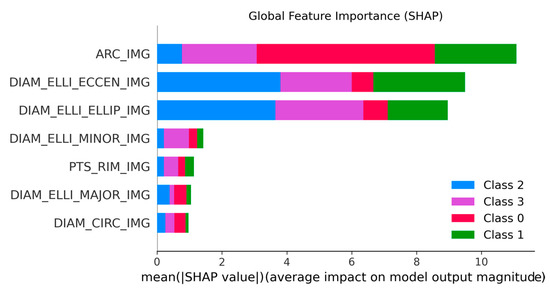
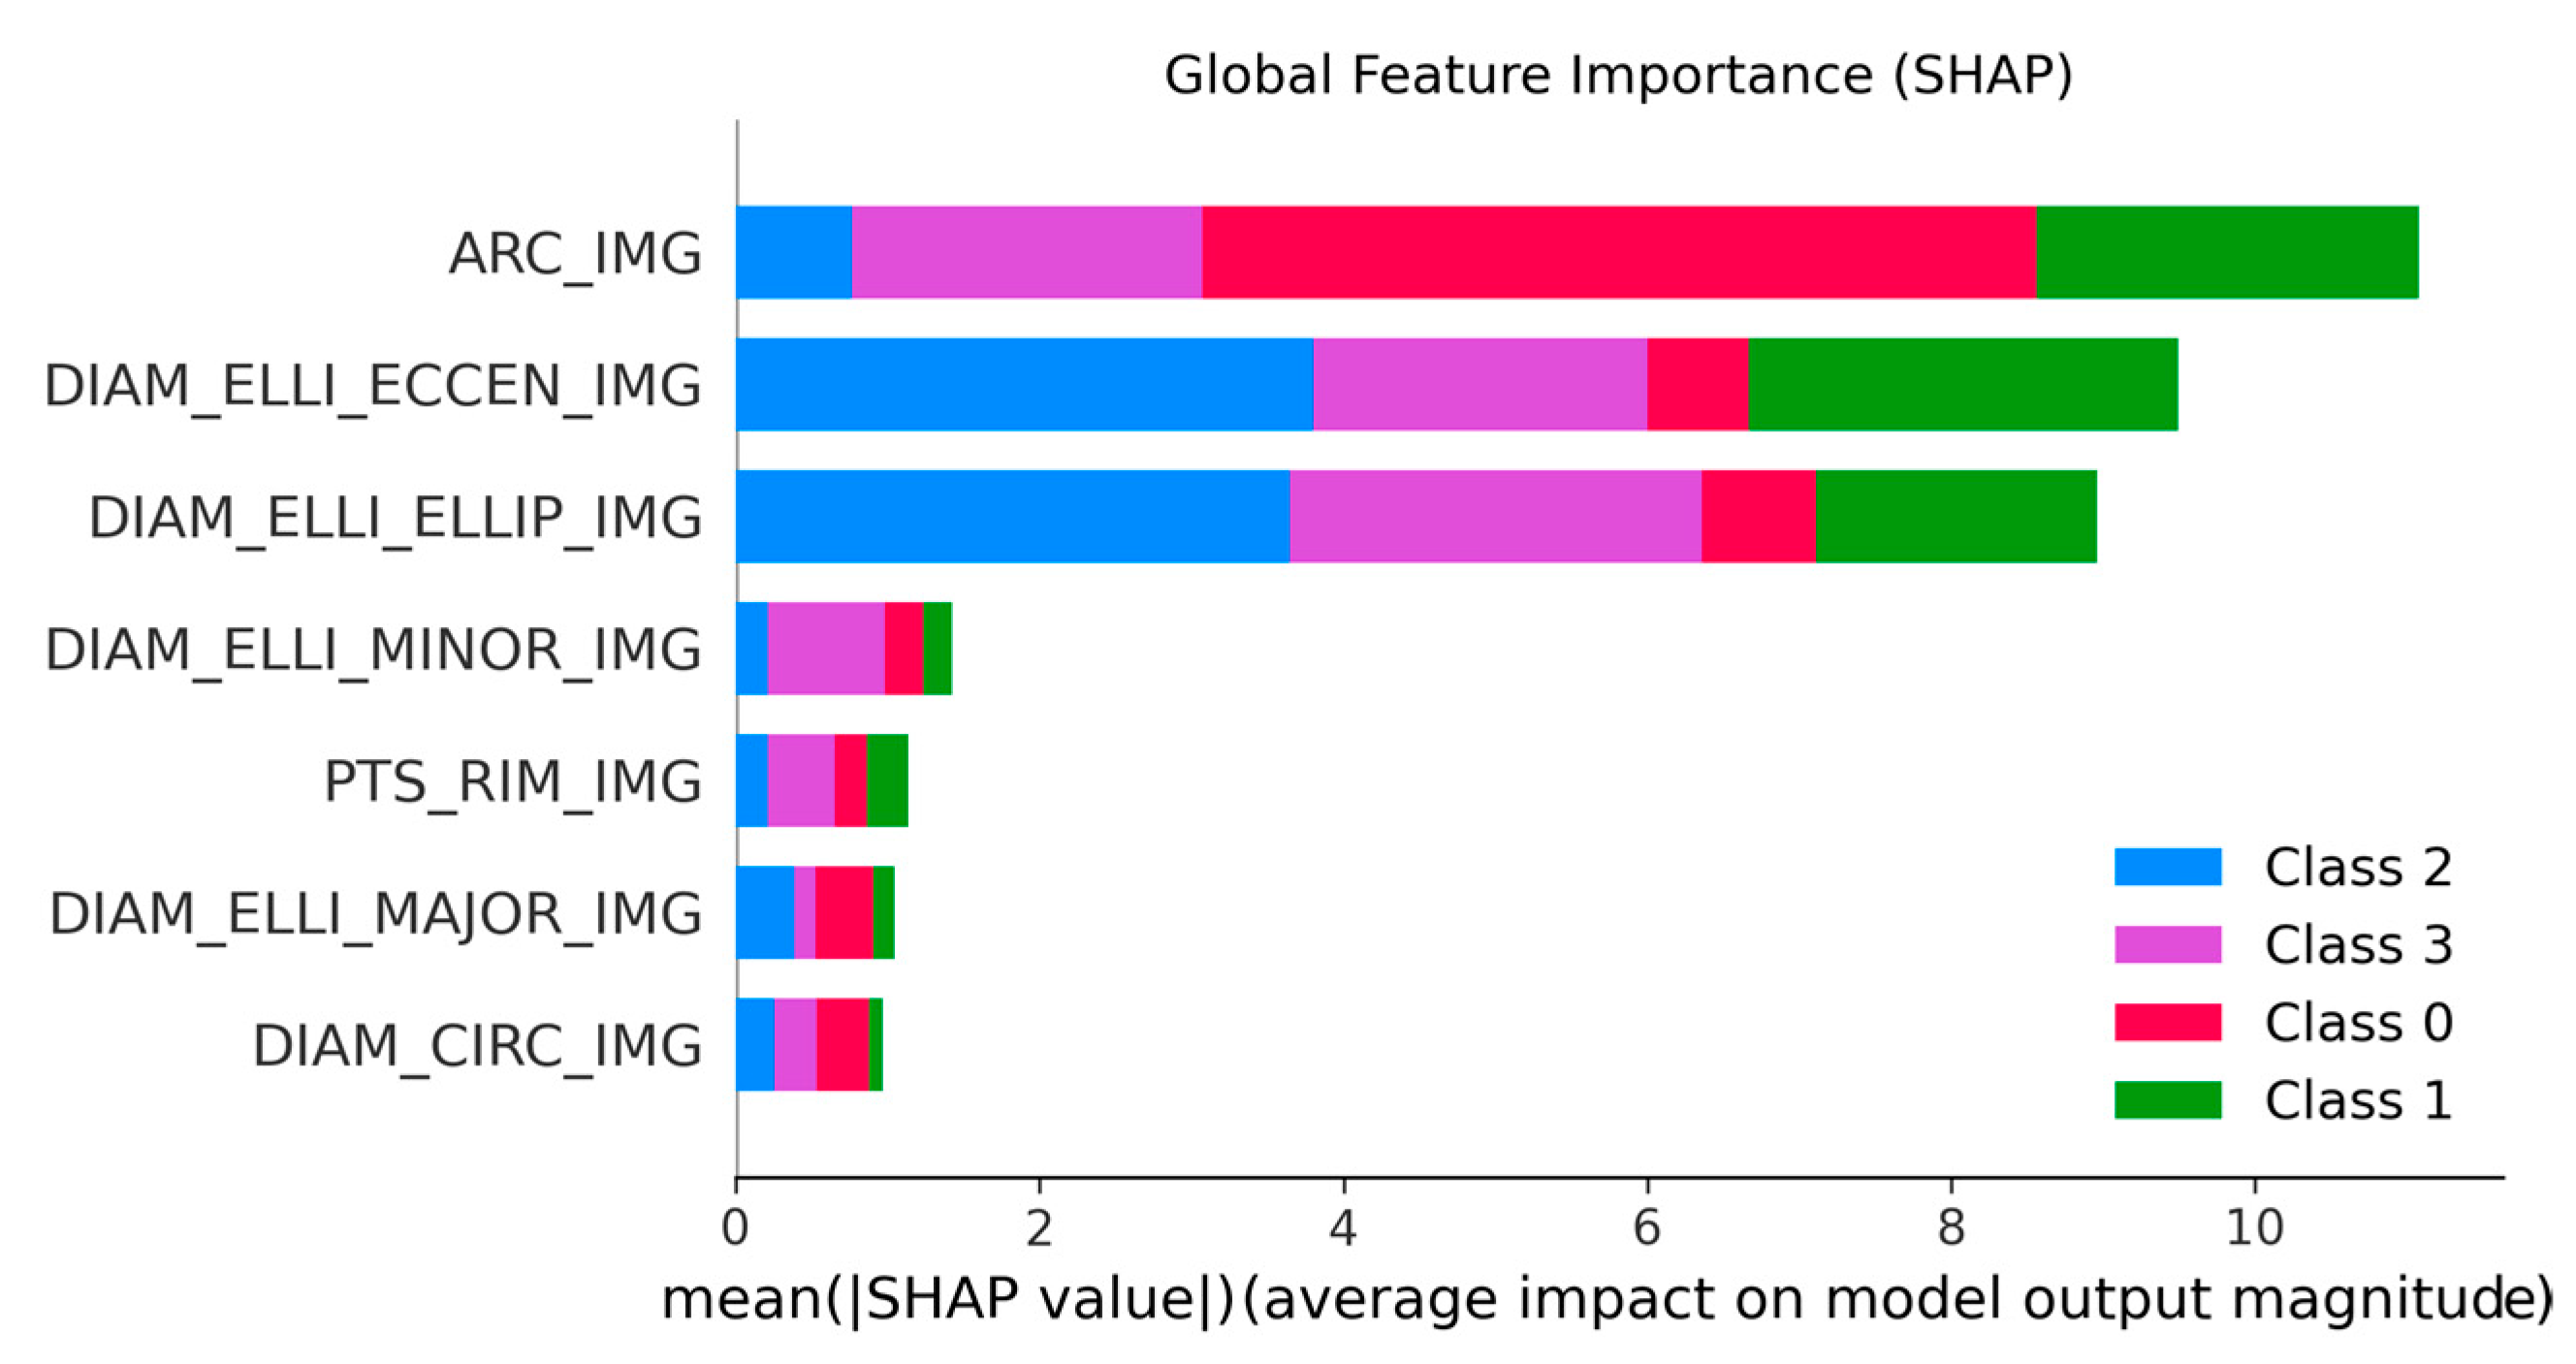
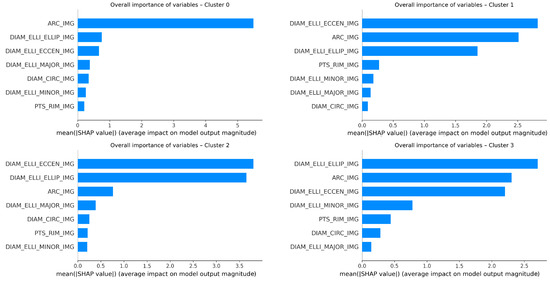
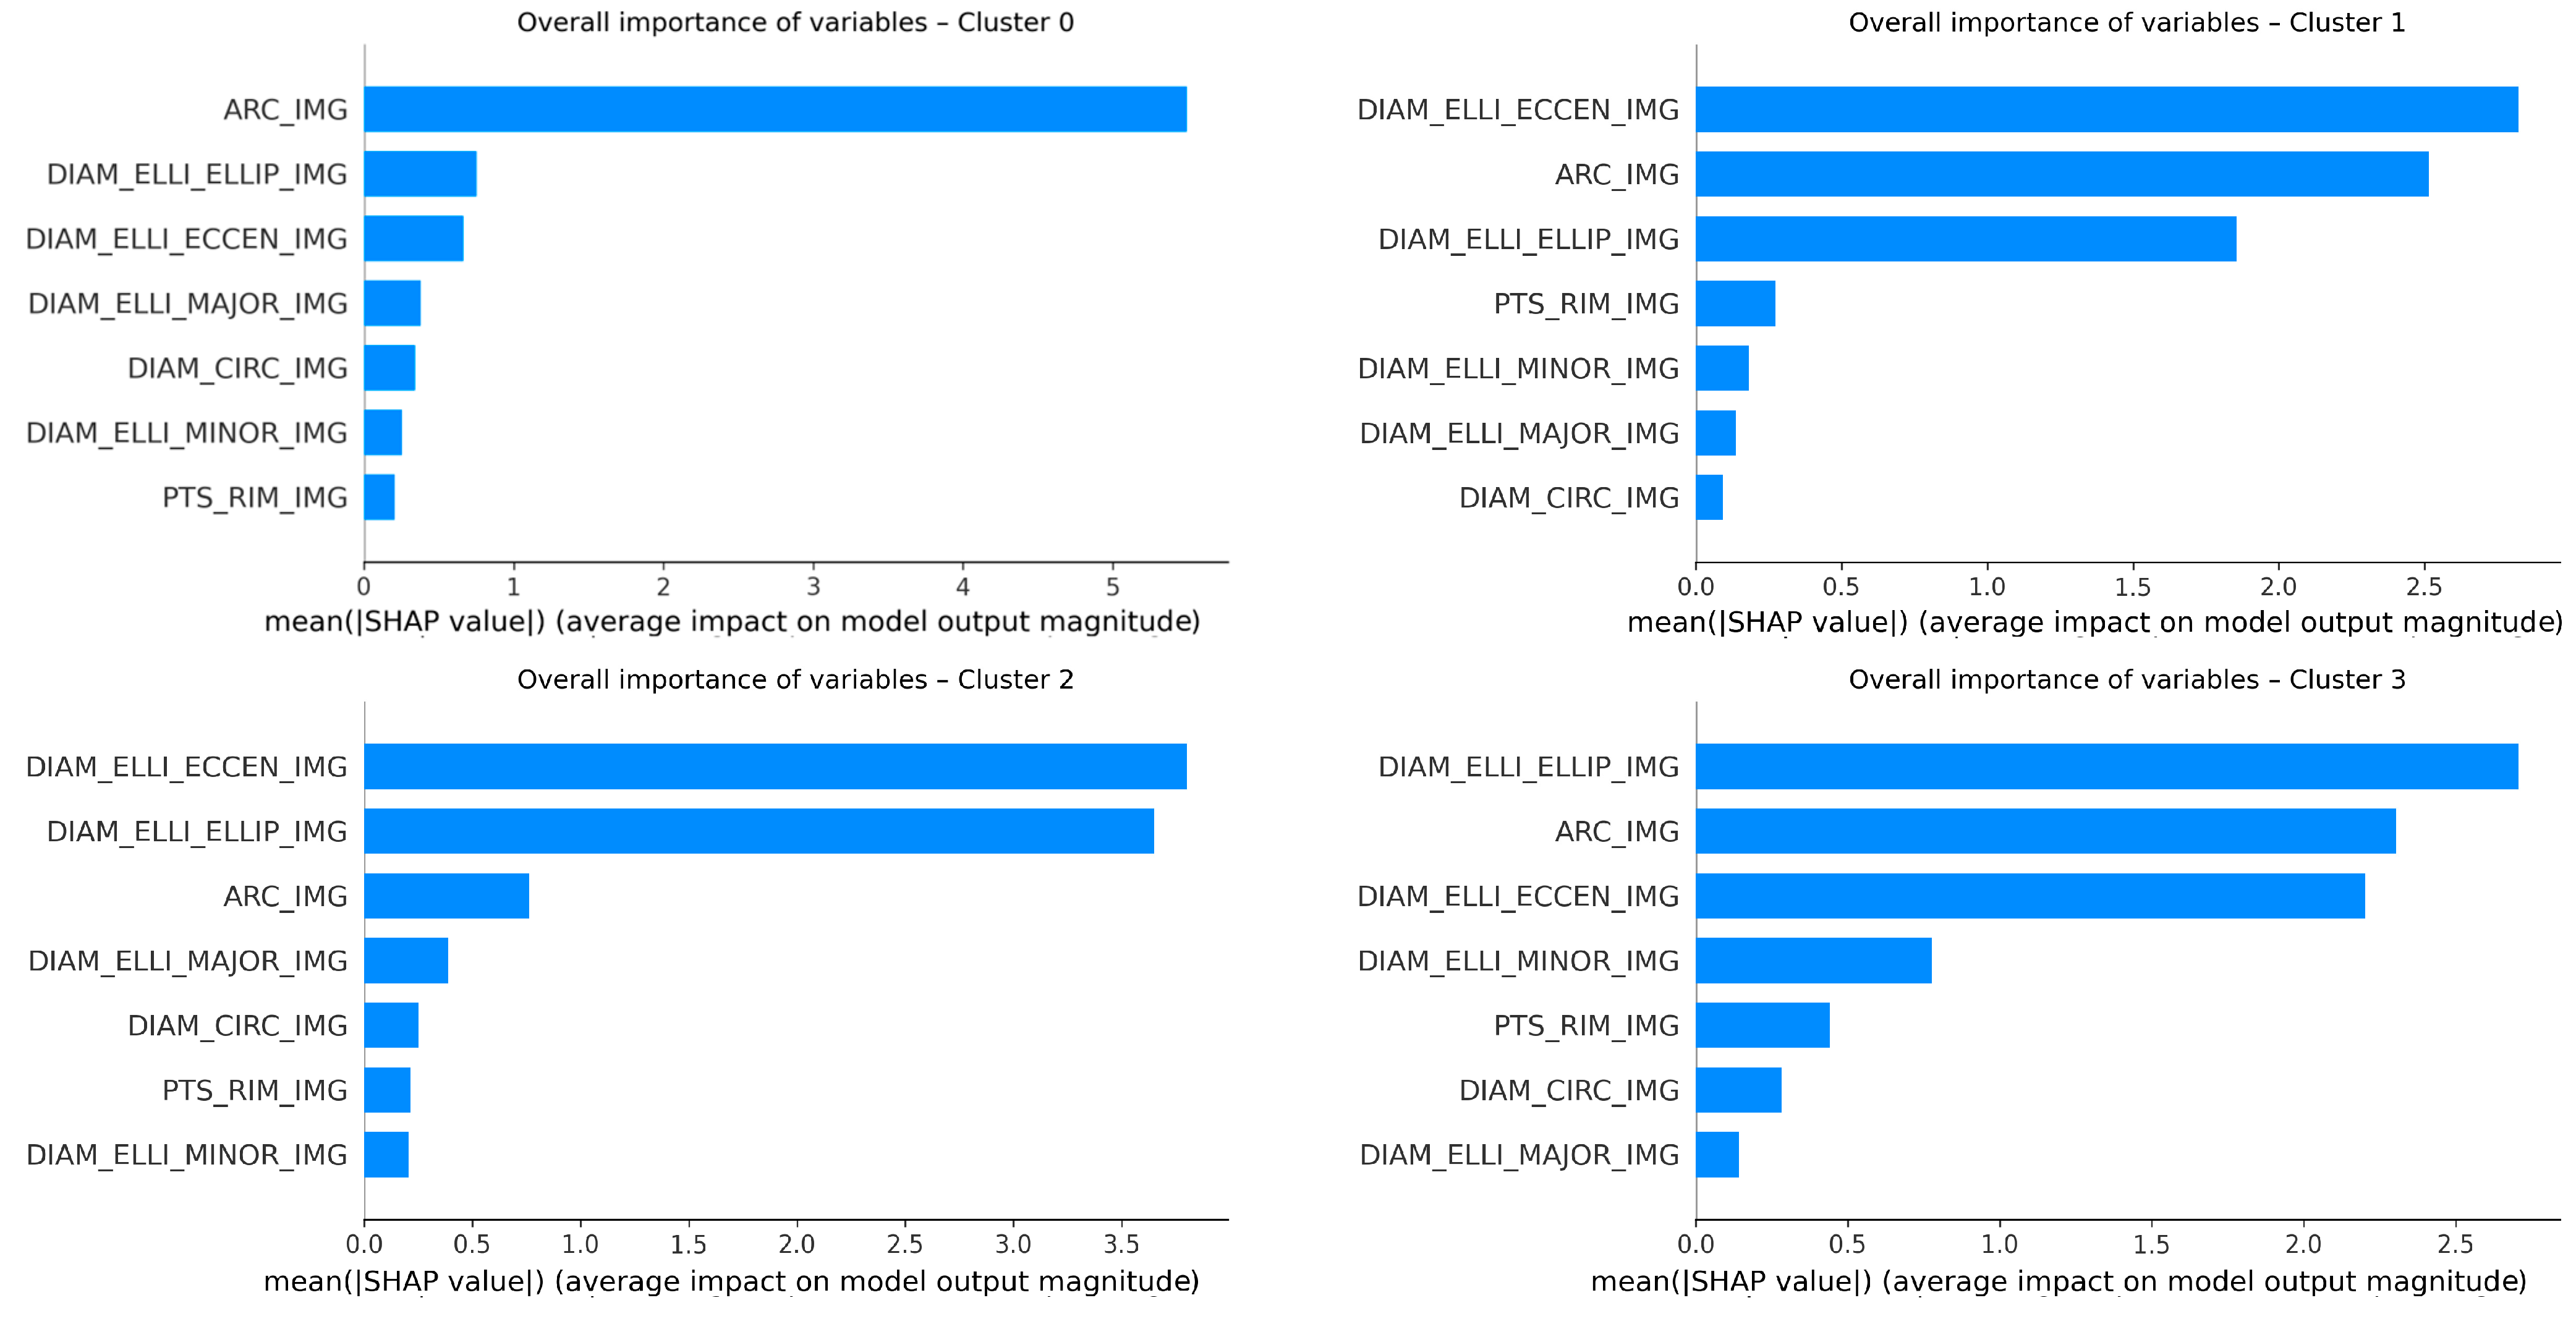
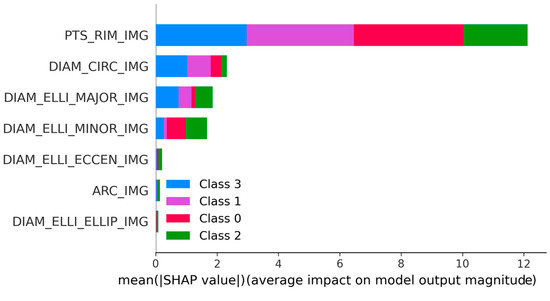
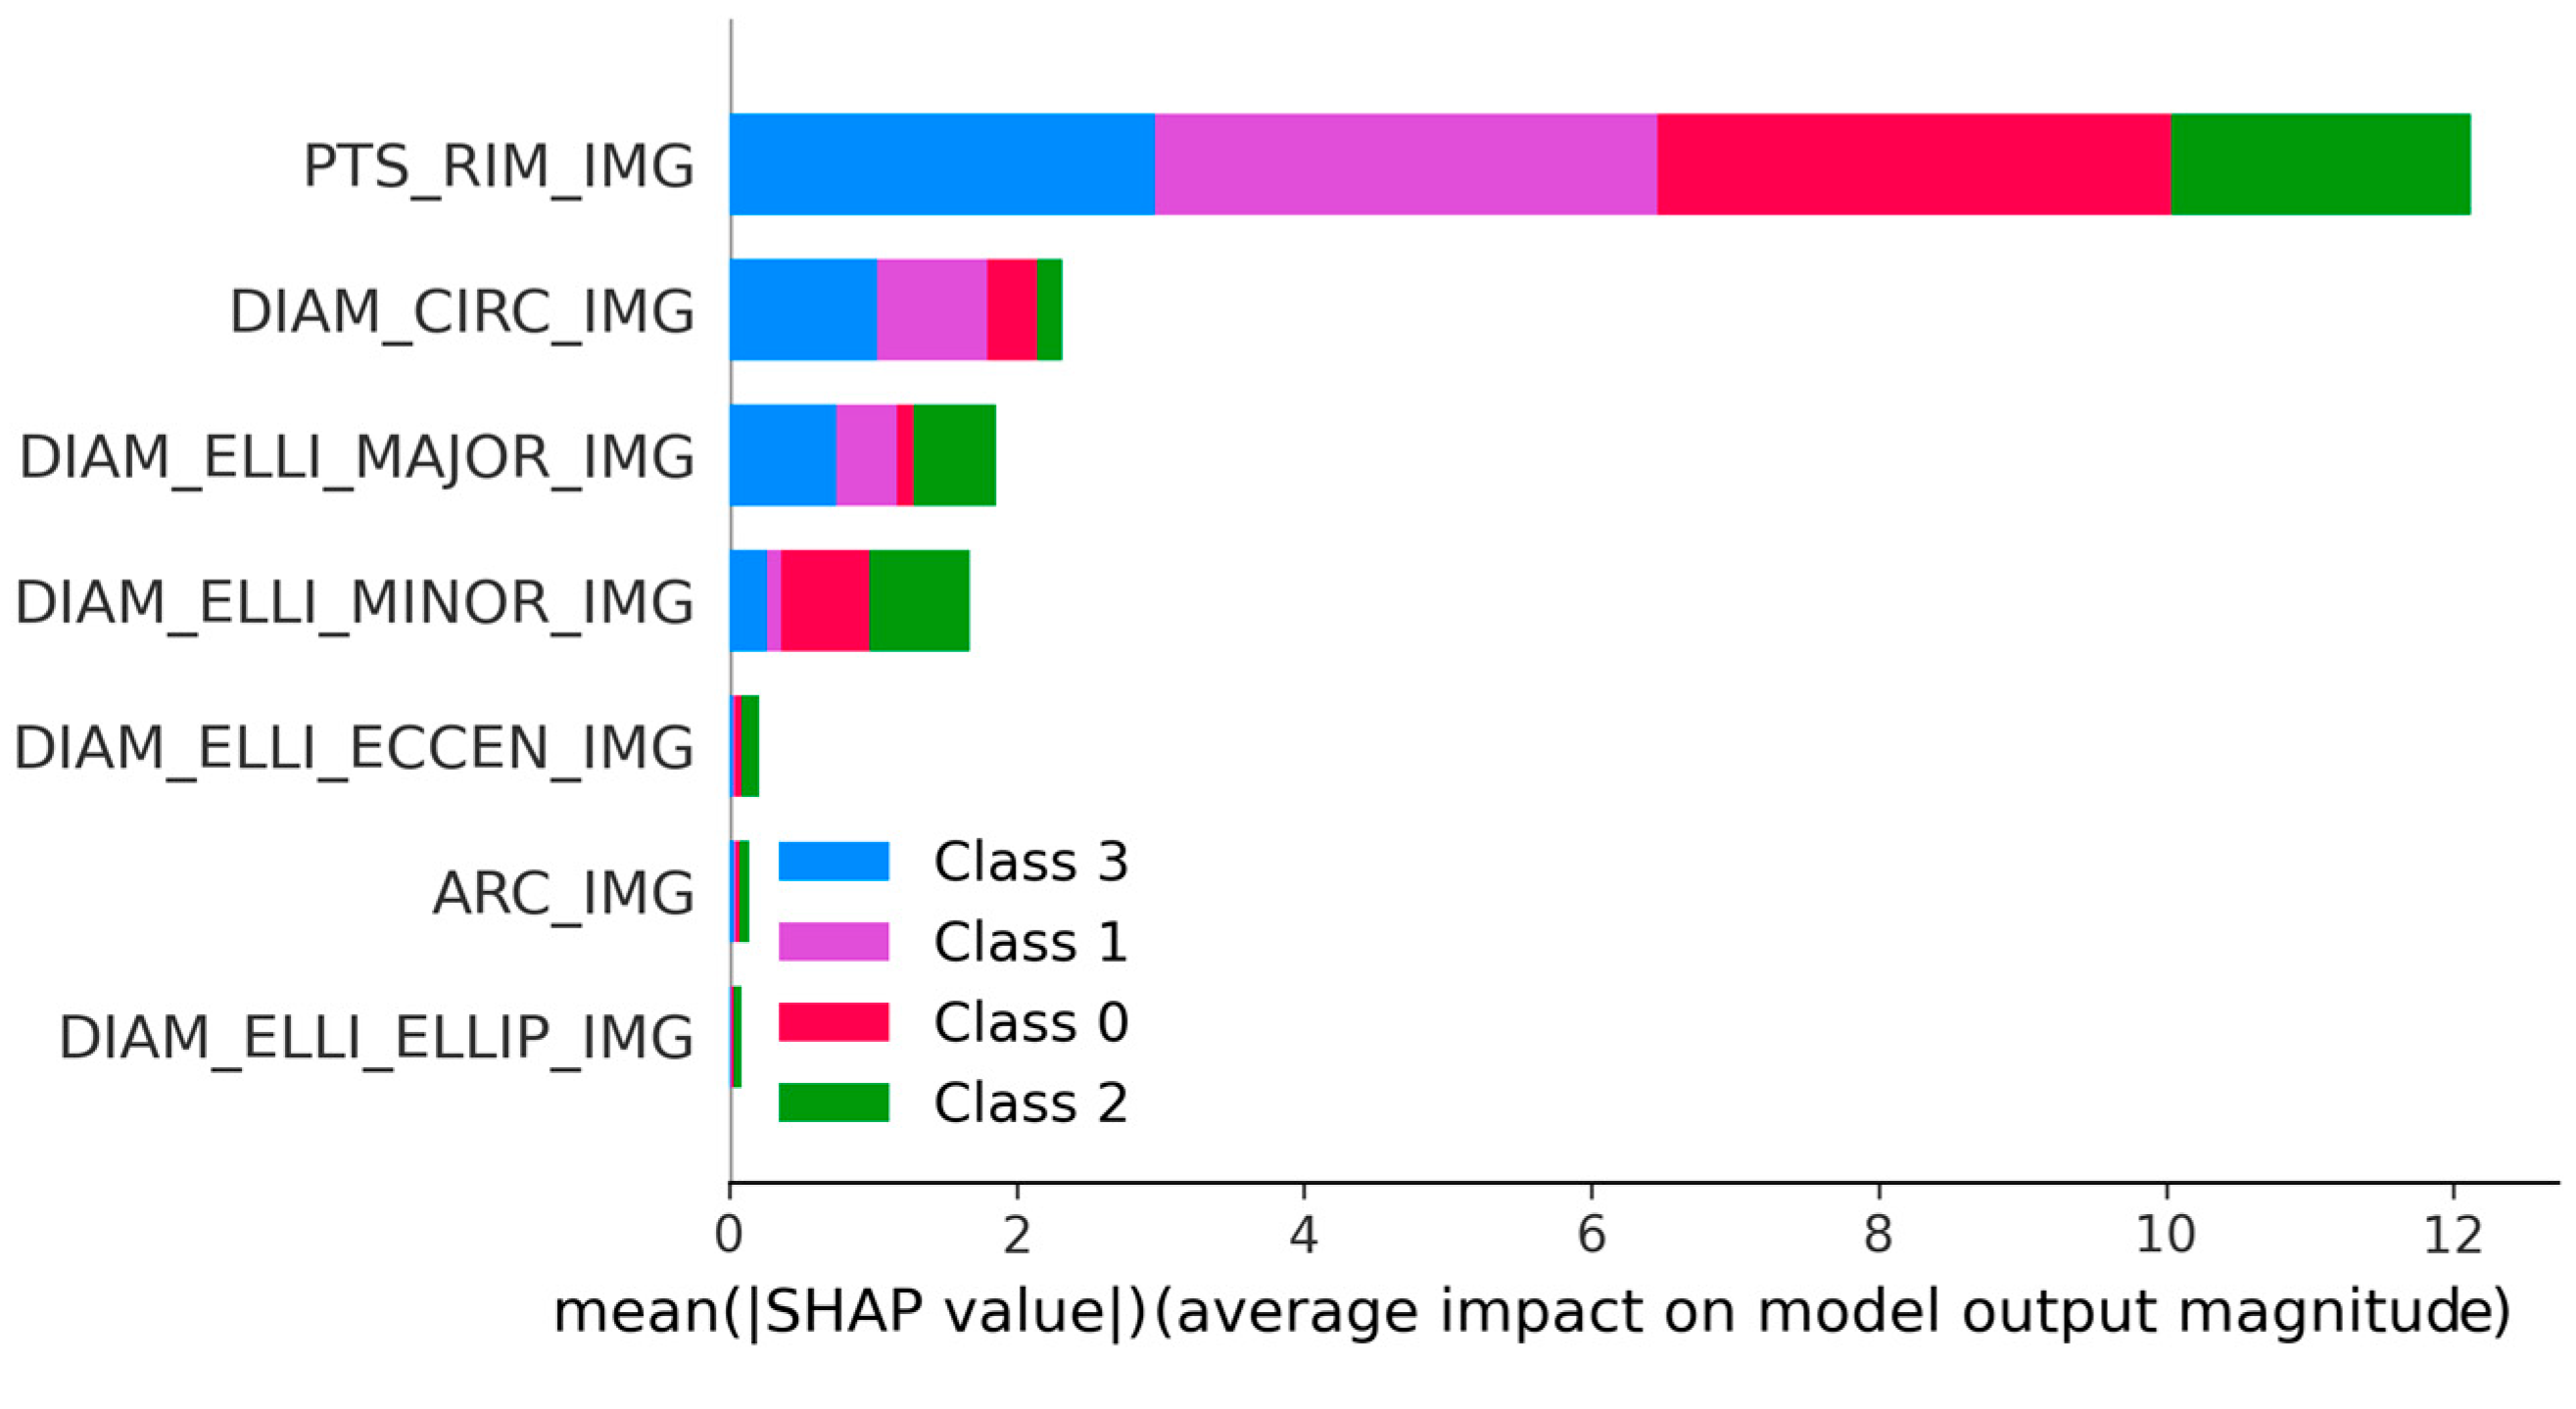
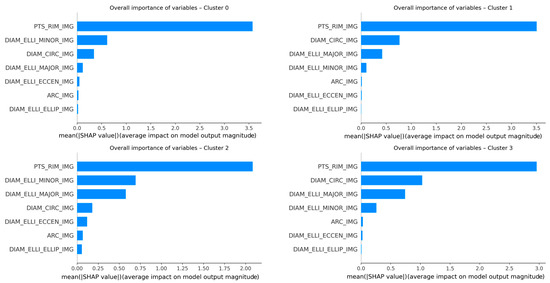
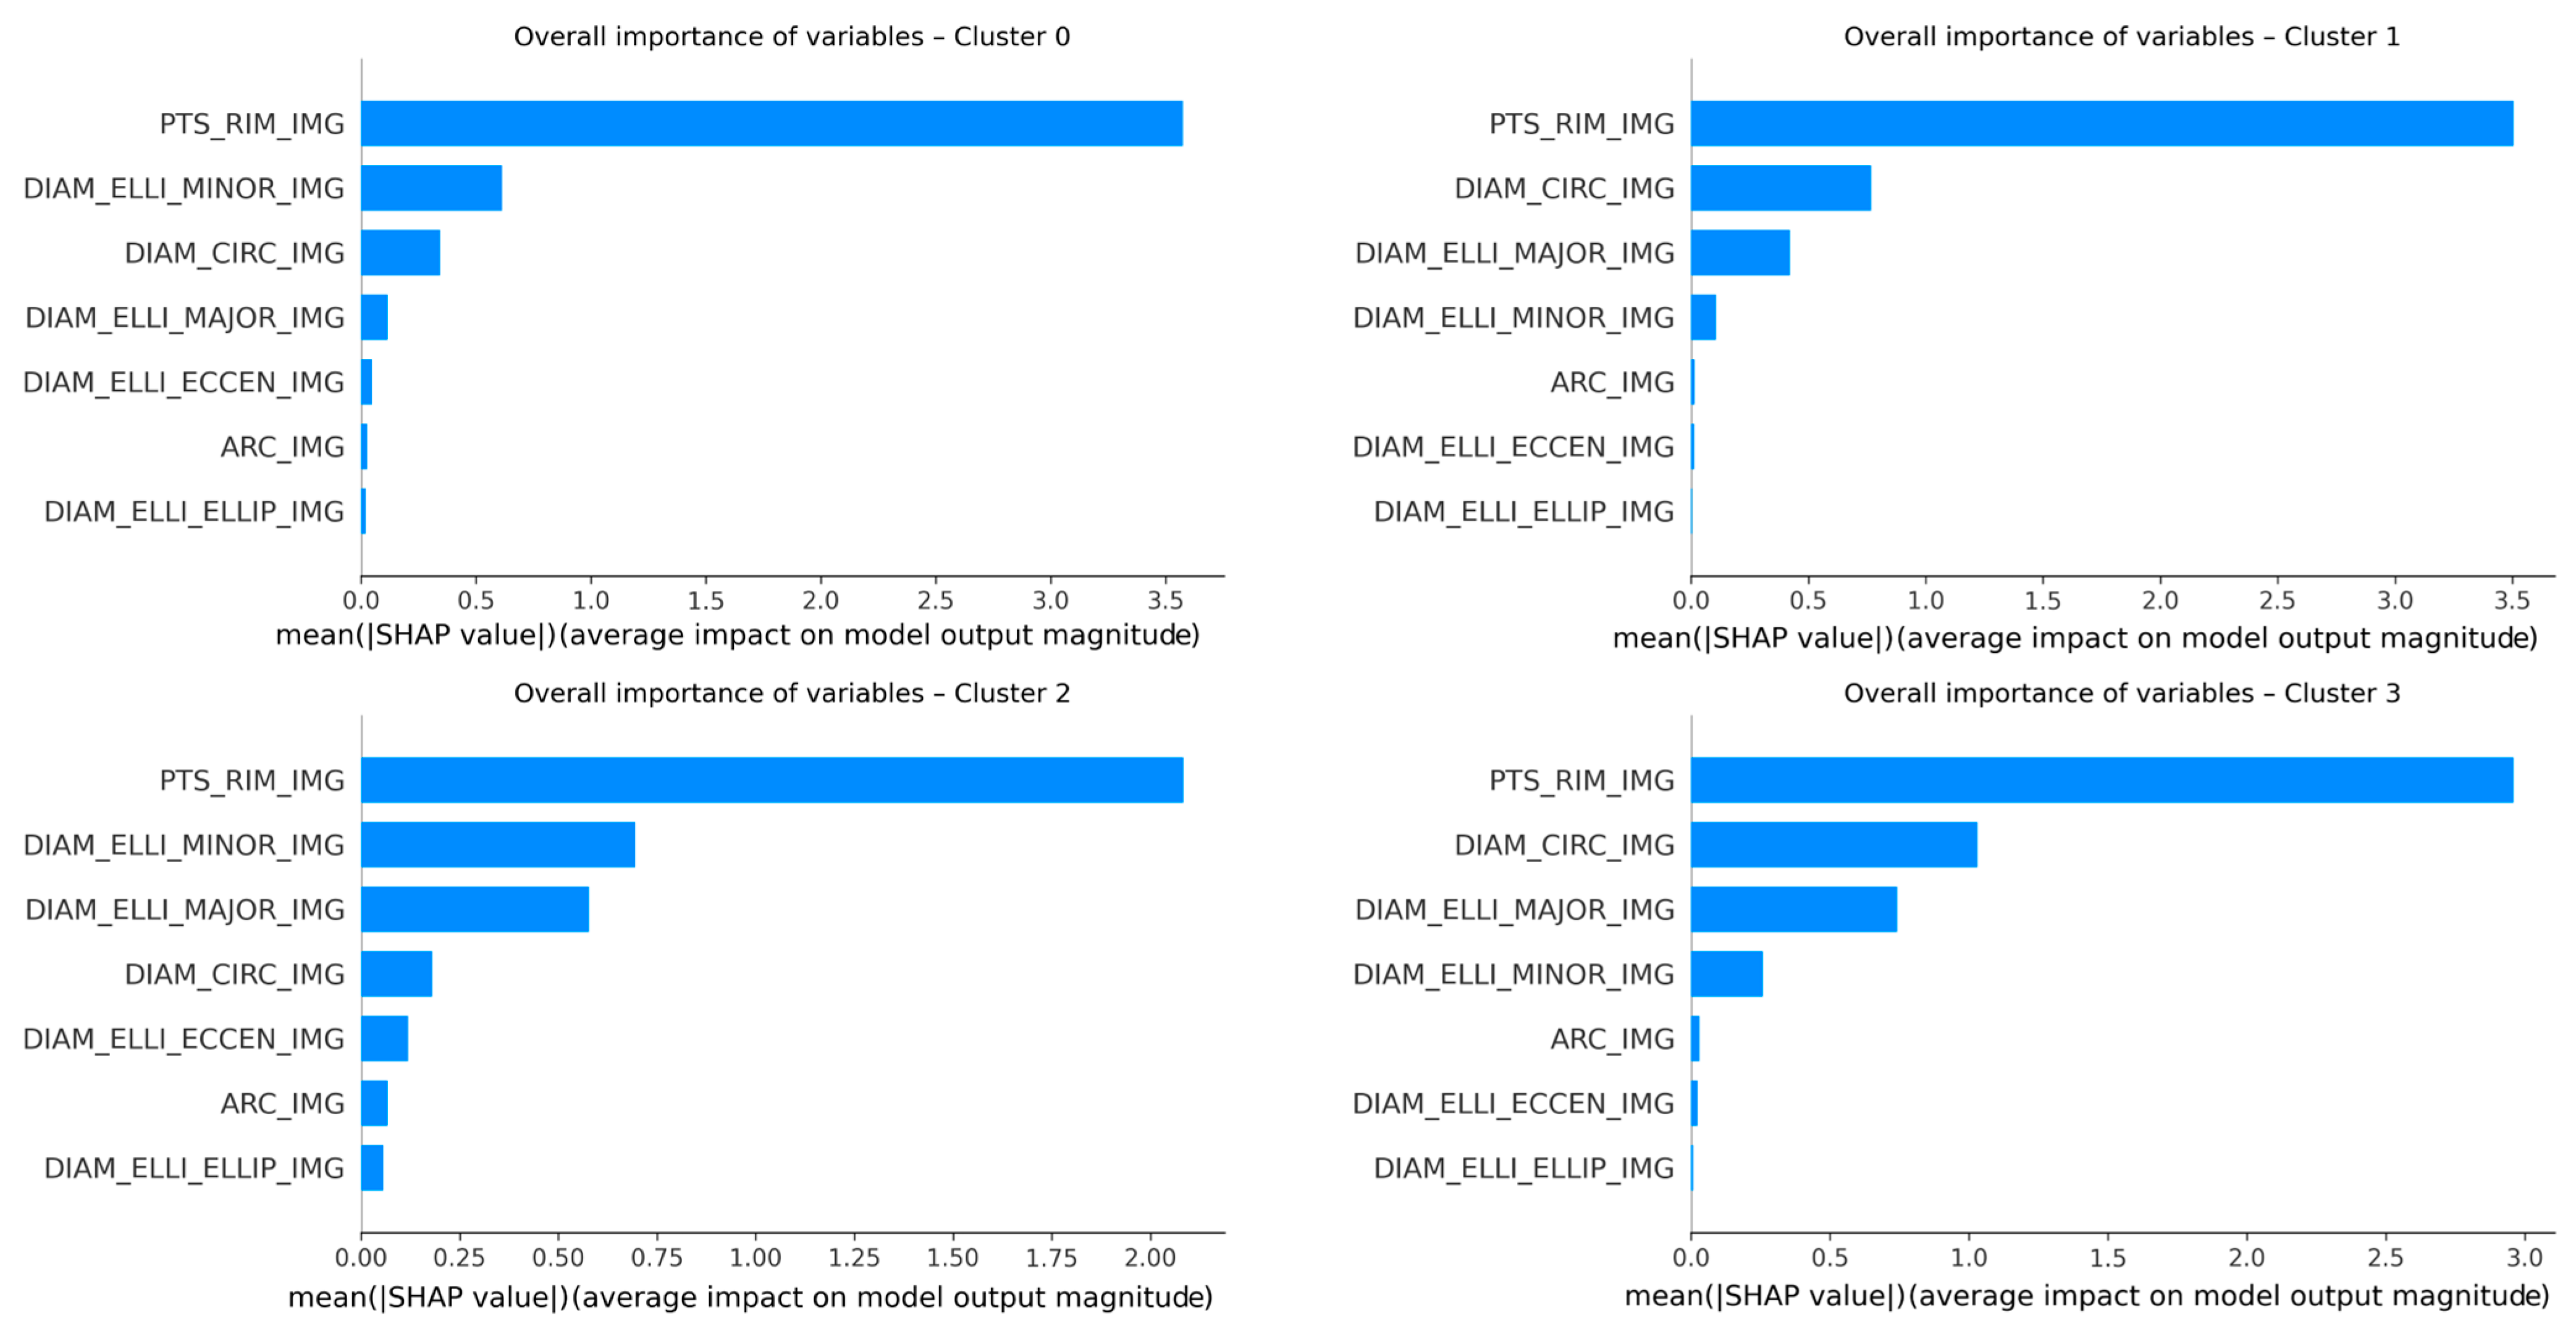

Disclaimer/Publisher’s Note: The statements, opinions and data contained in all publications are solely those of the individual author(s) and contributor(s) and not of MDPI and/or the editor(s). MDPI and/or the editor(s) disclaim responsibility for any injury to people or property resulting from any ideas, methods, instructions or products referred to in the content. |
© 2026 by the authors. Licensee MDPI, Basel, Switzerland. This article is an open access article distributed under the terms and conditions of the Creative Commons Attribution (CC BY) license.