


Abstract
In the context of a deep structural adjustment of China’s real estate sector and heightened macroeconomic uncertainty, quantitatively assessing the resilience of listed real estate enterprises is crucial for preventing systemic risk and promoting sustainable development. This paper proposes a multidimensional resilience evaluation framework for 37 Chinese A-share listed real estate firms using panel data from 2017–2024. An index system covering four dimensions—solvency and liquidity, profitability and cash flow, operational efficiency and asset structure, and growth and value—is constructed on the basis of financial ratios. The entropy-weighted TOPSIS method is employed to derive a composite resilience index, while principal component analysis (PCA) provides a complementary robustness check of the rankings. The empirical results indicate that (1) operational efficiency and asset structure receive the highest objective weight, followed by solvency and liquidity, whereas the weights of profitability, cash flow, and growth–value dimensions are relatively lower; at the indicator level, accounts receivable turnover, inventory turnover and the cash-to-short-term-debt ratio play a leading role, underscoring the central importance of liquidity safety and asset turnover under the “three red lines” regulatory regime. (2) Firms such as Shahe Co., Shenzhen, China, Huafa Co., Zhuhai, China and Wantong Development, Beijing, China exhibit persistently higher resilience scores, characterized by lower leverage, stronger cash buffers and faster operating turnover, whereas firms such as Yunnan Metropolitan Investment, Kunming, China, Greenland Holdings, Shanghai, China, Bright Real Estate, Shanghai, China and Rongsheng Development, Langfang, China remain at the lower tail of the resilience distribution with high leverage, tight liquidity and volatile profitability. (3) The resilience rankings obtained from entropy-weighted TOPSIS and PCA are positively and significantly correlated at the 1% level, suggesting a moderate level of consistency between distance-based and variance-based evaluation schemes. Building on these findings, this paper proposes resilience-oriented policy recommendations for regulators and managers in terms of differentiated prudential regulation, capital-structure and debt-maturity optimization, operational efficiency enhancement, and the integration of digital transformation and ESG governance.
Keywords:
enterprise resilience; listed real estate companies; entropy-weighted TOPSIS; financial health; operational efficiency; sustainable development MSC:
90B50
1. Introduction
In recent years, the global economic and financial environment has entered a highly uncertain “VUCA” era, where geopolitical conflicts, public health events, financial cycle fluctuations, and climate change shocks are frequently superimposed, substantially increasing the difficulty for firms to survive and develop in complex environments. Enterprise/organizational resilience, as an important concept for measuring a firm’s ability to “withstand shocks–absorb losses–recover rapidly–transform and upgrade” under sudden disturbances, has increasingly become a focus of both academic and policy circles [1,2,3,4,5]. Originating from ecological studies on system stability, the concept of resilience has been reinterpreted in organizational management and firm research as an integrated dynamic capability that emphasizes maintaining core functions while continuously adapting and regenerating under uncertainty. How to scientifically evaluate the level of enterprise resilience, identify resilience shortcomings, and propose targeted improvement pathways has become a critical foundation for promoting high-quality development at the micro level and safeguarding macroeconomic security and stability [6,7,8,9].
The real estate industry is typically characterized as “capital intensive, highly leveraged, long cycle, and strongly interconnected”. It is a key pillar of the national economy and one of the critical sources of systemic risk in the financial system. Since the central government established the position that “housing is for living in, not for speculation”, real estate regulation has gradually shifted from price- and transaction-volume management toward structural regulation centered on finance and land systems [10]. The “Three Red Lines” financing supervision rules implemented since 2020 impose hard constraints on the scale of interest-bearing debt of real estate firms from three dimensions—the asset–liability ratio net of advance receipts, the net gearing ratio, and the cash-to-short-term-debt ratio—significantly tightening the high-leverage development model [11]. Since 2022, the “three-arrow” policy package of credit, bonds, and equity has further improved financing conditions for high-quality developers to prevent systemic industry risk [12]. Under the combined effects of multiple rounds of regulation and declining demand, liquidity crises have erupted for several large developers. The real estate market has moved from the former “high leverage, high turnover” phase into a new stage of “deleveraging, steady operations, and strengthened risk control”. The industry’s overall logic has shifted from high growth to high-quality development, placing unprecedentedly higher requirements on the risk resistance and sustainable development capabilities of listed real estate companies.
Listed real estate companies have long relied on high-leverage expansion and high-turnover models, with generally high asset–liability ratios, significant short-term debt pressure, and revenues and cash flows that are highly sensitive to sales pace and the presale system. Once market sales slow down and financial regulation shifts from accommodative to neutral or tightening, funding chain tension and even credit defaults may occur. In recent years, volatility in real estate sector stock prices has intensified, and bond default cases have increased, with accelerated interfirm divergence: some firms have maintained strong resilience and achieved steady operations by optimizing capital structure, extending debt maturities, strengthening cash flow management, and deploying diversified businesses; others, owing to low asset turnover efficiency, single financing channels, and rigid governance structures, have exhibited pronounced fragility and become passive under shocks [13,14,15]. In this context, systematically identifying differences in resilience across listed real estate companies and quantitatively characterizing their comprehensive performance in dimensions such as financial health, solvency, profitability, and growth to provide objective evidence for financial supervision and investor decision-making is highly practical and aligns with the research frontier of organizational resilience and its measurement and management [16,17,18,19,20,21].
Accordingly, in this paper, Chinese A-share listed real estate companies are taken as the research object, an enterprise resilience evaluation index system based on multiperiod financial data is constructed, the entropy-weighted TOPSIS method is introduced to comprehensively measure enterprise resilience, and a robustness check of the measurement results is conducted using PCA. On this basis, “high-resilience” and “low-resilience” developers are identified, and differences in capital structure, liquidity, operating efficiency, profitability and growth are analyzed, leading to targeted policy recommendations and managerial implications. This study not only contributes to the theory and measurement framework of enterprise resilience in the real estate industry context but also provides empirical evidence for regulators to implement differentiated financial supervision and for firms to construct internal resilience governance frameworks.
Against this backdrop, this study focuses on Chinese A-share listed real estate companies and seeks to answer three interrelated research questions. First, how can we construct a multidimensional resilience evaluation framework that integrates solvency safety, liquidity buffers, operating efficiency and growth potential in a highly leveraged and strongly regulated industry context? Second, among the various financial dimensions and specific ratios, which factors are the key drivers of differences in resilience across listed developers during the 2017–2024 adjustment period? Third, how do high-resilience and low-resilience firms differ systematically in terms of capital structure, liquidity management, operating models and profit–growth patterns under repeated regulatory and macroeconomic shocks?
It is also important to clarify the conceptual distinction between enterprise resilience, financial health and financial risk. In this paper, enterprise resilience is understood as a dynamic capability that encompasses a firm’s ability to maintain essential functions, absorb losses, restore operations and achieve adaptive adjustment and renewed growth in the face of major shocks. Financial health, by contrast, mainly reflects the soundness of a firm’s balance sheet and income statement at a given point in time, whereas financial risk focuses on the probability of events such as default or liquidity crises. The multiperiod financial indicator-based index constructed in this study can therefore be viewed as an observable proxy of this broader resilience capability rather than a purely static measure of financial condition.
2. Literature Review
2.1. Conceptual Evolution and Theoretical Foundations of Enterprise Resilience
In ecological studies, Holling [1] proposed system resilience to describe an ecosystem’s ability to maintain its original structure and functions after disturbances. Walker et al. [2] further linked resilience with adaptability and transformability, emphasizing that complex systems can achieve long-term survival by reconstructing stable states during crises. In organizational and firm research, early scholars such as Wildavsky and Lengnick-Hall & Beck regarded resilience as an organization’s “buffering” and “recovery” capacity when facing environmental shocks [3,4], emphasizing the role of redundant resources, flexible structures, and diversification strategies. Duchek [5] proposed a capability-based framework of organizational resilience and argued that enterprise resilience comprises three stages: anticipation, coping, and adapting. Ortiz-de-Mandojana & Bansal [6] reported that sustainable business practices can enhance long-term resilience by improving resource redundancy and relationship networks. On the basis of a systematic literature review, Chen et al. [7] summarized organizational resilience on the basis of construction connotations, dimensionality, and measurement methods, observing a shift from a static trait perspective to a dynamic capability perspective, where resilience is understood as a comprehensive capability supported jointly by resource bases, process mechanisms, and dynamic adaptation. Using bibliometric methods, Jiang et al. [8] reported that hotspots in organizational resilience research are expanding from macro social-ecological systems to firm-level themes such as digital transformation, ESG practices, and innovation capability, with a pluralistic theoretical foundation intertwining resource-based theory, dynamic capability theory, institutional theory, and the attention-based view.
On this basis, some studies have begun to examine enterprise resilience from a unified perspective of “sustainable development–urban resilience–industrial resilience” [9,10,11,12], emphasizing that enterprise resilience is related not only to the survival and growth of individual firms but also to the stability and sustainability of urban and industrial systems. This perspective is highly consistent with the research question of this study, which focuses on highly leveraged and highly interconnected listed real estate companies.
2.2. Measurement Approaches for Enterprise Resilience and Their Limitations
With respect to measurement approaches, existing studies have broadly formed two strands: direct measurement and indirect measurement. Direct measurement typically uses questionnaires and scenario-based scales to construct multidimensional instruments and obtain resilience scores through respondents’ subjective evaluations. Such studies are beneficial for capturing soft factors that are difficult to quantify, such as organizational culture, leadership, and organizational learning. However, the results are prone to subjective bias, and there are substantial differences in items across studies, leading to weak comparability [22,23,24]. Indirect measurement involves the construction of indicator systems on the basis of publicly disclosed financial and market data. Common practices include using the drawdown and recovery time of profits or stock prices around major shocks (e.g., financial crises, pandemics) as proxy variables; building comprehensive evaluation systems based on multidimensional financial indicators such as profitability, solvency, operating capability, growth, and cash flows; or constructing indirect indicators from innovation inputs, financing constraints, and capital structure robustness [25,26,27].
In terms of comprehensive multi-indicator evaluation techniques, scholars have employed the analytic hierarchy process (AHP), fuzzy comprehensive evaluation, gray relational analysis, data envelopment analysis (DEA), principal component analysis (PCA), structural equation modeling, and multiattribute decision making (MADM) to construct enterprise resilience evaluation models [28,29]. Wang Nannan et al. [22] compared direct and indirect measures and reported that indirect measurement based on financial data helps expand samples and improve comparability; however, using only a few single indicators (such as stock price drawdowns and recovery time) makes it difficult to comprehensively reflect multidimensional performance across the stages of shock resistance, loss absorption, and recovery and reconstruction. To address the problem of subjective weighting, some studies have introduced objective weighting methods such as entropy weights and PCA and combined them with MADM models such as TOPSIS and VIKOR to evaluate enterprise performance, financial health, and sustainable development [30]. For example, Lam et al. [18] used the entropy-weighted TOPSIS method to comprehensively evaluate the financial performance of construction firms and demonstrated the method’s effectiveness in handling multi-indicator ranking problems. Chen & He [17] applied entropy-weighted TOPSIS to measure port enterprise resilience and constructed an evaluation system covering shock resistance, recovery capability, and adaptive capability.
In addition, a growing body of multicriteria decision-making (MCDM) studies has applied advanced models to complex evaluation problems in finance, supply chains and digital platforms. For instance, adaptive utility ranking algorithms and hybrid linguistic frameworks have been proposed to evaluate blockchain-enabled microfinance, e-commerce procurement and IT investment decisions, often combining sophisticated preference modeling with robustness analysis across multiple criteria and scenarios [31,32]. These approaches, including the VIKOR, PROMETHEE, AURA, and IVPNS–COBRA-based frameworks, highlight the importance of simultaneously capturing decision makers’ preferences, data-driven information content and uncertainty in criteria evaluations. Against this backdrop, our choice of an entropy-weighted TOPSIS scheme reflects a trade-off between methodological sophistication and transparency: the model remains sufficiently rich to capture multidimensional dispersion in financial data, while its computational logic and ranking results are straightforward for regulators and practitioners to interpret and reproduce.
Overall, the existing research still has two shortcomings in terms of resilience measurement. First, a dedicated resilience measurement system for highly leveraged and strongly regulated industries (such as real estate) is relatively lacking. Related studies have focused more on early warning and solvency assessments of financial risk, with insufficient systematic indicator design from a “resilience” perspective. Second, subjective weighting methods still dominate. Although some studies have attempted to introduce objective weighting tools such as entropy weights, they mostly use manufacturing, chemical, or “specialized, refined, distinctive and innovative” enterprises as samples, and systematic studies based on large-sample real estate firms remain relatively scarce.
2.3. Antecedents, Consequences, and Real Estate Context Studies of Enterprise Resilience
Research on the determinants and economic consequences of enterprise resilience has become increasingly rich. On the one hand, digital transformation has been shown to enhance firms’ flexibility and recovery capability under shock. On the basis of Chinese listed firms, Li et al. [19] reported that digital transformation significantly improves enterprise resilience by optimizing resource allocation and reducing information asymmetry. Xu et al. [20] and Zhan et al. [21] further reported that firms with higher digitalization levels exhibit stronger profitability recovery and capital market performance during a pandemic shock. On the other hand, ESG performance and sustainable governance are viewed as important antecedents of enterprise resilience. Wang et al. [33] and Walker et al. [34] reported that in the context of the pandemic, firms with higher ESG scores have significant advantages in terms of stock price drawdowns and earnings recovery. Using cross-country samples, Liu et al. [35] confirmed that ESG performance enhances shock resistance by improving trust and financing conditions. Domestic studies also indicate that top management team ESG attention [36], patient capital [37], and the degree of digital-real integration [30] significantly increase enterprise resilience.
In the context of the real estate industry, research on enterprise resilience has gradually attracted attention. Yang et al. [14] reported that debt financing costs and patient capital structure significantly affect developers’ survival and recovery capabilities under demand shocks and financing tightening. From a housing supply perspective, Brill [15] argued that patient capital can help developers maintain a more stable construction pace before demand shocks, thereby mitigating cyclical volatility. Overall, existing studies have revealed several important antecedents and mechanisms of real estate enterprise resilience, but they focus mostly on single-factor mechanisms and lack a unified and comparable enterprise resilience index as the dependent variable, making it difficult to integrate evidence across studies.
2.4. Literature Review and Contributions of This Study
In summary, prior studies have laid important groundwork for conceptualizing and measuring enterprise resilience, yet several gaps remain, particularly in highly leveraged and strongly regulated sectors such as real estate. Most existing resilience indices are either constructed for manufacturing and service sectors or rely on a narrow set of financial ratios or market-based indicators, making it difficult to capture the multistage nature of resilience in capital-intensive industries. Moreover, the lack of a unified, comparable resilience index has constrained cumulative evidence-building regarding the effects of digital transformation, ESG performance, patient capital and policy interventions. By focusing on listed real estate developers, constructing a four-dimensional resilience index system tailored to sector-specific capital structures and financing models, and adopting an entropy-weighted TOPSIS scheme complemented by PCA, this study contributes to the literature on resilience measurement and provides an operational metric that can be readily incorporated into subsequent regression-based and event-study analyses.
Accordingly, this paper aims to make the following contributions: (1) Starting from the specific industry object of listed real estate companies and incorporating the industry’s asset structure and financing characteristics, it constructs an enterprise resilience evaluation index system covering dimensions such as solvency safety, liquidity adequacy, earnings quality, operating efficiency, and growth potential, thereby enriching the applicability of the enterprise resilience concept in highly leveraged industries. (2) The introduction of the entropy-weighted TOPSIS method achieves a comprehensive ranking of multiperiod and multifirm resilience levels through objective weight determination and distance measurement to the ideal solution, providing a replicable technical route for resilience measurement. (3) The constructed real estate enterprise resilience index can be connected with subsequent empirical research on digital transformation, ESG performance, patient capital, and government support policies, providing a unified basis for revealing the intrinsic links between microlevel resilience, macrolevel urban resilience, and financial stability.
3. Research Design and Methods
3.1. Research Method
From a single-indicator proxy perspective, scholars often use indicators such as stock price drawdowns, recovery time, earnings volatility, or default probability before and after crises as measures of resilience [38,39]. Such methods are simple and convenient, but they cannot comprehensively reflect the multidimensional connotation of resilience. From a multi-indicator comprehensive evaluation perspective, researchers construct multidimensional evaluation systems that include financial and nonfinancial indicators and apply methods such as the AHP, fuzzy comprehensive evaluation, gray relational analysis, DEA, PCA, and MADM for measurement [28,29,30,31,32]. Among MADM methods, TOPSIS (Technique for Order Preference by Similarity to an Ideal Solution) is widely applied in evaluating enterprise performance, financial health, and sustainable development because of its intuitive logic, computational simplicity, and stable ranking results [14,18]. Compared with traditional subjective weighting methods, the entropy-weight method can objectively determine indicator weights on the basis of the dispersion of indicator values across the sample: the greater the variation is, the more information the indicator carries and the higher its weight, thereby avoiding biases from subjective judgment [25]. Therefore, combining the entropy-weight method with TOPSIS enables a comprehensive evaluation based on objective weights and proximity to the ideal solution. It has been widely used in evaluations of construction enterprise performance, hospital budget performance, internal control quality, and the level of high-quality development across industries.
Given the standardized disclosure of financial information among listed real estate companies, indicators such as solvency, liquidity, profitability, and growth have good comparability. Moreover, firms in the industry differ significantly in capital structure, regional distribution, ownership background, and business diversification, which is suitable for leveraging the advantage of the entropy-weight method in that “greater differences imply higher weights”. On the basis of these considerations, in this paper, entropy-weighted TOPSIS is chosen as the comprehensive evaluation method for enterprise resilience, supplemented by PCA for robustness testing.
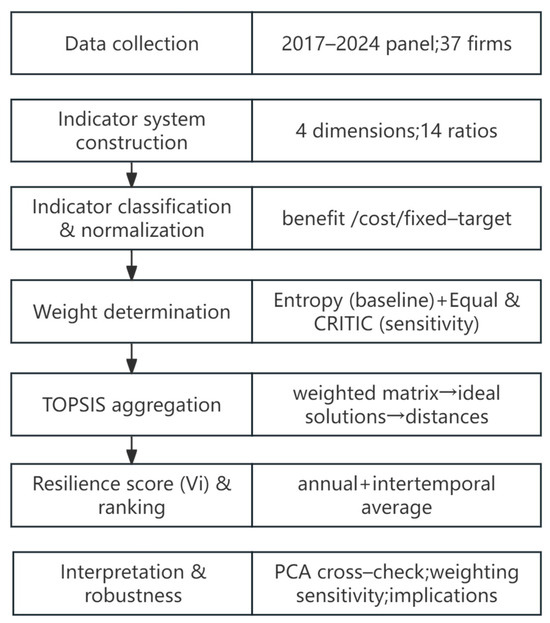
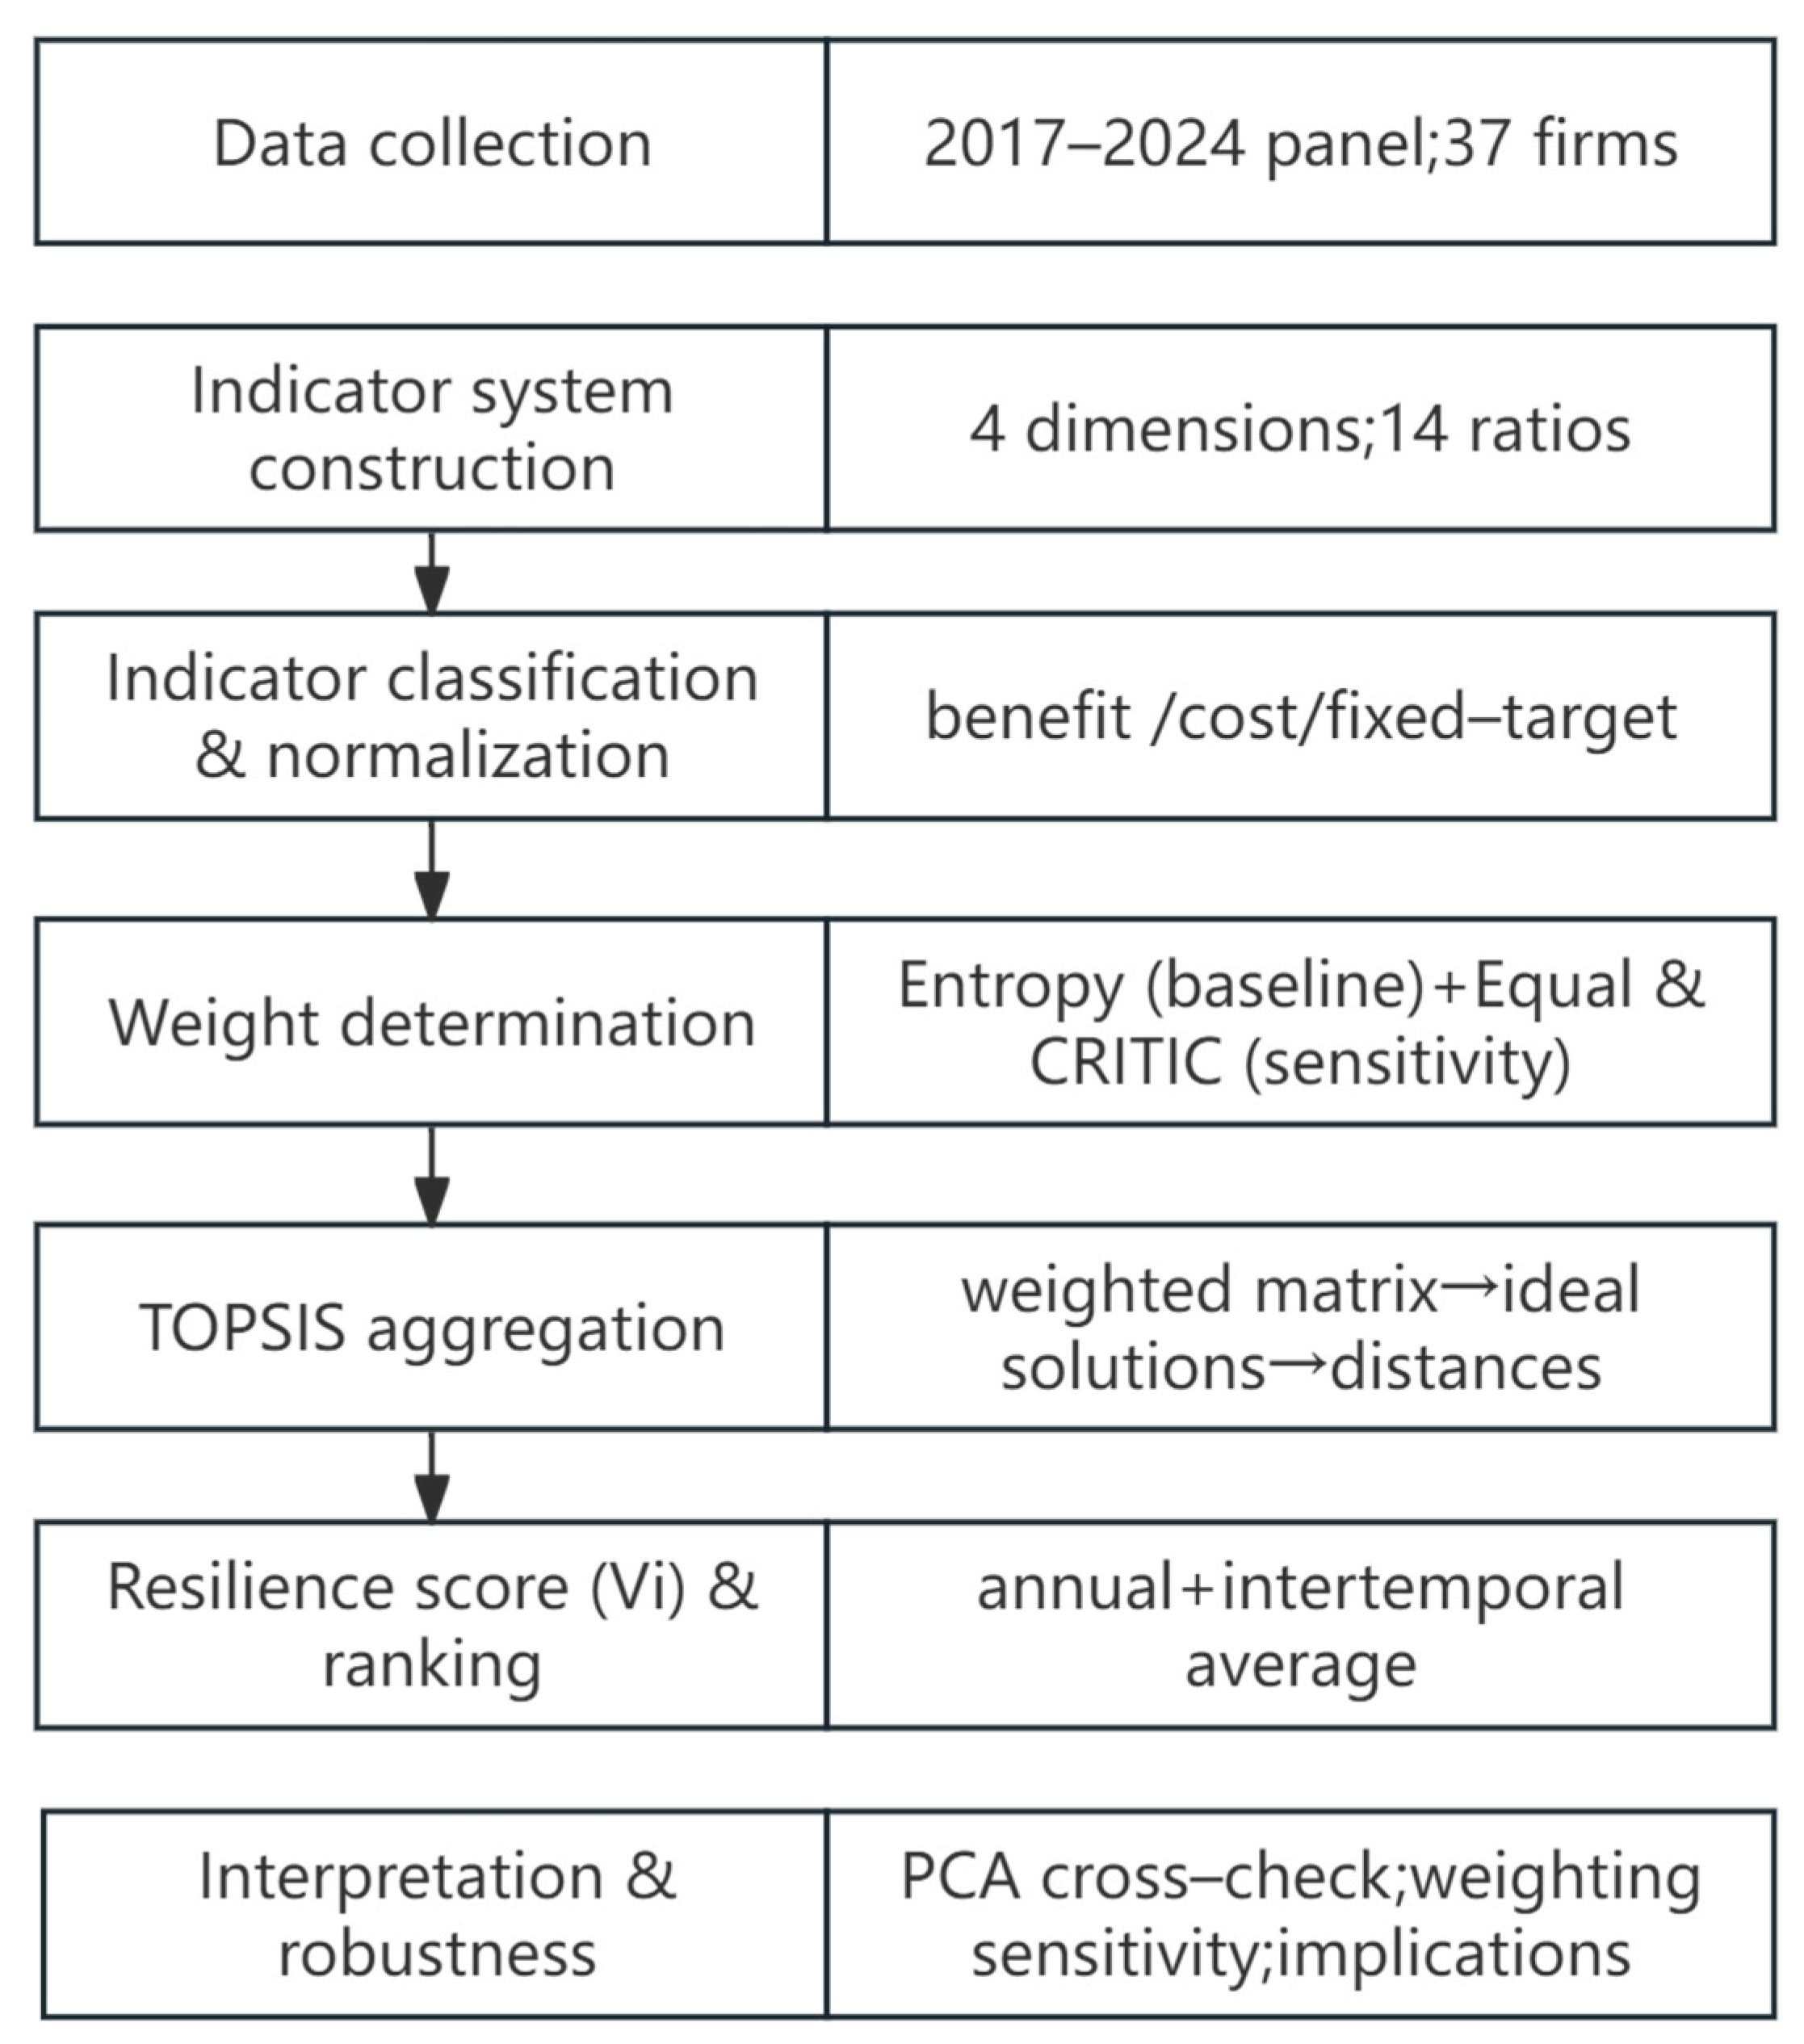
Let the research sample consist of m listed real estate companies and n evaluation indicators, and let denote the original value of the j-th indicator for the i-th firm. The entropy-TOPSIS procedure used in this study is summarized in Figure 1.
Figure 1.
Flowchart of the entropy-weighted TOPSIS evaluation procedure.
- (1)
- Standardization of raw data
Formulas (1) and (2) are used to normalize benefit-type and cost-type indicators, respectively, and Formula (3) provides the normalization expression for fixed-target indicators.
For benefit-type indicators (the larger, the better), the following formula is used:
For cost-type indicators (the smaller, the better), the following formula is used:
For fixed-target indicators (the closer to a given value, the better), the following formula is used:
For fixed-target indicators, such as regulatory thresholds on the asset–liability ratio or management-defined safety ranges for liquidity ratios, the closer an observation is to the target value, the better its performance is considered to be. Formula (3) therefore transforms deviations from the benchmark into a “the smaller, the better” form, where β denotes the target level (for example, a prudential upper bound on the asset–liability ratio). This treatment ensures that firms whose leverage or liquidity ratios are closer to the desired regulatory or managerial target receive higher normalized scores on these criteria.
- (2)
- Entropy-weight method for calculating indicator weights
First, compute the information entropy of the j-th indicator
In Formula (4), . Then, compute the divergence coefficient of the j-th indicator . For a given j, the smaller the divergence gj of xij, the larger the value of Ej. Accordingly, the weight of each indicator can be defined as follows:
- (3)
- TOPSIS method
Construct the weighted normalized matrix , where . The positive ideal solution f+ and the negative ideal solution f− are then defined by Formulas (6)–(7).
Determine the positive ideal solution and the negative ideal solution:
which constitute the vectors and , respectively
The Euclidean distances between firm i and the positive and negative ideal solutions are computed as follows:
The relative closeness coefficient is subsequently computed as follows:
The closer the enterprise is to the ideal resilience level, the closer it is to 1.
In the broader MCDM literature, a wide range of methods are available, including subjective weighting approaches such as the analytic hierarchy process (AHP) and the best–worst method (BWM), objective weighting schemes such as the entropy and CRITIC methods, and comprehensive ranking models such as VIKOR, PROMETHEE, AURA and IVPNS–COBRA. Subjective weighting emphasizes expert judgment and the theoretical importance of indicators but may introduce preference bias and inconsistency when the number of indicators and alternatives is large. Objective weighting methods exploit the statistical properties of the data and are more suitable for panel datasets with substantial cross-sectional heterogeneity, as in our setting. With respect to ranking, TOPSIS is computationally transparent and easy to interpret, which makes it attractive for regulators and practitioners who need to reproduce the results in practice.
Moreover, the entropy method has clear limitations. Because entropy weights are derived solely from the dispersion of indicator values across firms and years, they primarily reflect the empirical information content of indicators rather than their normative or theoretical importance. In our sample, for example, the operational efficiency and asset structure dimension receives an entropy weight as high as 0.6909, and accounts receivable turnover and inventory turnover become the leading indicators. This outcome is consistent with the central role of turnover in the prevailing “high-turnover–high-leverage” development model, but it is also partly driven by the large cross-firm variance of these ratios. Thus, the entropy weights should be interpreted as a data-driven ranking of empirical influence, and future research could integrate expert-based schemes such as the AHP or BWM with entropy weighting to better balance theoretical and empirical importance.
In addition, many financial indicators are intrinsically interrelated and may exhibit heterogeneous dependencies (e.g., leverage–liquidity trade-offs and joint risk exposure). Recent decision-analytic approaches, such as biobjective R-mathematical programming and risky multicriteria decision-making models with heterogeneous relationships, explicitly model such interdependencies when aggregating criteria. In the present study, we do not parameterize these relationships because our primary goal is to construct a transparent and easily reproducible composite index on the basis of publicly disclosed financial data and because the observed pairwise correlations among the normalized indicators are on average modest (mean absolute correlation ≈ 0.13; maximum ≈ 0.55 in our sample). Nevertheless, overlooking structured interrelationships may still affect marginal ranking positions. We therefore treat relationship-aware MCDM and multiobjective programming formulations as important avenues for future research, especially for stress-scenario evaluation and risk-sensitive policy design.
Furthermore, TOPSIS is known to be potentially susceptible to rank reversal when alternatives are added to or removed from the evaluation set. In this study, the set of 37 listed real estate firms is fixed throughout the period, and we do not compare rankings across different sets of alternatives; thus, the classical rank-reversal problem is less acute. Even so, we acknowledge that robustness to rank reversal is an important property of MCDM models, and in Section 6.3, we suggest that future work should apply alternative ranking procedures such as VIKOR, PROMETHEE, AURA or IVPNS–COBRA to the same indicator system and sample to examine the stability of the resilience rankings.
3.2. Selection of Evaluation Indicators
In light of the financial characteristics of listed real estate companies and the multidimensional connotation of enterprise resilience, this paper constructs an indicator system from four dimensions: “solvency and liquidity resilience—profitability and cash flow resilience—operational efficiency and asset structure resilience—growth and value resilience”. Overall indicator selection draws on studies on firms’ financial robustness and crisis resilience, such as Bistrova & Lace [9] and Lam et al. [18], as well as domestic research outcomes on constructing enterprise resilience evaluation indicator systems [28,29,30,31,32]. The specific indicator composition of each dimension is as follows:
- (1)
- Solvency and liquidity resilience dimension. This reflects a real estate firm’s ability to withstand short-term liquidity shocks and long-term solvency risks. Given that developers typically have high asset–liability ratios, capital structure safety is a key factor affecting resilience [38,39]. Indicators such as the asset–liability ratio, current ratio, quick ratio, and cash-to-short-term-debt ratio are selected. Among them, the cash-to-short-term-debt ratio directly measures a firm’s ability to cover short-term interest-bearing debt with highly liquid assets and is a core indicator in the recent supervisory framework.
- (2)
- Profitability and cash flow resilience dimension. This captures the firm’s ability to maintain stable profitability and operating cash flows under shock scenarios [39]. Return on assets (ROA), return on equity (ROE), and the operating cash flow ratio are selected to describe resilience foundations from the perspectives of the profitability of assets and shareholders’ equity and the “cash-generating” ability of operating activities, respectively.
- (3)
- Operational efficiency and asset structure resilience dimension. This reflects the flexibility and stability of real estate firms in terms of asset turnover, project development, sales, and operations [28,29]. Indicators such as inventory turnover, accounts receivable turnover, and the short-term interest-bearing debt ratio are selected to characterize resilience features in inventory monetization, receivable collection, and debt maturity structure.
- (4)
- Growth and value resilience dimension. This reflects real estate firms’ recovery and regrowth capabilities after crises [36,37]. Indicators such as the operating revenue growth rate, net profit growth rate, total asset growth rate, and Tobin’s Q are selected to characterize growth resilience and value resilience from the perspectives of scale expansion, earnings growth, and capital market expectations.
Overall, the 13 financial ratios selected in this study strike a balance between theoretical relevance, data availability and cross-firm comparability in the Chinese real estate context. Classic solvency and liquidity ratios capture the ability to withstand funding shocks; profitability and cash flow ratios reflect the quality and sustainability of earnings; turnover and debt-structure ratios characterize the speed and rigidity of asset monetization; and growth and value indicators proxy firms’ recovery and regeneration prospects in the capital market. Alternative indicators such as interest coverage, leverage-adjusted profitability or more granular cash flow metrics were considered but excluded either because of severe data gaps for some firms or because they are highly collinear with the chosen indicators. The final indicator set therefore aims to be parsimonious yet sufficiently rich to characterize key resilience dimensions of listed real estate companies.
From the perspective of the stages of resilience, the four dimensions play different but complementary roles. Solvency and liquidity primarily underpin the resistance and absorption stages, determining whether a firm can withstand and buffer short-term funding shocks. Profitability and cash flow are crucial for the absorption and recovery stages, reflecting the firm’s capacity to generate earnings and internal cash inflows during and after the shock. Operational efficiency and asset structure support both resistance and recovery, as they determine how quickly inventories can be monetized and receivables can be collected and how the maturity structure of interest-bearing liabilities amplifies or dampens shocks. Finally, the growth and value dimension is more closely related to the adaptation and regeneration stages, capturing the firm’s ability to restore growth trajectories and rebuild market valuation once the acute phase of the crisis has passed.
Notably, during the 2017–2024 period, China’s real estate sector experienced a prolonged downturn and valuation compression. Consequently, Tobin’s Q reflects not only firm-specific growth prospects but also sector-wide sentiment and risk aversion. To mitigate this issue, we combine Tobin’s Q with accounting-based growth indicators such as operating revenue growth, net profit growth and total asset growth so that growth and value resilience are jointly captured from both market-based and accounting perspectives. Nonetheless, we recognize that not explicitly controlling for sector-wide valuation and sentiment effects is a limitation of the present study, and we suggest that future research may employ sector-adjusted valuation measures or factor-model residuals to further purify market-based growth indicators.
With respect to potential redundancy among indicators, we examine the correlation between ROA and ROE and find a moderate Pearson correlation coefficient of approximately 0.55 in our sample, which does not indicate severe multicollinearity. Conceptually, ROA emphasizes the efficiency of asset utilization from a managerial perspective, whereas ROE reflects shareholders’ return and is more closely linked to capital market valuation. Retaining both indicators therefore allows us to capture profitability and value resilience from the complementary viewpoints of management and equity investors.
4. Empirical Analysis
4.1. Sample Selection and Data Sources
In this paper, 37 listed real estate companies with no missing data among those listed on the Shanghai and Shenzhen stock exchanges by the end of 2016 are selected as the research objects, as shown in Table 1. Indicator data are obtained mainly from the annual reports of listed firms and the WIND database. To ensure continuity and comparability, firms with severe data omissions or major financial anomalies are excluded.
Table 1.
Sample List.
Moreover, the exclusion of firms with severe data omissions or major financial anomalies may introduce a certain degree of survivorship bias. The final sample is closer to the subset of real estate developers that remained continuously listed and maintained relatively complete disclosure from 2017–2024. As a result, the resilience index and its distribution should be interpreted primarily for this group of firms, and some caution is needed when the findings are extrapolated to the broader population of unlisted or financially distressed developers.
To characterize the distributional features of the indicators, we also compute descriptive statistics (mean, standard deviation, minimum and maximum) for all 14 variables over the 2017–2024 period. In general, the mean asset–liability ratio is approximately 52.9%, with a standard deviation of approximately 13.4%, indicating relatively high leverage and notable cross-firm heterogeneity. The average cash-to-short-term-debt ratio is approximately 31.7, with a standard deviation of 25.7, reflecting large differences in short-term liquidity buffers. The operational indicators show even stronger dispersion: for instance, accounts receivable turnover has an average of approximately 141 times with a very large standard deviation, signaling that some firms adopt an extremely fast collection model, while others suffer from significant capital lock-up. The growth-related indicators, especially net profit growth, exhibit extreme volatility with large negative minima and positive maxima, confirming that the sample period can be considered a stress environment for the sector.
4.2. Entropy-Weight Results and Enterprise Resilience Evaluation
On the basis of all sample data from 2017–2024, indicator weights are calculated using the entropy-weight method, as shown in Table 2. Overall, among the first-level resilience dimensions, the operational efficiency and asset structure dimension has the highest weight (0.6909), followed by the solvency and liquidity dimension (0.1352). The weights of the growth and value dimension and the profitability and cash flow dimension are 0.1255 and 0.0484, respectively. At the second-level indicator level, accounts receivable turnover and inventory turnover have weights as high as 0.4041 and 0.2771, respectively, while the cash-to-short-term-debt ratio and Tobin’s Q also have relatively high weights. These findings indicate that in the current regulatory and market environment of “deleveraging and steady operations” in the real estate industry, enterprise resilience is driven mainly by operating efficiency, asset structure safety, and short-term liquidity safeguards, whereas profitability and short-term growth, while important, play relatively limited marginal roles in overall resilience.
Table 2.
Weights of Indicators at Each Level.
These results are broadly consistent with the resilience literature emphasizing that “operating efficiency–solvency safety–growth potential” jointly constitutes the foundation of resilience [36,38], indirectly validating the rationality and effectiveness of the indicator selection and model construction in this paper.
Using Formulas (6)–(10), the closeness coefficient Vi for each sample firm from 2017–2024 is calculated, and firms are ranked on the basis of the intertemporal average V value, as shown in Table 3. It can be seen that Shahe Co., Shenzhen, China, Huafa Co., Zhuhai, China, Wantong Development, Beijing, China, Pearl River Co., Guangzhou, China, Quzhou Development, Quzhou, China, China Enterprise, Shanghai, China, Yuehongyuan A, Dongguan, China, Shen Zhenye A, Shenzhen, China, Seazen Holdings, Shanghai, China, and New Huangpu, Shanghai, China rank among the top 10 by average V value, with overall manageable cross-year standard deviations. These findings indicate that these firms perform well in terms of capital structure, liquidity safety, operating efficiency, and profitability and growth, demonstrating strong financial resilience and shock resistance, and can be classified as the “high-resilience” group. In contrast, Fuxing Co., Wuhan, China, Suzhou New District High-Tech, Suzhou, China, Beijing Investment Development, Beijing, China, Tibet Metropolitan Investment, Lhasa, China, Nanjing High-Tech, Nanjing, China, GuanCheng New Materials, Fuzhou, China, Rongsheng Development, Langfang, China, Bright Real Estate, Shanghai, China, Greenland Holdings, Shanghai, China, and Yunnan Metropolitan Investment, Kunming, China are in the tail of the sample distribution according to the average V-value, and some show high volatility, indicating varying degrees of fragility in leverage, short-term solvency pressure, and operating efficiency, and can be classified as the “low-resilience” group. These results corroborate the earlier analysis based on entropy weights and reveal significant differentiation in enterprise resilience among listed real estate companies at the micro level.
Table 3.
Ranking of V-values for Enterprises, 2017–2024.
4.3. Robustness Analysis
To test whether the enterprise resilience evaluation results constructed by the entropy-weighted TOPSIS method are robust, this paper further uses principal component analysis (PCA) to conduct a comparative analysis based on cross-sectional data for 2024. After the 13 indicators are standardized, PCA is used to extract principal components and compute composite scores, yielding each firm’s PCA ranking. Table 4 reports a comparison between the V values and rankings from entropy-weighted TOPSIS and composite scores and rankings from PCA.
Table 4.
Enterprise Resilience TOPSIS Ranking and PCA Ranking (2024).
As shown in Table 4, Wantong Development, Beijing, China, Pearl River Co., Guangzhou, China, Yuehongyuan A, Dongguan, China, Shahe Co., Shenzhen, China and Quzhou Development, Quzhou, China rank among the top firms in terms of the PCA composite scores, whereas firms such as Fuxing Co., Wuhan, China, Huafa Co., Zhuhai, China and Beijing Investment Development, Beijing, China are located near the bottom. This pattern is broadly consistent with the classification of “high-resilience” and “low-resilience” groups under the entropy-weighted TOPSIS model, although the relative positions of several firms differ between the two methods. A Spearman rank correlation test is used to examine the association between the two sets of rankings. The resulting rank correlation coefficient is approximately 0.580 and is significantly positive at the 1% level, indicating a moderate degree of consistency between the distance-based entropy-weighted TOPSIS scheme and the variance-based PCA scheme in identifying higher- versus lower-resilience firms. Given the substantial differences in evaluation logic—TOPSIS evaluates proximity to an ideal solution, while PCA extracts components that maximize explained variance—we treat PCA as a complementary cross-check rather than a strict validation of the entropy-weighted TOPSIS rankings. This also highlights that detailed rankings may still be sensitive to model choice, which warrants further robustness analysis using alternative MCDM models and weight perturbation techniques in future research.
In other words, whether the distance-based entropy-weighted TOPSIS method or the dimensionality-reduction-based PCA method is used, the overall direction of the resilience ranking and the high/low grouping of sample developers are essentially consistent. These findings indicate that the enterprise resilience evaluation conclusions derived from the entropy-weighted TOPSIS method in this paper have good methodological robustness and reliability and can serve as a solid measurement basis for subsequent empirical analysis and policy recommendations.
4.4. Sensitivity Analysis of Weighting Schemes
To examine the sensitivity of our resilience results to weight determination, we recompute the TOPSIS scores using two alternative weighting approaches that are commonly used in objective multicriteria evaluation: (i) equal weights and (ii) CRITIC weights (which incorporate both dispersion and intercriterion conflict). We then compare the intertemporal average rankings (2017–2024) with the baseline entropy-weighted TOPSIS rankings.
The results suggest that the main classification of high-versus low-resilience developers remains qualitatively stable. Specifically, the Spearman rank correlation between the entropy-based ranking and the equal-weight TOPSIS ranking is approximately 0.665, whereas the correlation between the entropy-based ranking and the CRITIC-weight TOPSIS ranking is approximately 0.547. Moreover, the overlap of the top-10 firms under entropy weights with those under equal weights and CRITIC weights is 5 and 4, respectively. These sensitivity results indicate that although marginal positions can vary with weighting choices, our core findings—namely, the prominent role of liquidity safety and asset turnover in resilience differentiation—are not driven solely by a single weighting scheme.
Because subjective weighting methods such as the AHP or BWM require expert elicitation and may vary across decision contexts, we do not implement them in the current revision. Integrating subjective–objective hybrid weighting and conducting Monte Carlo weight-perturbation analysis under stress scenarios are important directions for future work (see Section 6.3).
5. Results and Discussion
To further reveal microlevel differences in enterprise resilience, this paper ranks sample developers on the basis of their average entropy-weighted TOPSIS closeness coefficient Vi for 2017–2024. The top 10 and bottom 10 firms by mean V value are selected as the “high-resilience group” and “low-resilience group”, respectively, and differences in financial structure and operating performance are compared (see Table 5).
Table 5.
Interfirm Differences in the Enterprise Resilience Index of Listed Real Estate Companies.
First, the comparison of capital structure and solvency indicators suggests that high-resilience developers tend to operate within a prudential leverage corridor, whereas low-resilience firms often remain close to or beyond regulatory risk thresholds. High-resilience firms typically combine more moderate asset–liability ratios with relatively comfortable current and quick ratios. This indicates that they have internalized the constraints of the “Three Red Lines” regime and adjusted their balance-sheet strategies in a timely manner, for example, by slowing expansion, reducing reliance on short-term interest-bearing debt, and aligning investment pace with realistic cash flow generation capacity. In contrast, low-resilience firms generally maintain higher leverage and a larger share of short-term liabilities, leaving them more exposed to refinancing and rollover risk when sales slow and financing conditions tighten. From a resilience perspective, the former group has built a stronger “defensive shield” against funding shocks, while the latter group operates much closer to the boundary of solvency.
Second, liquidity buffers and the quality of operating cash flows constitute another critical dividing line. High-resilience developers systematically hold stronger cash cushions relative to short-term debt and exhibit more stable coverage of operating cash flows over time. In practice, this often reflects more conservative debt maturity management, stricter control of presale receipts, and more disciplined policies on land acquisition and project expansion. These firms are able to preserve cash buffers even when external financing becomes less accessible, thereby cushioning the impact of market downturns. Low-resilience firms, in contrast, are characterized by thin cash buffers and highly volatile operating cash flows. Temporary disruptions in sales or credit supply can therefore quickly translate into liquidity stress, forcing them to cut back on investment, delay projects or dispose of assets at unfavorable prices. This pattern underscores that resilience is not only about surviving a single shock but also about maintaining a sustainable and internally generated “cash engine” that supports recovery and adaptation.
Third, differences in operating efficiency and asset monetization speed are particularly pronounced and help explain why the operational efficiency and asset structure dimension receive the highest entropy weight in our model. High-resilience firms consistently achieve faster turnover of inventories and accounts receivable, indicating more refined project scheduling, pricing, and customer collection management. They are better able to convert contracted sales into cash, reduce capital lock-up in projects, and shorten the cash conversion cycle. These features jointly enhance their ability to absorb and recover from shocks because working capital is recycled more quickly and can be redeployed to stabilize operations. Low-resilience firms, by contrast, typically suffer from slower turnover of inventories and receivables, signaling weaker execution in project delivery, sales, and postsale collection. In a capital-intensive, high-leverage industry, sluggish turnover effectively amplifies the impact of external shocks on internal cash flows and solvency, thereby eroding resilience.
Fourth, the profitability and growth profiles of the two groups reveal different risk–return configurations. High-resilience developers do not necessarily pursue the highest short-term growth rates; instead, they tend to maintain moderate but relatively stable levels of ROA and ROE and avoid prolonged periods of deep losses. Their revenue and profit paths exhibit fewer extreme swings, even during years of tightening regulation or pandemic disruption, suggesting that they adopt more cautious expansion strategies, diversify income sources, and pay greater attention to earnings quality. In contrast, low-resilience firms often display a “boom–bust” pattern: phases of aggressive expansion and temporarily strong performance are followed by sharp contractions in profits and persistent negative growth. This implies that resilience is linked not only to the level of profitability but also to its volatility and the firm’s ability to contain downside risk.
From a dynamic perspective, the time paths of the resilience index further differentiate the two groups. Many high-resilience developers show a situation of “temporary decline followed by relatively rapid recovery” around major shocks such as the COVID-19 outbreak and the implementation of stricter financing regulations. Their Vi values may dip during stress episodes but tend to revert toward or above their preshock levels within a few years, indicating that they are capable of reconfiguring resources, adjusting project portfolios, and realigning their financing structures. In contrast, the resilience indices of low-resilience firms frequently remain depressed for prolonged periods or improve only marginally despite policy easing or temporary market rebounds. This suggests that deep-seated structural issues—such as rigid governance, overdependence on a single business model, or chronic underinvestment in operational capabilities—limit their capacity to regenerate aftershocks.
Overall, the comparison between high- and low-resilience developers indicates that enterprise resilience in listed real estate companies is not driven by any single financial indicator but by a coherent configuration of financial and operating attributes. High-resilience firms combine more robust capital structures, stronger liquidity buffers, faster asset monetization, and more stable profitability and growth, forming an integrated capability bundle of “defense–recovery–growth”. In contrast, low-resilience firms tend to accumulate vulnerabilities across these dimensions—high and rigid leverage, concentrated short-term debt, fragile cash flows, slow turnover, and volatile earnings—which cause external shocks to translate more easily into liquidity crises and even default. These findings provide microlevel support for the entropy-weighted results, highlighting that in the current Chinese real estate context, operational efficiency and liquidity safety are the core levers through which firms can build and sustain enterprise resilience.
Beyond the empirical patterns, the findings also carry several theoretical implications. First, the dominant role of operational efficiency and liquidity buffers in shaping resilience supports a resource-based and dynamic-capability view of real estate firms, in which the ability to reconfigure working capital, accelerate asset monetization and maintain funding flexibility becomes a central strategic capability under prolonged shocks. Second, the pronounced difference between high- and low-resilience developers illustrates how similar regulatory and macro shocks can lead to very different trajectories depending on firms’ precrisis financial structures and governance choices, thereby linking microlevel resilience to macrofinancial stability. Third, by operationalizing enterprise resilience through an entropy-weighted TOPSIS index, this study provides a tractable bridge between the conceptual resilience literature and empirical work on digital transformation, ESG practices and patient capital, enabling future research to more systematically examine how these factors contribute to building resilience in highly leveraged industries.
6. Conclusions and Recommendations
Under a highly uncertain macro environment and stringent supervisory policies, listed real estate companies face significantly increased leverage levels, liquidity risks, and earnings volatility. Systematically identifying enterprise resilience levels and revealing their internal heterogeneity is highly important for preventing systemic industry risk and promoting the stable and healthy development of the real estate sector. On the basis of the public financial data of 37 listed real estate companies on the Shanghai and Shenzhen stock exchanges from 2017–2024, an enterprise resilience evaluation index system across four dimensions—debt and liquidity, profitability and cash flow, operational efficiency and asset structure, and growth and value—is constructed. The entropy-weighted TOPSIS method is introduced to objectively determine indicator weights and the enterprise resilience index, and PCA is used for robustness testing. On this basis, differences in financial characteristics between high-resilience and low-resilience developers are further compared, leading to the following main conclusions and policy recommendations.
6.1. Main Conclusions
- (1)
- From the perspective of indicator weights, the operational efficiency and asset structure dimension is currently the most important source of enterprise resilience for listed real estate companies. The entropy weight results reveal that the weight of this dimension reaches 0.6909, and the weights of accounts receivable turnover and inventory turnover are 0.4041 and 0.2771, respectively, far exceeding those of the other indicators. The solvency and liquidity dimension has a weight of 0.1352, with a relatively high weight for the cash-to-short-term-debt ratio. This reflects an industry consensus that under regulatory constraints such as the “Three Red Lines”, enhancing resilience relies on improving sales collections, accelerating inventory turnover, and maintaining reasonable cash coverage of short-term debt. In contrast, the profitability and cash flow dimension and the growth and value dimension have relatively lower weights, yet they still reflect the supporting role of earnings quality and long-term value expectations through indicators such as ROA, ROE, operating revenue and net profit growth rates, and Tobin’s Q. This conclusion is consistent with the literature emphasizing that operating efficiency and capital structure play critical roles in enterprise resilience under crisis scenarios [28,29,30,31,32].
- (2)
- In terms of interfirm differences, sample developers exhibit a pronounced “high-resilience vs. low-resilience” differentiation pattern for 2017–2024. Ranked by the intertemporal average V value, firms such as Shahe Co., Huafa Co., Wantong Development, Zhujiang Co., Quzhou Development, China Enterprise, Yuehongyuan A, Shen Zhenye A, Seazen Holdings, and New Huangpu are among the “high-resilience” group. They are characterized by asset–liability ratios within the regulatory safe range; higher current ratios and cash-to-short-term-debt ratios; relatively lower short-term debt pressure; faster receivables and inventory turnover; higher fund turnover efficiency; and generally positive ROA, ROE, operating revenue growth, and net profit growth in most years, indicating relatively stable profitability and growth. Conversely, “low-resilience” developers such as Yunnan Metropolitan Real Estate, Greenland Holdings, Bright Real Estate, and RiseSun Development remain at the tail of the sample for extended periods, commonly featuring high leverage, high proportions of short-term interest-bearing debt, low cash-to-short-term-debt ratios, slow receivables and inventory turnover, and persistently weak profitability and growth, making them more vulnerable to liquidity tensions and even credit default risks under demand downturns and financing tightening.
- (3)
- In terms of temporal evolution and methodological robustness, some high-resilience developers display a “short-term decline–rapid recovery” V-value trajectory during the pandemic shock and financial deleveraging phases, whereas low-resilience developers are more likely to remain trapped at long-term low levels. For example, Shahe Co. and Wantong Development experienced significant V-value improvements in approximately 2019, with some declines after the outbreak of the pandemic in 2020 but rapid recovery from 2021–2023 and a return to the top of the sample. In contrast, firms such as Yunnan Metropolitan Real Estate and Greenland Holdings remain near the bottom in multiple years, indicating emphasise structural problems that short-term policy support cannot fundamentally resolve. The PCA robustness results reveal a significant positive correlation between the rankings derived from entropy-weighted TOPSIS and PCA at the 1% significance level (Spearman’s rank correlation coefficient of approximately 0.580), indicating good methodological consistency and robustness of the enterprise resilience index constructed in this paper and providing a reliable measurement foundation for subsequent empirical research and policy analysis.
6.2. Policy Recommendations
On the basis of the above findings, this paper proposes the following recommendations from both regulatory authorities’ and corporate management’s perspectives:
- (1)
- Regulatory and policy level.
First, under the existing framework of “housing is for living in, not for speculation” and the “Three Red Lines”, it is advisable to further improve differentiated supervision and financial support arrangements oriented toward enterprise resilience. The enterprise resilience index and its key financial subindicators (such as the cash-to-short-term-debt ratio and receivables and inventory turnover) can be incorporated into risk monitoring and early warning systems for real estate firms. More stringent disclosure requirements and financing constraints should be imposed on high-leverage, low-turnover, and low-resilience developers to push them to accelerate deleveraging and asset disposal. Second, for developers with higher resilience, robust capital structures, and regional supporting functions and livelihood protection attributes, moderate liquidity support and credit enhancement can be provided through channels such as credit, bonds, and equity to prevent a negative “liquidity crisis–credit crisis” loop triggered by short-term liquidity shocks. Third, policymakers should encourage and guide real estate firms to transform toward areas such as urban renewal, affordable housing, industrial park development, urban operations, and property services, supporting them in enhancing long-term resilience through business model innovation and business diversification and reducing their dependence on returns from single residential development.
- (2)
- Corporate management level.
Listed real estate companies should incorporate resilience enhancement into the core objectives of corporate strategy and risk management. First, firms should reasonably control leverage levels and debt maturity structures, strictly limit the proportion of short-term interest-bearing debt, and improve the cash-to-short-term-debt ratio and operating cash flow coverage by strengthening sales collection management, optimizing the presale pace, and reducing investment in high-risk projects to solidify liquidity safety margins. Second, firms should continuously increase their operating efficiency and asset turnover speed by optimizing process management across the full cycle of project development, sales, and delivery; improving receivable collection efficiency and inventory turnover through refined pricing strategies and customer operations; and strengthening agility and adaptability under demand fluctuations. Third, firms should emphasize earnings quality and long-term value creation: while controlling the expansion pace, they should improve ROA and ROE through product structure upgrading, city layout optimization, and digital transformation and improve capital market expectations through strong ESG performance and disclosure quality, thereby forming a virtuous cycle of “profitability–value–resilience”. Fourth, firms should strengthen comprehensive risk management and corporate governance by establishing full-process risk control systems covering investment decisions, financing arrangements, fund management, and project operations; avoiding aggressive strategies that pursue short-term scale and rankings at the expense of prudence; and enhancing organizational learning and self-repair capabilities under uncertainty.
6.3. Limitations and Future Research
Despite the above contributions, this study has several additional limitations that point to avenues for future research. First, the resilience indicator system is constructed entirely from publicly disclosed financial statement data. While this choice enables larger-sample comparability, it does not explicitly incorporate “soft” determinants of resilience, such as governance structure, organisational culture, digitalization, supply chain collaboration or stakeholder relationships. Consequently, the index may underestimate the resilience advantages of firms that are strong in these nonfinancial dimensions. Future work could integrate survey-based or text-based measures (e.g., ESG disclosure, board characteristics, or digital transformation indicators) into a richer resilience framework.
Second, our sample consists only of A-share listed real estate developers with relatively complete financial data, which may introduce survivorship and selection bias. The results should therefore be interpreted primarily for continuously listed and relatively transparent firms rather than for the entire population of developers, including unlisted or severely distressed entities. In addition, during 2017–2024, the sector experienced pronounced valuation compression and sentiment swings; thus, market-based indicators such as Tobin’s Q inevitably embed both firm-specific expectations and sector-wide pessimism. Future research may construct sector-adjusted valuation metrics or factor-model residuals and extend the analysis to include delisted or privately held developers to obtain a more comprehensive picture of industry-wide resilience.
Third, from a methodological perspective, we employ entropy-weighted TOPSIS as the baseline MCDM model and use PCA as a complementary cross-check of the rankings. While this combination is transparent and replicable, it is not exhaustive. Entropy weighting emphasizes data dispersion and does not directly reflect the theoretical importance of indicators, and TOPSIS is potentially susceptible to rank reversal. We do not yet provide a systematic comparison with alternative MCDM methods such as VIKOR, PROMETHEE, AURA or IVPNS–COBRA under the same indicator system and weights, nor do we conduct Monte Carlo-based weight perturbation or scenario-based sensitivity analysis. These limitations suggest that future research should apply multiple MCDM tools under unified conditions and examine the stability of resilience rankings across models and stress scenarios.
Finally, the present study provides a static measurement of enterprise resilience and does not explicitly model how firms can adjust strategies, restructure debt or transform business models to enhance resilience. A natural next step is to use the resilience index developed here as a dependent variable in panel regressions or event-study frameworks to investigate how digital transformation, ESG performance, patient capital, government support programs and other strategic choices influence the evolution of resilience over time. Such dynamic analyses would deepen our understanding of the mechanisms behind resilience building and provide more concrete guidance for both regulators and corporate decision makers.
Author Contributions
Data curation: Y.Z. (Yipeng Zheng) and D.X. Investigation: Y.Z. (Yan Zheng) and Y.Z. (Yipeng Zheng). Formal analysis: B.Z. and Y.Z. (Yan Zheng). Writing—original draft: B.Z. and D.X. Writing—review and editing: B.Z. All authors have read and agreed to the published version of the manuscript.
Funding
This work was supported by the Fujian University of Technology Development Fund (GrantGY-H-21016).
Institutional Review Board Statement
Not applicable.
Informed Consent Statement
Not applicable.
Data Availability Statement
The raw data supporting the conclusions of this article will be made available by the authors on request.
Conflicts of Interest
The authors declare that they have no known competing financial interests or personal relationships that could have appeared to influence the work reported in this paper.
References
- Holling, C.S. Resilience and stability of ecological systems. Annu. Rev. Ecol. Syst. 1973, 4, 1–23. [Google Scholar] [CrossRef] [Scilit]
- Walker, B.; Holling, C.S.; Carpenter, S.R.; Kinzig, A. Resilience, adaptability and transformability in social–ecological systems. Ecol. Soc. 2004, 9, art5. [Google Scholar] [CrossRef] [Scilit]
- Lengnick-Hall, C.A.; Beck, T.E. Developing a capacity for organizational resilience through strategic human resource management. Hum. Resour. Manag. Rev. 2011, 21, 243–255. [Google Scholar] [CrossRef] [Scilit]
- Lengnick-Hall, C.A.; Beck, T.E. Adaptive fit versus robust transformation: How organizations respond to environmental change. J. Manag. 2005, 31, 738–757. [Google Scholar] [CrossRef] [Scilit]
- Duchek, S. Organizational resilience: A capability-based conceptualization. Bus. Res. 2020, 13, 215–246. [Google Scholar] [CrossRef] [Scilit]
- Ortiz-de-Mandojana, N.; Bansal, P. The long-term benefits of organizational resilience through sustainable business practices. Strateg. Manag. J. 2016, 37, 1615–1631. [Google Scholar] [CrossRef] [Scilit]
- Chen, R.; Liu, H.; Zhang, W.; Xu, P.; Guo, Y. Defining, conceptualizing, and measuring organizational resilience. Sustainability 2021, 13, 2517. [Google Scholar] [CrossRef] [Scilit]
- Jiang, N.; Li, P.-Y.; Liang, J.-M.; Liu, X. A bibliometric analysis of research on organizational resilience. Heliyon 2024, 10, e30275. [Google Scholar] [CrossRef] [Scilit] [PubMed]
- Bistrova, J.; Lace, N. Enterprise crisis-resilience and competitiveness. Sustainability 2021, 13, 2057. [Google Scholar] [CrossRef] [Scilit]
- Zeng, X.; Wang, S.; Li, J.; Wang, Y.; Liu, Y. Urban resilience for urban sustainability: Concepts, dimensions and indicators. Sustainability 2022, 14, 2481. [Google Scholar] [CrossRef] [Scilit]
- Esposito, D.; Mastrorillo, L.; Poles, L.; Sannino, G. A ladder of urban resilience: An evolutionary framework for sustainable cities. Sustainability 2025, 17, 6010. [Google Scholar] [CrossRef] [Scilit]
- Saptono, Y.; Rustiadi, E.; Barus, B.; Pravitasari, A.E. Systematic literature review: Research development of urban resilience. Sustainability 2025, 17, 7380. [Google Scholar] [CrossRef] [Scilit]
- Han, C.; Li, Y.; Wang, S.; Zhang, T. Can new consumption promote urban industrial resilience? PLoS ONE 2025, 20, e0323101. [Google Scholar] [CrossRef] [Scilit]
- Yang, Y.; Liu, H.; Chen, J.; Li, B. Debt financing costs, patient capital, and the resilience of real estate enterprises. Financ. Res. Lett. 2025, 83, 102015. [Google Scholar] [CrossRef] [Scilit]
- Brill, F.; Raco, M.; Ward, C. Anticipating demand shocks: Patient capital and the supply of housing. Eur. Urban Reg. Stud. 2023, 30, 50–65. [Google Scholar] [CrossRef] [Scilit]
- Zhang, S.J.; Zhang, F.D.; Xue, B.; Wang, D.; Liu, B.S. Unpacking resilience of project organizations: A capability-based conceptualization and measurement of project resilience. Int. J. Proj. Manag. 2023, 41, 102541. [Google Scholar] [CrossRef] [Scilit]
- Chen, C.; He, W. Resilience measurement and enhancement strategies for Meizhou Bay port enterprises. Sustainability 2024, 16, 5708. [Google Scholar] [CrossRef] [Scilit]
- Lam, W.S.; Lam, W.H.; Jaaman, S.H.; Liew, K.F. Performance Evaluation of Construction Companies Using Integrated Entropy-Fuzzy VIKOR Model. Entropy 2021, 23, 320. [Google Scholar] [CrossRef] [Scilit]
- Li, C.; Wang, X.; Zhao, Y.; Wu, D. Digital transformation and enterprise resilience: Enabling or inertia? PLoS ONE 2024, 19, e0305615. [Google Scholar] [CrossRef] [Scilit]
- Xu, Y.; Xu, L.; Shen, Y.; Fan, Z. Exploring the effect of digital transformation on firm resilience: Evidence from China. J. Asian Econ. 2024, 95, 101812. [Google Scholar] [CrossRef] [Scilit]
- Zhan, Y.Q.; Li, W.H. Has digital transformation enhanced the resilience of enterprises? Int. Rev. Econ. Financ. 2024, 96, 103688. [Google Scholar] [CrossRef] [Scilit]
- Wang, N.; Cui, D. Evaluation index system and quantitative analysis of enterprise resilience. J. Ind. Technol. Econ. 2023, 42, 86–95. [Google Scholar] [CrossRef]
- Luo, X.; Kang, K.; Lu, L.; Yu, C.; Li, C.; Li, B.; Hu, S.; Qi, X.; Zhou, Y. Resilience evaluation of low-carbon supply chain based on improved matter-element extension model. PLoS ONE 2024, 19, e0301390. [Google Scholar] [CrossRef] [Scilit] [PubMed]
- Zhang, L.; Dou, Y.; Wang, H. How enterprise resilience affects enterprise sustainable development: Empirical evidence from listed companies in China. Sustainability 2025, 17, 988. [Google Scholar] [CrossRef] [Scilit]
- Haghighat, M.; Mousavi, S.M.; Jahadi-Naeni, M. Identifying and ranking of the main organizational resilience indicators in hospitals during the COVID-19 pandemic: A study using FDT and FAHP. Heliyon 2024, 10, e27241. [Google Scholar] [CrossRef] [Scilit]
- Yao, C.-L.; Chen, Y.-J.; Wang, P.-H.; Lin, C.-H. Corporate sustainable development performance through TMT’s transactive memory system and organizational resilience: A moderated mediation analysis. Heliyon 2024, 10, e24674. [Google Scholar] [CrossRef] [Scilit]
- Gunawan, M.; Jacob, J.; Wulandari, D.A.; Siahaan, A.P. How to link organizational resilience to transformational entrepreneurship behavior. Sustainability 2023, 15, 7253. [Google Scholar] [CrossRef] [Scilit]
- Jiang, P.; Hu, Y.-C.; Wang, W.; Jiang, H.; Wu, G. Interval Gray Prediction Models with Forecast Combination for Energy Demand Forecasting. Mathematics 2020, 8, 960. [Google Scholar] [CrossRef] [Scilit]
- Chiu, Y.J.; Hu, Y.C.; Jiang, P.; Xie, J.C.; Ken, Y.W. A Multivariate Gray Prediction Model Using Neural Networkswith Application to Carbon Dioxide Emissions Forecasting. Math. Probl. Eng. 2020, 2020, 8829948. [Google Scholar] [CrossRef] [Scilit]
- Jiang, P.; Hu, Y.C.; Yen, G.F.; Jiang, H.; Chiu, Y.J. Using a Novel Gray DANP Model to Identify Interactions between Manufacturing and Logistics Industries in China. Sustainability 2018, 10, 3456. [Google Scholar] [CrossRef] [Scilit]
- Kamarul Zaman, M.M.; Rodzi, Z.M.; Andu, Y.; Shafie, N.A.; Sanusi, Z.M.; Ghazali, A.W.; Mahyideen, J.M. Adaptive Utility Ranking Algorithm for Evaluating Blockchain-Enabled Microfinance in Emerging—A New MCDM Perspective. Int. J. Econ. Sci. 2025, 14, 123–146. [Google Scholar] [CrossRef] [Scilit]
- Razak, S.A.; Rodzi, Z.M.; Al-Sharqi, F.; Ramli, N. Revolutionizing Decision-Making in E-Commerce and IT Procurement: An IVPNS-COBRA Linguistic Variable Framework for Enhanced Multi-Criteria Analysis. Int. J. Econ. Sci. 2025, 14, 1–31. [Google Scholar] [CrossRef] [Scilit]
- Wang, H.J.; Jiao, S.P.; Ma, C. The impact of ESG responsibility performance on corporate resilience. Int. Rev. Econ. Financ. 2024, 93, 1115–1129. [Google Scholar] [CrossRef] [Scilit]
- Walker, T.; Johnson, R.; Lee, K.; Brown, M. Corporate resilience during crises and the role of ESG factors: Evidence from the COVID-19 pandemic. Financ. Res. Lett. 2024, 61, 106168. [Google Scholar] [CrossRef] [Scilit]
- Liu, H.; Wang, L.; Yang, X.; Zhao, Q. From ESG performance to corporate resilience: Evidence from global listed firms. Sustainability 2025, 17, 9672. [Google Scholar] [CrossRef] [Scilit]
- Xue, Y.; Zhang, C.; Mentel, G.; Si Mohammed, K.; Rosak-Szyrocka, J.; Zhao, X. Impact of ESG rating divergence on corporate resilience: Insights from China’s A-share market. Environ. Dev. Sustain. 2025, 1–26. [Google Scholar] [CrossRef] [Scilit]
- Zhang, Y.; Li, B.; Wang, C. Research on the impact of enterprise artificial intelligence on supply chain resilience: Empirical evidence from Chinese listed companies. Sustainability 2025, 17, 8576. [Google Scholar] [CrossRef] [Scilit]
- Ge, Y.; Jia, W.; Zhao, H.; Xiang, P. A framework for urban resilience measurement and enhancement strategies: A case study in Qingdao, China. J. Environ. Manag. 2024, 367, 122047. [Google Scholar] [CrossRef] [Scilit]
- Zhang, J.; Wang, T. Urban resilience under the COVID-19 pandemic: A quantitative assessment framework based on system dynamics. Cities 2023, 136, 104265. [Google Scholar] [CrossRef] [Scilit]

Disclaimer/Publisher’s Note: The statements, opinions and data contained in all publications are solely those of the individual author(s) and contributor(s) and not of MDPI and/or the editor(s). MDPI and/or the editor(s) disclaim responsibility for any injury to people or property resulting from any ideas, methods, instructions or products referred to in the content. |
© 2026 by the authors. Licensee MDPI, Basel, Switzerland. This article is an open access article distributed under the terms and conditions of the Creative Commons Attribution (CC BY) license.