


Abstract
Severe flooding displaces populations and disrupts access to essential supplies, so relief operations must evacuate victims and deliver survival kits under tight time pressure. This study formulates flood relief route planning as a vehicle routing problem with mixed pickup and delivery (1-M-1/P-D) featuring a heterogeneous multi-trip fleet, node priorities, and a minimum-makespan objective, and develops a mixed integer linear programming (MILP) model together with a customized Differential Evolution (DE) metaheuristic. The methods are evaluated on 24 problem classes (five generated instances each) and on a real case drawn from the 2024 Typhoon Yagi floods in Chiang Mai Province, Thailand (100 demand nodes, 8 vehicles, 3 trips). For the 12 small classes, the MILP model returns proven optima, and DE attains an average heuristic performance of 94.94% with a mean optimality gap of 5.50% (Wilcoxon signed-rank test, p = 0.0005; Cohen’s dz = 1.01). Beyond 30 nodes, the exact model no longer proves optimality within 28,800 s, whereas DE returns feasible solutions for every instance, reaching 81–89% of the corresponding lower bound on the generated large instances and 73% on the real case. The framework is implemented as an intranet decision-support prototype, DisasterthApp; its field validation and comparison with other metaheuristics remain future work.
Keywords:
optimization technique; transportation problem; vehicle routing problem; flood management; disaster relief logistics; web application (intranet) MSC:
90B06; 90C11; 90C59; 90B35
1. Introduction
The world is currently experiencing rapid natural changes, which are leading to an increase in the severity of catastrophic scenarios. Fires, storms, floods, droughts, epidemics affecting humans and animals, aquatic animal diseases, pest infestations, and other incidents that harm the public—whether they are caused by natural forces, human activities, accidents, or other circumstances—are examples of disasters. These occurrences endanger lives and property and may damage both public and state assets. The definition also encompasses air disasters and acts of terrorism [1]. Moreover, such disasters pose major hazards to the lives and property of the public and the nation. They also affect future national growth trends with changes in the catastrophic condition. Therefore, a review of past disaster prevention and mitigation efforts highlights problems and challenges in solving issues of structure, processes, and knowledge. Building a system for disaster prevention, preparedness, and resilience is essential for strengthening the country’s capacity, establishing high standards, and achieving maximum efficiency.
Flooding is one of the recurrent natural disasters in Thailand happening annually. A flood is when water levels exceed normal ground levels because of excessive rainfall, resulting in overflow that exceeds the drainage capacity of rivers and canals. Human activities also cause flooding, either deliberately or accidentally—for example, blocking natural water flow. This causes damage to the life, property, and environment of the public [1]. Flooding can be categorized into two types: (1) inundation/overbank flow and (2) flash floods. The main causes of floods include natural factors and human actions. The natural factors include (1) precipitation, such as rain, snow, or hail; (2) water from storage sources such as dams, reservoirs, floodgates, and weirs; and (3) tidal floods. Human actions based on a lack of environmental awareness also contribute to floods.
Based on historical data from the past 20 years (1989–2009), Thailand has suffered 213 flood incidents that affected 52–74 provinces, with 2938 deaths, 7896 injuries, and 115.786 billion Baht worth of total damage [2]. The 2011 flood was the worst in Thailand’s history, affecting over 12.8 million people and causing over 1.44 trillion Baht worth of damage. This flood submerged more than 150 million rai of land, comprising agricultural and industrial areas in 65 provinces, impacting 684 districts and 6.8 million households, resulting in 813 fatalities [3]. Tropical Storm Podul and Tropical Storm Kajiki more recently triggered flash floods, landslides, and floodwater overflow in Thailand’s northern region in 2019. This disaster impacted 32 provinces, 179 districts, 927 subdistricts, and 6799 villages, affecting 391,557 households and causing 30 deaths [4]. Especially, Typhoon Yagi’s impact in 2024 affected 47 provinces, 287 districts, 1320 subdistricts, and 7035 villages, impacting 268,000 households, and a total of 77 fatalities were reported nationwide. The economic losses caused by the 2024 floods are anticipated to be more 30 billion THB, which is about 0.16% of the country’s Gross Domestic Product (GDP) [5], and related monsoon conditions led to devastating floods over Northern Thailand, with Chiang Mai and Chiang Rai being the most severely affected provinces. In Chiang Mai, the Ping River in late September 2024 reached near record levels of 4.93 m, leading to the worst floods in decades. Mae Ai, Fang, Saraphi, and the Mueang District (downtown Chiang Mai) were severely affected, with seven levels of impact (see Figure 1 [6] and Table 1) on approximately 2978 households. The river overflowed, disrupting major commercial zones, including the Night Bazaar, and causing significant disruption and property damage. Moreover, Mae Ai district in Chiang Mai experienced landslides and flash floods on 10 September 2024, which killed at least 2 people. The previous research indicates that flooding causes substantial casualties and considerable property damage, with the magnitude and severity of these effects escalating over time. Thus, the effective execution of comprehensive risk management strategies for disasters, especially hydrological hazards like flooding, has become crucial for sustainable resilience.
Figure 1.
Chiang Mai flood hazard map during Typhoon Yagi (2024) classified by seven impact levels: (a) Chiang Mai province map; (b) Flood area level 1; (c) Flood area level 2; (d) Flood area level 3; (e) Flood area level 4; (f) Flood area level 5; (g) Flood area level 6; (h) Flood area level 7 (modified from [6]).
Table 1.
Seven flood risk zones in Chiang Mai Province, Thailand, during Typhoon Yagi (2024).
The disaster risk management cycle is widely recognized worldwide. It highlights that disasters can be handled before they happen, unlike the conventional approach focused solely on “Disaster Management” after a disaster has already happened, such as the emergency response and post-disaster recovery. The emphasis has now shifted to “Disaster Risk Management (DRM)”, which consists of two main components: (1) Disaster Risk Reduction (DRR), which includes (1.1) prevention, mitigation, and (1.2) preparedness, and (2) Disaster Management (DM), which involves (2.1) response, relief, and (2.2) recovery. In detail, the process of DRM is as follows: (1) Prevention and Mitigation, which reduces the likelihood of a disaster occurring by implementing land-use management, safety codes, and comprehensive emergency management programs (CEM); (2) Preparedness, which involves the development of plans, training, drills, the installation of warning systems, and the preparation of food and medical supplies; (3) Response and Relief, which focuses on providing immediate aid and reducing damage when a disaster occurs, including rescuing survivors and minimizing harm; and (4) Recovery, which restores normalcy by supporting mental health recovery and rebuilding life conditions in the long term. The process of disaster warning includes (1) Monitoring, (2) Early Warning, (3) Warning, and (4) Evacuation [1]. This research focuses on Disaster Risk Management (DRM), in terms of Disaster Management (DM). In the third step, the Response and Relief process is considered (See Figure 2) [7]. Moreover, in the domain of disaster logistics management, the challenges are greater than those in conventional business logistics due to the diversity of goods and their various sizes, the uncertainty of the required quantities, and the complexity in forecasting human behavior. The goal of logistics management in disaster situations differs from that of traditional business logistics. It focuses on managing donated goods and disaster-affected people to reduce pain and death, rather than on profit-driven supply chains. Therefore, the appropriate strategy is to focus on building the ability to respond to the needs of disaster victims (Agility) (see Table 2) [8].
Figure 2.
Conceptual structure of the DRM process, combining hazard classification, risk reduction measures, disaster management actions, and supporting early warning procedures ([6]; modified from [7]).
Table 2.
Differences in logistics management between business sector and disaster scenarios.
This study aims to integrate disaster risk management, specifically emergency management during a flood. The fundamental principles are (1) to set standards for emergency management, (2) to provide systems or tools to enable emergency responses, and (3) to improve disaster relief systems and practices [1]. This study will develop a mathematical model for route planning to assist flood victims, using the case study of flooding in Chiang Mai Province from Typhoon Yagi in 2024. The relief efforts involve both evacuation and the distribution of survival kits to the victims, considering the urgency of assistance and the categories of victims. The objective is to minimize the time taken to aid the flood victims. It makes the system a decision-support tool for emergency response officers. This study will enable (1) systematic, standardized disaster emergency management; (2) prompt, comprehensive, and timely relief; and (3) a reduction in loss of life and property.
The approach to solving the route planning problem for disaster relief in Chiang Mai Province from the Typhoon Yagi 2024 flood is to find the fastest routes for relief. The problem can be classified as a Vehicle Routing Problem with Mixed Pickup and Delivery (VRPMPD) in the form of 1-M-1/P-D/Heterogeneous fleet sized, node priority, Min . This study is an extension of previous research on vehicle routing problems that consider vehicle time constraints and feasible travel routes, but also includes delivering survival kits to victims, which prior studies did not address [9,10]. Most of the methods used to solve such problems employ mathematical models, heuristics, or metaheuristics methods [11,12]. This research develops an exact model that yields optimal relief routes for small instances and a metaheuristic for realistic instances, and compares the two on generated instances and on the case study. Furthermore, a web application was developed to operationalize the proposed methodology, enabling practical decision-making support for disaster management authorities. Transferring the approach to other hazards requires the accessibility, travel time, and demand data to be re-estimated for that hazard.
The remainder of this paper is organized as follows. Section 2 reviews the related literature, and Section 3 presents the materials and methods. Section 4 formulates the mathematical model, while Section 5 presents the methodology of the proposed metaheuristic approach. Section 6 reports the computational results and their comparison with the case study, and Section 7 describes the software architecture of the flood victim evacuation planning system together with its intranet web application. Finally, Section 8 concludes the paper and summarizes the main findings.
2. Theory and Literature Review
Disaster operations management is a distinct branch of operations research. Surveys by Hoyos et al. [13] and Kaveh et al. [14], and the synthesis of Kamyabniya et al. [15] covering 127 studies from 2013 to 2022, agree that routing and distribution dominate the field and that published models remain distant from operational reality. The literature can be broadly classified into four research streams, three of which are relatively well established.
The first, post-disaster assessment, relies on continuous approximation [16], community selection with routing [17], a drone-and-motorcycle survey [18], and a metaheuristic benchmark [19]. The second, search, rescue, and evacuation, covers ambulance routing by casualty class [20], helicopters serving victims of differing urgency [11], late bushfire evacuees under time windows [9], and unmanned-aerial-vehicle path planning [10]. The third and largest stream couples distribution-center location with relief routing: siting under uncertainty [21], warehouse location-routing [22], split deliveries [23], network failure [24], half-time windows [25], roadway repair [26], depot activation [27], and risk aversion [28].
The fourth research stream remains comparatively underexplored. Very few studies treat relief distribution and victim assistance as one problem, although both activities compete for the same vehicle resources within the same operational time window. Özdamar and Demir [29] combine the two by hierarchical clustering; Bruni et al. [30] argue that arrival time, not cost, determines survival; and Zhan et al. [31] decide sequentially whether to serve a point now or later. Flood-specific work is recent [32,33,34].
Even within this stream, no study grades the service required at each location by urgency, that is, immediate evacuation or acceptable delay, and by victim type, whether patients, children, and the elderly, or the general population. This distinction is particularly relevant to the Thai flood relief context considered in this study, where one relief point dispatches vehicles of markedly different types whose access depends on the local water level, and where vehicle capacity may become a more critical operational constraint than route length. This research therefore develops one model combining delivery, pickup, fleet heterogeneity, multiple trips, and node urgency.
Stating that combination precisely requires a common classification. Vehicle routing problems are characterized by fleet composition, depot count, demand structure, capacity, and objective [35]. Where goods are both collected and delivered, this study adopts the scheme of Berbeglia et al. [36]: the structure field distinguishes many-to-many (M-M), one-to-many-to-one (1-M-1), and one-to-one (1-1) problems. The visit field distinguishes PD, one visit serving both operations; P-D, a node that may be pickup, delivery, or both; and P/D, a node that is exclusively one. Accordingly, the flood relief problem considered in this study is classified as 1-M-1/P-D with a heterogeneous fleet: kits travel outbound from the relief point while victims are collected and returned to it, and a node may require either operation or both. Because operations are judged by when the last victim is assisted, the objective is defined as the makespan, following the scheduling terminology of Pinedo [37], giving 1-M-1/P-D/Heterogeneous fleet, node priority |.
Table 3 classifies the disaster-routing literature under this notation, and three important structural gaps can be identified. Mixed pickup and delivery in the P-D sense is rare, with most contributions being PD or P/D and only [20,29] allowing a node to be both; the closest precedent, Dechampai et al. [38], solves a capacitated P-D routing problem by differential evolution, but for poultry collection with a homogeneous fleet and no urgency; split-demand variants appear in [23,39]. Heterogeneous-fleet considerations are also relatively uncommon [18,29,34], yet in a flood, the water level at a node dictates which vehicle types can reach it. Multiple trips are more common, but never alongside both, so the three features have yet to be combined in a single formulation.
Table 3.
Classification of the disaster relief routing literature and positioning of the present study.
The objective function is a fourth point of divergence. Among the studies in Table 3, dominated by cost and total time criteria, only Oh et al. [11] adopt a completion time criterion. This connects the problem to machine scheduling: each vehicle is a parallel machine, each trip a job, and the completion of the last.
Several constructs transfer directly. Machine-eligibility restrictions [40,41,42], surveyed in [43], are the counterpart of flood-dependent accessibility; the makespan on unrelated parallel machines is treated in [44]; eligibility with setup times and weighted flowtime [45,46] mirrors the service time Si; and the batching literature [47,48] formalizes jobs that are processed together, the counterpart of victims who share a vehicle-trip; population-based search performs well on these structures [49,50], though scheduling omits the spatial dimension: a trip here is a node sequence whose order sets its own processing time.
This correspondence also provides a basis for establishing the computational complexity of the proposed problem. Minimizing the makespan on parallel machines, P||, is strongly NP-complete [51], as are || [42,43] and || [46]. The present problem contains the traveling salesman problem as its single-vehicle, single-trip case and adds capacity, priority, and multi-trip structure; it is therefore strongly NP-hard, making a strong case for metaheuristics at realistic scale.
Among these, differential evolution [52] was devised for continuous optimization. DE offers several advantages, including a relatively small number of control parameters and rapid convergence [50,53]; however, it may suffer from premature convergence to local optima, which is why the algorithm of Section 5 embeds local search and decodes continuous vectors into permutations by rank-order value [53]. Discrete adaptations are competitive on assembly line balancing [54], generalized assignment [55], raw milk collection [56], mixed pickup-and-delivery routing [38], parallel machine scheduling [50], post-earthquake location-routing [23], aerial path planning [10], and rich routing hybridized with variable neighborhood descent [39], as are swarm methods on relief logistics [21]. Lagaros and Karlaftis [19] caution that performance is parameter-sensitive and should be validated against exact benchmarks, as in Section 6.
Taken together, these research streams clarify the positioning and novelty of the present study. To the best of our knowledge, none of the studies reviewed in Table 3 simultaneously incorporates the five features required in the present problem: the 1-M-1/P-D structure appears in none, a heterogeneous fleet in two, multiple trips in several but never with a heterogeneous fleet, an explicit node priority in two [9,20], neither delivering goods on the same tour, and a makespan objective in one.
The contributions of this study are threefold. First, it formulates the integrated problem of flood victim evacuation and survival kit distribution as a 1-M-1/P-D problem with a heterogeneous fleet and node priorities (1-M-1/P-D/Heterogeneous fleet, node priority, ), a problem structure that, to the best of our knowledge, has not previously been addressed, and develops a mixed integer linear programming model in Section 4. Second, Section 5 develops a customized differential evolution algorithm incorporating problem-specific encoding, mutation, recombination, and local search. The algorithm parameters are calibrated using a full factorial experimental design, and its solution performance is validated against exact solutions. Third, the proposed approach is implemented in an intranet-based decision-support prototype and demonstrated through a real-world case study of the 2024 Typhoon Yagi floods in Chiang Mai Province, Thailand.
3. Materials and Methods
This research examines the planning of disaster relief routes for flood victims in Chiang Mai Province after the flooding caused by Typhoon Yagi in 2024. Relief for flood victims involves both evacuation and the distribution of emergency relief packages. The study considers the urgency of aiding victims and analyzes the various types of affected individuals. The following steps constitute the research methodology: (1) Review the relevant background information relating to the nature of the problem. (2) Examine relevant theories, methods, and literature pertaining to the problem, including findings from previous research. (3) Develop a mathematical model and propose a metaheuristic approach to address the problem of planning disaster relief routes. (4) Use the mathematical simulation model to test the accuracy of the model and obtain results. (5) Conduct experimental design and analyze the results by comparing them with the current operational practices in the case study. (6) Develop a web application (Intranet) for flood victims’ evacuation planning. (7) Summarize the research findings and provide recommendations.
Generative AI Disclosure: During the preparation of this manuscript, the authors used ChatGPT (OpenAI, GPT-5.6 Sol) solely for language editing, including checking spelling, grammar, punctuation, and formatting consistency. ChatGPT was also used to assist in preparing Figure 10 only, which provides a graphical summary of the computational results obtained from the experiments reported in Section 6. All numerical data and computational results presented in Figure 10 were independently generated by the authors using the mathematical model (Lingo/CPLEX V.20) and the proposed Differential Evolution (DE) algorithm. The use of ChatGPT was limited to the graphical presentation of these pre-existing experimental results and did not contribute to the study design, mathematical model formulation, data generation, computational experiments, statistical analysis, or interpretation of the results. All AI-assisted content was critically reviewed, verified, and revised by the authors, who take full responsibility for the accuracy, originality, and integrity of the manuscript.
4. Mathematical Model Formulation
The mathematical model formulated for planning the relief route for flood victims is referred to as the Mixed Integer Linear Programming (MILP) model. The case study examines the floods in Chiang Mai province caused by Typhoon Yagi in 2024. The evacuation and distribution of survival kits for the victims are part of the relief operations. The model determines the urgency of relief efforts and the types of victims to minimize the time necessary for aid distribution. The topics include (1) the mathematical model, and (2) examples and results from evaluating the mathematical model.
4.1. Problem Statement and Assumptions
4.1.1. Problem Statement
Relief routes for flood victims are currently planned based on the situation at hand, using the initial information available. This process relies heavily on the experience and expertise of the commanding officers and field personnel. However, there is currently no decision-support tool or system available to assist in planning relief routes; such a decision-support tool or system would considerably enhance the efficiency and speed of the flood relief operations.
The problem of planning relief routes for flood victims, particularly in the case study of the 2024 flooding in Chiang Mai province caused by Yagi, involves both evacuation and the distribution of survival kits to the victims. The relief operation considers the urgency of assistance and the types of victims. This problem can be classified as a Vehicle Routing Problem with Mixed Pickup and Delivery (VRPMPD), which is defined in the 1-M-1/P-D/Heterogeneous fleet sized, node priority, Min , with the objective of minimizing the time required for rescuing flood victims.
In this model, the locations of the victims (Nodes; ) are considered, with being the total number of victim locations. Each location has a demand for the vehicle pickup of a certain number of victims, denoted as , and each location’s weight is represented as (in kilograms). Additionally, survival kits () are distributed at each location . The total number of vehicles is denoted as , where , and represents the number of trips made for flood victim assistance.
The constraints include the time required for each location , denoted as , and the travel time between locations , denoted as , where is the time required to travel from location to location by vehicle . The capacity of each vehicle is constrained by both weight and seating capacity. Each vehicle has a maximum weight capacity, , and a maximum seating capacity, .
Furthermore, the relief operation prioritizes aid based on the urgency, categorized by disaster severity (e.g., immediate evacuation (red) or delayed (green)) and the type of victim (e.g., sick, elderly, or healthy). The victims of one node may be split across several vehicle trips. Each location is assigned a priority weight, . The priority classification is used consistently as follows: two urgency levels (immediate evacuation; delay acceptable) are combined with three victim types (sick; children and elderly; normal individuals). An instance uses either two priority levels (urgency only; for immediate evacuation and for acceptable delay or six levels (urgency × victim type; for the immediate evacuation of sick victims down to 1 for normal individuals whose evacuation can be delayed).
4.1.2. Assumptions
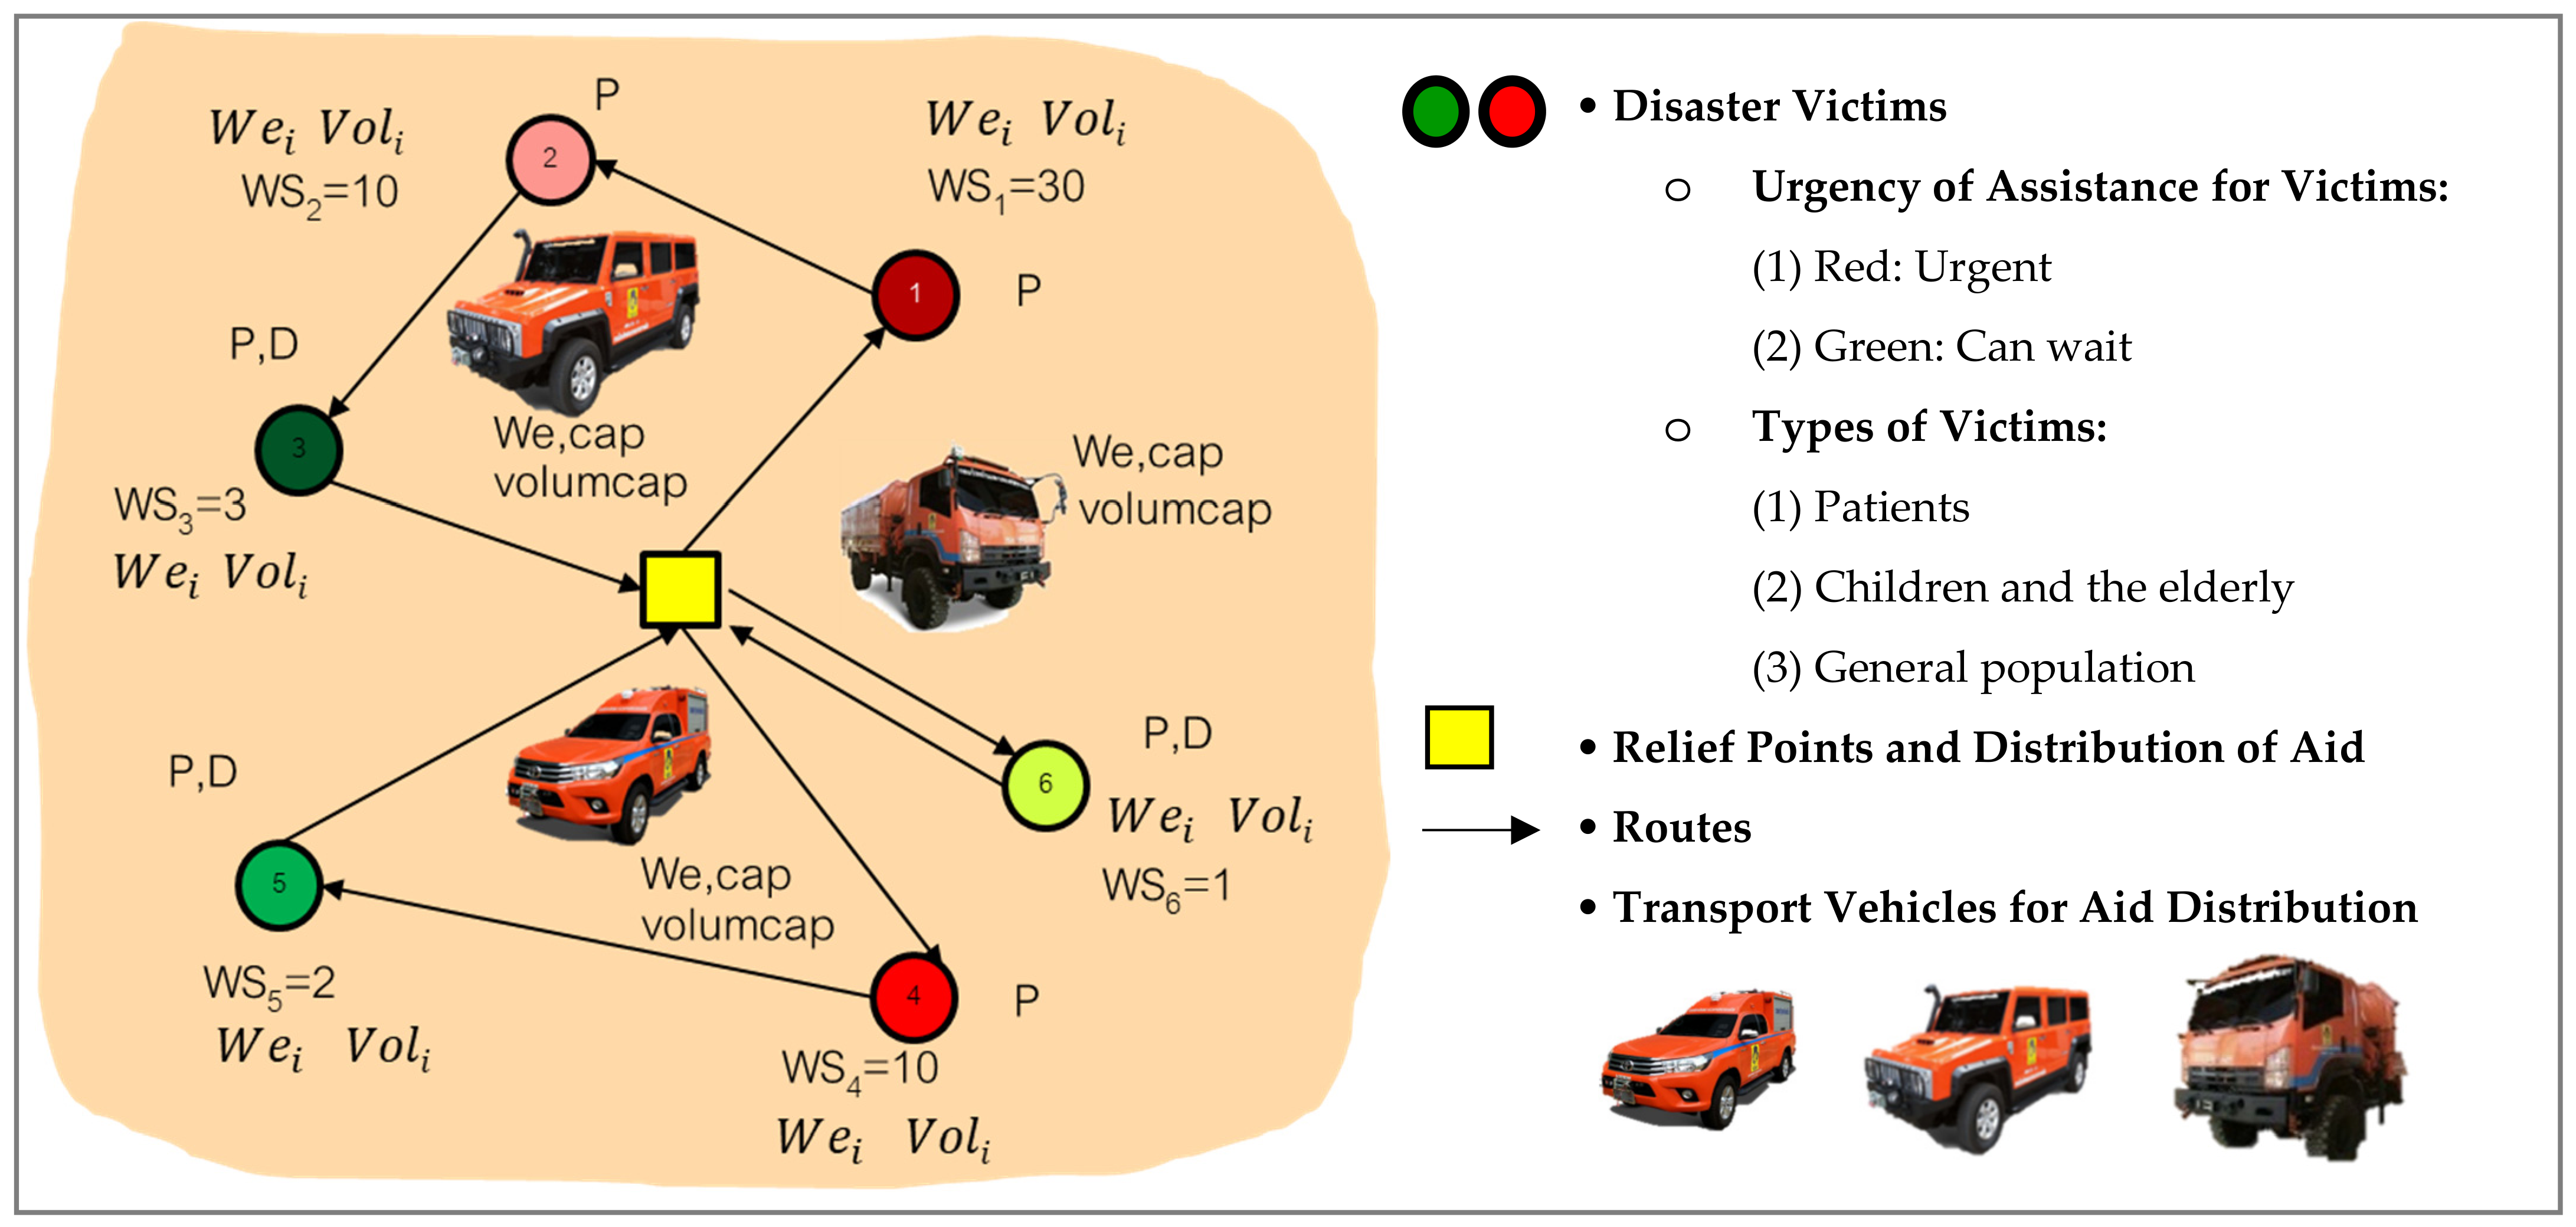
The problem of planning relief routes for flood victims has three main constraints: (1) relief points, (2) disaster victims, and (3) vehicles used for victim assistance. The structure of the problem is illustrated in Figure 3, with further details as follows.
- (1)
- Relief Points
- The relief points (Depot) have an infinite capacity in this area.
- (2)
- Disaster Victims
- The disaster victims are located in the seven major flood risk zones identified in the flood warning map of Chiang Mai municipality, predominantly located within Mueang Chiang Mai district, particularly in subdistricts situated along both banks of the Ping River. However, Zone 7, representing the critical or maximum flood stage, extends beyond the municipal area, with floodwaters spreading into low-lying areas of Saraphi district and Hang Dong district. (The instance test examples focus exclusively on flood zones 1–6.) These areas are situated adjacent to riverbanks, and suffered severe effects from the disaster (see Figure 1 and Table 1).
- The urgency for aid among victims is determined by the severity of the disaster. The urgency levels are (1) immediate evacuation or (2) delay is acceptable. Victims are categorized into the following types: (1) sick, (2) children and elderly, and (3) normal individuals (Priorities). The two urgency levels and three victim types define at most six priority classes, which are mapped to the weights as described in Section 4.1.1.
- The number of victims at a node may exceed the seating capacity of a single vehicle trip. In that case, the node is served by more than one vehicle trip, and the victims and survival bags of that node are split across those visits (split pickup and split delivery).
- (3)
- Vehicles for relief operations
- Vehicles departing from the relief points must always return to the relief points after completing each trip.
- A wide range of vehicles are available, each with a limited quantity.
- The vehicle passenger/cargo capacity and travel speed are limited.
- Vehicles can make multiple trips (Multiple Trips).
- Travel times TTijk are computed on the road network that is passable when the plan is made. A closed link is removed before the shortest paths are computed, a partially damaged link is represented by a longer travel time, and an arc that vehicle cannot traverse is removed from the arc set Ak of that vehicle, so that Xijkt = 0 is imposed through Equation (23) and its travel time does not enter Equations (3), (13), or (14). When the network changes during the operation, the model is re-solved with the updated travel times for the victims not yet served. In the computational experiments, all links were treated as passable and TTijk = distance/average speed.
- The experiments use the land vehicles 1–3. The formulation itself does not depend on the transport mode: a boat enters as a further vehicle k with its own VolCapk, WeCapk, and TTijk (and its own arc set Ak), so land-based, water-based, and mixed fleets differ only in the input data. Multimodal operations with transfers between modes (e.g., boat-to-truck transfer hubs) require transfer nodes and synchronization constraints that are not included in the present model.
Figure 3.
Characteristics of the flood victims’ evacuation planning problem for the case study of flooding in Chiang Mai Province caused by Typhoon Yagi in 2024 (Modified from [7]). Note: Within each color group (red and green), darker shades indicate higher priority levels than lighter shades.
4.2. Parameter Definitions
The notation employed in the proposed mathematical model is systematically organized into four categories: indices, sets, parameters, and decision variables, as defined below.
4.2.1. Indices
| Index of the residential area of victims (Node); represents the depot | |
| Index of the vehicle; | |
| Index of the evacuation trip; |
4.2.2. Set
| Set of residential areas + Depot; | |
| Set of residential areas; | |
| Set of vehicles; | |
| Set of trips for vehicle ; | |
| Set of arcs (i, j) that vehicle k can traverse; arcs that are closed to all traffic or impassable for vehicle k (e.g., water deeper than its wading limit) are excluded; |
4.2.3. Parameters
| A very large number (M = 999,999 in the computational experiments) | |
| Number of nodes, including the depot (N = |V|); the number of demand nodes is |V′| = N − 1 | |
| Number of vehicles (K = |K| in the summation limits) | |
| Maximum number of evacuation trips per vehicle; |Tk| = T for every vehicle in the computational experiments | |
| Weight of the priority term in the single-stage weighted objective Cmax + ε ΣWSiAi; used only for policy (ii) of the sensitivity analysis in Section 6.1 (ε = 0.1). The reported results are obtained with the two-stage lexicographic procedure of Section 4.3.1, which does not require ε | |
| Unit service time per victim loaded (unit: minutes/person) | |
| Average weight per victim at node ; (unit: kilograms/person) | |
| Weight (Priority) of node ; a larger value denotes a higher urgency of evacuation | |
| Service time at node ; (unit: minutes) | |
| Travel time between node and node vehicle (time = distance/speed) (unit: minutes); defined only for arcs (i, j) ∈ Ak, the arcs that vehicle k can traverse | |
| Weight of survival bags that must be delivered to node (unit: kilograms) | |
| Weight of victims that must be picked up at node (unit: kilograms) | |
| Number of victims that must be picked up at node (unit: persons) | |
| Maximum weight capacity of vehicle (unit: kilograms) | |
| Maximum passenger capacity of vehicle (unit: persons) |
4.2.4. Decision Variables
| Maximum total time to provide assistance to flood victims (Makespan) (unit: minutes) | |
| Completion time of the evacuation operation at node by vehicle k on trip t (unit: minutes) | |
| Start time of evacuation operation (Arrival time) at node of vehicle on trip ; for = 1, the departure time of trip t from the depot (unit: minutes) | |
| Payload weight after pickup–delivery at node by vehicle on trip (unit: kilograms) | |
| Cumulative number of victims on board after the pickup–delivery operation at node by vehicle on trip (unit: persons) | |
| Number of victims actually collected at node by vehicle on trip (unit: persons); integer | |
| Weight of survival bags actually delivered at node by vehicle on trip (unit: kilograms) | |
| Service time incurred at node by vehicle on trip ; (unit: minutes); | |
| Time at which the last victim at node has been collected, i.e., the evacuation completion time of node (unit: minutes) | |
| if vehicle travels from node to node on trip ; otherwise |
4.3. Model Formulation
4.3.1. Objective Functions
The objective is stated in lexicographic form in Equation (1) (unit: minutes): the makespan is minimized first and the priority-weighted evacuation completion time second.
Objective (1) is lexicographic: the makespan is minimized first, and the priority term is minimized only among makespan-optimal plans. It is solved by an explicit two-stage procedure. Stage 1 minimizes subject to Equations (2)–(26) and returns the optimal makespan . Stage 2 minimizes subject to Equations (2)–(26) and . The DE algorithm compares solutions in the same order (Section 5.5). A single-stage weighted sum reproduces this order only if , where δ is the smallest positive difference between the makespans of two feasible plans: every plan x with then satisfies , because . With travel times given to 0.001 min and integer service times, δ ≥ 0.001; for the verification instance of Section 6.1 (, min), the bound is . Because this bound depends on the instance and is numerically fragile, the weighted sum is not used to produce any reported result; it appears only as policy (ii) of the sensitivity analysis in Section 6.1.
4.3.2. Constraints
Twenty-five constraints are formulated as follows.
Objective Function (1) sets out a goal of minimizing the total time required for planning the disaster relief route (unit: minutes). The relief operations include both evacuation and the distribution of aid packages to the affected people. This objective function considers the urgency of assisting the victims and the type of victims, restricted by various factors. These constraints are expressed by the subsequent equations: Equation (2): this constraint requires the makespan to be greater than the completion time of the evacuation operation at node of vehicle on trip . Equation (3): the constraint ensures that the completion time of the evacuation operation from node to node at vehicle on trip is equal to or greater than the sum of the start time of the evacuation operation, service time at node , and travel time between nodes and . Equation (4) links the service time to the workload actually performed at a visit, , so that a stop lasts one minute per victim loaded. Equation (5) states that all disaster victims at each point are required to receive assistance. Equations (6) and (7) are the demand-conservation constraints of the split formulation: the victims of node are shared among the vehicle trips that visit it, and so are its survival bags. Equations (8) and (9) link those quantities to the routing variables, so that nothing can be collected or delivered at a node that is not visited. Equation (10) denotes the flow constraints (Flow constraint). Equation (11) mandates that the vehicle on trip is permitted to depart from the depot at most once. Equation (12) fixes only the departure time of the first trip of every vehicle at zero; a later trip starts when the preceding trip has returned (Equation (14)) and not before the preceding departure (Equation (15)). An unused trip has no active arc, so Equations (3), (13), (14), (17), (19) and (22) are relaxed by M for that trip, and it affects neither the makespan nor the priority term. Equations (13)–(15) outline the constraints relating to the beginning time of evacuation (Arrival time) for vehicle during each trip . Equation (16) now accumulates the survival bag weight actually loaded at the depot for that trip, and Equation (17) updates the payload with the weight of the victims collected at the head node, times , where converts persons into kilograms, and with the bag weight delivered, so that it is symmetric with Equation (19), which accumulates the victims on board, which represents the quantity of disaster victims present in the vehicle during pickup and delivery at each location. Equation (18) denotes the quantity of disaster victims transported by each vehicle carried from the depot during each trip . Equation (20) identifies the weight capacity constraints for vehicle . Equation (21) defines the seating capacity constraints for vehicle . Equation (22) records , the moment the last victim of node has been collected; this is the quantity weighted by in the priority term of objective function (1). Equation (23) denotes the binary routing variables, which are fixed at zero for every arc outside Ak; an arc that vehicle k cannot traverse is therefore excluded from the model rather than penalized through its travel time. Equations (24)–(26) declare the domains: the number of victims collected is an integer, and all the time variables are non-negative. Because objective (1) is solved lexicographically, the priority term never increases the optimal makespan; it only selects, among the makespan-optimal plans, the one that clears the higher-priority nodes earliest. (See Figure 4.)
Figure 4.
Illustration of flood victim evacuation planning, representing a solution to the VRPMPD problem.
Treatment of inaccessible arcs and choice of M Assigning the travel time of an inaccessible arc the value M would not exclude it: with and , Equation (13) reduces to , an unintended precedence between two nodes that need not be consecutive. The model therefore restricts each vehicle to its arc set (Equation (23)), so that every arc that can be selected has a finite travel time, and Equations (3), (13), (14), (17) and (19) are generated only for . A single constant M then relaxes every inactive constraint, provided that for the time constraints and and for the load constraints, where H is an upper bound on the makespan (e.g., the makespan of any feasible plan) and and are the largest service and travel times. The value M = 999,999 satisfies these bounds in every instance. Because all arcs were accessible in the computational experiments, contained every arc, and the reported results are not affected by this correction. Accordingly, the domains of Equations (3), (13), (14), (17) and (19) are stated over Ak, and every sum over j in Equations (5), (8)–(11), (16) and (22) runs only over arcs of Ak, because Xijkt = 0 for (i, j) ∉ Ak by Equation (23). The definition of TTijk, the constraint domains, and Equation (23) therefore refer to the same arc set.
The mathematical model was executed on a conventional personal computer equipped an 11th Gen Intel(R) Core™ i5-1135G7 processor (2.42-GHz clock speed, 8.00 GB of RAM) running Windows, with Lingo/CPLEX version 20.0 as the solver. Nevertheless, this modeling approach proved workable only for small-scale problem instances. As the problem size increases, the time needed for the model to reach an optimal solution becomes excessive, and the model commonly fails to converge. Consequently, a suite of metaheuristic techniques was devised to obtain near-optimal solutions when addressing realistically sized problems. Moreover, this result was translated into an intranet web application, which was built to operationalize the proposed methodology and provide practical decision-support capability for disaster management authorities.
5. Metaheuristic Development
This study adopts the Differential Evolution (DE) algorithm as the proposed metaheuristic to solve the flood evacuation routing and scheduling problem. This problem is fundamentally large-scale, combinatorial, and significantly constrained by mixed pickup and delivery requirements, heterogeneous vehicle capacities, urgency levels, and multi-trip operations. In real-world emergency logistics contexts, exact optimization methods become computationally impractical; thus, an effective approximation method is essential.
DE is widely recognized for its conceptual simplicity, computational efficiency, and robust search capability. As a result, DE was selected as the foundation for developing the customized metaheuristic approach implemented in this research. The algorithm is divided into seven major components—(1) the heuristic-based encoding and decoding, (2) the generation of the initial solution, (3) mutation, (4) recombination, (5) fitness evaluation, (6) selection, and (7) local search operations—all modified according to the unique characteristics of discrete routing decisions [52] (see Table 4 and Figure 5).
Table 4.
List of characteristics of the DE algorithm.
Figure 5.
The procedure of the proposed Differential Evolution (DE) algorithm for flood victim evacuation planning.
5.1. Encoding and Decoding of Solutions Operation
The initial step is to construct a representation scheme that can express all routing and scheduling decisions in a computationally feasible manner. Each candidate solution is encoded as a vector that indicates the sequential order of visits for each vehicle, including pickup and delivery nodes, vehicle assignment, and trip arrangement. The decoding procedure translates the encoded vector back into a tangible route structure while ensuring compliance with constraints such as vehicle capacity, pickup–delivery precedence, and adherence to urgency levels. This representation enables the effective application of differential operators of DE in a discrete problem context. (See Figure 6.)
Figure 6.
An instance of decoding performed by sorting the rank-order value (ROV Ascending for each vehicle). Note: The symbol * represents the evacuation center (Disaster Relief Center, Disaster Relief Shelter, or Temporary Shelter).
Operational details; A target vector contains one real-valued key in [0, 1] for each victim node. Decoding sorts the keys in ascending order (rank-order value, Figure 6) to obtain a node sequence, which is then assigned to vehicle trips sequentially: vehicles are filled in the order k = 1, …, K for trip 1 and then for trip 2, and so on; the next node is appended to the current vehicle trip while its remaining seats and payload allow; otherwise, the current vehicle trip is closed and the next one is opened. A node whose victims exceed the smallest seating capacity may be split, under the split-pickup and split-delivery rule of Section 4.1.2, between the current and the next vehicle trip. Because the decoder only builds capacity-feasible routes, no penalty function is required. A node is appended only to a vehicle trip whose vehicle k can reach it through arcs of Ak; otherwise, the next eligible vehicle trip is opened. In the reported experiments, all arcs are accessible, so this rule is never active. The trip start times then follow Equations (12)–(15).
5.2. Initial Population Generation Operation
An initial population of size NP is generated to give a set of diverse starting parameters for the evolutionary search. The population forms through a combination of random generation and heuristic-based construction. Heuristics such as nearest-neighbor construction, urgency-based grouping, and proximity clustering are employed to produce structurally meaningful initial solutions that improve convergence in the early stage. This hybrid initialization ensures a balance between population diversity and solution quality.
5.3. Mutation Operation
Mutation in DE is the process of perturbing an existing solution with information derived from randomly selected population members. The DE/rand/1 strategy is used to combine three distinct vectors for each target vector as shown in Equation (27):
where is the differential scaling factor. Because solutions are encoded as real-valued keys, Equation (27) is applied arithmetically, component by component; its structural effect on the routes (nodes exchanged, moved, or reversed in the sequence) appears when the perturbed keys are re-ranked during decoding. Components that leave [0, 1] are reset to the nearest bound. Mutation therefore needs no separate operator probabilities.
5.4. Recombination Operation (Crossover)
The recombination step creates a trial vector by combining elements of the mutant vector with the target vector , using a crossover rate . Binomial crossover is applied to the keys, and at least one component is taken from the mutant vector. Because every key vector decodes to a complete node permutation, crossover cannot create duplicated or missing nodes, and capacity feasibility is restored by the decoder; no separate conflict-resolution step is therefore required (See Equation (28) and Figure 7).
Figure 7.
The results for flood victim evacuation planning (allocating vehicles into each node for flood victims). Note: The symbol * represents the evacuation center (Disaster Relief Center, Disaster Relief Shelter, or Temporary Shelter).
5.5. Fitness Evaluation Operation
Each decoded trial solution is evaluated with the complete objective (1) in its lexicographic form (Section 4.3.1): the primary value is the makespan (), and the secondary value is the priority term ΣWSiA_i, which decides only between solutions with equal makespan (difference below 10−6 min). The number of trips and the workload balance are reported as indicators but do not enter the fitness.
5.6. Selection Operation
A greedy replacement strategy is adopted to conduct the selection process. The parent vector is replaced by the trial vector for each target solution only if it provides an improved objective value in Equation (29):
This mechanism ensures consistent improvement of the population while preserving the best solutions across generations.
5.7. Local Search Enhancement
Local search is applied to the best solution of each generation. It uses swap and relocate moves within and between vehicle trips (including between vehicles) and 2-opt and 3-opt moves within a route, accepts a move only if it improves the lexicographic fitness, and stops when no improving move exists. The DE run terminates after a fixed number of iterations (100 for small and 300 for large instances), not after a run time limit.
These operators are particularly effective for reducing travel time and improving route compactness. The integration of local search strengthens the exploitation capability of DE and improves convergence toward high-quality solutions, especially in large-scale problem instances that require the fine-grained adjustment of route structures.
6. Computational Framework and Results
This section presents the experimental findings and evaluates the performance of the proposed optimization approach for flood victim evacuation planning. Section 6.1 reports the results obtained from both the mathematical model and the DE algorithm. Section 6.2 presents the performance measurements. Section 6.3 discusses the computational results for real case emergency operations.
6.1. Parameter Setting and Test Problems
This research was motivated by the need to validate the applicability and computational performance of the proposed mathematical model and metaheuristic approach, using data collected from the case study of flooded areas in Chiang Mai Province, Thailand, during Typhoon Yagi (2024) (see Figure 8 and Table 5). The goal of developing a mathematical model for disaster relief route planning involves both evacuation and the distribution of survival kits to affected people. The model evaluates the urgency of assistance, and the types of victims involved. The developed mathematical model was validated by comparing the solutions from a small-scale problem with those of a more complex scenario to determine the accuracy of the model.
Figure 8.
Study area and spatial distribution of test instances in Chiang Mai province during Typhoon Yagi (2024): (a) Chiang Mai province, location in Thailand; (b) Chiang Mai flood hazard zonation classified by seven impact levels; (c) instance node distribution used in the case study [10]. Note: Within each color group (red and green), darker shades indicate higher priority levels than lighter shades.
Table 5.
Public disaster response machinery used in public disaster management.
Data provenance and parameters; The real case represents the area of flood zones 1–6 of the Chiang Mai flood warning map [6] (Figure 8c). The 100 demand nodes are the communities for which rescue or evacuation requests were recorded during the 2024 flood by the Chiang Mai Provincial Office of Disaster Prevention and Mitigation and the local administrative organizations. Every community with a recorded request in flood zones 1–6 was included; no sampling or exclusion was applied, so the node set is the complete record of requested assistance in the study area rather than a sample; it represents the location and size of recorded demand during this event, but not needs that were never reported. Their locations and victim counts were obtained in aggregated form from these agencies and contain no personal data. The remaining parameters are of three kinds. (i) Recorded data: node locations, numbers of victims Voli, and road distances. (ii) Equipment data: the capacities of vehicles 1–3 are as specified in Table 5 [12,57]. (iii) Research assumptions: the service time τ = 1 min per victim boarded, an average weight of kg per victim including personal belongings, and 10 kg of survival kits per node. The priority weights follow the scheme of Section 4.1.1, in which the urgency level reflects the flood zone and the victim type is taken from the records. (iv) Fleet and Trip Settings: The real case study considers eight vehicles, comprising three HMMWVs, three rescue trucks with cranes, and two small rescue vehicles (items 1–3 in Table 5). The fleet composition and the maximum limit of three trips per vehicle were established as experimental settings to evaluate the proposed model under predefined resource constraints, rather than representing the actual vehicles deployed or the number of trips recorded during the 2024 flood response. Because the study uses one real event, the results characterize this event; robustness to other events is discussed in Section 8.
The verification used the following input data from small-sized instance: one relief point, six affected victim locations (nodes), two vehicles, and two relief trips. The input data consisted of various parameters, including (1) the priority weight of each point , (2) the service time at point , (3) the weight of survival bags to be delivered at point , (4) the weight of affected people to be picked up at point , (5) the number of people to be picked up at point (See Table 6), (6) the travel time between point and point (calculated as distance/speed, as shown in Table 7), (7) the maximum weight capacity of vehicle , and (8) the maximum seating capacity of vehicle (see Table 8).
Table 6.
Parameters related to the disaster victim index at each location .
Table 7.
Parameters related to the disaster victim index at points and , which represent the time between points and (Time = Distance/Average vehicle Speed).
Table 8.
Parameters related to the index of vehicle .
For a small-sized instance, the proposed mathematical programming model was solved using Lingo/CPLEX V.20. As reported in Table 9, the model obtained an optimal of 69.49 min within 3.09 s. The optimal solution comprised three vehicle trip routes: Vehicle 1 operated 1-2-3-4-1 in Trip 1, while Vehicle 2 operated 1-5-7-6-1 in Trip 1, collecting one victim at node 6, and 1-6-1 in Trip 2, collecting the remaining six. This result verifies that the proposed model can generate a feasible routing plan while satisfying the specified operational constraints for the small-sized instance (Table 9).
Table 9.
Solution results and time taken to solve the example problem using Lingo/CPLEX V.20 in the flood relief route planning problem: a case study of the flood in Chiang Mai Province due to Typhoon Yagi in 2024.
The same S-0 instance was subsequently solved using the proposed Differential Evolution (DE) algorithm, as summarized in Table 10. DE obtained a of 70.18 min (HP = 99.02%; gap 0.98%) with a mean computational time of 541.60 s per replication. DE assigned the same nodes to each vehicle as the exact solution: Vehicle 1 operated 1-2-4-3-1, visiting nodes 3 and 4 in the reverse order, and Vehicle 2 reversed the order of its two trips, operating 1-6-1 (six victims at node 6) in Trip 1 and 1-6-5-7-1 (the remaining victim at node 6) in Trip 2. The 0.69 min difference arises from this trip sequence of Vehicle 2, which determines the makespan in both plans (Figure 9).
Table 10.
Solution results and time taken to solve the example problem using DE metaheuristics in the flood relief route planning problem: a case study of the flood in Chiang Mai Province due to Typhoon Yagi in 2024.
For this instance, the mathematical model provides the exact benchmark solution, whereas DE produces a near-optimal solution with the same node-to-vehicle assignment. Although DE requires more computational time for this small instance due to the predefined evolutionary search settings, the close agreement in and route structure supports the validity of the proposed DE procedure. This verification provides a basis for applying DE to the larger problem instances in Section 6.3, where exact optimization becomes computationally impractical because of the substantially larger solution space and number of decision variables.
Priority policy; To examine how urgency is represented, S-0 was solved under three priority policies, and the completion times of the two priority groups were recorded (urgent nodes 2–4 with WSi = 10; other nodes 5–7 with WSi = 1). (i) Two-stage lexicographic objective, makespan first (Section 4.3.1): Cmax = 69.49 min; urgent group completed at 39.44 min and the other group at 58.22 min. Because the makespan-optimal plan of S-0 is unique, Stage 2 returns this plan; the weighted form of Section 4.3.1 would also return it for any ε ≤ 10−2. (ii) Weighted objective with ε = 0.1: Cmax = 70.93 min (+2.1%), urgent group 36.10 min (−8.5%), other group 60.97 min. (iii) Priority first (minimize the completion time of the urgent group, and then the makespan): urgent group 28.92 min (−26.7%), Cmax = 78.20 min (+12.5%), other group 66.92 min. Treating urgency as a secondary criterion therefore gives the shortest overall operation but completes the urgent group about 10.5 min later than the priority-first policy. Where “immediate evacuation” must take precedence over the makespan, the order of the two stages in Section 4.3.1 is simply reversed; the choice is a managerial decision that the model accommodates without any change to the constraints.
To evaluate the model, the effectiveness and performance of DE metaheuristics in the flood victim evacuation planning were validated by comparing the optimal solution derived from the mathematical model obtained using Lingo/CPLEX version 20.0 software on Windows with the proposed DE metaheuristics obtained from the Django with Python version 3.2.16. The experimental design (Table 11) comprises 24 generated problem classes (S-1–S-12 and L-1–L-12), defined by the number of nodes, vehicles, trips, and priority levels, plus the real case. For each class, five instances were generated, giving 120 generated instances; each instance was solved once by the exact model and 30 times by DE, with the DE parameters set as specified in Table 12. And Table 13 reports class averages. In every generated instance, node locations were drawn from the node set of Figure 8c and travel times were computed from road distances as in Table 7. The generation procedure is described below.
Table 11.
Design experiment of test problem.
Table 12.
The setting of DE control parameters.
Table 13.
This section presents the solution outcome for the duration required to aid flood victims and the computational time for each model in the flood relief route planning problem. The case study focuses on the flood area in Chiang Mai Province, caused by Typhoon Yagi in 2024.
Instance generation; The five instances of a class were generated independently with the same procedure: (i) the demand nodes were sampled uniformly at random without replacement from the 100 real case nodes, and the relief point of the real case served as the depot; (ii) the number of victims of each sampled node was drawn from a discrete uniform distribution on {1, …, 12}, and its victim type was assigned at random, with kg and kg; (iii) the urgency level followed the flood zone of the node, and was assigned with the two- or six-level scheme of Section 4.1.1, as indicated in Table 11; (iv) the K vehicles of a class were drawn at random from items 1–3 of Table 5, each allowed the number of trips T given in Table 11; and (v) travel times were computed from road distances as in Table 7. To ensure exact reproducibility, the 120 generated instances are provided in File S1 of the Supplementary Materials. For each instance, the file lists the selected demand nodes with their numbers of victims, victim types and priority weights, the fleet composition, and the travel time matrix, together with the instance-level results of the exact model and of DE.
The DE parameters were determined by a full factorial experimental design carried out on calibration instances that are not part of the evaluation set in Table 11. The parameters and the value configurations are as follows: the number of populations is , the scaling factor is , the crossover rate is , and the stopping criteria are set at 100 iterations for small and 300 iterations for large-scale problems as indicated in Table 12. The function evaluation of DE was designed to consist of 30 runs with population sizes of 300, thus allowing sufficient function evaluations to identify an optimal solution. The algorithm was executed using Django with Python version 3.2.16 on Windows Intel(R) Core™ i5-1135G7 processors (2.42-GHz clock speed, 8.00 GB of RAM).
6.2. Performance Measurement
This section describes the performance of the proposed DE for solving the VRPMPD, 1-M-1/P-D/Heterogeneous fleet sized, node priority, Min transportation problem. Two performance indices are investigated: (1) the percentage heuristics performance (HP) (see Equation (30)) and (2) the percentage relative improvement (RI) (see Equation (31)).
where is the proposed heuristic performance (%), is the optimal solution obtained from the mathematical model, and is the solution obtained from the proposed heuristics and DE.
where is the relative improvement (%) between the mathematical model and the proposed algorithms, is the solution obtained from the proposed metaheuristics of DE, and is the solution obtained from the mathematical model.
Computational effort is compared through the time ratio TR = TDE/TMILP, where TDE is the mean wall-clock time of one DE replication (averaged over the 30 replications) and TMILP is the solver time, equal to the 28,800 s limit when optimality is not proven; TR < 1 means that DE is faster. For L-1–L-12 and the real case, in Equations (30) and (31) is replaced by the lower bound LB, so HP and RI are bound-based gaps.
6.3. Computational Results
Table 13 compares the computational performance of the mathematical model and the proposed Differential Evolution (DE) algorithm in terms of solution quality and computational time. For the small-scale instances (S-1 to S-12), the mathematical model obtained proven optimal solutions, which serve as exact benchmarks for evaluating DE. The DE results are based on 30 independent runs using the parameter settings identified through the full-factorial experiment reported in Table 12. The solution quality is assessed using the HP and RI measures defined in Equations (30) and (31).
For the small-scale instances, DE produced solutions that were identical or close to the corresponding exact optima. The small problem instance verification in Section 6.1 provides further support for the proposed DE procedure. The corrected exact model obtained = 69.49 min for the verification instance S-0, and DE obtained 70.18 min (HP = 99.02%). Across S-1 to S-12, the average HP and RI were 94.94% and −5.50%, respectively, corresponding to an average solution quality gap of approximately 5.50% relative to the proven optima. On this group, however, DE required more time than the exact model (989.30 s versus 188.92 s on average; TR = 5.24), because its run time is fixed by the population size and the iteration limit rather than by the difficulty of the instance. The exact model is therefore the appropriate tool for small instances, and DE serves there only for validation.
The small-scale solution gap was further examined statistically using the RI values for S-1 to S-12, as summarized in Table 14. The statistical unit is the problem class (n = 12): for each class, the exact optima and the DE results (30 replications per instance) are averaged over its five instances, giving one paired observation per class. The class was chosen because it is the level at which the experimental factors are varied and at which the results in Table 13 are reported, and because it is the conservative choice: pooling the 60 instances would treat instances that share all design factors as independent replicates and inflate the degrees of freedom. A two-tailed one-sample t-test indicated that the mean RI differed significantly from zero (mean = −5.50%, SD = 4.46%, t(11) = −4.28, p = 0.0013, 95% CI [−8.33%, −2.67%]). This finding was corroborated by a Wilcoxon signed-rank test on the paired values (mean DE solution versus exact optimum), which yielded W = 0 and p = 0.0005 for all 12 pairs. The paired standardized mean difference was large (Cohen’s dz = 1.01). These results show that the DE solutions are statistically distinguishable from the exact optima, although the average absolute solution quality gap remains moderate. The tests therefore quantify the approximation gap rather than establishing equivalence between the two methods.
Table 14.
Statistical validation of DE solution quality against the exact mathematical model for small-scale instances (S-1–S-12).
As the problem size increases, the exact mathematical model becomes considerably more computationally demanding because the numbers of nodes, vehicles, trips, and associated decision variables also increase. For the large-scale instances (L-1 to L-12) and the real case, the model did not prove optimality within the prescribed 28,800 s computational limit. Table 13 therefore reports lower bounds (LBs) rather than proven optimal solutions. DE, by contrast, generated feasible solutions for every large-scale instance and for the real case. Relative to these lower bounds, L-1 to L-12 achieved average HP and RI values of 84.54% and −18.38%, respectively, while the real case yielded HP = 73.48% and RI = −36.09%. Because the reference values are lower bounds, these results represent bound-based performance gaps and should not be interpreted as deviations from known optimal solutions. Relative to the 28,800 s limit, DE reduced the computational time by 57.35% on average for L-1–L-12 (TR = 0.43) and by only 9.90% for the real case (25,950 s; TR = 0.90). These figures compare DE with a truncated exact search, not with the time needed to prove optimality. At this scale, the advantage of DE is therefore that it returns complete feasible plans for every instance, whereas the exact model returns only bounds; its run time is of the same order as the time limit of the exact solver.
Figure 10 complements these findings by illustrating the convergence behavior and run-to-run consistency of DE for test problem 24 (L-12). In a representative replication, the best-so-far decreases rapidly during the early iterations before stabilizing at 354.78 min (Figure 10a). Across 30 independent replications, the mean is 348.39 min (SD = 9.94 min), with a best solution of 327.29 min (Figure 10b). These results indicate progressive convergence together with reasonably stable solution quality across independent runs.
Figure 10.
The best objective function of the generation for test problem 24: (a) Convergence behavior of the DE algorithm for Replication 1 over 300 iterations. The best solution () decreases rapidly during the initial search phase and gradually stabilizes, reaching a best solution of 354.78 min. (b) Maximum completion time () obtained from 30 independent replications of the DE algorithm. The dashed line represents the reported mean solution (348.39 min), while the dotted line indicates the best solution (327.29 min). (Note: This figure was prepared with the assistance of ChatGPT (OpenAI, GPT-5.6Sol) using computational results generated by the authors).
Evidence for the customized DE and operational suitability; The case for the customized DE rests on three results. On the 12 small classes, it stays within 5.50% of the proven optima on average and within 1% on four classes; on the large classes and the real case, it is the only method that returns a complete plan; its large-class makespans lie 12–23% above lower bounds that need not be tight. A comparison with other metaheuristics and an ablation of the local search were not part of this study, which is stated as a limitation in Section 8. The real case run time of 25,950 s (about 7.2 h per replication) must also be read against the intended use. The run length is fixed by the iteration limit rather than by convergence: in the representative L-12 replication of Figure 10a, the best-so-far makespan is within about 1% of its final value after roughly 60 of the 300 iterations, so a stopping rule based on non-improving iterations would shorten the run considerably, although this has not yet been tested on the real case. The 30 replications are independent and can be run in parallel, and the reported times refer to an interpreted Python implementation on a laptop processor. In its present form, DE is therefore suited to pre-event and early-warning planning, in which plans for each P.1 water-level stage of Table 1 are computed during the warning lead time and re-solved for unserved victims when conditions change; real-time dispatching would require a compiled, time-limited implementation.
Taken together, the computational results show distinct roles for the two solution approaches. The mathematical model provides exact benchmarks for small-scale instances, while DE generates feasible solutions for large-scale and real case instances, whose quality can be assessed only against lower bounds, for which optimality could not be proven within the computational limit. This scalability, supported by the convergence evidence in Figure 10, provides the computational basis for using DE as the optimization engine of the intranet decision-support application presented in Section 7.
7. Software Architecture for Flood Victims’ Evacuation Planning and Intranet Web Application
A software application for flood victim evacuation planning, referred to as DisasterthApp V. 1.0, was developed as a prototype intranet-based web application and decision-support tool for emergency logistics and transportation planning during flood disasters. The application supports route planners and decision makers in determining evacuation routes, vehicle assignments, and evacuation schedules based on available disaster-related data. The prototype is designed for deployment within an organizational intranet, providing a controlled environment for integrating evacuation data, optimization procedures, and route-planning functions. The proposed system incorporates the Differential Evolution (DE) algorithm developed in this study as its optimization engine. As demonstrated by the computational results in Section 6, the mathematical model provides an exact benchmark for small-scale instances, whereas DE provides a computationally applicable approach for large-scale instances for which exact optimization becomes impractical.
DisasterthApp was designed as a prototype Disaster Risk Management (DRM) decision-support application that transforms available evacuation data into operational routing solutions. The application processes information on affected locations, victim demand, node priority, vehicle characteristics, travel conditions, and other relevant parameters to generate feasible evacuation plans. The resulting solutions provide route planners and emergency logistics personnel with information on vehicle routes, trip assignments, evacuation sequences, and estimated evacuation times, thereby supporting timely and systematic operational decision making.
The proposed Flood Victims Evacuation Planning Decision-Support System (DSS) integrates the optimization models, data management, map-based route visualization, and user interfaces within a prototype intranet-based web architecture. The system is intended to support the Department of Disaster Prevention and Mitigation (DDPM) and relevant local authorities in planning evacuation routes, allocating available vehicles, and minimizing the overall evacuation completion time () under different flood-severity conditions. At this stage, the system serves as a functional prototype for demonstrating the integration of optimization, evacuation data management, and route visualization within an intranet environment. The system architecture consists of the following eight components:
- (1)
- Differential Evolution Optimization Engine—executes the proposed DE algorithm for solving the VRP with Mixed Pickup and Delivery (VRPMPD), particularly for large-scale evacuation instances.
- (2)
- Mathematical Model Module—represents the VRPMPD formulation and supports constraint and feasibility evaluation.
- (3)
- Web Application Layer—provides application functionality for evacuation planners and field operators.
- (4)
- Web Service Layer—facilitates data exchange among the user interface, optimization engine, database, and map visualization modules and supports model execution.
- (5)
- Database Management System (DBMS)—stores and manages evacuation-related input data and computational results.
- (6)
- Map Visualization Module—visualizes affected locations, evacuation routes, and spatial information for operational planning.
- (7)
- User Interface—enables command center personnel and field officers to enter planning parameters and review optimization results.
- (8)
- Intranet Deployment Layer—enables the prototype web application to operate within an organizational intranet, providing controlled access to the system and its evacuation planning functions.
The overall architecture and interactions among these components are illustrated in Figure 11a. The proposed architecture demonstrates how the DE-based optimization approach can be embedded within a prototype intranet web application to translate the computational methodology into an operational decision-support framework for flood evacuation planning. The following subsections describe the system architecture and prototype application design in detail.
Figure 11.
Flood victims’ evacuation planning software architecture and intranet web application: (a) Key components of flood victims’ evacuation planning. (b) Architecture of the flood evacuation planning decision-support system. (c) The intranet web-based evacuation planning application developed for the DDS.
7.1. Flood Victims’ Evacuation Planning Software Architecture
The proposed system adopts a modular, service-oriented architecture, driven by the intranet web application-based framework in the DisasterthApp. It is designed to enable real-time decision making, integrate multi-source data, and optimize computational efficiency. There are two parts: (1) an architectural overview of the initial solution and (2) the key functional components (see Figure 11b).
7.1.1. Architectural Overview of the Initial Solution
The system architecture consists of three main layers: a (1) Presentation Layer (User Interface Layer); (2) Application Layer (Processing and optimization layer); and (3) Data Management Layer, each designated for distinct functions:
- (1)
- Presentation Layer (User Interface Layer):
- Web Portal for emergency planners (Intranet);
- Includes dashboards, interactive route maps, and data input forms;
- Displays outputs such as optimized routes, vehicle assignments, and evacuation time summaries.
- (2)
- Application Layer (Processing and Optimization Layer):This layer contains the computational logic of the system, including the following:
- Optimization Engine:
- −
- Implements metaheuristics-based Differential Evolution (DE);
- −
- Handles VRPMPD constraints: (1) mixed pickup and delivery, (2) heterogeneous vehicles, (3) limited capacities, (4) urgency levels and disaster severity, and (5) travel time and accessibility constraints.
- Mathematical Model Manager:
- −
- Encodes the VRPMPD mathematical formulation;
- −
- Performs constraint checking and solution feasibility assessment.
- Web Services:
- −
- Manage communication between the UI and back-end modules;
- −
- Provide APIs for optimization requests, route queries, and .ap visualization.
- (3)
- Data Management Layer:
- A relational Database Management System (DBMS);
- Stores evacuation centers, households, road networks, vehicle availability, and disaster severity data;
- Maintains system logs and optimization outputs.
7.1.2. Key Functional Components
The key functional component architecture consists of four main modules—the (1) Data Input Module; (2) Routing and Scheduling Optimization Module; (3) Map Visualization Module; and (4) Reporting and Export Module—as detailed below:
- (1)
- Data Input Module:
- User inputs population data, vehicle data, and flood severity level;
- Supports CSV upload and manual entry.
- (2)
- Routing and Scheduling Optimization Module:
- Generates evacuation plans with minimum evacuation time;
- Calculates vehicle dispatching, sequencing, and routing;
- Runs multiple iterations to refine feasible solutions.
- (3)
- Map Visualization Module:
- Displays routes on real maps;
- Highlights road blockages during high-severity scenarios;
- Shows evacuation centers and population clusters.
- (4)
- Reporting and Export Module:
- Summary of evacuation times, number of trips, and vehicle utilization;
- Exports results in PDF or Excel formats.
7.2. Flood Victims’ Evacuation Planning Application
The proposed application has been introduced to support decision makers with the transportation problem, as well as to aid in evacuating flood victims. The application utilizes the available demand data fed into the DisasterthApp software, allowing the route planner to make the right decisions in flood victims’ evacuation planning (see Figure 11c).
This subsection describes the web-based evacuation planning application developed as part of the DSS. The application design follows the usability characteristics of the mathematical model and DE-based metaheuristics, which have been adapted to the context of flood evacuation.
7.2.1. Intranet Web Application Features
The Web Application Features were developed with five main features: (1) a Scenario Setup Interface, (2) an Optimization Execution Panel, (3) an Interactive Route Map, (4) an Evacuation Summary Dashboard, and (5) Multi-Platform Accessibility. The details are as follows.
- (1)
- Scenario Setup Interface:The scenario setup interface was developed, through which users can do the following:
- Define flood severity levels;
- Select affected districts, villages, and evacuation centers;
- Input vehicle availability and capacity;
- Load real-time field data.
- (2)
- Optimization Execution Panel:
- Allows the operator to run the DE-based optimization;
- Displays computation progress;
- Provides visual indicators to identify feasible/infeasible solutions.
- (3)
- Interactive Route Map:
- Shows optimized routes with color-coded vehicle paths;
- Provides clickable nodes for details (capacity, pickup/drop-off, times);
- Highlights urgent areas requiring immediate evacuation.
- (4)
- Evacuation Summary Dashboard:
- Total evacuation time;
- Number of vehicles used;
- Total distance traveled;
- Evacuation priority levels;
- Bottleneck analysis.
- (5)
- Multi-Platform Accessibility:
- Intranet version for command centers;
- Intranet version for provincial or national DDPM units;
- Scalable for future mobile deployments.
7.2.2. Application Workflow
The general workflow is similar to that used in the DisasterthApp transportation software design, but adapted for evacuation:
- Input and Upload data or information;
- Model Preprocessing and Feasibility Check;
- Optimization Run (DE-based metaheuristic);
- Solution Selection and Map Visualization;
- Route Review and manual adjustments (if needed);
- Report Generation and Export;
- Communication with field teams.
Based on the aforementioned discussion, it can be inferred that all the proposed methods can be effectively applied to minimize the total traveling time in flood victim evacuation planning. This not only helps to reduce the overall evacuation time and affected individuals’ waiting time in the system—with the objective of achieving the shortest possible response time for assisting flood victims—but also serves as a decision-support tool for operational personnel during flood-related emergency situations. Ultimately, the use of these methods aims to support (1) the systematic and standardized management of emergency disaster responses, through increased coordination and integration among all relevant sectors to achieve maximum efficiency and effectiveness; (2) the rapid, comprehensive, and timely delivery of relief assistance to affected populations; and (3) the minimization of the loss of life and property damage caused by disaster events.
8. Conclusions and Future Research
Floods remain among the most recurrent and damaging natural hazards in Thailand, and the 2024 flooding associated with Typhoon Yagi in Chiang Mai Province illustrates the operational demands that these events place on emergency response systems. Relief route planning under such conditions must reconcile accessibility, vehicle limitations, victim characteristics, and the urgency of assistance—a task that, in current practice, remains dependent on the experience of commanding officers rather than on a systematic decision-support tool. This study addressed that gap by formulating flood victim evacuation and survival kit distribution as a Vehicle Routing Problem with Mixed Pickup and Delivery (VRPMPD), specified as a 1-M-1/P-D problem with a heterogeneous fleet, node priorities, and a minimum-makespan objective (Min ). The resulting Mixed Integer Linear Programming (MILP) model unifies mixed pickup-and-delivery operations, heterogeneous vehicle capacities, multiple trips, and urgency-based prioritization within a single optimization framework, while a customized Differential Evolution (DE) metaheuristic—incorporating problem-specific encoding, mutation, recombination, and local search—extends the approach to problem sizes beyond the reach of exact solvers.
The computational results support the correctness of the model and the scalability of the metaheuristic. For the small-scale instances (S-1–S-12), the MILP model produced proven optimal solutions that served as exact benchmarks; DE reproduced these with an average heuristic performance of 94.94% (RI = −5.50%), a gap that is statistically significant (one-sample t-test, p = 0.0013; Wilcoxon signed-rank test, p = 0.0005; Cohen’s dz = 1.01) yet modest in absolute terms. For the large-scale instances and the 100-node, eight-vehicle, three-trip real case, exact optimality could not be established within the prescribed computational limit; relative to the corresponding lower bounds, DE nonetheless produced feasible solutions throughout, achieving average heuristic performances of 84.54% and 73.48%, respectively, using on average 43% (large-scale) and 90% (real case) of the time allotted to the exact solver; on small instances, DE was slower than the exact model. These results indicate that the exact formulation is suited to certifying optimality on tractable instances, whereas DE provides feasible plans at realistic scale, where its quality can currently be measured only against lower bounds.
The proposed methodology was operationalized as DisasterthApp, a prototype intranet-based decision-support system that integrates the optimization models, evacuation-data management, map-based route visualization, and planner-facing interfaces. This implementation shows how the framework can be embedded in an operational tool; it has not yet been validated in the field with emergency response personnel.
Collectively, the study contributes at three levels. First, it formulates a previously unaddressed combination of mixed pickup-and-delivery operations, heterogeneous multi-trip fleets, and urgency-based prioritization within a real disaster response setting. Second, it validates a customized DE algorithm statistically against exact benchmarks on small instances before extending it to large-scale and real case instances for which exact optimization is computationally infeasible. Third, it translates this optimization framework into a deployable decision-support prototype, bridging mathematical modeling and operational practice.
The study has limitations that define the scope of its conclusions. First, it is based on one real event. Typhoon tracks, rainfall, flood extent, and the spatial distribution of victims vary between events, so the results characterize the 2024 Chiang Mai flood and the generated instances rather than flood relief in general; further historical events and scenario-based instances are needed to assess robustness. Second, the model addresses flood relief with a single depot and a road network that is static during planning. It can be applied to other hazards, such as flash floods or landslides, only after the accessibility, travel time, and demand data are re-estimated for that hazard; earthquakes, with large-scale network damage and casualty triage, would require additional constraints. Third, network disruption is represented only through re-estimated travel times and re-solving, not through stochastic or dynamic disruption models, and the experiments use land vehicles only. Fourth, the performance of DE is established against exact solutions and lower bounds, not against other metaheuristics, and its components have not been examined by ablation. Fifth, the real case run time of about 7.2 h per DE replication confines the present implementation to pre-event and early-warning planning. Finally, several parameters (service time per victim, weight per victim, and kit weight) are research assumptions.
Several directions can extend this work and address these limitations. From a modeling perspective, incorporating explicit service time windows, and a two-layer multimodal structure—in which victims are first moved to boat-transfer hubs before being transferred to road vehicles—would better reflect field conditions during severe flooding; dynamic re-optimization under stochastic road disruption and the comparison of land, water, and mixed fleets are natural next steps. Methodologically, benchmarking DE against adapted ALNS, GA, and VNS algorithms, an ablation study of its components and validation on further historical flood events are required; integrating machine learning or artificial intelligence with the metaheuristic could support adaptive route and travel time prediction under dynamically changing road accessibility, demand, and vehicle availability. From an implementation standpoint, priorities include field validation with emergency response personnel, the migration of the intranet prototype to an internet-based platform with real-time GIS integration, and linkage to existing disaster-reporting and monitoring systems. Pursued together, these extensions would advance the framework from a validated prototype toward an adaptive, operationally integrated platform that supports timelier flood relief logistics in Thailand and comparable disaster-prone settings.
Supplementary Materials
The following supporting information can be downloaded at: https://www.mdpi.com/article/10.3390/math14214116/s1, File S1: Data of the 120 generated instances (classes S-1–S-12 and L-1–L-12, five instances per class) and instance-level results of the exact model and the DE algorithm.
Author Contributions
Conceptualization, K.W. and T.J.; methodology, K.W.; software, K.W. and P.T.; validation, K.W. and C.W.; formal analysis, K.W. and P.T.; investigation, K.W.; resources, K.W.; data curation, K.W.; writing—original draft preparation, K.W.; writing—review and editing, T.J. and C.W.; visualization, K.W.; supervision, T.J. and C.W.; project administration, C.W.; funding acquisition, K.W. All authors have read and agreed to the published version of the manuscript.
Funding
This research was funded by Fundamental Fund 2024, Thailand Science Research and Innovation (TSRI), Organization: Department of Disaster Prevention and Mitigation, Ministry of Interior, Thailand, grant number 194749.
Institutional Review Board Statement
Not applicable. The study did not involve human participants or animals; all victim, vehicle, and flood-extent data were obtained in aggregated form from government agencies and contain no personally identifiable information.
Informed Consent Statement
Not applicable.
Data Availability Statement
The data of the 120 generated instances are provided in File S1 of the Supplementary Materials. The real case data were obtained in aggregated form from government agencies and are available from the corresponding author on reasonable request.
Acknowledgments
This study was supported by Fundamental Fund 2024, Thailand Science Research and Innovation (TSRI), Organization: Department of Disaster Prevention and Mitigation, Ministry of Interior, Thailand (Grant No. 194749), in collaboration with the National Disaster Warning Center, the Disaster Prevention and Mitigation Center, Region 6 Khon Kaen, Chiang Mai Provincial Disaster Prevention and Mitigation Office, Department of Disaster Prevention and Mitigation, Ministry of Interior. During the preparation of this manuscript, the authors used ChatGPT (OpenAI, GPT-5.6 Sol) for language editing and to assist in preparing Figure 10 from the computational results generated by the authors. All AI-assisted content was reviewed and verified by the authors, who take full responsibility for the content of this publication.
Conflicts of Interest
The authors declare no conflicts of interest.
References
- National Disaster Prevention and Mitigation Committee. National Disaster Prevention and Mitigation Plan; Department of Disaster Prevention and Mitigation, Ministry of Interior: Bangkok, Thailand, 2015. (In Thailand)
- Department of Disaster Prevention and Mitigation. Statistics of Flooding Information; Disaster Mitigation Center, Ministry of Interior: Bangkok, Thailand, 2018. (In Thailand)
- World Bank. Thai Flood 2011: Rapid Assessment for Resilient Recovery and Reconstruction Planning; The World Bank: Bangkok, Thailand, 2012; Available online: https://documents.worldbank.org/en/publication/documents-reports/documentdetail/677841468335414861 (accessed on 15 September 2026).
- Flooded Areas from Typhoon Podul and Kajiki in 2019. Available online: https://tiwrm.hii.or.th/current/2019/PodulKajiki/news.html (accessed on 2 August 2026).
- Kasikorn Research Center. The Cost of Flood Damage in 2024 May Exceed THB30 Billion (Current Issue No. 3523); Kasikorn Research Center: Bangkok, Thailand, 2024; Available online: https://www.kasikornresearch.com/en/analysis/k-econ/economy/Pages/Flood-CIS3523-KR-15-10-24.aspx (accessed on 2 August 2026).
- Chiang Mai University. Flood Warning System and Urban Flood Prevention Guidelines for Chiang Mai Province (CMFlood); Water Resources Engineering and Management Research Center, Chiang Mai University: Chiang Mai, Thailand, 2024; Available online: https://watercenter.cmu.ac.th/chiangmai/cmflood/warning/floodmap (accessed on 10 January 2026). (In Thailand)
- Wongloucha, K.; Jamrus, T.; Kusoncum, C.; Pattanapairoj, S. A Mathematical Model for Flood Victims Evacuation Planning: A Case Study of Flooded Areas in Roi Et Province from Typhoon Podul and Kajiki in 2019. KKU Res. J. (Grad. Stud.) 2022, 22, 110–126. (In Thailand) [Google Scholar]
- Opasanon, S. Mummong kan chatkan logistics to wikrit nam thuam [Logistics management perspectives on the flood crisis]. J. Bus. Adm. 2011, 34, 6–9. Available online: https://web.archive.org/web/20261110074128/http://www.jba.tbs.tu.ac.th/files/Jba132/Column/JBA132SathapornC.pdf (accessed on 17 September 2026). (In Thailand)
- Shahparvari, S.; Abbasi, B. Robust stochastic vehicle routing and scheduling for bushfire emergency evacuation: An Australian case study. Transp. Res. Part A Policy Pract. 2017, 104, 32–49. [Google Scholar] [CrossRef] [Scilit]
- Yu, X.; Li, C.; Yen, G.G. A knee-guided differential evolution algorithm for unmanned aerial vehicle path planning in disaster management. Appl. Soft Comput. 2021, 98, 106857. [Google Scholar] [CrossRef] [Scilit]
- Oh, B.H.; Kim, K.; Choi, H.L.; Hwang, I. Integer linear program approach for evacuation of disaster victims with different urgency levels. IFAC-PapersOnLine 2017, 50, 15018–15023. [Google Scholar] [CrossRef] [Scilit]
- Department of Disaster Prevention and Mitigation. Guide of Disaster Machinery for Executives; Disaster Prevention Measures Division, Ministry of Interior: Bangkok, Thailand, 2018. (In Thailand)
- Hoyos, M.C.; Morales, R.S.; Akhavan-Tabatabaei, R. OR models with stochastic components in disaster operations management: A literature survey. Comput. Ind. Eng. 2015, 82, 183–197. [Google Scholar] [CrossRef] [Scilit]
- Kaveh, A.; Javadi, S.M.; Moghanni, R.M. Emergency management systems after disastrous earthquakes using optimization methods: A comprehensive review. Adv. Eng. Softw. 2020, 149, 102885. [Google Scholar] [CrossRef] [Scilit]
- Kamyabniya, A.; Sauré, A.; Salman, F.S.; Bénichou, N.; Patrick, J. Optimization models for disaster response operations: A literature review. OR Spectr. 2024, 46, 737–783. [Google Scholar] [CrossRef] [Scilit]
- Huang, M.; Smilowitz, K.R.; Balcik, B. A continuous approximation approach for assessment routing in disaster relief. Transp. Res. Part B Methodol. 2013, 50, 20–41. [Google Scholar] [CrossRef] [Scilit]
- Balcik, B. Site selection and vehicle routing for post-disaster rapid needs assessment. Transp. Res. Part E Logist. Transp. Rev. 2017, 101, 30–58. [Google Scholar] [CrossRef] [Scilit]
- Oruc, B.E.; Kara, B.Y. Post-disaster assessment routing problem. Transp. Res. Part B Methodol. 2018, 116, 76–102. [Google Scholar] [CrossRef] [Scilit]
- Lagaros, N.D.; Karlaftis, M.G. A critical assessment of metaheuristics for scheduling emergency infrastructure inspections. Swarm Evol. Comput. 2011, 1, 147–163. [Google Scholar] [CrossRef] [Scilit]
- Talarico, L.; Meisel, F.; Sörensen, K. Ambulance routing for disaster response with patient groups. Comput. Oper. Res. 2015, 56, 120–133. [Google Scholar] [CrossRef] [Scilit]
- Bozorgi-Amiri, A.; Jabalameli, M.S.; Alinaghian, M.; Heydari, M. A modified particle swarm optimization for disaster relief logistics under uncertain environment. Int. J. Adv. Manuf. Technol. 2012, 60, 357–371. [Google Scholar] [CrossRef] [Scilit]
- Rath, S.; Gutjahr, W.J. A math-heuristic for the warehouse location–routing problem in disaster relief. Comput. Oper. Res. 2014, 42, 25–39. [Google Scholar] [CrossRef] [Scilit]
- Wang, H.; Du, L.; Ma, S. Multi-objective open location-routing model with split delivery for optimized relief distribution in post-earthquake. Transp. Res. Part E Logist. Transp. Rev. 2014, 69, 160–179. [Google Scholar] [CrossRef] [Scilit]
- Ahmadi, M.; Seifi, A.; Tootooni, B. A humanitarian logistics model for disaster relief operation considering network failure and standard relief time: A case study on San Francisco district. Transp. Res. Part E Logist. Transp. Rev. 2015, 75, 145–163. [Google Scholar] [CrossRef] [Scilit]
- Chang, K.; Zhou, H.; Chen, G.; Chen, H. Multiobjective location routing problem considering uncertain data after disasters. Discret. Dyn. Nat. Soc. 2017, 2017, 1703608. [Google Scholar] [CrossRef] [Scilit]
- Vahdani, B.; Veysmoradi, D.; Shekari, N.; Mousavi, S.M. Multi-objective, multi-period location-routing model to distribute relief after earthquake by considering emergency roadway repair. Neural Comput. Appl. 2018, 30, 835–854. [Google Scholar] [CrossRef] [Scilit]
- Wei, X.; Qiu, H.; Wang, D.; Duan, J.; Wang, Y.; Cheng, T.C.E. An integrated location-routing problem with post-disaster relief distribution. Comput. Ind. Eng. 2020, 147, 106632. [Google Scholar] [CrossRef] [Scilit]
- Zhong, S.; Cheng, R.; Jiang, Y.; Wang, Z.; Larsen, A.; Nielsen, O.A. Risk-averse optimization of disaster relief facility location and vehicle routing under stochastic demand. Transp. Res. Part E Logist. Transp. Rev. 2020, 141, 102015. [Google Scholar] [CrossRef] [Scilit]
- Özdamar, L.; Demir, O. A hierarchical clustering and routing procedure for large scale disaster relief logistics planning. Transp. Res. Part E Logist. Transp. Rev. 2012, 48, 591–602. [Google Scholar] [CrossRef] [Scilit]
- Bruni, M.E.; Beraldi, P.; Khodaparasti, S. A fast heuristic for routing in post-disaster humanitarian relief logistics. Transp. Res. Procedia 2018, 30, 304–313. [Google Scholar] [CrossRef] [Scilit]
- Zhan, S.L.; Liu, S.; Ignatius, J.; Chen, D.; Chan, F.T. Disaster relief logistics under demand-supply incongruence environment: A sequential approach. Appl. Math. Model. 2021, 89, 592–609. [Google Scholar] [CrossRef] [Scilit]
- Santana-Robles, F.; Hernández-Gress, E.S.; Martínez-López, R.; González-Hernández, I.J. Quick-response model for pre- and post-disaster evacuation and aid distribution: The case of the Tula River flood event. Logistics 2024, 8, 8. [Google Scholar] [CrossRef] [Scilit]
- Zhang, P.; Zhang, C.; Zhang, P.; Yan, X.; Yang, H. Optimization of emergency logistics for urban flooding with consideration of rainfall effects. Sci. Rep. 2025, 15, 30301. [Google Scholar] [CrossRef] [Scilit] [PubMed]
- Cai, Z.; Xiao, C. Multi-objective dynamic scheduling for heterogeneous emergency fleets with breakdown-resilient rescheduling. Mathematics 2026, 14, 2541. [Google Scholar] [CrossRef] [Scilit]
- Toth, P.; Vigo, D. Vehicle Routing: Problems, Methods, and Applications, 2nd ed.; MOS-SIAM Series on Optimization; Society for Industrial and Applied Mathematics: Philadelphia, PA, USA, 2014. [Google Scholar] [CrossRef] [Scilit]
- Berbeglia, G.; Cordeau, J.-F.; Gribkovskaia, I.; Laporte, G. Static pickup and delivery problems: A classification scheme and survey. TOP 2007, 15, 1–31. [Google Scholar] [CrossRef] [Scilit]
- Pinedo, M.L. Scheduling: Theory, Algorithms, and Systems, 6th ed.; Springer: Cham, Switzerland, 2022. [Google Scholar] [CrossRef] [Scilit]
- Dechampai, D.; Tanwanichkul, L.; Sethanan, K.; Pitakaso, R. A differential evolution algorithm for the capacitated VRP with flexibility of mixing pickup and delivery services and the maximum duration of a route in poultry industry. J. Intell. Manuf. 2017, 28, 1357–1376. [Google Scholar] [CrossRef] [Scilit]
- Zhang, H.; Zhang, Y.; Zhao, F.; Zhou, L.; Zhou, B. Rich vehicle routing optimization based on variable neighborhood descent and differential evolution algorithm. Sci. Rep. 2025, 15, 32887. [Google Scholar] [CrossRef] [Scilit] [PubMed]
- Centeno, G.; Armacost, R.L. Parallel machine scheduling with release time and machine eligibility restrictions. Comput. Ind. Eng. 1997, 33, 273–276. [Google Scholar] [CrossRef] [Scilit]
- Hu, X.; Bao, J.S.; Jin, Y. Minimising makespan on parallel machines with precedence constraints and machine eligibility restrictions. Int. J. Prod. Res. 2010, 48, 1639–1651. [Google Scholar] [CrossRef] [Scilit]
- Lee, K.; Leung, J.Y.T.; Pinedo, M.L. Scheduling jobs with equal processing times subject to machine eligibility constraints. J. Sched. 2011, 14, 27–38. [Google Scholar] [CrossRef] [Scilit]
- Leung, J.Y.; Li, C. Scheduling with processing set restrictions: A survey. Int. J. Prod. Econ. 2008, 116, 251–262. [Google Scholar] [CrossRef] [Scilit]
- Dolgui, A.; Eremeev, A.V.; Kovalyov, M.Y.; Kuznetsov, P.M. Multi-product lot-sizing and scheduling on unrelated parallel machines to minimize makespan. IFAC Proc. Vol. 2009, 42, 828–833. [Google Scholar] [CrossRef] [Scilit]
- Gokhale, R.; Mathirajan, M. Scheduling identical parallel machines with machine eligibility restrictions to minimize total weighted flowtime in automobile gear manufacturing. Int. J. Adv. Manuf. Technol. 2012, 60, 1099–1110. [Google Scholar] [CrossRef] [Scilit]
- Rabadi, G.; Moraga, R.; Al-Salem, A. Heuristics for the unrelated parallel machine scheduling problem with setup times. J. Intell. Manuf. 2006, 17, 85–97. [Google Scholar] [CrossRef] [Scilit]
- Potts, C.N.; Kovalyov, M.Y. Scheduling with batching: A review. Eur. J. Oper. Res. 2000, 120, 228–249. [Google Scholar] [CrossRef] [Scilit]
- Webster, S.; Baker, K. Scheduling groups of jobs on a single machine. Oper. Res. 1995, 43, 692–703. [Google Scholar] [CrossRef] [Scilit]
- Moonsri, K.; Sethanan, K.; Sangsawang, C. Metaheuristics for scheduling unrelated parallel machines with sequence-dependent setup time and machine eligibility. Chiang Mai J. Nat. Sci. 2015, 14, 431–446. [Google Scholar] [CrossRef] [Scilit]
- Wu, X.; Che, A. A memetic differential evolution algorithm for energy-efficient parallel machine scheduling. Omega 2019, 82, 155–165. [Google Scholar] [CrossRef] [Scilit]
- Garey, M.R.; Johnson, D.S. “Strong” NP-completeness results: Motivation, examples, and implications. J. ACM 1978, 25, 499–508. [Google Scholar] [CrossRef] [Scilit]
- Storn, R.; Price, K. Differential evolution—A simple and efficient heuristic for global optimization over continuous spaces. J. Glob. Optim. 1997, 11, 341–359. [Google Scholar] [CrossRef] [Scilit]
- Kachitvichyanukul, V. Comparison of three evolutionary algorithms. Ind. Eng. Manag. Syst. 2012, 11, 215–223. [Google Scholar] [CrossRef] [Scilit]
- Pitakaso, R.; Sethanan, K. Modified differential evolution algorithm for simple assembly line balancing with a limit on the number of machine types. Eng. Optim. 2016, 48, 253–271. [Google Scholar] [CrossRef] [Scilit]
- Sethanan, K.; Pitakaso, R. Improved differential evolution algorithms for solving generalized assignment problem. Expert Syst. Appl. 2016, 45, 450–459. [Google Scholar] [CrossRef] [Scilit]
- Sethanan, K.; Pitakaso, R. Differential evolution algorithms for scheduling raw milk transportation. Comput. Electron. Agric. 2016, 121, 245–259. [Google Scholar] [CrossRef] [Scilit]
- Bureau of Public Disaster Prevention Measures. Public Disaster Machinery Manual for Executives; Department of Disaster Prevention and Mitigation, Ministry of Interior: Bangkok, Thailand, 2018.
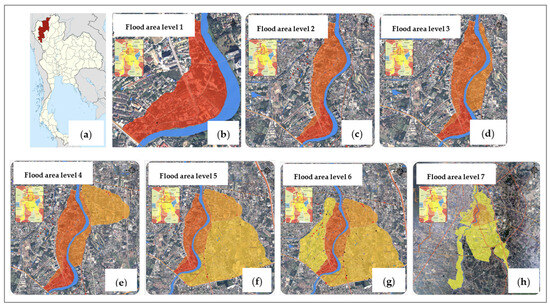
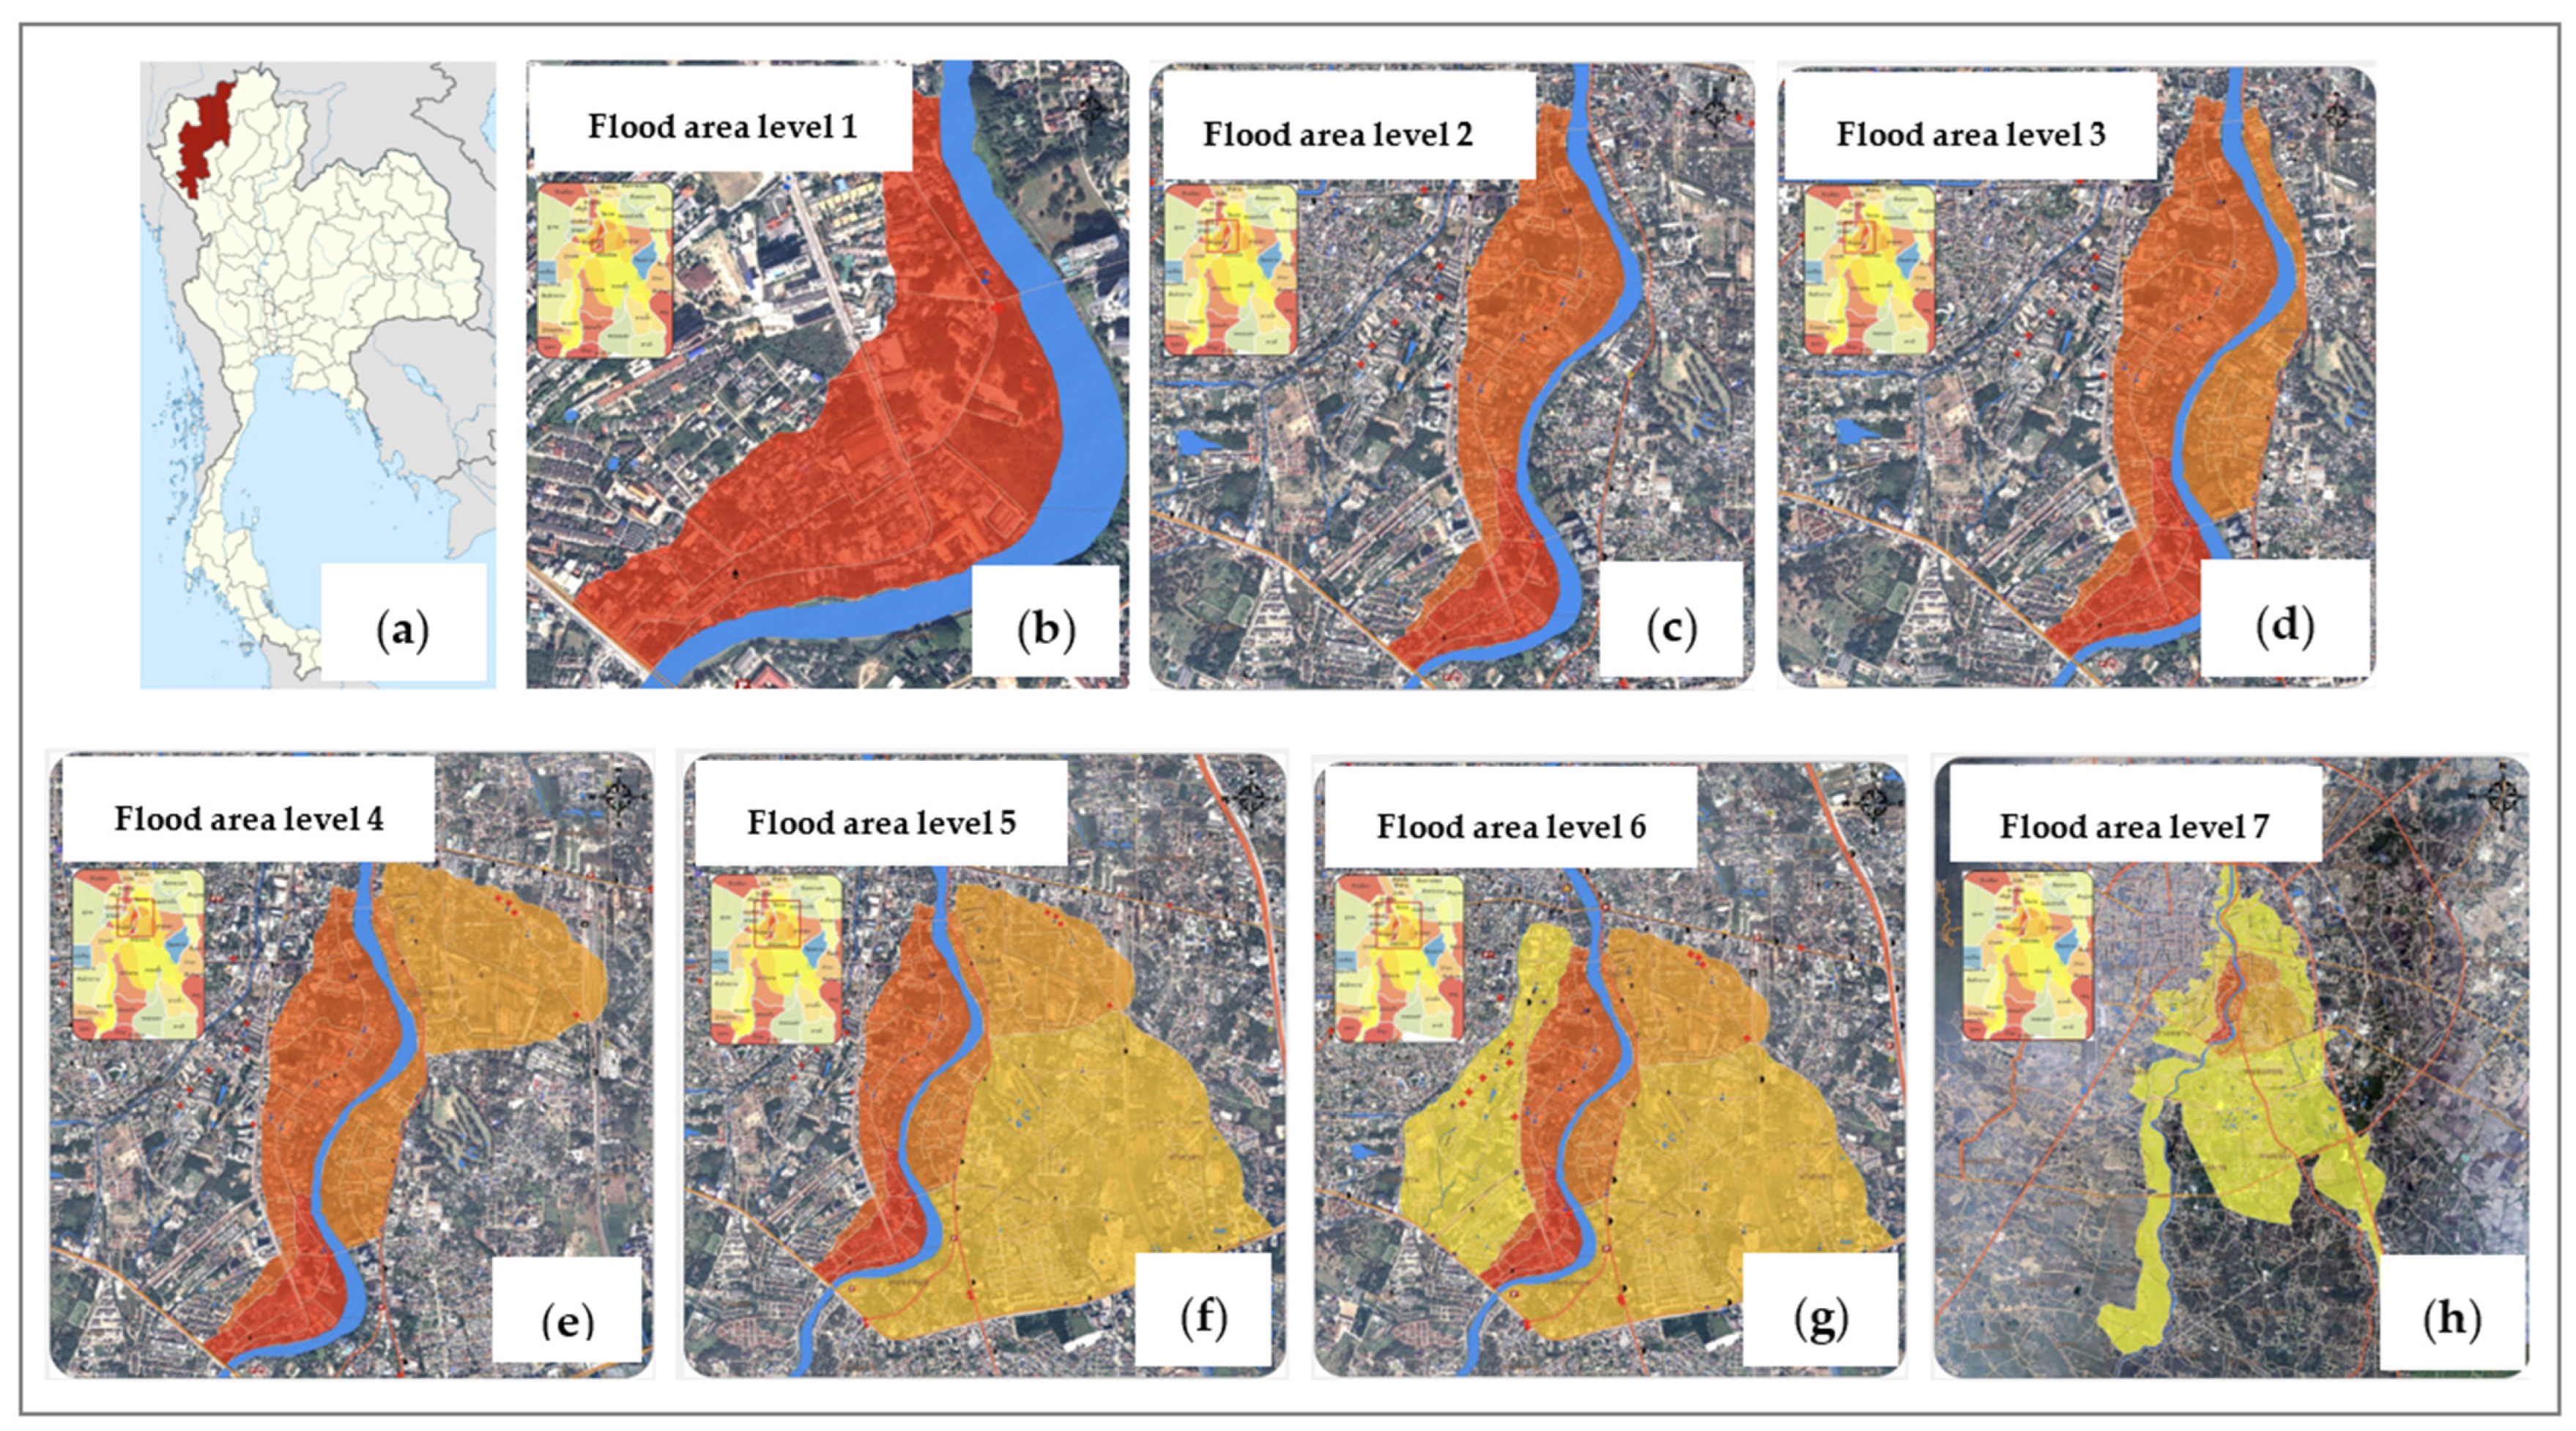
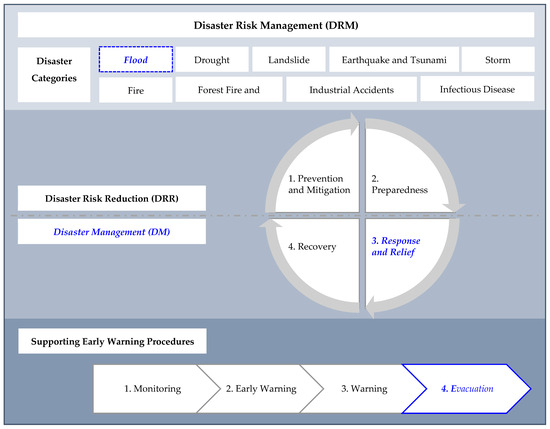
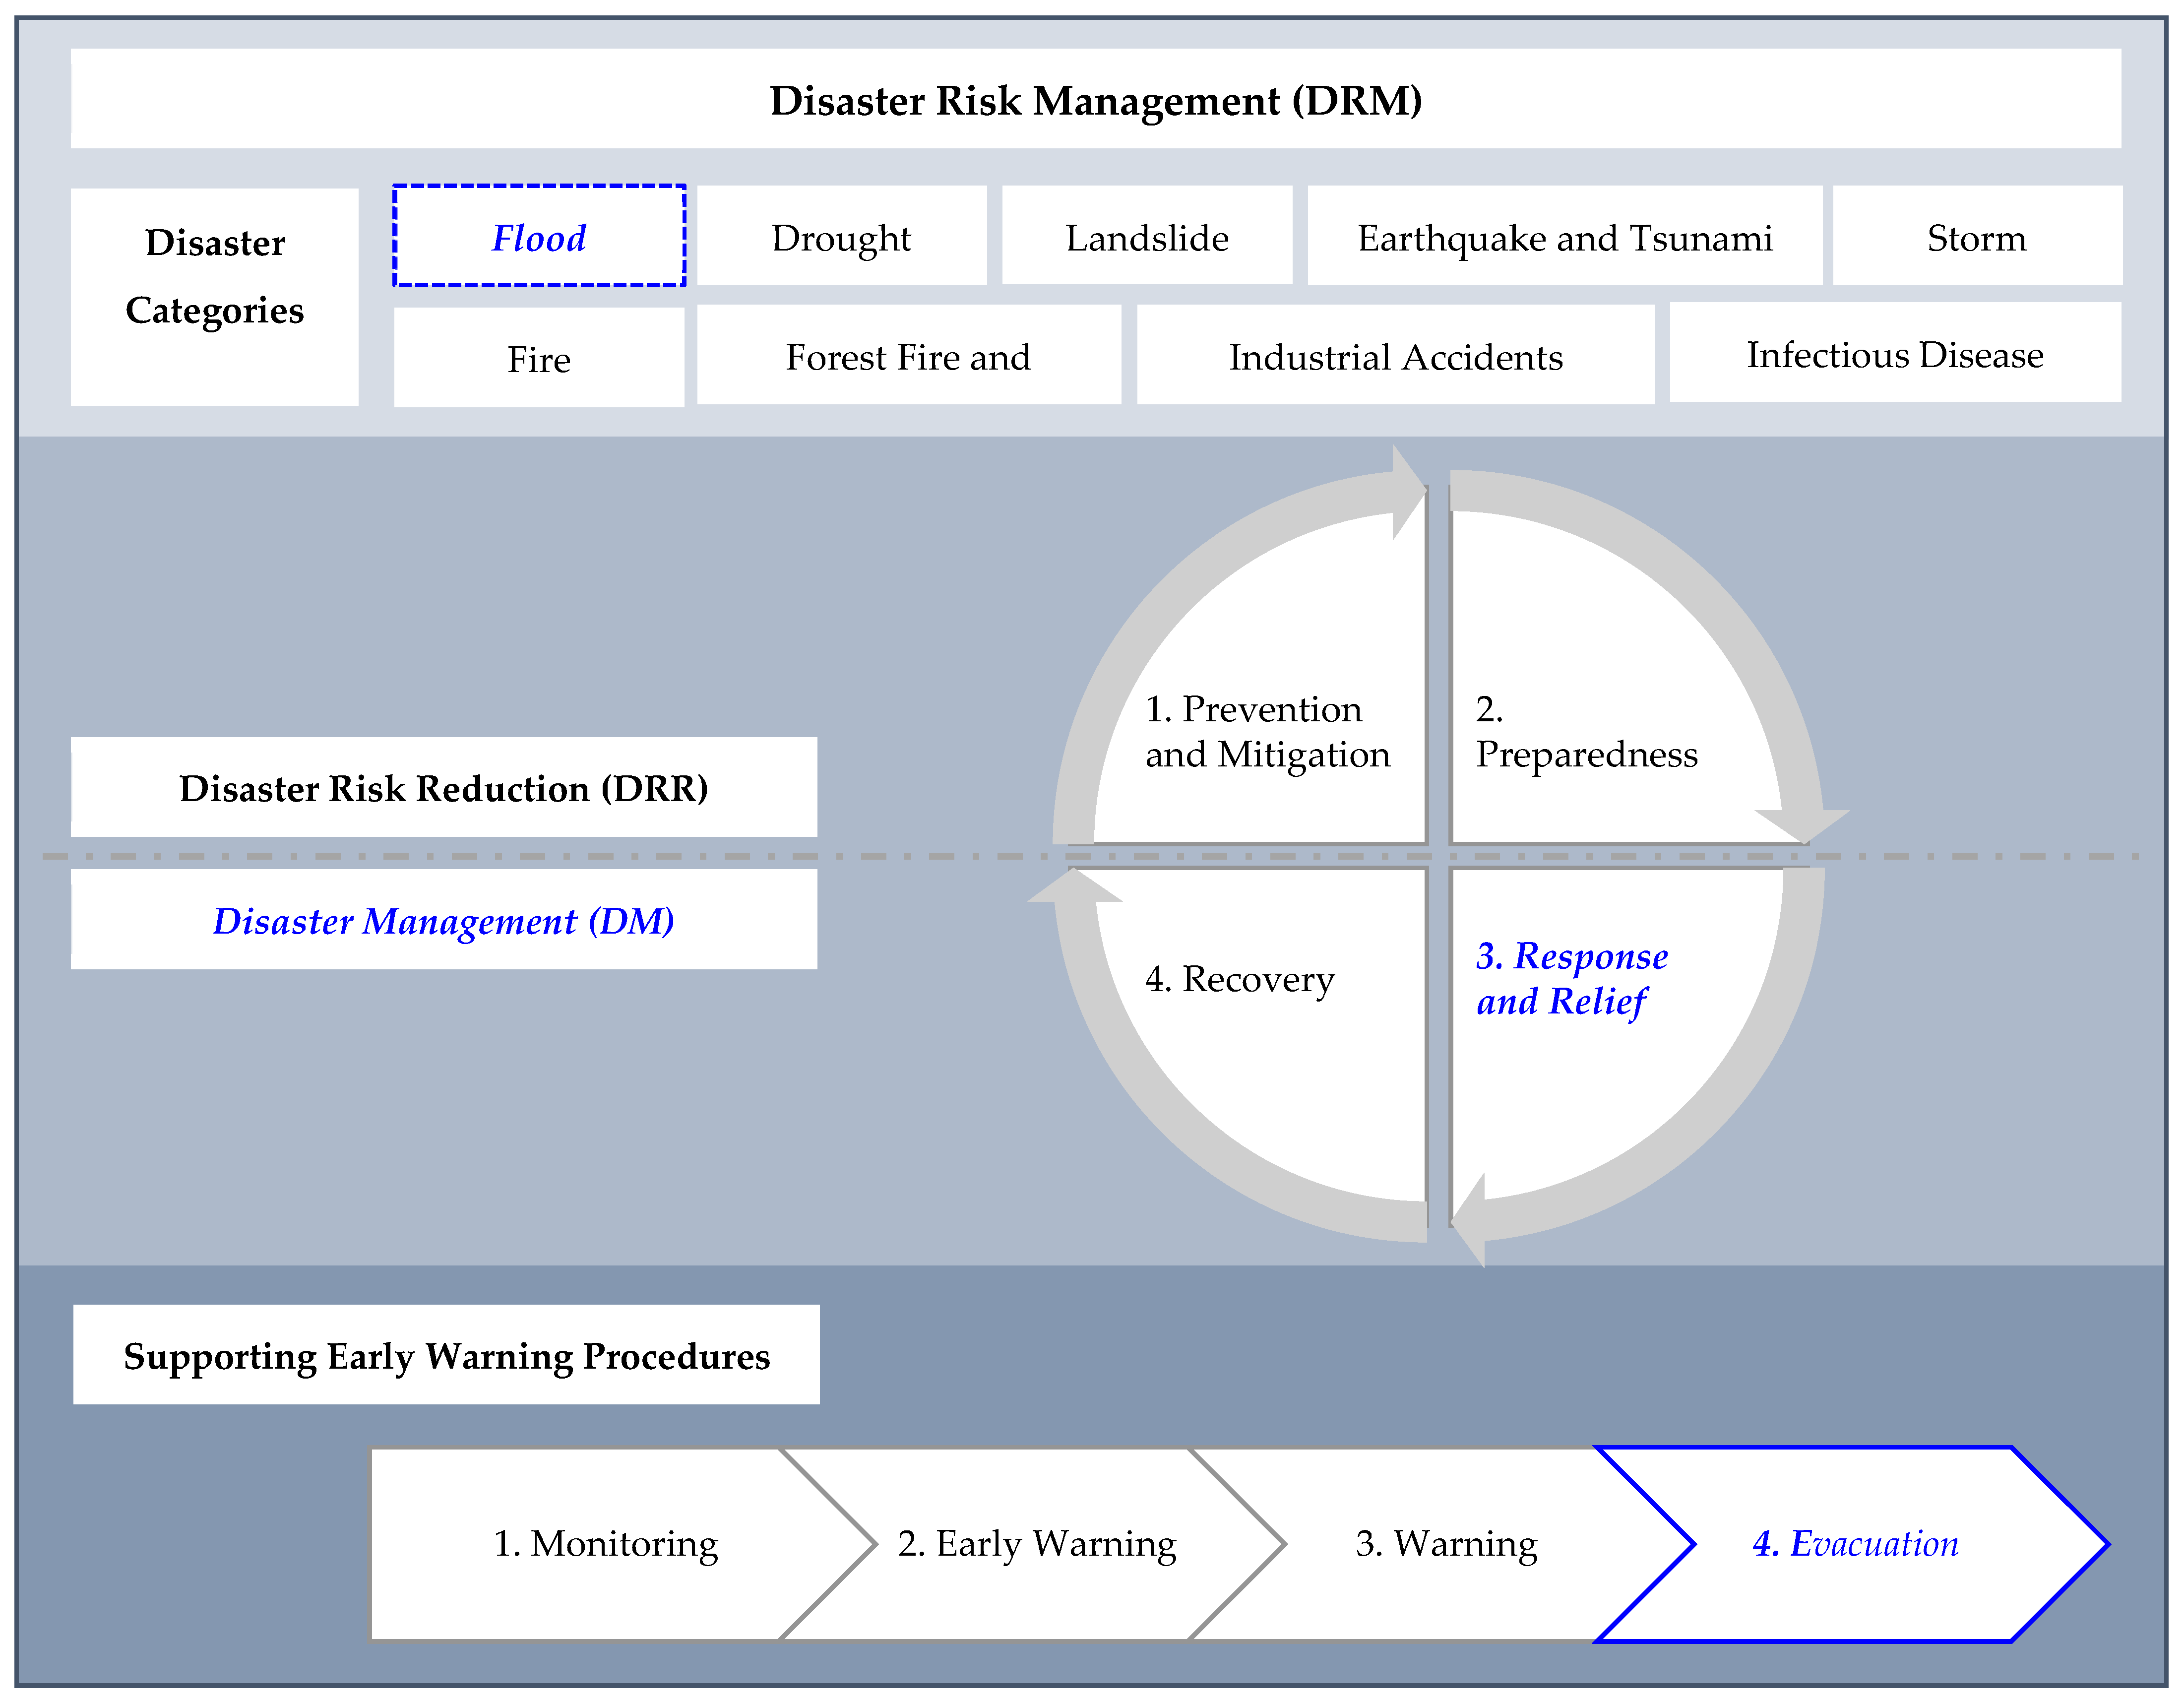
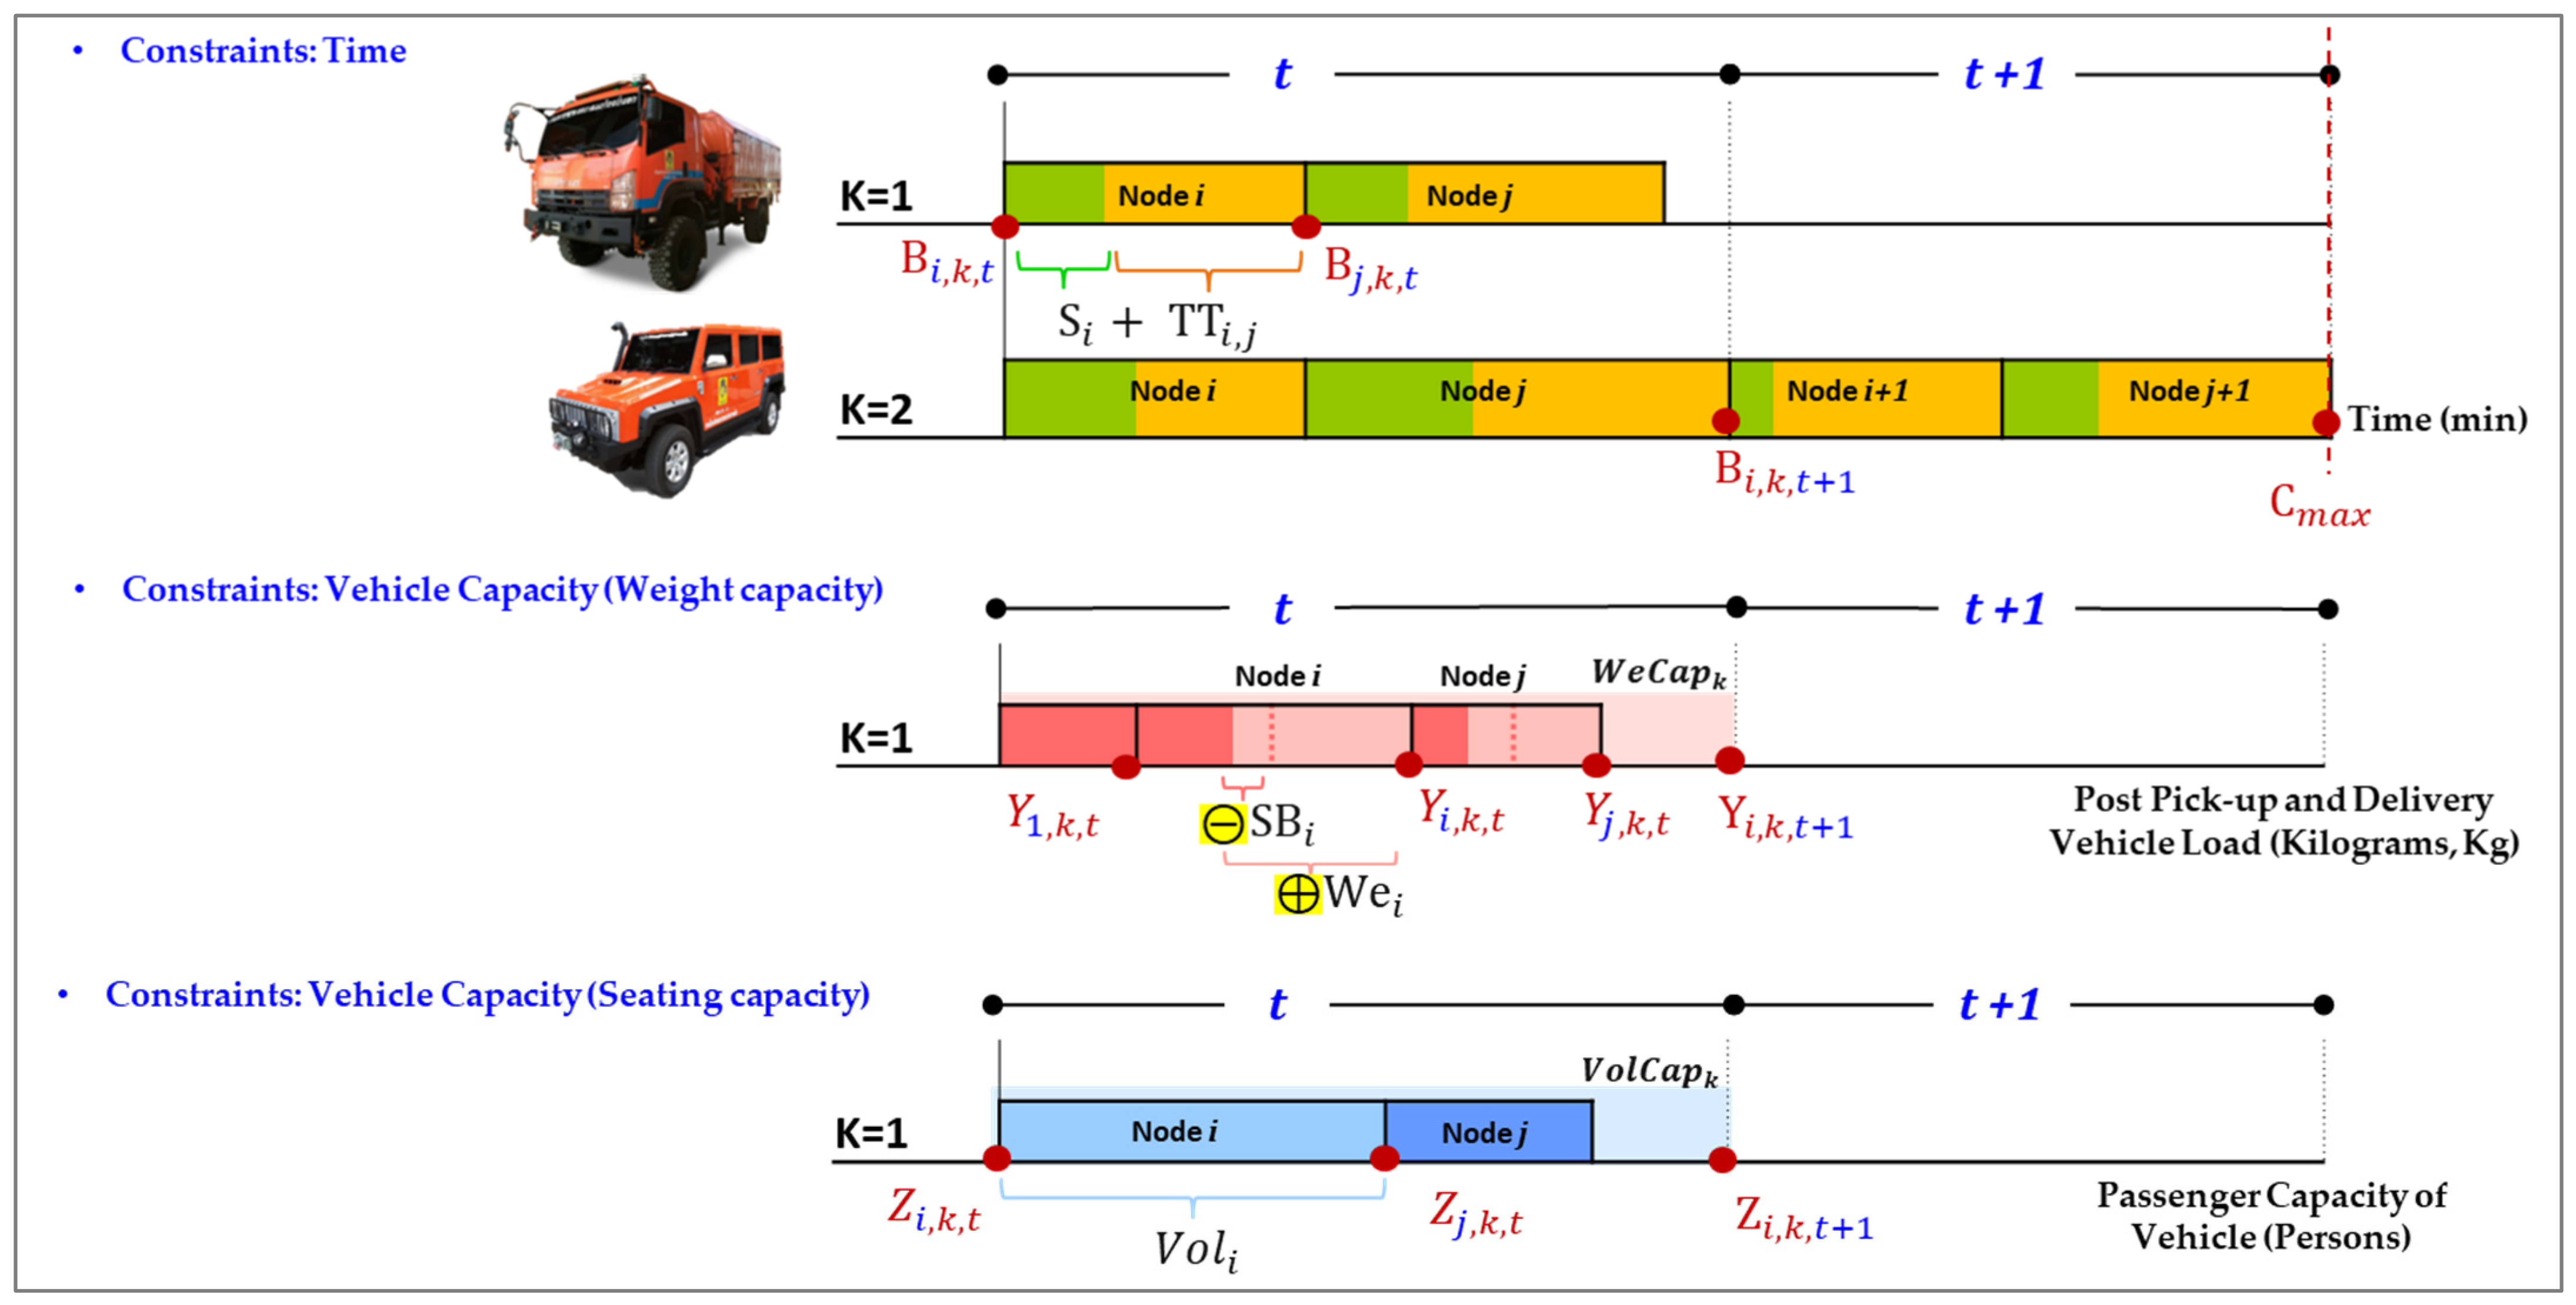
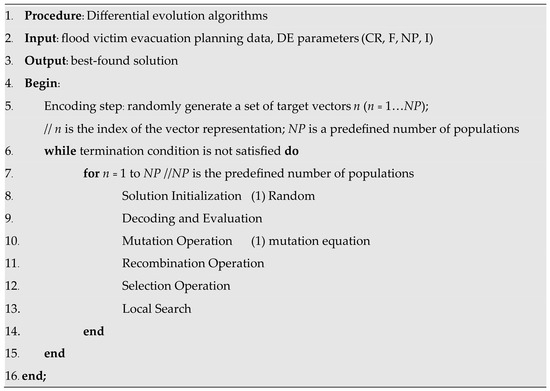
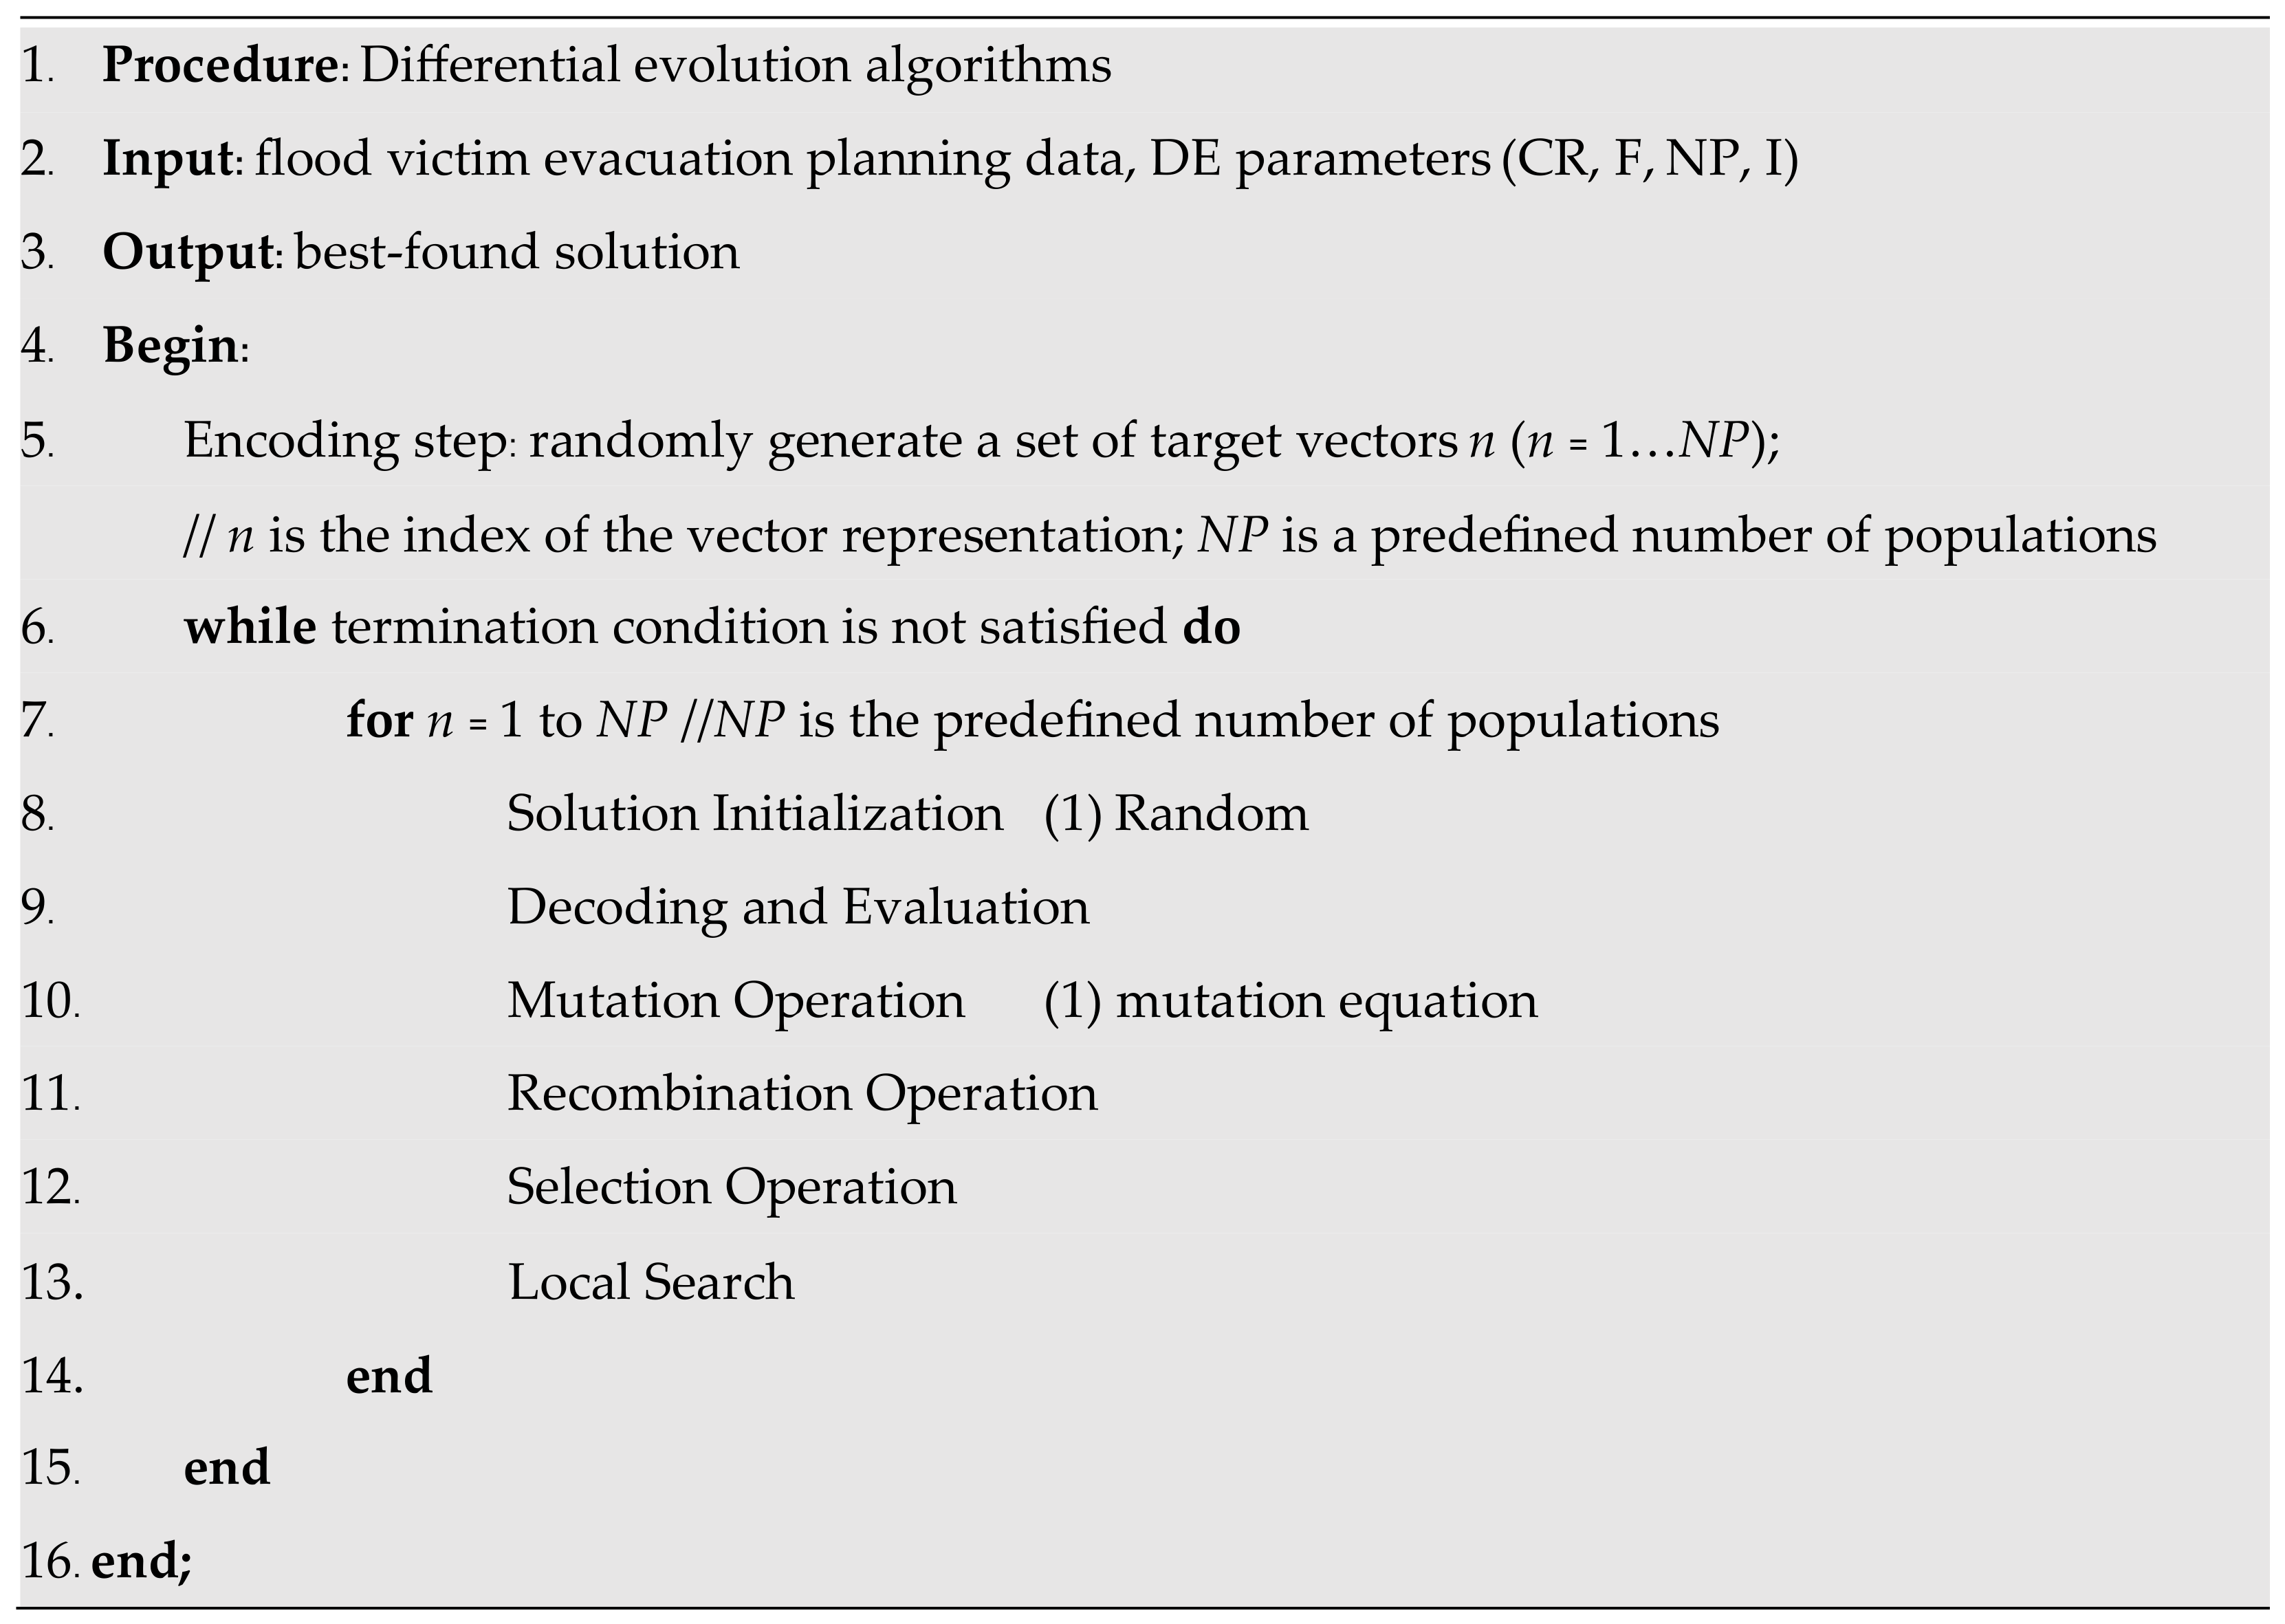


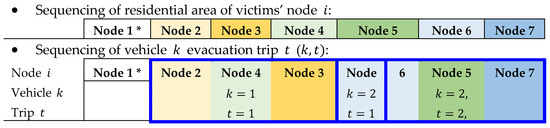
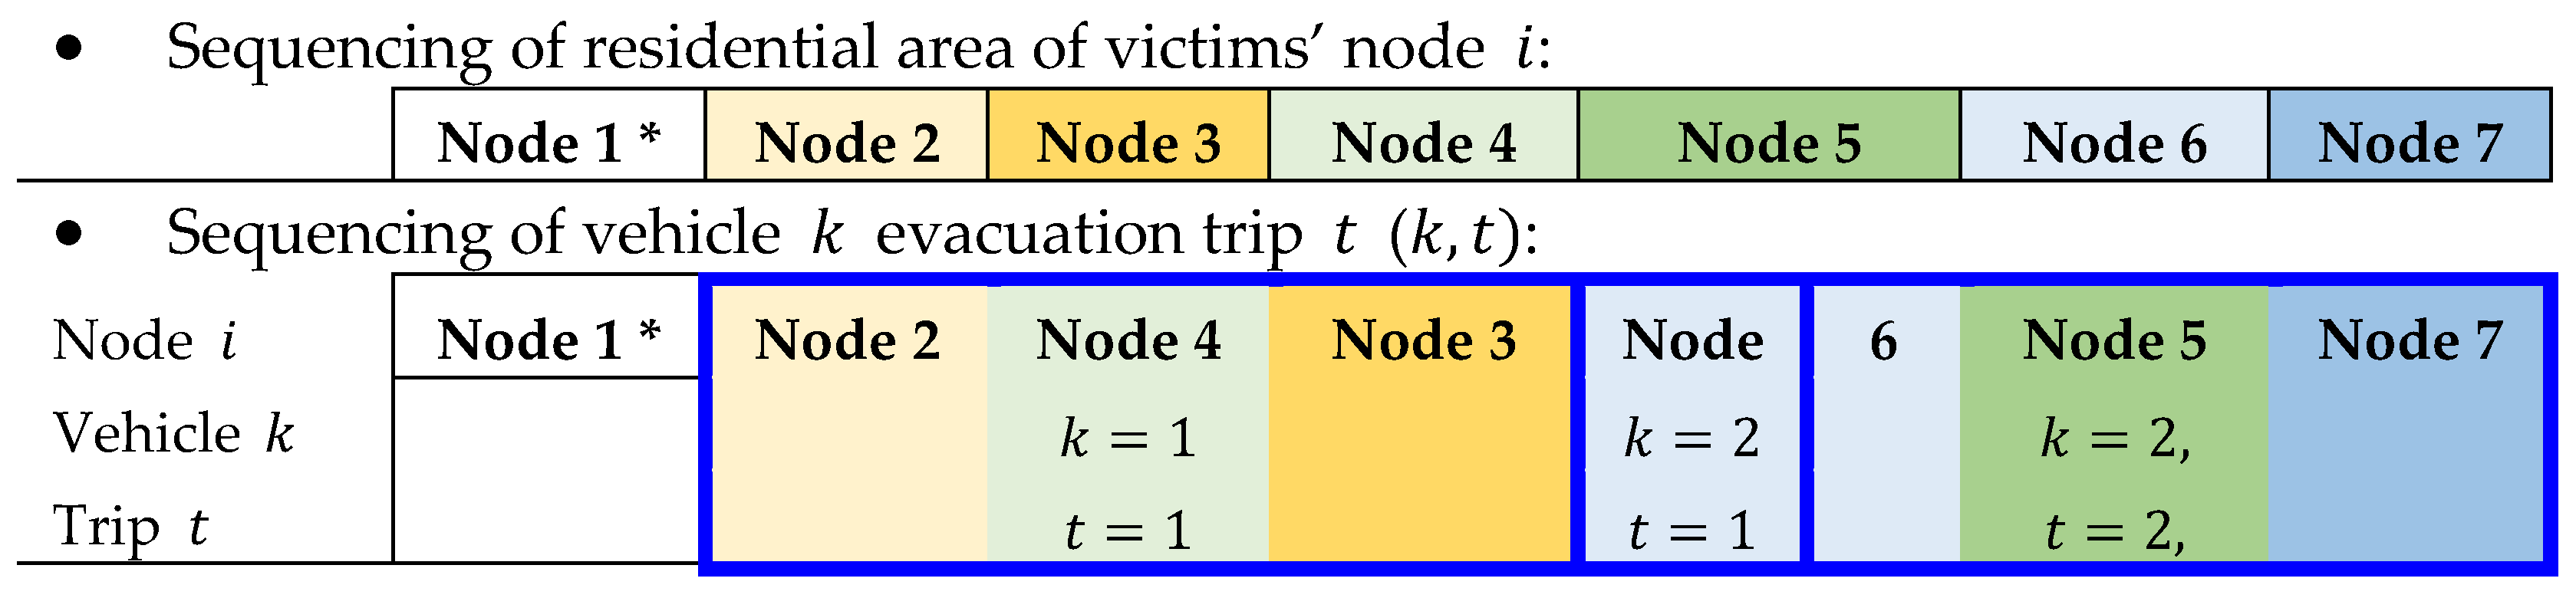
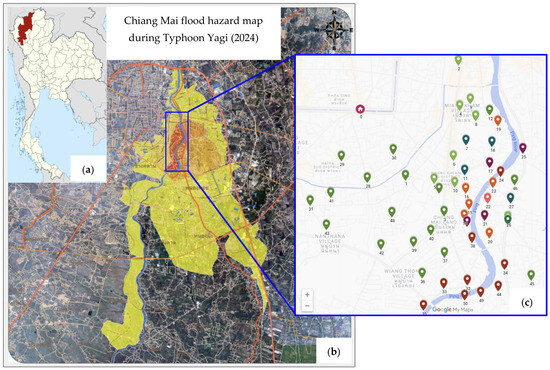
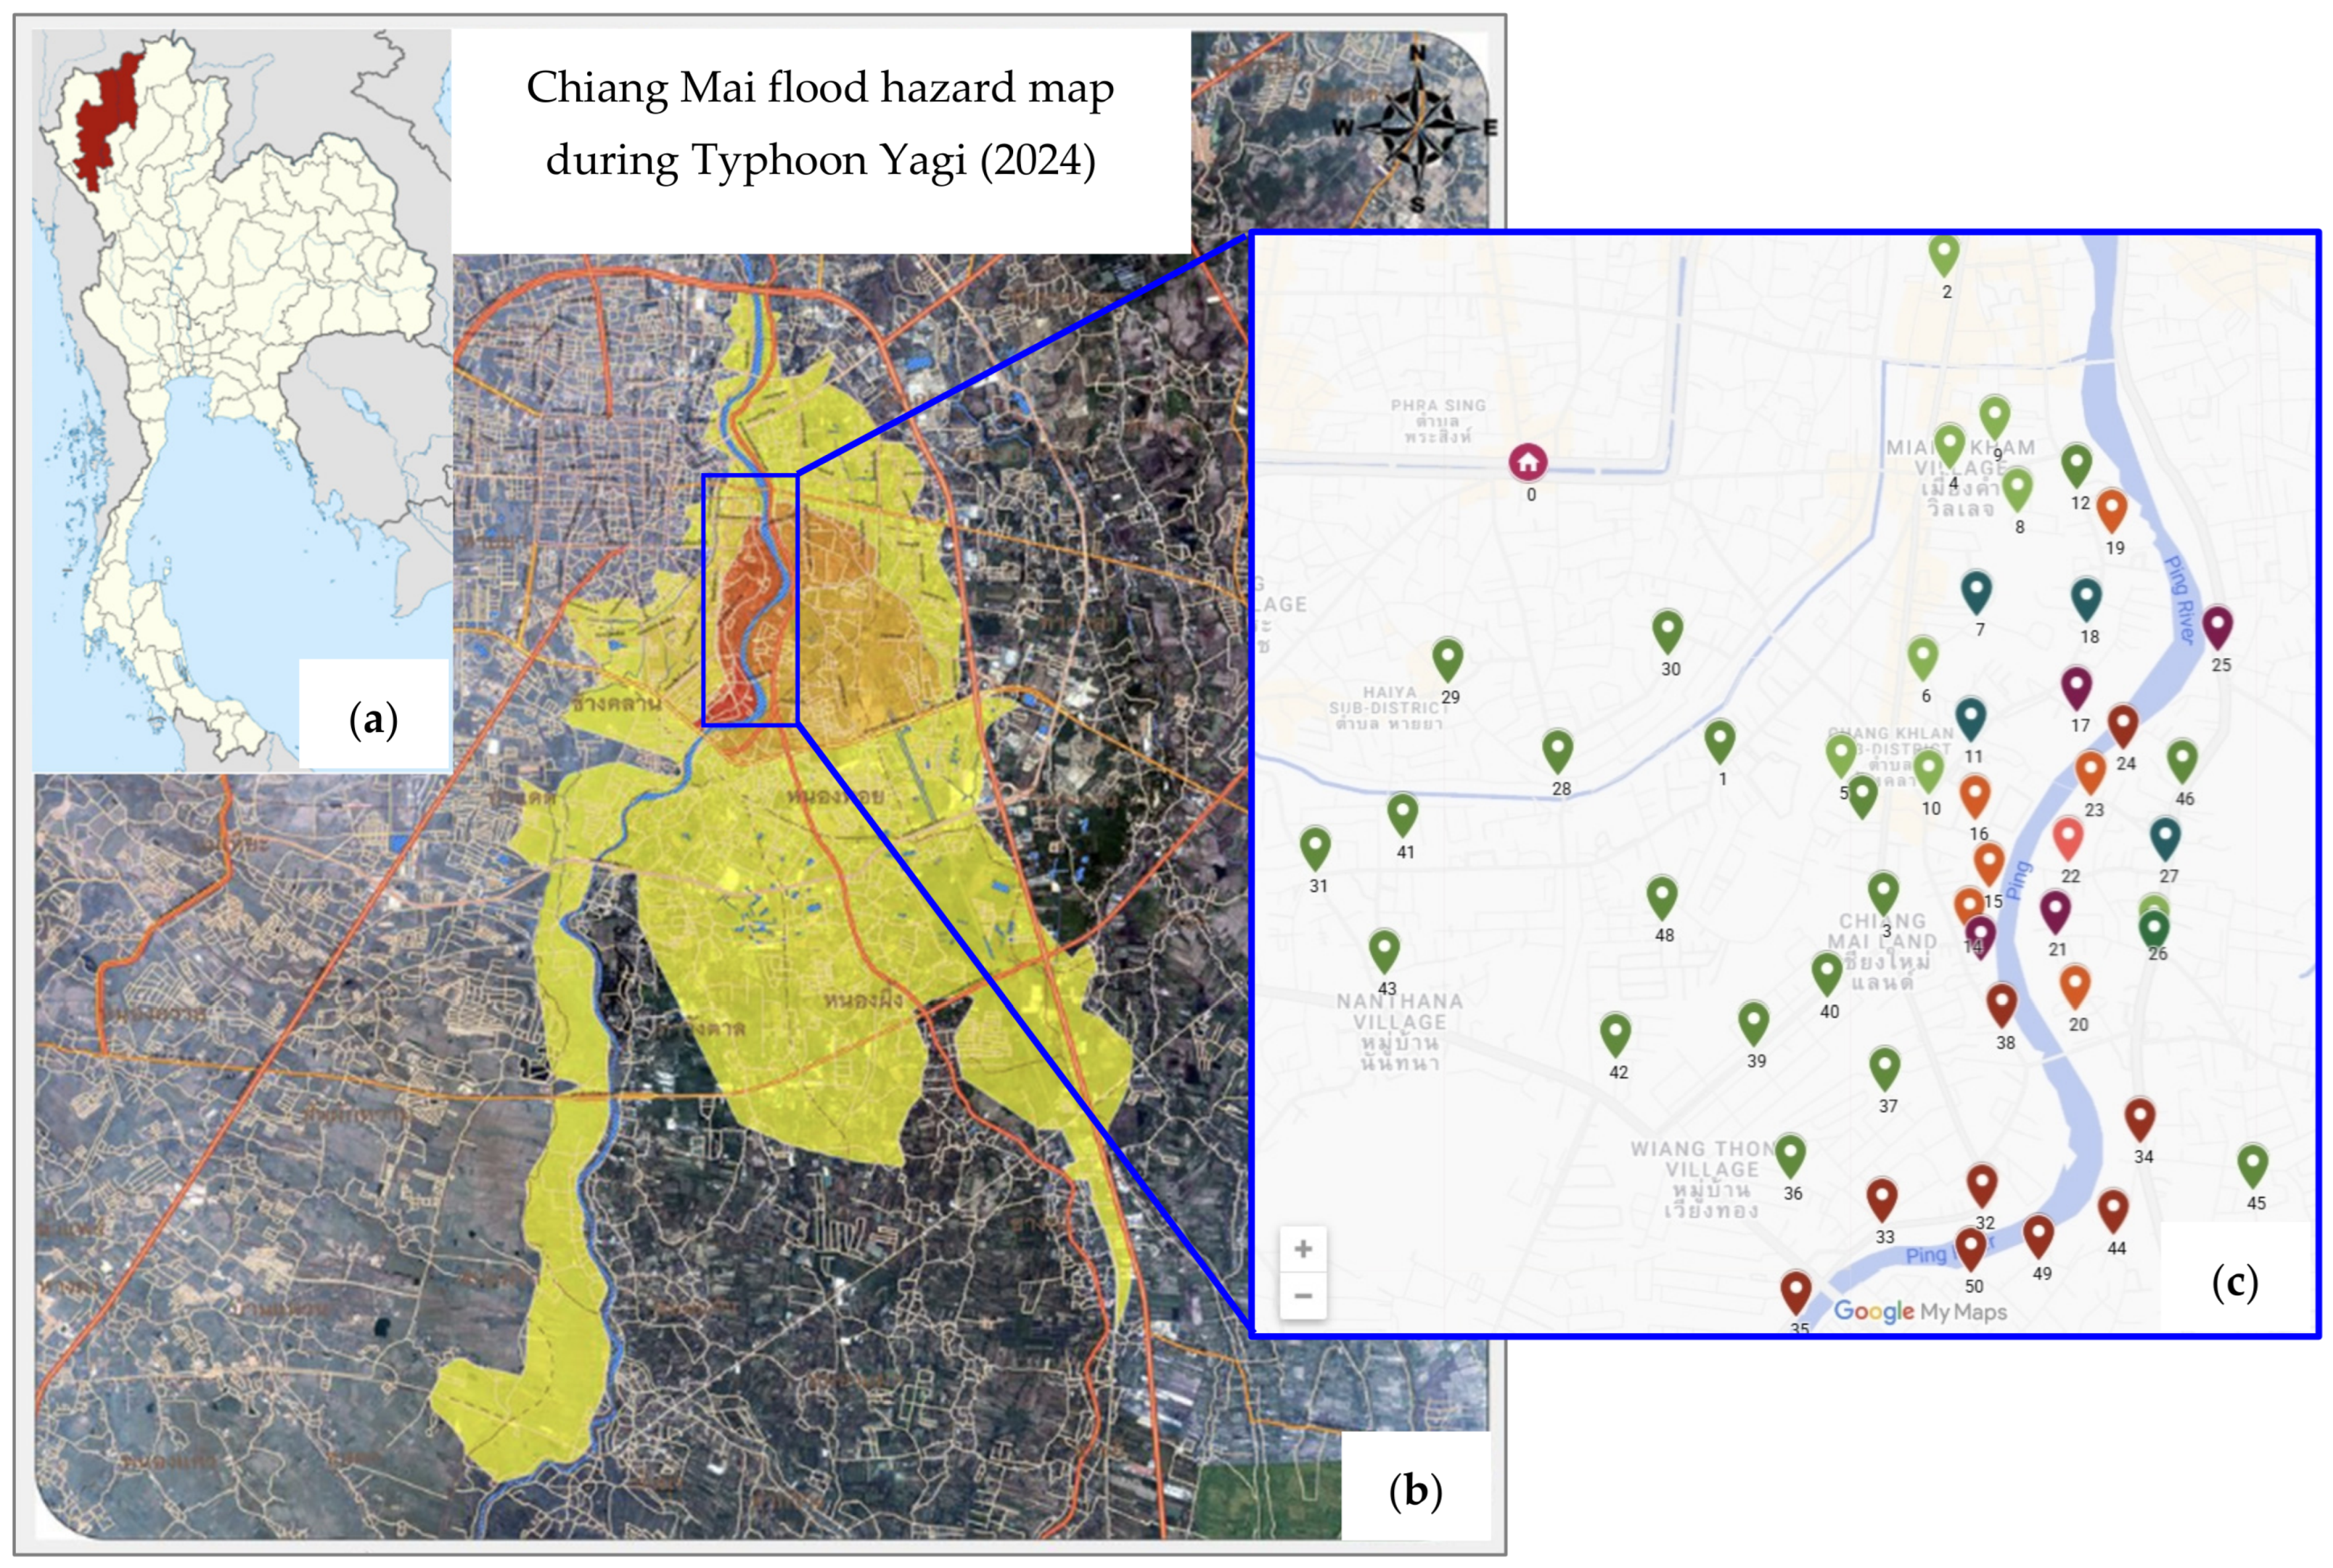
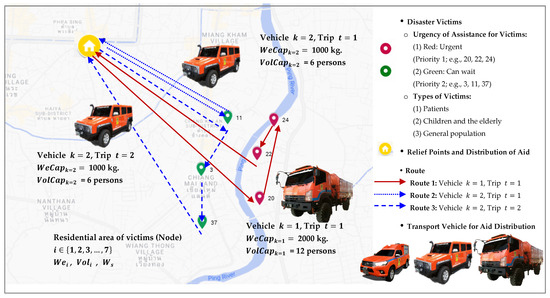
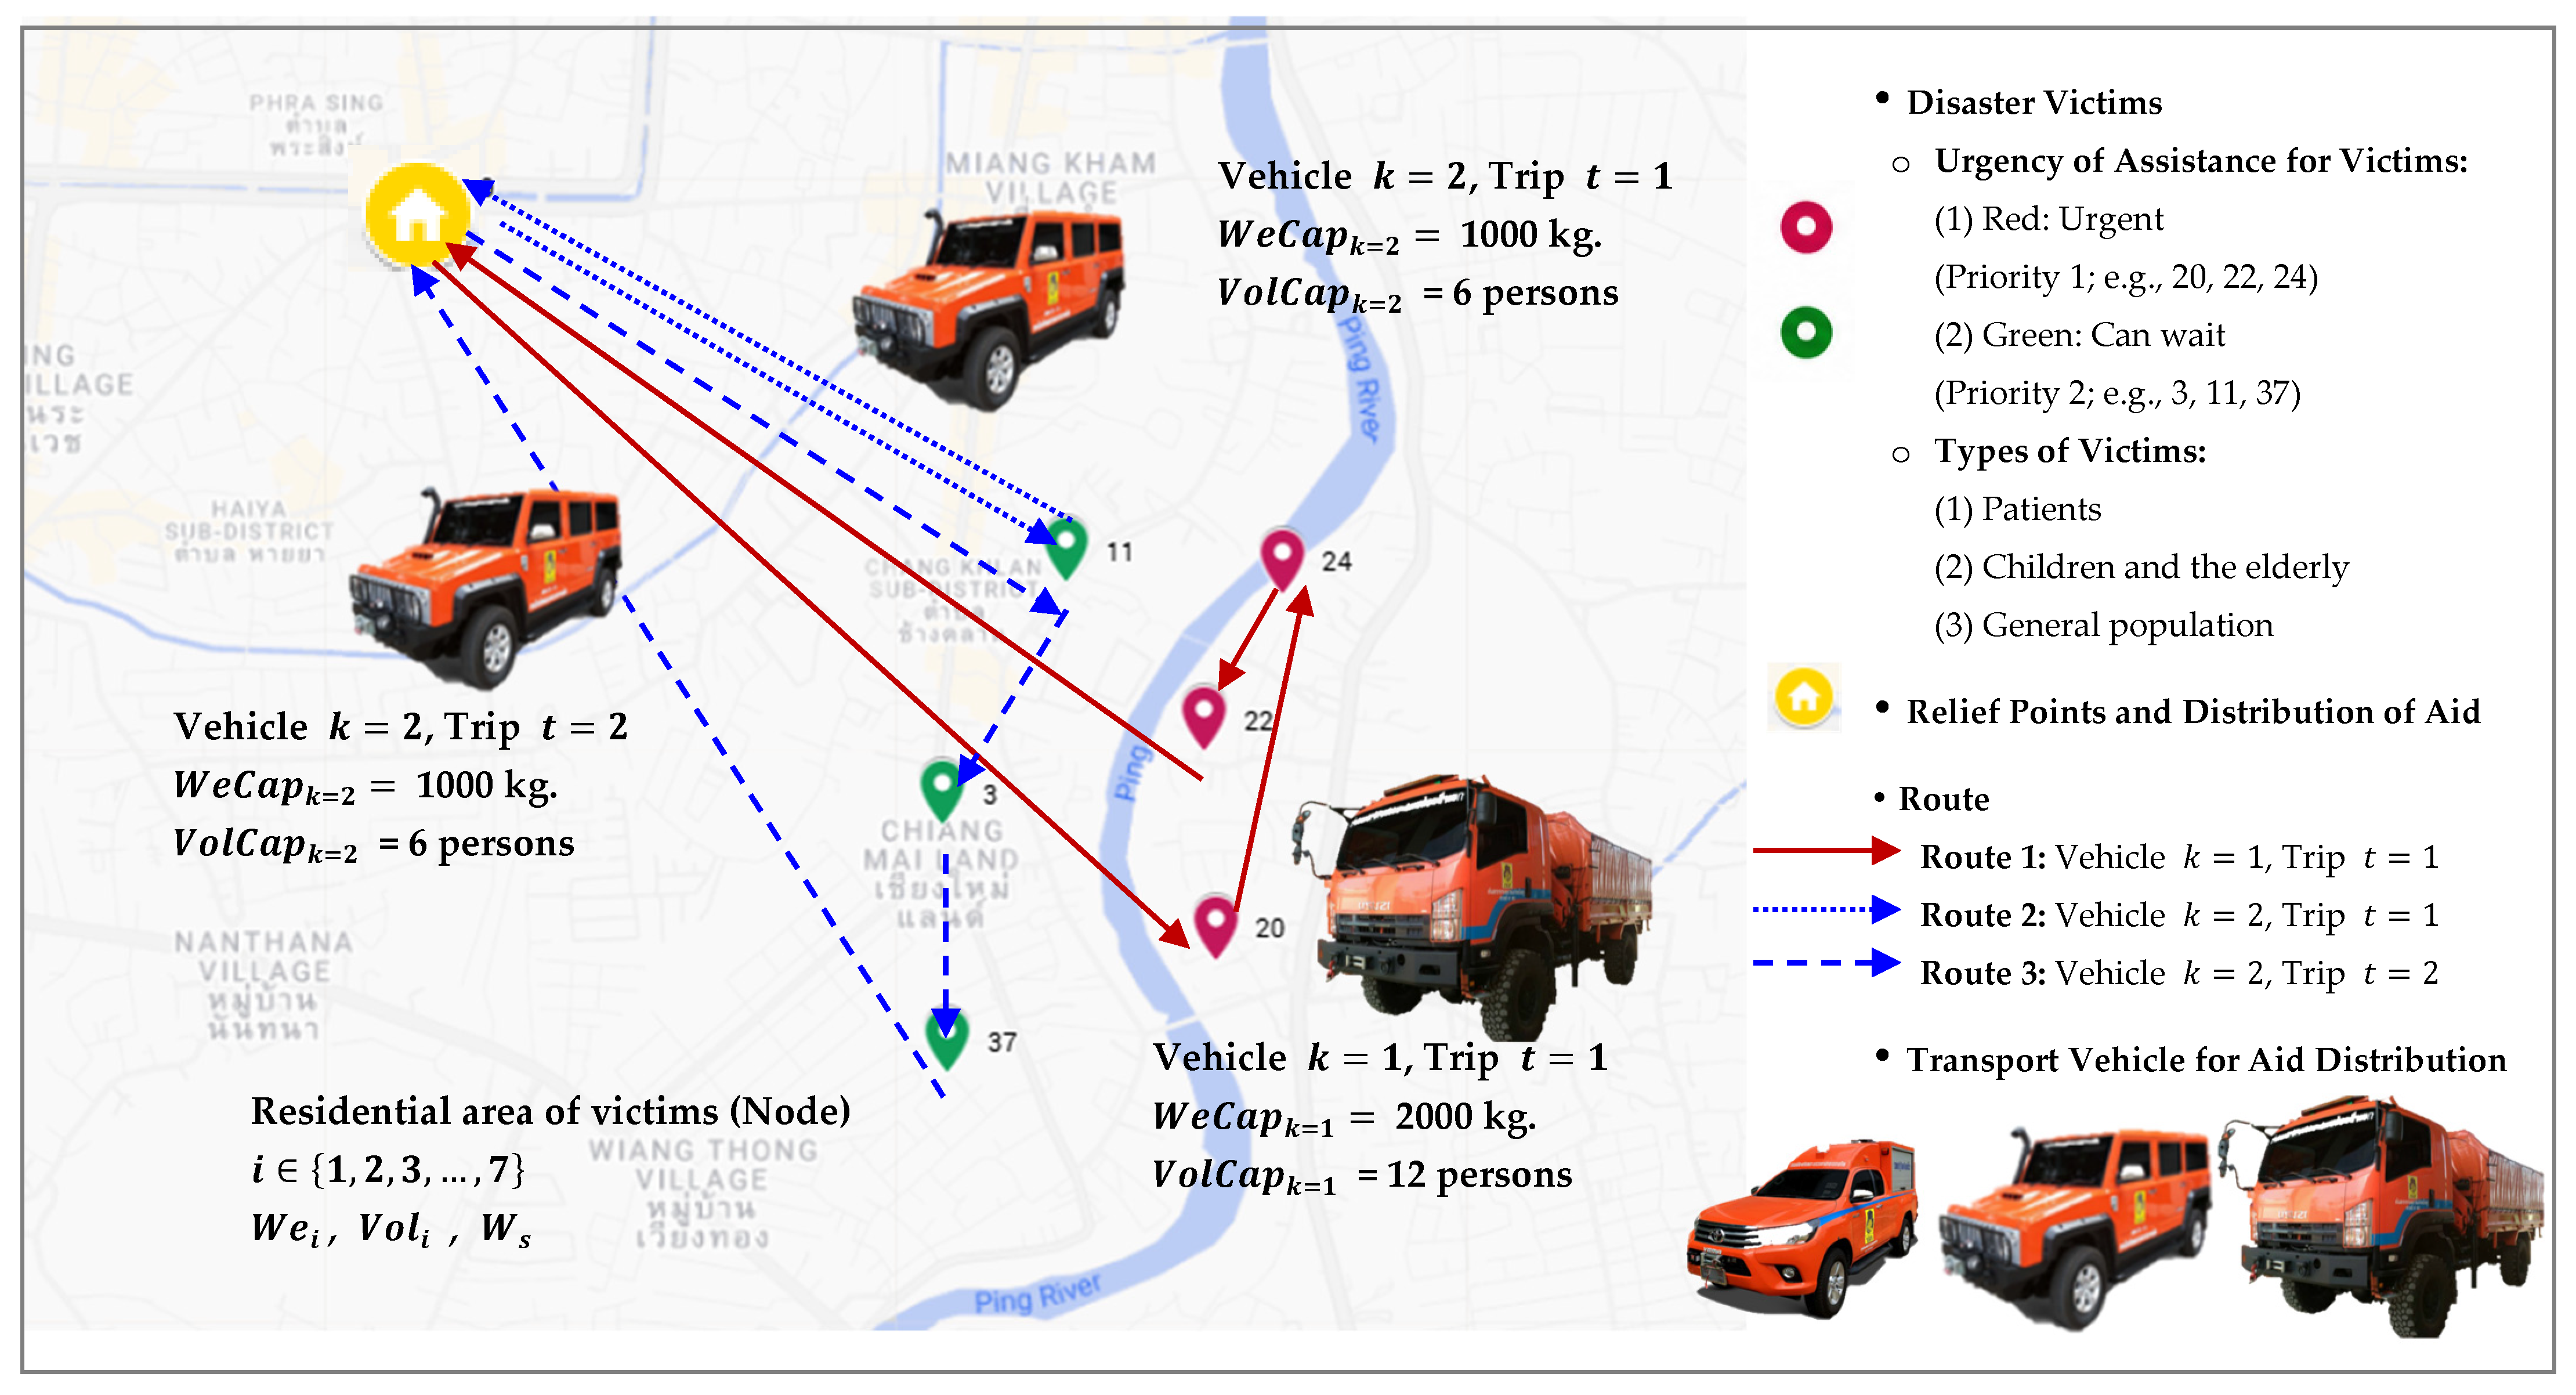
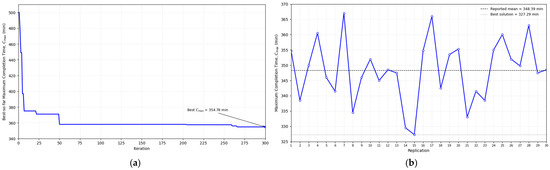
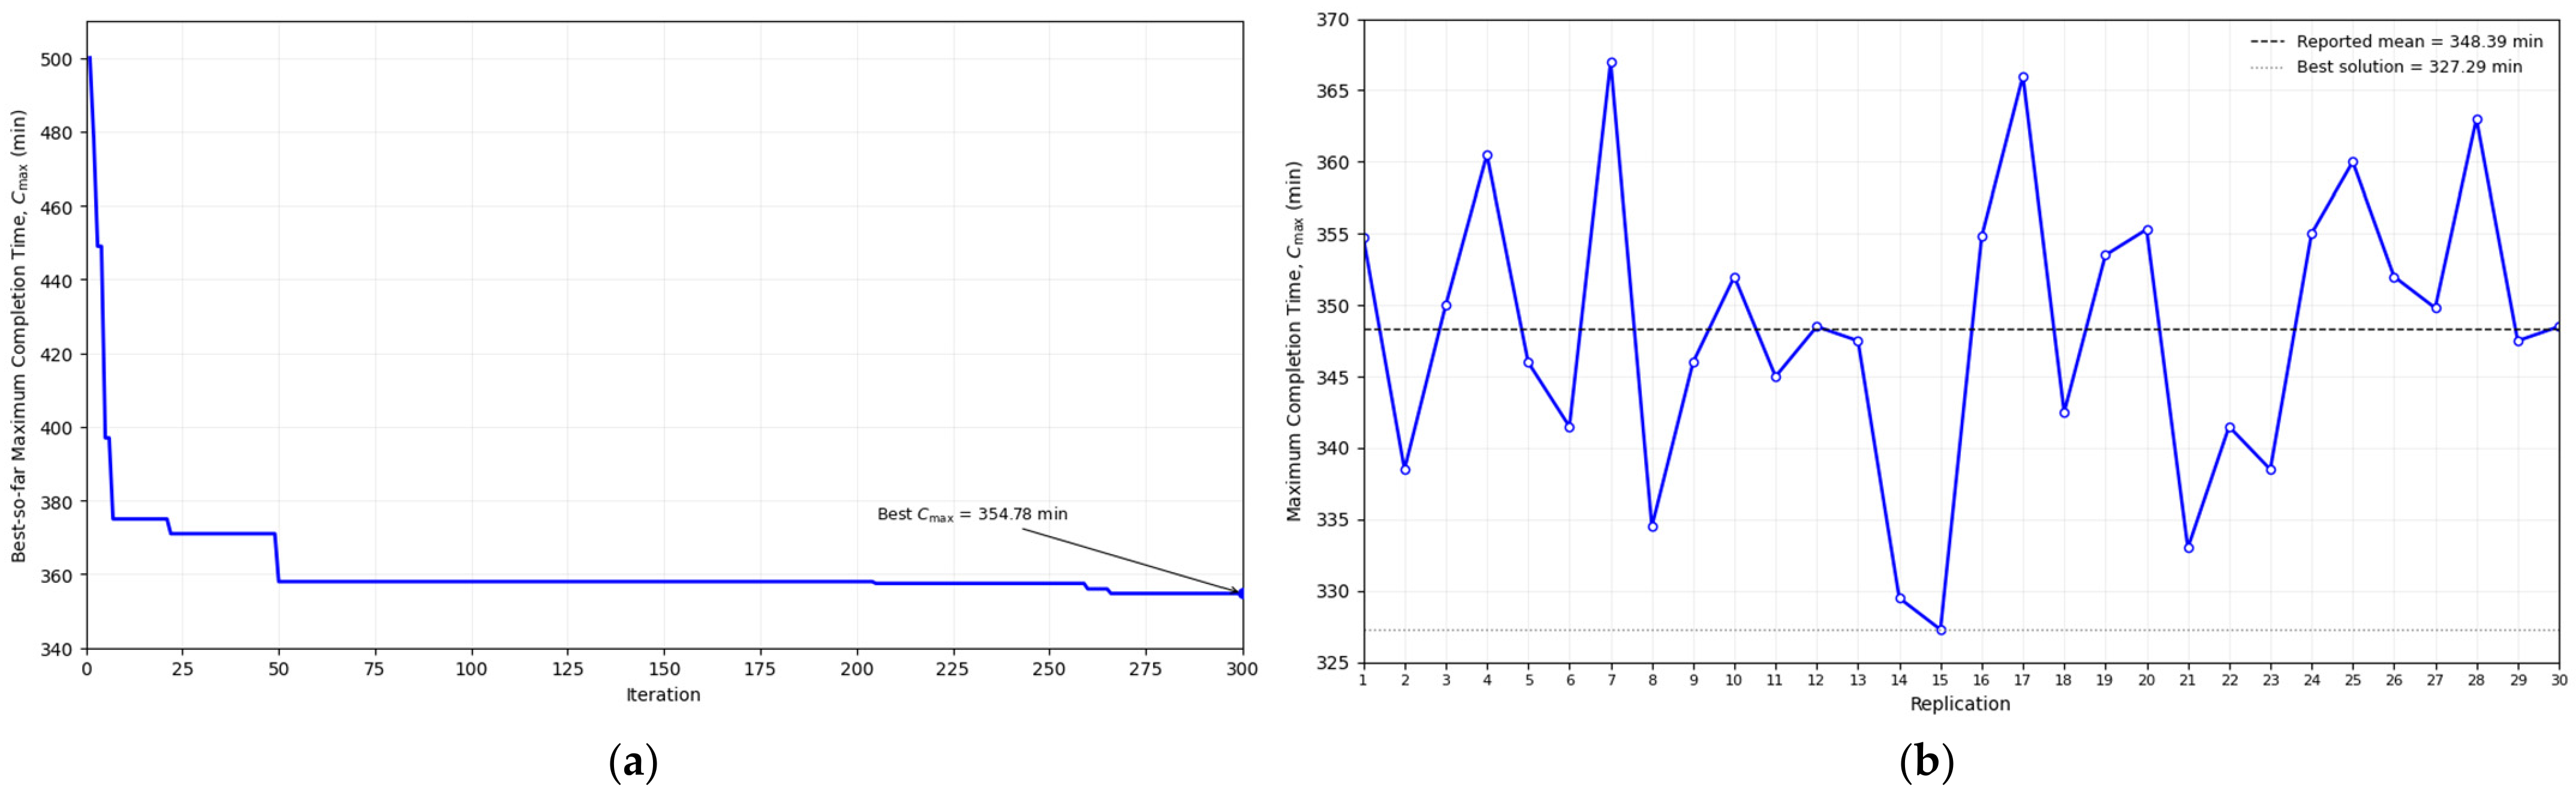
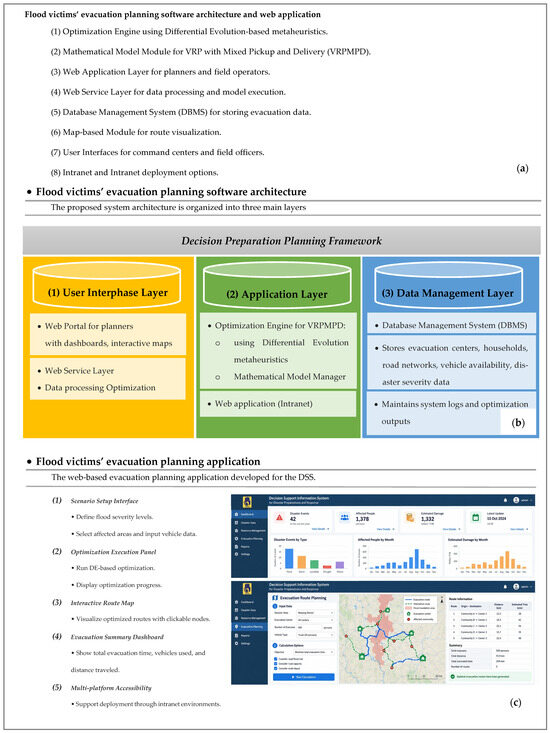
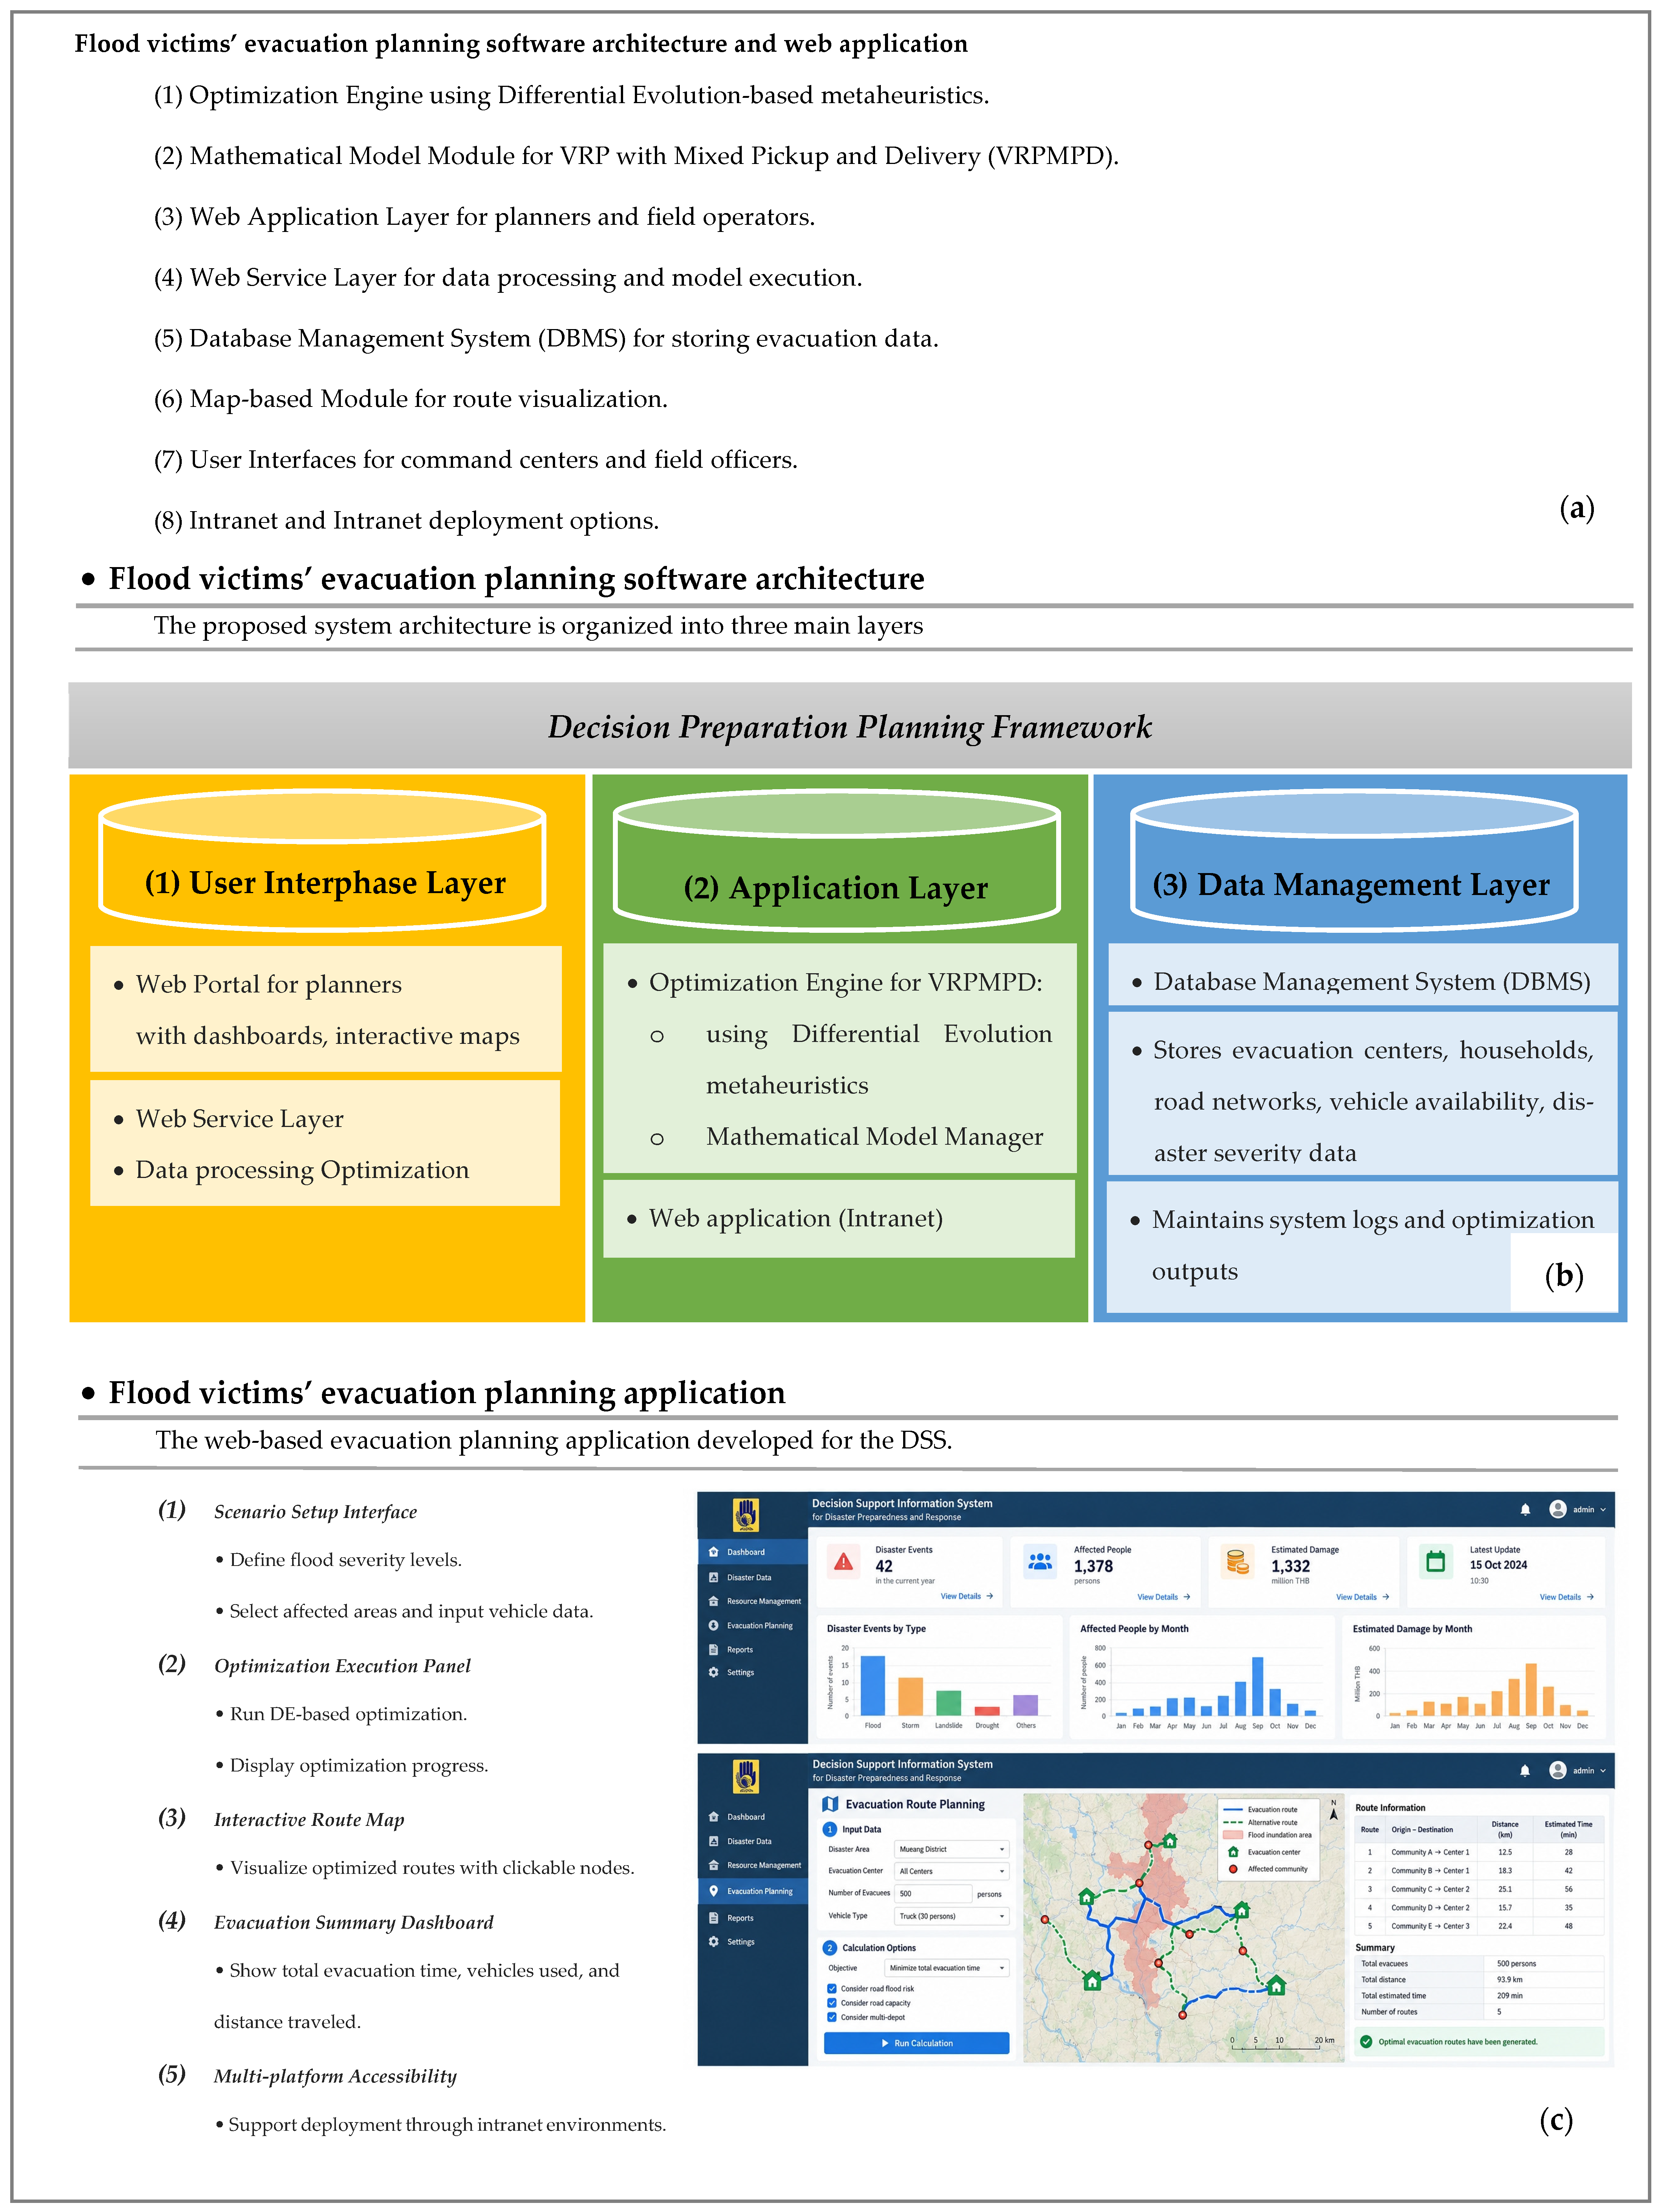

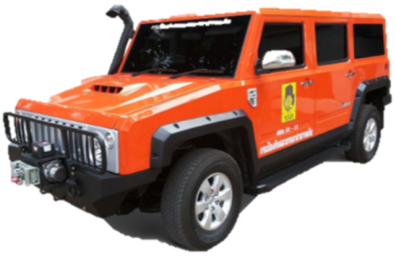
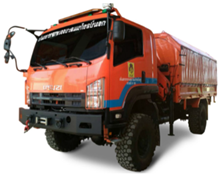

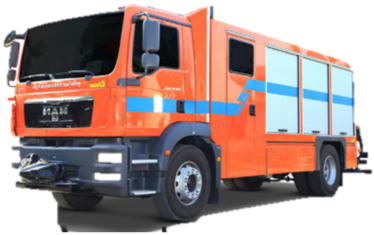
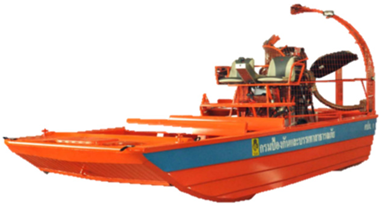
Disclaimer/Publisher’s Note: The statements, opinions and data contained in all publications are solely those of the individual author(s) and contributor(s) and not of MDPI and/or the editor(s). MDPI and/or the editor(s) disclaim responsibility for any injury to people or property resulting from any ideas, methods, instructions or products referred to in the content. |
© 2026 by the authors. Licensee MDPI, Basel, Switzerland. This article is an open access article distributed under the terms and conditions of the Creative Commons Attribution (CC BY) license.