


Abstract
Existing interval carbon price forecasting methods usually estimate the upper and lower bounds independently or derive them from point forecasts, overlooking their intrinsic coupling and risking logically inconsistent outputs. We propose a constrained multi-task learning framework, CMTL-ATCN, that treats interval-valued carbon prices as coupled tasks and optimizes them jointly under logical consistency constraints. The model uses attention-enhanced temporal convolutional networks (ATCN) to extract shared and task-specific features from multi-source data, which are then fused and decoded through dual task heads; all parameters are optimized jointly with a loss function that adds a logic penalty enforcing agreement between the two bounds. On China’s national (CEA), Guangdong (GDEA), and Hubei (HBEA) carbon markets, CMTL-ATCN attains the lowest interval forecast errors among deep models and eliminates logical inconsistencies entirely with zero violations. The results indicate that the proposed framework is promising for interval-valued forecasting in complex environments.
Keywords:
carbon price forecasting; interval-valued time series; multi-task learning; temporal convolutional network MSC:
91-08
1. Introduction
The carbon emission trading mechanism is a central market-based instrument for cost-effective decarbonization [1,2]. The carbon price plays a pivotal role in carbon trading, yet carbon prices exhibit pronounced volatility and heavy tails, such that point forecasts are insufficient for risk control and compliance [3,4,5]. Interval forecasts, which report predictive price bounds, better serve regulators and traders [6]. Growing attention to uncertainty characterization has driven a shift in carbon price forecasting research from point-valued to interval-valued series [7,8].
Prior work on interval carbon price forecasting falls into three streams. The first stream performs interval forecasting based on conditional probability distribution estimation. Lei et al. [9] combine SSA denoising with a non-crossing composite quantile neural network, forecasting the conditional probability distribution of carbon allowance prices in Chinese and European markets; Cao et al. [10] introduce a Quantile Temporal Convolutional Network (QTCN) that captures carbon price uncertainty; and Wang et al. [11] pair TS2Vec pretraining with a Distribution Transformer to deliver accurate probability density forecasts. The second stream develops decomposition–ensemble approaches for interval forecasting. Zhu et al. [12] propose a multiscale ensemble method BEMD–DE–XGB for carbon price interval forecasting; a subsequent update strengthened robustness using CEEMDAN-Bootstrap-XGB [13]; and for EUA futures, Yang et al. [14] develop a multiscale interval-valued decomposition–ensemble (MIDE) framework that integrates NAMEMD, IVAR, interval event analysis, and an interval MLP. The third stream builds combined point–interval frameworks that jointly pursue point accuracy and interval validity within one system. Niu et al. [15] propose a composite scheme coupling point forecasts with interval forecasts and validate its effectiveness on EU ETS daily futures; Zeng et al. [16] employ MVMD with an attention-based LSTM to realize multi-step joint point–interval forecasting, delivering robust improvements on the EUA series.
Despite this progress, the literature on interval carbon price forecasting still suffers from three systemic limitations. First, most existing methods treat the upper and lower bounds as separate targets and ignore their intrinsic structural dependence, which often produces logically inconsistent intervals. Second, although some recent studies have incorporated market microstructure variables or external indicators, no unified framework for integrating multi-source data has yet emerged. Third, decomposition–ensemble methods achieve high coverage but remain sensitive to the choice of decomposition method and window length, which raises concerns about their robustness.
To address these gaps, this paper proposes a novel carbon price interval forecasting model, CMTL-ATCN, built on a multi-task learning framework in which the interval-valued carbon prices are treated as coupled tasks and jointly optimized for logical consistency at both the objective and the representation levels. An attention-enhanced temporal convolutional network (ATCN) serves as the pattern extractor, learning both shared and task-specific features. Our main contributions are as follows:
- (1)
- We formulate carbon price interval forecasting as a multi-task learning (MTL) problem in which the interval-valued carbon prices are treated as coupled tasks and optimized jointly through hard parameter sharing and a logical consistency constraint, thereby overcoming the fragmentation of traditional approaches that model the two bounds independently.
- (2)
- We design a structured multi-source fusion framework in which every input—historical prices, market microstructure data, and related asset prices—is encoded separately by an ATCN, and the fused representation is then decoded through dual task heads. This design increases the capacity to model high-dimensional signals while reducing parameter redundancy and the risk of overfitting.
- (3)
- We embed an attention mechanism into the temporal convolutional network (TCN) and propose the attention-enhanced temporal convolutional network (ATCN). The attention module adaptively highlights the key temporal positions, improves the fit to time-varying patterns, and thereby strengthens the overall quality of the learned representation.
2. Methodology
2.1. Attention-Enhanced Temporal Convolutional Network (ATCN)
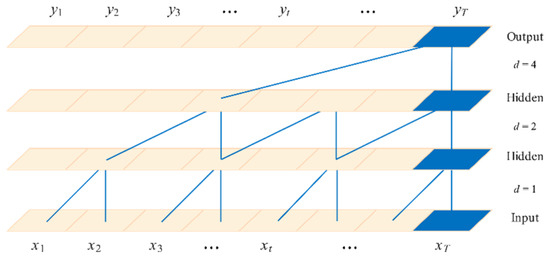
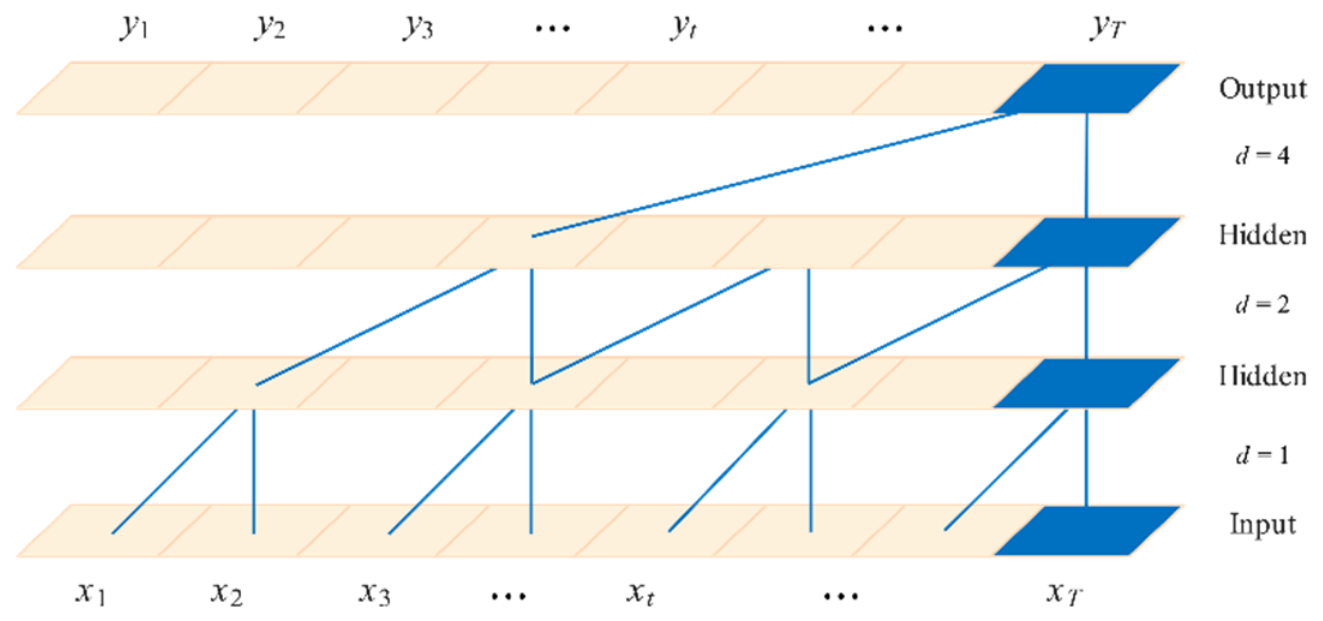
As shown in Figure 1, the TCN uses dilated convolutions to preserve temporal order while expanding the receptive field efficiently [17,18]. For input X ∈ ℝT×d, dilated convolution is
Figure 1.
Dilated convolution.
With receptive fields R = 1 + (K − 1)L for standard CNNs, the dilated convolution expands the receptive field at an exponential rate (assuming a growth rate of r):
so that longer-range dependencies can be captured. The output of the TCN layers is then
H = TCN(X) ∈ ℝT×h.
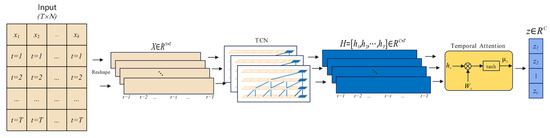
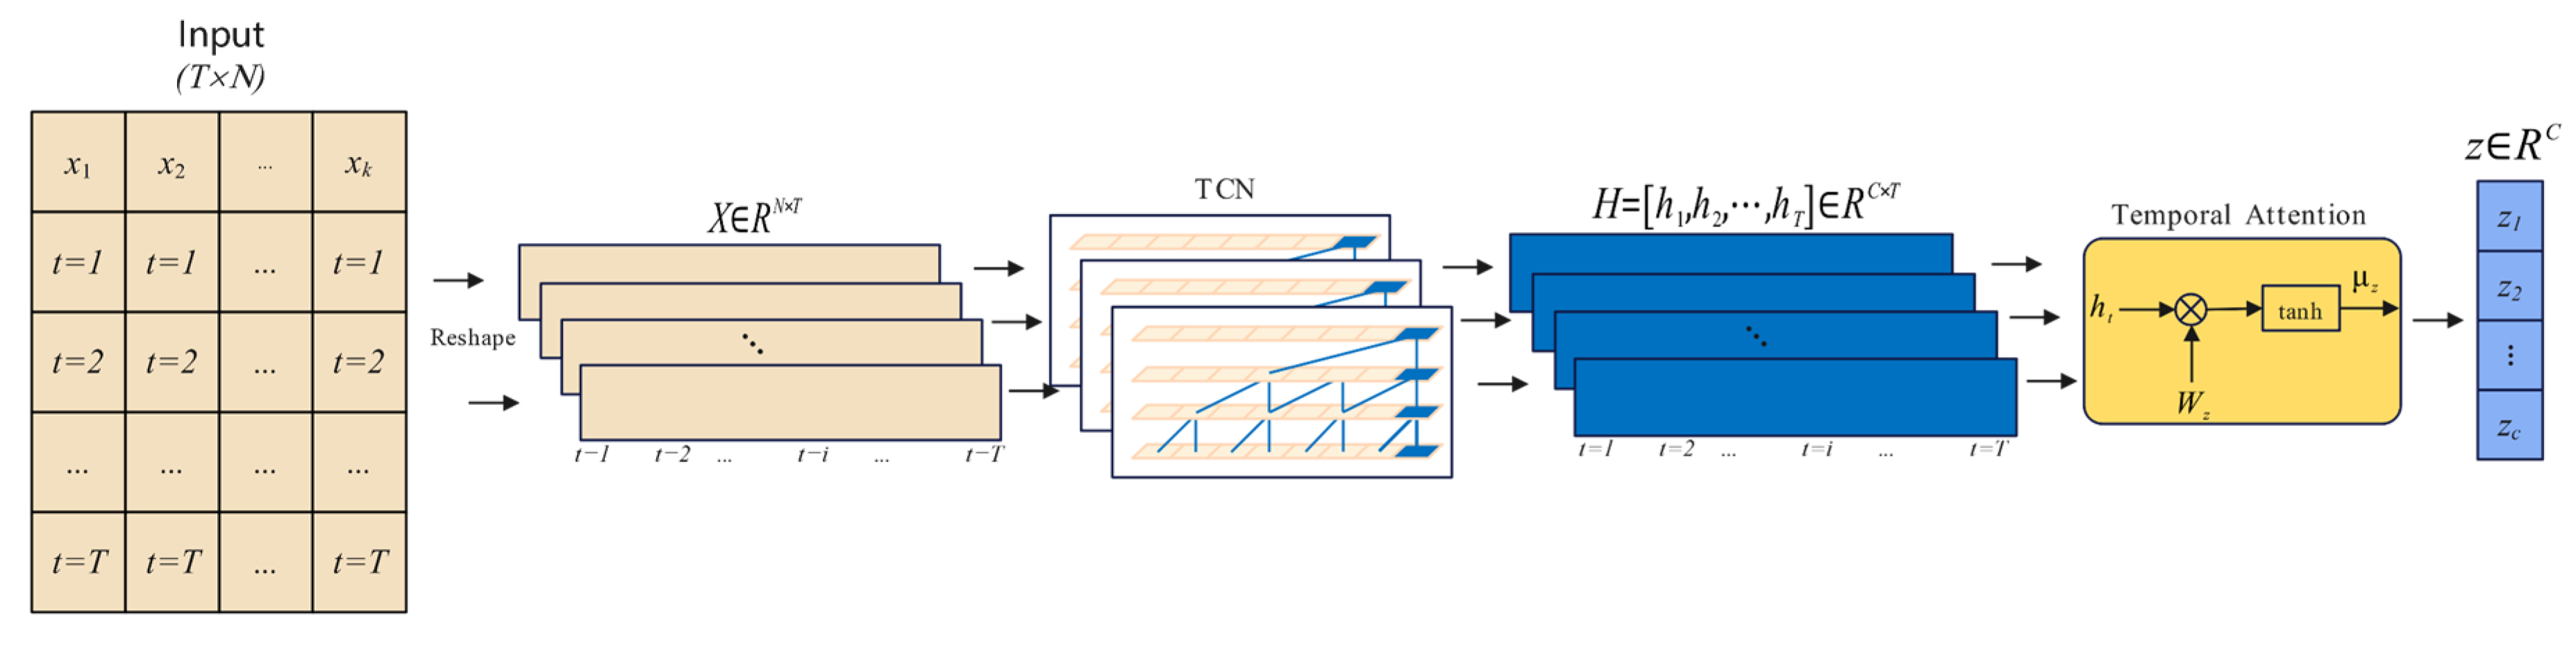
Simple pooling or last-step readout can dilute salient events. We therefore augment the TCN with a temporal-attention module at the aggregation stage; the resulting ATCN architecture is illustrated in Figure 2. The module emphasizes the most informative timesteps as follows:
where Wh, h, v are learnable, and z is the global aggregation representation.
Figure 2.
Attention-enhanced temporal convolutional network.
2.2. Multi-Task Learning (MTL)
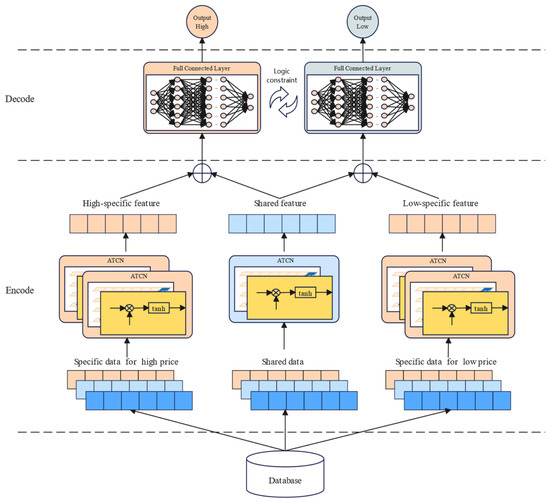
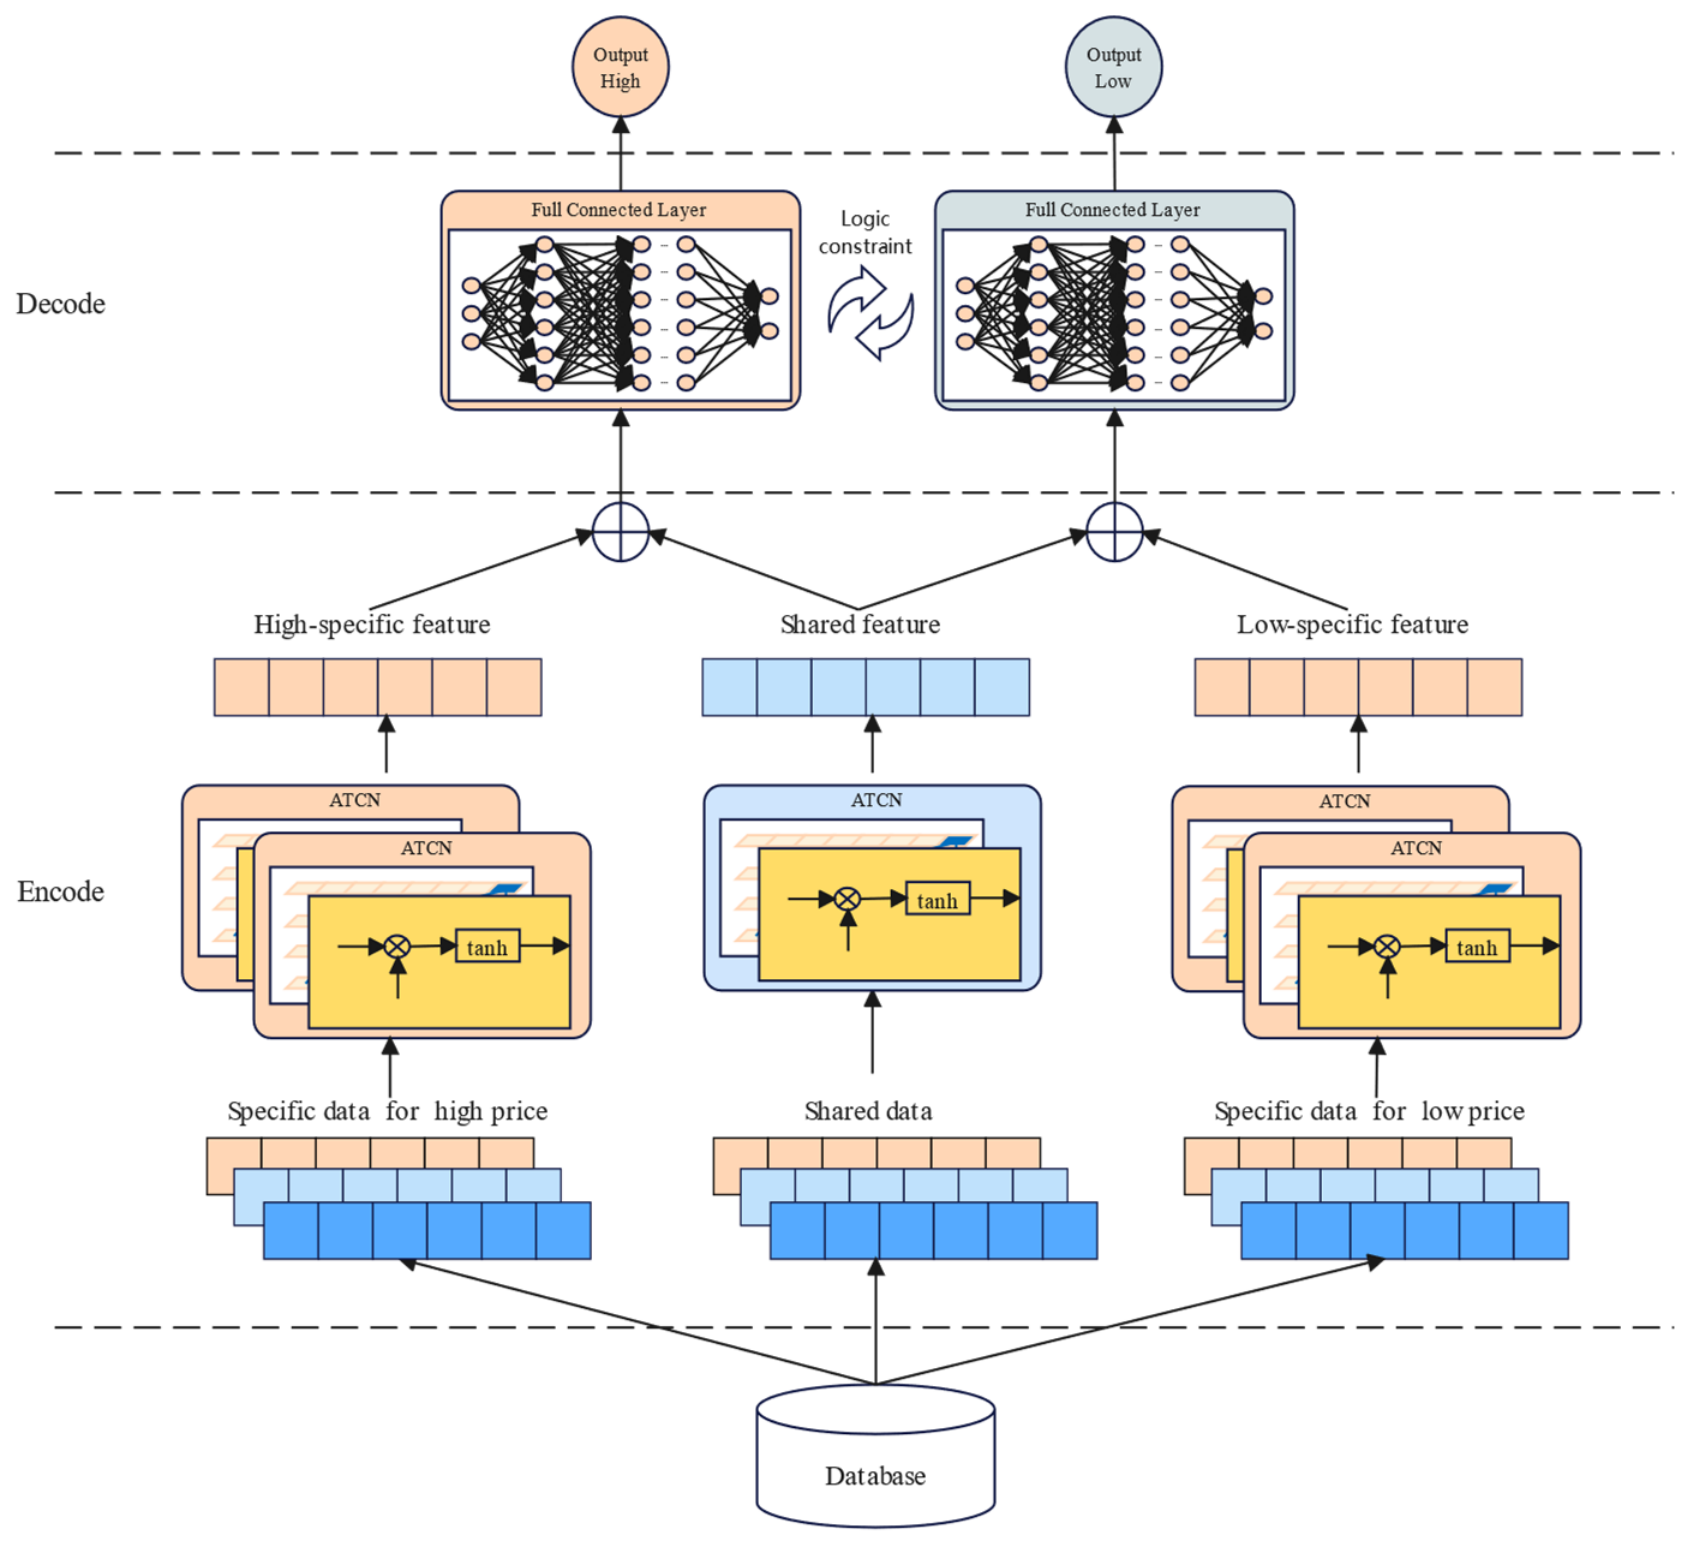
Multi-Task Learning (MTL) is a machine learning paradigm in which multiple related tasks are trained simultaneously by sharing parts of the model parameters or representations [19,20,21]. In carbon price interval forecasting, it is essential to estimate the upper and lower bounds simultaneously. Traditional single-task learning (STL) models often treat each objective independently, failing to exploit the potential synergy between tasks, which can lead to suboptimal generalization. To address this, we propose the constrained multi-task learning model (CMTL) consisting of a shared feature extraction module and two task-specific output branches that predict the upper and lower bounds of the interval-valued prices, as illustrated in Figure 3. The model uses the hard parameter sharing mechanism: shared layers learn common representations, while task-specific branches retain unique task-specific features. Hard parameter sharing is adopted for two reasons: the two bounds of the same daily interval are strongly coupled tasks driven by common market conditions, which is the setting in which shared representations are most beneficial, and sharing the extractor substantially reduces the number of trainable parameters relative to two independent networks, lowering the overfitting risk.
Figure 3.
The layout of the CMTL-ATCN.
To safeguard logical consistency between the two outputs—namely that the predicted upper bound should never fall below the lower bound—we add a logic penalty to the loss function as an explicit training time constraint. The total loss is defined as
where penalizes violations of the logical constraint, and λ controls the penalty strength.
total = max + min + λ ⋅ logic,
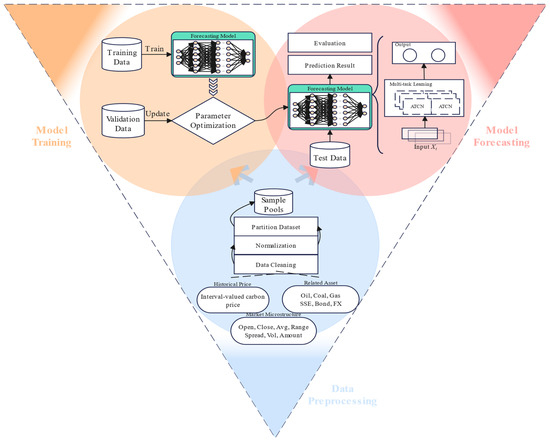
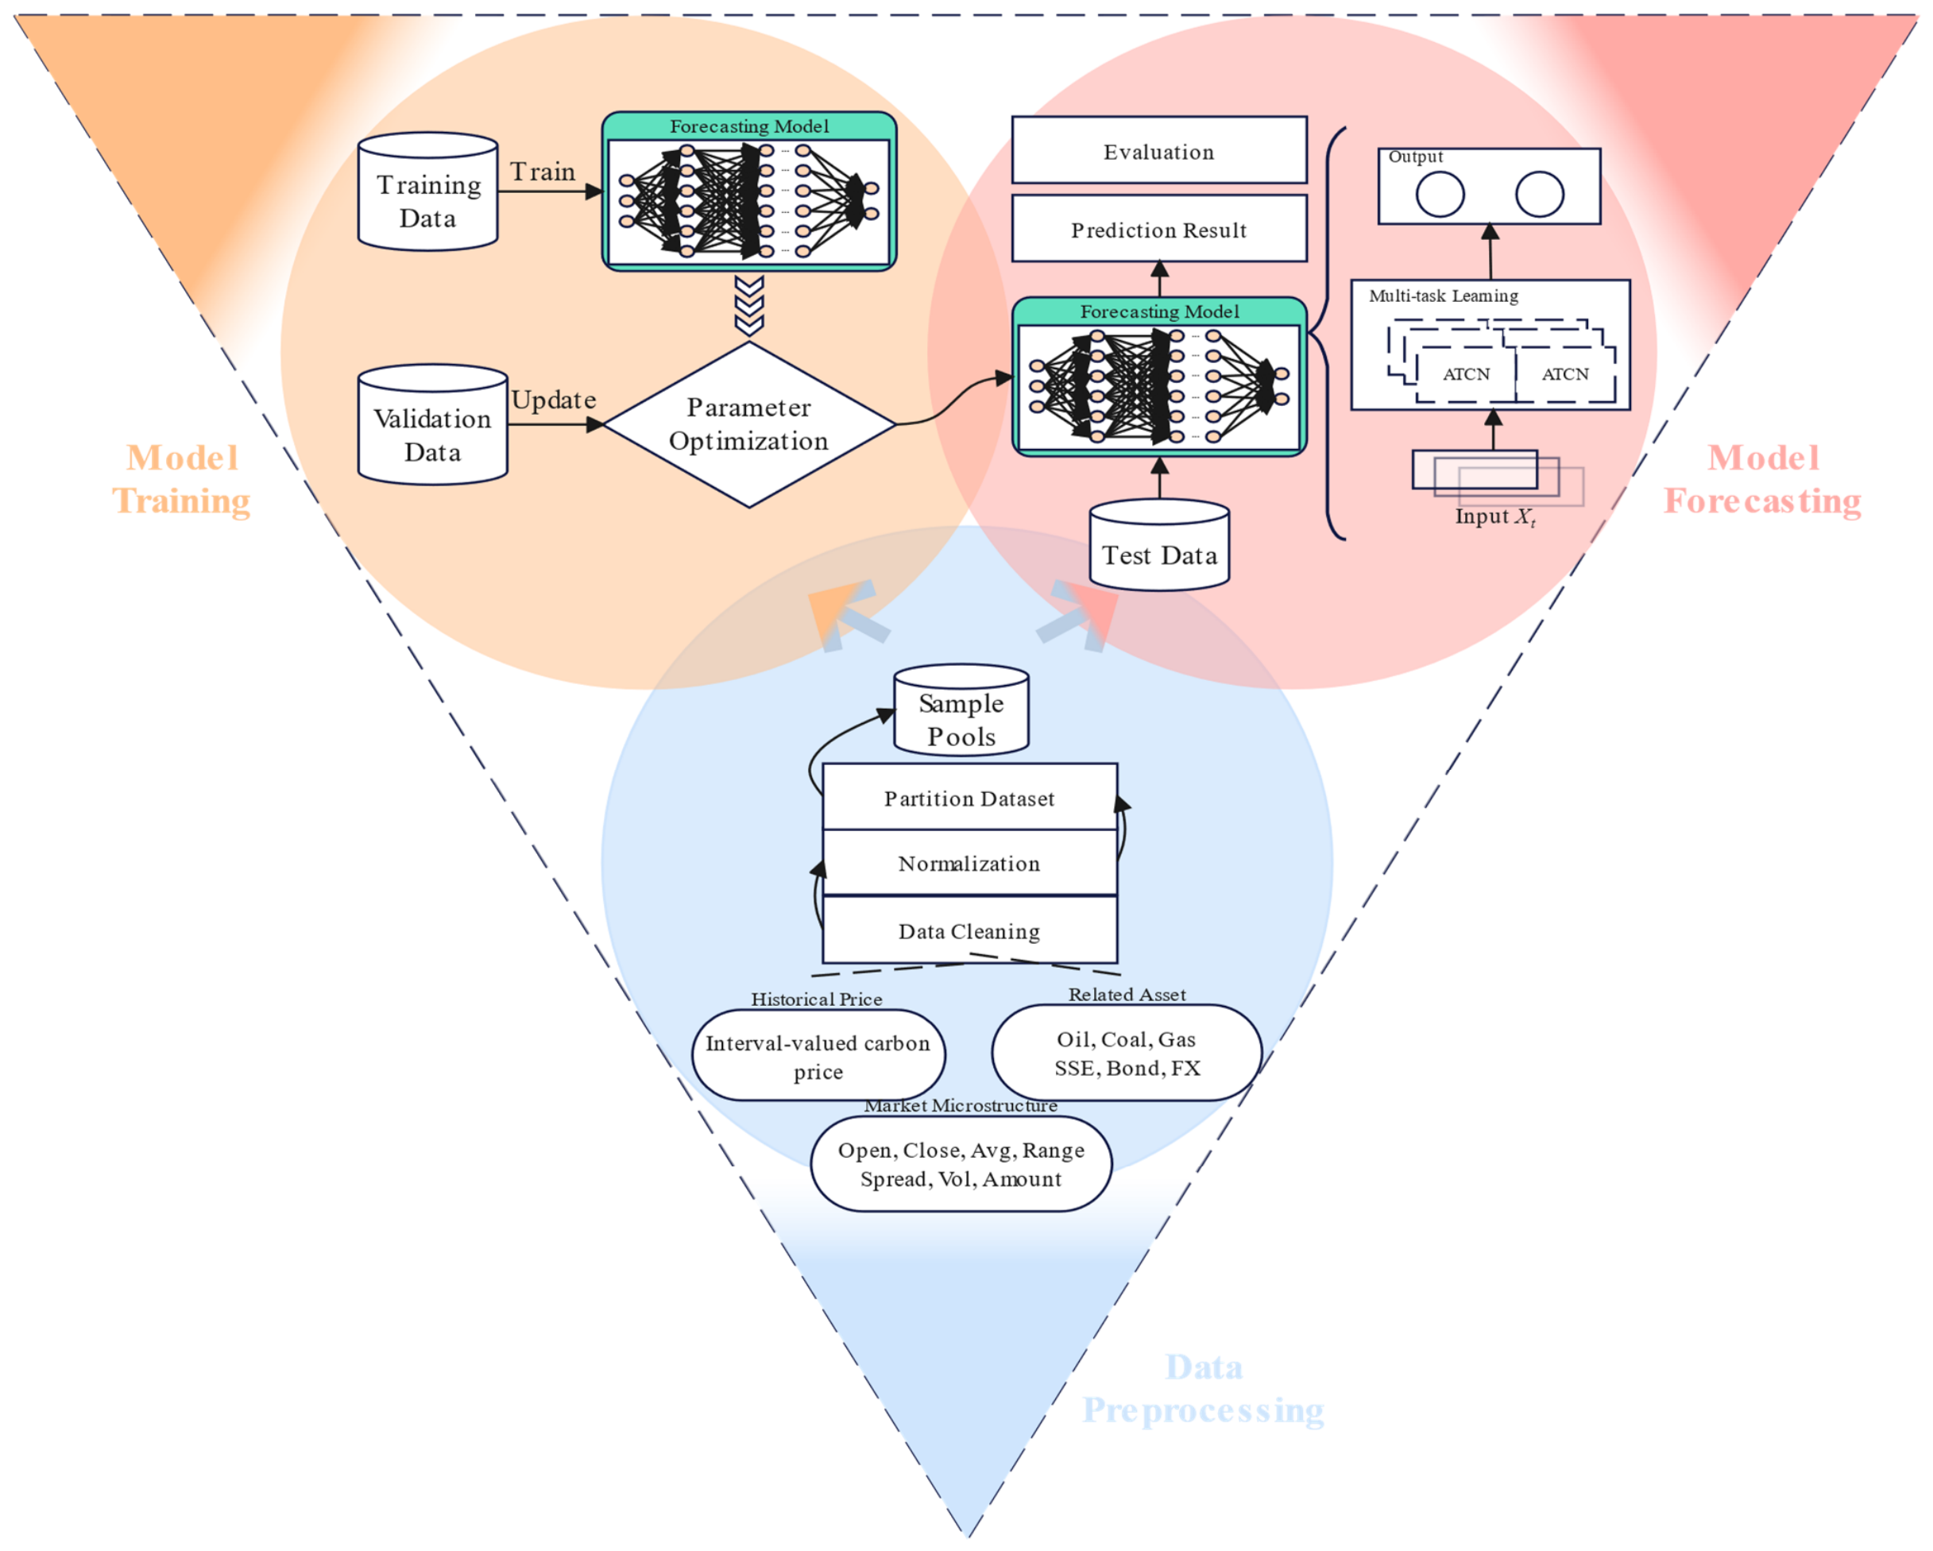
Figure 4 illustrates the overall workflow: (i) data preprocessing—alignment, missing-value imputation, normalization, and dataset splitting; (ii) model training—parameter optimization on the training set with validation-based early stopping and joint minimization of the task-specific losses together with the logic penalty; and (iii) prediction and evaluation—forecasting interval-valued prices on the test set to assess effectiveness.
Figure 4.
Flowchart of the forecasting procedure.
Algorithm 1 summarizes the procedure. In each iteration, the shared features are extracted, fused with the task-specific representations, and passed to the prediction heads; the task-specific losses and the logic error are then computed, combined into the total loss, and used to update both the shared and the task-specific parameters by gradient descent until convergence. This procedure allows CMTL to exploit inter-task correlations while still producing logically consistent and robust forecasts.
| Algorithm 1. Training procedure of CMTL-ATCN |
| Inputs: Shared input Xs; task inputs Xmax, Xmin dataset D; learning rate η; batch size B; epochs T |
| Output: Predictor f |
| Initialize shared params task feature params ;
prediction head params |
| For t = 1…T: |
| Sample a batch (Xs, Xmax, Xmin, Ymax, Ymin) from D |
| Extract shared features: Hs = Fshared(Xs; θs) |
| Extract task-specific features: |
| Fuse & predict: Zmax = Fuse (Hs, Hmax); Zmin = Fuse (Hs, Hmin); |
| Compute total loss: |
| Backprop & update all params: θs ← params-η∇ |
| End For |
3. Empirical Study
3.1. Data Description
China’s carbon emission reduction scheme originated in pilot trials of carbon emission trading. Among the seven pilot regions, Guangdong was one of the first to introduce regulations and launch trading, which makes the Guangdong regional market (GDEA) a representative and active regional market. By contrast, China’s national carbon market (CEA), established in 2021, integrates multiple sectors at the national level and offers broader coverage, higher liquidity, and stronger policy orientation. In addition, the Hubei market (HBEA) is the largest regional pilot by cumulative traded volume and offers a comparably long, liquid trading history. We therefore select CEA, GDEA, and HBEA to validate the proposed forecasting model, so that the evaluation spans the national market and the two most active regional markets. The sample spans from July 2021 to August 2026; after excluding a small number of no-trade posting days on which no intraday interval exists, it comprises 1216, 1233, and 1218 daily observations for CEA, GDEA, and HBEA, respectively. The data are split chronologically into training (70%), validation (10%), and test (20%) sets in strict temporal order, so that all estimations and model selections use only information prior to the evaluation periods, as detailed in Table 1. This sequential hold-out design follows standard practice in time series forecast evaluation and avoids the look-ahead bias that random splitting would introduce. The test windows cover distinct and demanding market regimes—a sharp drawdown followed by a pronounced V-shaped recovery in CEA, wide high-volatility range-bound swings in GDEA, and a volatile drawdown in HBEA—so that the three markets jointly provide complementary evidence on model behavior under different conditions.
Table 1.
Descriptive statistics of the dataset.
To improve predictive accuracy, we integrate three categories of multi-source data: (1) historical interval prices; (2) market microstructure data [22,23]; and (3) related asset prices [24,25,26]. As summarized in Table 2, all features are standardized. Multi-source series are aligned on the carbon market trading calendar: the related asset series are outer-joined with the carbon price series by date, and values missing on carbon trading days are imputed by forward filling. Price-level variables are normalized by the previous closing price, as specified in Table 2; this removes scale differences and trend non-stationarity, expresses both bounds on a common relative scale that preserves the intraday structure of the interval, and requires no parameters estimated from future observations. Trading volume and amount are min–max scaled with parameters fitted on the training set only.
Table 2.
Description of the data used.
3.2. Model Construction
The proposed model, CMTL-ATCN, is a multi-task learning framework implemented in PyTorch (version 2.13.0) that integrates three data streams: historical prices, market microstructure variables, and related asset inputs are each encoded by an ATCN, and the final output is produced by fully connected layers. The hyperparameters (Table 3) were tuned by Bayesian search with the Tree-structured Parzen Estimator (TPE) during the model development phase. The final configuration uses a window length of 20 steps; an ATCN with two layers, channels [64, 32], kernel size 2, and an attention module; and a fully connected layer of size 128. Training uses the Adam optimizer with a learning rate of 2 × 10⁻⁴ and a logic penalty coefficient of λ = 0.7. The model is trained for at most 400 epochs with early stopping, which monitors the validation set loss and terminates training when the loss fails to improve for 10 consecutive epochs.
Table 3.
Hyperparameter search space.
3.3. Comparative Analysis
To assess the proposed model, we compare it with classical single-task models (ENN, LSTM, GRU, ELM, MLP, TCN), multi-task learning models (MTSS-LSTM, MTHS-GRU), and an interval-specific statistical benchmark: a center–range ARIMA (CR-ARIMA), which models the interval midpoint and the log half-range by univariate ARIMA [27]. All deep models are re-trained from scratch under multiple random seeds—five for the proposed model and three for each benchmark; a seed jointly controls parameter initialization and dropout sampling, and the same seed list is used for every model. Table 4 reports means ± standard deviations across seeds. Among the multi-task baselines, MTSS-LSTM couples task-specific LSTM networks through an L2-regularized soft parameter sharing mechanism, balancing inter-task information sharing against task specificity [28], whereas MTHS-GRU adopts hard parameter sharing, in which GRU-based task networks share a common parameter structure to fully exploit inter-task correlations [29]. Performance is evaluated with several metrics: IRMSE, IMAE, and IMAPE for accuracy, together with coverage ratio (CR) and logic error (LE) for validity and logical consistency; the formulas are given in Appendix A. Table 4 summarizes the results. The main findings are as follows:
Table 4.
Performance comparison of different models.
- (1)
- The proposed model attains the lowest mean IRMSE, IMAE, and IMAPE among the nine deep models on all three markets. It achieves IRMSE of 1.5233 on CEA, 1.5579 on GDEA, and 1.4631 on HBEA. Its seed-level IRMSE standard deviations (0.0093, 0.0029, and 0.0179) never exceed 1.3% of the corresponding means, so this position does not depend on a favorable initialization. Meanwhile, the advantage extends to coverage. The proposed model attains the highest coverage ratio among deep models on CEA (0.5889) and HBEA (0.4712) and upper-range coverage on GDEA (0.6250, where the recurrent single-task models reach up to 0.6435).
- (2)
- CMTL-ATCN yields LE = 0 for every random seed on all three markets. Violations are widespread among the benchmarks under market stress. On the volatile CEA market, every deep benchmark crosses its bounds at least twice (from two crossings for MTHS-GRU up to 17 for TCN), ELM accumulates up to 28 crossed intervals on GDEA and 24 on HBEA, and GRU crosses nine times on HBEA. The statistical CR-ARIMA avoids crossings by construction, as its reconstructed half-range is positive, but at the coverage cost.
- (3)
- The benchmarks diverge sharply. LSTM and MTHS-GRU remain accurate but still cross their bounds on CEA (three and two crossings), and GRU deteriorates markedly on CEA and HBEA (IRMSE of 1.70 and 1.72, with 12 and nine crossings, respectively)—accuracy alone therefore does not confer logical validity. ELM, whose fixed random hidden layer cannot adapt its representation to regime shifts, combines persistently large errors with up to 28 crossed intervals, and the soft parameter sharing MTSS-LSTM trails its single-task LSTM counterpart on every market, indicating that loose task coupling adds little. Because daily highs and lows are extreme values, they are easily distorted by large trades and microstructure noise [30]; models that forecast each bound in isolation inherit this noise separately, whereas the proposed model anchors both bounds to a single shared representation of the market state, which is consistent with the stability and validity advantages.
- (4)
- Considering error, coverage, and validity jointly, the proposed model is the only model that combines high accuracy with top-tier coverage and zero logic errors on every market. The Diebold–Mariano tests confirm that the error advantage is statistically significant against most of the benchmarks. The linear CR-ARIMA attains nominally lower mean losses on the GDEA and HBEA markets but far narrower intervals that cover only 15–19% of the realized ranges (CR 0.1478 and 0.1893, against 0.6250 and 0.4712 for the proposed model), and it falls significantly behind on the volatile CEA market.
The statistical significance of these comparisons is assessed with the Diebold–Mariano (DM) tests applied to the daily interval loss (the per-day average of the absolute errors of the two bounds), with the Harvey small-sample correction. All models are compared through their seed-averaged loss series. Table 5 reports the full results. At the 5% level the proposed model attains significantly lower interval losses than six of the nine benchmarks on CEA—including the statistical CR-ARIMA, which falls clearly behind the deep models in this volatile, V-shaped regime—seven on GDEA, and six on HBEA. Conversely, no benchmark—deep or statistical—is significantly better on any market. CR-ARIMA’s nominally lower mean losses on the GDEA and HBEA markets do not reach significance, and they are obtained with intervals that are markedly narrower and cover only a small fraction of the realized ranges (CR 0.1478 vs. 0.6250 on GDEA and 0.1893 vs. 0.4712 on HBEA). Judged jointly on error and coverage, these narrow bands are less informative forecasts rather than better ones, and on the volatile CEA market, CR-ARIMA falls significantly behind.
Table 5.
The Diebold–Mariano tests of the proposed model against each benchmark of Table 4 on the three markets.
3.4. Ablation Studies
To assess the contribution of each component, we conduct an ablation study in which individual modules are removed or replaced (Table 6). The results (Table 7) confirm the following:
Table 6.
Experimental model comparison.
Table 7.
Experimental results.
- (1)
- Adding the multi-source block lowers IRMSE for both extractors on all three markets (for TCN, from 1.6061 to 1.5426 on CEA, 1.7866 to 1.6222 on GDEA, and 1.5075 to 1.4784 on HBEA; for ATCN, from 1.5832 to 1.5678, 1.7337 to 1.5900, and 1.4906 to 1.4659). The constrained multi-task formulation then improves the ATCN chain on every market (from 1.5678 to 1.5233, 1.5900 to 1.5579, and 1.4659 to 1.4631) and eliminates the logic violations that the single-task configurations incur on CEA and GDEA. Both constrained configurations (CMTL-TCN and CMTL-ATCN) are violation-free on every market and seed.
- (2)
- The attention-based extractor contributes consistently. CMTL-ATCN improves on CMTL-TCN on every market (1.5233 vs. 1.5544 on CEA, 1.5579 vs. 1.6009 on GDEA, and 1.4631 vs. 1.4785 on HBEA), and the price-only ATCN improves on the TCN on all three markets (1.5832 vs. 1.6061, 1.7337 vs. 1.7866, and 1.4906 vs. 1.5075). Only with multi-source inputs is its effect regime-dependent, helping on GDEA and HBEA but not on CEA (1.5678 vs. 1.5426).
- (3)
- The complete CMTL-ATCN attains the lowest IRMSE on all three markets and the highest coverage on CEA and GDEA. It achieves the lowest errors, top-tier coverage, and zero logic errors jointly across all three markets.
3.5. Computational Cost
Table 8 reports model sizes and training costs. The proposed model contains about 329K trainable parameters—fewer than the recurrent baselines (LSTM 1.32M, GRU 0.99M)—and converges within 28 epochs on average; a single one-day-ahead forecast takes about 4 ms. The additional cost relative to the lightest baselines is modest in absolute terms, and real-time deployment at daily frequency is unproblematic.
Table 8.
Computational cost (CPU; averages over seeds and markets).
4. Conclusions
This study develops a novel interval carbon price forecasting model, CMTL-ATCN, within a multi-task deep learning framework. The model integrates heterogeneous information sources—historical carbon prices, market trading data, and related asset prices—through a hard parameter sharing mechanism and uses the ATCN for feature abstraction. A logic-constrained loss function is further incorporated to guarantee the consistency and plausibility of the predictions.
Empirical results on China’s national carbon market (CEA), the Guangdong regional market (GDEA), and the Hubei pilot market (HBEA) show that the proposed model consistently outperforms classical benchmarks. It attains the lowest interval forecast errors among the nine deep models while eliminating logically inconsistent forecasts entirely across all markets. In addition, the ablation study attributes the framework’s behavior to complementary components. The multi-source block lowers errors for both extractors on all three markets, the attention-based extractor consistently improves the multi-task variants, and the constrained multi-task formulation delivers the chain’s lowest errors on every market together with the elimination of logic violations.
Several limitations remain. First, the data are confined to market-level information: although policy shocks and macroeconomic indicators are widely recognized as influential in carbon markets, they were not included here because of frequency misalignment. Second, the proposed model has limited interpretability; given its complexity and the present focus on predictive accuracy, a systematic interpretability analysis was beyond the scope of this study. Future work will integrate mixed-frequency data sources, incorporate interpretability techniques for analysis of the relative value of data sources, and augment the interval forecasts with calibrated confidence-level bands to serve risk management applications more directly.
Author Contributions
Conceptualization, K.C. and Z.T.; Methodology, K.C. and Y.Z.; Validation, Y.Z.; Data curation, W.H.; Writing—original draft, K.C.; Writing—review and editing, D.L.; Visualization, K.C. and D.L.; Supervision, Z.T. and Y.Z.; Funding acquisition, Z.T. All authors have read and agreed to the published version of the manuscript.
Funding
This research was funded by the National Natural Science Foundation of China, grant numbers 71973028 and 72341030.
Data Availability Statement
The data used in this study were obtained from the Wind Financial Terminal (Wind Information Co., Ltd., Shanghai, China).
Conflicts of Interest
The authors declare no conflicts of interest.
Appendix A. Evaluation Metrics
The forecasting results are evaluated from two perspectives: validity and accuracy. The validity metrics are the coverage ratio (CR) and the logic error (LE). The CR measures the average fraction of the realized daily high–low interval that is covered by the predicted interval, an interval-overlap ratio defined against the realized intraday range. The LE counts the number of forecasts in which the predicted upper bound falls below the predicted lower bound; it is reported as an absolute count over the test set. Accuracy is quantified by the Interval Mean Absolute Error (IMAE), the Interval Root Mean Square Error (IRMSE), and the Interval Mean Absolute Percentage Error (IMAPE). The metrics are summarized in Table A1.
Table A1.
Overview of evaluation metrics.
References
- Lee, C.-C.; Xing, W.; Lee, C.-C. The impact of energy security on income inequality: The key role of economic development. Energy 2022, 248, 123564. [Google Scholar] [CrossRef] [Scilit]
- Ren, X.; Duan, K.; Tao, L.; Shi, Y.; Yan, C. Carbon prices forecasting in quantiles. Energy Econ. 2022, 108, 105862. [Google Scholar] [CrossRef] [Scilit]
- Liu, M.; Lee, C.-C. Capturing the dynamics of the China crude oil futures: Markov switching, co-movement, and volatility forecasting. Energy Econ. 2021, 103, 105622. [Google Scholar] [CrossRef] [Scilit]
- Zhu, B.; Ye, S.; Wang, P.; He, K.; Zhang, T.; Wei, Y.-M. A novel multiscale nonlinear ensemble leaning paradigm for carbon price forecasting. Energy Econ. 2018, 70, 143–157. [Google Scholar] [CrossRef] [Scilit]
- Zhu, B.; Ye, S.; Wang, P.; Chevallier, J.; Wei, Y.-M. Forecasting carbon price using a multi-objective least squares support vector machine with mixture kernels. J. Forecast. 2022, 41, 100–117. [Google Scholar] [CrossRef] [Scilit]
- Sun, S.; Sun, Y.; Wang, S.; Wei, Y. Interval decomposition ensemble approach for crude oil price forecasting. Energy Econ. 2018, 76, 274–287. [Google Scholar] [CrossRef] [Scilit]
- Ji, Z.; Niu, D.; Li, M.; Li, W.; Sun, L.; Zhu, Y. A three-stage framework for vertical carbon price interval forecast based on decomposition–integration method. Appl. Soft Comput. 2022, 116, 108204. [Google Scholar] [CrossRef] [Scilit]
- Xiong, T.; Bao, Y.; Hu, Z.; Chiong, R. Forecasting interval time series using a fully complex-valued RBF neural network with DPSO and PSO algorithms. Inf. Sci. 2015, 305, 77–92. [Google Scholar] [CrossRef] [Scilit]
- Lei, H.; Xue, M.; Liu, H. Probability distribution forecasting of carbon allowance prices: A hybrid model considering multiple influencing factors. Energy Econ. 2022, 113, 106189. [Google Scholar] [CrossRef] [Scilit]
- Cao, Y.; Zha, D.; Wang, Q.; Wen, L. Probabilistic carbon price prediction with quantile temporal convolutional network considering uncertain factors. J. Environ. Manag. 2023, 342, 118137. [Google Scholar] [CrossRef] [Scilit] [PubMed]
- Wang, X.; Wang, L.; An, W. Probability density prediction for carbon allowance prices based on TS2Vec and distribution transformer. Energy Econ. 2024, 140, 107986. [Google Scholar] [CrossRef] [Scilit]
- Zhu, B.; Wan, C.; Wang, P. Interval forecasting of carbon price: A novel multiscale ensemble forecasting approach. Energy Econ. 2022, 115, 106361. [Google Scholar] [CrossRef] [Scilit]
- Zhu, B.; Wan, C.; Wang, P.; Chevallier, J. Interval forecasting of carbon price with a novel hybrid multiscale decomposition and bootstrap approach. J. Forecast. 2025, 44, 376–390. [Google Scholar] [CrossRef] [Scilit]
- Yang, K.; Sun, Y.; Hong, Y.; Wang, S. Forecasting interval carbon price through a multi-scale interval-valued decomposition ensemble approach. Energy Econ. 2024, 139, 107952. [Google Scholar] [CrossRef] [Scilit]
- Niu, X.; Wang, J.; Wei, D.; Zhang, L. A combined forecasting framework including point prediction and interval prediction for carbon emission trading prices. Renew. Energy 2022, 201, 46–59. [Google Scholar] [CrossRef] [Scilit]
- Zeng, L.; Hu, H.; Tang, H.; Zhang, X.; Zhang, D. Carbon emission price point-interval forecasting based on multivariate variational mode decomposition and attention-LSTM model. Appl. Soft Comput. 2024, 157, 111543. [Google Scholar] [CrossRef] [Scilit]
- Bai, S.; Kolter, J.Z.; Koltun, V. An empirical evaluation of generic convolutional and recurrent networks for sequence modeling. arXiv 2018, arXiv:1803.01271. [Google Scholar]
- Kim, J.; Kim, H.; Kim, H.; Lee, D.; Yoon, S. A comprehensive survey of deep learning for time series forecasting: Architectural diversity and open challenges. Artif. Intell. Rev. 2025, 58, 216. [Google Scholar] [CrossRef] [Scilit]
- Hervella, Á.S.; Rouco, J.; Novo, J.; Ortega, M. Multi-adaptive optimization for multi-task learning with deep neural networks. Neural Netw. 2024, 170, 254–265. [Google Scholar] [CrossRef] [Scilit] [PubMed]
- Ruder, S.; Bingel, J.; Augenstein, I.; Søgaard, A. Latent multi-task architecture learning. In Proceedings of the Thirty-Third AAAI Conference on Artificial Intelligence, Honolulu, HI, USA, 27 January–1 February 2019; pp. 4822–4829. [Google Scholar]
- Zhang, Y.; Yang, Q. An overview of multi-task learning. Natl. Sci. Rev. 2018, 5, 30–43. [Google Scholar] [CrossRef] [Scilit]
- Zhang, X.; Zong, Y.; Du, P.; Wang, S.; Wang, J. Framework for multivariate carbon price forecasting: A novel hybrid model. J. Environ. Manag. 2024, 369, 122275. [Google Scholar] [CrossRef] [Scilit] [PubMed]
- Zhou, Y.; Jin, C.; Ren, K.; Gao, S.; Yu, Y. TFR: A temporal feature-refined multi-stage carbon price forecasting. Energy Sci. Eng. 2025, 13, 611–625. [Google Scholar] [CrossRef] [Scilit]
- Batten, J.A.; Maddox, G.E.; Young, M.R. Does weather, or energy prices, affect carbon prices? Energy Econ. 2021, 96, 105016. [Google Scholar] [CrossRef] [Scilit]
- Lovcha, Y.; Perez-Laborda, A.; Sikora, I. The determinants of CO2 prices in the EU emission trading system. Appl. Energy 2022, 305, 117903. [Google Scholar] [CrossRef] [Scilit]
- Salvagnin, C.; Glielmo, A.; De Giuli, M.E.; Mira, A. Investigating the price determinants of the European emission trading system: A non-parametric approach. Quant. Finance 2024, 24, 1529–1544. [Google Scholar] [CrossRef] [Scilit]
- Maia, A.L.S.; de Carvalho, F.d.A.T.; Ludermir, T.B. Forecasting models for interval-valued time series. Neurocomputing 2008, 71, 3344–3352. [Google Scholar] [CrossRef] [Scilit]
- Fan, P.; Wang, D.; Wang, W.; Zhang, X.; Sun, Y. A novel multi-energy load forecasting method based on building flexibility feature recognition technology and multi-task learning model integrating LSTM. Energy 2024, 308, 132976. [Google Scholar] [CrossRef] [Scilit]
- Xuan, W.; Shouxiang, W.; Qianyu, Z.; Shaomin, W.; Liwei, F. A multi-energy load prediction model based on deep multi-task learning and ensemble approach for regional integrated energy systems. Int. J. Electr. Power Energy Syst. 2021, 126, 106583. [Google Scholar] [CrossRef] [Scilit]
- Wang, Q.; Wu, S.; Huang, P.; Hueng, C.J. The influence of market liquidity on the efficiency of China’s pilot carbon markets. Finance Res. Lett. 2025, 72, 106560. [Google Scholar] [CrossRef] [Scilit]

Disclaimer/Publisher’s Note: The statements, opinions and data contained in all publications are solely those of the individual author(s) and contributor(s) and not of MDPI and/or the editor(s). MDPI and/or the editor(s) disclaim responsibility for any injury to people or property resulting from any ideas, methods, instructions or products referred to in the content. |
© 2026 by the authors. Licensee MDPI, Basel, Switzerland. This article is an open access article distributed under the terms and conditions of the Creative Commons Attribution (CC BY) license.