


Abstract
Classical MANOVA procedures are not directly applicable in high-dimensional settings where the number of variables is comparable to, or exceeds, the sample size, and many existing high-dimensional MANOVA tests remain sensitive to outlying observations. This study proposes a weighted minimum regularized covariance determinant (MRCD)-based robust Wilks’ Lambda test for one-way high-dimensional MANOVA. The proposed method combines MRCD-based robust location and scatter estimation with a robust distance-based reweighting step and uses permutation calibration to obtain p-values. Through extensive Monte Carlo simulations, the method is evaluated in terms of Type-I error control, power, and robustness under structured contamination. Under clean data, the proposed test maintains empirical Type-I error near the nominal level, with only modest aggregate differences from Cheng-GM; Schott’s test can have higher power under weak signals. Under contaminated null scenarios where outliers create artificial group separation, the proposed method yields lower false-rejection rates than the competitors considered. A controlled sensitivity illustration using breast-cancer gene-expression data shows the same qualitative behavior after imposed contamination. The method is therefore positioned as a robustness-oriented option for contamination-prone high-dimensional MANOVA, at the cost of additional computation.
Keywords:
high-dimensional MANOVA; robust Wilks’ lambda; robust statistics; minimum regularized covariance determinant; MRCD; MVTests MSC:
62H15; 62F35; 62G35; 62H12
1. Introduction
Multivariate Analysis of Variance (MANOVA) is used when researchers want to compare groups across multiple related outcomes simultaneously rather than analyzing each outcome in separate univariate tests. By modeling outcomes jointly, MANOVA can better capture the dependence among variables, provide a single global test of group differences, and control for the inflation of Type I errors that occurs with multiple independent tests [1]. Because of these advantages, MANOVA has become an indispensable tool across a wide variety of scientific disciplines. In the social and behavioral sciences, it is frequently employed to evaluate complex psychological and educational constructs (e.g., multiple scale scores), such as assessing academic stress and burnout among distance education students [2] or understanding operator stress in collaborative robotics [3]. In clinical and biomedical research, MANOVA is heavily utilized to analyze multiple biomarkers and the simultaneous impact of risk factors like inflammation and hypertension on cognitive functioning [4]. Furthermore, its application extends into bioinformatics to detect differentially expressed gene sets and pathways in high-dimensional, correlated omics-type data [5]. Beyond health and psychology, MANOVA’s versatility is evident in engineering and sustainability studies, where it is used to assess solar energy generation and electricity consumption performance across different urban sectors [6]. Ultimately, MANOVA remains highly valued across these diverse fields whenever the scientific question concerns an overall multivariate group effect rather than isolated, variable-by-variable contrasts.
The classical MANOVA problem aims to test the equality of several multivariate mean vectors
Under the classical framework, inference is typically based on the decomposition of the total scatter matrix into within-group and between-group components. Let denote the sample mean vector of group k, and let denote the overall sample mean vector. The within-group scatter matrix is defined as
whereas the between-group scatter matrix is defined as
Here, corresponds to the pooled within-group covariance estimator, while measures the dispersion of the group mean vectors around the overall mean. Based on these matrices, Wilks’ Lambda is given by
Under multivariate normality and when the dimension p is small relative to the sample size, admits a chi-square approximation, allowing hypothesis testing using classical reference distributions [7].
However, modern datasets frequently involve high-dimensional settings where p is comparable to or larger than the sample size. In such cases the sample covariance matrix becomes singular and the determinant in Wilks’ Lambda is no longer well defined. Consequently, classical MANOVA procedures cannot be applied when .
To address this issue, several alternative MANOVA tests have been proposed for high-dimensional data. One of the early contributions is due to [8], who proposed a trace-based statistic constructed from the between- () and within-group () scatter matrices. To ensure the statistic remains well-defined in high-dimensional settings where , the test is defined as
Under the null hypothesis , it can be shown that . The statistic is standardized as
where the variance estimator is given by . Here, is the unbiased estimator of defined by [8] as
Under the high-dimensional asymptotic framework considered by Schott [8], the standard normal approximation is obtained when both the error degrees of freedom and the dimension tend to infinity, with the ratio of the dimension to the error degrees of freedom converging to a positive finite constant. More specifically, if denotes the error degrees of freedom, the condition is . Under this asymptotic regime, the standardized statistic converges in distribution to a standard normal random variable under the null hypothesis. The null hypothesis is rejected for large positive values of at a significance level if
Zhang et al. [9] proposed an -norm based test statistic for the high-dimensional one-way MANOVA problem, which measures the dispersion of group means around the overall mean. The test statistic is defined as
This statistic can be viewed as the squared -norm of a linear transformation of the sample mean vectors and is equivalent to the general form given in [9].
Under the null hypothesis, the distribution of is a -type mixture, which is generally skewed and depends on the eigenvalues of the underlying covariance matrix. To obtain a tractable testing procedure, Zhang et al. [9] approximated the null distribution using a scaled chi-square distribution via the Welch–Satterthwaite method. Specifically, the distribution of is approximated by
where the scaling parameter and the degrees of freedom d are obtained by matching the first two moments of . Accordingly, the decision rule is given by
in which case the null hypothesis is rejected.
Following the -norm-based approach of [9], more flexible test procedures have been developed to handle different alternative structures in high-dimensional MANOVA problems. In particular, Zhang et al. [10] proposed a data-adaptive test based on a family of -norm statistics. The method begins by constructing standardized pairwise differences between group means, forming a matrix of normalized contrasts. To avoid the degeneracy caused by the strong dependence structure among these contrasts, the matrix is summarized into a d-dimensional vector by taking the maximum absolute value across all pairwise group differences for each coordinate.
Based on this transformed vector, the test statistic is defined using the norm as
where is the aggregated vector of maximum standardized differences. The norm is an extension of the classical norm that focuses on the largest components of the vector, allowing the test to adapt to different signal sparsity levels. Since the null distribution of is analytically intractable, Zhang et al. [10] employed a multiplier bootstrap procedure to approximate its distribution and compute p-values. To further improve robustness across different alternative patterns, a data-adaptive test is constructed by combining multiple -norm statistics with different values of p, typically by taking the minimum p-value among them [10].
Regularization-based approaches have also been proposed to extend likelihood-ratio MANOVA statistics to high-dimensional data. Ullah and Jones [11] introduced a regularized MANOVA framework in which the singular sample covariance matrix is replaced by a regularized estimator. In their approach, several regularization techniques, including ridge, shrinkage, and lasso-based estimators, are considered to improve the estimation of the covariance matrix in high-dimensional settings.
A typical ridge-type regularization takes the form
where denotes the sample covariance matrix, is the identity matrix, and is a regularization parameter controlling the amount of shrinkage.
Using the regularized covariance estimator, the classical Wilks’ Lambda statistic is computed by replacing the sample covariance matrix with its regularized counterpart. This yields a regularized likelihood-ratio statistic
where . Since the null distribution of is not available in closed form in high-dimensional settings, Ullah and Jones [11] employed a permutation procedure to approximate the sampling distribution of the test statistic. The null hypothesis is rejected when the observed value of the statistic exceeds the quantile of its permutation distribution.
Lin et al. [12] proposed a bootstrap-based high-dimensional MANOVA procedure based on maximum-type statistics constructed from pairwise differences of sample mean vectors. Let denote the sample mean vector of the kth group. The test is built upon the statistic
where denotes the variance of the difference between the jth coordinates of the kth and lth groups, and is a tuning parameter controlling the degree of standardization.
A key feature of this approach is the use of partial standardization, where each coordinate is scaled by a fractional power of its standard deviation. This allows the method to exploit variance decay structures commonly observed in high-dimensional data while avoiding the loss of information associated with full standardization. Since the null distribution of M is analytically intractable, Lin et al. [12] employed a Gaussian multiplier bootstrap procedure to approximate its distribution and obtain critical values. The resulting framework can also be interpreted in terms of simultaneous confidence regions, enabling the identification of specific group differences without requiring additional multiple testing adjustments.
Lin et al. [13] proposed a high-dimensional MANOVA test based on clustering subspaces. The main idea is to partition the p variables into b clusters and perform low-dimensional MANOVA analyses within each subspace.
Let denote the classical MANOVA decomposition. Instead of using the original matrices, the method constructs block-diagonal approximations based on the clustering structure, yielding
with similar definitions for and .
Based on this decomposition, a family of test statistics can be constructed. For example, the likelihood ratio-type statistic is given by
which can be interpreted as the sum of likelihood ratio statistics computed within each cluster subspace. Since the null distribution is analytically intractable, a random permutation procedure is used to approximate the sampling distribution of the test statistic and compute p-values.
Despite these developments, most high-dimensional MANOVA tests rely on classical estimators of location and covariance and are therefore sensitive to outliers. Robust MANOVA inference was investigated by Todorov and Filzmoser [14], who proposed replacing the classical mean and covariance estimators in Wilks’ Lambda with robust estimators obtained from the minimum covariance determinant (MCD) method. Let and denote the robust location and scatter estimates. The robust Wilks statistic is then defined as
where and are computed using the robust estimators. The significance of the statistic can be assessed using approximate chi-square distributions or permutation procedures. However, the classical MCD estimator requires and therefore cannot be applied in high-dimensional settings.
Recently, Cheng et al. [15] proposed a robust high-dimensional MANOVA test based on the geometric median. Instead of the sample mean, the method employs the geometric median as a robust estimator of location for each group
Based on these estimators, the test statistic is constructed using pairwise differences between groups. Specifically, a maximum-type statistic is defined as
where denotes a suitable scale estimator for the kth coordinate of the difference between groups i and j. This formulation allows the test to effectively detect sparse differences while maintaining robustness against outliers.
Since the null distribution of is analytically intractable, Cheng et al. [15] proposed using a bootstrap procedure to approximate the distribution and obtain critical values.
Motivated by the limitations of existing methods, we propose a robust high–dimensional MANOVA test based on the minimum regularized covariance determinant (MRCD) estimator. The MRCD estimator was introduced by Boudt et al. [16] as a high-dimensional extension of the minimum covariance determinant (MCD) estimator. Unlike the classical MCD estimator, which requires the dimension to be smaller than the subset size, the MRCD estimator replaces the subset covariance matrix with a regularized covariance estimator obtained as a convex combination of a target matrix and the subset covariance matrix. As a result, it provides robust and well-conditioned estimates of multivariate location and scatter even in high-dimensional settings.
It is important to distinguish the original MRCD estimator from the reweighting mechanism used in the proposed test. In the present study, the MRCD estimator is used to obtain robust location and scatter estimates, whereas the subsequent robust-distance-based standardization and binary reweighting step follows the Mahalanobis-distance approach based on MRCD estimators proposed by Bulut [17]. This reweighting step is not part of the original MRCD procedure of Boudt et al. [16] and is not implemented as a reweighting option in the CovMrcd() function of the rrcov package.
This feature is particularly important for robust MANOVA inference. Classical robust approaches, such as Todorov and Filzmoser [14], rely on the MCD estimator and are therefore not directly applicable when the dimension is large relative to the sample size. By using MRCD instead of MCD, the proposed approach extends robust Wilks-type MANOVA inference to high-dimensional regimes.
In contrast to geometric median-based approaches such as [15], which focus on robust estimation of group locations, the proposed method incorporates robustness at both the location and scatter levels. This allows the method to effectively handle multivariate outliers that may affect not only the mean structure but also the covariance structure of the data.
Furthermore, we use permutation inference rather than asymptotic approximations to estimate the null distribution of the proposed test statistic. This approach provides greater flexibility and reliability in high-dimensional settings, where classical distributional approximations are often inaccurate. The construction and algorithm are presented in Section 2.
The main statistical contribution of this study is not the use of MRCD estimation in isolation, but the construction of a robust high-dimensional Wilks-type MANOVA testing framework. The proposed procedure combines four elements: positive-definite MRCD-based location and scatter estimation, robust-distance-based observation reweighting, a determinant-based Wilks-type statistic, and permutation-calibrated inference. This combination makes it possible to retain a Wilks-type determinant formulation even when the dimension exceeds the group sample sizes, while also reducing the influence of observations that may create artificial group separation. In this sense, the proposed method extends robust Wilks-type MANOVA from the classical low-dimensional MCD setting to high-dimensional regimes and provides a robustness-oriented alternative for contamination-prone multivariate group comparisons. The method is implemented in the R package MVTests, making the proposed procedure directly available for practical high-dimensional data analysis.
2. Weighted MRCD-Based Robust Wilks’ Lambda Test
Let denote the ith observation from group k, for and , with total sample size . We consider the null hypothesis
against the alternative that at least one group mean differs.
For each group k, let be the MRCD location and scatter estimates computed from the observations in that group. Next, define the centered observations
and let be the MRCD location and scatter estimates obtained from the pooled centered sample .
Using the pooled location correction , define the preliminary group centers
For each observation in group k, compute the robust squared distance
In high-dimensional settings, classical chi-square based cutoffs for Mahalanobis distances may lead to inflated false detection rates due to the instability of covariance estimation and deviation from Gaussian assumptions. To address this issue, we adopt a normal-calibrated cutoff inspired by Bulut [17].
Let denote the robust distance of observation i in group k. To account for high-dimensional effects and dependence structure, we define
where are the eigenvalues of the standardized data matrix. In addition, we define the correction factor
The standardized robust distance is then given by
Finally, the binary weights are defined as
where denotes the quantile of the standard normal distribution. Let denote the number of retained observations in group k. Then the weighted group mean is defined as
If , we use the fallback rule
The overall weighted mean is
The robust within-group and between-group scatter matrices are then defined as
Hence, .
The proposed weighted MRCD-based robust Wilks’ Lambda statistic is
Since smaller values of indicate stronger evidence against , the significance of the test is assessed via permutation. Let be the statistics obtained by randomly permuting the group labels. Then the inclusive Monte Carlo permutation p-value is computed as
The additions of 1 to both numerator and denominator are the standard finite-sample correction in permutation testing, preventing zero p-values and yielding stable Monte Carlo inference. We reject at significance level whenever The proposed weighted MRCD-based robust Wilks’ Lambda procedure with permutation calibration is summarized in Algorithm 1.
The methodological rationale of the proposed statistic follows from the way in which the classical Wilks-type construction is regularized and robustified. In the classical MANOVA framework, the determinant ratio is based on within-group and total scatter matrices constructed from sample covariance estimates. When the dimension is not smaller than the relevant sample size, these covariance estimates become singular, and the determinant ratio is no longer well defined. In the proposed procedure, MRCD-based scatter estimates replace the classical covariance estimates and are positive definite by construction because of the regularization step. Consequently, the matrices entering the determinant ratio remain nonsingular, so the Wilks-type statistic remains computable in high-dimensional settings.
The proposed procedure should therefore be understood as a finite-sample permutation-calibrated robust testing construction rather than as a new asymptotic optimality theorem. MRCD-based location and scatter estimates reduce the influence of atypical observations on the fitted group structure, while the robust-distance-based reweighting step further limits the contribution of observations that are far from the robust group centers. Since the finite-sample null distribution of the resulting statistic is not available in closed form after MRCD estimation and reweighting, permutation calibration is used to approximate the empirical null distribution under group-label exchangeability. Thus, the proposed test combines positive-definite regularized scatter estimation, robust observation weighting, and data-driven null calibration in a unified high-dimensional MANOVA framework.
Remark 1.
In high-dimensional settings where , the classical sample covariance matrix is singular and the determinant ratio in Wilks’ statistic becomes undefined. The use of MRCD ensures that the covariance matrices and are regularized and positive definite by construction. Consequently, and remain well-behaved and is well-defined even when , which is essential for modern high-dimensional inference.
| Algorithm 1 Weighted MRCD-Based Robust Wilks’ Lambda Test for One-Way HD-MANOVA |
|
Remark 2.
In the classical low-dimensional MANOVA framework, likelihood-ratio statistics admit exact or asymptotic chi-square approximations. In the present high-dimensional robust framework, however, these approximations are no longer directly applicable due to MRCD estimation and the robust distance-based reweighting step. Therefore, inference is calibrated via the permutation distribution of , and the Monte Carlo permutation p-value is computed using the inclusive permutation formula given above. The computational cost of the proposed procedure is mainly driven by repeated MRCD estimation within the permutation calibration. For the observed statistic, MRCD estimates are computed separately for each group and once again for the pooled centered data. If the statistic is recomputed from scratch for each permutation, approximately MRCD estimations are required, where B is the number of random permutations and G is the number of groups. Therefore, the elapsed running time increases approximately linearly with the number of permutations and the number of groups, while the cost of each MRCD fit also depends on the sample size, dimension, and the internal optimization required by the estimator. This makes the proposed method computationally more demanding than procedures based only on sample means, trace statistics, or geometric medians. In practice, smaller values such as or may be used for preliminary analyses, whereas or larger values are preferable for final confirmatory inference. Since the permutation statistics are independent, parallel computation can substantially reduce the elapsed running time.
3. Simulation Study
In this section, a comprehensive simulation study is conducted to evaluate the empirical performance of the proposed weighted MRCD-based robust MANOVA test. The main objectives of the simulation experiments are threefold: (i) to investigate the control of Type-I error under the null hypothesis, (ii) to compare the statistical power of the proposed test with existing high-dimensional MANOVA procedures, and (iii) to assess the robustness of the competing methods under various contamination scenarios.
Throughout the simulations, the proposed test is compared with several existing high-dimensional MANOVA procedures available in the literature. For each simulated dataset, the null hypothesis of equal mean vectors across groups is tested at the nominal significance level . Empirical Type-I error rates and statistical power are estimated as the proportion of rejections over repeated simulation runs.
Each simulation scenario is repeated times, and for the proposed method the permutation distribution of the test statistic is approximated using random permutations. To improve readability, the main text reports the primary scenario-level tables and representative graphical summaries, whereas additional plots and reproducibility materials are provided in the project GitHub repository, version a5a564c. This organization preserves the main simulation evidence while avoiding an excessive expansion of the manuscript.
3.1. Type-I Error Simulation Design
To evaluate the size accuracy of the competing MANOVA test statistics, we conducted an extensive Monte Carlo simulation study under the null hypothesis
where all group mean vectors are set to zero, i.e., .
For each simulation setting, data are generated from a p-dimensional multivariate distribution with a common covariance matrix . Specifically, for group ,
Two covariance structures are considered:
- Identity structure: ,
- AR(1) structure: with .
The simulation design systematically varies the number of groups, sample sizes, and data dimension. Both balanced and unbalanced group configurations are considered.
Balanced designs:
- :
- :
Unbalanced designs:
- :
- :
The data dimension is selected as , with combinations chosen to reflect moderate and high-dimensional settings.
For each scenario, Monte Carlo replications are generated. The empirical Type-I error rate is computed as
where denotes the p-value obtained in the r-th replication.
To assess the stability of the estimates, Monte Carlo standard errors (MCSE) are also reported:
Table 1 indicates that the proposed weighted MRCD-based procedure provides accurate control of the Type-I error rate across all examined scenarios, with empirical rejection probabilities remaining close to the nominal level 0.05. Across the 40 simulation settings, the observed rejection rates for the proposed method range from 0.028 to 0.061, accompanied by small Monte Carlo standard errors. Although Schott’s test occasionally yields rejection rates numerically close to the nominal level, it tends to exhibit mild liberal behavior in several challenging scenarios, particularly under AR(1) dependence and unbalanced designs. In contrast, the proposed method maintains more stable calibration across scenarios.
Table 1.
Empirical Type-I error rates and Monte Carlo standard errors under different simulation scenarios.
To provide a global summary of calibration performance across all 40 scenarios, we also computed the average absolute deviation (AAD) from the nominal significance level , defined as
where denotes the empirical Type-I error rate obtained under scenario s, and . Smaller AAD values indicate closer overall agreement with the nominal level and therefore better calibration stability. Based on this criterion, the proposed weighted MRCD-based procedure achieved an AAD of 0.006, compared with 0.012 for Schott’s test and 0.007 for Cheng-GM. These results provide an aggregate measure that complements the scenario-specific rejection rates in Table 1 and show that the proposed method achieved the smallest AAD among the considered procedures, although the difference from Cheng-GM is small under clean data.
It should be noted that the clean-data calibration difference between the proposed method and Cheng-GM is modest. The AAD values are 0.006 and 0.007, respectively, indicating that both procedures provide satisfactory Type-I error control under the uncontaminated scenarios considered here. Therefore, the additional computational complexity of the proposed MRCD-based procedure is not justified primarily by a large improvement in clean-data size control. Rather, its main motivation is robustness in high-dimensional settings where outlying observations may distort both location and covariance structure and may induce artificial group separation. This robustness aspect is examined in the contamination experiments below.
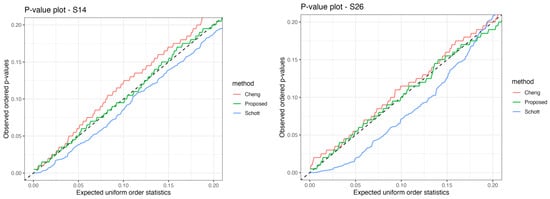
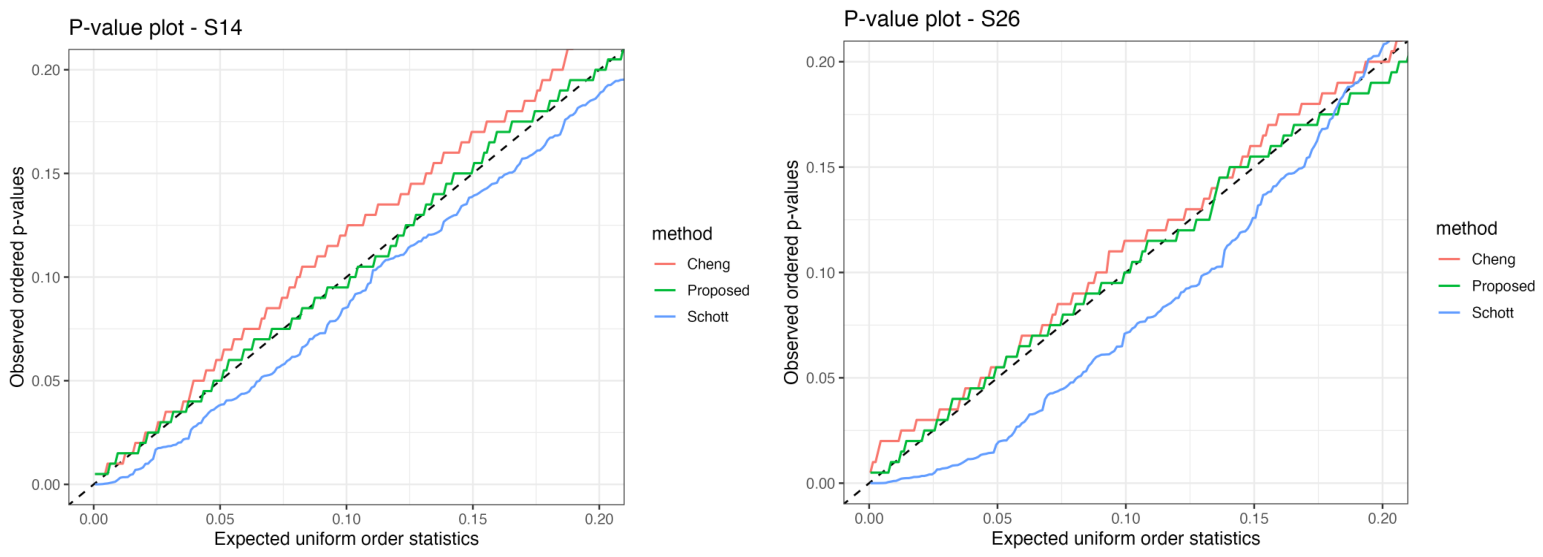
Following Davidson and MacKinnon [18], p-value plots are used to assess whether the simulated null p-values follow the Uniform(0,1) distribution under the null hypothesis. Under correct calibration, the ordered empirical p-values should remain close to the diagonal reference line. To focus on the practically relevant region for inference, the plots are displayed only over the interval , consistent with the discussion in Todorov and Filzmoser [14] that departures from uniformity in the lower tail are most informative for diagnosing size distortions, whereas p-values above 0.20 are generally less relevant for Type-I error assessment. Because the complete simulation study includes 40 scenarios, only two representative p-value plots are presented here for illustration, while the full set of p-value plots for all scenarios is made available in the project GitHub repository [19].
Figure 1 provides graphical support for the numerical results reported in Table 1. In both representative scenarios, the proposed weighted MRCD-based procedure remains close to the diagonal reference line, confirming satisfactory Type-I error calibration. The Cheng-GM procedure shows slight upward deviations in parts of the lower-tail region, indicating mild departures from ideal calibration, while Schott’s test exhibits more pronounced downward deviations, particularly in Scenario S26, reflecting a stronger departure from uniform calibration. These graphical findings are consistent with the empirical rejection rates reported in Table 1 and further support the stability of the proposed procedure. Additional p-value plots for all simulation scenarios are provided in the GitHub repository for reproducibility and supplementary assessment [19].
Figure 1.
p-value plots under the null hypothesis for Scenarios S14 and S26 [8].
Overall, the comprehensive Type-I error study across 40 simulation scenarios suggests that the proposed procedure achieves satisfactory calibration while remaining competitive with existing alternatives under clean high-dimensional settings. These findings provide a reliable baseline before proceeding to the power comparisons under alternatives.
3.2. Power Simulation Design
To evaluate the power performance of the competing MANOVA test statistics, we consider the same simulation settings as in the Type-I error study, but under alternatives where the group mean vectors differ.
Specifically, data are generated as
where is either the identity matrix or an AR(1) covariance structure with .
In this study, we focus on dense mean shift alternatives, where all variables are affected. For the two-group case (), the alternative is defined as
where denotes a p-dimensional vector of ones. For the three-group case (), we consider an ordered mean structure:
This configuration introduces increasing separation between groups while maintaining a simple and interpretable structure. The magnitude of the mean shift is controlled by , representing weak, moderate, and strong signals, respectively. All other simulation parameters, including group sizes, dimensionality, and covariance structures, are identical to those used in the Type-I error analysis. This ensures direct comparability between size and power results.
For each scenario, Monte Carlo replications are performed. The empirical power is computed as
and Monte Carlo standard errors are also reported.
To maintain clarity and readability, power results are reported separately for each signal level using the same scenario grid as in the Type-I error study.
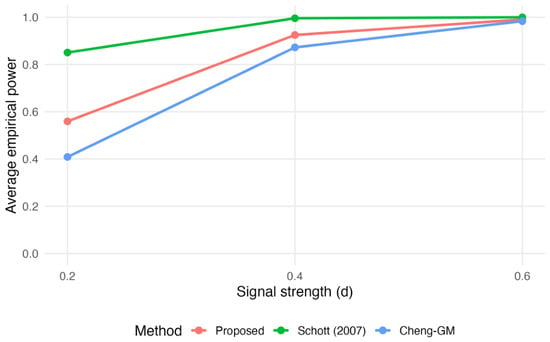
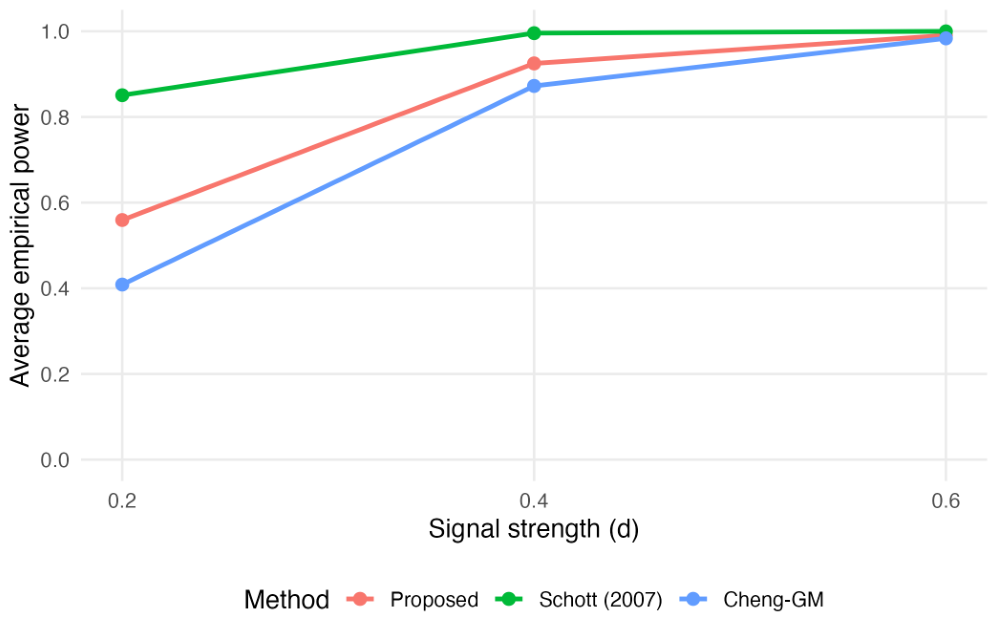
Figure 2 summarizes the unadjusted empirical power across all simulation scenarios. The results presented in Table 2, Table 3 and Table 4 show that empirical power increases with the signal strength parameter (d), as expected. Under weak dense alternatives , Schott’s test often yields higher rejection rates than the competing methods. This behavior is not unexpected under clean Gaussian sampling, because Schott’s statistic is designed for high-dimensional MANOVA under non-robust clean-data conditions and does not include robust scatter estimation or outlier downweighting. By contrast, the proposed method uses MRCD-based robust scatter estimation and robust-distance-based reweighting, which naturally leads to a more conservative testing behavior under weak clean alternatives. Therefore, the clean-data power results should be interpreted in terms of the usual robustness–power trade-off rather than as evidence against the proposed robust procedure.
Figure 2.
Average empirical power across all simulation scenarios as a function of signal strength d [8].
Table 2.
Empirical power and Monte Carlo standard errors under dense alternatives ().
Table 3.
Empirical power and Monte Carlo standard errors under dense alternatives ().
Table 4.
Empirical power and Monte Carlo standard errors under dense alternatives ().
Despite its robust construction, the proposed method remains reasonably competitive under clean data. As the signal strength increases from to , the proposed procedure approaches the performance of the competing methods in many scenarios, particularly in balanced designs and identity covariance structures. Under strong signals , all procedures exhibit near-perfect power in most scenarios, indicating that the detection problem becomes relatively easy in this setting. Thus, the proposed test is not intended to dominate classical or non-robust high-dimensional MANOVA tests under ideal uncontaminated data. Rather, its objective is to retain acceptable power under clean conditions while providing additional protection against false rejections when structured contamination is present.
The original signal strength values , , and were chosen to represent weak, moderate, and strong dense alternatives within the scale of the simulation design. However, these values provide a broad monotone power profile rather than a detailed characterization of the empirical detection boundary. To address this limitation, we conducted an additional focused near-boundary power experiment using smaller signal strengths , , , and .
Because the competing methods may operate at slightly different empirical significance levels, we also computed size-adjusted power. For each method and simulation scenario, the empirical 5% cutoff was obtained from the corresponding null p-value distribution, and power under the alternative was then evaluated using this method- and scenario-specific cutoff. This calibration places the competing procedures on a common empirical significance scale and provides a fairer comparison of their discriminatory ability.
Table 5 shows that size-adjusted power increases monotonically with the signal strength for all methods. Schott’s test retains the largest size-adjusted power under the clean near-boundary alternatives considered here. Therefore, its higher weak-signal power should not be attributed solely to liberal Type-I error behavior; it also reflects stronger clean-data sensitivity in this setting. The proposed method, however, consistently improves upon Cheng-GM across all near-boundary signal levels. These findings support a balanced interpretation of the proposed procedure: it is not intended to dominate non-robust high-dimensional tests under ideal uncontaminated alternatives, but rather to provide a robustness-oriented compromise that maintains reasonable clean-data power while offering improved protection against contamination-induced false discoveries.
Table 5.
Size-adjusted empirical power under near-boundary signal strengths. The empirical 5% cutoff was calibrated separately for each method and scenario under the null hypothesis.
3.3. Robustness Simulation Design
To assess the robustness of the competing MANOVA test procedures, we conduct a simulation study under contaminated versions of the null hypothesis. Specifically, we retain the same scenario grid used in the Type-I error analysis, where the true group mean vectors are identical, i.e.,
However, instead of generating purely clean data, we introduce contamination in the observations to evaluate the sensitivity of the tests to outliers.
For each group , observations are generated from a mixture distribution:
where denotes the contamination proportion. The matrix is either the identity matrix or an AR(1) covariance structure with .
To mimic realistic high-dimensional contamination, outliers are introduced only in a subset of variables. The number of affected components is defined as
which ensures a sparse contamination pattern as the dimension increases.
The contaminated observations are constructed to artificially induce separation between groups, even though the underlying clean data satisfy the null hypothesis.
To address the possibility that the original contamination design may favor the proposed procedure, we conducted an additional focused robustness experiment under the null hypothesis. In addition to the original opposite-shift contamination, which creates artificial group separation, two further contamination mechanisms were considered. The first mechanism applies a common shift in the same direction across all groups, whereas the second mechanism introduces random sparse cellwise contamination by perturbing only a subset of variables with random signs. The experiment used two- and three-group designs, balanced and unbalanced sample sizes, dimensions and , identity and AR(1) covariance structures, and contamination levels and . Each setting was replicated 500 times, and the reported values are averaged over the corresponding scenario-level rejection rates.
Table 6 summarizes the mean empirical rejection rates and the average absolute deviation from the nominal 5% level. Under the original opposite-shift contamination, Schott’s test becomes severely liberal, with rejection rates close to one, and Cheng-GM is also strongly affected when the contamination level increases. In contrast, the proposed procedure remains close to the nominal level. Under common-shift and random sparse cellwise contamination, the proposed method also maintains rejection rates reasonably close to 5%, although a mild increase is observed for random cellwise contamination at . These results indicate that the robustness behavior of the proposed method is not restricted to the original artificial group-separation design, while its strongest advantage appears in settings where outliers induce spurious between-group separation.
Table 6.
Additional robustness analysis under different contamination mechanisms. Entries are mean empirical rejection rates, with AAD from the nominal 5% level in parentheses.
For the two-group case (), the outlier means are defined as
For the three-group case (), the first two groups are shifted in opposite directions, whereas the third group is not shifted:
This construction ensures that contamination induces artificial differences between groups, making it challenging for statistical procedures to correctly maintain the null hypothesis.
The shift magnitude was fixed at , based on preliminary pilot experiments, to yield meaningful artificial separation without making the rejection problem completely trivial. All other simulation parameters, including group sizes, dimensionality, and covariance structures, are identical to those used in the Type-I error study.
For each scenario, Monte Carlo replications are performed. The empirical rejection rate under contamination is computed as
which reflects the extent to which each method is affected by outliers. Monte Carlo standard errors are also reported.
Since the null hypothesis is true for the uncontaminated data, deviations of from the nominal level indicate the sensitivity of the method to contamination. A robust method is expected to maintain rejection rates close to the nominal significance level even in the presence of outliers.
The empirical results in Table 7 and Table 8 demonstrate the robustness advantage of the proposed weighted MRCD-based procedure under contaminated null scenarios. It should be emphasized that, in this simulation design, the null hypothesis is true for the underlying clean observations. Therefore, rejections observed after contamination should be interpreted as false rejections induced by outlier-driven artificial group separation.
Table 7.
Empirical rejection rates and Monte Carlo standard errors under contaminated null scenarios with .
Table 8.
Empirical rejection rates and Monte Carlo standard errors under contaminated null scenarios with .
For the moderate contamination setting with , the proposed method maintains empirical rejection rates close to the nominal significance level across almost all scenarios. The rejection rates of the proposed method are generally concentrated around the nominal level for both identity and AR(1) covariance structures. In contrast, Schott’s test exhibits severe over-rejection in almost all scenarios. This behavior indicates that the trace-based statistic is highly sensitive to structured outliers and tends to interpret contamination-induced separation as genuine evidence against the null hypothesis. Cheng-GM performs better than Schott’s test, but its rejection rates are still systematically larger than those of the proposed method in several scenarios, especially when the group sizes and dimensions increase.
The AAD values reported at the bottom of Table 7 further support this conclusion. The proposed method has the smallest AAD value, equal to 0.010, indicating that its empirical rejection rates remain very close to the nominal level on average. By contrast, the AAD values for Schott’s test and Cheng-GM are 0.832 and 0.060, respectively. Thus, under 10% structured contamination, the proposed procedure shows the smallest deviation from the nominal level among the considered methods in this simulation setting.
Under the heavier contamination setting with , all procedures become more affected by the outliers, as expected. Nevertheless, Table 8 shows that the proposed method still yields substantially lower empirical rejection rates than the competing procedures in most scenarios. Schott’s test rejects the null hypothesis almost uniformly across all scenarios, with rejection rates equal or very close to one. This indicates a complete breakdown of the classical trace-based procedure under severe contamination. Cheng-GM also becomes highly liberal, particularly in larger dimensional settings and under stronger artificial separation. In contrast, the proposed method remains much more conservative and avoids the systematic false discovery pattern observed for the competing tests.
The AAD values provide a compact summary of this behavior. For , the proposed method again achieves the smallest AAD value, equal to 0.092, whereas the corresponding values for Schott’s test and Cheng-GM are 0.950 and 0.471, respectively. Although the proposed method is naturally more affected under 20% contamination than under 10% contamination, its deviation from the nominal level remains considerably smaller than that of the competing methods. This result is consistent with reduced sensitivity of the combined MRCD-based estimation and reweighting framework to structured outliers. Therefore, the robustness gains should be interpreted as the performance of the overall proposed procedure rather than as evidence that any single component alone is responsible for the improvement.
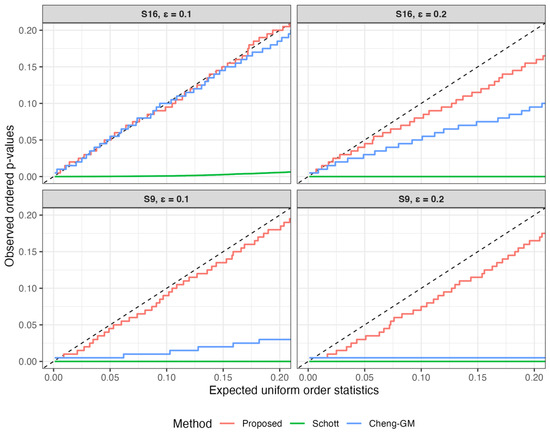
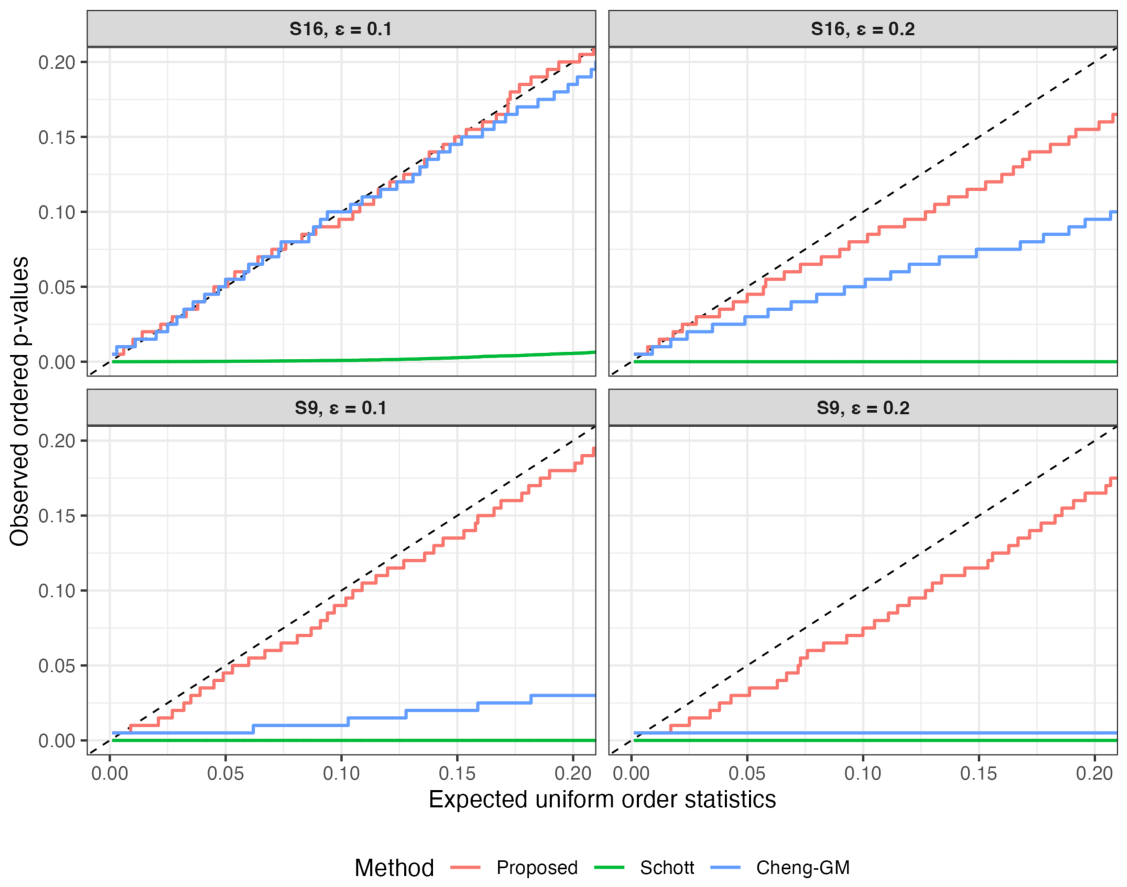
Figure 3 provides graphical support for the robustness results reported in Table 7 and Table 8. The dashed diagonal line represents the expected behavior of well-calibrated p-values under the null hypothesis. Curves lying clearly below the diagonal indicate an excess of small p-values and therefore a tendency toward inflated false rejection. In the representative scenarios, the proposed method remains much closer to the diagonal reference line than the competing procedures, especially under . Schott’s test shows extreme downward deviations, with its p-values concentrated near zero, confirming its severe sensitivity to contamination. Cheng-GM also exhibits downward deviations in several panels, particularly under , whereas the proposed method preserves a substantially more stable p-value distribution.
Figure 3.
p-value plots under contaminated null scenarios for Scenarios S9 and S16 at contamination levels and [8].
Overall, the robustness analysis suggests that the proposed weighted MRCD-based test is less affected by the structured contamination mechanisms considered here than the competing high-dimensional MANOVA procedures. The proposed method not only maintains near-nominal false rejection rates under moderate contamination, but also provides the smallest deviations from the nominal level under severe contamination. These findings support the main motivation of the proposed approach: by combining MRCD-based robust covariance estimation with a reweighting mechanism, the method reduces false discoveries caused by outlier-induced artificial group separation in high-dimensional MANOVA.
4. Real-Data-Based Controlled Sensitivity Analysis
To illustrate the robustness of the proposed weighted MRCD-based high-dimensional MANOVA procedure, we used the breast cancer gene expression dataset previously analyzed by Cheng et al. [15]. The dataset was originally reported by Schmidt et al. [20] and is available through the Bioconductor package breastCancerMAINZ [21]. It contains gene expression measurements from node-negative breast cancer patients and provides a suitable high-dimensional genomic framework for evaluating the behavior of competing MANOVA procedures under structured contamination.
The purpose of this application is not to conduct a biological comparison among tumor-grade categories, but to construct a controlled robustness illustration based on real high-dimensional gene-expression data. A natural tumor-grade comparison would not provide a known-null benchmark, because true biological differences among tumor-grade categories may exist and any rejection could reflect either genuine biological separation or sensitivity to outlying observations. In contrast, by forming pseudo-groups from the same tumor-grade category, the analysis starts from a setting in which no systematic group difference is expected. This design allows the effect of the subsequently imposed contamination to be interpreted more directly: if a method rejects the null after contamination, the rejection is attributable to outlier-induced artificial separation rather than to a known biological difference.
Let denote the data matrix obtained from the selected tumor-grade category. From this matrix, three pseudo-groups were randomly formed with equal sample sizes . Thus, the clean data matrix consisted of observations. To retain the high-dimensional structure while avoiding uninformative variables, genes were ranked according to their median absolute deviation (MAD) within the selected tumor-grade group, and the first genes with the largest MAD values were retained. The selected variables were then standardized using the mean and standard deviation computed from the selected tumor-grade group only. This resulted in a high-dimensional setting with for each group.
The equality of the three pseudo-group mean vectors was first tested using Schott’s high-dimensional MANOVA test, Cheng’s geometric median-based MANOVA test, and the proposed weighted MRCD-based robust Wilks’ Lambda test. Since the three pseudo-groups were generated from the same tumor-grade category, all methods were expected to yield non-significant results before contamination.
To assess robustness, a structured block-contamination mechanism was introduced into the clean pseudo-group data. Specifically, the last 12 observations of the first pseudo-group were shifted by on the first 120 selected genes, while the last 12 observations of the second pseudo-group were shifted by on the same gene block. The third pseudo-group was left unchanged. That is,
where and denote the contaminated subsets of the first and second pseudo-groups, respectively. This scheme creates artificial group separation in a controlled subset of variables while retaining the original real-data structure outside the imposed contaminated block.
It is important to emphasize that the contamination was introduced only for robustness assessment; therefore, any group separation observed after contamination represents an artificial outlier-driven separation rather than a genuine difference between biological groups. This controlled construction is intentionally different from a natural tumor-grade comparison. In a natural comparison, the true status of the null hypothesis is unknown, and a significant result may be difficult to interpret because it may reflect real biological heterogeneity. Here, the use of pseudo-groups from the same tumor-grade category provides an approximate known-null setting. Therefore, the analysis is suitable for evaluating whether competing methods falsely detect group differences after artificial outlier-driven separation is introduced into otherwise comparable real high-dimensional observations.
After applying the structured contamination, the three MANOVA procedures were repeated on the contaminated data. The resulting p-values and descriptive group-separation measures are summarized in Table 9.
Table 9.
Real-data-based MANOVA results and pairwise distances between pseudo-group mean vectors before and after structured contamination.
Before contamination, all three procedures produced non-significant results, with p-values of 0.770, 0.306, and 0.958 for Schott’s test, Cheng’s test, and the proposed MRCD-based test, respectively. This result is consistent with the construction of the pseudo-groups, since all observations were sampled from the same tumor-grade category. Thus, the analysis starts from an approximate known-null setting based on real high-dimensional gene-expression data. In this controlled setting, no systematic biological group difference is expected before contamination, and the non-significant results confirm that the initially formed pseudo-groups do not show evidence of artificial separation.
This design is intentionally different from a natural tumor-grade comparison. In a natural comparison, the true status of the null hypothesis is unknown, because genuine biological differences among tumor-grade categories may exist. Therefore, a significant result in such an analysis could reflect real biological heterogeneity rather than sensitivity to outlying observations. By contrast, the present pseudo-group design provides a controlled benchmark in which the effect of the imposed contamination can be interpreted more directly. The purpose is therefore not to discover biological differences among tumor grades, but to evaluate whether the competing procedures falsely reject the null hypothesis after artificial outlier-driven separation is introduced into otherwise comparable real observations.
After structured contamination was introduced, the pairwise distances between pseudo-group mean vectors increased substantially. For example, d12 increased from 3.65 to 32.98, while d13 and d23 increased from 3.93 and 3.49 to 16.53 and 17.08, respectively. These large increases show that the imposed contamination created a strong artificial separation among the pseudo-groups. Consequently, the very small p-values obtained by Schott’s test, below 0.001, and Cheng’s geometric median-based test, equal to 0.004, should not be interpreted as evidence of genuine biological group differences. Rather, they indicate that these procedures are sensitive to the outlier-induced artificial separation generated by the contamination mechanism.
In contrast, the proposed weighted MRCD-based test remained non-significant at the 5% level, with a p-value of 0.134. This result is consistent with the objective of the controlled sensitivity analysis. Although the imposed contamination produced a strong apparent separation in the sample mean structure, the underlying clean observations still originated from the same tumor-grade category. Therefore, the non-rejection by the proposed method indicates that it was less affected by the imposed outlying pattern and avoided falsely rejecting the null hypothesis in the presence of artificial contamination-driven group separation. Thus, the real-data example should be interpreted as a controlled robustness illustration with an approximate known-null motivation, rather than as an exploratory natural comparison among tumor-grade categories.
5. Software Availability
We implemented the proposed weighted MRCD-based robust MANOVA test in the R package MVTests using the function RobHDMANOVA() [22]. The MRCD estimates used in this implementation are computed through the CovMrcd() function from the rrcov package [23].
The function requires two main arguments: x, a numeric data matrix containing the observations, and group, a grouping vector indicating the group membership of each observation. The function returns the robust Wilks’ Lambda value, the observed robust MANOVA test statistic, the permutation-based p-value, and the permutation distribution of the test statistic. Researchers can install the MVTests package from GitHub using the following R commands:
- install.packages("devtools")
- devtools::install_github("hsnbulut/MVTests")
After installation, the proposed method can be applied as follows:
- > library(MVTests)
- > set.seed(123)
- > X <- matrix(rnorm(60 * 100), nrow = 60, ncol = 100)
- > group <- rep(1:3, each = 20)
- > result <- RobHDMANOVA(x = X, group = group, N = 999,
- + alpha = 0.75, tau = 0.975,
- + cutoff = "normal")
- > summary(result)
- Weighted MRCD-Based Robust MANOVA~Test
- Robust Wilks’ Lambda = 0.005405396
- Test Statistic (-log Lambda) = 5.220358
- p-value: 0.698
- Number of permutations = 999
- MRCD alpha = 0.75
- Tau = 0.975
- Cutoff rule = normal
Using this function, the proposed robust MANOVA test can be easily applied to high-dimensional data sets, especially when the data may contain outlying observations.
This implementation is intended to facilitate reproducibility and practical use of the proposed method, allowing researchers from different scientific fields to apply the robust high-dimensional MANOVA procedure without implementing the MRCD estimation, reweighting, and permutation steps manually.
6. Conclusions
This study introduced a weighted MRCD-based Wilks-type test for one-way high-dimensional MANOVA. Its defining contribution is the combined use of positive-definite MRCD scatter estimation, robust-distance observation reweighting, a determinant ratio, and permutation-calibrated inference. The construction remains computable when the dimension exceeds group sample sizes.
Under clean data, the difference in Type-I error control between the proposed method and Cheng-GM is modest, and Schott’s test can have higher power for weak signals. The proposed method should therefore be viewed as a conservative robustness-oriented alternative rather than a uniformly superior clean-data procedure. Its main empirical advantage in the present experiments is lower false rejection under contamination that creates artificial group separation. Accordingly, the observed robustness gain should be attributed to the combined MRCD-based testing framework, which integrates positive-definite robust scatter estimation, robust-distance-based observation weighting, a determinant-based Wilks-type statistic, and permutation calibration, rather than to any single component in isolation.
Computation is an important limitation. Permutation calibration repeatedly refits groupwise and pooled MRCD estimates, making the method more expensive than the competitors. Parallel execution is recommended for confirmatory studies, and a smaller number of permutations may be used for preliminary screening followed by a larger value for final inference. Future work should develop faster calibration strategies and extend the framework to factorial and repeated-measures designs.
Funding
This research received no external funding.
Data Availability Statement
The data presented in this study are openly available from GitHub [19] (version number: a5a564c) at https://github.com/hsnbulut/HDrob_manova (accessed on 10 June 2026).
Acknowledgments
The numerical calculations reported in this paper were partially performed at TUBITAK ULAKBIM, High Performance and Grid Computing Center (TRUBA resources). Moreover, ChatGPT by OpenAI (San Francisco, CA, USA; https://chatgpt.com, accessed on 16 July 2026) was used only for proofreading and language polishing during the preparation of the manuscript.
Conflicts of Interest
The author declares no conflict of interest.
References
- Warne, R.T. A primer on multivariate analysis of variance (MANOVA) for behavioral scientists. Pract. Assess. Res. Eval. 2014, 19, 17. [Google Scholar] [CrossRef]
- Owusu, D.; Arthur, F.; Okyere-Dankwa, R.; Affreh, O.; Kumedzro, F.K.; Maison, R.S. Academic stress and burnout among distance education students in a Ghanaian higher education institution. Cogent Educ. 2024, 11, 2334686. [Google Scholar] [CrossRef] [Scilit]
- Borghi, S.; Ruo, A.; Sabattini, L.; Peruzzini, M.; Villani, V. Assessing operator stress in collaborative robotics: A multimodal approach. Appl. Ergon. 2025, 123, 104418. [Google Scholar] [CrossRef] [Scilit] [PubMed]
- Chrzanowski, L.; Singer, J.; Rerick, P.; Elliott, L.; Levitt, D.E.; Cummings, C.; Decourt, B.; Molinar-Lopez, V.; Neugebauer, V. The role of inflammation, chronic pain, and hypertension on cognitive functioning in an underserved, rural population: A Project FRONTIER study. J. Clin. Exp. Neuropsychol. 2025, 47, 249–262. [Google Scholar] [CrossRef] [Scilit] [PubMed]
- Shen, Y.; Lin, Z.; Zhu, J. Shrinkage-based regularization tests for high-dimensional data with application to gene set analysis. Comput. Stat. Data Anal. 2011, 55, 2221–2233. [Google Scholar] [CrossRef] [Scilit]
- Alsalman, M.; Alraeesi, M.; Alzaatreh, A. Multivariate analysis of energy and solar performance across Dubai: Insights from MANOVA and cluster analysis. Sci. Rep. 2025, 15, 24526. [Google Scholar] [CrossRef] [Scilit] [PubMed]
- Rencher, A.C. Methods of Multivariate Analysis, 2nd ed.; Wiley-Interscience: New York, NY, USA, 2002. [Google Scholar]
- Schott, J.R. Some high-dimensional tests for a one-way MANOVA. J. Multivar. Anal. 2007, 98, 1825–1839. [Google Scholar] [CrossRef] [Scilit]
- Zhang, J.T.; Guo, J.; Zhou, B. Linear hypothesis testing in high-dimensional one-way MANOVA. J. Multivar. Anal. 2017, 155, 200–216. [Google Scholar] [CrossRef] [Scilit]
- Zhang, M.; Zhou, C.; He, Y.; Liu, B. Data-adaptive test for high-dimensional multivariate analysis of variance problem. Aust. N. Z. J. Stat. 2018, 60, 447–470. [Google Scholar] [CrossRef] [Scilit]
- Ullah, I.; Jones, B. Regularised MANOVA for high-dimensional data. Aust. N. Z. J. Stat. 2015, 57, 377–389. [Google Scholar] [CrossRef] [Scilit]
- Lin, Z.; Lopes, M.E.; Müller, H.G. High-dimensional MANOVA via bootstrapping and its application to functional and sparse count data. J. Am. Stat. Assoc. 2023, 118, 177–191. [Google Scholar] [CrossRef] [Scilit]
- Lu, M.; Zhou, B. A one-way MANOVA test for high-dimensional data using clustering subspaces. Stat. Probab. Lett. 2025, 217, 110293. [Google Scholar] [CrossRef] [Scilit]
- Todorov, V.; Filzmoser, P. Robust Statistic for the One-way MANOVA. Comput. Stat. Data Anal. 2010, 54, 37–48. [Google Scholar] [CrossRef] [Scilit]
- Cheng, G.; Lin, R.; Peng, L. High-dimensional multivariate analysis of variance via geometric median and bootstrapping. Biometrics 2024, 80, ujae088. [Google Scholar] [CrossRef] [Scilit] [PubMed]
- Boudt, K.; Rousseeuw, P.J.; Vanduffel, S.; Verdonck, T. The minimum regularized covariance determinant estimator. Stat. Comput. 2020, 30, 113–128. [Google Scholar] [CrossRef] [Scilit]
- Bulut, H. Mahalanobis distance based on minimum regularized covariance determinant estimators for high dimensional data. Commun.-Stat.-Theory Methods 2020, 49, 5897–5907. [Google Scholar] [CrossRef] [Scilit]
- Davidson, R.; MacKinnon, J.G. Graphical methods for investigating the size and power of hypothesis tests. Manch. Sch. 1998, 66, 1–26. [Google Scholar] [CrossRef] [Scilit]
- Bulut, H. HDrob_manova: Simulation Codes, Results, and Graphical Materials for Robust High-Dimensional MANOVA. GitHub Repository. 2026. Available online: https://github.com/hsnbulut/HDrob_manova (accessed on 10 June 2026).
- Schmidt, M.; Böhm, D.; von Törne, C.; Steiner, E.; Puhl, A.; Pilch, H.; Lehr, H.A.; Hengstler, J.G.; Kölbl, H.; Gehrmann, M. The humoral immune system has a key prognostic impact in node-negative breast cancer. Cancer Res. 2008, 68, 5405–5413. [Google Scholar] [CrossRef] [Scilit] [PubMed]
- Schroeder, M.; Haibe-Kains, B.; Culhane, A.; Sotiriou, C.; Bontempi, G.; Quackenbush, J. breastCancerMAINZ: Gene Expression Dataset Published by Schmidt et al. [2008] (MAINZ). R Package Version 1.46.0. Bioconductor. 2025. Available online: https://bioconductor.org/packages/release/data/experiment/html/breastCancerMAINZ.html (accessed on 10 June 2026).
- Bulut, H. An R Package for Multivariate Hypothesis Tests: MVTests. Technol. Appl. Sci. 2019, 14, 132–138. [Google Scholar] [CrossRef] [Scilit]
- Todorov, V.; Filzmoser, P. An object-oriented framework for robust multivariate analysis. J. Stat. Softw. 2009, 32, 1–47. [Google Scholar] [CrossRef] [Scilit]

Disclaimer/Publisher’s Note: The statements, opinions and data contained in all publications are solely those of the individual author(s) and contributor(s) and not of MDPI and/or the editor(s). MDPI and/or the editor(s) disclaim responsibility for any injury to people or property resulting from any ideas, methods, instructions or products referred to in the content. |
© 2026 by the author. Licensee MDPI, Basel, Switzerland. This article is an open access article distributed under the terms and conditions of the Creative Commons Attribution (CC BY) license.