The Optimal and Robust Siting and Ranking Framework for ESS and STATCOM Under 765 kV Double-Circuit N-2 Contingencies



Abstract
1. Introduction
- It formulates 765 kV double-circuit N-2 mitigation as a formal scenario-robust siting and ranking optimization problem (Problem (4)) for ESS and STATCOM, with a transparent cost-comparison proxy () and an explicit rank-aggregation objective (Definition 3).
- It establishes the mathematical properties of the framework. These properties are (i) finite-termination of the capacity sweeps (Theorem 1), (ii) a closed-form total complexity bound (Corollary 1), (iii) existence of an optimal sized capacity on the sweep grid (Proposition 1), (iv) an exact decomposition of the joint problem into independent per-bus inner sizing problems plus a single outer ranking step (Proposition 2), and (v) percentile-bootstrap consistency for the top-share confidence intervals (Proposition 3).
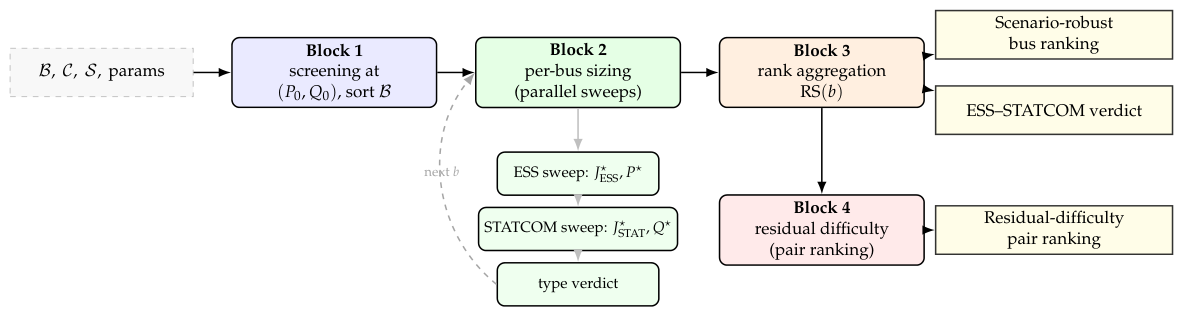
- It presents a screening-and-sweep evaluation algorithm (Figure 1) whose computational budget is bounded a priori by Corollary 1, so the full scenario sweep completes within a planned wall-clock budget without solver-dependent stopping behavior.
- It empirically demonstrates on a multi-year scenario set of the Republic of Korea backbone that pair-level best performance and scenario-level robustness lead to different candidate preferences, and it interprets residual pair difficulty as a corridor-level vulnerability ranking with direct implications for long-term transmission planning.
2. Study System and Problem Setting
2.1. Security Implications of 765 kV Double-Circuit N-2 Contingencies
2.2. Key 765 kV Transmission Corridors and Candidate Buses


| N-2 Pair | Analyzed Scen. | Worst-Pair Sel. | Top-3 Diff. Entries | Avg. Rank |
|---|---|---|---|---|
| Bus A–Bus F | 46 | 22 | 28 | 3.22 |
| Bus I–Bus J | 60 | 17 | 38 | 3.13 |
| Bus A–Bus D | 14 | 9 | 9 | 2.79 |
| Bus D–Bus F | 46 | 7 | 32 | 3.35 |
| Bus D–Bus E | 61 | 6 | 31 | 3.62 |
| Bus C–Bus H | 60 | 1 | 35 | 3.77 |
| Bus G–Bus H | 60 | 0 | 5 | 4.50 |
| Bus B–Bus C | 60 | 0 | 4 | 5.52 |
2.3. Relationship Between ACCC and Static Post-Contingency Evaluation
2.4. Construction of N-2 Contingency Pairs and Candidate-Bus Set
2.5. System Data and Scenario Configuration
- Year 2023: Pre-HVDC baseline case.
- Year 2026: 500 kV HVDC Bus A–Bus E line available.
- Year 2033: Long-term expanded system with the HVDC line retained.
2.6. Definition of the Scenario Set
3. Scenario-Robust Siting and Ranking Framework
3.1. Physical Roles of ESS and STATCOM in the Post-Contingency Regime
3.2. Congestion-Relief and Voltage-Support Mechanisms
3.3. Post-Contingency Score
3.4. Candidate Evaluation and Economic Comparison Metric
3.5. Implementation Settings
3.6. Overall Workflow
3.7. Hierarchical Screening and Independent Capacity Sizing
3.8. Statistical Re-Scoring Algorithm
3.9. Theoretical Properties
4. Results
4.1. Pair-Level and Scenario-Level Candidate Rankings
4.2. Scenario-Level Sensitivity Summary
4.3. Vulnerable N-2 Pair Ranking
4.4. Sensitivity to Robust-Score Weights
4.5. Cost-Ratio Sensitivity ()
4.6. Coverage and the Identification of Structurally Unsolvable Contingencies
4.7. Comparison with a Single Severe-Pair Baseline
4.8. Reliability and Failure Handling
5. Discussion
5.1. Divergence Between Pair-Level and Scenario-Level Rankings
5.2. Corridor-Level Vulnerability and Planning Implications
5.3. ESS vs. STATCOM Selection Under the Cost Proxy
6. Conclusions
Supplementary Materials
Author Contributions
Funding
Institutional Review Board Statement
Informed Consent Statement
Data Availability Statement
Conflicts of Interest
Nomenclature
| Set of buses in the post-contingency network; | |
| Set of transmission lines and transformers; | |
| Set of 765 kV double-circuit N-2 contingency pairs; | |
| c | Index for a specific N-2 contingency pair; |
| b | Index for a candidate installation bus; |
| Voltage magnitude and angle at bus; i | |
| Conductance and susceptance of branch under contingency c; | |
| Thermal rating of branch ; | |
| Active-power ESS and reactive-power STATCOM injection at bus b; | |
| Post-contingency score for candidate under contingency c; | |
| Baseline post-contingency score (no corrective support) under c; | |
| Average score and average improvement over ; | |
| Capacity-penalized evaluation metrics for the ESS (P) and STATCOM (Q) sweeps; | |
| Economic weights for ESS and STATCOM (fixed ratio ); | |
| Post-contingency severity penalty index under contingency c; | |
| Aggregate voltage-limit, thermal-overload, and voltage-deviation violations; | |
| Swing-limit violation, islanded-bus count, and total bus MVA mismatch; | |
| Penalty weights for the six violation terms of ; | |
| M | Fixed non-convergence penalty assigned to a failed power flow; |
| Rank-aggregation weights in scenario-robust score ; | |
| Robust score of candidate k; | |
| Normalized score rank and improvement rank; | |
| Reliability (proportion of successful evaluations) of candidate k; | |
| ESS | Energy storage system; |
| STATCOM | Static synchronous compensator; |
| ACCC | AC contingency calculation; |
| RPS | Renewable portfolio standard; |
| HVDC | High-voltage direct current. |
Appendix A
| Algorithm A1 Scenario-Robust Siting and Ranking for ESS/STATCOM |
| Input. . |
| Output. Scenario-robust ranking , ESS–STATCOM verdict per bus, residual difficulty per N-2 pair. |
| 1. Screening. For each and each , solve the post-contingency AC flow at and accumulate by Definition 2. Sort in ascending screening score. |
| 2. Per-bus loop (for each in sorted order) |
| 2a. ESS sweep. Set , , . While and : set , evaluate . If is feasible and , then , , , else . |
| 2b. STATCOM sweep. Symmetric loop on Q with step , returning and . |
| 2c. Type verdict. Label b as ESS-better, STATCOM-better, or neutral by comparing with within the tolerance band. |
| 3. Rank aggregation. Compute normalized score and improvement ranks and reliability . Evaluate by Definition 3. Sort in ascending . |
| 4. Residual-difficulty layer. For each , compute the residual score with corrective support placed at the scenario-level winner and rank pairs by residual difficulty. |
| 5. Return the rank-aggregated bus ranking, the per-bus type verdict, and the residual-difficulty pair ranking. |
Appendix B
| Scenario | N-2 Pair | Min (pu) | Max Load (%) | V-Viol. (#) | Therm.-Viol. (#) | Feas. +ESS | Feas. +STATCOM |
|---|---|---|---|---|---|---|---|
| 2033 peak (HVDC on) | Bus A–Bus F | 0.79 | 549.7 | 37 | 205 | N | N |
| 2026 peak (HVDC on) | Bus D–Bus E | 0.94 | 217.4 | 165 | 57 | N | N |
| 2033 middle (HVDC on) | Bus I–Bus J | 0.86 | 599.3 | 69 | 237 | N | N |
| Configuration | Rank-1 | Top-3 Set | Change vs. Default | |
|---|---|---|---|---|
| Default (reported) | Bus D | {Bus D, Bus F, Bus C} | — | |
| Within-tier scaled | Bus D | {Bus D, Bus F, Bus C} | none (preserved) | |
| Tier-compressed | Bus D | {Bus D, Bus F, Bus C} | none (preserved) | |
| Equal weights (no tiers) | Bus D | {Bus D, Bus F, Bus C} | none; Bus D share | |
| Reordered (hierarchy broken) | Bus E | {Bus E, Bus F, Bus C} | Rank-1 → Bus E; Bus D leaves Top-3 | |
| Reference capacity | varied | n/e | n/e | n/e |
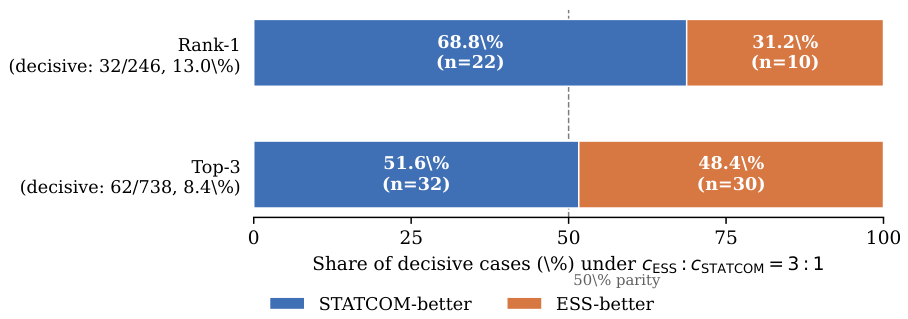
| Cost Ratio | Rank-1 STATCOM | Rank-1 ESS | Top-3 STATCOM | Top-3 ESS |
|---|---|---|---|---|
| (reported) | 68.8% | 31.2% | 51.6% | 48.4% |
| Bus | Role | Driving N-2 Pairs |
|---|---|---|
| Bus D | Scenario-level Rank-1 | Bus A–Bus D, Bus D–Bus F, Bus D–Bus E (inland chain) |
| Bus F | Scenario-level 2nd | Bus A–Bus F (most frequent worst pair), Bus D–Bus F |
| Bus C | Pair-level leader | many individual pairs (e.g., Bus C–Bus H); diffuse scenario benefit |
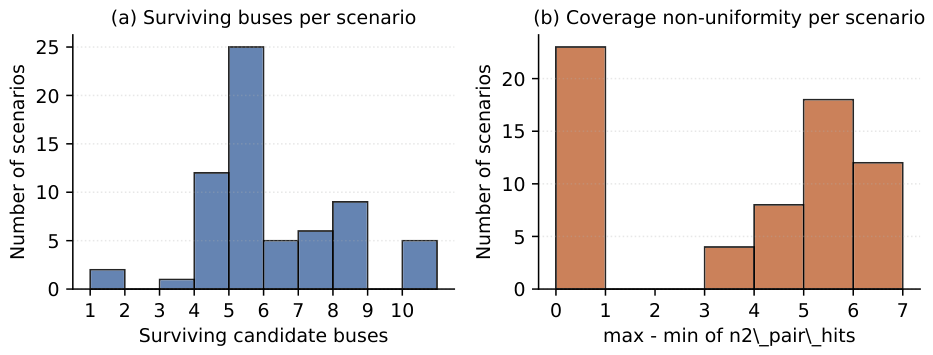
| Quantity | Value |
|---|---|
| Analyzed scenario files | 65 |
| Files retaining a full sweep | 60 |
| Files dropped (solver failure / pruning) | 5 |
| Non-uniform n2_pair_hits files | 42 (64.6%) |
| Per-bus n2_pair_hits range (2033 peak) | 1–7 |
References
- Kim, S.; Kim, H.; Lee, H.; Lee, J.; Lee, B.; Jang, G.; Lan, X.; Kim, T.; Jeon, D.; Kim, Y.; et al. Expanding power systems in the Republic of Korea: Feasibility studies and future challenges. IEEE Power Energy Mag. 2019, 17, 61–72. [Google Scholar] [CrossRef] [Scilit]
- Papic, M.; Bell, K.; Chen, Y.; Dobson, I.; Fonte, L.; Haq, E.; Hines, P.; Kirschen, D.; Luo, X.; Miller, S.S.; et al. Survey of tools for risk assessment of cascading outages. In Proceedings of the 2011 IEEE Power and Energy Society General Meeting, Detroit, MI, USA, 24–28 July 2011; pp. 1–9. [Google Scholar] [CrossRef] [Scilit]
- Morales, J.M.; Conejo, A.J.; Madsen, H.; Pinson, P.; Zugno, M. Integrating Renewables in Electricity Markets: Operational Problems; Springer: New York, NY, USA, 2014. [Google Scholar] [CrossRef] [Scilit]
- Go, Y.; Choi, W.; Kim, M.; Chung, J.-H.; Kim, H.; Lee, D. Fair transmission expansion cost allocation for renewable energy resource interconnection based on stochastic cooperative game theory. Mathematics 2025, 13, 3898. [Google Scholar] [CrossRef] [Scilit]
- Korea Electric Power Corporation. Transmission and Distribution Business: Transmission and Substation Facility Overview. 2024. Available online: https://home.kepco.co.kr/ (accessed on 31 March 2026).
- Jeong, I.; Oh, S.; Song, J.; Ku, H.; Bae, M.; Kwak, E.-S.; Min, J.-H.; Shin, J. A study on analysis of margin of transient stability and calculation of power generation constraints according to renewable energy sources in the East Coast. Trans. Korean Inst. Electr. Eng. 2022, 71, 1564–1570. [Google Scholar] [CrossRef] [Scilit]
- Conejo, A.J.; Baringo, L.; Kazempour, S.J.; Siddiqui, A.S. Investment in Electricity Generation and Transmission: Decision Making Under Uncertainty; Springer: Cham, Switzerland, 2016. [Google Scholar] [CrossRef] [Scilit]
- Abdi, H. A survey of combined heat and power-based unit commitment problem: Optimization algorithms, case studies, challenges, and future directions. Mathematics 2023, 11, 4170. [Google Scholar] [CrossRef] [Scilit]
- Davis, C.M.; Overbye, T.J. Multiple element contingency screening. IEEE Trans. Power Syst. 2011, 26, 1294–1301. [Google Scholar] [CrossRef] [Scilit]
- Kaplunovich, P.; Turitsyn, K. Fast and reliable screening of N-2 contingencies. IEEE Trans. Power Syst. 2016, 31, 4243–4252. [Google Scholar] [CrossRef] [Scilit]
- Aguado, J.A.; de la Torre, S.; Triviño, A. Battery energy storage systems in transmission network expansion planning. Electr. Power Syst. Res. 2017, 145, 63–72. [Google Scholar] [CrossRef] [Scilit]
- Lindner, M.; Peper, J.; Offermann, N.; Biele, C.; Teodosic, M.; Pohl, O.; Menne, J.; Häger, U. Operation strategies of battery energy storage systems for preventive and curative congestion management in transmission grids. IET Gener. Transm. Distrib. 2023, 17, 589–603. [Google Scholar] [CrossRef] [Scilit]
- Khani, H.; Dadash Zadeh, M.R.; Hajimiragha, A.H. Transmission congestion relief using privately owned large-scale energy storage systems in a competitive electricity market. IEEE Trans. Power Syst. 2016, 31, 1449–1458. [Google Scholar] [CrossRef] [Scilit]
- Jung, S.-W.; An, Y.-Y.; Suh, B.; Park, Y.; Kim, J.; Kim, K.-I. Multi-agent deep reinforcement learning for scheduling of energy storage system in microgrids. Mathematics 2025, 13, 1999. [Google Scholar] [CrossRef] [Scilit]
- Xu, Y.; Dong, Z.Y.; Xiao, C.; Zhang, R.; Wong, K.P. Optimal placement of static compensators for multi-objective voltage stability enhancement of power systems. IET Gener. Transm. Distrib. 2015, 9, 2144–2151. [Google Scholar] [CrossRef] [Scilit]
- Kundur, P.; Paserba, J.; Ajjarapu, V.; Andersson, G.; Bose, A.; Canizares, C.; Hatziargyriou, N.; Hill, D.; Stankovic, A.; Taylor, C.; et al. Definition and classification of power system stability IEEE/CIGRE Joint Task Force on Stability Terms and Definitions. IEEE Trans. Power Syst. 2004, 19, 1387–1401. [Google Scholar] [CrossRef] [Scilit]
- Bai, W.; Lee, D.; Lee, K.Y. Stochastic dynamic AC optimal power flow based on a multivariate short-term wind power scenario forecasting model. Energies 2017, 10, 2138. [Google Scholar] [CrossRef] [Scilit]
- Bhattacharya, A.; Chakraborty, A.K.; Bhattacharjee, A. Dynamic security assessment of power systems: A comprehensive review of computational intelligence techniques. Int. J. Electr. Power Energy Syst. 2020, 121, 106126. [Google Scholar] [CrossRef] [Scilit]
- Chakraborty, A.; Musunuri, S.K.; Srivastava, A.K.; Kondabathini, A.K. Integrating STATCOM and battery energy storage system for power system transient stability. Adv. Power Electron. 2012, 2012, 676010. [Google Scholar] [CrossRef] [Scilit]
- Ejebe, G.C.; Wollenberg, B.F. Automatic contingency selection. IEEE Trans. Power Appar. Syst. 1979, PAS-98, 97–109. [Google Scholar] [CrossRef] [Scilit]
- Ministry of Trade, Industry and Energy. Standard for Reliability and Quality of Electricity in Power Systems; MOTIE Notification No. 2023-65. Ministry of Trade, Industry and Energy: Sejong, Republic of Korea, 2023. Available online: https://www.law.go.kr/admRulLsInfoP.do?admRulSeq=69497 (accessed on 15 May 2026).
- Cole, W.; Ramasamy, V.; Turan, M. Cost Projections for Utility-Scale Battery Storage: 2025 Update; NREL/TP-6A40-93281. National Renewable Energy Laboratory: Golden, CO, USA, 2025.
- Carbonara, A.; Dambone Sessa, S.; L’Abbate, A.; Sanniti, F.; Chiumeo, R. Comparison of advanced flexible alternating current transmission system (FACTS) devices with conventional technologies for power system stability enhancement: An updated review. Electronics 2024, 13, 4262. [Google Scholar] [CrossRef] [Scilit]
- Hooke, R.; Jeeves, T.A. Direct search solution of numerical and statistical problems. J. ACM 1961, 8, 212–229. [Google Scholar] [CrossRef] [Scilit]
- Kollenda, K.; Schrief, A.; Biele, C.; Lindner, M.; Sundorf, N.; Hoffrichter, A.; Roehder, A.; Moser, A.; Rehtanz, C. Curative measures identification in congestion management exploiting temporary admissible thermal loading of overhead lines. IET Gener. Transm. Distrib. 2022, 16, 3171–3183. [Google Scholar] [CrossRef] [Scilit]
- Yager, R.R. On ordered weighted averaging aggregation operators in multicriteria decisionmaking. IEEE Trans. Syst. Man Cybern. 1988, 18, 183–190. [Google Scholar] [CrossRef] [Scilit]
- Ben-Tal, A.; El Ghaoui, L.; Nemirovski, A. Robust Optimization; Princeton Series in Applied Mathematics; Princeton University Press: Princeton, NJ, USA, 2009. [Google Scholar] [CrossRef] [Scilit]
- Wang, Z.; Cao, R.; Tang, D.; Wang, C.; Liu, X.; Hu, W. Distributionally robust energy optimization with renewable resource uncertainty. Mathematics 2025, 13, 992. [Google Scholar] [CrossRef] [Scilit]
- Efron, B.; Tibshirani, R. Bootstrap methods for standard errors, confidence intervals, and other measures of statistical accuracy. Stat. Sci. 1986, 1, 54–75. [Google Scholar] [CrossRef] [Scilit]
- Fisher, E.B.; O’Neill, R.P.; Ferris, M.C. Optimal transmission switching. IEEE Trans. Power Syst. 2008, 23, 1346–1355. [Google Scholar] [CrossRef] [Scilit]
- Zhou, B.; Xu, D.; Chan, K.W.; Li, C.; Cao, Y.; Bu, S. A two-stage framework for multiobjective energy management in distribution networks with a high penetration of wind energy. Energy 2017, 135, 754–766. [Google Scholar] [CrossRef] [Scilit]
- Aghaei, J.; Amjady, N.; Shayanfar, H.A. Multi-objective electricity market clearing considering dynamic security by lexicographic optimization and augmented epsilon constraint method. Appl. Soft Comput. 2011, 11, 3846–3858. [Google Scholar] [CrossRef] [Scilit]



| Geographic Role | Candidate Buses | Principal Role |
|---|---|---|
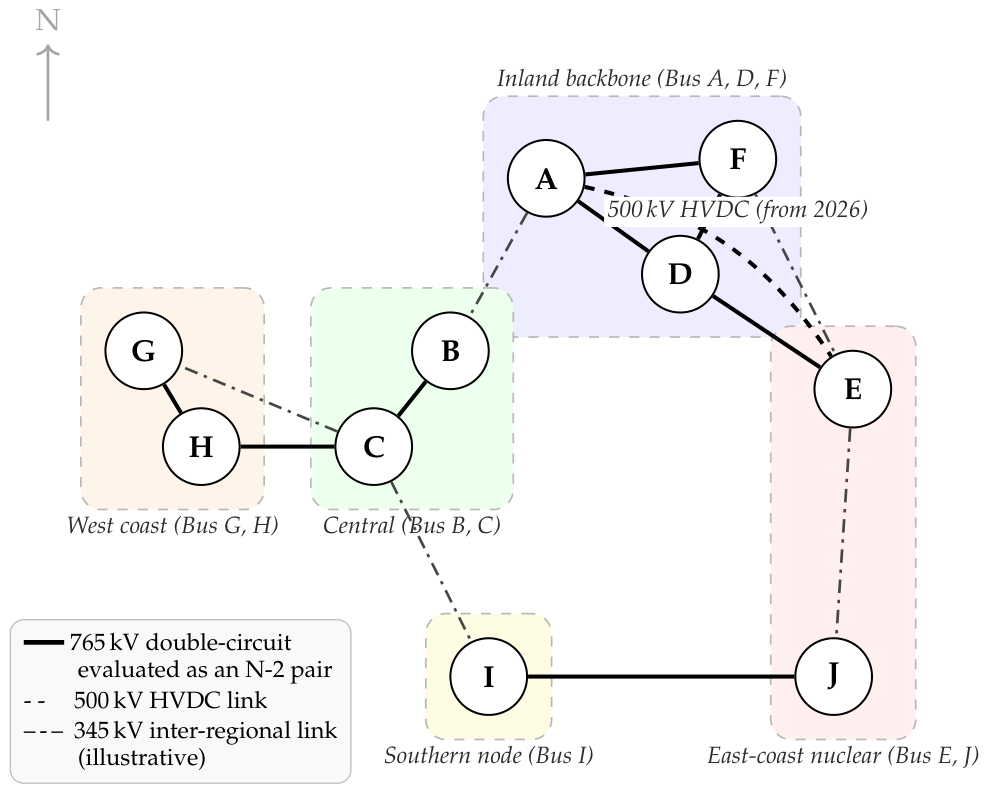
| East-coast nuclear corridor | Bus E, Bus J | Receiving substations for large-scale nuclear output |
| Inland backbone | Bus D, Bus F, Bus A | Main east-coast to metropolitan bulk-transfer chain |
| Central nodes | Bus C, Bus B | Aggregation and redistribution hubs for westbound power flow |
| West-coast generation nodes | Bus H, Bus G | Thermal-generation nodes serving western demand |
| Southern node | Bus I | Interface to the southern industrial load zone |
| Category | Condition | 2023 (GW) | 2026 (GW) | 2033 (GW) |
|---|---|---|---|---|
| Demand | Peak | 98.8 | 104.2 | 113.6 |
| Medium | 79.0 | 83.4 | 90.9 | |
| Off-peak | 59.3 | 62.5 | 68.2 | |
| Generation | Installed capacity | 116.8 | 129.6 | 139.9 |
| Peak output | 101.6 | 107.2 | 119.5 | |
| Medium output | 82.2 | 86.6 | 97.9 | |
| Off-peak output | 61.2 | 65.0 | 72.9 |
| Item | Value | Description |
|---|---|---|
| Target voltage | 765 kV | Only 765 kV lines are used to construct valid double-circuit N-2 pairs. |
| Valid N-2 pair | Same bus pair, 2 circuits | Two lines form a valid pair only when they belong to the same 765 kV double-circuit corridor. |
| Candidate filter | 765 kV buses | Candidate siting buses are taken at the 765 kV level (renewable-injection buses excluded). |
| Screening capacity | MW, Mvar | Fixed reference capacity applied to every candidate bus in the screening stage. |
| Sizing-stage buses | All screened buses | Every screened bus is sized, and buses are processed in descending screening-score order. |
| Capacity sweep range | ESS up to 4000 MW and STATCOM up to 4000 Mvar | Per-axis defense limit applied independently to the ESS active-power sweep and the STATCOM reactive-power sweep. |
| Sweep step sizes | ESS 100 MW, STATCOM 10 Mvar | Linear capacity increments for the independent ESS (P) and STATCOM (Q) sweeps. |
| Sweep termination | 2 steps without improvement | Each sweep stops after two consecutive increments fail to improve the capacity-penalized metric beyond a tolerance. |
| Zero-capacity anchor | included | The no-installation case is the sweep starting point and reference. |
| Economic weights | ESS : STATCOM | Capacity-penalty ratio in the ESS/STATCOM comparison metric, Equation (8). |
| Failure treatment | No-result | Solver failure or non-convergence is recorded and excluded from the robust ranking. |
| Robust-score weights | 0.65/0.25/0.10 | Weights assigned to score rank, improvement rank, and reliability, respectively. |
| Bus Label | Bus Code | Pair-Level (%) | Pair 95% CI | Scenario-Level (%) | Scenario 95% CI |
|---|---|---|---|---|---|
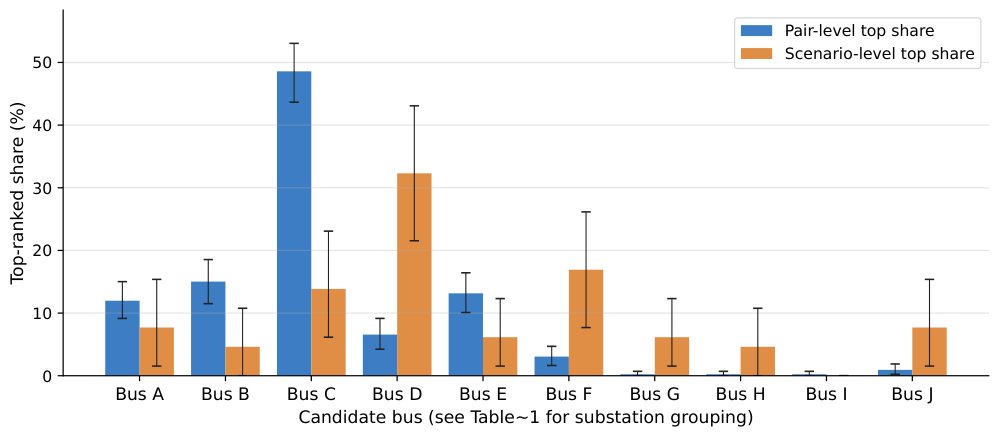
| Bus A | 1020 | 12.0 | [9.2, 15.0] | 7.7 | [1.5, 15.4] |
| Bus B | 4010 | 15.0 | [11.5, 18.5] | 4.6 | [0.0, 10.8] |
| Bus C | 4020 | 48.6 | [43.7, 53.1] | 13.9 | [6.2, 23.1] |
| Bus D | 5010 | 6.6 | [4.2, 9.2] | 32.3 | [21.5, 43.1] |
| Bus E | 5020 | 13.2 | [10.1, 16.4] | 6.2 | [1.5, 12.3] |
| Bus F | 5040 | 3.1 | [1.6, 4.7] | 16.9 | [7.7, 26.2] |
| Bus G | 6020 | 0.2 | [0.0, 0.7] | 6.2 | [1.5, 12.3] |
| Bus H | 6030 | 0.2 | [0.0, 0.7] | 4.6 | [0.0, 10.8] |
| Bus I | 8010 | 0.2 | [0.0, 0.7] | 0.0 | [0.0, 0.0] |
| Bus J | 9010 | 0.9 | [0.2, 1.9] | 7.7 | [1.5, 15.4] |
| Axis | Representative Result | Implication |
|---|---|---|
| 2023 | Medium-load cases center on Bus C, and off-peak cases on Bus A. | Candidate concentration is clear in the pre-HVDC baseline system. |
| 2026 | Medium and peak cases are shared among Bus D, Bus F, Bus C, and Bus J. | HVDC commissioning and expanded generation reorder the robust ranking. |
| 2033 | Off-peak cases favor Bus D, and medium and peak cases remain dispersed. | Long-term structural change broadens the effective mitigation region. |
| HVDC | Pair-level top remains Bus C, but 10/16 matched on/off scenarios change the scenario-level winner. | HVDC affects the robust ranking more strongly than it affects pair-level local optima. |
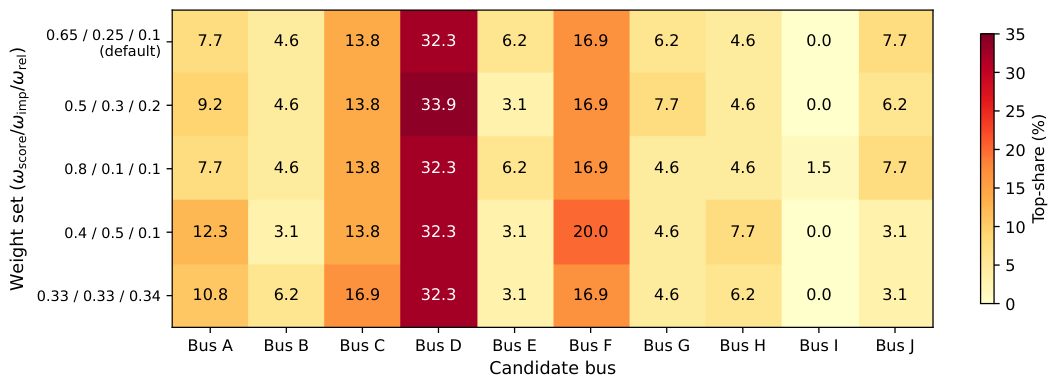
| Weight Set () | A | B | C | D | E | F | G | H | I | J |
|---|---|---|---|---|---|---|---|---|---|---|
| 0.65/0.25/0.10 (default) | 7.7 | 4.6 | 13.9 | 32.3 | 6.2 | 16.9 | 6.2 | 4.6 | 0.0 | 7.7 |
| 0.50/0.30/0.20 | 9.2 | 4.6 | 13.8 | 33.8 | 3.1 | 16.9 | 7.7 | 4.6 | 0.0 | 6.2 |
| 0.80/0.10/0.10 | 7.7 | 4.6 | 13.8 | 32.3 | 6.2 | 16.9 | 4.6 | 4.6 | 1.5 | 7.7 |
| 0.40/0.50/0.10 | 12.3 | 3.1 | 13.8 | 32.3 | 3.1 | 20.0 | 4.6 | 7.7 | 0.0 | 3.1 |
| 0.33/0.33/0.34 | 10.8 | 6.2 | 16.9 | 32.3 | 3.1 | 16.9 | 4.6 | 6.2 | 0.0 | 3.1 |
| Item | Observation | Implication |
|---|---|---|
| Source | Original runs jointly evaluate all N-2 pairs and search points. | Burden increases sharply in stressed scenarios. |
| Peak | Failures occur mainly in 2033 peak cases. | Scenario hardness dominates, not a single modeling bug. |
| Retry | Timeouts selectively retried, and unstable pairs excluded from aggregation. | Final results reflect refined survivors rather than raw failures. |
| Coverage | In 2033 peak files, n2_pair_hits ranges from 1 to 7 across surviving candidates. | Coverage differences remain part of the reliability outcome. |
Disclaimer/Publisher’s Note: The statements, opinions and data contained in all publications are solely those of the individual author(s) and contributor(s) and not of MDPI and/or the editor(s). MDPI and/or the editor(s) disclaim responsibility for any injury to people or property resulting from any ideas, methods, instructions or products referred to in the content. |
© 2026 by the authors. Licensee MDPI, Basel, Switzerland. This article is an open access article distributed under the terms and conditions of the Creative Commons Attribution (CC BY) license.
Share and Cite
Kim, M.; Jung, M.; Im, H.; Lee, M.; Lee, D. The Optimal and Robust Siting and Ranking Framework for ESS and STATCOM Under 765 kV Double-Circuit N-2 Contingencies. Mathematics 2026, 14, 2921. https://doi.org/10.3390/math14162921
Kim M, Jung M, Im H, Lee M, Lee D. The Optimal and Robust Siting and Ranking Framework for ESS and STATCOM Under 765 kV Double-Circuit N-2 Contingencies. Mathematics. 2026; 14(16):2921. https://doi.org/10.3390/math14162921
Chicago/Turabian StyleKim, Minsoo, Minkyu Jung, Hyeonjun Im, Minyoung Lee, and Duehee Lee. 2026. "The Optimal and Robust Siting and Ranking Framework for ESS and STATCOM Under 765 kV Double-Circuit N-2 Contingencies" Mathematics 14, no. 16: 2921. https://doi.org/10.3390/math14162921
APA StyleKim, M., Jung, M., Im, H., Lee, M., & Lee, D. (2026). The Optimal and Robust Siting and Ranking Framework for ESS and STATCOM Under 765 kV Double-Circuit N-2 Contingencies. Mathematics, 14(16), 2921. https://doi.org/10.3390/math14162921