


Abstract
This research establishes a framework to evaluate how effectively financial institutions convert environmental, social, and governance (ESG) pressures into readiness for open innovation (EOIR). EOIR is conceptualized as a higher-order capability that encompasses environmental opportunity, social legitimacy, and governance discipline. This study employs a triangulated multi-criteria decision-making framework consisting of CRITIC, Shannon Entropy, and Fuzzy AHP weighting with MARCOS ranking, TOPSIS validation, and pillar-focused scenario analysis to evaluate ESG–open innovation readiness. Results inindicate the importance of governance practices, such as board independence, low controversies, and alignment with the Paris Agreement and environmental innovation. Data privacy outperforms representational social attributes. The MARCOS and TOPSIS rankings demonstrate a high degree of concordance; leaders maintain their stability across weighting philosophies, while mid-tier positions exhibit policy-sensitive mobility. Scenario analysis indicates a stable frontier, high top-10 overlap, and mid-teen rank shifts, highlighting actionable levers. The framework provides a transparent, reproducible multiple-criteria decision-making pipeline for EOIR measurement and clarifies important enablers, including credible governance, environmental technology alignment, and privacy-centric data governance, from a theoretical and practical perspective.
Keywords:
open innovation; ESG pressures; financial institutions; multi-criteria decision-making; scenario analysis; MARCOS; TOPSIS MSC:
90B50
1. Introduction
Sustainability is a multiparameter concept that aims at the well-being of society, the proper utilization of existing production resources, and the more environmentally responsible management of natural resources. This leads to both indirect and direct forms of guidance or pressure on companies to adapt to this framework and to modify parts of their business activity or operations. Since such adaptation is not straightforward, the complexity of this large-scale transition becomes evident, both from the side of governments and green initiatives as well as from the business sector. Within this context, the phenomenon of greenwashing emerges as a (negative) consequence of companies’ reaction to increasing environmental pressures [1]. In light of the above, it becomes clear that the complexity of the sustainable transition requires more integrated theoretical and practical approaches. However, the dynamics of sustainability are both strong and continuously increasing, and consequently, significant efforts are being made by intergovernmental bodies and green organizations to address these challenges and to further promote the broader and essential concept of sustainability. In this study, we examine a factor that may contribute to the normalization of this complexity and the corresponding pressures, namely, the open innovation process [2]. In other words, the purpose of this research is to investigate a mechanism that can act as a catalyst between sustainability and the adaptive capacity of organizations. More precisely, it establishes a decision-analytic framework to investigate the processes by which financial institutions convert environmental, social, and governance (ESG) pressures into open innovation readiness.
The investigation is located within the context of research on the co-evolution of technology, markets, and institutional complexity [3,4]. It addresses readiness as a multidimensional capability [5] that is the result of the coordinated alignment of environmental opportunity [6], social legitimacy for collaboration [7], and governance mechanisms [8] that facilitate adaptive learning and credible commitment. Consequently, the concept of preparedness acquires a systemic character, linking institutional pressures and innovative outcomes.
The concept of open innovation readiness (EOIR) based on the ESG criteria is conceived as a configurational capability of a higher order, rather than a singular attribute.
Institutions are prepared for open innovation when they simultaneously achieve the following objectives:
(a) Align technologies and portfolios with environmental opportunities: The adoption of clean technologies, combined with the alignment of investment portfolios with the climate targets of the Paris Agreement, gradually contributes to reducing financed emissions and increasing green investments. In this way, technological strategy and the financial support for the environmental transition operate in a coordinated manner, reinforcing sustainable development [9,10]. Furthermore, the increased use of renewable energy sources (RES), both in institutional infrastructure and in the energy consumption of financial organizations, further strengthens this environmental alignment [11]. Therefore, the environmental dimension is not confined to isolated practices, but is directly associated with a broader strategic technological trajectory, a critical element for any model of open innovation.
(b) Establish the social prerequisites for collaboration and data sharing: This axis concerns the effective utilization of a dynamic and increasingly significant component of modern entrepreneurship: diversity and inclusion. It reflects the healthy interaction among human values within the workplace, with respect for individual differences in culture, origin, skills, and knowledge [12]. The inclusion and acceptance of such diversity contribute not only to ensuring human values in the professional environment but also to the smooth and evolving functioning of the organization. Understanding the diversity embedded in the market is more effectively achieved and decoded through the diversity of the workforce. Within the context of open innovation, diversity and inclusion motivate human resources to better understand market needs, thereby supporting improved decision-making and enhanced productivity [13]. Therefore, in the context of open innovation, it is very important to respect the protection of personal data and privacy, acting as an aid to employee security and trust [14].
(c) Institutionalize governance arrangements that facilitate complexity and support credible commitment: The independence of the board of directors plays an important role in a company’s readiness for open innovation. The strength of this independence acts as a point of attraction for external partners and stakeholders, enabling a two-way exchange of knowledge, ideas, and shared objectives [15]. Another important factor in reducing governance-related complexity is the avoidance of conflicts that could harm the company’s reputation. Such situations can either reinforce or undermine public perception of the firm and therefore require careful oversight, as they directly influence external collaborations [16]. Finally, formal sustainability oversight by government bodies ensures the proper implementation of ESG indicators and, consequently, the tangible achievement of the company’s strategic goals [17]. Thus, the governance pillar functions as a stabilizing mechanism that reduces internal uncertainty within financial institutions. At the same time, it supports the continuity of collaboration both internally and externally, elements that constitute fundamental characteristics of readiness for open innovation.
We therefore observe that readiness for open innovation arises as an extension of the broader ESG strategy, given that its three main axes, environmental, social and corporate governance, converge into a shared and collaborative framework. An effective alignment of technology and investment portfolios can generate a more holistic effort toward an open and sustainable economy, while also contributing to the optimization of regulatory principles and long-term sustainability dynamics. Finally, the coordination and alignment of the values discussed above naturally introduce an additional layer of complexity into our methodological model. The above-mentioned alignment and coordination of the ESG pillars presuppose the use of a multi-criteria method capable of responding to this objective. A core requirement is the ability to synthesize multiple ESG parameters into a single, comparable indicator, namely, the EOIR index.
To date, prior studies have investigated ESG performance, sustainability disclosure, corporate governance, environmental accountability, social legitimacy, and open innovation as significant but mostly distinct study domains. ESG research has mostly concentrated on measurement reliability, reporting quality, greenwashing, financial performance, and consequences particular to each pillar, while open innovation research has highlighted cooperation, information sharing, trust, and digital innovation ecosystems. Nonetheless, little focus has been directed toward the conversion of ESG demands into organizational preparedness for open innovation, particularly within the banking industry. The current research is deficient in a cohesive theoretical and empirical framework that elucidates how environmental alignment, social legitimacy, and governance discipline influence a firm’s ability to participate in collaborative and open innovation processes.
This study fills the gap by presenting the idea of ESG–open innovation readiness (EOIR) as an advanced configurational capacity. The paper’s originality is attributed to three primary contributions. Initially, it conceptualizes EOIR as a conduit between ESG demands and open innovation preparedness, thus linking two study domains that had traditionally been considered in isolation. Secondly, it implements this notion via a transparent MCDM-based EOIR index that incorporates twelve ESG-related factors spanning the environmental, social, and governance dimensions. Third, it substantiates the EOIR framework via triangulated weighing, MARCOS ranking, TOPSIS comparison, and policy-oriented scenario analysis, ensuring both methodological rigor and practical interpretation. This research transcends the isolated assessment of ESG performance and open innovation potential, presenting a novel decision-support framework for evaluating how financial institutions transform ESG demands into collaborative innovation readiness.
Methodologically, to quantify a multi-parametric concept such as EOIR, we adopt the MCDM model, a method that incorporates multiple and heterogeneous criteria and produces a unified, comparable indicator [18]. In this context, the twelve selected ESG criteria used in this study undergo a three-stage process: weighting, aggregation, and validation, ultimately leading to the construction of the single EOIR index.
The paper is organized as follows. Section 2 presents the related literature and identifies the research gap examined in this study. Section 3 describes and analyzes the proposed methodology for constructing the EOIR index, including the details of the MCDM framework. Section 4 presents the empirical findings and highlights the key results. Section 5 discusses the interaction between the core problem addressed in this study and the empirical outcomes, and also provides remarks for future research. Finally, Section 6 summarizes the main results and outlines the practical implications for the financial sector.
2. Literature Review
This study adopts a multi-criteria approach in data collection and processing, as well as in its overall methodological structure. The choice of this approach derives from the need to connect ESG pressures and the readiness of financial institutions for open innovation. Accordingly, this section provides the bibliographic foundation of the multiple dimensions of the topic under investigation. In this direction, a coherent bibliographic framework is established, supporting both the theoretical foundation and the empirical objectives of the study.
Initially, a large part of the literature discusses whether quantitative approaches to measuring ESG indicators are sufficiently reliable, and whether they accurately reflect the actual realization of organizational sustainability performance. Mishra and Pandey [19] address this issue across four main directions: (a) the problematic methodological foundation of ESG research, (b) the geographical concentration of studies in developed economies, (c) the theoretical fragmentation of the field, (d) a large corporation focus. These weaknesses often lead to the well-known phenomenon of ‘washing’. Moreover, the study combines the framework of measuring ESG indicators within the broader context of Triple Bottom Line and Sustainable Development Goals to explore the relationship between environmental sustainability and corporate performance. Sahin et al. [20] introduce a new ESG pillar, the so-called Missing pillar, to capture missing ESG information and improve the interpretation of ESG scores. The next review articles provide a theoretical foundation for the Triple Bottom Line (Anrafel et al. [21]) and Sustainable Development Goals (Shauhrat et al. [22]), with the aim of developing a more meaningful and reliable assessment of ESG performance based on higher quality and more representative data. This foundation is critical, as data quality becomes even more essential when embedded in multi-criteria methodologies, as in the EOIR index proposed in this study. In this context of appropriate data selection for assessing ESG pressures in the sustainability domain, our study focuses on listed financial institutions covered by Refinitiv ESG, using the most recent stable period to balance data reliability and recency. All entities are anonymized to ensure confidentiality and to prevent any potential reputational inference. Moreover, from a methodological point of view, we employ multiple verification mechanisms through scenario analysis, thereby strengthening the validity of the EOIR index. This ensures that the resulting outcomes are neither driven nor distorted by the specific methodological choices. Let us now discuss the three pillars of the Triple Bottom Line, people, planet, and profit, and how these pillars are connected to our research goal. Starting with the review study of Jámbor [23], it examines whether information related to the social pillar, which largely derives from Corporate Social Responsibility (CSR), is sufficiently collected and used by researchers to enable accurate representation and interpretation of ESG indicators, especially the S dimension. Updating the previous binary CSR-ESG concept, the study of Moreira et al. [24] examines the role and impact of Sustainable Human Resource Management (SHRM) within the ESG and Global Reporting Initiative (GRI) reporting systems. The authors argue that Human Resource Management (HRM) should be more deeply integrated into corporate sustainability strategies and that this integration is achievable through the principles and practices of SHRM. This integration highlights the long-term significance of human capital, as a foundational element supporting both the sustainable transition and readiness for collaborative innovation.
Let us now proceed to the investment framework related to the social pillar within ESG and its interaction over time. More precisely, in the study of Potharla et al. [25], the ‘S’ pillar is measured through metrics such as community engagement, adherence to human rights, customer loyalty, consumer health and safety protection, and employee welfare. Using Panel data regression with industry-year fixed effects, the authors conclude that the stronger the social issue management of firms, the higher the synchronization of their stock prices with market movements. However, the dynamics of the social pillar, compared to the Environmental pillar, showed a rapid increase during the period 2013–2022. The study of Yusifzada et al. [26], using a dataset from the Morgan Stanley Capital International (MSCI) All Country World Index (ACWI) covering the same period, provides evidence that the number of firms with higher Environmental scores relative to social scores was greater than those with higher social scores. However, from the pivotal year 2016 onward, the scores of the two pillars began to converge, indicating that financial markets started to assign equal importance to both. In this way, the importance of balancing social and environmental goals is highlighted, ensuring that this equilibrium is fully integrated into the dynamics of the ‘E’ and ‘S’ of ESG. This finding supports the gradual convergence of the environmental and social pillars, a convergence that reinforces the development of trust and collaborative relationships, which are fundamental characteristics of open innovation.
In the environmental scope, the problem of unpublished information, and, by extension, the unreliability of ESG measurements, remains evident, as previously, we noted in the case of the Social pillar. Despite the growing significance of the environmental pillar, particularly with the rapid increase in technology, Senadheera et al. (2021) [27] argue that the assessment of the ‘E’ pillar does not accurately reflect the actual environmental performance of companies. The study of Trahan et al. [28], proposes a five-point framework (embrace electrification, anticipate cycles of adoption and development, evaluate the economic and social purposes of goods and services, employ substitution analysis, invest to understand socio-technical pathways) aimed at redefining the Environmental pillar in light of contemporary socio-technical systems that influence emission patterns. Specifically, the authors conclude that the Environmental pillar has been largely confined to the parameter of carbon emission reduction, whereas it should be expanded to include a wide range of environmental metrics that better represent the complexity of environmental sustainability. Therefore, while the accurate representation of the environmental pillar remains complex and challenging to assess in its true essence, its influence on both corporate and financial performance is now empirically observable. The complexity of the environmental pillar is further highlighted by the fact that extreme environmental events may also affect financial and economic stability, Breeden [29]. This need for further investigation represents an important insight for research exploring the multidimensional impact of environmental pressures, a domain to which the present study also contributes. The measurable impact of the environmental pillar, used as a proxy for environmental corporate social responsibility, is illustrated by Agliardi et al. [30], who found that the low-rated companies tend to achieve higher financial returns but face increased financial risk, reflected in higher return volatility and deeper maximum drawdowns. In the same research framework and along the main axis of the environmental pillar, but extending into the field of corporate performance, the work of Li et al. [31] identifies a positive correlation between ESG pressures and firms’ efficiency and competitiveness. Researching a large sample of Chinese companies operating in highly polluting industries, both the study of Li et al. [31] and the previous one by Agliardi et al. [30] highlight the significant influence of the environmental pillar, particularly in reflecting the positive and negative inverse correlations observed between financial institutions and businesses, especially within the digital era in which they operate. Therefore, as indicated by the last two studies, environmental pressures influence both corporate and financial behavior, constituting a critical determinant of organizations’ readiness for open innovation.
The last pillar is related to governance, which is often identified mainly with corporate governance. In fact, this is a perspective that needs to be reconsidered, as suggested by Guilherme et al. [32], who attend to explore this identification at two interconnected levels: corporate governance and governance mechanisms for sustainability. This combination is more closely associated with ESG parameters, as it connects corporate governance practices with broader sustainability governance. In this way, governance assumes an expanded role that transcends traditional administrative oversight and aligns with the broader collaborative orientation and readiness required for open innovation. However, the systematic work of Lagasio et al. [33] focused on the first level identified by Guilherme et al. [32], examining the impact of corporate governance structures on ESG reporting. Given the voluntary nature of ESG disclosure, this study applies a meta-analysis to the following governance domains: board independence, meeting frequency, ownership structure, size, CEO duality, family ownership, gender and institutional investors, and state ownership.
Finally, according to their findings, they conclude that the governance mechanisms that lead to better ESG metrics are board independence, board size, and female directorship. Moreover, the authors point out that to achieve even stronger ESG outcomes, new and more innovative approaches to governance are needed. This suggests that governance is not a static construct; instead, it operates as an evolving mechanism for adapting to ESG pressures. This conclusion is essentially close to the findings of the research by Guilherme et al. [32]. Specifically, both Lagasio et al. [33] and Guilherme et al. [32] support the need for a broader mechanism to assess ESG pressures, going beyond the boundaries traditionally defined by corporate governance. This convergence underscores the role of the Governance pillar as a central coordinating mechanism within the ESG structure, thereby strengthening the readiness of financial institutions for open innovation. This motivation continues through studies that explore different aspects of corporate governance mechanisms, such as the work of Arici et al. [34], which examined the role of CEO duality not only in relation to corporate governance but also in connection with ESG pressures under various board characteristics (policy executive compensation performance, policy executive compensation ESG performance, CEO duality, board independence and size) and financial indicators (return on invested capital, return on assets). Using machine learning techniques and data from the hospitality and tourism (H&T) industry provided by Thomson Reuters Eikon, the authors concluded that CEO duality mainly affects the environmental pillar negatively. In addition, effective governance strategies related to policy executive compensation performance, policy executive compensation ESG performance, and return on invested capital are positively associated with overall ESG scores.
These findings indicate that governance can either enhance or hinder ESG alignment, depending on its underlying structure and practices. Therefore, the appropriate alignment of the E, S, and G pillars emerges as a critical factor for the effective functioning of the overall ESG framework. Another study related to the direct correlation between the governance and environmental pillars is that of Bai et al. [35]. The authors demonstrate that a 1% improvement in the governance index strengthens the environmental index by increasing private participation in green projects by 0.34% in the short term and 0.64% in the long term. This finding empirically demonstrates that governance plays a direct and measurable role in advancing the green transition. When we combine this study with the previous one by Arici et al. [34], we observe that the governance pillar does not operate in isolation, but rather functions as a hub of cooperation and overall sustainability coordination. That is, governance functions as a central coordinating mechanism that links the parameters of the E and S pillars.
Therefore, and in view of the aforementioned literature, the question arises as to whether the governance pillar implements a multidimensional operational framework, one that incorporates transparency, collaboration, trust, knowledge transfer, accountability and digital integration, both externally and internally, while simultaneously aligning with the parameters of the environmental and social pillars. Equivalently, the environmental and social pillars interact through feedback mechanisms of coordination and cooperation, forming an integrated system that advances sustainability. This framework aligns directly with the principles of open innovation and leads to the main goal of this study, that is, to examine whether, and to what extent, ESG pressures can effectively guide financial institutions toward open and collaborative innovation.
However, open innovation remains an evolving issue in the literature, especially regarding its interaction with ESG. For example, the work of [36] bibliographically supports the idea that trust among partners plays a major role in open innovation settings, while trust is also a major characteristic of the ESG field. Additionally, open innovation acts as a bridge between companies’ internal knowledge and external knowledge and capabilities, through relationships developed between organizations [37]. Moreover, recent evidence indicates that financial inclusion, development, and technological innovation contribute to ESG readiness, particularly in low- and middle- income countries, Guo et al. [38]. There is also a growing connection between the open innovation framework and Artificial Intelligence. That is, Artificial Intelligence-based platforms can optimize decision-making processes and foster joint innovation activities within innovation ecosystems, including the development of new products, services, and prototypes [39,40]. Despite the need for further exploration to clarify the aspects and organizational conditions of open innovation, companies are required to become more receptive to open innovation-related practices as an important resource for their growth and competitiveness. This need emerges from the increasingly complex market environment characterized by complex products, changing market demands, and stakeholder pressures [41].
Practical Problem and Methodological Justification
Financial institutions are confronted with the practical challenge of simultaneously addressing the demands of stakeholders, regulatory expectations, technological transition requirements, and the demand for more collaborative and open innovation models, which are all influenced by a variety of ESG pressures. Nevertheless, it is somewhat difficult to reduce these pressures to a singular performance indicator. The development of environmental alignment, social legitimacy, data protection, governance credibility, and innovation capacity may be uneven across institutions and may also involve trade-offs. Regulators, managers, and stakeholders require a decision-support framework that can convert fragmented ESG data into an interpretable indicator of open innovation readiness. This practical necessity justifies the implementation of a multi-criteria decision-making methodology. Due to their ability to identify the informational structure of the data and mitigate arbitrary weighting, CRITIC and Entropy are suitable metrics. By including theoretically informed judgment under uncertainty, Fuzzy AHP complements these objective methods. MARCOS is employed to generate the primary EOIR ranking due to its ability to conduct a transparent utility-based comparison with ideal and anti-ideal benchmarks. TOPSIS evaluates the stability of the ranking under an alternative distance-based logic. Scenario analysis concludes by acknowledging the practical reality that policy priorities may shift toward environmental, social, or governance concerns. Therefore, the chosen methodologies are not merely technical instruments; they are also directly relevant to the practical issue of assessing the extent to which financial institutions are able to transform ESG pressures into open innovation readiness.
From a methodological point of view, and in order to quantify the idea of establishing a decision-analytic framework to investigate the processes by which financial institutions convert ESG pressures into open innovation readiness (EOIR), we apply a triangulated MCDM approach. Specifically, this approach consists of the CRITIC, Shannon Entropy, Fuzzy AHP, MARCOS, and TOPSIS. The first stage of the methodology involves the determination of a triangulated weighting strategy that includes two objective procedures, CRITIC and Shannon Entropy, and a literature-informed procedure, Fuzzy AHP. CRITIC captures contrast and correlation intensity. The method measures the informational value of a criterion through the combined effect of its dispersion and its level of conflict with other criteria [42]. Shannon Entropy reflects dispersion-based objectivity by evaluating the evenness of a criterion’s distribution across alternatives [43,44]. Fuzzy AHP is a complexity-aware method that incorporates theoretical structures and preference judgments under conditions of uncertainty in a manner that mitigates linguistic ambiguity through fuzzy pairwise comparisons [45]. The second stage aims to determine EORI readiness through the application of two ranking methods, MARCOS [46] and TOPSIS [47]. More precisely, the MARCOS method assesses the ESG–open innovation readiness of financial institutions. TOPSIS is employed to validate the robustness of the resulting rankings, ensuring in this way the reliability of the results. Then, a scenario analysis is performed. It investigates counterfactual reallocations of importance across the ESG pillars, maintaining the relative trade-offs among criteria within each pillar. Finally, the robustness of the EOIR framework is evaluated through metric concordance, weighting-scheme sensitivity, policy displacement, and data integrity. This step supports the stability and reliability of the resulting rankings under alternative methodological assumptions and weighting philosophies.
3. Materials and Methods
3.1. Research Design
This research establishes a decision-analytic framework to investigate the processes by which financial institutions convert ESG pressures into open innovation readiness. The investigation is located within the context of research on the co-evolution of technology, markets, and institutional complexity. It addresses readiness as a multidimensional capability that is the result of the coordinated alignment of environmental opportunity, social legitimacy for collaboration, and governance mechanisms that facilitate adaptive learning and credible commitment.
ESG–EOIR is defined as a high-order configurational capability rather than a single-dimensional key feature. Financial organizations demonstrate readiness for open innovation when they simultaneously (i) align their technological infrastructure and investment strategies with environmental opportunities, such as adopting clean technologies, complying with Paris Agreement targets and increasing renewable intensity, (ii) cultivate the social foundations necessary for collaboration and data sharing, such as inclusion, diversity, and robust privacy safeguards, and (iii) establish governance structures that reduces the complexity and support credible long-term commitment, such as board independence, controversy avoidance and formal sustainability oversight.
The MCDM paradigm is justified on both conceptual and measurement principles from a methodological perspective. Conceptually, EOIR consists of complementary yet non-commensurate dimensions whose effects are interdependent and partially compensatory. Reducing it to a singular proxy would understate these interactions. MCDM facilitates the disciplined aggregation of heterogeneous indicators through explicit weighting and ranking, while also facilitating triangulation between objective, dispersion-based weights and expert-informed ambiguous judgments, from a measurement perspective. The resulting index is transparent with observable weights and transformations. It is reproducible, since inputs and operators are fully documented. Finally, it is analytically testable through robustness assessments involving alternative weighting schemes and policy-sensitive scenarios that reallocate emphasis across pillars.
Empirically, the framework is implemented for listed financial institutions that are covered by Refinitiv ESG, with a concentration on the most recent stable horizon to reconcile reliability with recency (Figure 1). Entities are anonymized to protect confidentiality and reduce reputational inference. Table 1 provides precise definitions, Refinitiv source fields, and measurement units for the ESG-related indicators used in the EOIR framework. These indicators are mapped to the three EOIR pillars. This coding scheme enables the parsimonious presentation of results, supports replication and secondary analysis, and facilitates formal elucidation through matrix representation, optimization procedures, and sensitivity analyses.
Figure 1.
Methodological framework for EOIR assessment.
Table 1.
Criteria dictionary.
3.2. Data and Variable Construction
The empirical setting comprises listed financial institutions that are covered by Refinitiv ESG over the fiscal years 2022–2024, a horizon that strikes a balance between measurement stability and recency. In order to facilitate concise notation and reproducibility, all indicators are designated E1–G4, and all entities are anonymized as fin_01, …, fin_m. Data preparation and management were performed using Microsoft Excel, while the statistical analyses were carried out using R version 4.5.1.
Four principles were employed to direct the selection of the twelve criteria. Initially, each criterion was required to be theoretically connected to the EOIR construct, which means that it should reflect an enabling condition that enables ESG pressures to support open innovation readiness. Secondly, the criteria were required to ensure that the three ESG pillars were adequately represented, with a focus on environmental alignment, social legitimacy, and governance discipline. This was achieved by avoiding over-representation of any one dimension. Third, the indicators had to be comparable and observable across listed financial institutions in Refinitiv ESG during the 2022–2024 period. Fourth, the criteria must be comprehensible within an MCDM framework, with a clear direction in terms of cost or benefit. This led to the selection of four indicators for each ESG pillar, resulting in a balanced but sparse set of twelve criteria. The objective was not to encompass every conceivable ESG or innovation-related variable, but rather to develop a decision-support model that was operational, transparent, and reproducible for the assessment of ESG–open innovation readiness.
The coded criteria, their pillar assignments (E, S, and G), the precise Refinitiv field names, the units and scales, and the benefit-versus-cost direction required for normalization are reported in Table 1. Twelve indicators, four per pillar, are selected for conceptual coverage, observability, and cross-firm comparability in the operationalization of the EOIR construct.
The environment criteria were chosen because they accurately represent the technological and transition-oriented conditions that financial institutions employ to address climate and sustainability pressures. E1 is considered a cost criterion that reflects changes in direct emissions intensity, as lower emissions-intensity growth indicates more robust environmental adaptation.
E2 reflects the credibility of the climate transition by capturing alignment with the Paris Agreement targets. E3 denotes the utilization of renewable energy sources, which suggests dedication to the low-carbon transition, while E4 encompasses environmental innovation and a clean-technology orientation, which serves as a direct link between ESG performance and innovation readiness.
The social criteria were chosen due to the fact that open innovation is contingent upon responsible data-sharing conditions, inclusive human capital, trust, and collaboration. S1 and S2 are indicative of diversity and inclusion, which are linked to organizational openness, collaborative capacity, and broader knowledge bases. S3 is particularly crucial for financial institutions due to the increasing involvement of digital platforms, stakeholder trust, and information exchange in open innovation. It is capable of capturing data privacy and security. S4 is indicative of customer-oriented accountability and product responsibility, which are pertinent to external collaboration and legitimacy.
The governance criteria were chosen due to the institutional discipline that governance mechanisms provide, which is essential for the coordination of ESG pressures and the maintenance of credible open innovation processes. The board’s independence is captured by G1, which promotes external confidence and oversight. The composite ESG score, G2, is a powerful tool for institutional sustainability performance management, as it reflects the overall maturity of ESG management. G3 indicates the formality of ESG oversight by capturing the presence and strength of sustainability committee structures. The cleanliness of ESG controversy is reflected in G4, which is significant because reputational controversies can erode stakeholder trust and diminish the willingness of external partners to participate in open innovation. Collectively, these twelve criteria offer a fair operational representation of EOIR in terms of environmental opportunity, social legitimacy, and governance discipline. For institution and criterion , raw annual observations for are aggregated by a three-year average to mitigate idiosyncratic disruptions,
where the denominator is adjusted if one year is absent as indicated in the Appendix A. The rows of the decision matrix correspond to financial institutions, while the columns correspond to the twelve EOIR criteria. Thus, each criterion is scaled independently across all institutions i = 1, …, m, as all normalization operations are conducted column-wise. The raw values are rescaled to the common interval [0, 1] by utilizing the minimum and maximum observed values for each column. This procedure enables the comparison of heterogeneous criteria across the EOIR framework, while also preserving comparability across institutions within the same criterion. The min–max normalization by criterion is used to transform the averaged matrix to [0, 1]. Regarding the benefit criteria,
and for the sole cost criterion (E1),
Consequently, the column-wise calculation does not aggregate institutions at this time. Rather, it transforms each criterion individually to ensure that all values are expressed on a scale that is consistent in direction. Stronger EOIR readiness is indicated by higher normalized values for benefit criteria. The transformation is reversed for the cost criterion E1, resulting in a higher normalized score for lower emission-intensity growth. Following this stage, all columns are interpreted as benefit-oriented criteria and can be consistently employed in the weighting and ranking processes.
The two transformations belong to the standard linear max–min normalization family commonly used in MCDM studies to place heterogeneous criteria on a comparable scale. The benefit criteria are evaluated using the initial expression, which indicates that higher raw values correspond to superior performance. The second expression is applied to cost criteria, wherein lower basic values indicate superior performance. The authors did not originate it; rather, it is the reversed min–max transformation, which is algebraically equivalent to
This transformation converts the minimum observed value, which is the optimal cost value, to 1 and the maximum observed value, which is the worst cost value, to 0. This study exclusively employs it for E1, as it is preferable to have a lower Scope-1 emissions intensity year over year. Following this direction adjustment, all criteria are expressed as benefit-oriented indicators and can be consistently aggregated in the subsequent weighting and ranking procedures.
Columns with no empirical range are retained; however, they are identified as uninformative for dispersion-based weights. Any residual missing values after scaling are imputed with the column mean of ,
where indexes observed entries for criterion and . Additional winsorization was eliminated using three-year averaging and min–max scaling; however, empirical ranges and coverage ratios are documented for transparency. The classification scheme for institutions and criteria, the metadata in Table 1, and the resulting matrix serve as a scale-consistent, direction-aware, and entirely reproducible foundation for the subsequent weighting–ranking analyses.
3.3. Weighting Schemes
The study employs a triangulated weighting strategy that includes two objective procedures, CRITIC and Shannon Entropy, and one expert- and literature-informed procedure, Fuzzy AHP. This combined approach reduces method dependence and incorporates both statistical evidence and theoretically grounded judgment. The three weight vectors are reported and compared in Table 2. They are subsequently employed to produce robustness diagnostics and complementary rankings.
Table 2.
Comparison of criterion weights across CRITIC, Fuzzy AHP, and Entropy methods.
It is important to note that the term “triangulated weighting strategy” does not necessarily mean that the three weight vectors are averaged into a single composite vector. The baseline model does not employ an arithmetic mean or an equal division of the weights of CRITIC, Entropy, and Fuzzy AHP. Rather, the three methodologies are regarded as parallel weighting philosophies. The primary data-driven baseline is provided by CRITIC, which takes into account both criterion dispersion and inter-criterion conflict. Entropy is employed as an additional objective criterion that is solely based on distributional dispersion, whereas Fuzzy AHP offers a comparison that is informed by theory and expert opinion in the presence of uncertainty. It is then employed as a robustness test to compare the rankings across these three weighting schemes. This design prevents the imposition of an arbitrary equal contribution of the three methods and enables the evaluation of the stability of EOIR rankings under distinct epistemic assumptions. Formally, let denote the normalized decision matrix for institutions and criteria. The objective of weighting is to obtain a vector with and and, such that is informationally and theoretically defensible for aggregating .
Let us start with the first procedure, CRITIC, which captures contrast and correlation intensity. It quantifies the “informativeness” of a criterion as the combined manifestation of (i) contrast, operationalized by its dispersion, and (ii) conflict, operationalized by its low collinearity with other criteria. Let be the standard deviation of and the Pearson correlation matrix across criteria. The information content of criterion is
where the CRITIC weight is
Equations (1) and (2) prioritize criteria that are both discriminating (large ) and non-redundant (small ), a desirable characteristic in multi-dimensional preparedness assessments.
Secondly, Shannon Entropy measures dispersion-based objectivity. It isolates the evenness of a criterion’s distribution across alternatives is isolated by Entropy. For this purpose, let
and with alternatives, the Entropy components are computed as
which leads to the Entropy weight
In contrast to CRITIC, Entropy abstracts from inter-criterion correlation, thereby offering a complementary “pure dispersion” benchmark. The Fuzzy AHP procedure was predicated on the evaluations of an independent expert council consisting of 3 experts who were not members of the author team. The experts were chosen for their professional or academic expertise in ESG assessment, sustainable finance, open innovation, and multi-criteria decision-making. To prevent conflicts of interest, none of the experts were involved in the authorship, data processing, empirical classification, or interpretation of the final results. Their responsibilities were restricted to the provision of pairwise judgments for the FAHP comparison matrices. The geometric mean, which is frequently employed in group AHP/FAHP contexts to synthesize expert preferences while maintaining reciprocal comparison properties, was employed to aggregate the individual judgments.
The Fuzzy AHP calculation followed four steps. First, each expert completed pairwise comparisons at two levels: the pillar level and the within-pillar criterion level . Second, the linguistic judgments were converted into triangular fuzzy numbers , where , , and denote the lower, modal, and upper bounds of the fuzzy preference value. Third, the individual expert matrices were aggregated using the geometric mean in order to obtain one collective fuzzy pairwise-comparison matrix for each level of the hierarchy. Fourth, the fuzzy priorities were derived, defuzzified using the centroid method, and normalized so that the weights summed to one.
The global Fuzzy AHP weight of each criterion was obtained by multiplying its local within-pillar weight by the corresponding pillar weight:
where denotes the Fuzzy AHP weight of pillar , and denotes the local Fuzzy AHP weight of criterion within that pillar. This procedure produced the final Fuzzy AHP criterion weights reported in Table 2.
Consistency checking was also implemented to confirm the logical reliability of the pairwise comparisons. The aggregated fuzzy comparison matrices were initially defuzzified into equivalent crisp matrices using the centroid value, as the original judgments were expressed as triangular fuzzy numbers:
The standard AHP consistency procedure was then applied to each defuzzified matrix. For each matrix, the maximum eigenvalue , the consistency index , and the consistency ratio were calculated as follows:
where is the size of the pairwise-comparison matrix and is Saaty’s random index. A matrix was considered acceptable when . The pillar-level comparison matrix and the three within-pillar comparison matrices were subjected to this threshold. The final FAHP weights were derived exclusively from matrices that satisfied this consistency condition. Thirdly, Fuzzy AHP, a complexity-aware and expert-informed method, is employed to incorporate theoretical structure and expert input under uncertainty. To incorporate theory and expert judgment in a manner that is resistant to linguistic ambiguity, we implement a two-level hierarchy involving the pillars E, S, and G, and their corresponding criteria, E1 through G4. This hierarchy utilizes triangular fuzzy numbers (TFNs). for pairwise preferences. TFN arithmetic follows
The fuzzy synthetic extent for row in a pairwise TFN matrix is determined using Chang’s extent analysis as follows:
Weights are determined through centroid defuzzification and normalization:
Global FAHP weights for E1–G4 are obtained by multiplying pillar weights with within-pillar local weights. In accordance with the governance of open innovation under institutional complexity, the pillar comparisons encode G > E > S. Local priorities emphasize environmental alignment and innovation within E (E2, E4), data privacy and inclusion within S (S3, S2), and controversy cleanliness and board independence within G (G4, G1). The numeric weights that result are reported in the following Table 2 and decomposed in Appendix A. The global Fuzzy AHP weights across the E/S/G taxonomy are illustrated in Figure 2.
Figure 2.
Polar radial bars of Fuzzy AHP global weights.
In conjunction, CRITIC and entropy offer data-driven baselines that acknowledge the configurational nature of EOIR and reward dispersion, and in the case of CRITIC, also penalize redundancy. Meanwhile, Fuzzy AHP provides a theory-concordant alternative. The stability of rankings under policy-sensitive scenarios and across these weighting philosophies is assessed in the subsequent sections.
3.4. Ranking Models
Considering the direction-consistent, min–max-scaled matrix (cf. Section 3.2) and a probability weight vector obtained in Section 3.3 with , as well as ESG–open innovation in its entirety, a principal additive geometry (MARCOS) and a validation geometry (TOPSIS) are employed to determine readiness.
The coded criteria (E1–G4) are incorporated into MARCOS by a partially compensatory aggregation logic, whereas TOPSIS assesses the proximity to the ideal profile in a weighted Euclidean metric. In contrast to empirical claims that all ESG weaknesses can be fully offset by strengths in other criteria, the compensatory structure implemented in MARCOS and TOPSIS is regarded as a modeling assumption. In the present investigation, EOIR is interpreted as a readiness index, rather than as a compliance or ethical sustainability score. As a result, partial compensability is deemed to be acceptable, as institutions may achieve open innovation readiness through various ESG configurations, such as stronger governance discipline, environmental technology alignment, or social trust mechanisms. However, the framework does not presuppose an infinite substitution among ESG pillars.
In the model, all environmental, social, and governance criteria are maintained, and the stability of rankings is assessed through alternative weighting schemes, TOPSIS validation, and ESG pillar scenario analysis. The implementation of these procedures assists in determining whether rankings are unduly influenced by a single compensating dimension. The ideal and anti-ideal are equivalent to 112 and 012, respectively, since all criteria are expressed as benefits on [0, 1].
The utilization of compensability in this investigation should be perceived as controlled and restricted, rather than unlimited. Full compensability may be problematic in ESG assessments, as strong performance in one pillar should not entirely compensate for severe weaknesses in another. Nevertheless, the current study does not employ EOIR as a compliance score or as a claim of absolute sustainability performance. Rather, EOIR is designed as a decision-support index for benchmarking open innovation readiness. Partial compensability is appropriate in this context, as financial institutions may increase their preparedness through various ESG configurations that are related, including environmental technology alignment, stronger governance discipline, or social trust mechanisms.
The framework implements numerous safeguards to mitigate the risk of excessive substitution among criteria. Initially, the criteria are arranged according to the three ESG pillars to ensure that the environmental, social, and governance dimensions are all represented. Secondly, the aggregation procedure is not omitted from any criterion following normalization. Third, scenario analyses and alternative weighting schemes are implemented to determine whether the rankings are excessively contingent upon a single ESG pillar or methodological assumption. Consequently, compensability is employed solely as a transparent aggregation mechanism for comparative preparedness assessment, while the robustness and scenario analyses evaluate the stability of the results under alternative ESG priorities.
- A.
- MARCOS (primary aggregation). The additive utility of an institution is
In the context of benefit orientation, accepts interpretation as a portion of ideal attainment, and monotonicity is present in each for fixed .
- B.
- TOPSIS (validation via proximity to the ideal). With the same and , distances to the ideal and anti-ideal are as follows:
Larger denotes a closer proximity to the ideal and a further distance from the anti−ideal, provided that the same trade-off structure .
Regarding comparative properties and diagnostics, indices and lie on , enabling direct comparability across weighting philosophies. Both are isotone in for a fixed w, ensuring that advances in any criterion strictly increase the aggregate score. Internal evidence is obtained by assessing whether rank inferences are not artifacts of the aggregation geometry by quantifying the concordance between MARCOS- and TOPSIS-induced orders using Spearman’s and Kendall’s .
3.5. Scenario Analysis
The current analysis framework investigates counterfactual reallocations of importance across pillars while maintaining within-pillar trade-offs. Let denote a baseline, probability-normalized weight vector over the 12 coded criteria (E1–G4), and let index the focal pillar. Denote by the set of criteria belonging to pillar and by its complement. A target share (set to in the empirical exercises) is assigned to pillar , with the residual share distributed across proportionally to their baseline weights. The resulting scenario weights are defined criterion-wise as
Equation (13) ensures the following: (i) the preservation of total weight mass, (ii) the invariance of relative trade-offs within pillars, and (iii) controlled, policy-motivated adjustment in between-pillar emphasis.
Moreover, three substantive lenses are taken into account: Governance pressure , Social inclusion , and Green drive . For each scenario, MARCOS indices are recomputed using the scenario-specific weight vector . Let denote the baseline rank of institution , and let indicate its rank under scenario . The scenario-induced rank displacement is defined as
Equation (14) quantifies the magnitude and direction of each institution’s movement in response to a specific policy scenario. A negative value suggests that the institution’s ranking position has improved, as it has moved closer to the top of the ordering. A value of zero indicates complete rank stability, while a positive value indicates a decline in ranking position.
The mean absolute displacement is calculated to provide a summary of the aggregate magnitude of policy-induced rank mobility:
The average absolute rank shift across all institutions under scenario P is captured by Equation (15), regardless of whether institutions move upward or downward. Lower values suggest that the EOIR ranking is relatively stable under the corresponding policy reweighting, whereas higher values suggest a greater sensitivity to the focal ESG pillar.
Lastly, the top-decile overlap ratio is used to evaluate the stability of the leading institutions:
where denotes the set of institutions belonging to the top 10% under the baseline ranking, and denotes the corresponding top 10% under scenario . Equation (16) measures the extent to which leading institutions remain in the frontier group after policy reweighting. Values closer to one indicate high frontier stability, whereas values closer to zero indicate substantial reshuffling among the leading institutions.
Together, , , and provide complementary diagnostics of scenario sensitivity. The first captures institution-level rank movement, the second summarizes overall rank mobility, and the third evaluates whether the best-performing institutions remain stable under alternative ESG policy emphases. Scenario-specific tables of and are placed in the Appendix A, and the visualization of rank displacement for the top-25 institutions is provided in Figure 3.
Figure 3.
Rank displacement of the top 25 financial institutions relative to the baseline MARCOS–CRITIC ranking. The colors denote the alternative weighting scenarios: Green (green), Governance (blue), and Social (orange), representing increased weighting of the Environmental, Governance, and Social pillars, respectively. The black points represent the maximum absolute displacement (ΔMaxAbs). The dashed horizontal line at ΔRank = 0 represents the baseline ranking. Positive values indicate a deterioration in ranking (movement to a lower-ranked position), negative values indicate an improvement in ranking (movement to a higher-ranked position), and zero indicates no change in ranking.
3.6. Robustness and Diagnostics
The inferential credibility of the EOIR rankings is evaluated using a variety of diagnostics, including metric concordance, weighting-scheme sensitivity, policy displacement, and data integrity. The goal is to prove that ordering conclusions are not the result of a specific aggregation geometry, weighting philosophy, or coverage idiosyncrasy.
(i) Cross-metric concordance (MARCOS vs. TOPSIS).
Let and denote the ranks of institution under MARCOS (Equations (8) and (9)) and TOPSIS (Equations (10)–(12)), respectively, for . Rank agreement is summarized by Spearman’s and Kendall’s . With ,
and with and the numbers of concordant and discordant pairs, and tie adjustments,
The inferred hierarchy’s stability across distinct aggregation geometries applied to the same and w is indicated by high values of and , which are indicative of metric invariance of the ordering.
(ii) Weighting-scheme sensitivity (CRITIC, Entropy, Fuzzy AHP).
Robustness to the weighting philosophy is evaluated by recalculating EOIR indices under each weight vector derived in Section 3.3 and contrasting the induced rankings pairwise using Equations (17) and (18). This diagnostic contrasts the judgment-informed Fuzzy AHP weighting scheme with dispersion-driven weighting schemes, specifically CRITIC and Entropy.
This comparison is significant because each weighting method reflects a distinct epistemic logic. CRITIC prioritizes criteria with low redundancy and high contrast, Entropy emphasizes distributional dispersion, and Fuzzy AHP incorporates theory-based and expert-informed preferences. The EOIR framework can be regarded as resilient to alternative assumptions about the significance of criteria if the resulting rankings remain essentially consistent across these weighting philosophies.
The following is another method for examining pointwise differences in EOIR indices in order to localize sensitivity at the institution level:
where denotes the EOIR index of institution under an alternative weight vector , and denotes its EOIR index under the baseline weight vector. This institution-level comparison identifies whether ranking changes are concentrated among specific institutions or distributed more broadly across the sample.
(iii) Policy displacement (scenario analysis).
Policy displacement is assessed using the scenario-diagnostic measures introduced in Section 3.5. Specifically, institution-level rank displacement , mean absolute displacement , and top-decile overlap are calculated using Equations (14)–(16).
The sensitivity of EOIR rankings to alternative ESG pillar emphases is jointly assessed by these measures. Under a specific scenario, Equation (14) accurately represents the direction and magnitude of each institution’s rank movement. The average absolute magnitude of rank adjustments across all institutions is summarized in Equation (15). Equation (16) assesses whether the top-decile frontier is maintained by the leading institutions following policy reweighting.
A pattern of modest combined with high indicates leader resilience and limited policy-induced instability. Conversely, the scenario assumptions are more sensitive to the larger displacement values and reduced top-decile overlap. This distinction is significant because it reveals whether policy reweighting primarily impacts mid-tier institutions or if it also reorganizes the top EOIR performers.
(iv) Data integrity and informational sufficiency.
Transparency regarding data completeness is provided through coverage and imputation metrics for each criterion . Let be the indicator function. The coverage ratio and imputation share are
Equation (19) presents the ratio of observed values to the equivalent ratio of imputed values for each criterion. Elevated values of signify enhanced empirical coverage, whereas increased values of imply a heightened dependence on imputation.
Criteria with zero empirical range, that is,
are also flagged for their potential to diminish discriminatory power and their failure to contribute dispersion to objective weighting procedures. The EOIR results are based on informationally sufficient inputs and potential attenuation caused by limited variation or missingness is explicitly acknowledged by reporting , , and zero-range markers.
Collectively, these diagnostics—scenario displacement and frontier stability in Equations (14)–(16), metric concordance in Equations (17) and (18), weighting-scheme sensitivity, and data integrity in Equation (19)—evidence that the EOIR rankings are stable, interpretable, and replicable under permissible perturbations of the aggregation metric, weighting stance, policy emphasis, and data-coverage structure.
4. Results
4.1. Weights and Decision Structure
However, the reported weights should be interpreted as three distinct weighting specifications, rather than as components of a single averaged weight vector. The primary EOIR ranking is based on the CRITIC baseline weighting scheme, while the robustness and sensitivity assessments are conducted using Entropy and Fuzzy AHP alternative weighting specifications.
Table 2 compares the criterion weights derived from CRITIC, Shannon Entropy, and Fuzzy AHP, allowing for a triangulated perspective on informational salience (dispersion and non-redundancy) versus theory-concordant judgment under uncertainty. A consistent pattern of rank-ordering is observed across all schemes. In all specifications, governance constructs that proxy institutional hygiene and decision independence, notably the ESG controversies score (G4) and board independence (G1), occupy the upper stratum of importance. The readiness construct is jointly anchored in risk governance and environmental technology orientation, as evidenced by the clustering of environmental levers associated with technological alignment and opportunity capture, specifically Paris Agreement alignment (E2) and environmental innovation (E4), at the summit. Data privacy (S3) consistently outranks representational attributes such as diversity (S1) among social indicators, which is consistent with the idea that trustworthy data governance is a binding constraint for open collaboration. Conversely, workforce composition, while normatively salient, has a weaker direct impact on inter-organizational knowledge sharing.
Interpretable features are method-specific. In practice, this results in a reduction in the weights on omnibus composites such as the ESG score (G2) when they are collinear with granular governance or environmental indicators. CRITIC elevates criteria that are concurrently discriminating, meaning that they exhibit high dispersion and non-redundant meaning that they maintain low correlation with the remaining set. Entropy, a pure dispersion metric, allocates a larger mass to criteria with irregular cross-sectional distributions (E3). The broader ordering that prioritizes governance purity and environmental alignment is preserved, despite the heterogeneous adoption of renewable energy. In contrast, structural or policy-presence proxies with limited discriminatory power, such as the sustainability committee score (G3), and representational social metrics, such as diversity (S1), receive lower weight. Fuzzy AHP concentrates weight where the literature and expert judgments locate the primary frictions to openness, specifically, G4, G1, E2, E4, and S3, while down-weighting them.
The Fuzzy AHP global weights across the E/S/G taxonomy are synthesized in the polar radial chart (Figure 2). The radial magnitudes indicate a governance-centric mass, which is characterized by pronounced spikes at G4 and G1, a second ridge at E2/E4, and moderate contributions from E3 and S3. The environmental pillar is more balanced (E2 ≳ E4 ≳ E3 ≫ E1, the latter regarded as a cost criterion prior to normalization), whereas the social pillar exhibits a steeper intra-pillar gradient (S3 ≫ S2 ≳ S4 ≫ S1). In general, the weight structure is consistent across philosophies: the three vectors concur on the strategic importance of environmental alignment and innovation, as well as the primacy of governance cleanliness and independence. The only second-order redistributions are driven by dispersion (Entropy) and redundancy penalties (CRITIC).
4.2. Baseline Rankings and Cross-Method Agreement
The baseline ordering obtained from MARCOS with CRITIC weights is reported in Table 3. The table presents the top-25 institutions, while the complete ranking of all entities is available in the Supplementary Materials. The MARCOS ranks are highly concordant with the corresponding TOPSIS ordering, which is computed under the same CRITIC vector. Summary statistics, such as Spearman’s ρ and Kendall’s τ, can be reported adjacent to Table 3 in place of a dedicated figure. The headline results are not artifacts of the aggregation geometry, as evidenced by the modest dispersion in the mid-ranks and the strongest concordance in the upper tail (Section 3.6).
Table 3.
Weights comparison.
At the frontier, leading institutions (anonymized as exhibit a characteristic profile that includes environmental innovation (E4) and environmental alignment (E2), as well as governance hygiene (G4) and board independence (G1). The role of trustworthy data governance in facilitating open collaboration is consistent with the fact that data privacy (S3) is typically at or above the sample median among leaders.
Upper-middle deciles demonstrate compensatory configurations that are heterogeneous. While some institutions exhibit the inverse, others combine strong environmental scores such as E3 and E4 with inferior governance sanitation (G4). Composite governance (G2) has a limited marginal influence under CRITIC weighting when it is highly collinear with granular governance indicators (G1, G4). This reflects CRITIC’s redundancy penalty and explains minor permutations in comparison to alternative weight schemes. Even when E3 or S4 are favorable, deficits in G4 and G1 are rarely compensated for by strengths in other areas at the lower end.
In general, the top-25 MARCOS scores exhibit a visible elbow that distinguishes a stable frontier from a congested mid-tier (Table 4). This pattern is consistent with the scenario displacement patterns depicted in Figure 3 (Section 3.5) and persisted under the expert-informed specification (Section 4.3).
Table 4.
Baseline ranking (top-25; MARCOS and TOPSIS under CRITIC).
4.3. Expert-Informed Ranking (Fuzzy AHP)
The Fuzzy AHP specification, which aligns with the literature’s emphasis on sustainability alignment and governance purity, produces a ranking that is broadly consistent with the CRITIC baseline, with local reordering in the upper-middle deciles. Institutions that combine credible environmental alignment/innovation (E2 and E4), high board independence (G1), and minimal controversy exposure (G4) experience the greatest gains. Losses are frequently observed in situations where governance hygiene is inadequate or where innovation intensity fails to correspond with Paris targets. The pattern is in accordance with the decision structure described in Section 4.1 (Table 2; Figure 2): criteria that receive higher FAHP weights (G4, G1, E2, E4, S3) have more pronounced marginal effects on the EOIR index.
The rank distances between the CRITIC and FAHP orderings are modest at the frontier and increase in the mid-ranks, suggesting that leaders are structurally robust, while mid-tier positions are more susceptible to weighting philosophy. This is consistent with the scenario behavior reported in Section 4.4 and the robustness diagnostics in Section 3.6. The top-25 rankings obtained using the MARCOS method with Fuzzy AHP weights are presented in Table 5.
Table 5.
Rankings (MARCOS with Fuzzy AHP weights; top-25).
4.4. Scenario Sensitivity
The stability of the EOIR rankings in the presence of fluctuations in the relative importance of the ESG pillars is investigated through the sensitivity analysis tool. The rankings are determined by employing the CRITIC weight vector in the baseline specification. 50% of the total weight is allocated to one focal pillar, such as the Green, Governance, or Social pillar, in the scenario analysis. The remaining 50% is distributed proportionally among the other two pillars. With this design, we can evaluate the institutional hierarchy’s resilience to alternative policy priorities without altering the internal structure of trade-offs within each pillar.
The sensitivity analysis is assessed using three complementary indicators: rank displacement, mean absolute displacement, and top-decile overlap. Under a particular scenario, rank displacement indicates whether an institution’s ranking has improved or declined in comparison to the baseline ranking. Positive values suggest deterioration, while negative displacement values suggest improvement as the institution approaches the top of the ranking. To characterize the overall extent of rank mobility across the sample, the mean absolute displacement is used. The ranking structure is stable when the value is low, while it is more sensitive to the emphasis of the selected pillar when the value is high. Last but not least, top-decile overlap evaluates whether the top-tier institutions continue to be in the top 10% following scenario reweighting. This indicator is especially significant because it indicates whether the EOIR frontier is stable or whether policy reweighting alters the group of best-performing institutions.
The results indicate that the EOIR ranking is susceptible to pillar-specific reweighting; however, this sensitivity is restricted and primarily concentrated outside the institutions with the highest performance. The institution with the highest ranking remains unaltered in all scenarios, suggesting that the highest-performing EOIR performer has a resilient and balanced ESG–open innovation profile. The concurrence values for the top-10 scenarios are also high: 8/10 for the Green scenario, 9/10 for the Governance scenario, and 7/10 for the Social scenario. According to these findings, the majority of frontier institutions remain in the dominant group regardless of fluctuations in policy emphasis.
The Governance scenario exhibits the highest level of stability, with a top-10 overlap of 9/10. This implies that the baseline EOIR structure is closely aligned with governance-related criteria, particularly board independence and ESG controversy purity. The central role of governance discipline in ESG–open innovation readiness is confirmed by the fact that institutions that perform well in governance tend to maintain their position even when the weighting scheme changes.
The Green scenario exhibits a slightly higher degree of mobility, with a top-10 overlap of 8/10. Institutions that exhibit stronger environmental alignment, particularly those that excel in environmental innovation and Paris Agreement alignment, enhance their relative position in this scenario. This suggests that environmental technology orientation is a significant, but not the sole, determinant of EOIR performance.
The Social scenario produces the most significant relative reshuffling, with a top-10 overlap of 7/10. This implies that social indicators introduce a distinct source of institutional differentiation. The Social scenario is particularly advantageous for institutions that possess superior data privacy and social trust-related capabilities. Nevertheless, the fact that seven of the top ten institutions are in agreement with the baseline classification suggests that the prominent EOIR frontier is still relatively stable.
In general, the median displacement is approximately 15 positions, and the average absolute displacement is approximately 18 ranking positions. These values indicate that scenario reweighting generates significant rank mobility, but not excessive rank mobility. Consequently, the sensitivity analysis demonstrates a pattern of mid-tier mobility and leader resilience. Leading institutions are comparatively stable due to their ability to leverage their strengths across multiple ESG dimensions, whereas mid-tier institutions are more susceptible to shifts in policy emphasis. This discovery corroborates the EOIR framework’s durability and verifies that the rankings are not determined by a single ESG pillar, but rather by the integrated configuration of environmental alignment, social legitimacy, and governance discipline.
The top-25 rank displacements are represented in Figure 3 through the use of a lollipop plot. Positive values indicate deterioration, while negative values indicate development in relation to the baseline ranking. The figure supports the aforementioned interpretation: In the Green scenario, institutions that exhibit strong environmental alignment and innovation experience an improvement. In the Governance scenario, institutions with stronger board independence and controversy cleanliness experience an improvement. In the Social scenario, institutions with stronger data privacy and social trust capabilities benefit.
4.5. Role of Robustness Analyses
The evidentiary status of the EOIR estimates is verified through robustness tests. Cross-metric concordance between the MARCOS and TOPSIS orders was evaluated using Spearman’s rank correlation coefficient and Kendall’s rank correlation coefficient , as defined in Equations (17) and (18). The results are reported in Table 6.
Table 6.
Rank-concordance and methodological robustness results.
The findings demonstrate a significant degree of agreement between MARCOS and TOPSIS when the same CRITIC weights are used. Specifically, Spearman’s ρ = 0.998 and Kendall’s τ = 0.968, indicating that the institutional ranking is almost comparable across the two aggregation geometries. This outcome corroborates the internal validity of the EOIR ranking and suggests that the findings are not a byproduct of the chosen ranking methodology.
The comparison between MARCOS using CRITIC weights and MARCOS utilizing Fuzzy AHP weights demonstrates significant concordance, but with a slightly increased reordering. Spearman’s ρ = 0.969 and Kendall’s τ = 0.854, demonstrating that the ranking retains a high degree of consistency despite the transition from an objective, data-driven methodology to a theory-informed and expert-based approach. The greater mean and median absolute rank differences in this comparison indicate that the primary sensitivity is seen in the middle segment of the ranking rather than among the top schools.
The overlap among the top ten further corroborates this conclusion. Seven of the top ten colleges are consistent between MARCOS and TOPSIS using CRITIC weights, while eight of the top ten institutions are consistent between CRITIC and Fuzzy AHP methodologies. Consequently, the EOIR landscape remains largely stable, whereas rank movement is mostly seen among mid-tier schools. The findings validate that the EOIR architecture is resilient across various aggregation measures and weighting assumptions.
These robustness tests do not establish that the criteria are intrinsically compensatory; rather, they evaluate the stability of the rankings under alternative compensatory specifications. The EOIR ordering is not primarily determined by a single aggregation geometry, as evidenced by the high concordance between MARCOS and TOPSIS. Nevertheless, non-compensatory outranking methods, such as ELECTRE or PROMETHEE, may implement more stringent preference, indifference, or veto conditions. It is anticipated that these methods would primarily impact institutions with unbalanced ESG profiles, which are characterized by strong performance in one pillar and lackluster performance in another. As PROMETHEE and ELECTRE were not implemented in the current empirical design, it is not possible to report exact rank changes. Consequently, they are suggested as an extension for future research.
The robustness based on scenarios was further assessed by reweighting scenarios of the Green, Governance, and Social pillars, using the displacement diagnostics presented in Equations (14)–(16). The Governance scenario had the lowest average displacement, but the Green and Social scenarios resulted in greater, although still comprehensible, rank mobility. The rank-concordance coefficients, top-10 overlap, and scenario-displacement indicators together provide a robust assessment, affirming that the EOIR ordering is stable, interpretable, and not influenced by a singular methodological specification.
5. Discussion
The empirical results derived from the EOIR index indicate the existence of an optimal configuration linking ESG parameters with the readiness of financial institutions for open innovation. Given their dominant position in both the European and global market, financial institutions can significantly contribute to the development of sustainability through specific ESG strategies, as revealed by the weighting analysis of the selected criteria. More specifically, the increased weight presented to the corporate governance criteria, and specifically in the pair (G1, G4), initially assumes the importance of board independence (G1) for enhancing readiness. Unfair competition, favoritism, and the defense of internal interests are dominant factors that exclude the organization from possible cooperation with external partners. In addition, the weight of the G4 criterion expresses the dynamics of the organization’s social impact, both in terms of frequency and intensity. Therefore, reduced ESG challenges also imply a more stable institutional framework, that is, improved internal corporate management, communication, trust, and readiness for innovation. Beyond the corporate governance axis, the weighting analysis recommends compliance with environmental alignment, E2, and environmental innovation (E4). Thus, the recommended environmental standard is shaped by the adherence of financial institutions to the rules of the Paris Agreement, as well as by investment in clean technologies. Finally, the indicator related to personal data protection and security (S3) dominates the remaining social pressures, both at the individual level of employees and within the organization itself. This criterion reflects responsibility and respect for sensitive data flows, both within the internal boundaries of the organization and in its social interaction with external partners. Therefore, the five criteria that emerged as dominant drivers of the EIOR index are expressed by the triple combination of strong corporate governance (G1, G4), climate alignment and environmental innovation (E2, E4), and privacy and security (S3). Additionally, the highest EOIR values correspond to organizations that comply with the above triple combination. The application of different scenarios regarding changes in regulatory priorities within ESG rules shows that these organizations remain in the upper positions of the EOIR index. This conclusion suggests that readiness for open innovation is directly correlated with the maintenance of the triplet (G1, G4), (E2, E4), and S3. To derive the aforementioned results and conclusions, multiple validation mechanisms were used in the methodological analysis, such as cross-metric concordance (MARCOS vs. TOPSIS), weighting-scheme sensitivity (CRITIC, Entropy, Fuzzy AHP), policy displacement through scenario analysis, and data integrity and informational sufficiency checks. These checks strengthen the methodological validity of the EOIR index, verifying that the results are neither determined nor altered by the specific choice of methodology. However, the EOIR index values resulted from the processing of selected criteria directly related to the financial sector, without knowing in advance whether the same methodological approach would produce corresponding results in other sectors of economic activity or in possible interactions between financial and non-financial organizations.
Limitations and Future Research Directions
The suggested EOIR paradigm offers a visible and repeatable method for evaluating ESG–open innovation readiness in financial institutions; nevertheless, some limitations must be recognized. The empirical study is based on ESG metrics sourced from Refinitiv. Although Refinitiv offers organized and comparable ESG data, the outcomes are contingent upon the availability, measuring methodology, and quality of disclosure within this particular database. Consequently, further research may corroborate the EOIR framework by using other ESG data sources or manually gathered sustainability and innovation metrics.
The research focuses on publicly traded financial institutions; hence, the results may not be immediately applicable to privately held corporations, small and medium-sized enterprises, or entities in other industries. The financial industry is extensively regulated and data-driven, making it especially conducive to examining ESG–open innovation readiness. Future study may use the EOIR framework inside industrial, energy, technology, or public-sector enterprises to evaluate its wider application.
The EOIR index is constructed utilizing twelve ESG-related metrics categorized into environmental, social, and governance pillars. While these criteria were chosen to represent the theoretical link between ESG demands and open innovation preparedness, they do not comprehensively include all organizational, technical, cultural, and strategic aspects of open innovation. Subsequent research may enhance the model by including supplementary variables associated with R&D cooperation, digital transformation, knowledge-sharing networks, innovation outputs, stakeholder co-creation, and external collaborations.
The research employs a three-year average method for the period 2022–2024 to enhance measurement stability and mitigate annual volatility. This method restricts the capacity to monitor evolving institutional preparation over time. Future research may employ longer observation periods, panel-data extensions, dynamic MCDM models, or longitudinal robustness tests to analyze the evolution of EOIR under varying regulatory, macroeconomic, and technological situations.
Fifth, although the research employs CRITIC, Entropy, Fuzzy AHP, MARCOS, TOPSIS, and scenario analysis to mitigate method reliance, the ultimate rankings are still somewhat affected by methodological decisions, such as normalization, weighting, aggregation, and scenario-design assumptions. Subsequent investigations may juxtapose the proposed framework with other MCDM methodologies, like PROMETHEE, VIKOR, EDAS, MAIRCA, or BWM, and may also include uncertainty analysis, bootstrapping, or simulation-based robustness assessments.
This research assesses preparedness for open innovation instead of direct effects of open innovation. Consequently, the EOIR index needs to be regarded as an evaluation of institutional readiness and facilitating circumstances, rather than as direct proof of innovative efficacy. Subsequent research may correlate EOIR ratings with quantifiable innovation results, including patents, green patents, collaborative R&D initiatives, digital innovation alliances, new product creation, or market success metrics.
By recognizing these limits, the study delineates the interpretative confines of the EOIR framework and presents several opportunities for future research. These modifications would enhance the empirical validity, sectoral applicability, and dynamic explanatory power of ESG–open innovation readiness as a decision-support framework.
6. Conclusions
This study explored how the financial sector has the potential to transform ESG pressures into open innovation, thereby contributing to the formation of a more sustainable and collaborative economic environment. In this context, the EOIR index was developed, synthesizing the environmental, social, and governance pillars into a single tool for assessing institutional readiness for collaborative innovation processes. The results indicated that achieving this readiness is not accomplished through isolated ESG actions, but through a specific alignment of key parameters across the three pillars. This alignment reflects the set of conditions that enhance the ability of organizations to adopt open forms of innovation. Specifically, the governance pillar emerges as a fundamental element, while environmental alignment with green practices and technical know-how, together with social trust, function in a complementary manner. The originality of this work lies in connecting two previously distinct research fields, ESG pressures and open innovation in the financial sector, an area that remains largely unexplored in the existing literature. This connection was established through the development and application of the EOIR index, which results from a multi-criteria MCDM methodology.
Consequently, the EOIR index represents a useful tool for financial institutions, strengthening their capacity for collaboration, institutional communication and coordination, while contributing to a collective framework that supports the sustainable transition. Finally, the results of the study indicate that, beyond showing that readiness for open innovation emerges from a specific configuration of critical ESG parameters, its implementation can enhance the resilience of financial institutions against uncertainty and market changes.
The findings should be interpreted in the context of several limitations, despite these contributions. Firstly, the empirical analysis is dependent on Refinitiv ESG indicators, which implies that the results are influenced by the availability, disclosure quality, and measurement logic of this database. Secondly, the study concentrates on listed financial institutions; as a result, the EOIR framework should be further evaluated in other sectors, such as energy, manufacturing, technology, public organizations, and small and medium-sized enterprises. Third, the twelve selected ESG criteria do not encompass all potential aspects of open innovation readiness, such as R&D collaboration, patents, digital partnerships, knowledge-sharing networks, or stakeholder co-creation, despite the fact that they provide a balanced representation of environmental, social, and governance dimensions. Fourth, the utilization of a three-year average enhances measurement stability; however, it restricts the capacity to investigate dynamic changes in EOIR over time. Ultimately, the results are partially influenced by the methodological decisions made in relation to scenario design, aggregation, weighting, and normalization.
Consequently, the EOIR framework could be expanded in a variety of directions through future research. Initially, the index could be validated through the use of alternative ESG databases or manually collected sustainability and innovation indicators in subsequent studies.
Secondly, dynamic or longitudinal MCDM models could be employed to investigate the evolution of ESG–open innovation readiness in response to evolving regulatory, technological, and macroeconomic conditions. Third, future research could compare MARCOS and TOPSIS with non-compensatory or outranking methods, such as PROMETHEE and ELECTRE, to investigate whether institutions with unbalanced ESG profiles alter their position under stricter preference structures. Lastly, future research could establish a correlation between EOIR scores and direct innovation outcomes, including green patents, collaborative R&D projects, digital innovation alliances, new product development, or market-performance indicators. The empirical validation, sectoral transferability, and explanatory power of EOIR as a decision-support framework for sustainable and collaborative innovation would be enhanced by these extensions.
Supplementary Materials
The following supporting information can be downloaded at: https://www.mdpi.com/article/10.3390/math14152773/s1, the supporting information is also available online: criteria definitions, weighting results (CRITIC, Entropy, and Fuzzy AHP), full institutional rankings, and scenario-based analyses provided in an Excel file. Data source: Refinitiv ESG (LSEG). Available at: https://www.lseg.com/en/data-analytics/refinitiv. Accessed on: 15 November 2025.
Author Contributions
Conceptualization, I.V. and D.F.; methodology, D.F., I.M., and G.K.; resources, G.K., I.M., and G.P.; writing—original draft preparation, D.F. and I.V.; writing—review and editing, G.B. and G.P.; visualization, I.M. and G.K.; supervision, I.V. and G.B.; project administration, G.P. and G.B. All authors have read and agreed to the published version of the manuscript.
Funding
This research was funded by the Research Committee (ELKE) of the University of Western Macedonia, grant number 81427.
Data Availability Statement
The original contributions presented in this study are included in the article. Further inquiries can be directed to the corresponding author.
Conflicts of Interest
The authors declare no conflicts of interest.
Appendix A
Table A1.
FAHP pillar weights.
Table A2.
Environmental local weights (E1–E4).
Table A3.
Social local weights (S1–S4).
Table A4.
Governance local weights (G1–G4).
Table A5.
FAHP global weights.
Table A6.
Scenario-based MARCOS ranking (top-10 institutions) (full scenarios tables available in Supplementary File: A4_Scenarios).
Table A7.
Robustness analysis. Panel (A). Methodological robustness (MARCOS vs. TOPSIS vs. Fuzzy AHP). Panel (B). Scenario robustness (pillar reweighting scenarios).
The robustness diagnostics confirm that the proposed EOIR framework yields a highly stable ranking structure under a range of methodological and policy-induced perturbations. Cross-metric comparisons reveal that MARCOS and TOPSIS demonstrate near-perfect concordance when employing CRITIC weights (Spearman’s ρ = 0.998; Kendall’s τ = 0.968). In contrast, substituting CRITIC with Fuzzy AHP weights yields only moderate reordering (ρ = 0.969; τ = 0.854), predominantly impacting the intermediate tier. The substantial overlap in frontier institutions (7–8 out of 10 across multiple specifications) further indicates that leadership positions are not influenced by the choice of aggregation methods or weighting schemes. Scenario perturbations, implemented through substantial (approximately 50%) reweighting of pillars, produce deliberate modifications in institutional positions. The Governance scenario yields the minimal displacement, with a mean of 9.10 and a median of 7. In contrast, the Green and Social scenarios demonstrate increased mobility, with mean values of 18.01 and 17.86, respectively, while both sustaining 70–80% of the top-10 frontier. These findings corroborate that the EOIR model remains fundamentally sound across diverse methodological, weighting, and policy scenarios, thereby validating the internal consistency and robustness of the benchmarking framework.
References
- Liu, C.; Gong, W.; Dong, G.; Ji, Q. Regulation of environmental, social and governance disclosure greenwashing behaviors considering the risk preference of enterprises. Energy Econ. 2024, 135, 107637. [Google Scholar] [CrossRef] [Scilit]
- Bigliardi, B.; Ferraro, G.; Filippelli, S.; Galati, F. The influence of open innovation on firm performance. Int. J. Eng. Bus. Manag. 2020, 12, 1847979020969545. [Google Scholar] [CrossRef] [Scilit]
- Eccles, R.G.; Ioannou, I.; Serafeim, G. The impact of corporate sustainability on organizational processes and performance. Manag. Sci. 2014, 60, 2835–2857. [Google Scholar] [CrossRef] [Scilit]
- Galindo-Martin, M.A.; Mendez-Picazo, M.T.; Perez-Pujol, R.S. Open innovation and sustainable development: A micro and macroeconomic analysis using a mixed method research. Int. J. Inf. Manag. 2025, 82, 102874. [Google Scholar] [CrossRef] [Scilit]
- West, J.; Bogers, M. Open innovation: Current status and research opportunities. Innov. Organ. Manag. 2017, 19, 43–50. [Google Scholar] [CrossRef] [Scilit]
- Thao, H.T.; Xie, X. Fostering green innovation performance through open innovation strategies: Do green subsidies work? Environ. Dev. Sustain. 2024, 26, 18641–18671. [Google Scholar] [CrossRef]
- Gegenhuber, T.; Mair, J. Open social innovation: Taking stock and moving forward. Ind. Innov. 2024, 31, 130–157. [Google Scholar] [CrossRef] [Scilit]
- Mu, R.; Wang, H. A systematic literature review of open innovation in the public sector: Comparing barriers and governance strategies of digital and non-digital open innovation. Public Manag. Rev. 2021, 23, 1833–1860. [Google Scholar] [CrossRef] [Scilit]
- De Marchi, V. Environmental innovation and R&D cooperation: Empirical evidence from Spanish manufacturing firms. Res. Policy 2012, 41, 614–623. [Google Scholar] [CrossRef] [Scilit]
- Battiston, S.; Mandel, A.; Monasterolo, I.; Schütze, F.; Visentin, G. A climate stress-test of the financial system. Nat. Clim. Change 2017, 7, 283–288. [Google Scholar] [CrossRef] [Scilit]
- Polzin, F.; Migendt, M.; Täube, F.A.; von Flotow, P. Public policy influence on renewable energy investments—A panel data study across OECD countries. Energy Policy 2015, 80, 98–111. [Google Scholar] [CrossRef] [Scilit]
- Østergaard, C.R.; Timmermans, B.; Kristinsson, K. Does a different view create something new? The effect of employee diversity on innovation. Res. Policy 2011, 40, 500–509. [Google Scholar] [CrossRef] [Scilit]
- Shore, L.M.; Randel, A.E.; Chung, B.G.; Dean, M.A.; Ehrhart, K.H.; Singh, G. Inclusion and diversity in work groups: A review and model for future research. J. Manag. 2011, 37, 1262–1289. [Google Scholar] [CrossRef] [Scilit]
- Chesbrough, H.; Bogers, M. Explicating open innovation: Clarifying an emerging paradigm for understanding innovation. In New Frontiers in Open Innovation; Oxford University Press: Oxford, UK, 2014; pp. 3–28. Available online: https://papers.ssrn.com/sol3/papers.cfm?abstract_id=2427233 (accessed on 1 September 2025).
- Amore, M.D.; Bennedsen, M. Corporate governance and green innovation. J. Environ. Econ. Manag. 2016, 75, 54–72. [Google Scholar] [CrossRef] [Scilit]
- Flammer, C. Corporate green bonds. J. Financ. Econ. 2021, 142, 499–516. [Google Scholar] [CrossRef] [Scilit]
- Khan, M.; Serafeim, G.; Yoon, A. Corporate sustainability: First evidence on materiality. Account. Rev. 2016, 91, 1697–1724. [Google Scholar] [CrossRef] [Scilit]
- Keeney, R.L.; Raiffa, H. Decision Making with Multiple Objectives: Preferences and Value Tradeoffs; Wiley: New York, NY, USA, 1976. [Google Scholar]
- Mishra, P.; Pandey, S. Triple bottom line and environmental sustainability: Evolution of global ESG research—A bibliometric analysis. Environ. Sci. Eur. 2025, 37, 136. [Google Scholar] [CrossRef] [Scilit]
- Sahin, Ö.; Bax, K.; Czado, C.; Paterlini, S. Environmental, social, governance scores and the missing pillar—Why does missing information matter? Corp. Soc. Responsib. Environ. Manag. 2022, 29, 1782–1798. [Google Scholar] [CrossRef] [Scilit]
- Barbosa, A.S.; Crispim da Silva, M.C.B.; Bueno da Silva, L.; Morioka, S.N.; Souza, V.F. Integration of environmental, social, and governance (ESG) criteria: Their impacts on corporate sustainability performance. Humanit. Soc. Sci. Commun. 2023, 10, 410. [Google Scholar] [CrossRef] [Scilit]
- Chopra, S.S.; Senadheera, S.S.; Dissanayake, P.D.; Withana, P.A.; Chib, R.; Rhee, J.H.; Ok, Y.S. Navigating the Challenges of Environmental, Social, and Governance (ESG) Reporting: The Path to Broader Sustainable Development. Sustainability 2024, 16, 606. [Google Scholar] [CrossRef] [Scilit]
- Jámbor, A.; Zanócz, A. The Diversity of Environmental, Social, and Governance Aspects in Sustainability: A Systematic Literature Review. Sustainability 2023, 15, 13958. [Google Scholar] [CrossRef] [Scilit]
- Moreira, A.; Rodrigues, A.C.; Ferreira, M.R. Where Is Human Resource Management in Sustainability Reporting? ESG and GRI Perspectives. Sustainability 2025, 17, 3033. [Google Scholar] [CrossRef] [Scilit]
- Potharla, S.; Turubilli, S.K.; Shekar, M.C. The Social Pillar of ESG: Exploring the Link Between Social Sustainability and Stock Price Synchronicity. Indian J. Corp. Gov. 2024, 17, 130–152. [Google Scholar] [CrossRef] [Scilit]
- Yusifzada, L.; Lončarski, I.; Czupy, G.; Naffa, H. Return Trade-Offs Between Environmental and Social Pillars of ESG Scores. Res. Int. Bus. Financ. 2025, 75, 102779. [Google Scholar] [CrossRef] [Scilit]
- Senadheera, S.S.; Withana, P.A.; Dissanayake, P.D.; Sarkar, B.; Chopra, S.S.; Rhee, J.H.; Ok, Y.S. Scoring environment pillar in environmental, social, and governance (ESG) assessment. Sustain. Environ. 2021, 7, 1960097. [Google Scholar] [CrossRef] [Scilit]
- Trahan, R.T.; Jantz, B. What Is ESG? Rethinking the “E” Pillar. Bus. Strategy Environ. 2023, 32, 4382–4391. [Google Scholar] [CrossRef] [Scilit]
- Breeden, J.L. Impacts of Drought on Loan Repayment. J. Risk Financ. Manag. 2023, 16, 85. [Google Scholar] [CrossRef] [Scilit]
- Agliardi, E.; Alexopoulos, T.; Karvelas, K. The environmental pillar of ESG and financial performance: A portfolio analysis. Energy Econ. 2023, 120, 106598. [Google Scholar] [CrossRef] [Scilit]
- Li, Q.; Tang, W.; Li, Z. ESG systems and financial performance in industries with significant environmental impact: A comprehensive analysis. Front. Sustain. 2024, 5, 1454822. [Google Scholar] [CrossRef] [Scilit]
- Monteiro, G.F.A.; Miranda, B.V.; Rodrigues, V.P.; Saes, M.S. ESG: Disentangling the governance pillar. RAUSP Manag. J. 2021, 56, 482–487. [Google Scholar] [CrossRef] [Scilit]
- Lagasio, V.; Cucari, N. Corporate governance and environmental social governance disclosure: A meta-analytical review. Corp. Soc. Responsib. Environ. Manag. 2019, 26, 701–711. [Google Scholar] [CrossRef] [Scilit]
- Arici, H.E.; Aladag, O.F.; Koseoglu, M.A. How does CEO duality influence ESG scores in hospitality and tourism companies? Confounding roles of governance mechanisms and financial indicators. J. Hosp. Tour. Res. 2025, 49, 961–981. [Google Scholar] [CrossRef] [Scilit]
- Bai, Y.; Lu, C.; Dong, X.; Li, Y. Role of collaborative governance in unlocking private investment in sustainable projects. J. Environ. Plan. Manag. 2023, 66, 2571–2591. [Google Scholar]
- Antonelli, G.A.; di Prisco, D.; Leone, M.I. Trust in Open Innovation: An Integrated Model Based on a Systematic Literature Review. R&D Manag. 2026, 56, 37–54. [Google Scholar] [CrossRef] [Scilit]
- Arsanti, T.A.; Rupidara, N.; Bondarouk, T. Managing knowledge flows within open innovation: Knowledge sharing and absorption mechanisms in collaborative innovation. Cogent Bus. Manag. 2024, 11, 2351832. [Google Scholar] [CrossRef] [Scilit]
- Guo, Y.; Naseer, M.M. Financial Pathways to Sustainability—The Effects of Financial Inclusion, Development, and Innovation on Shaping ESG Readiness in Low- and Middle-Income Countries. Int. J. Financ. Stud. 2025, 13, 122. [Google Scholar] [CrossRef] [Scilit]
- Barile, D.; Secundo, G.; Del Vecchio, P. An artificial intelligence-based innovation ecosystem enabling open innovation and sustainable growth: Evidence from a case study. Innov. Organ. Manag. 2026, 28, 14–36. [Google Scholar] [CrossRef] [Scilit]
- Broekhuizen, T.; Dekker, H.; de Faria, P.; Firk, S.; Nguyen, D.K.; Sofka, W. AI for managing open innovation: Opportunities, challenges, and a research agenda. J. Bus. Res. 2023, 167, 114196. [Google Scholar] [CrossRef] [Scilit]
- Martielli, F.; Salvi, A.; Doronzo, E. Corporate social responsibility practices and value creation through open innovation approach: Evidence from the STOXX Europe 600 Index. Corp. Soc. Responsib. Environ. Manag. 2024, 31, 4732–4745. [Google Scholar] [CrossRef] [Scilit]
- Diakoulaki, D.; Mavrotas, G.; Papayannakis, L. Determining objective weights in multiple criteria problems: The CRITIC method. Comput. Oper. Res. 1995, 22, 763–770. [Google Scholar] [CrossRef] [Scilit]
- Shannon, C.E. A Mathematical Theory of Communication. Bell Syst. Tech. J. 1948, 27, 379–423. [Google Scholar] [CrossRef] [Scilit]
- Saraiva, P. On Shannon Entropy and Its Applications. Kuwait J. Sci. 2023, 50, 194–199. [Google Scholar] [CrossRef] [Scilit]
- Chang, D.Y. Applications of the extent analysis method on fuzzy AHP. Eur. J. Oper. Res. 1996, 95, 649–655. [Google Scholar] [CrossRef] [Scilit]
- Stević, Ž.; Pamučar, D.; Puška, A.; Chatterjee, P. Sustainable supplier selection in healthcare industries using a new MCDM method: Measurement Alternatives and Ranking according to COmpromise Solution (MARCOS). Comput. Ind. Eng. 2020, 140, 106231. [Google Scholar] [CrossRef] [Scilit]
- Hwang, C.L.; Yoon, K. Multiple Attribute Decision Making: Methods and Applications; Springer: New York, NY, USA, 1981. [Google Scholar]
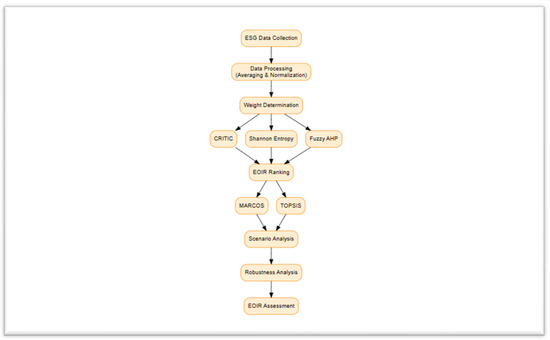
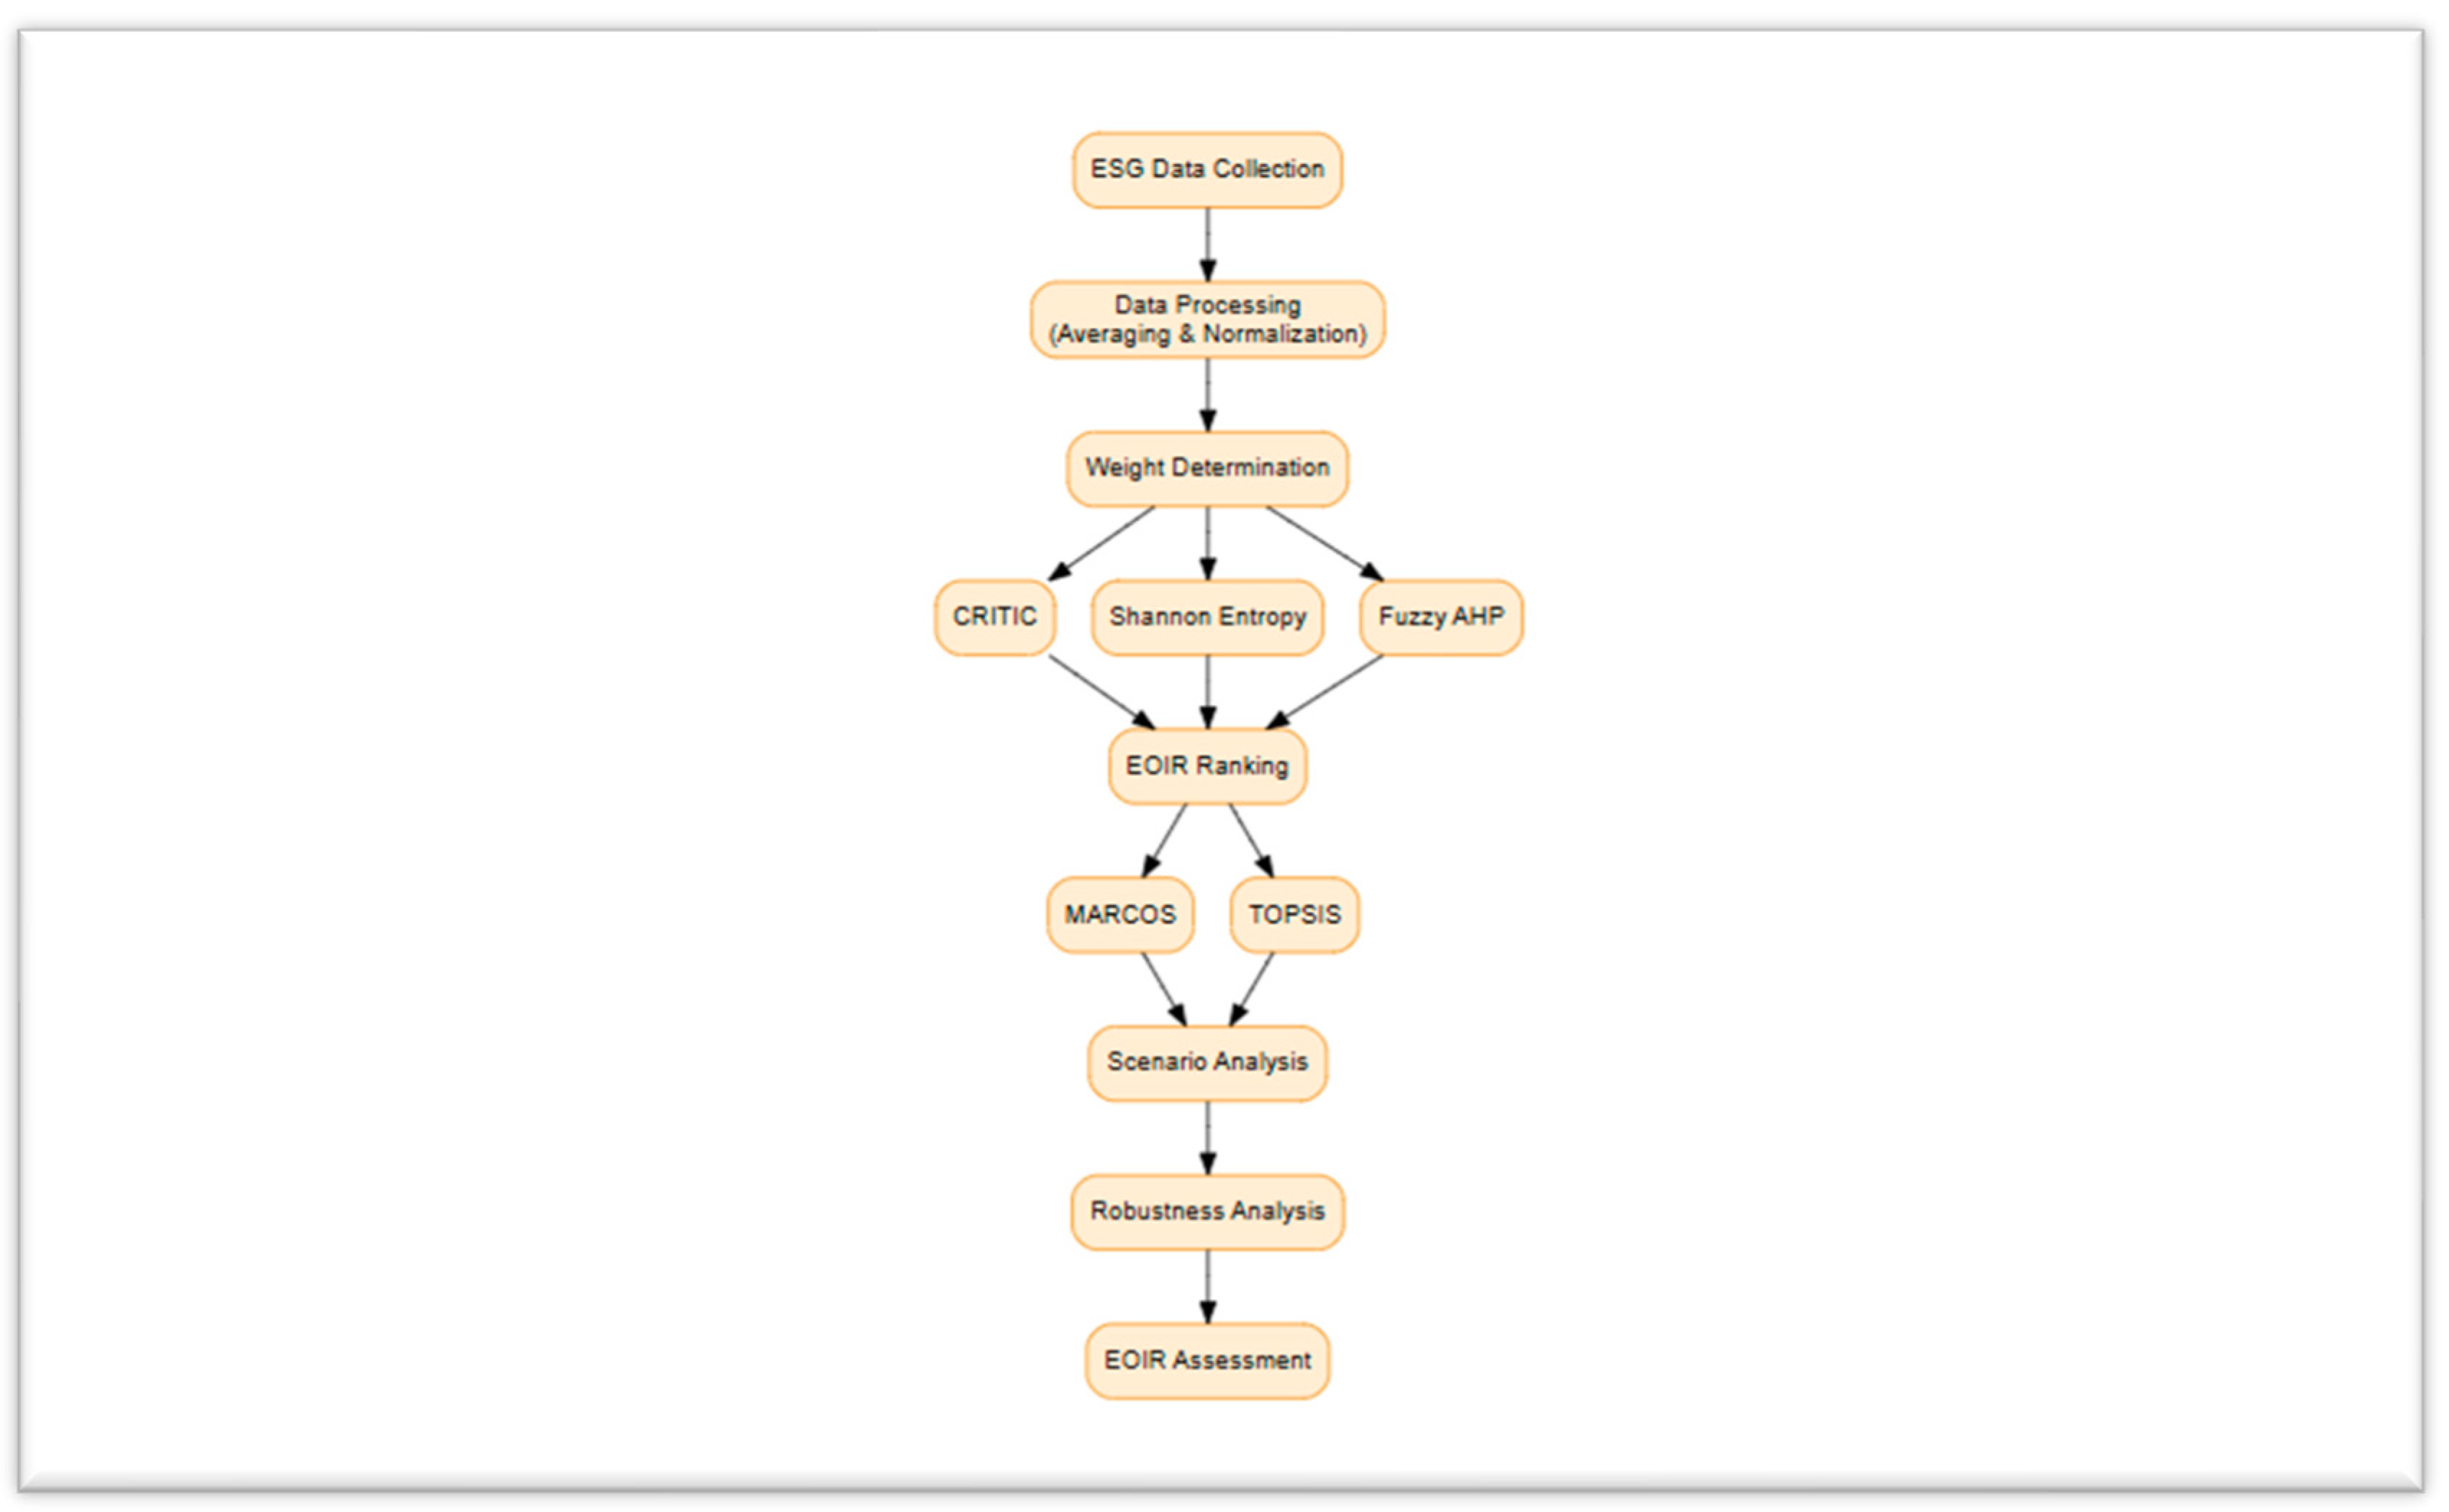
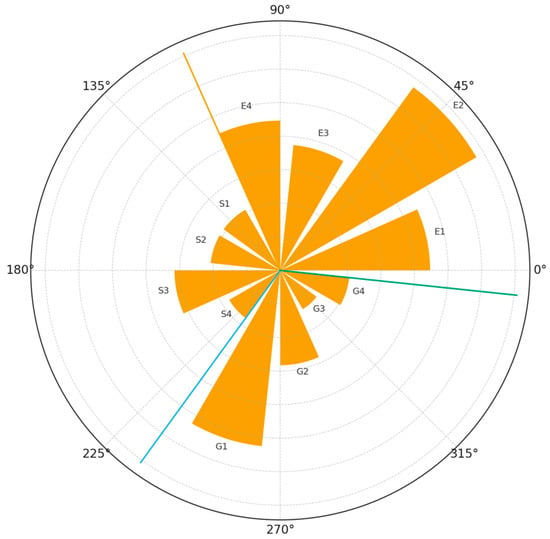
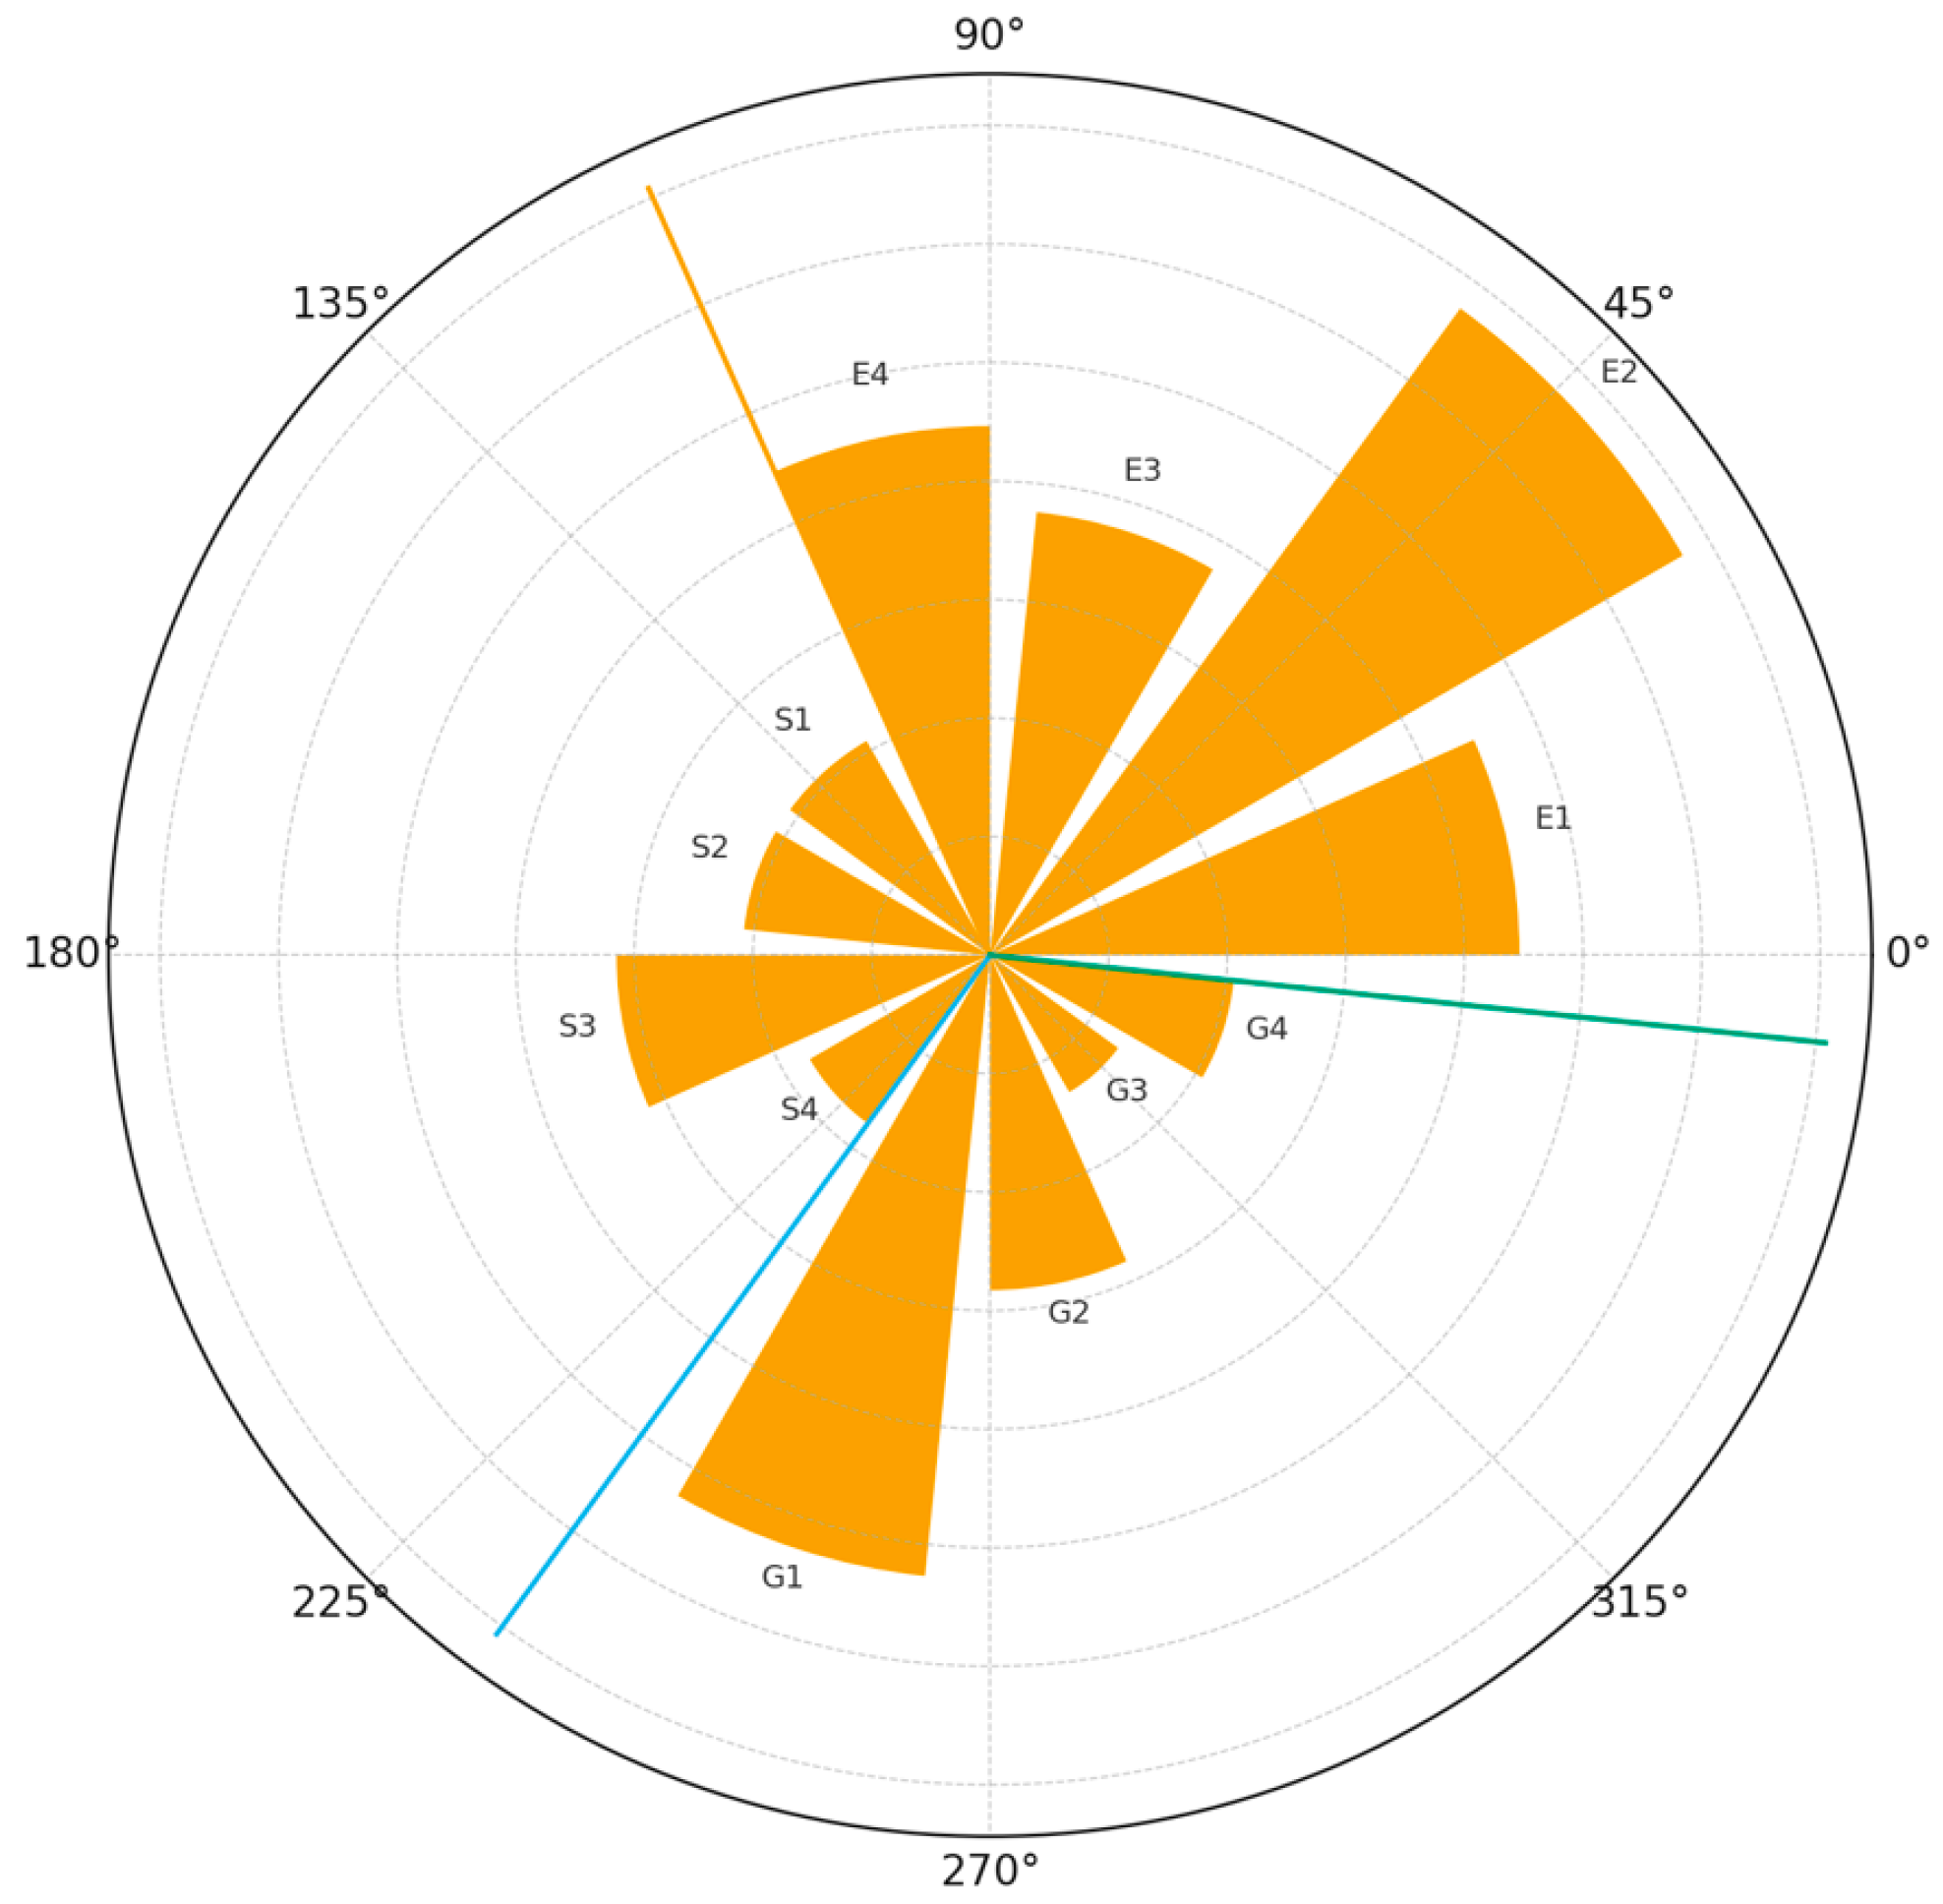
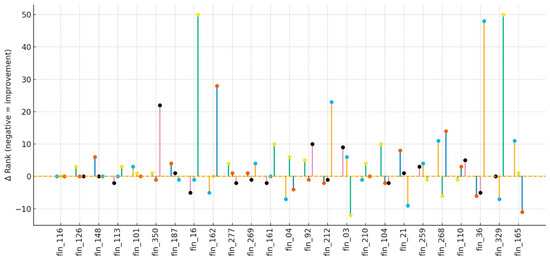
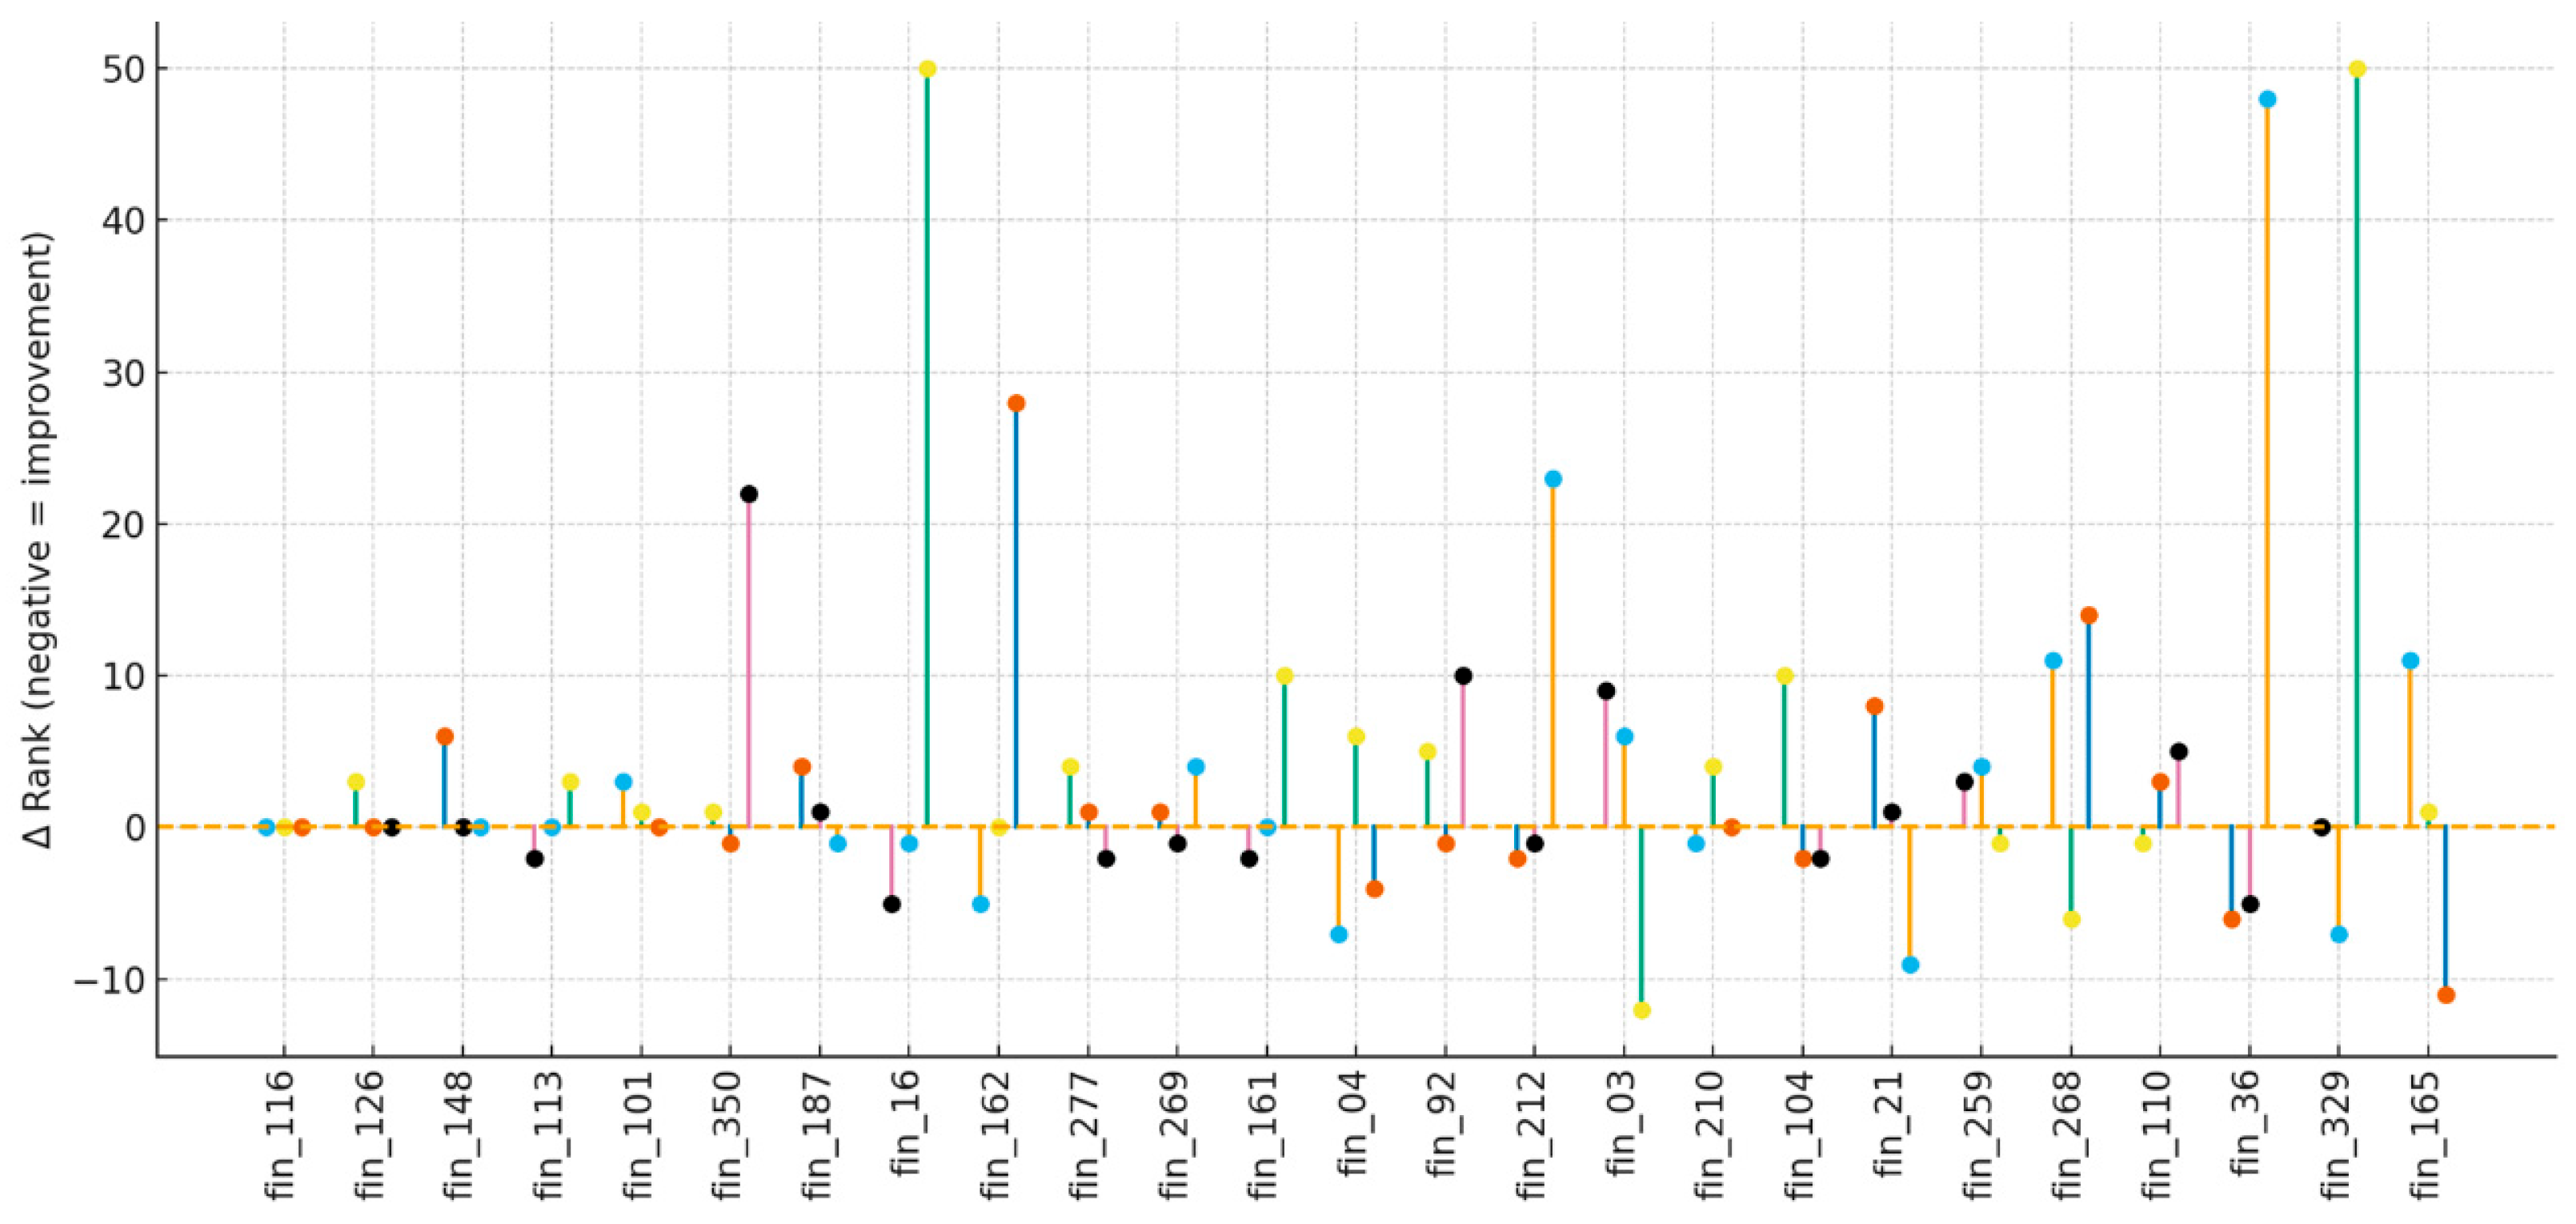

Disclaimer/Publisher’s Note: The statements, opinions and data contained in all publications are solely those of the individual author(s) and contributor(s) and not of MDPI and/or the editor(s). MDPI and/or the editor(s) disclaim responsibility for any injury to people or property resulting from any ideas, methods, instructions or products referred to in the content. |
© 2026 by the authors. Licensee MDPI, Basel, Switzerland. This article is an open access article distributed under the terms and conditions of the Creative Commons Attribution (CC BY) license.