


Abstract
Cube-shaped automated storage and retrieval systems (AS/RS) enhance storage density by organizing inventory in a three-dimensional grid. However, they face two operational bottlenecks: (1) digging—the temporary removal and restacking of upper bins to access a target bin—and (2) inefficient idle staging and return policies in multi-AGV operations. We proposed a demand-based digging and bin-placement strategy and a waiting-point (staging) selection policy that considers AGV positions and remaining task times. These control policies are implemented in both rule-based and multi-agent reinforcement learning (MARL) variants. Their performance is evaluated using a Discrete Event System Specification (DEVS) simulation framework. In a 30 × 30 × 4 grid, three experiments demonstrated that deploying five AGVs achieved the best performance within the tested configuration; the demand-based digging and placement strategy achieved a 6.2% reduction in makespan, and the rule-based and MARL staging policies achieved additional reductions of 2.5% and 1.1%, respectively. These results highlight the benefits of jointly optimizing digging and multi-AGV staging and provide practical guidance for control-policy design in cube-shaped AS/RS.
Keywords:
automated storage and retrieval systems (AS/RS); automated guided vehicle (AGV); bin placement; predictive staging; multi-agent reinforcement learning (MARL); discrete event simulation MSC:
90B06; 93C65; 90B35
1. Introduction
In recent years, e-commerce companies have been expanding the adoption of cube-shaped Automated Storage and Retrieval Systems (AS/RS) to enhance profitability by utilizing limited space more efficiently [1]. Conventional pallet-rack warehouses employ horizontal rack structures separated by working aisles, where operators walk through the aisles to manually pick and manage items. This configuration not only requires substantial labor but also dedicates a significant portion of the floor area to aisles rather than storage, resulting in lower effective storage capacity for a given footprint. In contrast, cube-shaped automated storage and retrieval systems (AS/RS) vertically stack bins within a three-dimensional grid and minimize aisle space, thereby maximizing storage density [2]. On the grid top, automated guided vehicles (AGVs) execute storage and retrieval tasks under centralized warehouse management systems (WMS) that integrate AS/RS scheduling, inventory control and inbound/outbound operations [3]. This architecture increases storage capacity for a given footprint and, through automation, raises throughput per unit time, thereby improving cost efficiency [4].
However, cube-shaped AS/RS introduces two operational challenges. First, to retrieve a target bin located below the top layer, upper bins must be temporarily removed—an operation known as digging—and later restacked, which adds relocations and delays [5]. For example, if a target bin is located near the bottom of the stack, the system must sequentially remove all bins above it before retrieval [6]. Second, under multi-AGV operation, idle-staging and return-to-origin policies can lengthen unnecessary travel and induce local congestion when new tasks arrive. Despite their practical relevance, these two aspects are often treated separately in the literature.
Prior studies on AGV scheduling in cube-shaped AS/RS have two major limitations. First, previous scheduling studies have applied methods such as genetic algorithms to minimize collisions and generate optimal paths. For example, a Collision Index was proposed as a unique identifier for evaluating logistics tasks and robot movements. However, such studies typically ignore restacking after retrieval and are limited to single-AGV scenarios, restricting their applicability in real-world environments. Second, studies on digging optimization have explored techniques such as Rollout Heuristics for order sequencing and strategies for placing frequently requested bins at the top layer to reduce digging frequency. While these approaches successfully reduced process times, they did not consider multi-AGV cooperation or the restacking process following digging. Thus, existing approaches provide partial improvements—either minimizing digging or optimizing AGV scheduling—while neglecting multi-AGV collaboration, restacking strategies, and scalable simulation design.
To address these limitations, this study proposes two major improvements. First, we introduce digging process optimization and cooperative AGV operation strategies. To enhance the digging process, a demand-based placement algorithm is proposed, which assigns frequently requested bins to upper layers instead of relying on the traditional first-in–last-out strategy. Furthermore, realistic cooperative AGV operations are implemented, and inefficient return policies are improved. Both rule-based algorithms and reinforcement learning (RL)-based policies are applied and compared to determine their effectiveness. Second, we develop a Discrete Event System Specification (DEVS)-based simulation framework to objectively evaluate the proposed strategies. DEVS provides modular and hierarchical modeling of complex logistics systems and simulates event-driven operations efficiently [7,8,9]. Moreover, it enables flexible testing of diverse scenarios and operational strategies within a unified environment, making it highly suitable for systematic performance evaluation.
To validate the proposed approach, three experiments were conducted in a 30 × 30 × 4 cube-shaped AS/RS. The first experiment evaluated different AGV fleet sizes to determine the optimal number of AGVs. The second experiment assessed the effectiveness of the proposed digging algorithm. The third experiment compared three strategies: the baseline system, a rule-based waiting-point policy, and an RL-based waiting-point policy. The experimental results demonstrated that five AGVs provided the best balance between makespan reduction and AGV utilization under the tested configuration. The proposed digging algorithm reduced the makespan by 6.2%, confirming its effectiveness. In the waiting-point comparison, the rule-based policy achieved a 2.5% reduction in makespan relative to the baseline, while the RL-based policy achieved a 1.1% reduction.
Therefore, this study aimed to develop a DEVS-based simulation framework that represents the end-to-end operating processes of a cube-shaped AS/RS, including inbound and outbound handling, digging, restacking, and multi-AGV movements. Using this framework, we pursued three research objectives. First, we identified an appropriate AGV fleet size for a 30 × 30 × 4 cube-shaped AS/RS under the given order profile. Second, we quantified the makespan reduction achieved by the proposed demand-based digging and restacking algorithm compared with a conventional strategy. Third, we compared a baseline return policy with rule-based and reinforcement learning-based waiting-point policies in terms of multi-AGV operating efficiency and AGV utilization. We hypothesized that jointly optimizing digging operations and multi-AGV staging will improve system throughput and AGV utilization over conventional, partially optimized approaches, and that the findings will provide practical guidelines for designing and tuning control policies and AGV operation strategies in cube-shaped AS/RS.
The remainder of this paper is organized as follows: Section 2 reviews related research; Section 3 describes the architecture of the proposed simulation along with the demand-based digging algorithm and the task-predictive staging algorithm, Section 4 presents the visualization methods, Section 5 reports the experimental evaluations and Section 6 concludes the paper and outlines future research directions.
2. Related Work
Research on improving and simulating cube-shaped AS/RS is summarized in Table 1. These studies propose ways to apply algorithms or systems to specific logistics processes in order to improve the operational efficiency of cube-shaped AS/RS. In particular, most studies focused on minimizing digging operations. Ha et al. (2023) applied a Genetic Algorithm (GA) to optimize AGV task scheduling and the digging process, aiming to avoid collisions among multiple AGVs and derive optimal paths [10]. However, GA inherently suffers from the drawback that its performance heavily depends on the initial parameter settings [11]. Moreover, while the study focused primarily on collision avoidance, it did not incorporate detailed time constraints that are critical in real operational environments. In addition, the simulation was conducted under a limited scenario that only considered picking and retrieval processes, assuming a single-layer cube storage system without explicitly modeling the digging process. Additionally, the study only addressed picking and shipping within the logistics process and focused solely on non-digging scenarios. Ko and Han (2022) proposed an algorithm based on the Rollout Heuristic to optimize order sequencing and minimize bin relocations [12]. However, the study was limited to a single-AGV environment, which restricts its applicability to real-world operations. In addition, the validation relied solely on a mathematical model and small-scale case analyses, lacking simulation-based evaluation. Furthermore, critical operational factors such as restorage processes, multi-layer storage structures, and time-related constraints were not considered, leading to limitations in both scalability and practical relevance.
Table 1.
Related works on cube-shaped AS/RS optimization and simulation.
Yue et al. (2023) focused on the picking task in the logistics process and proposed a method to reduce digging time by placing bins with frequent demand at the top [13]. While this effectively reduced digging operation time, the study was conducted in a limited scenario focusing solely on picking operations and did not investigate subsequent processes such as the restorage of sub-bins after digging. Therefore, while the number of digging operations may decrease, there is a risk of remaining at a local optimum in which empty travel or shop-floor congestion increases, limiting its ability to translate into overall operational performance improvements at the system level. Trost et al. (2024) conducted optimization research on various logistics process-based scenarios, including orders, picking, and shipping, using Simio-based simulation [14]. They analyzed the number of robots and charging rates based on stack height to evaluate the key factors affecting logistics performance. However, they did not consider the cooperation between AGVs applied to actual cube-shaped AS/RS, and there was a drawback in that it was difficult to reflect detailed requirements such as scenario and algorithm expansion due to the use of tool-based simulation.
In summary, existing studies on cube-shaped AS/RS commonly rely on simplified assumptions such as single-layer storage structures, single-AGV environments, and non-digging scenarios. As a result, even when they improve local performance metrics such as the number of digging operations or bin relocations, they provide limited insight into how these improvements translate into system-level performance in realistic multi-layer, multi-AGV environments where digging, restorage, and AGV movements interact.
To address these limitations, this paper proposes a control framework that integrally models the entire logistics process in a multi-layer cube-shaped AS/RS, covering inbound, storage, picking, and outbound. Specifically, we design a demand-based digging and bin placement algorithm that determines the temporary placement and restorage locations of sub-bins during digging, together with a waiting (staging) policy that assigns AGV waiting positions after each task. Using this framework, we quantitatively analyze the impact of the proposed policies on system-level operational metrics such as makespan, AGV idle time, and travel distance in multi-AGV scenarios.
Although several advanced methods have been proposed for cube-shaped AS/RS and related automated warehouse systems, direct numerical comparison among them is not straightforward because the modeled logistics scope, system assumptions, and decision variables differ substantially. For example, GA-based scheduling studies mainly focus on path generation and collision reduction, rollout-heuristic approaches focus on order sequencing or relocation minimization, and top-layer placement policies focus on reducing digging frequency. In contrast, the present study models the end-to-end operational flow of a multi-layer cube-shaped AS/RS, including order generation, digging, temporary relocation, restacking, multi-AGV movement, and staging. Therefore, the experimental comparison in this study is designed as a controlled ablation-style evaluation that isolates the effects of AGV fleet size, demand-based digging, and task-predictive staging under the same DEVS-based simulation environment. Direct implementation-based comparison with heterogeneous advanced algorithms is left as an important direction for future work.
3. Proposed Simulation Framework
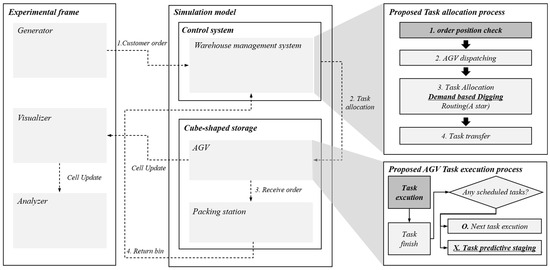
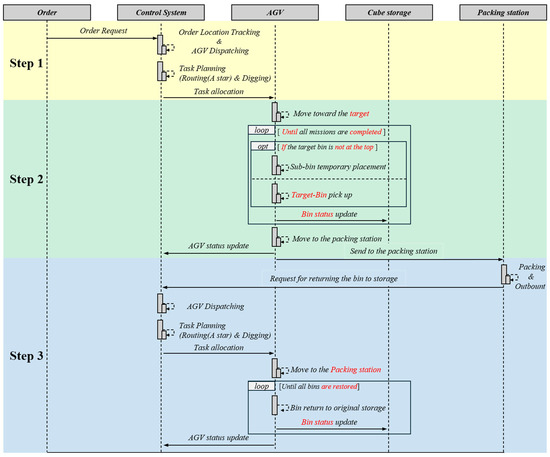
This section provides detailed descriptions of the proposed simulation framework. Figure 1 shows the framework of the proposed cube-shaped AS/RS simulation. The experimental frame was a structural framework for evaluating the operation of the simulation model, consisting of a generator, visualizer, and analyzer. This system generated orders in the Generator module, and the simulation model operated based on the generated orders. Events that occurred during the simulation process were delivered to the Visualizer module and were visualized, and based on these results, the Analyzer module computed the final performance metrics, forming the overall flow of the system.
Figure 1.
Proposed cube-shaped AS/RS simulation framework.
Among these, the generator was a module that loaded customer orders and generated order data at time intervals based on an exponential distribution. The generated order data were randomly created based on the product distribution of a factory that used an actual cube-shaped AS/RS. The Visualizer received events related to the simulation progress and results from the Simulation model and visualized them to support intuitive understanding. In this study, Unity was used to effectively visualize the experimental results and system operation process. The Analyzer model collected and evaluated simulation results, serving as an evaluation model that calculated key performance indicators. In this way [15], the Experimental frame comprehensively supported the entire process of order generation, visualization, and performance evaluation in the simulation environment, enabling effective verification of the proposed cube-shaped AS/RS simulation model.
Simulation model reproduced the operation of the target system in the simulation environment and performed simulations based on the conditions and input data that were set in the Experimental frame [16]. The Warehouse management system model of the Control system was the core model responsible for the core operational logic of the cube-shaped AS/RS simulation, including inventory management, AGV scheduling, and routing assignment. After confirming the order data received from the generator model, it identified the location of the relevant inventory. Based on the identified product location, it assigned the task to the closest AGV according to the Euclidean distance criterion so that it could join the task as quickly as possible.
The tasks assigned to AGVs were broadly categorized into digging operations for product retrieval and path planning. First, a demand-based digging strategy was applied, in which sub-bins located above the target bin were temporarily relocated to surrounding grids with lower demand. By moving sub-bins to areas with lower future access probability, the system prevented repeated digging of the same bins and minimized unnecessary operations during the retrieval process. After this step, the AGV picked up the target bin (Main bin) and transported it to the packing station for unloading. The travel paths of AGVs in the proposed cube-shaped AS/RS were planned using the A STAR algorithm. A STAR was a heuristic best-first search method that guarantees an optimal path on a grid graph when an admissible distance heuristic was used and, at the same time, explores significantly fewer nodes than uninformed methods such as Dijkstra’s algorithm, leading to shorter computation times in large-scale grid environments [17]. Given that the storage locations and aisles were modeled as a discrete grid, A STAR provided an effective trade-off between path optimality, computational efficiency, and collision-free navigation for automated storage and retrieval systems [18].
Algorithm 1 describes the collision-avoidance rule that operated while multiple AGVs moved along their A STAR paths, based on the mission priorities defined in priority and the Euclidean safe distance (safe_distance). At each simulation step, each agv formed a neighbor set of AGVs whose Euclidean distance Euclidean_distance (agv.position, other.position) was less than safe_distance and compared their mission_type values using priority mapping. If any higher-priority AGV existed in this neighborhood, agv.state was kept as “STOP”. Conversely, if no higher-priority AGV was present nearby, the AGV advanced along its A STAR path via move_along_path, enabling safe, priority-aware motion in a multi-AGV environment.
The priority levels were defined such that “Move_to_packing” was assigned the highest priority to expedite outbound orders for customers. To reduce future confusion about bin locations, the restoration tasks “Move_to_restore_sub_bin” and “Move_to_restore_main_bin” were given the next highest priorities so that sub-bins and main-bins were returned to their storage positions promptly. Finally, the approach motion for accessing the main bin, “Move_to_digging”, was assigned the lowest priority, under the assumption that its impact on overall system throughput was relatively small; this design ensured that, in congested areas, outbound and restoration tasks were handled before digging movements.
| Algorithm 1 Priority-based collision avoidance algorithm |
| 1: priority = { 2: “Move_to_packing”: 4, # outbound to packing station 3: “Move_to_restore_sub_bin”: 3, # restore sub-bins 4: “Move_to_restore_main_bin”: 2, # restore main-bin 5: “Move_to_digging”: 1 } # move to digging position 6: while simulation_is_running( ): 7: for agv in agv_list: 8: my_priority = priority[agv.mission_type] 9: near_agvs = [ ] 10: for other in agv_list: 11: if other == agv: 12: continue 13: dist = Euclidean_distance(agv.position, other.position) 14: if dist < safe_distance: 15: near_agvs.append(other) 16: can_move = True 17: for other in near_agvs: 18: other_priority = priority[other.mission_type] 19: if other_priority > my_priority: 20: can_move = False 21: break 22: if can_move: 23: agv.state = “MOVE” 24: agv.position = move_along_path(agv.path, agv.position) 25: else: 26. agv.state = “STOP” |
The responsibilities of AGVs extended beyond simply picking up and unloading the main bin. They also included restoring temporarily relocated sub-bins to their original positions and returning packed bins to the storage system. These multi-stage processes were executed sequentially and cooperatively by multiple AGVs, ensuring the completeness and efficiency of the overall workflow. Finally, upon completing their assigned tasks, AGVs applied the task-predictive staging method, which anticipated upcoming tasks and proactively moved to nearby locations. This strategy allowed AGVs to initiate subsequent operations more quickly, thereby improving not only the efficiency of individual AGVs but also optimizing the overall workflow in multi-AGV environments.
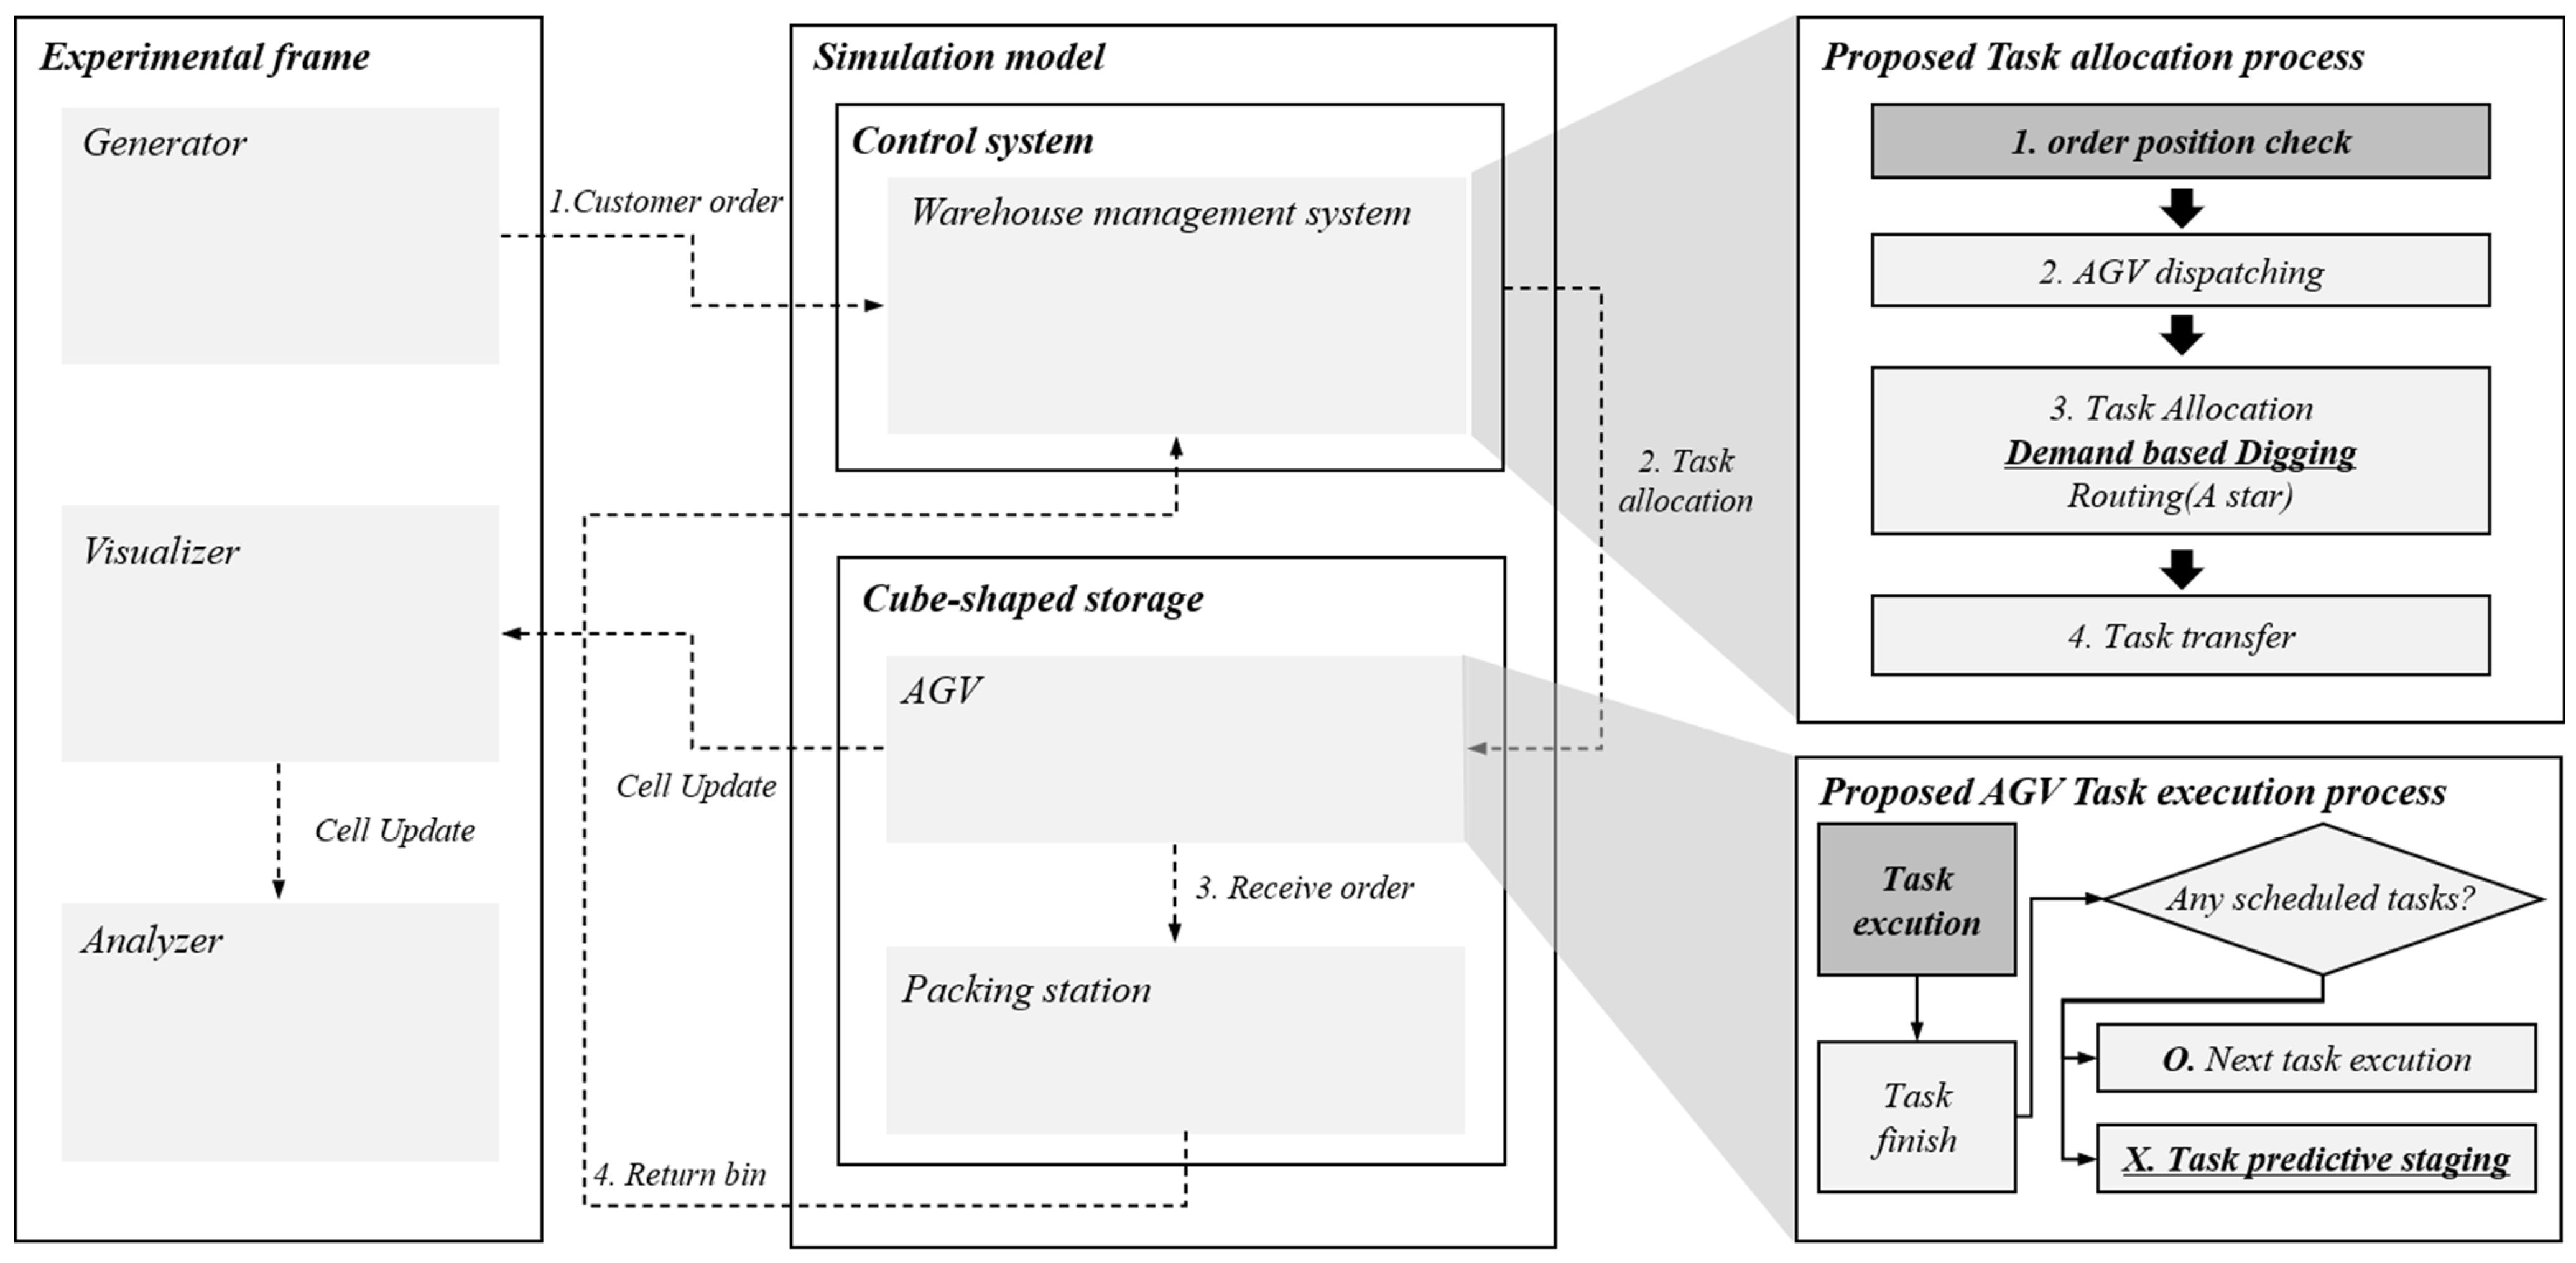
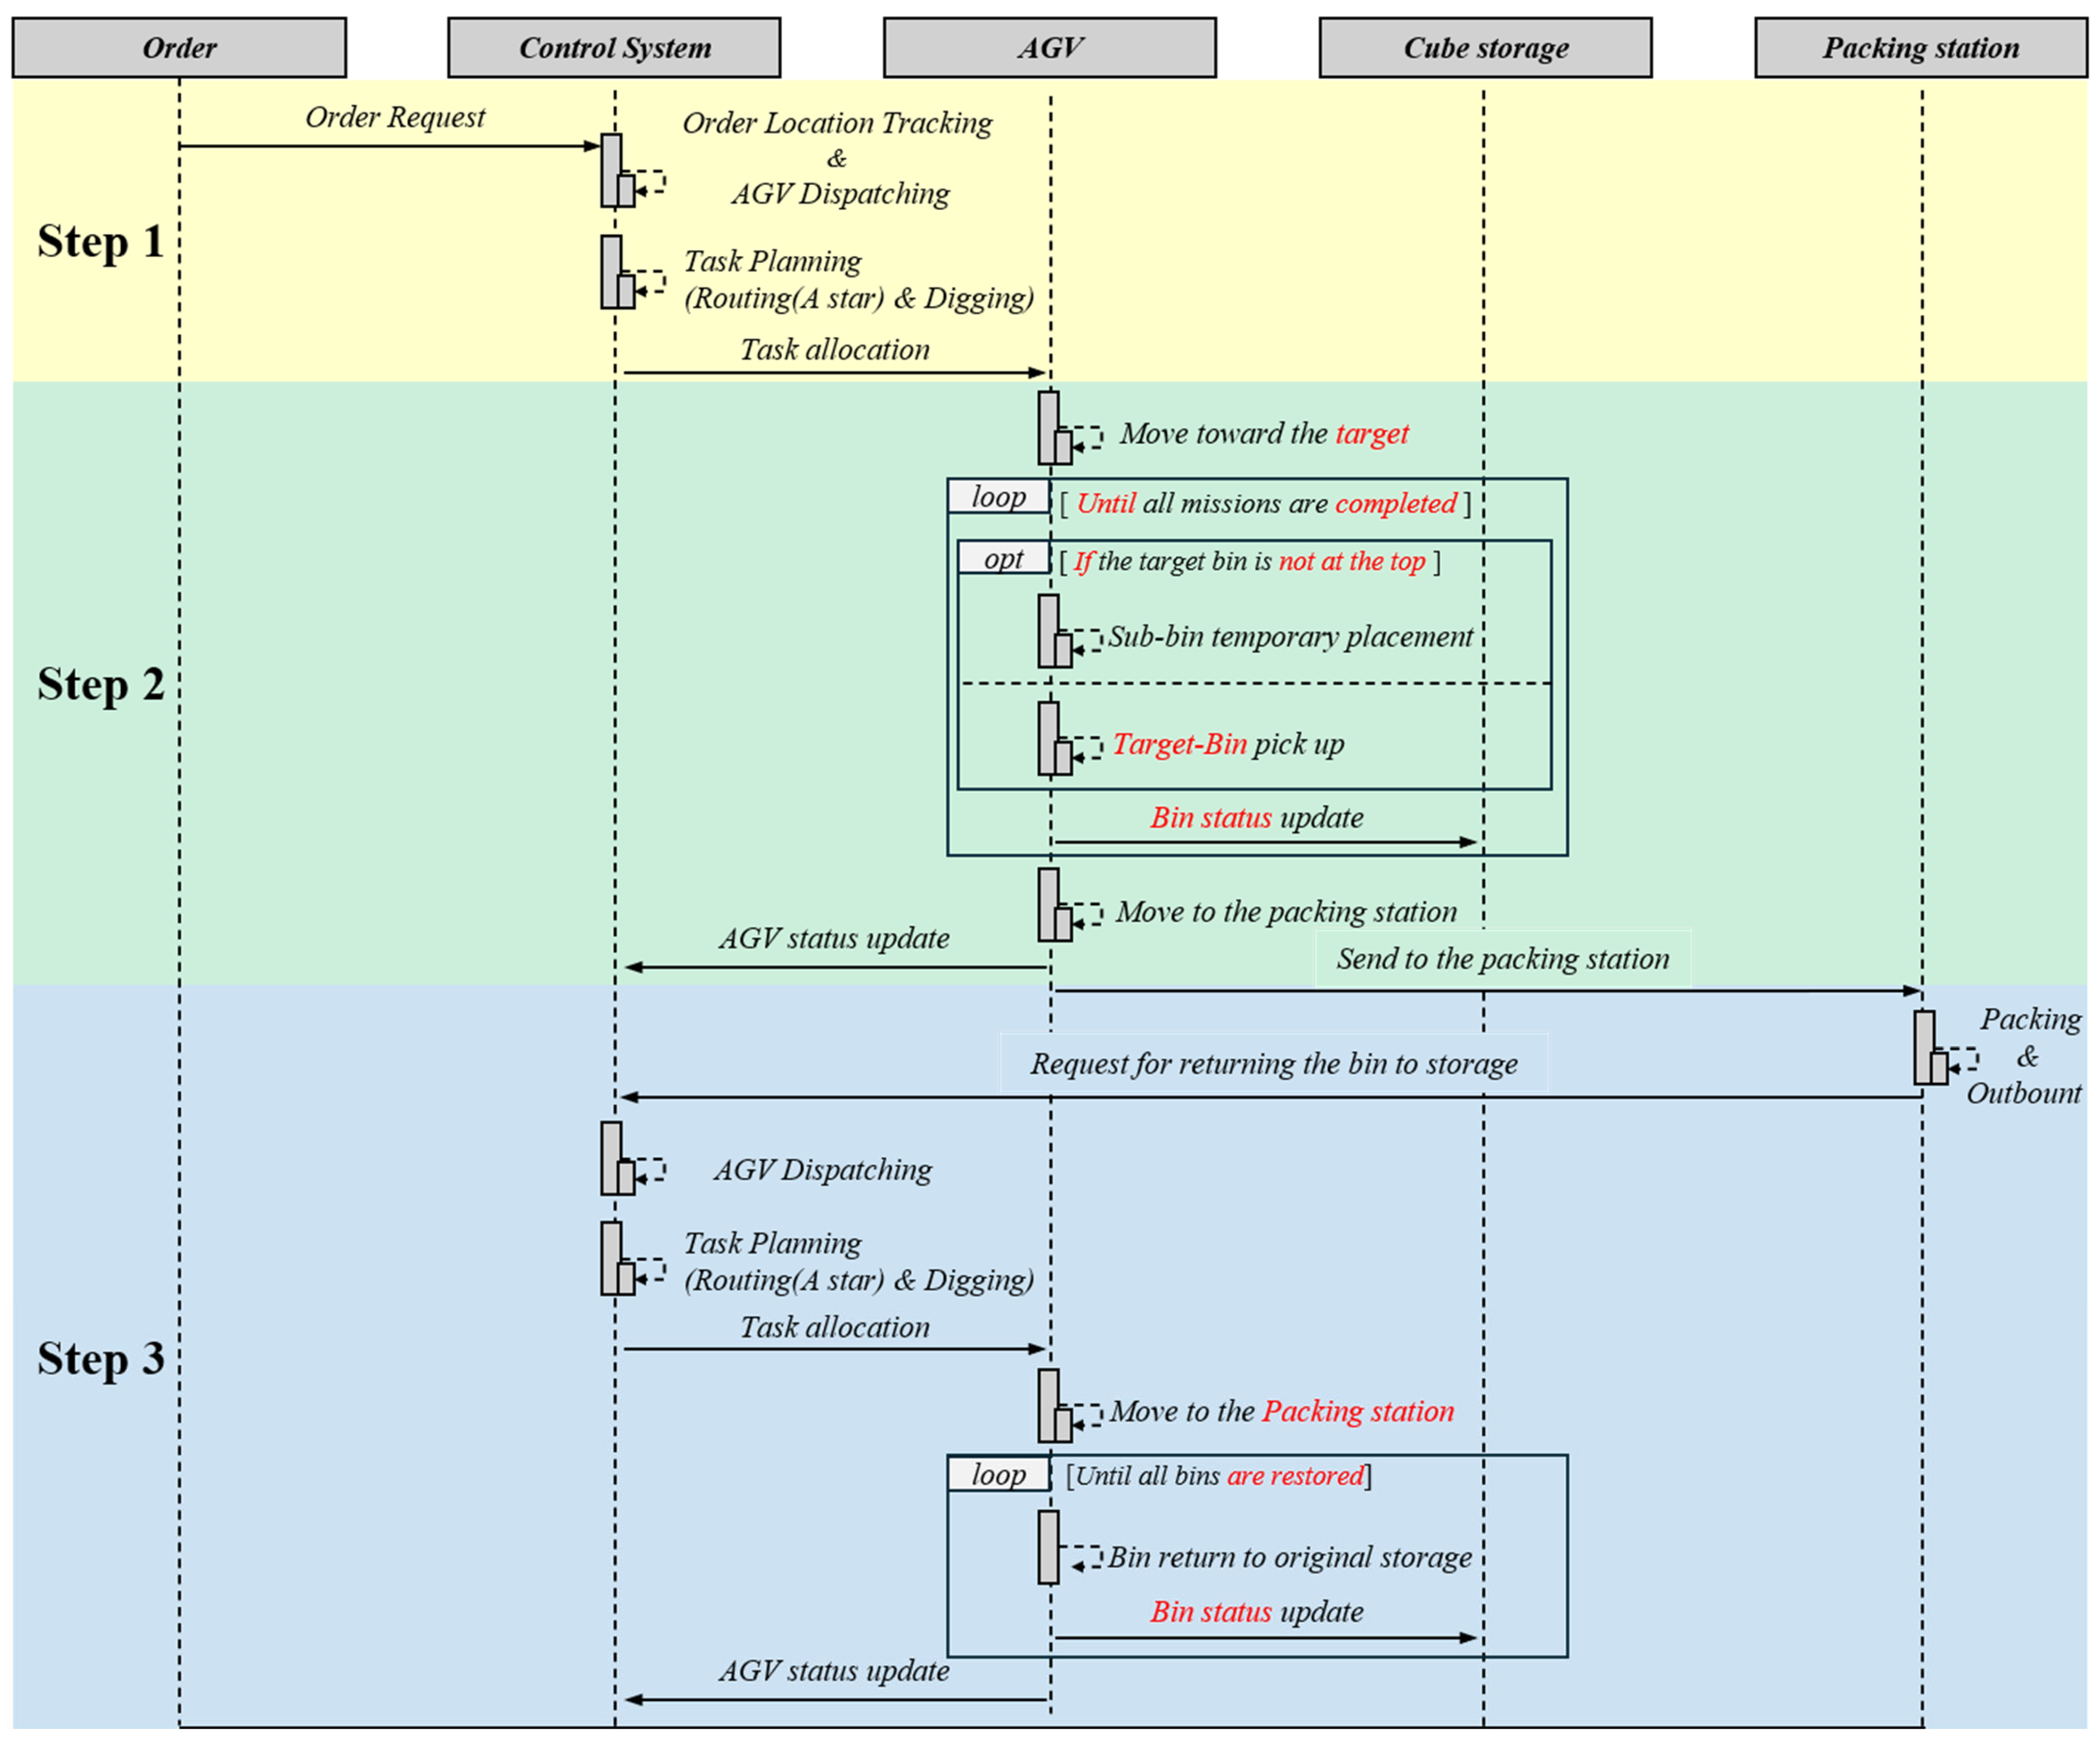
Figure 2 illustrates the sequence diagram of the overall process for an incoming order, from order arrival to shipping and restorage, divided into three steps. The yellow region corresponds to Step 1, where once an order is received, the control system identifies the product location and assigns the retrieval task to a selected AGV, representing the product search and task assignment stage. In this stage, the control system assigns not only the travel path to the AGV but also the complete mission, including post-movement picking and transportation.
Figure 2.
Cube-shaped AS/RS process sequence diagram.
The green region represents Step 2, in which the AGV, having received its path and mission, moved to the target location and performs the digging process. Upon arriving at the target bin, the AGV carries out a digging operation by removing the sub-bins stacked above the target bin. After the digging of temporary bins is completed, the AGV picks up the target bin and transports it to the packing station. During this process, other AGVs retrieve the temporarily relocated sub-bins and return them to their original storage locations, where restorage is performed with priority given to bins with lower demand.
The blue region corresponds to Step 3 and represents the restorage stage for bins containing remaining products after shipping. When the packing station sends a bin-returning request to the control system, the restorage task is assigned to another AGV. This AGV moves to the packing station, collects the main bin and the temporarily relocated sub-bins, and restores them to their original storage positions, thereby completing the entire process.
In this way, the cube-shaped automated storage and retrieval system (AS/RS) is designed so that multiple AGVs operate cooperatively through three stages (1) product search and retrieval, (2) transportation and packing, and (3) restorage—enabling efficient handling of the entire workflow from product retrieval to restorage [19].
3.1. Control System—Warehouse Management Model
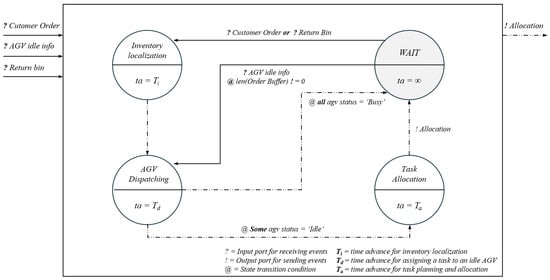
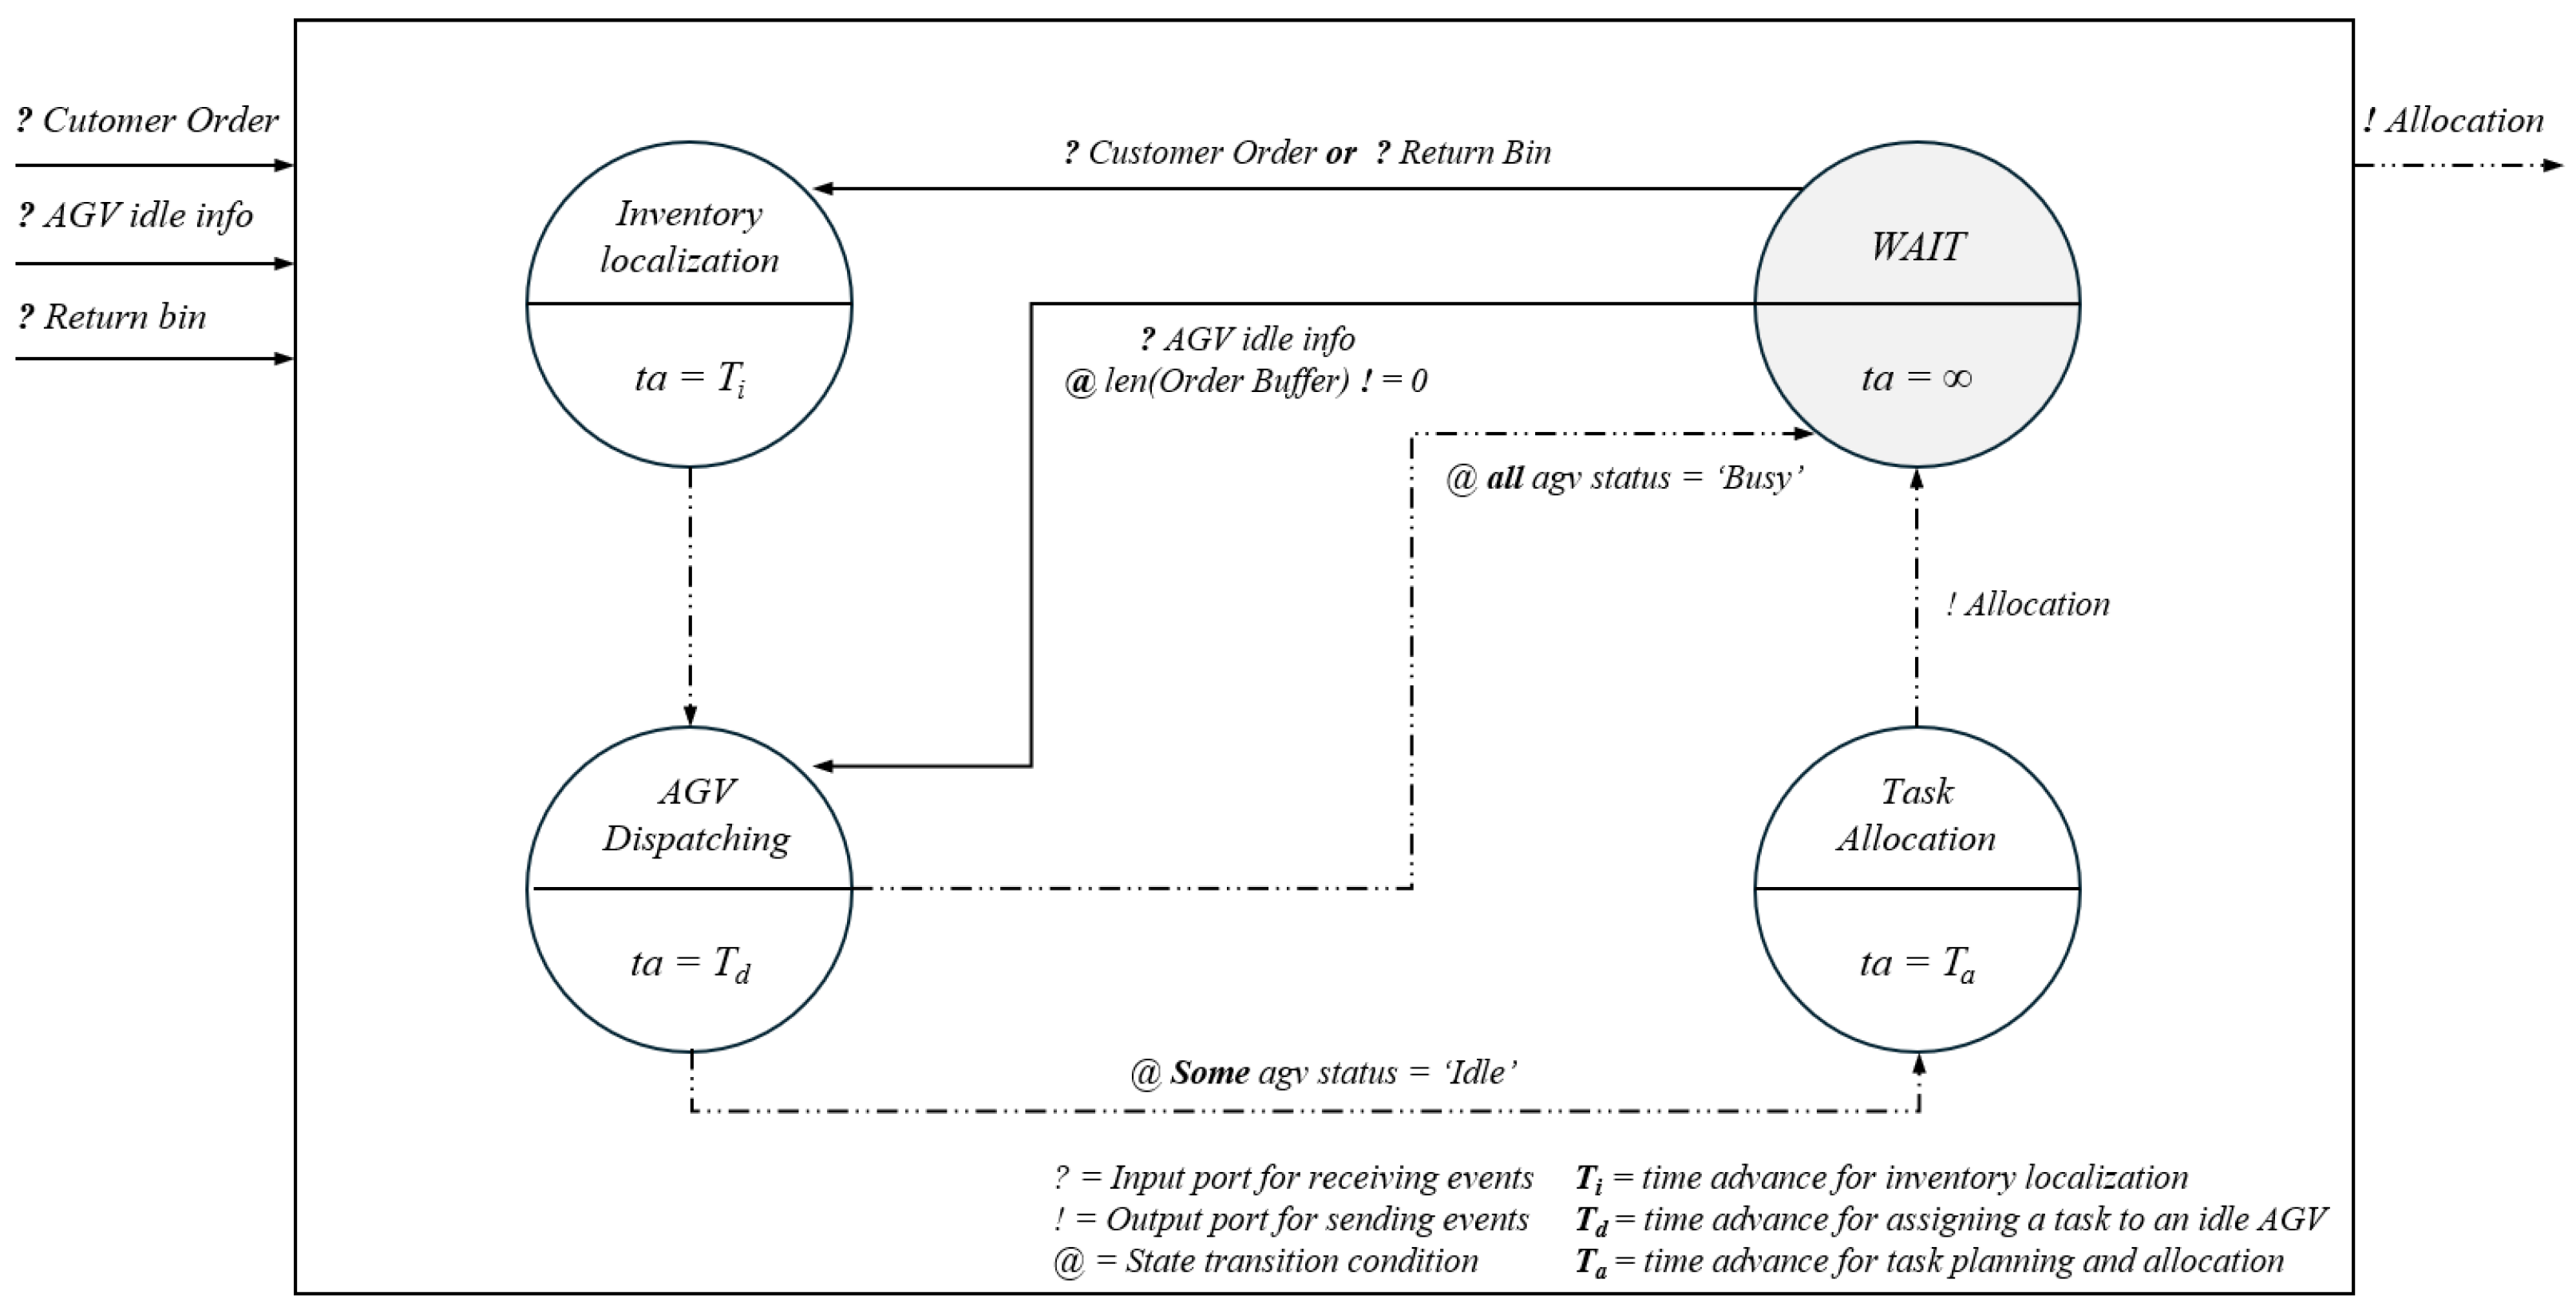
Figure 3 illustrates the state transition process of the Control System DEVS atomic model. The system remains in wait state as long as no events occur. This state corresponds to situations where there are no pending tasks or all AGVs are currently engaged in other missions, and no additional control actions are required. When an external event (Customer Order or Return bin) occurs, the system transitions to the Inventory localization state. This state represents the phase in which the system searches for the location of the ordered item. During the time advance , the system retrieves the three-dimensional storage position and current inventory information of the ordered product. Once the position search is completed, the system transitions to the AGV Dispatching state. In this state, during the time advance , the system assigns the task to an idle AGV that can complete the work in the shortest time. If all AGVs are in a busy state, the system returns to the wait state and remains there until an idle AGV becomes available. Conversely, if an idle AGV is available, it is designated as the task executor, and the system transitions to the Task allocation state. In the task allocation state, the system determines the digging task and the execution sequence based on the product’s storage location. At this point, an Allocation event is generated, and the tasks and paths are organized into a list and sent to the AGV so that it can perform the appropriate operations. The AGV then receives a non-preemptive task sequence and executes it continuously, in the order defined in the list, until all tasks are completed without any preemption.
X = {Customer Order, AGV idle info, Return bin}
Y = {Allocation}
S = {Wait, Inventory localization, AGV Dispatching, Task allocation}
Figure 3.
Control system (Warehouse management) DEVS diagram.
Equations (1)–(8) represent the Warehouse Management model specification based on the DEVS format. The proposed system is defined by the input , output , state set , internal transition function , external transition function , output function λ, and time advance function ta as shown in Equation (1) [20,21,22]. The input consists of customer order, AGV idle info, and Return bin, which represent external events arriving at the system. The output is defined as the allocation of AGVs or resources, which represents the decision-making results provided by the system to the outside. The state consists of four states: Wait, Inventory localization, AGV Dispatching, and Task allocation, which represent the processing steps within the system. The external transition function specifies that when customer orders, return bin, and AGV idle info are given as inputs, the state transitions to either inventory localization or AGV dispatching. The internal transition function represents the rules for internal state changes within the system, defining transitions from inventory localization c to AGV dispatching, and from AGV dispatching back to inventory localization or task allocation. The output function generates the final output (task allocation) only in the allocation, while the time advance function specifies the dwell time for each state, setting the waiting state to infinity, inventory location verification to , AGV dispatching to , and task allocation to .
3.1.1. Task Allocation Algorithm
Algorithm 2 shows the procedure for assigning tasks to AGVs in the Task Allocation state of the Warehouse Management model. First, the system checked the 3D location of the order item get_bin_location() and assigned the z-coordinate of the product to Top_floor for the Digging task setting. Then, it selected the AGV closest to the order item location from among the AGVs in the “idle” state (allocation_agv) and assigned the task to that AGV. For the selected AGV, the system constructed a task sequence considering the height of the product, and if the target item was not located at the top, it searched for the sub-bin loaded at the top through get_bins_above and added a “Digging” task to temporarily place it. Next, it registered the mission, including loading the ordered item (“Load”), searches for the packing station (get_nearest_packing_station), and added the movement path to that point as “MoveToPackingStation” Finally, it performed sequentially included unloading at the packing station (“Unload”) and return movement (“MoveTo”), then assigned the entire mission sequence to the selected AGV using assign_mission_sequence.
| Algorithm 2 Mission allocation algorithm |
| 1: item_position = get_bin_location(order_item) 2: idle_agvs = get_idle_agv_list() 3: min_dist = float(‘inf’) 4: Top_floor = Cube_storage.z 5: mission_list = [] 6: for agv in idle_agvs: 7: distance = calc_distance(agv, item_position) 8: if distance < min_dist: 9: min_dist = distance 10: nearest_agv = agv 11: allocation_agv = nearest_agv 12: mission_list.append((“MoveToTarget”, path_to_bin)) 13: mission_list.append((“Load”, order_item)) 14: if item_position = Top_floor: 15: pass 16: else: 17: for bin in sub_bins: 18: mission_list.append((“Digging”, bin)) 19: packing_station = get_nearest_packing_station() 20: mission_list.append((“MoveToPackingStation”, path_to_station)) 21: mission_list.append((“Unload”, packing_station)) 22: assign_mission_sequence(agv, mission_list) 23: return “Mission Sequence Assigned” |
3.1.2. Proposed Demand-Based Digging Algorithm
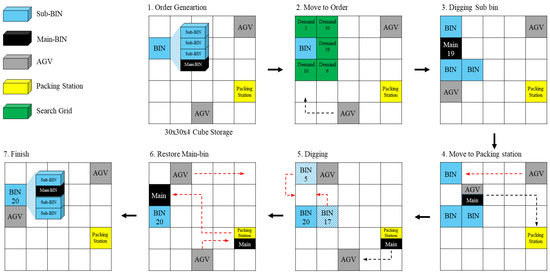
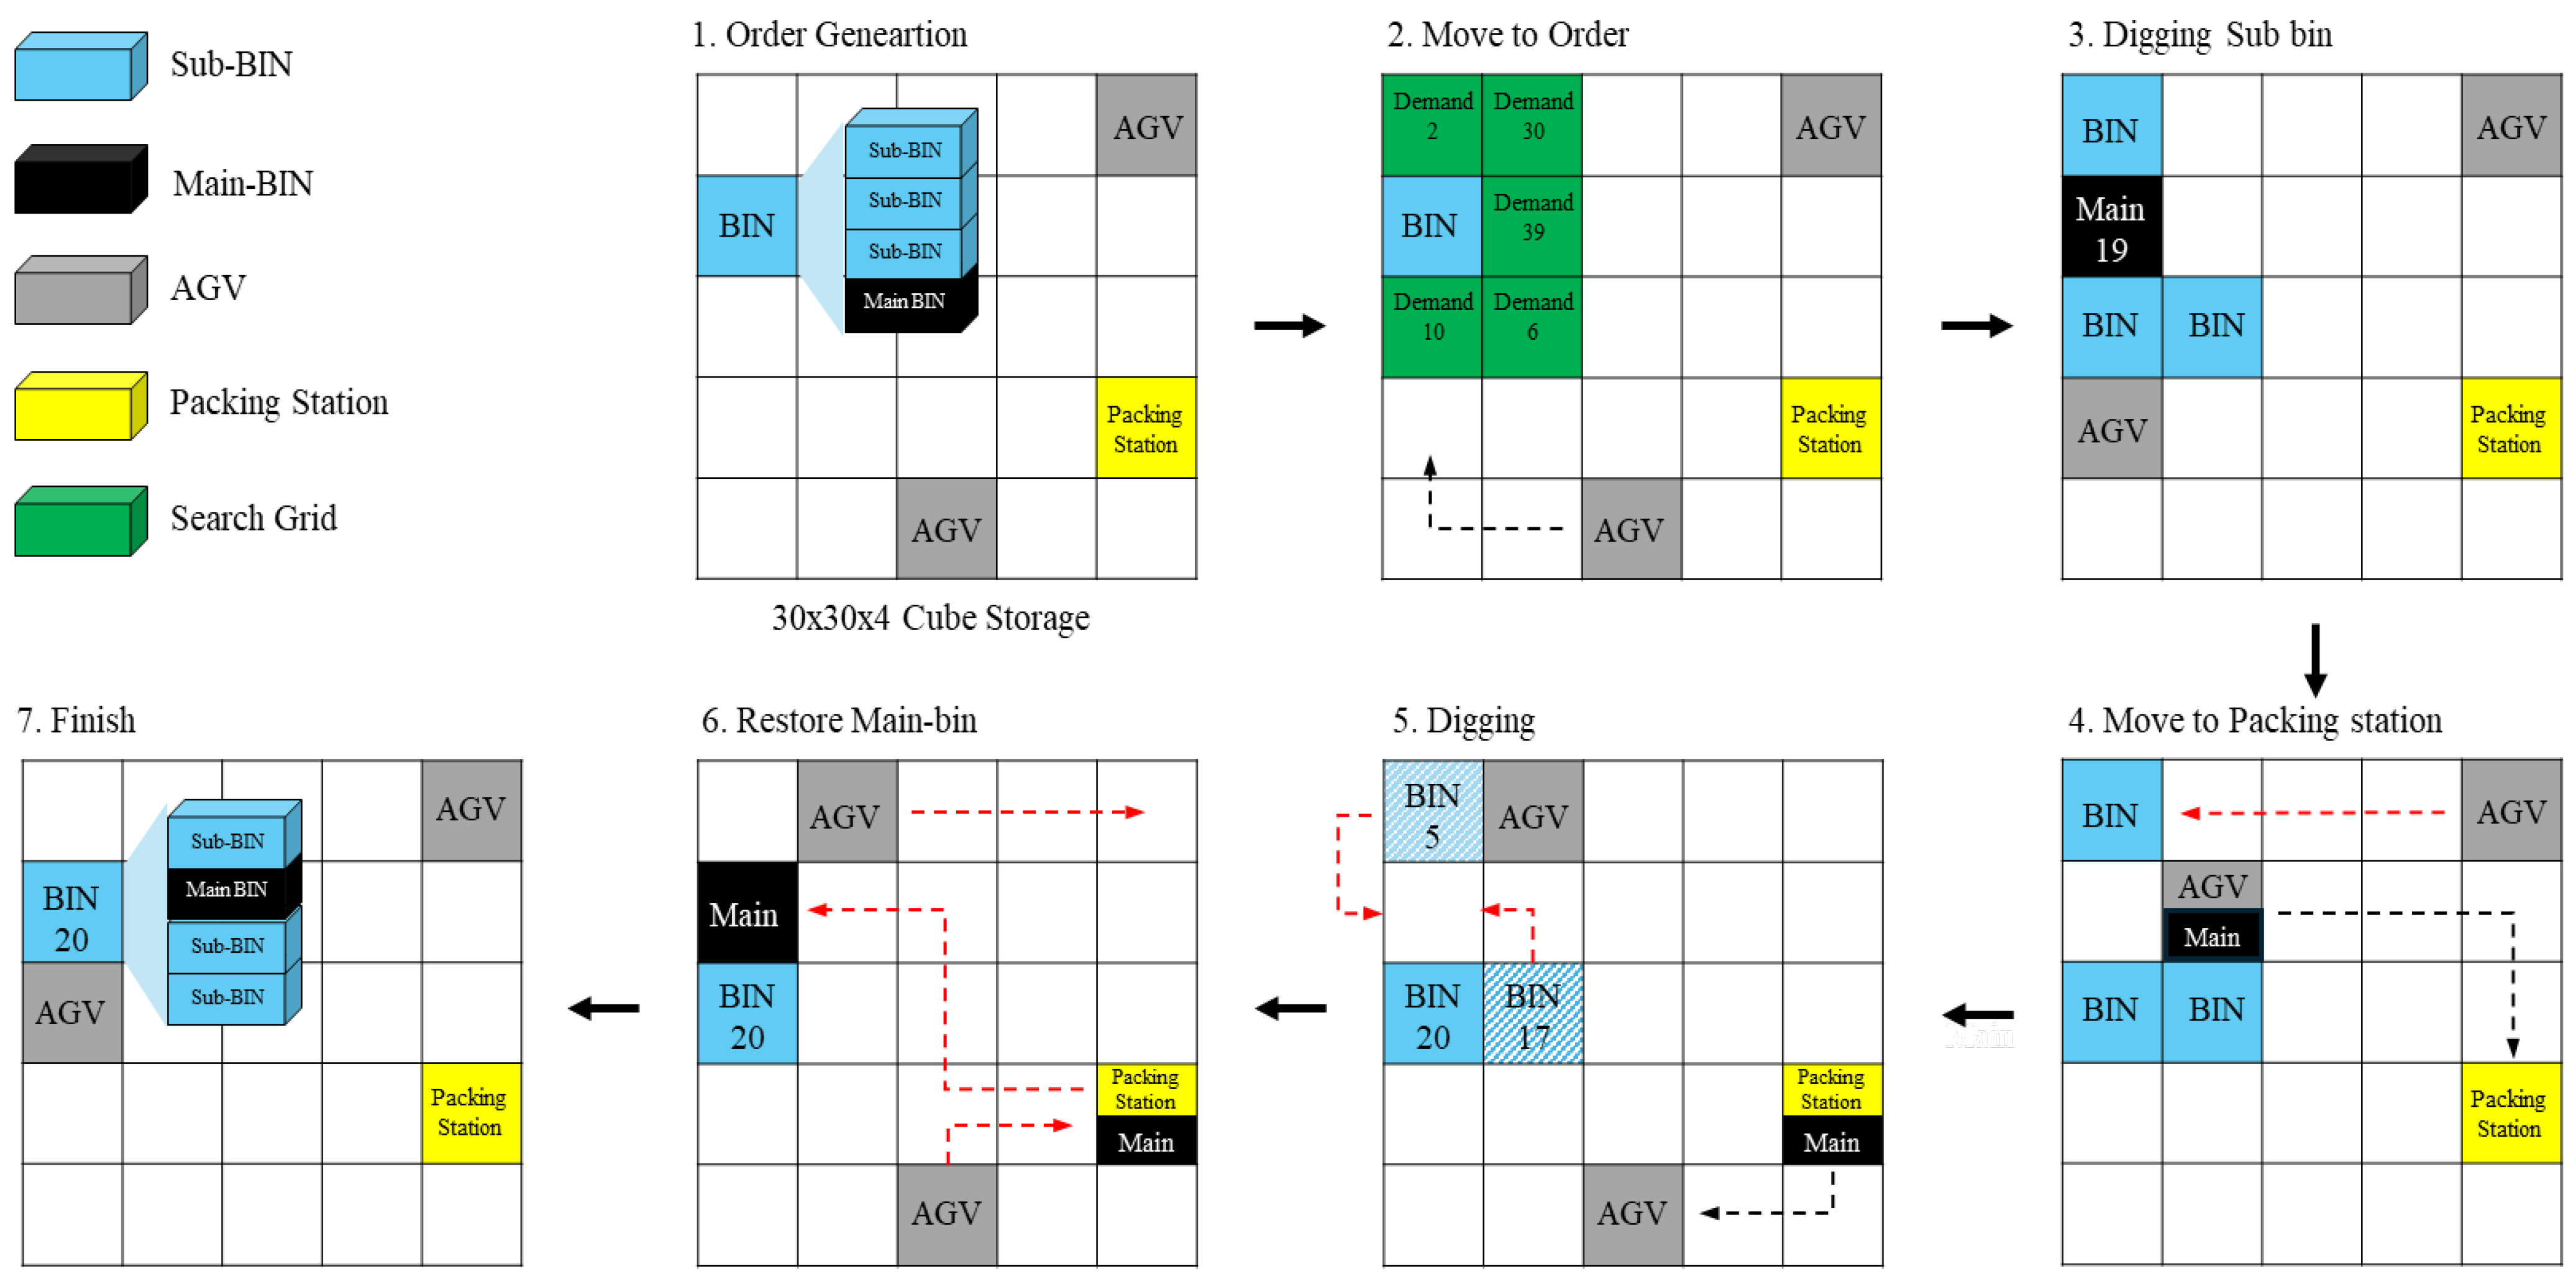
Figure 4 shows the whole flow of the algorithm used when an AGV assigned to a task performs the digging operation. First, (1) when a customer order was placed on the lowest level of the warehouse, the system assigned an idle AGV to ship the product and (2) the selected AGV moved to the location of the bin containing the ordered product. (3) If the Main-bin was stored at a lower level, the Sub-bins stacked above it had first to be removed. In this case, the AGV searched for a low-demand area within the nearby grid and temporarily placed the Sub-bins on the top layer, referred to as the sub-bin floor. Within this sub-bin floor, Sub-bins were assigned to coordinates in ascending order of the total order demand associated with each coordinate, so that additional digging at the same location was minimized and the Digging task required to access the Main-bin could be performed more efficiently. (4) Once digging was complete, the AGV loaded the main bin and transported it to the nearest packing station. (5) A separate AGV reloaded the temporarily placed sub-bins back into their original structure. If the demand for a sub-bin was higher than that for the main bin, the sub-bin was left in place during the rearrangement process to minimize future digging operations. (6) After order processing was completed at the packing station and the empty container was returned, the AGV moved to that location, picked up the main bin again, and returned it to its original loading position. (7) If any Sub-bins remained un-rearranged, the system first loaded the Main-bin and then sequentially reloaded the remaining Sub-bins. This procedure followed a demand-based sequential loading method, which placed high-demand bins at the top and low-demand bins at the bottom, thereby reducing the frequency of future digging operations and improving overall operational efficiency.
Figure 4.
Proposed demand-based digging process.
3.2. Cube-Shaped AS/RS—AGV Model
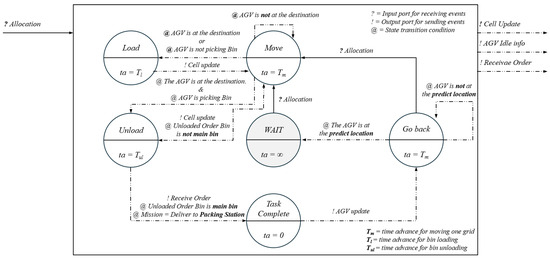
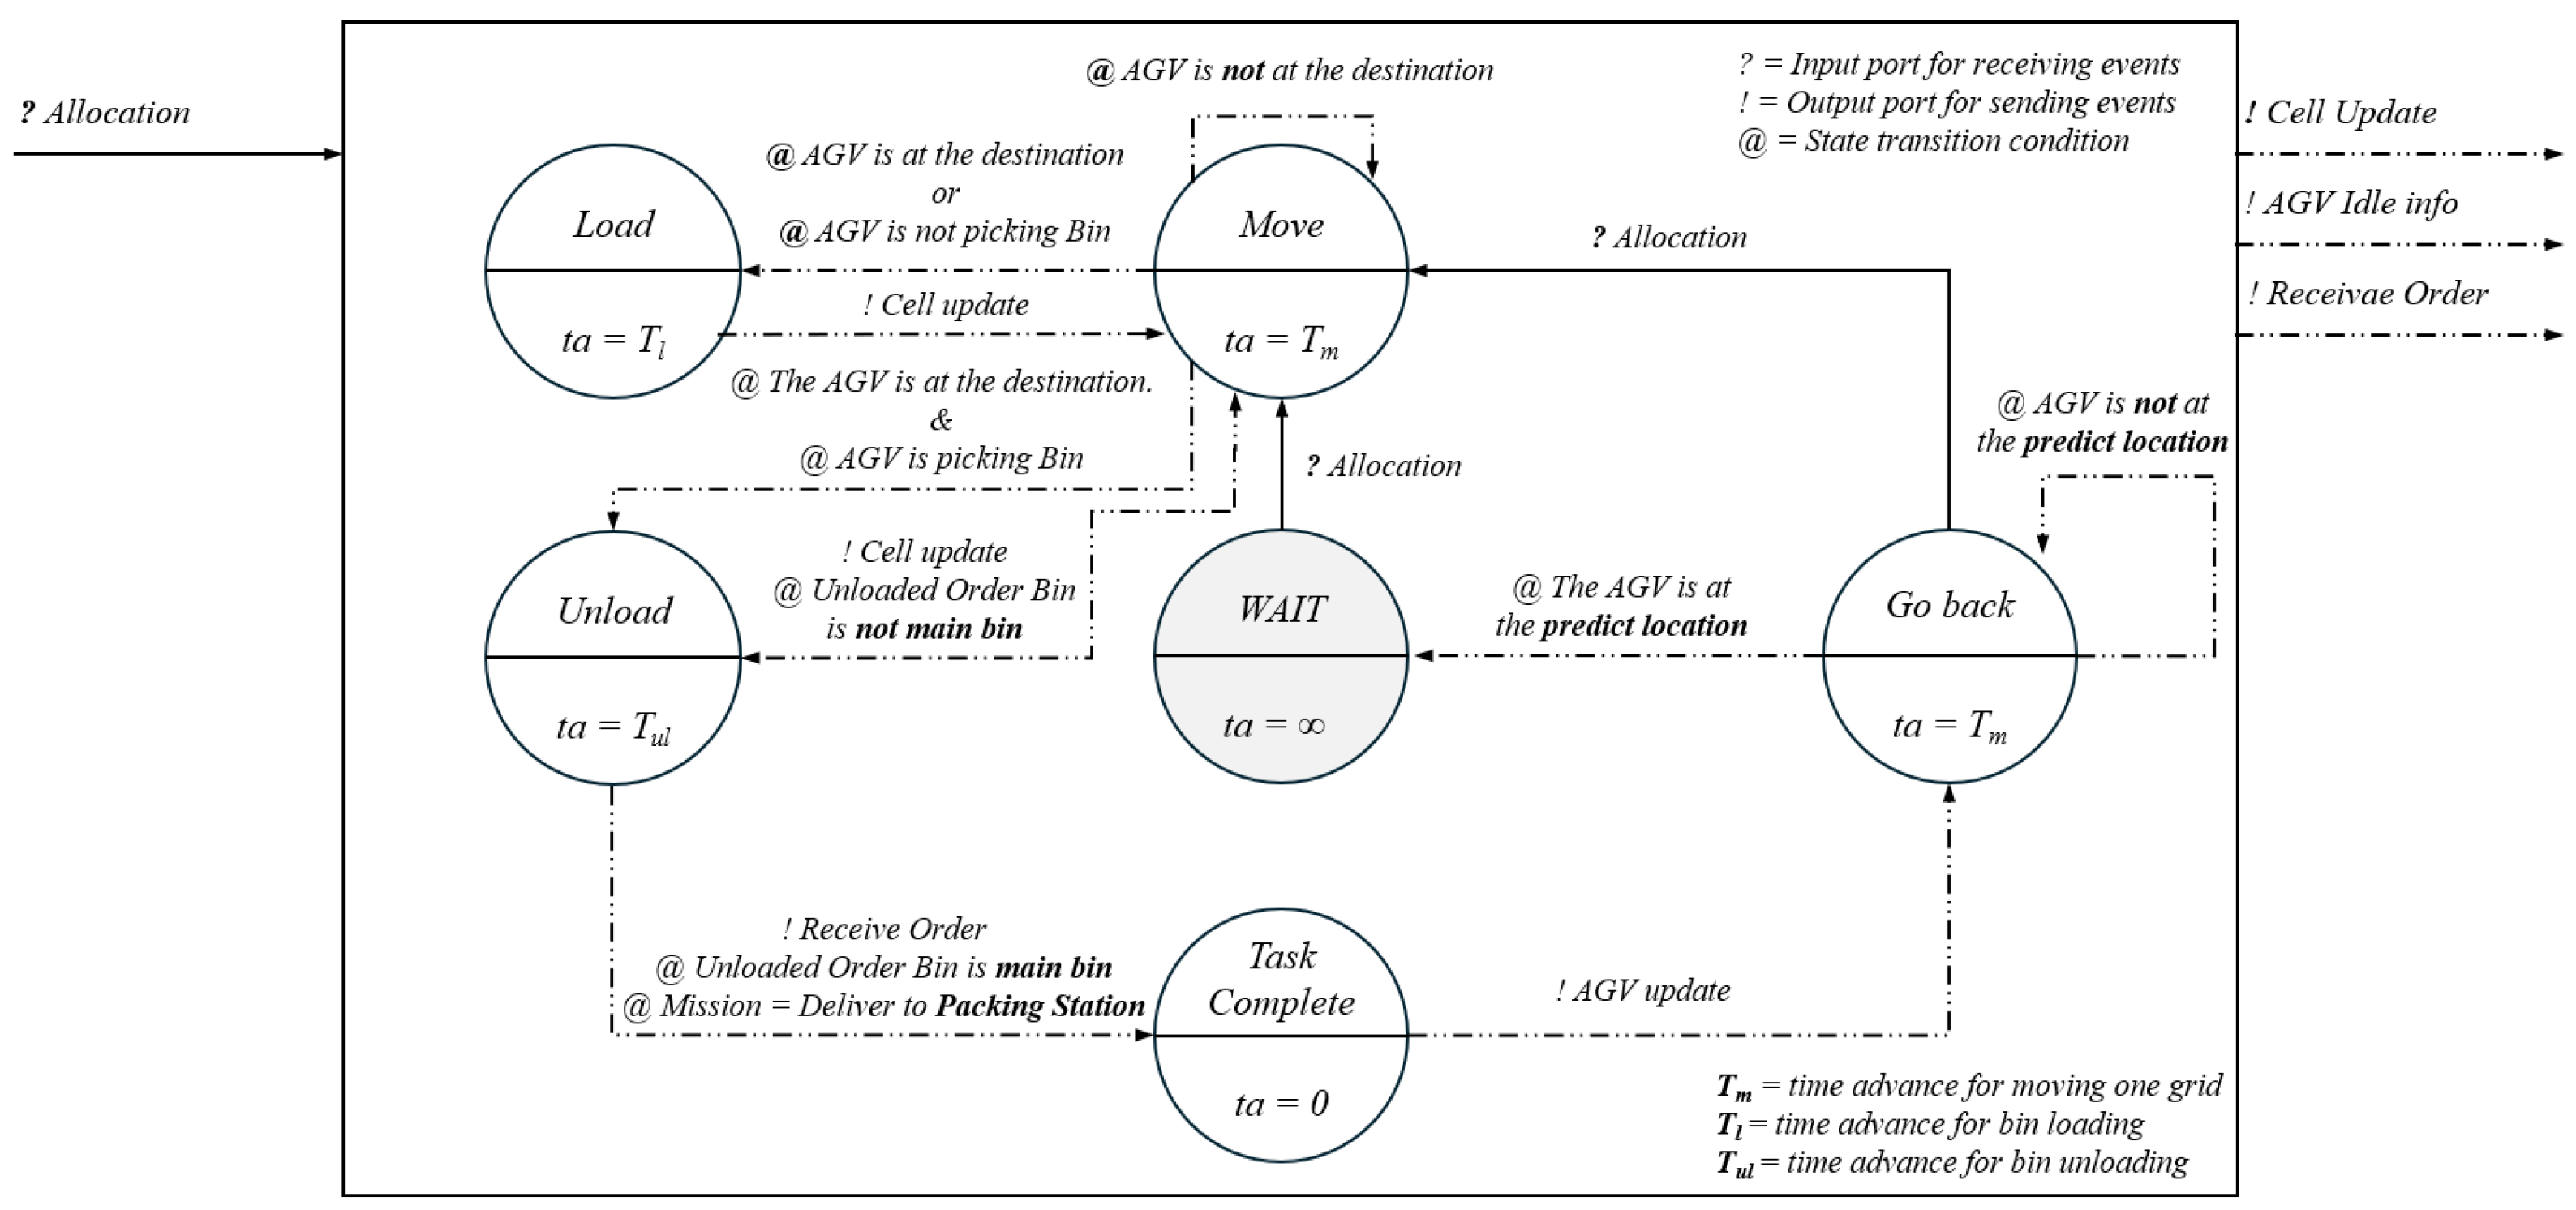
Figure 5 shows the AGV atomic model sequentially performing the mission list received from the warehouse management model. When a task is assigned, the AGV moves to the destination by repeating the Move state. After arriving at the destination, it transitions to the Load and Unload states depending on the task and performs the digging task to proceed with the work. Once the digging and picking tasks are complete, the AGV transitions to the Move state again to move to the packing station or to the Mission Complete state to finish the mission. Once all tasks are complete, the AGV transitions back to Move state to perform the next task if there is one. If there are no tasks, it transitions to the Go back state to predict the next task to be performed and move to the location of that task.
X = {Allocation}
Y = {Cell Update, AGV idle info, Receive order}
S = {Wait, Move, Load, Unload, Task complete, Go back}
Figure 5.
Cube-shaped AS/RS (AGV) DEVS diagram.
Equations (9)–(16) define the operation of the AGV model in the DEVS formalism. The AGV model is represented as The input consists of task allocation messages Allocation delivered from the Warehouse Management system. The output includes Cell Update, which updates the inventory and positional state of the cube storage, AGV idle info, which reports the idle status of the AGV, and Receive order, which represents the delivery of products to the packing station. The state comprises six states: Wait, Move, Load, Unload, Task complete, and Go back, and the AGV performs its mission by repeatedly transitioning through these states. The external transition specifies that the system moves from the Wait state to the Move state when an allocation occurs, and from the Go back state to the Move state when a new allocation is received. The internal transition function defines the main operational procedures of the AGV: transitioning from Move to Load or Unload, returning to Move after Load or Unload, proceeding from Unload to Task complete, then to Go back, and finally returning to Wait state. The output function λ describes the events generated during state transitions: Cell Update occurs at Load, while both Cell Update and Receive order are produced at Unload. Furthermore, during the Task complete state, AGV idle info is generated and delivered to the Warehouse Management system. Finally, the time advance function ta determines the duration of each state, where Wait is set to infinity ∞, Move to , Load to , Unload to , Task complete to 0, and Go back to .
3.2.1. Proposed Task-Predictive Staging Method
In the existing system, there was an inefficiency where AGVs simply returned to their initial positions when they were not assigned to the next task. To improve this, this section proposed two approaches for determining efficient waiting positions by considering the task progress of other AGVs. First, a rule-based waiting position selection algorithm was applied to calculate the remaining task time and travel distance, thereby determining an appropriate waiting position. Second, we proposed a method for AGVs to learn reasonable waiting positions through information sharing and interaction by utilizing MAPPO (Multi-Agent Proximal Policy Optimization), a multi-agent reinforcement learning technique.
Rule-Based Task-Predictive Staging Algorithm
The rule-based task-predictive staging method determined an appropriate waiting position for an AGV to efficiently execute the next task after completing its current one. This method considered the positions of other AGVs and their remaining task times at the moment an AGV finishes its operation, enabling an idle AGV to proceed to the next task without unnecessary delays [23]. Equations (17)–(20) described the cost evaluation process for selecting the optimal waiting position that allows an idle AGV to effectively support busy AGVs. In this formulation, the subscript i denotes an idle AGV that has just completed its task, while the subscript b refers to a busy AGV that is still executing a task. Following previous studies that use normalized distance and time measures for AGV dispatching and AS/RS control [24], we defined as the normalized Euclidean distance between an idle and a busy AGV, and as the normalized remaining task time of the busy AGV. Specifically, represents the Euclidean distance between idle AGV and busy AGV, normalized to the range of 0–1 by dividing by the maximum distance in the environment . denotes the normalized remaining task time of busy AGV, obtained by dividing its remaining execution time by the maximum task time .
These normalized values allowed distance and time to be compared on the same scale, and a balanced cost function was defined by applying weights α and β. Finally, the idle AGV selected the busy b* that minimized the cost and determined its waiting position based on the coordinates , subsequently moving to the designated position. In this way, the proposed method enabled AGVs to perform subsequent tasks more rapidly, thereby improving the overall efficiency of task execution.
Multi-Agent Reinforcement Learning-Based Task-Predictive Staging
The reinforcement learning-based staging algorithm was proposed to overcome the limitations of the rule-based approach [25]. Traditional rule-based methods rely on predefined heuristics, which restrict adaptability to dynamic environments and lead to reduced efficiency in complex situations [26]. In contrast, reinforcement learning enables AGVs to autonomously learn optimal staging strategies through repeated trial-and-error interactions with the environment [27]. In this study, we applied the Multi-Agent Proximal Policy Optimization (MAPPO) algorithm to enable multiple AGVs to cooperate and perform sequential tasks by predicting staging locations. MAPPO allows decentralized agents to learn coordinated strategies through centralized training and decentralized execution, maximizing utilization in dynamic multi-AGV environments and minimizing task handover delays and empty travel [28,29,30]. Table 2 presents the three fundamental components of the reinforcement learning framework: state, action, and reward. The state space is defined as the coordinates of an idle AGV and the coordinates and remaining task time of a busy AGV . The action space consists of five discrete actions: moving up, down, left, right, or remaining stationary.
Table 2.
State, action, and reward design in the reinforcement learning environment.
The reward function was meticulously designed to guide AGVs toward cooperative staging that maximizes overall system efficiency. First, the encouraged idle AGVs to approach target positions efficiently. At each step, a positive reward was provided when the distance to the target decreases, reinforcing movement in the direction of “getting closer.” Second, the provided an additional +5 reward when an idle AGV positions itself near a busy AGV to support its task continuation. This encouraged idle AGVs not to remain idle at meaningless positions, but instead to stage near busy AGVs and prepare for the next process without delay. Third, the is given upon the successful completion of a task, with differentiated values depending on the ratio of idle to busy AGVs. This mechanism encouraged multiple idle AGVs to be reasonably distributed around multiple busy AGVs in various environments, enabling not only individual path optimization but also a balanced staging strategy at the system level. As a result, congestion and imbalance among AGVs were reduced, while task efficiency and resource utilization were improved.
On the other hand, penalties were imposed for inefficient actions. The and the were designed to discourage unnecessary movement and idling. The absolute value of the stop penalty is set higher than that of the movement penalty, based on the assumption that unnecessary idling more severely degrades system resource utilization. Additionally, the prevented idle AGVs from moving unnecessarily after already covering a busy AGV, thereby avoiding meaningless trajectory learning and improving system stability. The strictly penalized collisions between AGVs, preventing safety issues and bottlenecks in real operations. Finally, penalized redundant coverage of the same busy AGV by multiple idle AGVs. This promoted the dispersion of idle AGVs, ensuring balanced resource allocation and improving overall system efficiency.
In summary, the reward structure was designed not only to optimize the trajectory of individual AGVs but also to enable multiple AGVs to cooperatively and equitably select staging positions. Through this mechanism, the MAPPO (Multi-Agent Proximal Policy Optimization) algorithm allowed idle AGVs to move beyond the simple strategy of “waiting at the nearest position,” and instead to learn strategic behaviors that optimize overall task throughput. Consequently, the proposed reinforcement learning-based approach significantly enhanced the operational efficiency of warehouse systems.
Learning Results
In this section, the learning results of the proposed reinforcement learning-based AGV staging algorithm are presented. Table 3 summarizes the hardware specifications and key hyperparameters used in the training. The training was conducted in an environment equipped with an Intel® Core i9-10900K CPU, NVIDIA RTX 3060 Ti GPU, and 32 GB RAM. These specifications meet the minimum requirements to stably handle large-scale parallel computations and simulation processes that occur in multi-agent environments. The learning environment size was configured as a 15 × 15 grid, designed to resemble an actual cube-shaped AS/RS. The number of idle AGVs was set to 2–3, and the number of busy AGVs was also set to 2–3, allowing the training to be performed under various combinations. This setup enabled the environment to capture not only single-AGV or single-task scenarios but also the complexity arising from multiple AGVs and their interactions.
Table 3.
Training environment parameters.
The training episodes were composed of a maximum of 20 steps per episode and 50 episodes per batch. This configuration ensured sufficient interactions within each episode while maintaining stable policy updates during batch training. The hyperparameters were selected with consideration for the convergence stability of the PPO algorithm. The discount factor appropriately reflected the value of future rewards, while GAE balanced bias and variance to improve sample efficiency. The number of PPO update iterations and the clipping coefficient were chosen to suppress instability caused by drastic policy updates and to encourage gradual learning. In addition, an entropy coefficient was introduced to maintain exploration and prevent the agent from converging prematurely to a local optimum. The initial learning rate was set to 1.0 × 10⁻³, and it was decayed to a minimum learning rate of 1.0 × 10⁻⁴ as training progressed, ensuring stable convergence. This configuration allowed for rapid exploration in the early stages of training, followed by fine-grained policy adjustments in the later stages. In summary, the hyperparameter settings of this study were designed to adequately reflect the complexity of multi-AGV interactions and the training environment while minimizing unnecessary variables, thereby ensuring a fair evaluation of the proposed algorithm’s performance.
The training was conducted through a three-stage curriculum, with the difficulty level gradually increasing across stages. In the first stage, the environment was composed of three idle AGVs and two busy AGVs, where idle AGVs were trained to cooperatively maximize the collective reward. In the second stage, both idle and busy AGVs were set to two, encouraging each idle AGV to stage near a single busy AGV. In the final stage, the environment consisted of two idle AGVs and three busy AGVs, requiring idle AGVs to select one of the busy AGVs and learn efficient operational strategies by positioning themselves in an optimal location. Each stage was repeatedly trained, and once a success rate of 95% or higher was continuously achieved, the training was considered successful and progressed to the next stage. To stabilize MARL training and improve convergence, we employed an exponential learning-rate decay schedule. The initial learning rate η0 was set to and decayed at each PPO update according to ηt = max(ηmin, η0 × αt), where ηmin = , α = 0.99975, and t denotes the PPO update iteration.
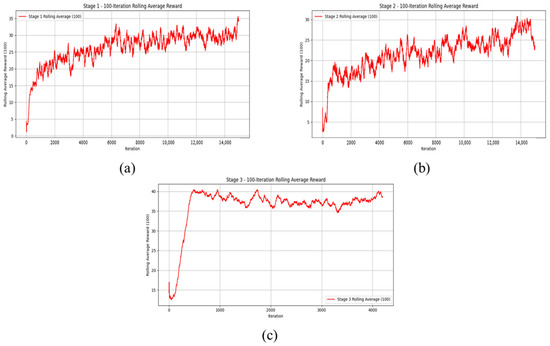
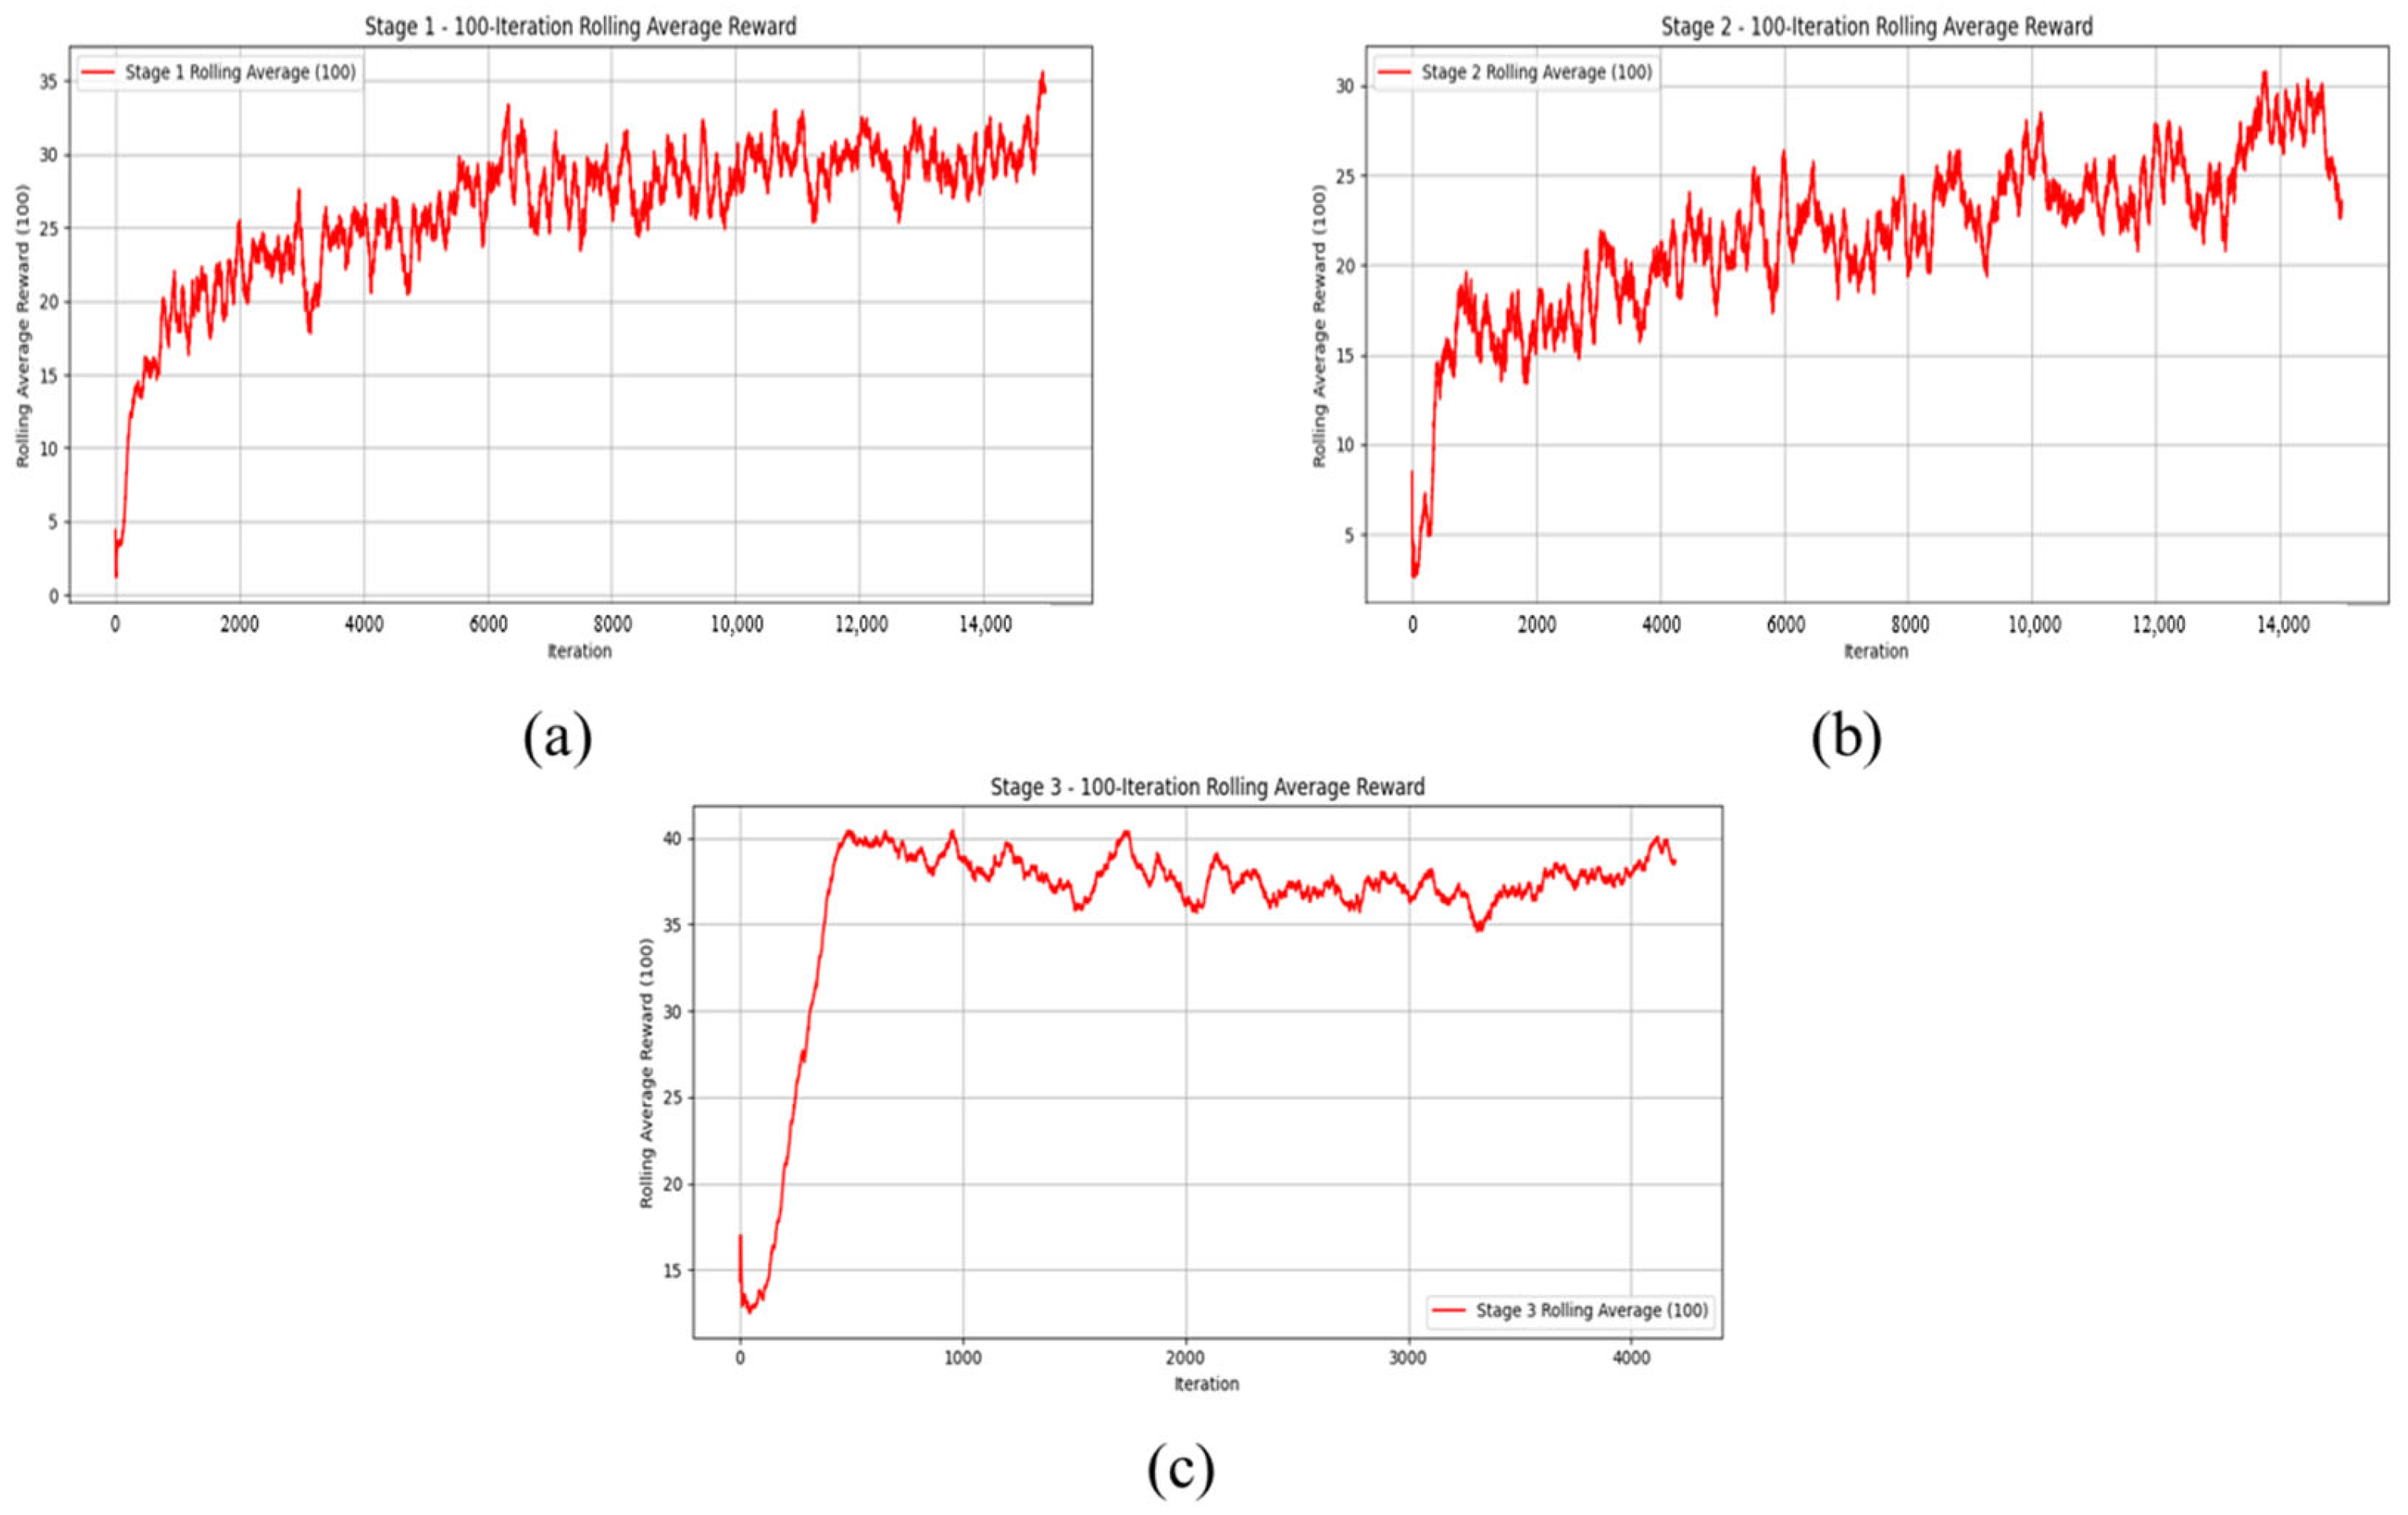
Figure 6 illustrates the reward variation over iterations for each stage. In the first stage, the reward rapidly increased during the initial iterations and stabilized at around an average reward of 25 within approximately 2000 iterations. In the second stage, the training started from a relatively low reward but gradually improved over 10,000 iterations, stabilizing within the range of 20–25. In the third stage, the reward exhibited a steep increase from the beginning and achieved a high average reward of approximately 40 within 1000 iterations, while maintaining stable performance thereafter. These results demonstrated that the proposed algorithm successfully adapts to environments of increasing difficulty and effectively learns improved strategies in a stepwise manner.
Figure 6.
Average reward convergence across training stages: (a) three idle AGVs and two busy AGVs (b) two idle AGVs and two busy AGVs (c) two idle AGVs and three busy AGVs.
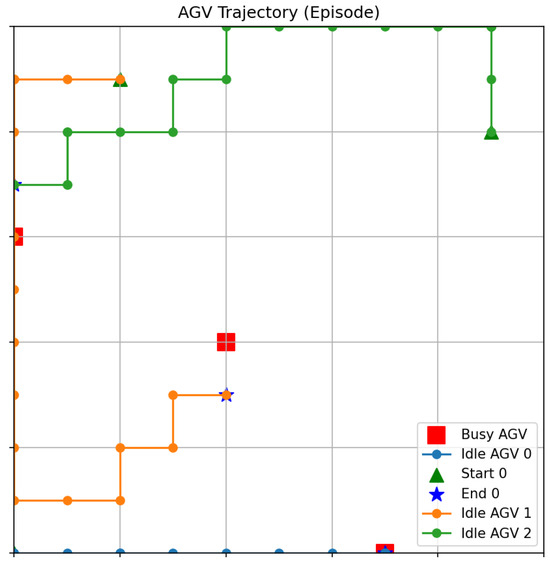
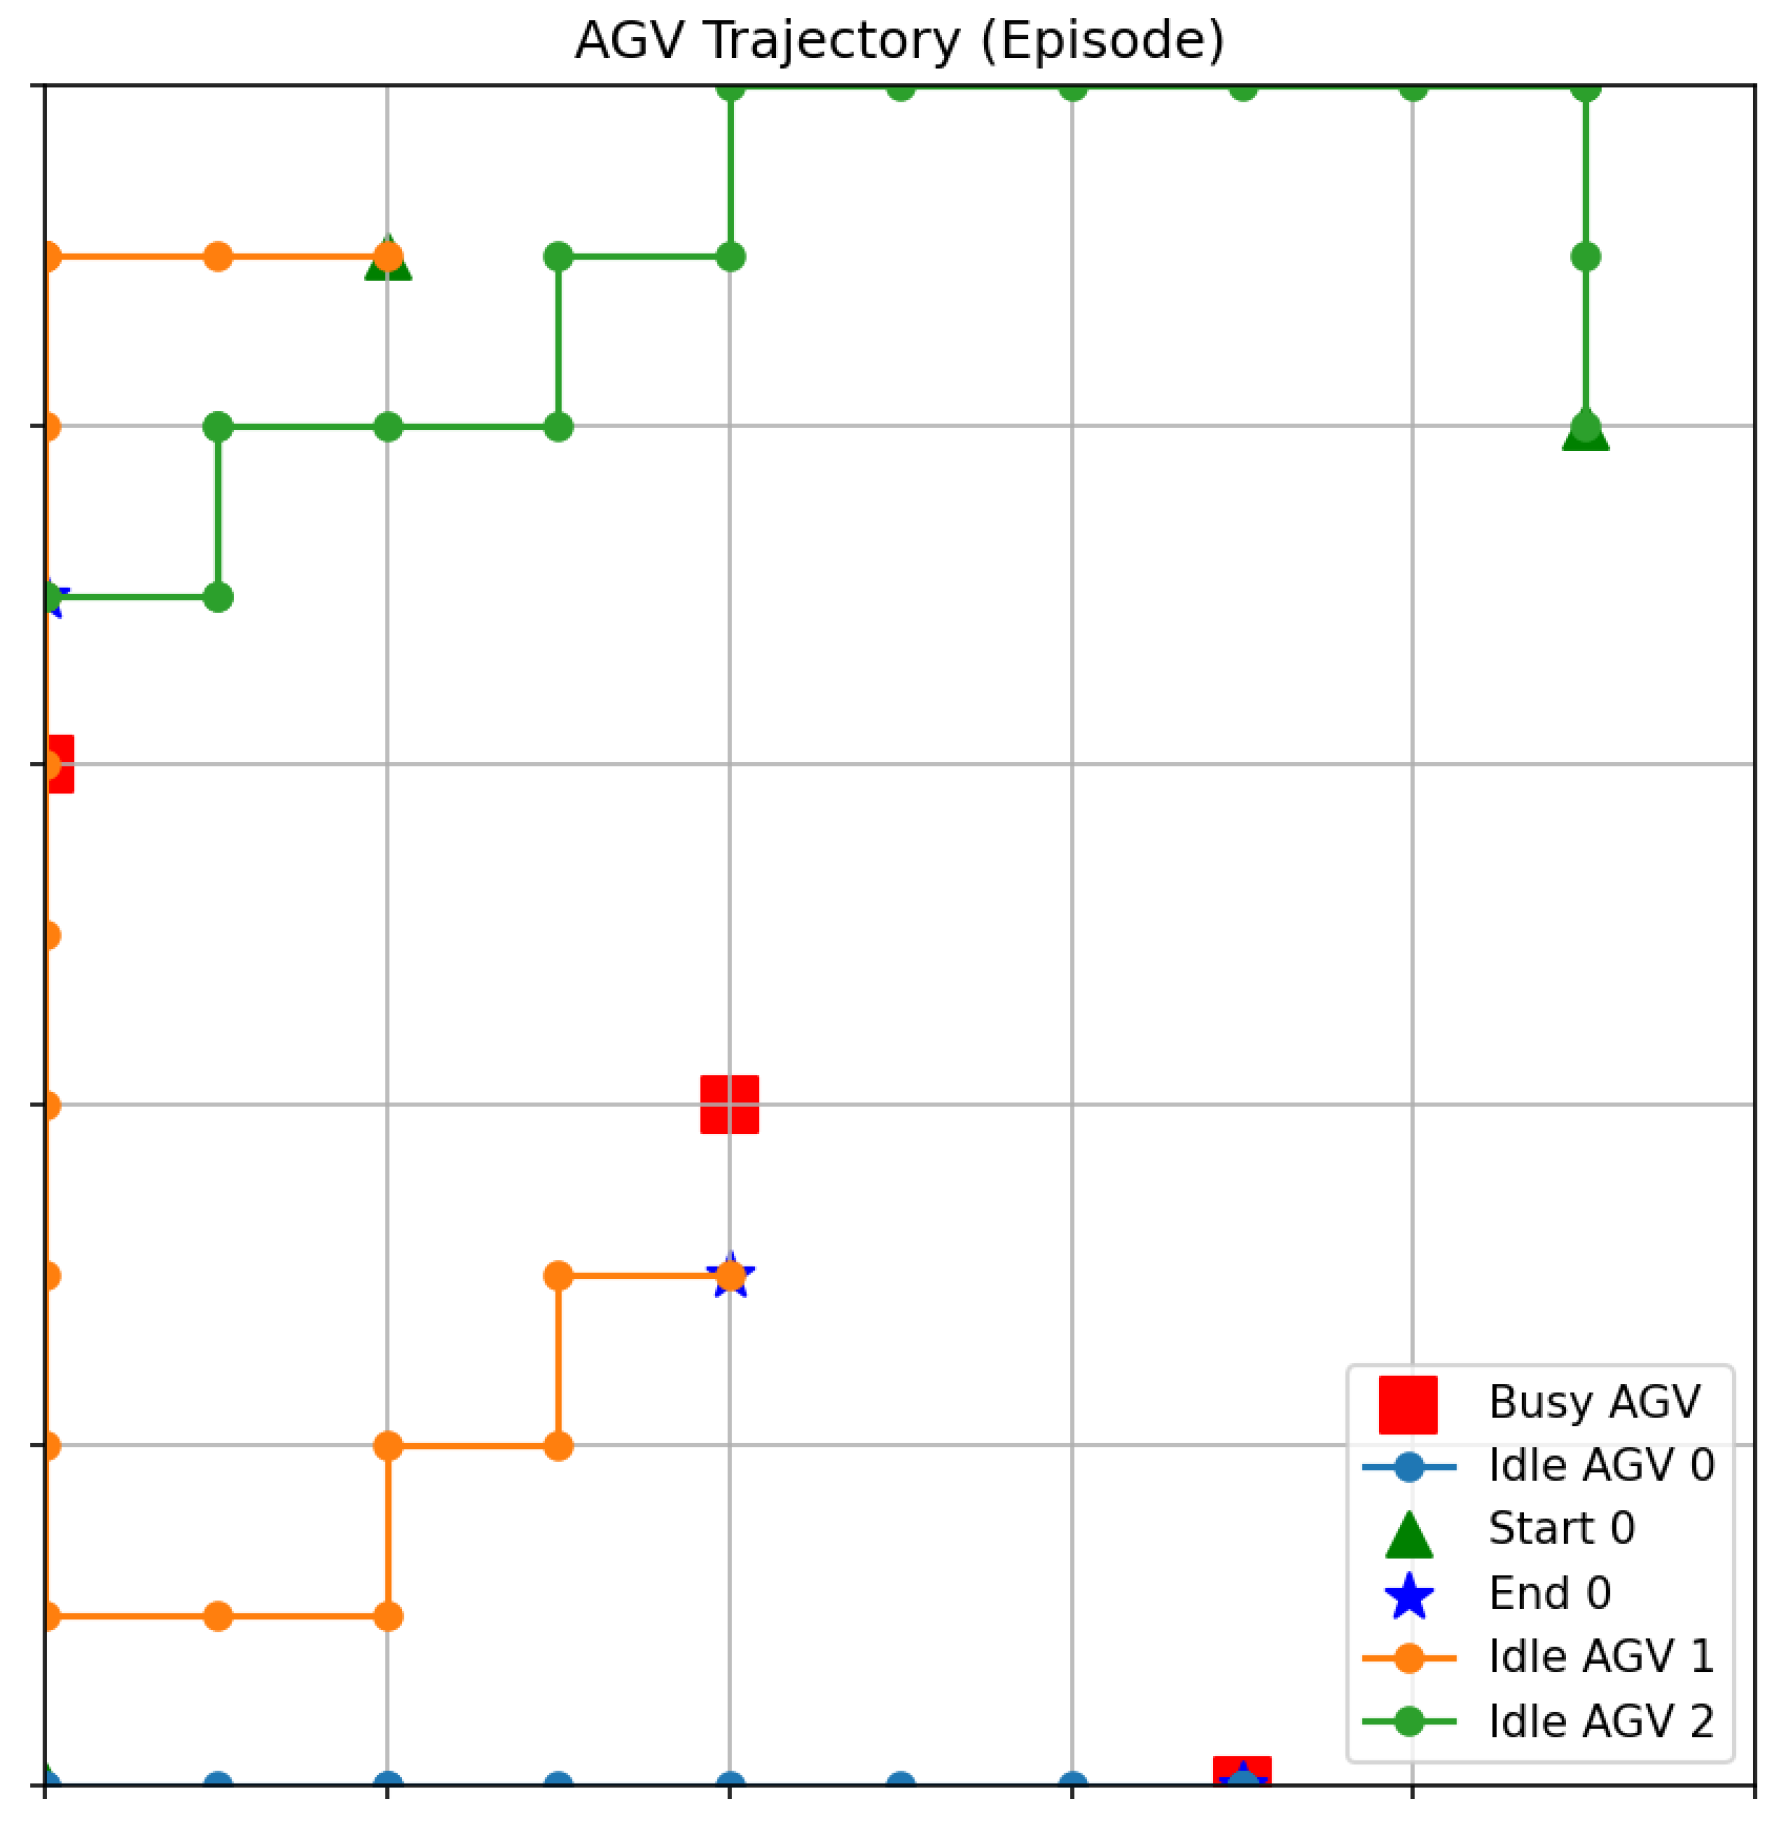
Figure 7 presents an example of the trajectories of idle and busy AGVs under the learned policy. The scenario corresponds to an environment with two idle AGVs and three busy AGVs. As shown in the figure, idle AGVs did not remain in arbitrary positions but instead tended to move closer to busy AGVs in preparation for subsequent tasks. Notably, the trajectories of the idle AGVs were distributed without overlapping and form staging positions that minimize the distance to busy AGVs. This indicated that the proposed reinforcement learning-based algorithm not only optimized the paths of individual AGVs but also learned system-level strategies for efficient resource allocation and staging. Consequently, idle AGVs autonomously positioned themselves near busy AGVs, enabling immediate task takeover upon completion, and thereby improved the overall operational efficiency of the warehouse system.
Figure 7.
Visualization of AGV paths in stage (c): 2 idle and 3 busy AGVs.
4. Implementation
In this paper, we implemented a virtual environment using Unity, a realistic 3D visualization simulator, to verify the operation of a cube-shaped AS/RS. The DEVS-based simulation model and the warehouse simulator were integrated via User Datagram Protocol (UDP) communication. This integration enabled real-time verification and visualization of simulation results. Unity acts as a visualization client: it receives control commands and state information from the DEVS simulator in the form of UDP packets and immediately reflects them in the 3D environment [31].
This allowed various events occurring in the DEVS model to be effectively reflected in the virtual environment within Unity, enabling systematic evaluation of the consistency between physical actions and logical state changes [32,33]. In particular, behaviors that are difficult to capture in a purely code-level simulator, such as congestion patterns, digging and multi-AGV waiting and movement patterns, could be visually verified and evaluated using the 3D, model-based visualization in Unity.
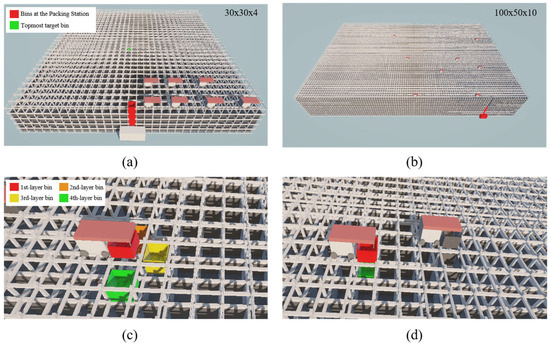
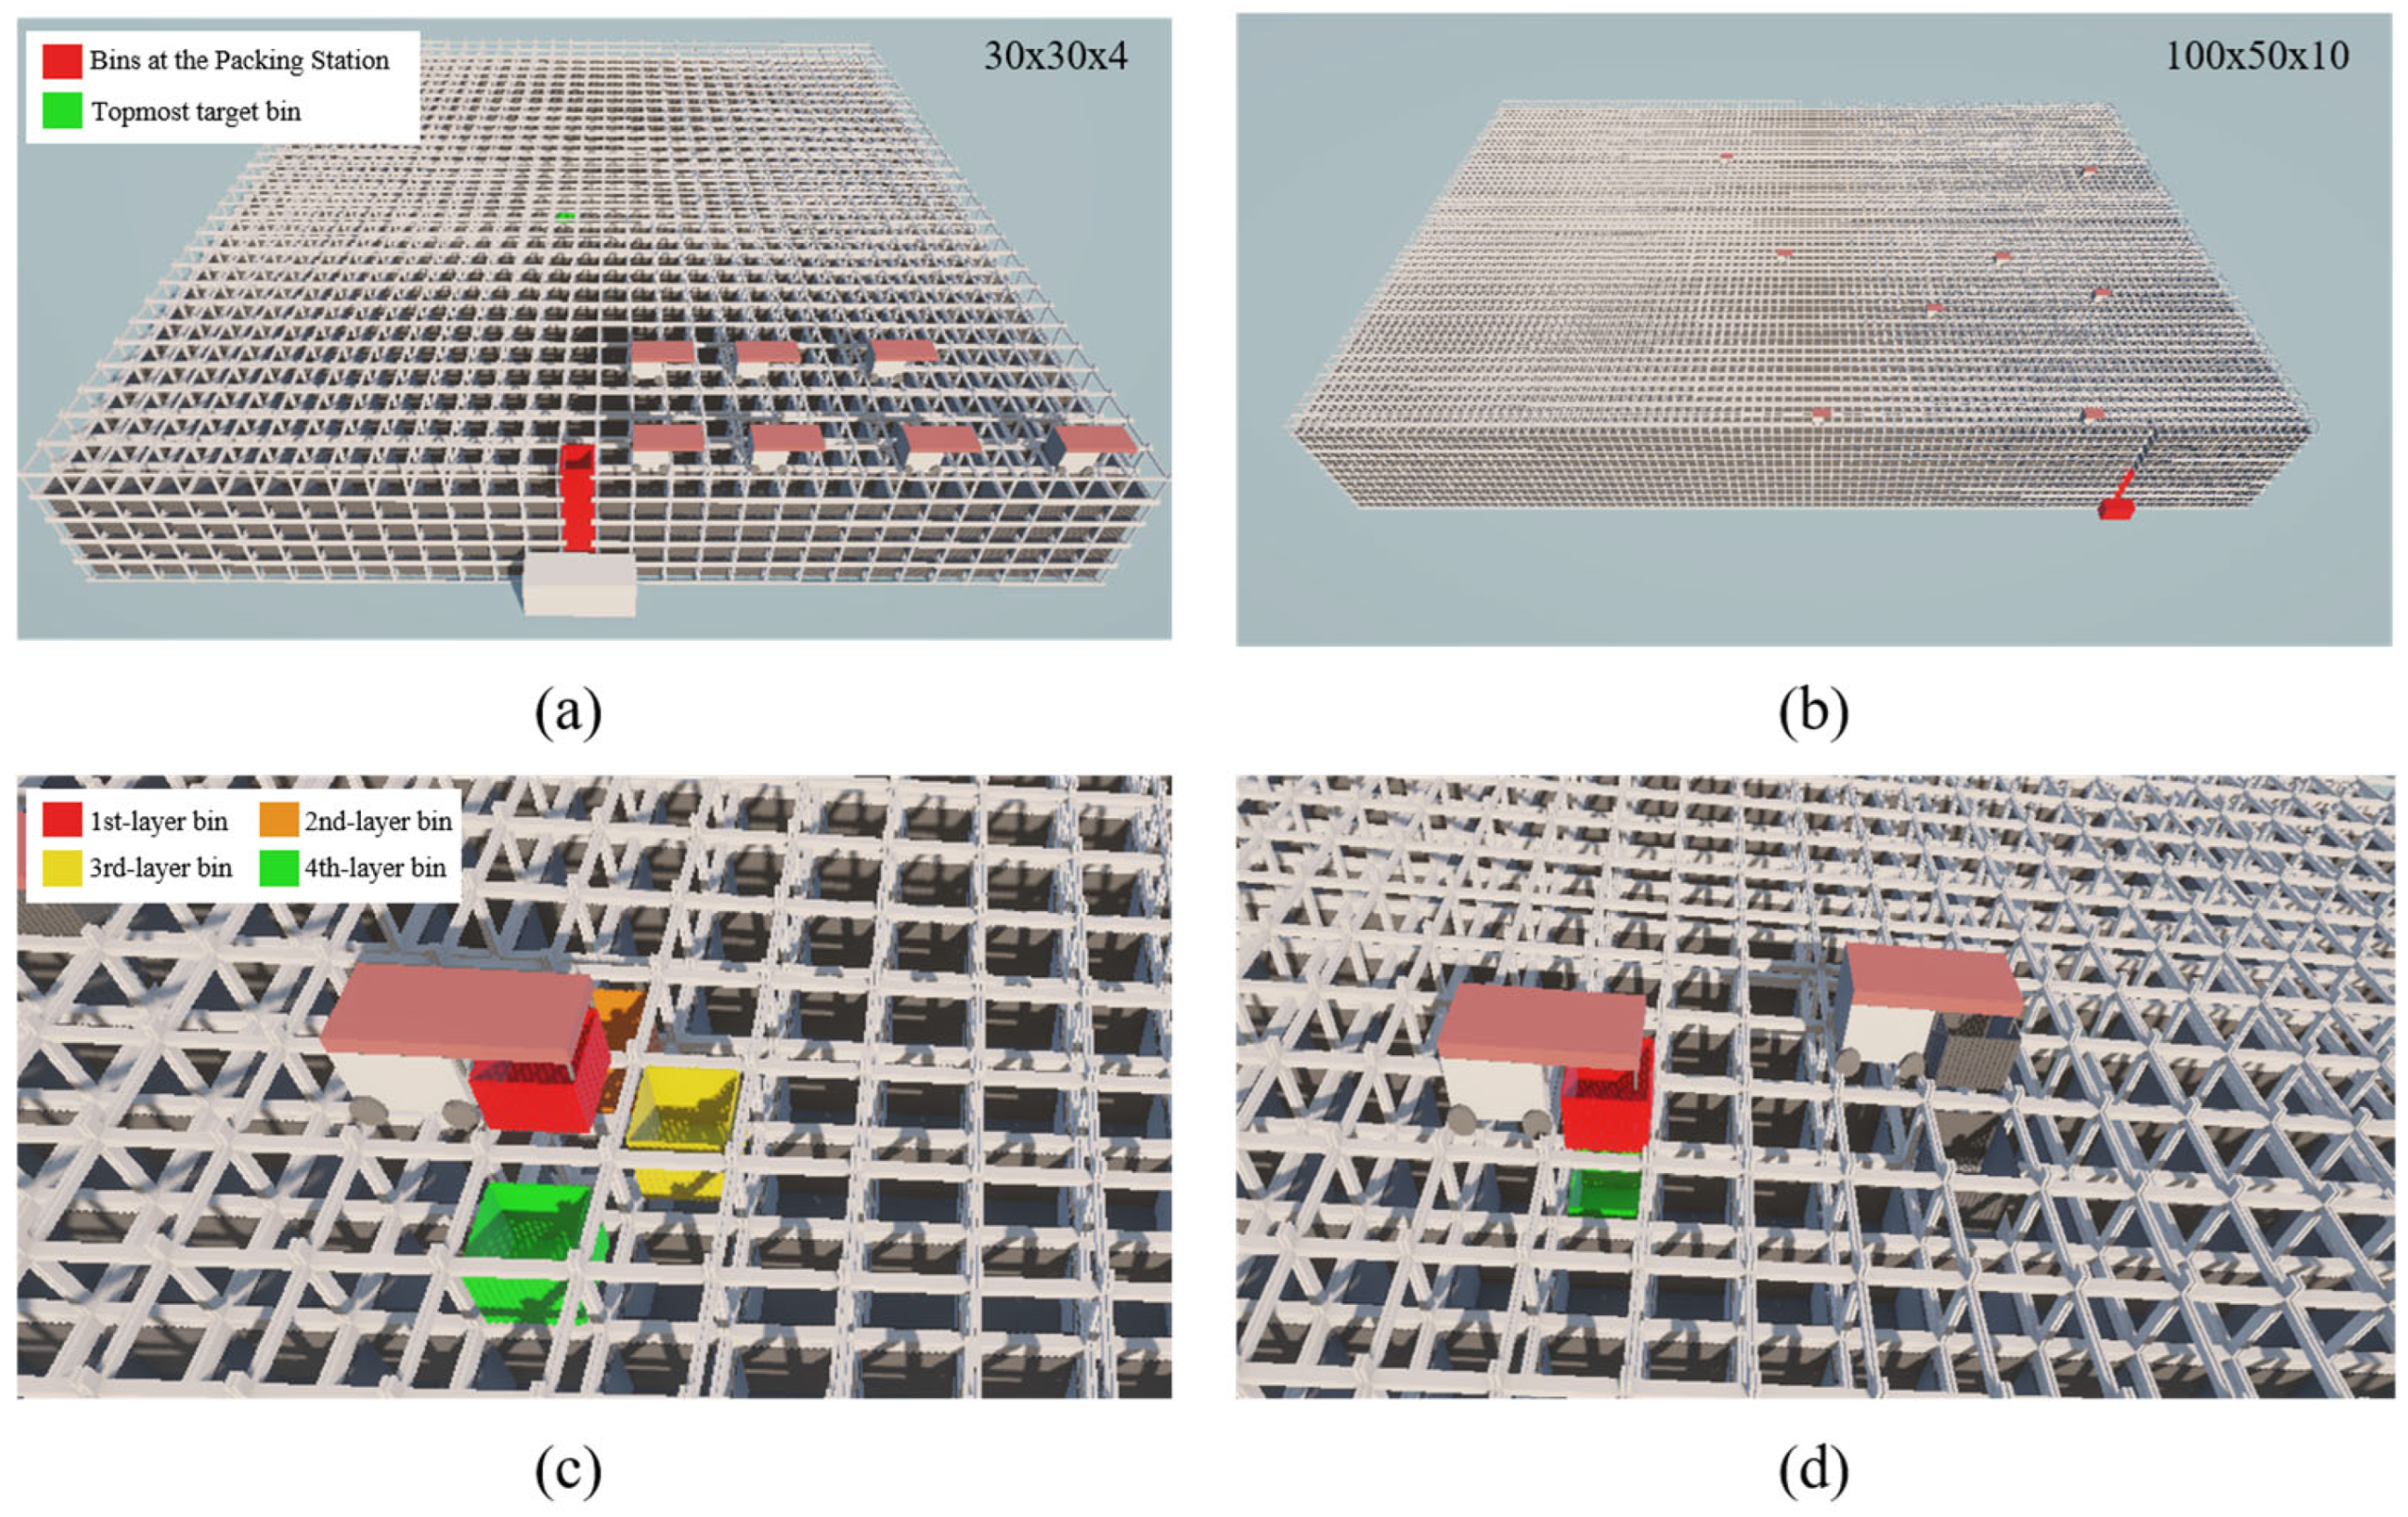
Figure 8 illustrates the Unity-based visualization of the proposed system-level simulator for automated warehouse environments with grid sizes of 30 × 30 × 4 and 100 × 50 × 10. Figure 8a shows the overall simulation view of the 30 × 30 × 4 cube-shaped AS/RS, where a total of seven AGVs collaborate to perform inbound and outbound operations. The Packing Station, highlighted in red, is located at the front of the warehouse and serves as the interface through which products inside bins are shipped to customers.
Figure 8.
Unity-based visualization of cube-shaped AS/RS operations. (a) Overall view of the 30 × 30 × 4 cube-shaped AS/RS; (b) scaled-up visualization of the 100 × 50 × 10 cube-shaped AS/RS; (c) digging operation for extracting the target bin; (d) restorage operation after outbound shipment.
Figure 8b presents an example in which the same control logic and simulation framework are scaled up to a larger 100 × 50 × 10 cube-shaped AS/RS. In this expanded setting with more bins, cells, aisles, and AGVs, the proposed inbound/outbound, digging, restorage, and AGV staging policies operate without additional model modifications. This visualization demonstrates that the framework can be applied to large-scale warehouse configurations and helps to identify bottlenecks and regions of dense AGV traffic in a visually intuitive manner, thereby supporting model verification and validation.
Figure 8c depicts the process in which an AGV extracts a red bin located on the bottom layer. During this process, the sub-bins stacked above it (green, yellow, and orange from top to bottom) undergo a digging operation and are temporarily placed in adjacent grid slots. After extraction, the target bin is transported to the Packing Station.
Finally, Figure 8d shows the process in which the red bin, whose outbound shipment has been completed, is retrieved from the Packing Station and returned to storage. In this step, the red bin is stored at the topmost position rather than at its original bottom position. This confirms that the proposed strategy helps prevent unnecessary future digging operations when the same bin is requested again.
Table 4 summarizes the scalability of the simulator in terms of computational complexity (runtime and memory usage) with respect to grid size and the number of AGVs. For the baseline configuration with a 30 × 30 × 4 grid and 5 AGVs, a single simulation run requires an average runtime of 2616.7 s and an average peak memory usage of 1024.1 MB. In contrast, when the grid size is expanded to 100 × 50 × 10 while keeping the number of AGVs fixed at 5, the average runtime increases to 10,049.1 s, i.e., by a factor of approximately 3.8, whereas the average peak memory usage increases only to 1430.3 MB, by about 400 MB. This indicates that even with a substantial increase in the number of storage cells, memory requirements grow relatively moderately, allowing the simulator to operate at large warehouse scales within realistic computational resource limits.
Table 4.
Computational scalability with respect to grid size and number of AGVs.
Furthermore, for the 100 × 50 × 10 grid, increasing the number of AGVs from 5 to 10 results in an average runtime of 9984.5 s, which is slightly lower, while the average peak memory usage remains almost unchanged at 1432.7 MB. This suggests that increasing the AGV count does not significantly burden memory consumption, while improved parallelism in task execution can contribute to a modest reduction in total simulation time. Overall, the results in Table 4 support that the proposed simulation framework can be operated in environments with larger grid sizes and more AGVs with an approximately linear increase in computational resources, making it suitable for performance evaluation and policy comparison in large-scale cube-shaped AS/RS.
5. Experiment
5.1. Experiment Design
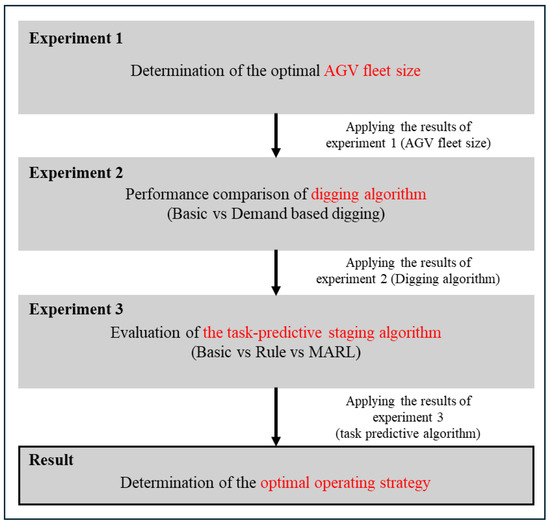
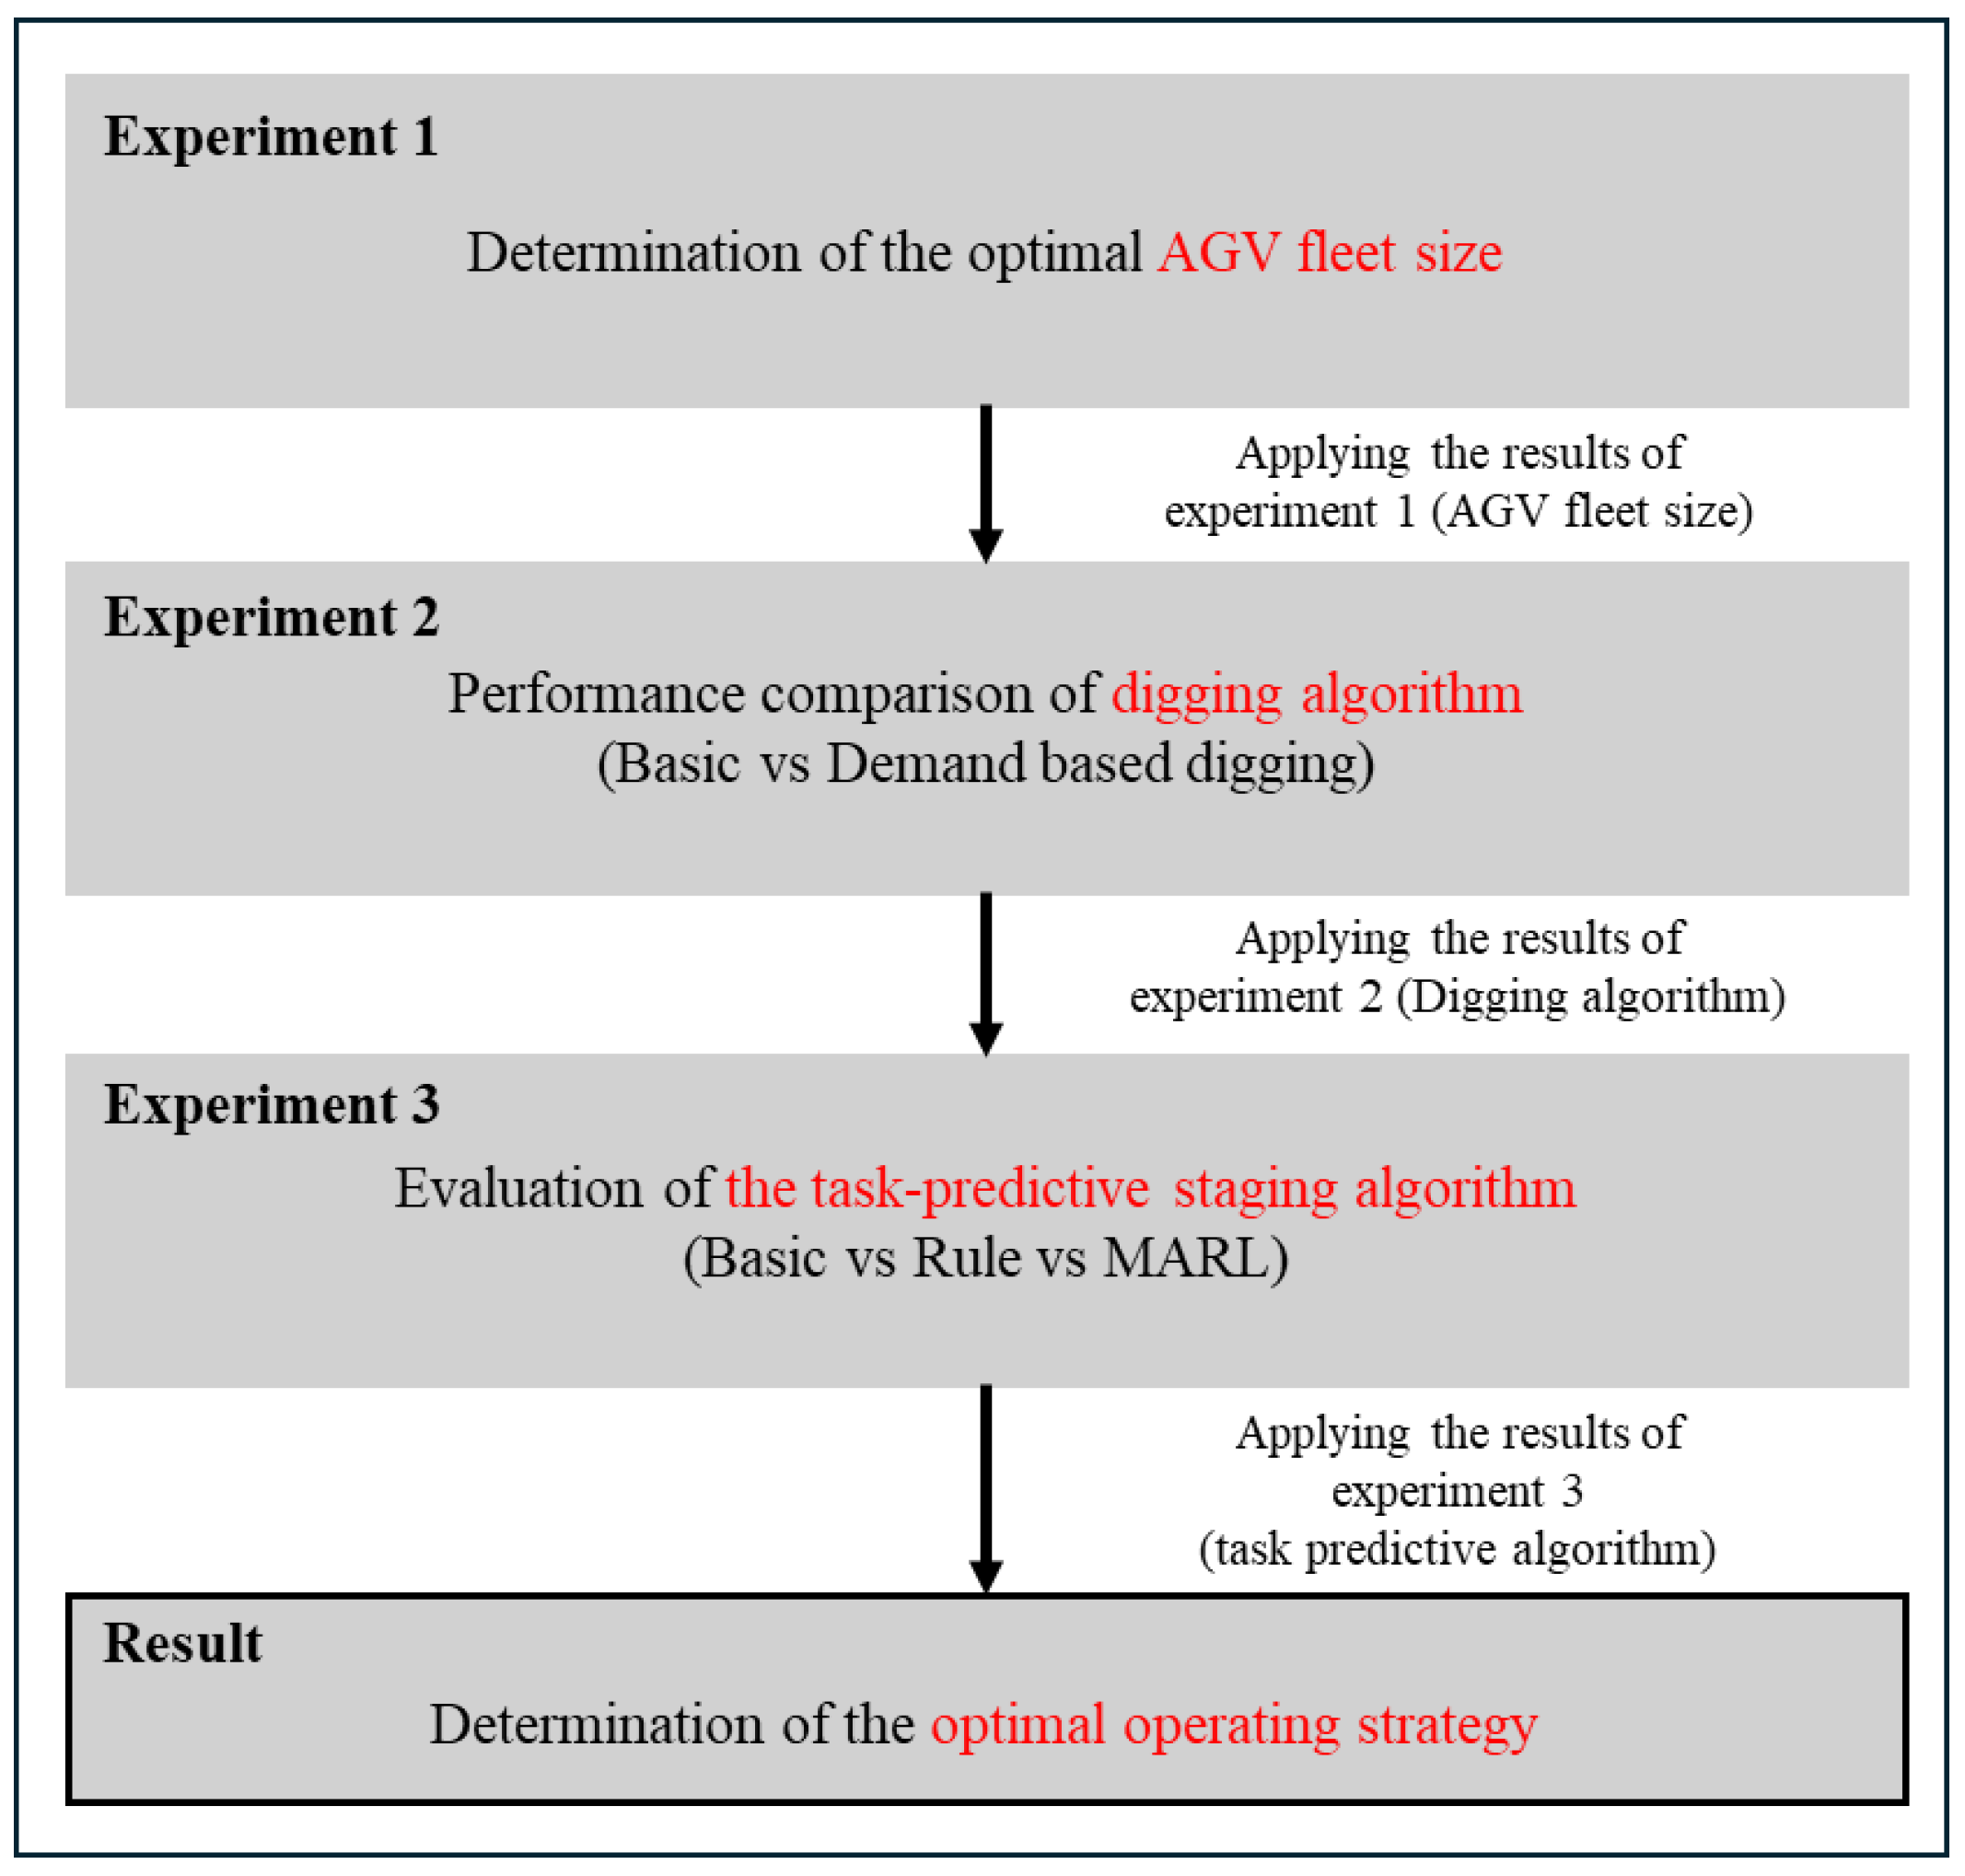
As summarized in Table 5, the operational evaluation of the proposed cube storage warehouse simulation was composed of three sequential experiments. Each stage complemented the others, as illustrated in Figure 9, and the outcome of one stage was directly reflected in the design of the next. The AGV fleet size determined in Experiment 1 was used as the configuration in Experiment 2. In Experiment 2, we identified the most effective digging algorithm through comparative analysis and then applied it in Experiment 3. Experiment 3 evaluated the task-predictive staging algorithm under the AGV configuration from Experiment 1 and the digging policy selected in Experiment 2. This stepwise structure ensured both the logical consistency and the practical validity of the overall evaluation. Through these three experiments, we derived an optimal combination of operating policies for the cube-shaped storage system. In Experiment 1, the optimal number of AGVs was determined under a baseline scenario. By applying a range of AGV counts (2–8 units) and repeatedly conducting simulations, the throughput and average task completion time were comprehensively examined to derive the appropriate number of AGVs required for a given environment. Beyond identifying the optimal AGV count, this stage also served to verify the normal operation of the simulator [34,35,36].
Table 5.
Simulation experiment design for cube-shaped AS/RS.
Figure 9.
Sequential experimental procedure.
Experiment 2 focused on analyzing the effectiveness of the Digging algorithm. Using the optimal AGV count derived from Stage 1 as a fixed parameter, the conventional Digging method (Basic Digging) and the proposed Demand-based Digging method were compared under identical conditions. This analysis not only highlighted performance differences but also validated the extent to which the demand-based approach reduces the burden of Digging operations and enhances picking efficiency in warehouse operations.
In Experiment 3, the performance of task-predictive staging algorithms was evaluated. Building on the improved system configuration established in Stage 2, three approaches—basic staging, rule-based staging, and multi-agent reinforcement learning were compared. This stage extended the scope of analysis beyond individual AGV optimization, focusing instead on cooperative operational strategies in dynamic multi-AGV environments. Moreover, it evaluated not only performance differences but also the overall resource utilization efficiency and task allocation responsiveness among AGVs, with the ultimate goal of identifying the most effective system configuration.
Table 6 summarizes the uncontrollable parameters defined for the simulation in this study. The experimental environment was configured as a cube-shaped AS/RS with 30 grids in width, 30 grids in length, and 4 layers in height (30 × 30 × 4). This structure was designed to emulate, in a simplified manner, the three-dimensional multi-layer storage configuration typically applied in large-scale logistics centers. The order interarrival time followed an exponential distribution Exp(1/15) with a mean of 15 time units, reflecting the stochastic and irregular nature of real order arrivals.
Table 6.
Uncontrollable experiment parameters.
The number of orders processed per simulation was fixed at 2500 to ensure a sufficient workload, and each scenario was repeated 30 times to secure statistical reliability of the results [37]. Operational parameters of AGVs were set to reflect the physical characteristics of actual automated storage systems. The travel time taken for an AGV to move one grid cell was set to 0.35 s, which corresponded to the typical travel speed of real AGVs. The load and unload operations were set to require a base time of 1.0 s, with an additional 0.21 s per storage layer, thereby reflecting the practical constraint that bins located at lower layers take longer to handle. Finally, the packing process at the packing station was assumed to take an average of 15 s, based on operational data from real logistics centers and values reported in previous studies.
Table 7 presents the key performance indicators (KPIs) used to analyze the simulation results. AGV Utilization refers to the proportion of time that AGVs are actively performing tasks, excluding idle periods and return times. In this study, the appropriate operating range was set to 90–95%, taking into account potential risks such as equipment failure and maintenance requirements [38,39,40,41]. Makespan represents the total completion time required to process all 2500 orders, serving as a measure of overall system efficiency. Travel time indicates the time spent by AGVs moving to task locations or packing stations, which is directly related to path efficiency.
Table 7.
Experiment key performance indicators.
In addition, digging time refers to the average time required to load or unload a single bin, while Digging count represents the average number of loading and unloading operations per simulation run. Together, these two indicators reflect the efficiency of the digging process. Factors that reduce operational efficiency include Idle time and Return time. Idle time represents the average duration during which AGVs remain in a waiting state, reflecting resource underutilization. Return time refers to the average time required for AGVs to return to their initial position or predictive waiting position after completing all assigned tasks, making it an important metric in evaluating the closing stage of the operational cycle. Therefore, by analyzing the detailed indicators presented in Table 7, it is possible to evaluate not only the total processing time but also AGV utilization, task intensity, and inefficiencies related to waiting and return operations. These insights provide an essential foundation for developing logistics operation strategies and optimizing system performance.
It should be noted that the purpose of these experiments is not to claim universal superiority over all existing advanced algorithms, but to evaluate the marginal contribution of each proposed control component under a unified and reproducible simulation setting. Because existing advanced methods differ in terms of modeled processes, assumptions on AGV cooperation, treatment of digging/restacking, and availability of implementation details, they cannot be directly reproduced without substantial redesign of the simulation model. Therefore, this study adopts controlled baseline policies as reference cases and focuses on quantifying how demand-based digging and task-predictive staging improve system-level performance within the same operational environment.
5.2. Experiment 1: Optimal AGV Number Determination
Experiment 1 was conducted to validate the feasibility of the proposed cube-shaped AS/RS simulation framework in terms of its design and implementation, while simultaneously determining the optimal number of AGVs under given conditions. To this end, the number of AGVs varied from 2 to 8, and simulations were repeatedly performed. Throughput and average task completion time were employed as the primary evaluation metrics. In this experiment, AGVs collaboratively performed the bin digging task (loading and unloading), and a BASIC method was applied in which bins were always placed on the top layer regardless of demand fluctuations. In addition, upon completion of all assigned tasks, AGVs were configured to return to their initial positions following the BASIC method, thereby clearly distinguishing each operation cycle.
Analysis of Experiment 1 Results
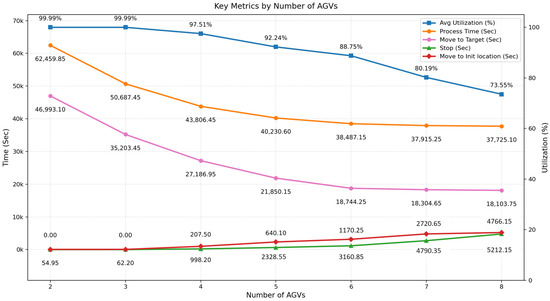
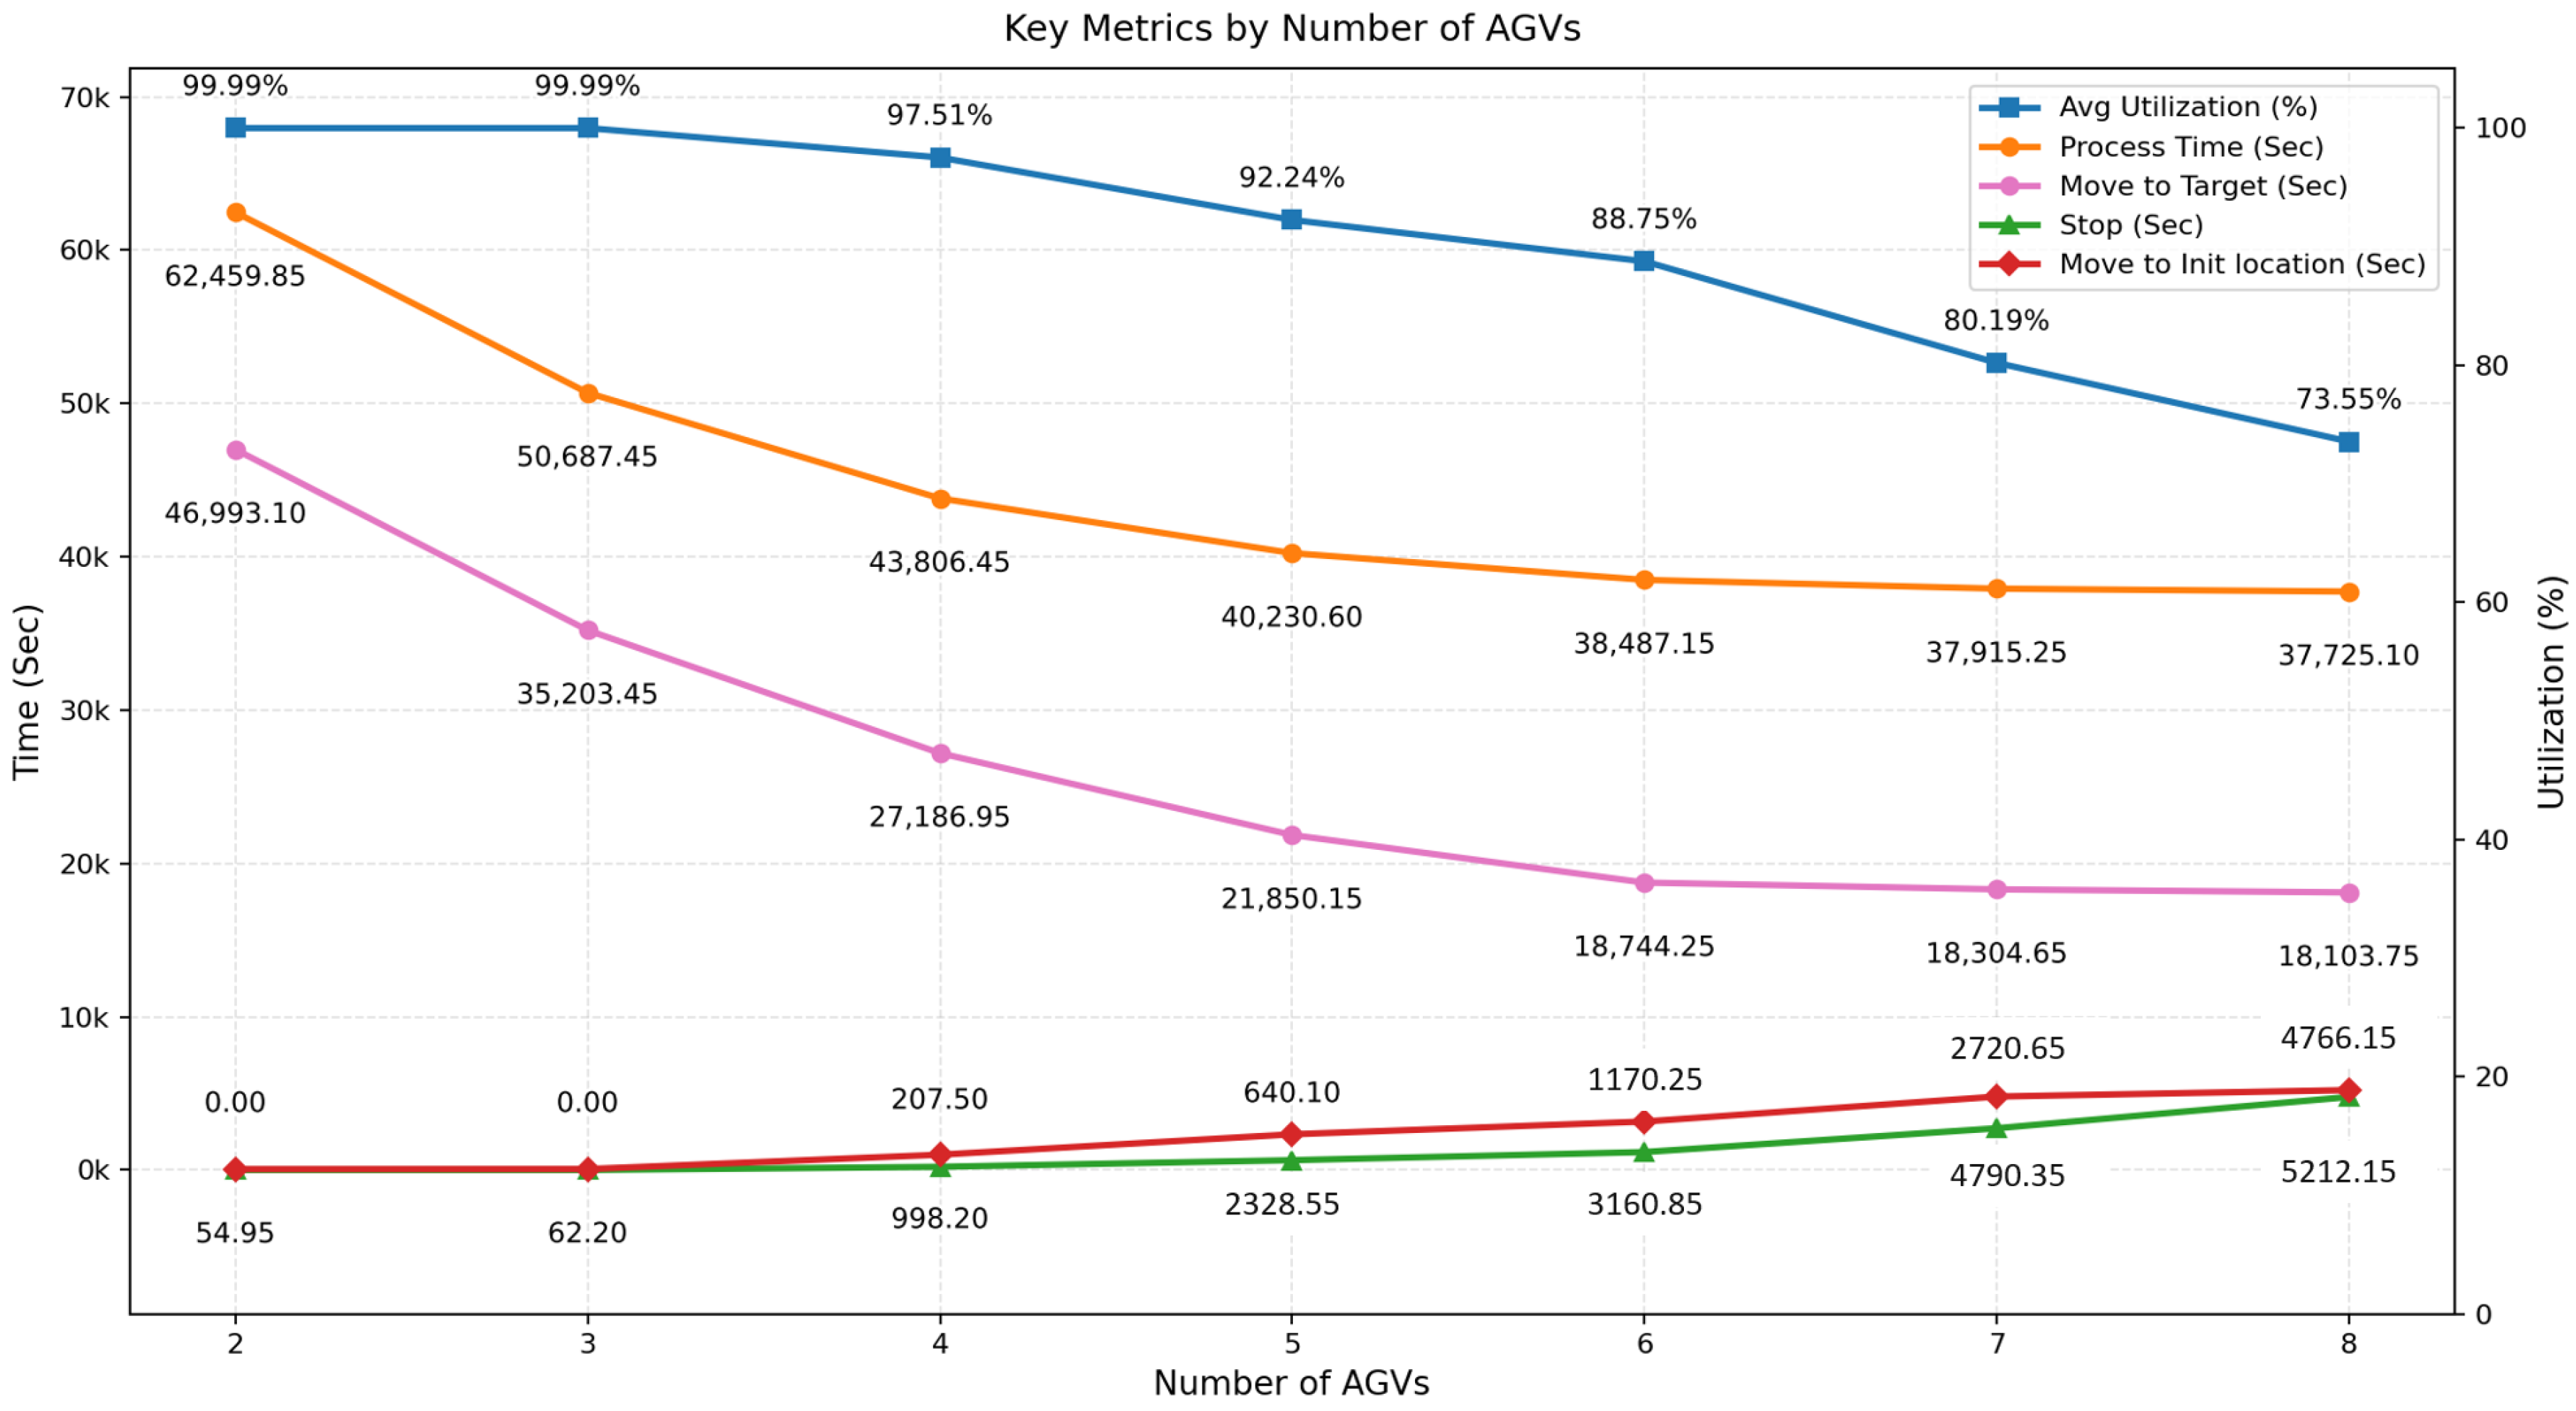
Table 8 and Figure 10 present the quantitative indicators obtained in Experiment 1 according to the number of AGVs deployed. When operating with two AGVs, the utilization rate was 99.99%, indicating that the vehicles operated almost continuously with virtually no idle time. However, the process time was measured at 62,459.85 s, revealing the presence of a bottleneck in the system. The digging process was executed 11,720 times, taking a total of 15,411.8 s, which accounted for approximately 24.7% of the overall time, demonstrating its significant share in the workflow. For three AGVs, the utilization rate remained the same at 99.99%, but the process time decreased to 50,687.45 s, representing an 18.86% reduction compared to the two-AGV case. On the other hand, since the digging procedure followed the same operational principle regardless of the AGV count, both the number of executions and the time spent showed little difference from the two-AGV scenario.
Table 8.
Simulation results of key performance indicators by AGV count.
Figure 10.
Key metrics by number of AGVs.
When four AGVs were deployed, the utilization rate slightly decreased to 97.51%, while the process time further decreased to 43,806.45 s, reflecting a 13.57% reduction. This indicates that increasing the number of AGVs distributes the workload more evenly across units, thereby improving system efficiency. Nevertheless, the duration and frequency of the digging process remained similar to those in previous cases. With five AGVs, the utilization rate was 92.24%, maintaining a stable level, and the process time was further reduced to 40,230.6 s. At this point, the breakdown of travel time, digging time, and return time appeared more balanced, enabling more efficient task execution. Although makespan continued to decrease when more than five AGVs were deployed, the marginal improvement became progressively smaller relative to the substantial decrease in AGV utilization and the increase in idle and return times. Thus, five AGVs were selected as the most balanced configuration in terms of makespan reduction, AGV utilization, and operational stability.
5.3. Experiment 2: Performance Validation of the Proposed Digging Algorithm
Experiment 2 was conducted to quantitatively evaluate the performance of the proposed digging algorithm. In Experiment 1, when operating with five AGVs, the time spent on digging tasks was 15,411.8 s, accounting for approximately 38% of the total process time. This result indicated that digging tasks have a significant impact on overall system efficiency. Accordingly, Experiment 2 compared the conventional digging method with the proposed algorithm to analyze the reduction effect in digging time as well as the improvement in overall process efficiency. For this purpose, key performance indicators such as digging time, total process time, and AGV utilization were measured and comparatively evaluated for each algorithm.
Analysis of Experiment 2 Results
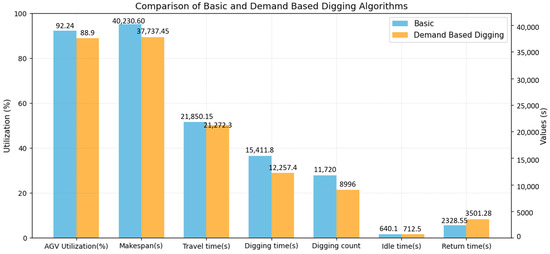
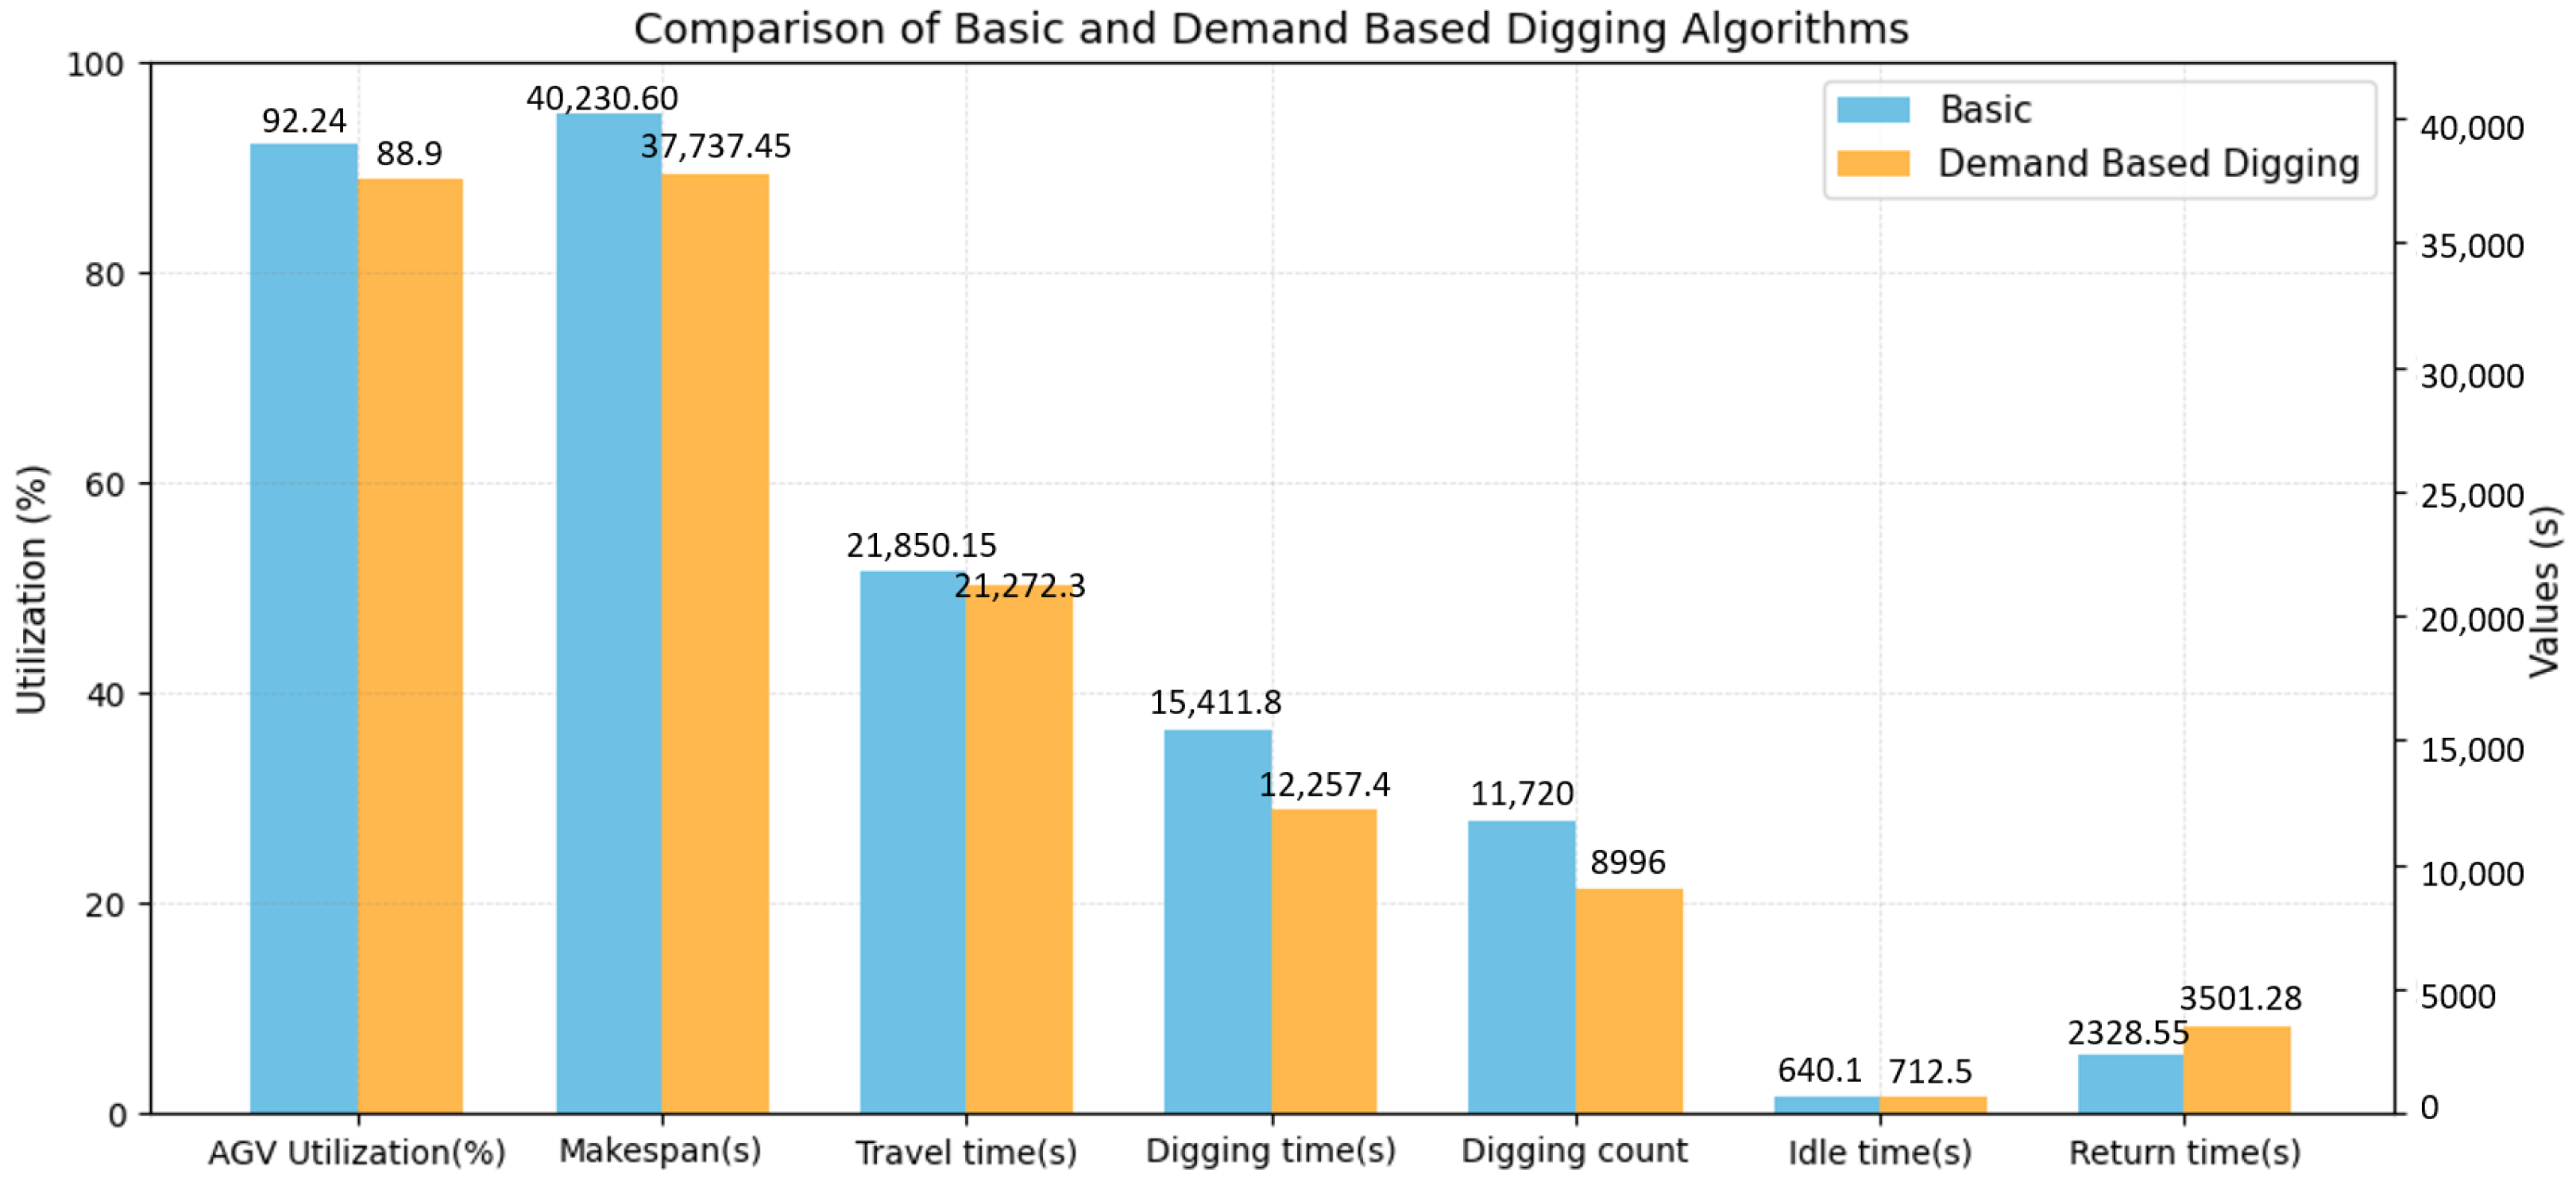
Table 9 and Figure 11 summarize and compare the key performance results of the digging algorithms. The demand-based digging algorithm reduced the makespan from 40,230.60 s to 37,737.45 s, corresponding to a 6.20% improvement. More importantly, the digging time decreased from 15,411.8 s to 12,257.4 s and the digging count decreased from 11,720 to 8996, corresponding to reductions of 20.47% and 23.24%, respectively. These results indicate that the proposed policy directly reduces the number of bin-handling operations required during digging. Travel time also decreased by 2.64%, suggesting that fewer relocation operations indirectly reduce AGV movement. However, idle time and return time increased by 11.31% and 50.36%, respectively, because AGVs completed digging-related tasks earlier and spent more time in post-task states. This observation motivates the need for the task-predictive staging policies evaluated in Experiment 3.
Table 9.
Simulation results of key performance indicators by digging algorithm.
Figure 11.
Comparison of basic and demand-based digging algorithms.
5.4. Experiment 3: Performance Validation of Task-Predictive Staging Policies
Experiment 3 was conducted to compare and analyze waiting position selection algorithms based on the optimal number of AGVs and the optimal digging algorithm derived from Experiments 1 and 2. As a baseline policy, AGVs were configured to return to their initial positions. On this basis, a rule-based algorithm that considers distance and time was compared with a multi-agent reinforcement learning (MARL)-based algorithm. Through this comparison, the experiment aimed to identify the most efficient operational scenario among the alternative approaches.
Analysis of Experiment 3 Results
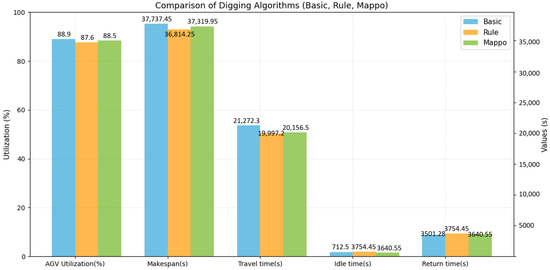
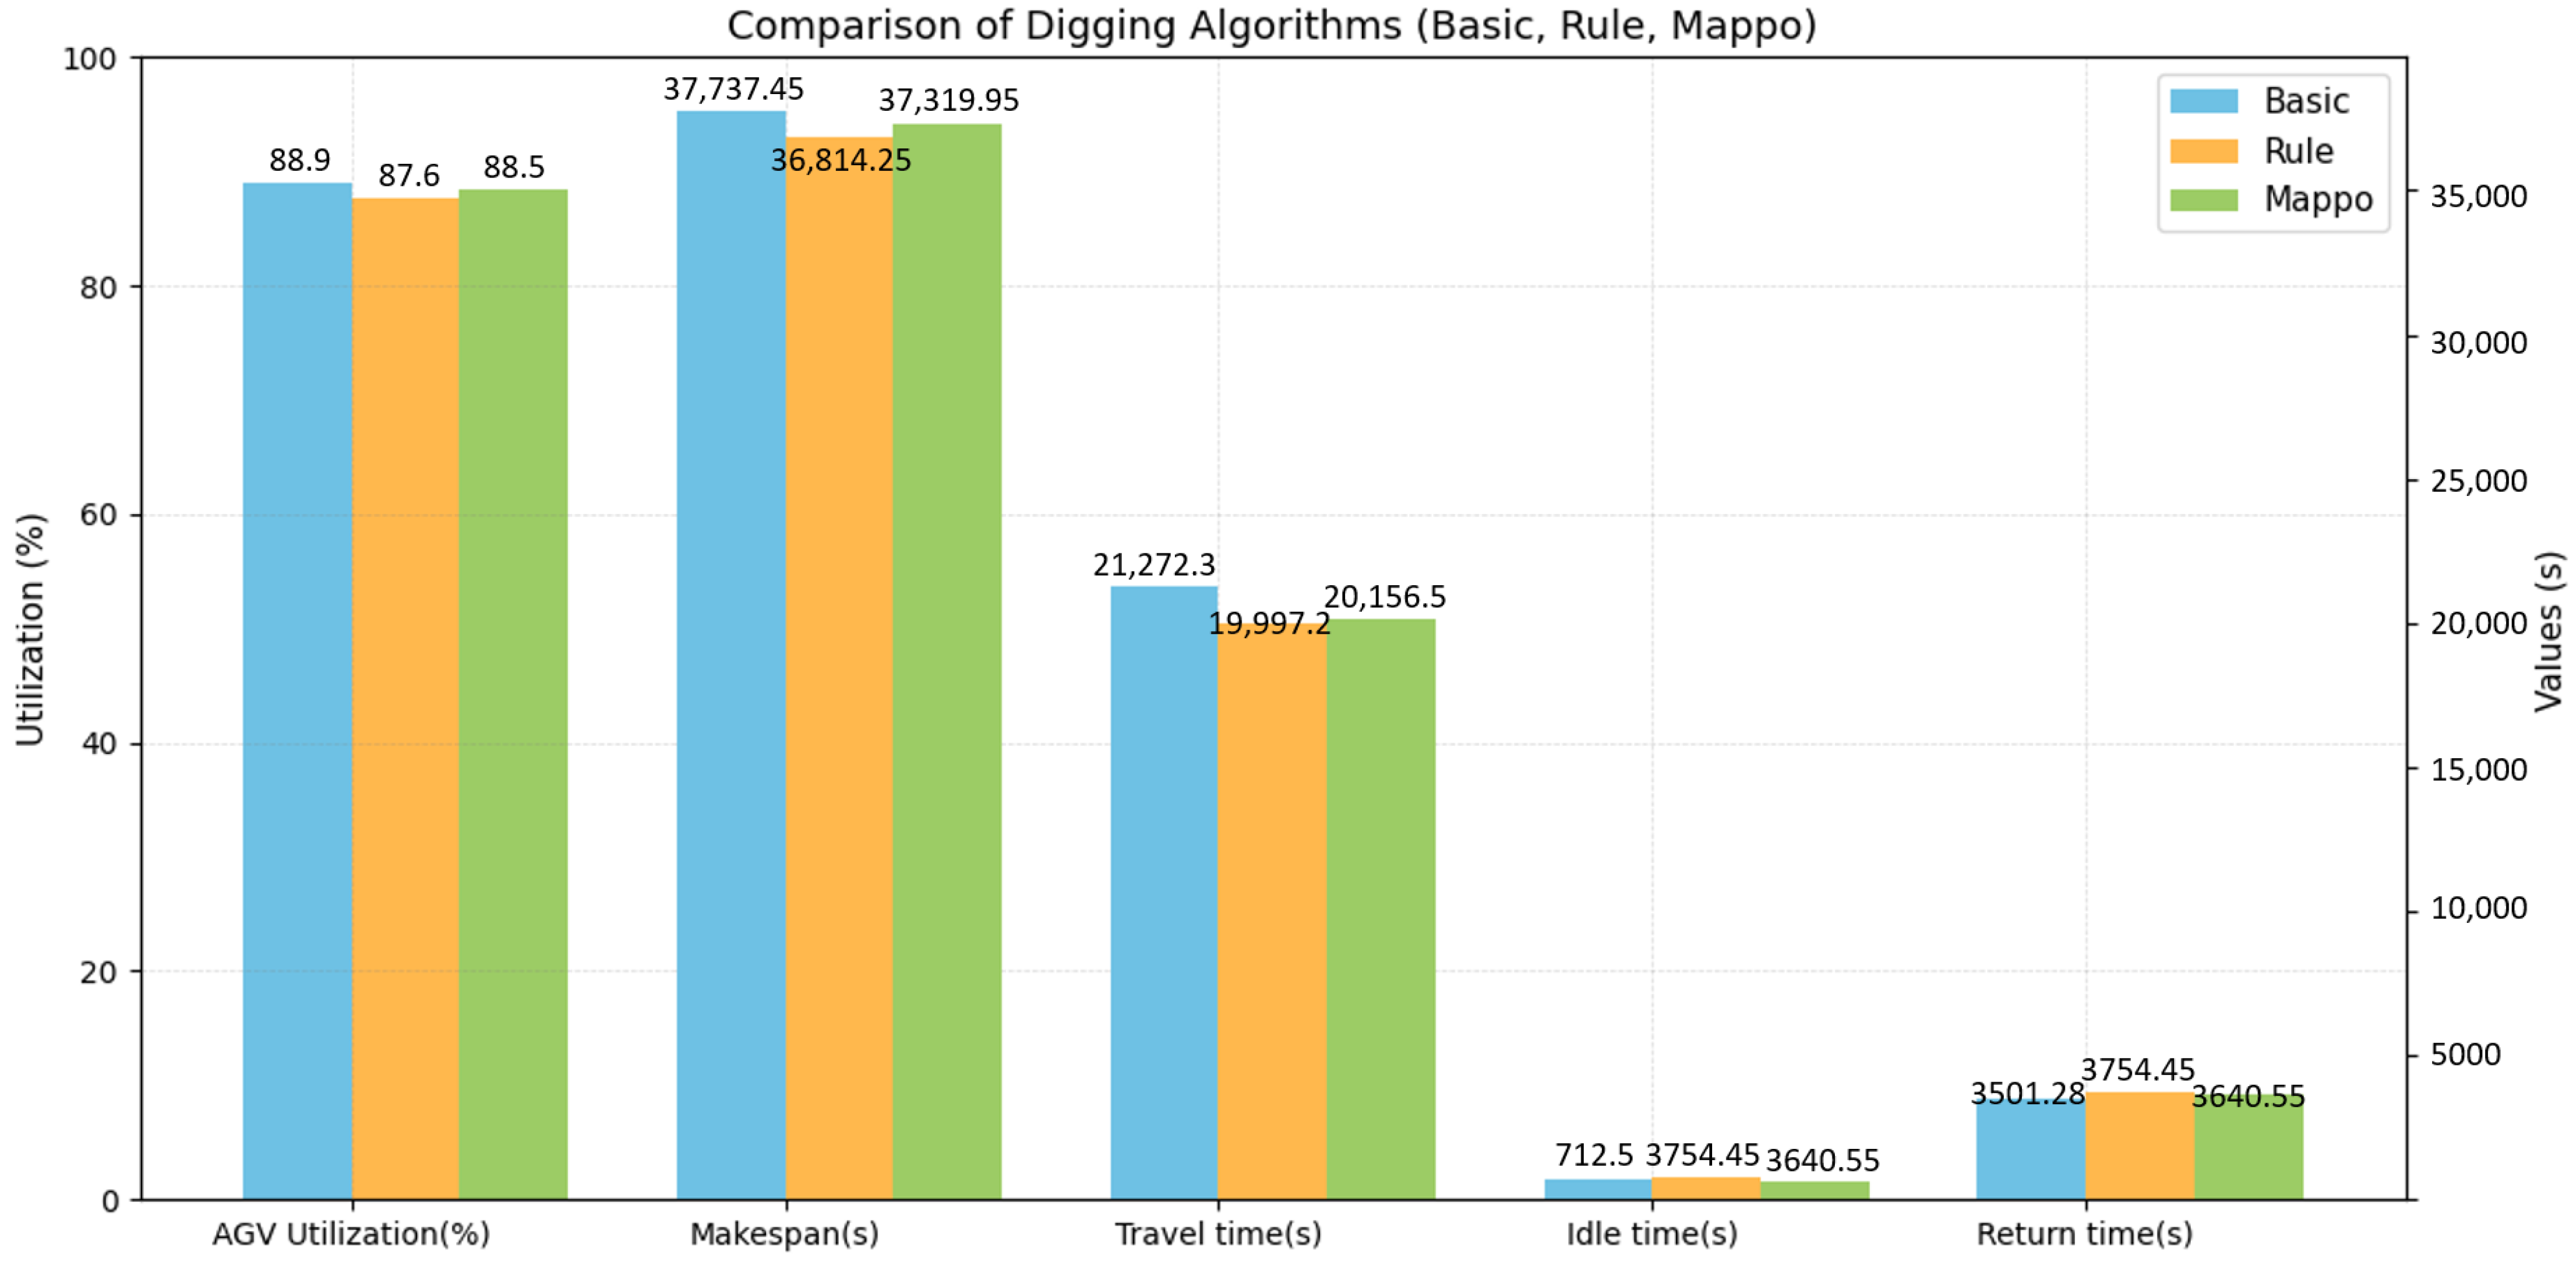
Table 10 and Figure 12 summarize and compare the key performance results of the task-predictive staging policies. The rule-based staging policy achieved the largest makespan reduction, decreasing the makespan from 37,737.45 s to 36,814.25 s, corresponding to a 2.45% improvement. This result shows that even a simple predictive policy based on AGV location and remaining task time can effectively reduce unnecessary travel and improve task responsiveness. The MAPPO-based policy achieved a smaller makespan reduction of 1.11%; however, it reduced idle time from 712.5 s to 600.1 s, corresponding to a 15.78% reduction. This suggests that the learning-based policy was more effective in distributing idle AGVs and reducing waiting, although its current reward structure and training setting were not sufficient to outperform the rule-based policy in terms of makespan. Therefore, the MARL result should be interpreted as an exploratory extension that demonstrates potential for adaptive staging rather than as the primary performance contribution of this study.
Table 10.
Simulation results of key performance indicators by task-predictive staging algorithm.
Figure 12.
Comparison of task-predictive staging policies (basic, rule-based, and MAPPO-based).
6. Conclusions
In this study, we proposed a demand-based bin reallocation strategy to reduce digging time and a waiting position selection method for multi-AGV operation to improve the efficiency of cube-shaped AS/RS. To validate the proposed methods, three experiments were conducted. The first experiment identified the optimal number of AGVs for a specific warehouse environment, while the second and third experiments demonstrated that the proposed demand-based digging strategy and AGV pre-positioning method enhanced overall operational efficiency.
However, this study was conducted under an idealized scenario that excluded the inbound process and assumed the absence of inventory shortages and battery charging requirements. Since inventory replenishment is an essential and realistic component of logistics processes, future research should incorporate such processes into the simulation scenarios to better reflect real-world operating conditions. Furthermore, experimental validation using actual demand data is necessary to strengthen the practical applicability of the proposed strategies and to evaluate their sustained effectiveness under various demand fluctuations.
Regarding the MARL-based policy, the experimental results showed that it did not outperform the rule-based policy in terms of makespan, but it reduced idle time and demonstrated the potential of learning-based cooperative staging for resource-balancing objectives. In the current study, the hyperparameters and reward function for the reinforcement learning model were set empirically, based on operational intuition and preliminary experiments, rather than through systematic tuning or optimization. Therefore, future work should focus on enhancing the robustness and stability of the reinforcement learning model by incorporating realistic constraints and diverse operational scenarios. Another limitation of this study is that the proposed methods were not directly compared with full implementations of other advanced algorithms, such as GA-based scheduling, rollout-heuristic order sequencing, top-layer bin-placement policies, or alternative multi-agent path-planning algorithms. Because these methods assume different logistics scopes, AGV cooperation structures, and digging/restacking mechanisms, implementing them under identical cube-shaped AS/RS conditions requires substantial additional modeling and calibration. Future research will extend the proposed DEVS framework to implement these advanced benchmark methods under a unified simulation environment and perform direct quantitative comparisons across diverse warehouse layouts, demand distributions, and AGV fleet sizes.
Moreover, the current simulator does not take battery constraints and charging stations into account. Future research will extend the simulator by introducing a dispatching strategy that reflects battery utilization and charging schedules. Finally, to further increase the completeness and practical relevance of the proposed simulation framework and control policies, follow-up studies should involve implementation and validation in a real cube-storage environment. Overall, the findings of this study provide practical insights and guidelines for improving the efficiency of cube-shaped AS/RS operations and for establishing effective AGV deployment strategies. By addressing the suggested directions for future research, the proposed approaches are expected to contribute to the development of more realistic and practically applicable operational strategies.
Author Contributions
Methodology, C.-W.K., J.-M.W. and K.-M.S.; Software, C.-W.K.; Validation, C.-W.K. and J.-M.W.; Formal analysis, C.-W.K.; Resources, J.-M.W.; Data curation, J.-M.W.; Writing—original draft, C.-W.K.; Writing—review and editing, K.-M.S.; Visualization, J.-M.W.; Supervision, K.-M.S.; Project administration, K.-M.S.; Funding acquisition, K.-M.S. All authors have read and agreed to the published version of the manuscript.
Funding
This research received no external funding.
Data Availability Statement
The data presented in this study (simulation models, configuration files, and event logs) are available on reasonable request from the corresponding author due to institutional policy.
Conflicts of Interest
The authors declare no conflicts of interest.
References
- Cinar, Z.M.; Zeeshan, Q. Design and Optimization of Automated Storage and Retrieval Systems: A Review. In Proceedings of the International Conference on Industrial Engineering in the Internet-of-Things World; Springer: Cham, Switzerland, 2021; pp. 177–190. [Google Scholar] [CrossRef] [Scilit]
- Ha, W.Y. The Characteristics of Cube Storage: AutoStore System. In Proceedings of the 2024 15th International Conference on Information and Communication Technology Convergence (ICTC), Jeju Island, Republic of Korea, 16–18 October 2024; IEEE: Piscataway, NJ, USA, 2024; pp. 391–394. [Google Scholar] [CrossRef] [Scilit]
- Low, A.K.J.; Sim, K.S.; Lew, K.L. Review on Automated Storage and Retrieval System for Warehouse. J. Inform. Web Eng. 2024, 3, 77–97. [Google Scholar] [CrossRef] [Scilit]
- AutoStore. Benefits of Cube Storage. Available online: https://www.autostoresystem.com/benefits/space (accessed on 11 September 2025).
- Tutam, M.; Liu, J.; White, J.A. Consideration of Skewness in Designing Robotic Compact Storage and Retrieval Systems. Expert Syst. Appl. 2024, 248, 123361. [Google Scholar] [CrossRef] [Scilit]
- Zaerpour, N.; Yu, Y.; de Koster, R. Small Is Beautiful: A Framework for Evaluating and Optimizing Live-Cube Compact Storage Systems. Transp. Sci. 2017, 51, 34–51. [Google Scholar] [CrossRef] [Scilit]
- Sung, J.-H.; Ju, S.-H.; Cho, S.-W.; Joo, H.-J.; Seo, K.-M.; Kang, B.-G. Modeling and Exploratory Analysis of Discrete Event Simulations for Optimizing Overhead Hoist Transport Systems and Logistics in Semiconductor Manufacturing. Mathematics 2025, 13, 1167. [Google Scholar] [CrossRef] [Scilit]
- Cho, S.-W.; Lim, Y.-H.; Ju, S.-H.; Seo, K.-M. Analyzing New Operation Strategy of Demand-Responsive Transports Using Discrete-Event Simulation Framework. Systems 2025, 13, 303. [Google Scholar] [CrossRef] [Scilit]
- Seo, K.M.; Choi, C.; Kim, T.G.; Kim, J.H. DEVS-Based Combat Modeling for Engagement-Level Simulation. Simulation 2014, 90, 759–781. [Google Scholar] [CrossRef] [Scilit]
- Ha, W.Y.; Jiang, Z.-P. Optimization of Cube Storage Warehouse Scheduling Using Genetic Algorithms. In Proceedings of the 2023 IEEE 19th International Conference on Automation Science and Engineering (CASE), Auckland, New Zealand, 26–30 August 2023; IEEE: Piscataway, NJ, USA, 2023; pp. 1–6. [Google Scholar] [CrossRef] [Scilit]
- Zhu, J.; Pan, D. Improved Genetic Algorithm for Solving Robot Path Planning Based on Grid Maps. Mathematics 2024, 12, 4017. [Google Scholar] [CrossRef] [Scilit]
- Ko, D.; Han, J. A rollout heuristic algorithm for order sequencing in robotic compact storage and retrieval systems. Expert Syst. Appl. 2022, 203, 117396. [Google Scholar] [CrossRef] [Scilit]
- Yue, A.; Smith, S.L. Minimizing Robot Digging Times to Retrieve bins in Robotic-Based Compact Storage and Retrieval Systems. arXiv 2023, arXiv:2312.05338. [Google Scholar] [CrossRef] [Scilit]
- Trost, P.; Eder, M. An Analytical Performance Approach for RCS/RS with One Robot Serving Multiple Stack Heights under a One-Path Relocation Strategy. Sci. Rep. 2024, 14, 3593. [Google Scholar] [CrossRef] [Scilit] [PubMed]
- Wang, Z.; Kim, B.; Kobayashi, H.; Wu, G.; Barth, M.J. Agent-Based Modeling and Simulation of Connected and Automated Vehicles Using Game Engine: A Cooperative On-Ramp Merging Study. arXiv 2018, arXiv:1810.09952. [Google Scholar] [CrossRef] [Scilit]
- Choi, S.H.; Seo, K.M.; Kim, T.G. Accelerated Simulation of Discrete Event Dynamic Systems via a Multi-Fidelity Modeling Framework. Appl. Sci. 2017, 7, 1056. [Google Scholar] [CrossRef] [Scilit]
- Lu, J.; Jin, Q.; Yuan, J.; Ma, J.; Qi, J.; Shao, Y. Path Planning Methods for Four-Way Shuttles in Dynamic Environments Based on A STAR and CBS Algorithms. Mathematics 2025, 13, 1588. [Google Scholar] [CrossRef] [Scilit]
- Wu, X.; Zhang, Q.; Bai, Z.; Guo, G. A Self-Adaptive Safe A STAR Algorithm for AGV in Large-Scale Storage Environment. Intell. Serv. Robot. 2024, 17, 221–235. [Google Scholar] [CrossRef] [Scilit]
- Krizmancic, M.; Arbanas, B.; Petrovic, T.; Petric, F.; Bogdan, S. Cooperative Aerial-Ground Multi-Robot System for Automated Construction Tasks. IEEE Robot. Autom. Lett. 2020, 5, 798–805. [Google Scholar] [CrossRef] [Scilit]
- Cao, Q.; He, Z.-S.; Yu, L. Modeling and Simulation for Material Supply in Emergent Disaster Based on Agent-DEVS/HLA. In Proceedings of the 2010 Third International Conference on Information and Computing (ICIC), Wuxi, China, 4–6 June 2010; IEEE: Piscataway, NJ, USA, 2010; pp. 269–272. [Google Scholar] [CrossRef] [Scilit]
- Goo, B.; Chung, H.; Han, S. Layered Discrete Event System Specification for a Ship Production Scheduling Model. Simul. Model. Pract. Theory 2019, 96, 101934. [Google Scholar] [CrossRef] [Scilit]
- Hong, J.S.; Song, H.-S.; Kim, T.G.; Park, K.H. A Real-Time Discrete Event System Specification Formalism for Seamless Real-Time Software Development. Discret. Event Dyn. Syst. 1997, 7, 355–375. [Google Scholar] [CrossRef] [Scilit]
- Fan, H.; Li, D.; Ouyang, B.; Yan, Z.; Wang, Y. Improving Scheduling in Multi-AGV Systems by Task Prediction. J. Sched. 2024, 27, 299–308. [Google Scholar] [CrossRef] [Scilit]
- Azimi, P.; Haleh, H.; Alidoost, M. The Selection of the Best Control Rule for a Multiple-Load AGV System Using Simulation and Fuzzy MADM in a Flexible Manufacturing System. Model. Simul. Eng. 2010, 2010, 821701. [Google Scholar] [CrossRef] [Scilit]
- Lowe, R.; Wu, Y.; Tamar, A.; Harb, J.; Abbeel, P.; Mordatch, I. Multi-Agent Actor-Critic for Mixed Cooperative-Competitive Environments. Adv. Neural Inf. Process. Syst. 2017, 30, 6379–6390. [Google Scholar]
- Wang, X.; Zhao, K.; Qin, B. Optimization of Task-Scheduling Strategy in Edge Kubernetes Clusters Based on Deep Reinforcement Learning. Mathematics 2023, 11, 4269. [Google Scholar] [CrossRef] [Scilit]
- Jeon, S.; Lee, H.; Kaliappan, V.K.; Nguyen, T.A.; Jo, H.; Cho, H.; Min, D. Multiagent Reinforcement Learning Based on Fusion-Multiactor-Attention-Critic for Multiple-Unmanned-Aerial-Vehicle Navigation Control. Energies 2022, 15, 7426. [Google Scholar] [CrossRef] [Scilit]
- Kang, H.; Chang, X.; Mišić, J.; Mišić, V.B.; Fan, J.; Liu, Y. Cooperative UAV Resource Allocation and Task Offloading in Hierarchical Aerial Computing Systems: A MAPPO-Based Approach. IEEE Internet Things J. 2023, 10, 10497–10509. [Google Scholar] [CrossRef] [Scilit]
- Zuo, J.; Ai, Q.; Wang, W.; Tao, W. Day-Ahead Economic Dispatch Strategy for Distribution Networks with Multi-Class Distributed Resources Based on Improved MAPPO Algorithm. Mathematics 2024, 12, 3993. [Google Scholar] [CrossRef] [Scilit]
- Song, Y.; Zeng, Q.; Chen, G.; Yuan, G.; Duan, H. Multi-Agent Proximal Policy Optimization-Based Efficient User Association and Resource Allocation in UAV-Assisted Heterogeneous Cellular Networks. Comput. Commun. 2025, 238, 108172. [Google Scholar] [CrossRef] [Scilit]
- Abbass, M.A.B.; Kang, H.S. Drone Elevation Control Based on Python-Unity Integrated Framework for Reinforcement Learning Applications. Drones 2023, 7, 225. [Google Scholar] [CrossRef] [Scilit]
- Pernas-Álvarez, J.; Crespo-Pereira, D. Open-Source 3D Discrete Event Simulator Based on the Game Engine Unity. J. Simul. 2024, 18, 886–902. [Google Scholar] [CrossRef] [Scilit]
- Singh, M.; Kapukotuwa, J.; Gouveia, E.L.S.; Fuenmayor, E.; Qiao, Y.; Murry, N.; Devine, D. Unity and ROS as a Digital and Communication Layer for Digital Twin Application: Case Study of Robotic Arm in a Smart Manufacturing Cell. Sensors 2024, 24, 5680. [Google Scholar] [CrossRef] [Scilit] [PubMed]
- Rizqi, Z.U.; Chou, S.-Y. Multi-Speed Configuration of AS/RS Amidst Responsiveness and Energy Efficiency Trade-Off: Metamodel-Based Simulation–Optimization. Int. J. Adv. Manuf. Technol. 2024, 134, 1711–1728. [Google Scholar] [CrossRef] [Scilit]
- Zhu, Z.; Wang, S.; Wang, T. Optimizing Robotic Mobile Fulfillment Systems for Order Picking Based on Deep Reinforcement Learning. Sensors 2024, 24, 4713. [Google Scholar] [CrossRef] [Scilit] [PubMed]
- Wang, B.; Yang, X.; Qi, M. Order and Rack Sequencing in a Robotic Mobile Fulfillment System with Multiple Picking Stations. Flex. Serv. Manuf. J. 2023, 35, 509–547. [Google Scholar] [CrossRef] [Scilit]
- Ramley, I.; Alzayed, H.M.; Al-Hadeethi, Y.; Chen, M.; Barasheed, A.Z. An Overview of Underwater Optical Wireless Communication Channel Simulations with a Focus on the Monte Carlo Method. Mathematics 2024, 12, 3904. [Google Scholar] [CrossRef] [Scilit]
- Pilati, F.; Lelli, G.; Regattieri, A.; Ferrari, E. Assembly Line Balancing and Activity Scheduling for Customised Products Manufacturing. Int. J. Adv. Manuf. Technol. 2022, 120, 3925–3946. [Google Scholar] [CrossRef] [Scilit]
- Hung, Y.-H.; Li, L.Y.O.; Cheng, T.C.E.; Tsai, C.Y.; Wu, C.-C.; Liao, Y.-C. Uncovering Hidden Capacity in Overall Equipment Effectiveness Management. Int. J. Prod. Econ. 2022, 248, 108494. [Google Scholar] [CrossRef] [Scilit]
- Liew, C.F.; Prakash, J.; Ong, K.S. Equipment Cost Efficiency: A Comprehensive Metric for Evaluating Operational and Financial Performance in Manufacturing. Manuf. Lett. 2024, 39, 16–19. [Google Scholar] [CrossRef] [Scilit]
- Okpala, C.C.; Chima, A.S.; Mgbemena, C.E. The Optimization of Overall Equipment Effectiveness Factors in a Pharmaceutical Company. Heliyon 2020, 6, e03796. [Google Scholar] [CrossRef] [Scilit] [PubMed]

Disclaimer/Publisher’s Note: The statements, opinions and data contained in all publications are solely those of the individual author(s) and contributor(s) and not of MDPI and/or the editor(s). MDPI and/or the editor(s) disclaim responsibility for any injury to people or property resulting from any ideas, methods, instructions or products referred to in the content. |
© 2026 by the authors. Licensee MDPI, Basel, Switzerland. This article is an open access article distributed under the terms and conditions of the Creative Commons Attribution (CC BY) license.