


Abstract
Centered on lean production, this study integrates operational technologies (OT), communication technologies (CT), and information technologies (IT) within an open-system software architecture. Under stochastic customer demand, reliance on static data and experience-based decision-making constrains firms’ responsiveness to market. The integration of lean management with a data-driven database enhances operational flexibility and decision quality, enabling small and medium-sized enterprises (SMEs) in the bicycle industry to develop responsive digital factory environments with real-time monitoring and improved operational transparency. The proposed platform is applicable to both manufacturing processes and operational management, improving overall equipment effectiveness (OEE), production efficiency, process optimization, and reducing quality losses, inventory levels, and workforce misallocation. This study investigates the application of the Analytic Hierarchy Process (AHP) and multi-criteria decision-making (MCDM) within a performance framework integrating ESG indicators and a balanced scorecard to identify key success factors for digital lean improvement in the bicycle industry. A case study of a bicycle manufacturer was conducted using questionnaire surveys and expert interviews with exporters. The results indicate that the five most critical success factors are: enhancing return on invested capital, strengthening digital capabilities, improving product quality, minimizing inventory waste, and reducing lead time. These findings provide practical guidance for decision-makers in designing more effective lean management strategies in highly competitive digital markets. Furthermore, by facilitating the adoption of appropriate digital technologies under a reasonable return on investment, this approach supports the systematic implementation of Industry 4.0 initiatives and transforms traditional lean practices into more efficient and sustainable digital lean operations.
MSC:
90B30; 90C90; 90C39
1. Introduction
Decision-making is an iterative process comprising the clarification of objectives, identification of evaluation criteria, prioritization of alternatives, and selection of the optimal solution. Given that decisions frequently involve multiple and often conflicting criteria, this process is commonly referred to as MCDM. A substantial body of literature has addressed the resolution of MCDM problems. For example, Hsu et al. [1] proposed a novel MCDM framework for knowledge management (KM) adoption and for ranking performance gaps across KM dimensions. Some studies integrated DEMATEL-based ANP with VIKOR to address recycled material vendor selection problems involving interdependent dimensions and criteria, thereby better reflecting real-world conditions than the independent assumptions of AHP. However, Hwang & Yoon [2] found that decision-makers are often less effective than they believe. A common misconception is that better decisions require more information. In practice, excessive and sometimes irrelevant information may overwhelm decision-makers and hinder the process. Therefore, decision-making remains a complex task that often requires analytical support. An information technology, known as a decision support system (DSS), emerges to assist the decision-maker to accelerate the convergence of the decision-making process. This approach integrates operational, communication, and information technologies within a lean production framework. It enables SMEs to establish a flexible digital factory command center capable of generating timely alerts under resource constraints. The system enhances visualization and transparency in manufacturing and operational management. Its objectives include improving overall equipment effectiveness, production efficiency, workflow optimization, quality loss reduction, inventory minimization, and workforce allocation. This framework supports cost-effective digital technology adoption, transforming traditional lean production practices. Additionally, it strengthens lean management by optimizing ERP systems to improve data integrity and standardization, thereby enabling more efficient operational workflows. Integrating Internet of Things (IoT) technologies allows for direct acquisition of production and quality data from equipment, ensuring data integrity and enabling real-time monitoring of key process indicators. Jaiswal et al. [3] investigate the interrelationships among lean manufacturing (LM) adoption barriers in Indian SMEs, where LM has become increasingly important for competitiveness under quality, cost, and delivery pressures. It analyzes interdependencies and prioritizes barriers using an integrated MCDM approach (grey-DEMATEL). As mentioned above, MCDM is a complicated problem but can reflect the real world precisely and therefore we should pay more attention to resolve the MCDM issue. Next, Beyaz & Yildirim [4] aimed to identify the criteria and methods that can be used in a structured feasibility analysis as an MCDM model for selecting appropriate technologies for effective DLM, aligned with process improvement needs in manufacturing firms in developing countries.
1.1. Digital Lean Management
Bertagnolli [5] explored how lean production prioritizes waste-free processes and aims for good quality, short delivery times, and low costs, focusing on customer satisfaction. The concept originated at Toyota in Japan. More recently, advancements in information technology and the emergence of Industry 4.0 have prompted firms to examine how digitalization can drive the next frontier of industrial improvement. The primary objective is to better meet customer requirements, identify critical operational issues, and enhance process efficiency. Holmemo & Korsen [6] explore how lean production is connected to digitalization in Industry 4.0. It looks at this relationship from a process perspective. Gohitha et al. [7] explore how digital tools are changing traditional lean methods using technologies like the IoT, Artificial Intelligence (AI), and automation. Hoellthaler et al. [8] show the need for a method to measure the profitability of using digital technologies in lean production for SMEs. Valamede & Akkari [9] intended to analyze the LM and I4.0 integration by studying the relationship between the classic types of waste with the digital technologies 4.0. Applying a three-phase methodology approach, the principles, attributes, and technologies of LM and I4.0 were identified. Medyński et al. [10] have developed the e-Lean system, whose task is to digitize selected lean manufacturing tools. The subject of this work is analysis of the functionality and effectiveness of the essential part of the e-Lean system in the form of specialized TPM (Total Productive Maintenance) software as an application. Liutkevičienė et al. [11] present a framework for integrating ERP and LM to enhance digital business process improvement and boost competitiveness. Mojumder [12] enhances the discourse on Industry 4.0 by providing a comprehensive analysis of the convergence between Lean Six Sigma (LSS) and digital technologies (DT), while proposing innovative approaches for hybrid performance management in advanced manufacturing systems. Bag et al. [13] explore the direct impact of digital technology capability on innovative lean management capability and its indirect effect on operational performance. Continuous learning is identified as a moderating variable that may influence the relationship between digital technology capability and innovative lean management capability. Dinis-Carvalho et al. [14] illustrate that three specific contextual factors within an organization can enable substantial performance improvements through the implementation of lean methodologies and Industry 4.0 principles. Solheim & Powell [15] identified a significant gap in the literature, which offers many frameworks for digitalization but limited insights on its integration with lean methodologies. The aforementioned literature primarily focuses on the importance of digital transformation. Melo et al. [16] analyzes current approaches to evaluating digital transformation, focusing on performance measurement frameworks and their incorporation of environmental, social, and economic sustainability dimensions. Limited research has explored the significance of digital transformation in promoting the sustainable development of SMEs in the bicycle industry.
1.2. Digital Lean Management and Balanced Scorecard (BSC)
The balanced scorecard (BSC) is extensively utilized as a tool for performance measurement and strategy implementation within organizations. The BSC performance measurement system, which was built on the stakeholder theory, was first introduced by Kaplan & Norton [17]. Garcia-Buendia et al. [18] proposed a performance measurement framework to evaluate Lean Supply Chain Management (LSCM) performance by BSC. Ibrahim et al. [19] proposed a model for small and medium-sized bicycle enterprises in Jordan to boost the economy, focusing on management accounting systems and digital balanced scorecards (D.BSC), with capital forecasting and decision-making as influencing factors. Zwickau & Unternehmensführung [20] examine how BSC and Digital Maturity Models (DMMs) can be integrated as strategic management tools for digital transformation (DT) in manufacturing companies. Karmeni et al. [21] explored the unclear link between digitalization and organizational sustainable performance, highlighting mixed effects and proposing a tool for assessment based on the sustainability balanced scorecard framework. Frederico et al. [22] present a theoretical approach based on the BSC with regard to performance measurement—PM in supply chains for the Industry 4.0 era. The aforementioned literature primarily emphasizes the importance of the DLM within BSC model. For small and medium-sized bicycle enterprises, the implementation of ESG indicators during digital transformation can enhance managerial efficiency and improve overall organizational performance. Nuansa et al. [23] examine the effects of DLM, ESG practices, and lean management on corporate value within the manufacturing sector. Carneiro et al. [24] investigate the contribution of Kaizen operational practices to ESG performance in manufacturing and develop an integrative conceptual framework to explain this relationship. Limited research has explored the significance of DLM in promoting the ESG indicators of SMEs in the bicycle industry.
1.3. Digital Lean Management and Environmental, Social, and Governance (ESG)
Buhaya & Metwally [25] explore how digital technologies enhance company sustainability and the mediating role of lean manufacturing practices. The ESG principle, established in 2004, emphasizes environmental, social, and governance practices. Countries globally are advancing coordinated development in these areas for sustainable economic and societal growth. Wang et al. [26] examine the nonlinear relationship between inventory leanness and ESG performance, focusing on how market concentration and digital transformation moderate this relationship in manufacturing enterprises. Chen et al. [27] provide insights for engineering managers and policymakers on using Lean 4.0 for sustainability by integrating Industry 4.0 technologies with lean principles. It outlines a framework detailing the drivers of Lean 4.0 implementation and its impact on ESG performance. However, despite economic growth and technological advancement, corporate performance remains central to organizational development and long-term viability. Meanwhile, changing consumer expectations and stricter regulations have reshaped the business environment. Firms are no longer isolated from social and ecological systems, as stakeholders increasingly influence corporate activities. Consequently, governance, environmental, and social factors play an increasingly important role in shaping corporate performance. Drawing on Freeman [28], stakeholder theory in corporate governance encompasses diverse participants, including managers, customers, investors, and other parties associated with or affected by corporate management. Rahmaniati & Pangeran [29] examine how integrating ISO 31000-based ERM and ESG risks into a BSC framework can enhance the sustainable financial performance of small financial institutions. Garefalakis et al. [30] examine the integration of ESG principles into the BSC framework in local government organizations to improve strategic planning and sustainability performance. Lai [31] examines the implementation of the AHP method through a bicycle industry case, where a focal firm applies web-based design for a key component. Despite substantial investments in information systems to improve productivity, competitiveness, and cost efficiency, empirical evidence has not consistently supported these outcomes. Consequently, researchers have sought improved approaches to evaluating digital lean management. Lizarelli et al. [32] examines whether Kaizen practices improve ESG performance. The results suggest that organizations can enhance ESG outcomes by adopting Kaizen and integrating digital systems. Table 1 presents a synthesis of recent literature organized based on the dimensions of the balanced scorecard (BSC) and ESG framework: financial [33,34,35,36,37,38,39,40,41,42,43,44,45,46], customer [47,48,49,50,51,52,53,54,55,56,57], internal process [58,59,60,61,62,63,64,65,66,67,68,69,70,71,72], and learning and growth [73,74,75,76,77,78,79,80,81] in consumer electronics, e-commerce, and the bike industry. The above literature highlights the interrelationship among DLM, ESG, and within the BSC framework. This study supports small and medium-sized bicycle enterprises in developing ESG indicators within the BSC framework during the implementation of DLM. Subsequently, the key operational challenges encountered by small and medium-sized bicycle enterprises are examined.
Table 1.
Summary of BSC/ESG Literature.
1.4. Problem Description
Taiwan’s small and medium-sized bicycle firms face significant operational challenges. Declining demand in European and U.S. markets has led to excess inventory, sharp order reductions (in some cases to 30% of previous levels), and intensified competition from cost-competitive Chinese brands. These pressures are further compounded by tariff uncertainties, liquidity constraints from inventory buildup, and the shift toward electric bicycles. However, DLM is not merely the adoption of digital tools; rather, it represents the integration of lean thinking with digital technologies (such as IoT, AI, MES, and ERP) to eliminate waste, enhance visibility, and improve decision-making agility. DLM exhibits cross-industry applicability: the implementation of lean and digital management techniques using a data-driven database in some industry settings. In the manufacturing industry, there is a strong need for efficiency optimization and high potential for data-driven transformation, such as in automotive, bicycle manufacturing, electronics, semiconductors, and machining; DLM generates production benefits by reducing inventory levels, improving capacity utilization, and minimizing waste (Rossini et al. [84]). In the supply chain and logistics industry, shortening lead times is a critical, strategic goal that delivers significant benefits to owners, for example, warehousing and logistics, e-commerce distribution, and third-party logistics (3PL). In the healthcare industry, digital lean management reduces healthcare waiting times and enhances quality and patient safety by applying principles from LSS, such as patient flow optimization, electronic medical records (EMR), data integration, and optimization of healthcare resource allocation (Mishra & Sharma [85]; Tlapa et al. [86]). Small and medium-sized bicycle enterprises in Taiwan are currently facing extremely severe operational challenges. The core issues include substantial inventory backlogs driven by declining demand in European and American markets, a sharp contraction in orders (in some cases dropping to as low as 30% of previous levels), and intensifying competitive pressure from the rise in high-cost-performance brands from mainland China. The adoption of DLM can address the following challenges:
- Excess Inventory and Order Contraction: Following a surge in orders during the pandemic, firms are now struggling to absorb accumulated inventory, leading to so-called “orphan orders.” Both complete bicycle manufacturers and component suppliers are experiencing substantial order reductions.
- Liquidity Pressure: Rising raw material costs combined with excessive inventory accumulation have constrained the working capital of small and medium-sized enterprises.
- Geopolitical and Tariff Risks: Anti-dumping investigations and increased tariffs in European and American markets have raised export costs and heightened uncertainty.
- Pressure for Industrial Transformation and Upgrading: Firms must rapidly transition from traditional bicycle manufacturing to the “three-electric” (motor, battery, and electronic control) technologies. However, SMEs face inherent disadvantages in terms of talent acquisition and R&D investment.
2. Research Gap
As shown in the above review, existing research in traditional lean management has ignored the role of digitalization. This is done with the hope that it may provide an alternative solution to the problem of enterprises in operational efficiency, decision-making quality, cross-departmental collaboration, quality control, and sustainable development. Additionally, DLM can enhance overall organizational performance and competitive advantage. Traditional lean management emphasizes the principles of waste elimination and continuous improvement. However, its strong focus on maximizing efficiency and minimizing inventory may also create certain limitations. For example, lean practices can increase supply chain vulnerability, place greater pressure on employees, and lead organizations to prioritize process optimization over innovation. Additional challenges include insufficient inventory buffers that heighten the risk of production disruptions, relatively centralized management structures, and limited digital data integration, which constrains traceability and data-driven decision-making. The following represent the primary limitations of traditional lean management: high employee pressure and low morale, limited capability for effective quality traceability. However, small and medium-sized bicycle enterprises have become increasingly important in national and international markets because they contribute to the development of local and national economies. Small and medium-sized bicycle enterprises often face serious challenges when competing with multinational companies. The adoption of DLM in small and medium-sized bicycle enterprises can effectively integrate lean production principles with digital technologies. To correct this, process efficiency, reducing waste, and strengthening operational resilience, should be altered. The following three issues are often posed by manufacturers as key points of interest:
- How ESG indicators can be developed within the context of DLM.
- How to use the AHP within the BSC framework to scientifically evaluate the performance of DLM information systems.
- How to support small and medium-sized bicycle enterprises in developing an MCDM framework for evaluating their competitiveness.
In this study, we adopt an MCDM framework to address the aforementioned three issues through a DLM information system integrated with ESG indicators within the BSC framework for small and medium-sized bicycle enterprises. The originality of this study lies in the integrated use of the MCDM framework and AHP to enhance the assessment of small and medium-sized bicycle enterprises’ competitiveness. AHP-BSC primarily serves as a decision-making framework that utilizes pairwise comparisons to determine the relative importance of BSC-based indicators, whereas ESG performance evaluation models focus on assessing corporate sustainability performance across environmental, social, and governance dimensions, often using ESG-specific indicator systems rather than prioritization-oriented weighting structures. The innovative contribution of this study is reflected in the scarcity of prior research addressing the practical application and integration of AHP-BSC and ESG indicators. Theoretically, it strengthens the structural extension of the ESG–BSC integration framework; methodologically, it proposes an AHP-based hierarchical integration design; and practically, it provides decision-making implications for SMEs in digital lean transformation and sustainability performance management.
The rest of the study is organized as follows: Section 3 presents the research methodology, based on which Section 4 presents the analysis and results. Section 5 introduces a real DLM scenario in the bike industry to enhance the relevance of our model in the real world; the implementation process of DLM from a bike case is presented to illustrate a solution procedure, and a sensitivity analysis is performed to provide some managerial insights and decision-making. Section 6 presents a discussion of the findings. Finally, Section 7 provides the conclusions and suggestions for further research.
3. Research Methodology
The primary objective of this study is to identify the critical success factors (CSFs) for implementing lean practices in small and medium-sized bicycle enterprises. Given the large number of categories and CSFs that must be considered in the decision-making process, multi-criteria decision-making (MCDM) methods are adopted. The following section presents a detailed description of a specific MCDM technique, namely the Analytic Hierarchy Process (AHP). AHP was developed to systematically structure complex decision problems and evaluate multiple criteria in a coherent and consistent manner. Early theorization of AHP can be traced back to Saaty [87]. Saaty [88] posited that AHP is a method of measurement with ratio scales and illustrated it with two samples. However, in many real applications, it is difficult to handle ambiguous and vague issues for the method, and mathematical models cannot cope with decision-makers’ ambiguities, uncertainties, and vagueness. The AHP is widely applied across various industries and decision-making contexts. Typical application domains include:
- Supplier Selection (Procurement and Supply Chain Management): AHP is used to develop supplier evaluation and selection decision models, to systematically assess and rank potential suppliers, for example, the automotive industry (Jain et al. [89], Dweiri et al. [90]) and the kitchenware industry (Ikinci & Tipi [91]).
- Strategic Decision-Making and Industrial Transformation: This is applied in areas such as industrial park transformation strategies and the site selection of cultural and creative industry clusters, for example, the manufacturing industry (Rehman et al. [92]).
- Competitiveness Analysis: For instance, AHP combined with Porter’s Diamond Model has been used to analyze Taiwan’s animation industry, identifying “government policy” and “demand conditions” as the most critical dimensions of competitiveness, for example: the automotive components industry (Sirikrai & Tang, [93]) and the Logistics and Supply Chain Industry (Song & Yeo [94]; Lee et al. [95]).
- Construction and Asset Management: In the construction industry, AHP is employed to identify key criteria influencing customer value, such as spatial planning and construction quality, thereby supporting product positioning and decision-making, for example, the construction industry (Marzooqi et al. [96]; Desbalo & Woldesenbet [97]).
- Information System Selection: AHP is also widely used in enterprise IT procurement decisions, such as selecting the most appropriate ERP system among alternative solutions, for example, information industry (Hsiao et al. [98], Asemi et al. [99]).
However, BSC provides a multi-dimensional framework for evaluating organizational performance across financial and non-financial perspectives—typically financial, customer, internal processes, and learning and growth. BSC in AHP provides a structured, multi-dimensional hierarchy-linking strategy to measurable criteria. ESG in lean KPIs ensures sustainability and governance objectives are operationalized and measurable, reinforcing both strategic alignment and continuous improvement. The next step involved structuring the model. The BSC criteria for digital lean (DL) applications in the bicycle industry were identified through an extensive literature review. Principles of LM reported in previous studies were systematically categorized into four main groups. The BSC criteria for DL application in the manufacturing industry were identified through an extensive literature review. Building on Putri et al. [100], this study evaluates DLM using the four perspectives of the BSC. Lean management (LM) principles identified in prior studies were categorized into the BSC dimensions, and an AHP model was developed to determine the relative importance of the evaluation criteria and indicators (Figure 1).
Figure 1.
MCDM framework.
Figure 1 presents the research framework developed based on the literature review and synthesis summarized in Table 1. To further strengthen the theoretical foundation and practical applicability of the proposed model, this study will provide a detailed explanation of how the ESG dimensions and their corresponding evaluation indicators are aligned with the assessment criteria of the BSC. Furthermore, building on Carneiro et al. [24], who identified the link between Kaizen practices and ESG outcomes through digital transformation and organizational culture, this study develops an AHP-based evaluation framework that systematically integrates ESG indicators with BSC strategic perspectives. By establishing a hierarchical structure and weighting mechanism, the proposed model provides a transparent and practical approach for performance measurement and decision evaluation, thereby enhancing the interpretability and managerial relevance of the findings.
For the environmental dimension, measurable indicators may include minimizing inventory waste, mitigating carbon cost risk, strengthening green brand image, lean production, reducing energy consumption, carbon footprint assessment for lightweight materials, and strengthening sustainability awareness.
For the social dimension, measurable indicators may include increasing revenue from high-value products, improving product quality, enhancing customer satisfaction, establishing a subscription service model, frame recycling rates, and enhancing employee engagement.
For the governance dimension, measurable indicators may include enhancing operational efficiency, enhancing return on invested capital, reducing lead time, enhancing supply chain transparency, enhancing digital capabilities, establishing a data-driven culture, and fostering innovation. After explaining the ESG performance measurement framework, the study will subsequently provide a detailed description of the AHP decision evaluation model.
3.1. The Implementation Procedure of Analytic Hierarchy Process (AHP)
The implementation procedure of AHP was as follows, consisting of seven steps for assessing digital lean management performance:
- Problem Structuring and Developing a Hierarchical Framework from the Objective (Zero Level) to the Lowest Levels (Criteria and Sub-Criteria): This document highlights 20 CSFs for successfully implementing digital lean practices in small and medium-sized bicycle enterprises.
- Definition of the decision problem and the refinement of the selection criteria.
- Creating a structure for the CSFs of digital lean practices in small and medium-sized bicycle enterprises.
- Data Collection through Pairwise Comparisons via Expert Interviews: To obtain the data, structured questioning with experts actively involved in the decision-making problem must be conducted (Cheng & Li [101]). Subsequently, the pairwise comparison matrix A is constructed as follows:
- 5.
- Determination of normalized priority weights for individual factors and conducting the consistency test.
This step is concluded by performing the consistency test through the calculation of the consistency ratio (CR) as follows.
- Calculation of the largest Eigen value of the matrix by solving the following equation:
- Computation of the CR as:
- 6.
- This document analyzes the priority weights and provides a solution to the problem. Analyzing the priority weights and deriving a solution to the problem.
- 7.
- Sensitivity analysis.
3.2. An Approach Utilizing AHP to Prioritize the Critical Success Factors (CSFs) of Digital Lean Management in Small and Medium-Sized Enterprises
Some authors have used the AHP to approach DLM. Belhadi et al. [102] discussed prioritizing the CSFs for implementing DLM in small and medium-sized bicycle enterprises using an AHP-based approach. A literature review has been conducted to identify the CSFs for lean implementation in SMEs based on existing studies. After identifying the initial list of CSFs for implementing lean methodologies in small and medium-sized bicycle enterprises, the main objective of this study is to prioritize these CSFs. Therefore, the core contributions of the AHP can be specifically reflected in the following aspects:
- In the context of DLM information system decision-making, the AHP approach integrates ESG-related indicators by consolidating key dimensions—namely Intelligent Scheduling Optimization, Intelligent Manufacturing Systems into a structured set of core evaluation criteria.
- The quality of DLM decision-making can be enhanced by utilizing expert questionnaire data and consistency validation, thereby effectively mitigating potential decision bias.
- Within the DLM framework, AHP analysis reveals the following key capabilities: the Inventory Turnover Ratio as a critical indicator under the environmental dimension; the E-bike Sales Share as a key indicator under the social dimension; and the Manufacturing Cost Reduction Rate as a key indicator under the governance dimension.
3.3. Participants
S Company is pursuing digital transformation but is confronted with several challenges, including constrained financial resources, requirements for improved production quality, and the need to reduce inventory waste. A total of 50 experts from the bicycle industry, ERP systems, digital transformation, and production management domains were invited to participate in this study. A structured expert questionnaire was developed based on the four dimensions of the BSC. The key success factors of DLM identified by these industry experts were systematically coded and assigned numerical identifiers for subsequent analysis. A total of 50 questionnaires were distributed to experts, of which 45 were returned, yielding a response rate of 90%. After consistency testing, 40 questionnaires (returned questionnaires) were deemed valid, resulting in a valid response rate of 80%. Questionnaires deemed invalid based on the consistency ratio (CR > 0.1) were removed from the dataset. The subject was asked to fill out a questionnaire which elicited information concerning his attitude and professional knowledge of the bike industry. They came from various countries of Taiwan. Their ages ranged from fifty to sixty years.
3.4. Outline of Survey
For the AHP, respondents were asked to respond to a series of redundant pairwise comparisons. We thus needed to take into account the possible inconsistency of a pairwise comparison matrix in analyzing elicited weights. To ensure methodological rigor, responses with a consistency ratio (CR) greater than 0.10 were excluded from the final sample. Consistent with the recommendations of the AHP literature, only questionnaires satisfying the consistency requirement (CR ≤ 0.10) were retained for subsequent analysis, thereby enhancing the reliability and validity of the expert judgments.
Expert Panel Selection
Based on the above-described S company context and expert selection criteria, the following presents a summary of the questionnaire screening process. The expert panel consisted of 40 professionals representing five key domains relevant to digital lean management and ESG transformation, including ESG implementation, lean management, ERP systems, manufacturing operations, information systems, and strategic decision-making. To ensure the reliability of expert judgments, participants were required to possess at least a bachelor’s degree, hold a supervisory or higher-level position, and have a minimum of ten years of relevant professional experience. The distribution of expertise areas and demographic characteristics of the expert panel are presented in Table 2, Table 3 and Table 4.
Table 2.
Distribution of expert panel members by area of expertise (N = 40).
Table 3.
Expert selection criteria.
Table 4.
Demographic and professional profile of the expert panel (N = 40).
3.5. Questionnaire Screening Procedure
In order to establish criteria weights, 40 experts were asked to express their opinions on the relative importance of the criteria in the form of pairwise judgments. However, Saaty’s 1–9 scale was utilized to gauge answers, in which, 1 indicates “equal importance”, 3 indicates “moderate importance”, 5 indicates “strong importance”, 7 indicates “very strong importance”, and 9 indicates “absolute importance”, 2, 4, 6 and 8 indicate intermediate values. Even-numbered values fall in between importance levels. We briefly summarize the questionnaire screening procedure in Figure 2.
Figure 2.
The proposed procedure for questionnaire screening.
- Part 1. Building the initial model
In this part, this study refers to the literature reviewed in Section 2. Their indicators are generalized—the four dimensions are financial, customer, internal process, and learning growth.
- Part 2. Modifying the initial model
In this part, external experts/scholars in production management and heads of management departments were invited to identify which dimensions and criteria are appropriate for evaluating manufacturing performance.
- Part 3. Building the evaluation model
Finally, after building the AHP-based framework, pairwise comparisons were performed. To perform pairwise comparisons, separate questionnaires were prepared for the goal and for each dimension.
The following are the four dimensions and 20 criteria in the modified model:
- *Financial
- -
- Enhancing operational efficiency (EOE); minimizing inventory waste (MIW); enhancing return on invested capital (ERIC); mitigating carbon cost risk (MCCR); and increasing revenue from high-value products (IRHVP).
- *Customer
- -
- Improving product quality (IPQ); reducing lead time (RLT); enhancing customer satisfaction (ECS); strengthening green brand image (SGBI); and establishing a subscription service model (ESSM).
- *Internal Process
- -
- Lean production (LP); reducing energy consumption (REC); carbon footprint assessment for lightweight materials (CFALM); enhancing supply chain transparency (ESCT); and frame recycling rates (FRR).
- *Learning and Growth
- -
- Enhancing digital capabilities (EDC); strengthening sustainability awareness (SSA); enhancing employee engagement (EEE); establishing a data-driven culture; and fostering innovation (EDDCFI).
A scale will be defined to assess the relative weights of the categories and CSFs. Next, a decision hierarchy will be structured in collaboration with the expert panel, followed by data collection through consultations to create pairwise comparison matrices. If consistent, the weights will be analyzed for priority; if not, the expert panel will be consulted for adjustments. Finally, a sensitivity analysis will be conducted to evaluate the stability of the defined priorities.
4. Analysis and Results
The consistency of the judgments was evaluated based on Equation (4). The calculations were performed using Expert Choice 2000 software. Table 5 presents the recommended random index (RI) values proposed by Saaty.
Table 5.
Random index for consistency check.
Table A1 presents the overall results of the sub-dimensional analysis. The relative importance of the factors is ranked as follows: enhancing return on invested capital (ERIC; 18.2%; the rank = 1), enhancing digital capabilities (EDC; 14.5%, the rank = 2), improving product quality (IPQ; 13.1%, the rank = 3), minimizing inventory waste (MIW; 7.35%, the rank = 4), reducing lead time (RLT; 6.7%, the rank = 5), enhancing supply chain transparency (ESCT; 6.6%, the rank = 6), fostering innovation (FI; 5.5%, the rank = 7), enhancing customer satisfaction (ECS; 3.7%, the rank = 8), enhancing operational efficiency (EOE; 3.5%, the rank = 9), mitigating carbon cost risk (MCCR; 3.4%, the rank = 10), establishing a subscription service model (ESSM; 3.2%, the rank = 11), reducing carbon emissions (RCE; 3.15%, the rank = 12), increasing revenue from high-value products (IRHVP; 2.6%, the rank = 13), strengthening green brand image (SGBI; 2.3%, the rank = 14), strengthening sustainability awareness (SSA; 2%, the rank = 15), enhancing employee engagement (EEE; 1.8%, the rank = 16), establishing a data-driven culture (EDDC; 1.2%, the rank = 17), enhancing safety management (ESM; 0.6%, the rank = 18), lean production (LP; 0.3%, the rank = 19) and reducing energy consumption (REC; 0.25%, the rank = 20). By comparing the attribute values across all alternatives, the alternatives can subsequently be ranked according to their overall priorities. Few studies so far have attempted to account for the role of ERIC, EDC, and IPO. Zhang [103] analyzes digital ROI in multinational firms, emphasizing that accurate measurement requires clear KPIs, benchmarking, and balanced scorecard alignment with strategic goals. Gyamerah et al. [104] demonstrate that transformational leadership significantly shapes digital transformation in SMEs, highlighting the critical role of digital capabilities and the differentiated effects of digital strategies. Che et al. [105] identify digital transformation as a key driver of firms’ quality improvement, proposing a model based on organizational transparency and showing that collaboration in quality activities enhances product quality. Therefore, enhancing return on invested capital is a key objective of digitalization, as digital systems improve resource efficiency, accelerate decision-making, reduce operational costs, and enable more effective capital allocation, thereby increasing overall financial performance. Next, following the identification of the top five key indicators, Table A1 is used to further analyze the strategic management implications of ESG practices at S Company.
- ERIC/G (18.2%; the rank = 1):
Within the ESG framework, improvements in ROIC not only represent a financial outcome for S Company but also reflect its long-term strategic governance capability, sustainable investment decision-making capability, and the extent of integration between capital allocation and ESG objectives.
- EDC/G (14.5%, the rank = 2):
By facilitating ESG information disclosure and governance performance evaluation at S Company, digital tools enhance the accuracy of ESG data collection and reporting, strengthen sustainability performance tracking, and improve the visualization of key indicators through management dashboards.
- IPQ/S (13.1%, the rank = 3):
Within the social dimension of ESG, improving product quality at S Company not only reflects advancements in manufacturing and technological capabilities, but also signifies the company’s comprehensive implementation of social responsibility in terms of product safety, customer well-being, social trust, and responsible production practices.
- MIW/E (7.35%, the rank = 4),
Within the environmental dimension of ESG, assisting S Company in minimizing inventory waste not only enhances operational efficiency but also strengthens its environmental sustainability performance in green supply chain management and circular economy development by reducing resource consumption, carbon emissions, and waste generation.
- RLT/G (6.7%, the rank = 5)
Within the corporate governance dimension of ESG, reducing lead time not only contributes to improved operational efficiency at S Company but also reflects the overall enhancement of the firm’s decision-making agility, supply chain collaborative governance, information transparency, and risk management capability.
Let us consider the following, Table A2. The sub-dimensional analysis of the financial dimensions shows enhancing return on invested capital (52%), minimizing inventory waste (21%), enhancing operational efficiency (10%), mitigating carbon cost risk (9.7%), and increasing revenue from high-value products (7.3%), respectively. Among the sub-dimensions of customer dimensions, the relative importance was improving product quality (45%), reducing lead time (23%), enhancing customer satisfaction (12.9%), establishing a subscription service model (11%) and strengthening green brand image (8.1%). Among the sub-dimensions of the internal process dimension, the relative importance was enhancing digital capabilities (58%), fostering innovation (22%), strengthening sustainability awareness (8.1%), enhancing employee engagement (7.2%) and establishing a data-driven culture (4.7%). In the dimension of learning and growth, the relative importance was enhancing supply chain transparency (60%), reducing carbon emissions (29%), enhancing safety management (5.6%), lean production (3.1%) and reducing energy consumption (2.3%). Similarly, comparing the attribute values of all the alternatives, we can rank them accordingly. Since ‘enhancing return on invested capital’ received the highest weight in the financial dimension (52%), the S company prioritized the implementation of an ERP system with automated scheduling capabilities in the early stage of its digital transformation; minimizing inventory waste (21%) can be effectively achieved through the integration of real-time data analytics, intelligent demand forecasting, and automated inventory management systems. Enhancing operational efficiency (10%) can improve process integration, reduce manual workloads, and enable faster, more accurate decision-making through the use of digital technologies. Mitigating carbon cost risk (9.7%) enables more accurate carbon tracking, improving emissions transparency through digital monitoring systems, and supporting data-driven sustainability management and compliance.
4.1. Sensitivity Analysis
The sensitivity of the group weights with respect to a change in one pairwise comparison supplied by one user is now calculated and the row geometric means are calculated for the matrix. AHP assumes independence among criteria; therefore, sensitivity analyses should be conducted to examine the potential impact of plausible interdependencies on the resulting rankings. Improta et al. [106] demonstrate, using MCDM techniques, that the AHP still suffers from some theoretical disputes. One major criticism is that the assumption of independence among the criteria can be considered a limitation of the AHP in certain cases. In fact, Saaty [107] demonstrate that one of the main aspects of the AHP is the assumption of independence between the various levels of the hierarchical structure in terms of both the criteria and sub-criteria. The final ranking of alternatives depends on the weights of the main criteria, and small changes in these weights can significantly affect the results. As these weights are often based on subjective judgments, ranking stability should be tested under different scenarios. Sensitivity analysis is used for this purpose by varying criterion weights to examine how rankings change. If results are highly sensitive, the weights may need to be revised and additional criteria considered to improve discrimination. In this study, key criteria weights are varied from 0% to 100% while adjusting others to keep the total at 100%. The performance graph (Figure 3) illustrates how alternatives change under different weight settings. Sensitivity of Expert Choice was performed to analyze the change in outcome caused by a change in each of the main criterion. The aim of sensitivity analysis is to explore how these changes affect the priorities of the selected alternatives. Figure 3 demonstrates the current importance of each alternative considering all criteria used in this model. As can be seen from Figure 3, the highest value corresponds to enhancing operational efficiency (38.3%). Additionally, Figure 3 also shows the values of the weights of all three main criteria from minimizing inventory waste (16.7%), improving product quality (13.1%), enhancing return on invested capital (7.2%), from Using Expert Choice 2000 2nd Edition software, variations in local priority weights can be analyzed. This indicates that enhancing operational efficiency exhibits the greatest variation, suggesting that for each unit of investment in the DLM information system, managers can significantly improve on-site operational efficiency. The finding that “Enhancing Return on Invested Capital” received the highest priority indicates that organizations implementing digital lean information systems are primarily concerned with maximizing the economic value generated from digital transformation investments. This result suggests that firms should align digital lean initiatives with financial performance objectives, ensuring that investments in digital technologies contribute directly to productivity improvement, cost reduction, resource utilization efficiency, and long-term competitive advantage. Particularly for SMEs with limited resources, digital lean projects should be evaluated based on their ability to generate measurable returns and sustainable business value. However, a comparison of Table A1 and Figure 3 indicates that the differences between the baseline AHP ranking (primary results) and the sensitivity analysis outcomes (robustness validation) can be attributed to scenario-based weight adjustments, which reflect changes in decision priorities. The AHP results represent the original expert judgments, whereas the sensitivity analysis assesses the robustness and stability of the rankings under varying weight conditions.
Figure 3.
Performance sensitivity of alternative.
4.2. Determination of Performance Ratings
The adaptability of linguistic variables associated with membership functions can assist designers to efficiently adjust importance degrees and reorder the priorities of the customer requirements. The corresponding characteristics in design alternatives should also be modified in response to this adjustment and to ensure that the designs meet customer requirements. This process can be systematically analyzed through sensitivity across different dimensions, providing insights into how changes in customer priorities impact design decisions and enabling a more responsive and flexible design strategy, as presented in Figure 4. Table 6 reveals insights into the importance and stability of the indicator weights. ‘FD1’ (enhancing operational efficiency) showed the highest mean weight (0.383),with a 95% confidence interval.
Figure 4.
Sensitivity for different dimensions.
Table 6.
Weight intervals (expert bootstrap).
It is important to emphasize that the differences between the provided averages of Spearman’s rank correlation coefficients (Spearman rho-s) show the performance of the aggregation priority vectors, not the indicators themselves, where W1 is pre-implementation mean weight, W2 is post-implementation mean weight, Spearman ρ = 0.956245. It implies that the high degree of correspondence between W1 and W2 suggests that the relative importance of the evaluation criteria remained stable before and after the implementation of the digital lean management system, thereby indicating the robustness of managerial preferences and decision-making priorities. Table 7 presents Spearman’s rank correlation coefficients between the group-aggregated priority vector and the individual expert preference vectors. The results demonstrate the extent to which the aggregated priorities reflect the ranking preferences of individual experts, thereby providing an assessment of the stability and representativeness of the group decision-making outcome.
Table 7.
Spearman’s rank correlation coefficients between the group-aggregated priority vector and individual expert preference vectors (n = 20).
5. Application Example
Although this study provides theoretical and practical insights, its design has limitations. Taiwan’s bicycle industry serves as a leading example of ESG adoption, transitioning toward a green and sustainable model aligned with the 2050 net-zero target. Through the DLM system, the industry integrates digital technologies with lean production to enhance manufacturing efficiency and serves as a benchmark for industrial upgrading. To validate the proposed approach, a real-world case from Taiwan’s bicycle industry is presented, followed by sensitivity analysis to examine variations in optimal policy outcomes.
5.1. DLM Case in the Bike Industry
The selected manufacturer is a large, popular company in Taiwan’s OEM/ODM bike industry with a renowned 15-year history. Operational challenges and digital transformation initiatives of S company. As shown in Table A1, the following findings are observed.
Q1. High-Mix, Low-Volume Production Challenges in Taiwan’s Bicycle Components Industry
Taiwan’s bicycle components industry operates under a high-mix, low-volume model. In the post-COVID-19 context, firms face declining order volumes and more urgent, uncertain delivery demands, increasing operational complexity.
- Production Intelligence Control Center
To operationalize Intelligent Scheduling Optimization within DLM at S company, the key lies in its integration with lean principles, including waste reduction, pull-based production, and continuous improvement. Accordingly, Company S integrated a MES with IoT technologies to establish a real-time production intelligence control center, enabling faster issue detection, reduced downtime, and improved on-time delivery performance.
- APS–Supplier Integration
S company integrates an intelligent supply chain within its DLM framework by adopting a demand-driven (pull-based) system, real-time synchronization, and end-to-end optimization. Accordingly, the implementation of an APS system integrated with key suppliers enhanced visibility of material availability and consolidation status, thereby improving supply chain coordination and delivery reliability.
Q2. Workforce Discontinuity and Labor Shortages in Manufacturing
Manufacturing industries face increasing workforce discontinuity due to aging labor, weak knowledge transfer, and skilled labor shortages.
- Digital Lean SOP Standardization
The Intelligent Management System (IMS) aims to make S company’s operations faster, more accurate, and more transparent through value stream redesign, digitalization of key processes, intelligent scheduling, digital lean KPIs, and a continuous improvement loop. Accordingly, S company applied DLM to standardize SOPs, improving training consistency, process transparency, coordination, and operational efficiency.
- Objective Performance Evaluation System
When real-time quality monitoring is used only as an auxiliary dashboard, it leads to process digitalization rather than transformation. In contrast, S company implemented a quantified, goal-aligned performance appraisal system linking evaluations to compensation and bonuses, reducing subjectivity, improving fairness, and enhancing retention.
This study builds on the framework proposed by Medyński et al. [10], which demonstrated the effectiveness of digital TPM tools in supporting lean management. The evaluation dimensions and indicators were adapted to the operational characteristics and improvement needs of the bicycle industry, providing a basis for assessing DLM implementation performance and improvement priorities. The S company has manufactured several innovative products, including a bicycle pedal and gravel bike suspension fork. In this study, we illustrate a small and medium-sized bicycle enterprises in which DLM cases frequently occur. Figure 5 shows the system architecture for corporation strategy map and the balanced scorecard. The following figure denotes that KPIs should be derived from executives’ strategic objectives; otherwise, they risk measuring what is easily quantifiable rather than what is strategically important. To ensure effective strategy execution—an essential CEO concern—OKR/KPIs should reflect either mission-critical initiatives (project-based KPIs) or key operational processes (process-based KPIs). Budgeting and rolling forecasts should be aligned with funding requirements for strategic projects (nonrecurring investments) and operational processes (recurring, volume-driven costs). Risk-related expenditures should also be incorporated, addressing a key limitation of the balanced scorecard regarding risk integration. Under budgetary and resource constraints, S company must adopt strategies such as ERP, BPR, and PM to achieve enterprise-wide digitalization and accelerate the implementation of DLM. Niven & Lamorte [108] have defined OKRs as a critical thinking framework and ongoing discipline that seeks to ensure employees work together, focusing their efforts to make measurable contributions that drive the company forward.
Figure 5.
Integrated analytical framework of the corporate strategy map and the balanced scorecard.
A key element of effective digital management is the ability to anticipate future sales and operational requirements, thereby aligning managerial processes with production flexibility demands. The process begins with an assessment of the organization’s current digital maturity and managerial capabilities. Based on the assessment results, specific implementation tasks are formulated, and appropriate digital technologies are selected in accordance with actual operational needs and investment capacity. This structured approach enables firms to capture the benefits of digital upgrading while avoiding unnecessary expenditure on high-cost tools. By adhering to a staged digital management framework, organizations can achieve predefined objectives at each phase, thereby facilitating successful transformation and sustained business improvement. Figure 6 illustrates the implementation process of the DLM system.
Figure 6.
Procedural framework for implementing digital lean management.
As shown in Table A1, the five highest-ranked criteria are enhancing return on invested capital/intelligent scheduling optimization (Rank = 1), enhancing digital capabilities/intelligent manufacturing system (Rank = 2), improving product quality/real-time quality monitoring (Rank = 3), minimizing inventory waste/real-time inventory visibility (Rank = 4), reducing lead time/intelligent supply chain (Rank = 5), respectively. The findings suggest that strengthening digital capabilities (Rank 2) within DLM at S company depends largely on aligning digital initiatives with core lean principles, namely waste reduction, pull-based production, and continuous improvement. Therefore, S company intends to implement an integrated architecture combining the IoT and SCADA platforms to enable the real-time acquisition and monitoring of production-related data, including personnel, equipment status, product quality, and environmental conditions. Data collected from various sensors and Programmable Logic Controllers (PLCs) are subsequently processed through visualized edge controllers and AI-driven analytical systems, which generate actionable control information to support intelligent decision-making and process optimization. This information is then transmitted to the application layer, where the SCADA platform performs computations to provide real-time production status for the entire production line or facility. The third-ranked factor, real-time quality monitoring, is supported by the deployment of an integrated IoT–SCADA architecture within Company S. This architecture enables continuous data collection, real-time process monitoring, and automated control across manufacturing operations, thereby strengthening quality assurance capabilities and facilitating data-driven decision-making. At the sensing layer, various IoT-enabled devices and sensors are deployed to capture operational data, such as equipment status, production parameters, and environmental conditions. These data are transmitted through a communication network to the control layer, where the SCADA system performs centralized supervision, visualization, and control of manufacturing processes. The system allows operators to monitor system performance, detect anomalies, and execute timely interventions. At the application layer, collected data are further processed and analyzed to support decision-making, predictive maintenance, and continuous improvement initiatives. The integration of IoT and SCADA thus facilitates enhanced data transparency, operational efficiency, and responsiveness, contributing to the implementation of digital lean management within S company. Figure 7 depicts the IoT/SCADA-based information system architecture adopted by S company.
Figure 7.
IoT/SCADA information system architecture adopted by S company.
With the implementation of digital lean management technologies, organizations can utilize digital tools to integrate customer requirements and develop modular product designs. Coupled with a flexible manufacturing operations model, this approach enhances production flexibility in response to changing market demands. The fifth-ranked factor, intelligent supply chain, is supported by real-time supply chain monitoring, which improves supply chain visibility and predictive decision-making capabilities. This enables managers to proactively adjust production schedules and resource allocations in response to changing operational conditions. As a result, companies can achieve coordinated operations, swift delivery, enhanced inventory and logistics efficiency, and optimized partnerships, thereby strengthening their adaptability to market fluctuations and competitive advantage. Figure 8 depicts the performance improvements realized by S company after the implementation of DLM. We see from Figure 8 that a 60% reduction in inventory should be explicitly recorded through the MES system; it could be the improvement magnitude in the inventory turnover rate. A 40% increase in production capacity typically indicates that the production process has been optimized through the implementation of MES, IoT, and AI-based scheduling systems. This improvement leads to higher output per unit of time and enhanced overall equipment effectiveness (OEE), as well as reduced downtime and fewer production bottlenecks. In addition, it enables more efficient allocation of labor and machine resources, allowing greater output to be achieved with the same level of input, thereby reducing unit production costs. Verifiable key performance indicators (KPIs) from the case company before and after implementation to strengthen the study’s claims include exportable quantitative metrics derived from ERP, MES, or SCADA systems. Experts applied mean-based estimation to compare pre- and post-implementation performances of the digital lean management system. However, a comprehensive understanding of the complexities of external validity in such evaluations requires adequate data literacy regarding digital lean management systems.
Figure 8.
Estimated benefits of digital lean management implementation.
5.2. Practical Challenges
For small and medium-sized bicycle enterprises, the adoption of digital lean management is constrained by financial limitations, insufficient digital talent, system integration difficulties, and organizational resistance. However, the return on investment can be realized through multiple pathways, including productivity improvement, cost reduction, inventory optimization, and revenue expansion. The ROI is typically accumulated progressively across short-, medium-, and long-term horizons, reflecting a staged transformation from operational efficiency gains to strategic competitiveness enhancement. For human and technical constraints, small and medium-sized bicycle enterprises face a shortage of talent in data analytics, IT integration, and AI applications. In addition, their capabilities in operating and maintaining MES and IoT systems are often limited. For system integration barriers, legacy systems in existing production environments are often incompatible with IoT connectivity. Furthermore, data silos persist among ERP, MES, and SCADA systems, hindering seamless information integration.
5.3. Limitations of the Study
Nevertheless, this study presents several limitations that warrant further investigation. Although digital technologies encompass a range of advanced manufacturing and digital solutions, the rapid pace of technological innovation implies that not all relevant technologies are captured within the scope of this study, which is a single-case study approach including a digital lean management Transformation Strategy and Ten-Year Development Trajectory Analysis. DLM is not merely the implementation of software systems; rather, it represents a systemic upgrade integrated with Industry 4.0 principles. This ten-year transformation trajectory typically follows the stages below:
- Early Stage (Lean Foundation and Process Standardization, Years 1–3): Eliminating non-value-added activities and defining standardized operating procedures (SOPs), addressing paper-based workflows, and initiating the first phase of data digitization.
- Middle Stage (Digitalization and Automation, Years 4–6): Establishing a digital factory through the deployment of IoT sensors for data acquisition, enabling production transparency and real-time monitoring, as exemplified by Ming-Chang International’s digital transformation.
- Long-Term Stage (Data-Driven Intelligence, Years 7–10): Leveraging AI analytics for predictive maintenance and scheduling optimization, shifting from experience-based decision-making to data-driven decision-making, and ultimately achieving a fully integrated digital lean system.
5.4. Management Implications
In real-world business, an SME will face financial limitations, insufficient digital talent, system integration difficulties, and organizational resistance during the process of enterprise digital transformation. However, small and medium-sized bicycle enterprises encounter various challenges. Business owners seek to establish KPIs to enhance managerial performance following digital transformation. Table A1 shows that the five major CFS/KPI for enhancing return on invested capital/intelligent scheduling optimization (ERIC; 18.2%; the rank = 1), enhancing digital capabilities/intelligent manufacturing system (EDC; 14.5%, the rank = 2), improving product quality/real-time quality monitoring (IPQ; 13.1%, the rank = 3), minimizing inventory waste/real-time inventory visibility (MIW; 7.35%, the rank = 4), reducing lead time/intelligent supply chain (RLT; 6.7%, the rank = 5). The implementation of the digital lean system is as follows:
- Intelligent Scheduling Optimization: To effectively operationalize Intelligent Scheduling Optimization within DLM at S company, the key lies not in merely implementing a scheduling system, but in embedding it into the broader framework of lean thinking, for example: waste elimination, pull-based production, and continuous improvement. The essence of intelligent scheduling is to enable S company to perform real-time optimization of production decision-making, aligning with the three core principles of lean management, which includes: waste elimination (Muda), pull system, and continuous improvement (Kaizen).
- Intelligent Manufacturing System (IMS): IMS serves the core logic of DLM, rather than replacing it. The primary objective of IMS is to enable the S company of operations to become faster, more accurate, and more transparent. This integration should encompass value stream redesign, digitalization of critical process nodes, implementation of intelligent scheduling, establishment of digital lean KPIs, and the formation of a continuous improvement closed loop.
- Real-Time Quality Monitoring: Real-time quality monitoring is merely regarded as “an additional quality dashboard,” it only results in the digitalization of manufacturing processes rather than a true transformation. In contrast, in the case of S Company, quality data are directly integrated into the lean system to actively drive process control, production scheduling, and continuous improvement. This approach encompasses Quality Value Stream Mapping, the design of Critical Control Points, the establishment of real-time quality KPIs, the implementation of a closed-loop control mechanism, and continuous learning and optimization.
- Real-Time Inventory Visibility: In S company, real-time inventory data are systematically integrated to drive pull-based production, inform replenishment decisions, and optimize operational processes. This integrated framework comprises inventory value stream analysis, the identification and design of critical inventory control points, the development of real-time inventory KPIs, the implementation of a closed-loop replenishment mechanism, and ongoing learning and continuous optimization.
- Intelligent Supply Chain: S Company integrates an intelligent supply chain into digital lean management by adopting a demand-driven (pull) system, real-time synchronization, and end-to-end optimization. This integration generates tangible operational benefits, including reduced stockout risk, minimized inventory waste, and improved delivery accuracy.
6. Discussion
OKRs are used to define what an organization or system aims to achieve, while KPIs serve as concrete performance indicators for measuring the extent to which those objectives are accomplished. The AHP, in turn, is applied when multiple evaluation criteria must be considered simultaneously, enabling the determination of the relative weights of different criteria in decision-making. Fattahi et al. [109] aim to identify and prioritize key performance criteria and indicators to improve the productivity of special production and services in the bicycle sector. Using an OKR-based perspective, it examines service quality through the LibQUAL and three-pronged models, while BSC and PPM are applied to assess management structure and performance, enabling the identification of critical success factors and development of KPIs. AHP is then used to weight and rank these factors based on predefined success criteria. The relationship among the three can be characterized as a hierarchical structure that progresses from goal setting to performance measurement and further extends to weighting-based decision-making: OKR (goal setting) → KPI (performance measurement) → AHP (weighting decision-making). Traditional industries and manufacturing: precise KPI-based efficiency measurement to ensure stable production capacity. Applicable approach: KPIs as the primary framework, with OKRs as a supplementary mechanism. Traditional industries (e.g., automotive manufacturing and food processing) and the manufacturing sector generally focus on production capacity, quality control, and operational efficiency as their core objectives. These indicators are typically concrete and quantifiable; therefore, KPIs are more appropriate for performance management in such contexts. Practical case: KPI settings in a bicycle component assembly plant.
- Production Efficiency: Each production line is required to complete 500 component assemblies per hour.
- Product Yield Rate: The assembly qualification rate of bicycle components must reach 99%.
- Equipment Utilization Rate: Machine operating time must exceed 20 h per day.
7. Conclusions
The evaluation of the implementation of digital lean management requires appropriate metrics. The proposed framework, in order to take into account the CFS of digital lean management in the bicycle industry, makes use of AHP techniques for measuring and quantifying user satisfaction. The proposed planning framework commences with a systematic diagnosis of gaps in the factory’s existing digital lean production capabilities. Based on this evaluation, targeted improvement initiatives are formulated, beginning with information integration, followed by structured data collection and its effective application. Future research is therefore encouraged to identify emerging and critical technologies, refine measurement constructs, and reassess the proposed hypotheses. Finally, the measurement of digital technologies and lean production in this study relies on traditional keyword frequency analysis derived from corporate announcements. Future research may adopt more advanced analytical techniques, such as natural language processing, to enhance the precision and robustness of measurement and analysis, incorporating a fuzzy comprehensive evaluation or expanding the industrial scope. Furthermore, future research should consider adopting multi-case study designs for validation and comparative analysis, thereby enhancing the generalizability and robustness of the findings.
Author Contributions
Conceptualization, C.-T.T. and M.-W.W.; methodology, M.-W.W.; software, M.-W.W.; validation, M.-W.W., Y.-F.H. and C.-T.T.; formal analysis, C.-T.T.; investigation, C.-T.T. and M.-W.W.; resources, C.-T.T.; data curation, C.-T.T. and M.-W.W.; writing—original draft preparation, C.-T.T. and M.-W.W.; writing—review and editing, C.-T.T. and M.-W.W.; visualization, C.-T.T. and M.-W.W.; supervision, Y.-F.H.; project administration, Y.-F.H.; funding acquisition, Y.-F.H. All authors have read and agreed to the published version of the manuscript.
Funding
This research was supported by National Science and Technology Council under Grant NSTC 113-2622-E-324-004 and Chaoyang University of Technology.
Data Availability Statement
The original contributions presented in the study are included in the article, further inquiries can be directed to the corresponding author.
Acknowledgments
The authors would like to thank the editor and anonymous reviewers for their valuable and constructive comments, which have led to a significant improvement in the manuscript.
Conflicts of Interest
The authors declare that there are no conflicts of interest.
Abbreviations
The following abbreviations are used in this manuscript:
| SCADA | Supervisory Control and Data Acquisition |
| OKRs | Objectives and Key Results |
| PLCs | Programmable Logic Controllers |
| IoT | Internet of Things |
| TPS | Toyota Production System |
| OEE | Overall Equipment Effectiveness |
| CSFs | Critical Success Factors |
| MCDM | Multi-Criteria Decision-Making |
| SMEs | Small and Medium-Sized Enterprises |
| MES | Manufacturing Execution System |
| BSC | Balanced Scorecard |
| LM | Lean Management |
Appendix A
Table A1.
Weight analysis of overall indicators.
Table A2.
Analysis of pairwise comparison matrices and weights across the four dimensions.
References
- Hsu, C.H.; Wang, F.K.; Tzeng, G.H. The best vendor selection for conducting the recycled material based on a hybrid MCDM model combining DANP with VIKOR. Resour. Conserv. Recycl. 2012, 66, 95–111. [Google Scholar] [CrossRef] [Scilit]
- Hwang, C.L.; Yoon, K. Multiple Attribute Decision Making: Methods and Application; Springer: New York, NY, USA, 1981. [Google Scholar]
- Jaiswal, P.; Singh, A.; Misra, S.C.; Kumar, A. Barriers in implementing lean manufacturing in Indian SMEs: A multi-criteria decision-making approach. J. Model. Manag. 2021, 16, 339–356. [Google Scholar] [CrossRef] [Scilit]
- Beyaz, H.F.; Yıldırım, N. A Multi-criteria Decision-Making Model for Digital Transformation in Manufacturing: ACase Study from Automotive Supplier Industry. In Proceedings of the International Symposium for Production Research 2019. ISPR 2019; Durakbasa, N., Gençyılmaz, M., Eds.; Lecture Notes in Mechanical Engineering; Springer: Cham, Switzerland, 2020. [Google Scholar] [CrossRef] [Scilit]
- Bertagnolli, F. Lean Management Introduction and In-Depth Study of Japanese Management Philosophy; Springer: Berlin/Heidelberg, Germany, 2018; pp. 1–449. [Google Scholar] [CrossRef] [Scilit]
- Holmemo, M.D.Q.; Korsen, E.B.H. The growing gap between lean production and digital lean tools. Int. J. Lean Six Sigma 2023, 14, 1188–1206. [Google Scholar] [CrossRef] [Scilit]
- Gohitha, M.J.; Vivekanand, S.G.; Inchara, N.A.; Shankaramma. Digitalization of Lean Tools and Techniques: Enhancing Efficiency and Quality in Modern Industries. In Proceedings of the 2024 8th International Conference on Computational System and Information Technology for Sustainable Solutions (CSITSS), Bengaluru, India, 7–9 November 2024. [Google Scholar] [CrossRef] [Scilit]
- Hoellthaler, G.; Braunreuther, S.; Reinhart, G. Digital Lean Production An Approach to Identify Potentials for the Migration to a Digitalized Production System in SMEs from a Lean Perspective. Procedia CIRP 2018, 67, 522–527. [Google Scholar] [CrossRef] [Scilit]
- Valamede, L.S.; Akkari, A.C.S. Lean 4.0: Digital Technologies as Strategies to Reduce Waste of Lean Manufacturing. In Proceedings of the 7th Brazilian Technology Symposium (BTSym’21). BTSym 2021; Smart Innovation, Systems and Technologies; Springer: Cham, Switzerland, 2022. [Google Scholar] [CrossRef] [Scilit]
- Medyński, D.; Bonarski, P.; Motyka, P.; Wysoczański, A.; Gnitecka, R.; Kolbusz, K.; Dąbrowska, M.; Burduk, A.; Pawelec, Z.; Machado, J. Digital Standardization of Lean Manufacturing Tools According to Industry 4.0 Concept. Appl. Sci. 2023, 13, 6259. [Google Scholar] [CrossRef] [Scilit]
- Liutkevičienė, I.; Rytter, N.G.M.; Hansen, D. Leveraging capabilities for digitally supported process improvement: A framework for combining Lean and ERP. Bus. Process Manag. J. 2022, 28, 765–783. [Google Scholar] [CrossRef] [Scilit]
- Mojumder, M.U. Impact of Lean Six Sigma on Manufacturing Efficiency Using a Digital Twin-Based Performance Evaluation Framework. ASRC Procedia Glob. Perspect. Sci. Sch. 2025, 1, 343–375. [Google Scholar] [CrossRef] [Scilit]
- Bag, S.; Rahman, M.S.; Sharma, J.; Chiarini, A.; Srivastava, S.K.; Gupta, S. Building digital technology and innovative lean management capabilities for enhancing operational performance: An empirical study. Prod. Plan. Control 2025, 36, 1009–1028. [Google Scholar] [CrossRef] [Scilit]
- Dinis-Carvalho, J.; Sousa, R.M.; Moniz, I.; Macedo, H.; Lima, R.M. Improving the Performance of a SME in the Cutlery Sector Using Lean Thinking and Digital Transformation. Sustainability 2023, 15, 8302. [Google Scholar] [CrossRef] [Scilit]
- Solheim, A.B.; Powell, D.J. A Learning Roadmap for Digital Lean Manufacturing. In Advances in Production Management Systems. Towards Smart and Digital Manufacturing; Springer: Cham, Switzerland, 2020; pp. 1009–1028. [Google Scholar] [CrossRef] [Scilit]
- Melo, I.C.M.; Queiroz, G.A.; Junior, P.N.A.; Sousa, T.B.D.; Yushimito, W.F.; Pereira, J. Sustainable digital transformation in small and medium enterprises (SMEs): A review on performance. Heliyon 2023, 9, e13908. [Google Scholar] [CrossRef] [Scilit]
- Kaplan, R.; Norton, D. The Balanced Score Card—Measures That Drive Performance. Harv. Bus. Rev. 1992, 70, 71–79. [Google Scholar] [PubMed]
- Garcia-Buendia, N.; Kristensen, T.B.; Moyano-Fuentes, J.; Maqueira-Marín, J.M. Performance measurement of lean supply chain management: A balanced scorecard proposal. Prod. Plan. Control 2024, 35, 618–638. [Google Scholar] [CrossRef] [Scilit]
- Ibrahim, I.; Mohammed, A.; Abdulaali, H.S.; Mohammad, M.M.; Ali, K. Does Digital Balanced Scorecards Lead to the Sustainable Performance Amongst the Jordanian SMEs? Int. J. Prof. Bus. Rev. 2023, 8, 35. [Google Scholar] [CrossRef] [Scilit]
- Zwickau, W.H.; Friedemann, R. Balanced Scorecard and Maturity Models in the Context of the Digital Transformation of Manufacturing Companies. MBA Int. Bus. Publ. 2025, 4–30. [Google Scholar] [CrossRef]
- Karmeni, K.; Beldi, A.; Saadi, T. Exploring the performance effects of digitalization: A measurement tool based on the sustainability balanced scorecard framework. Technol. Anal. Strateg. Manag. 2025, 37, 2174–2188. [Google Scholar] [CrossRef] [Scilit]
- Frederico, G.F.; Kumar, V.; Garza-Reyes, J.A.; Martins, R.A.; Kumar, A. Guest editorial: Performance measurement in supply chains during disruptions: Lessons from the COVID-19 pandemic. Int. J. Qual. Reliab. Manag. 2023, 40, 1113–1118. [Google Scholar] [CrossRef] [Scilit]
- Nuansa, N.Y.I.; Lestari, M.I.; Caroline, S.T. Natural Language Processing in Digital Transformation, ESG Practices, and Lean Management: A Determinant Factor of Manufacturing Firm Value. In Proceedings of the 2025 7th International Conference on Cybernetics and Intelligent System (ICORIS), Mataram, Indonesia, 22 December 2025; pp. 2174–2188. [Google Scholar] [CrossRef] [Scilit]
- Carneiroa, F.; Lizarellib, F.L.; Suarez-Barrazac, M.; Antonye, J.; Sony, M.; Ma, J. Exploring the impact of kaizen practices on ESG performance in manufacturing: The role of digital technologies and organizational culture. Prod. Plan. Control 2026, 1–24. [Google Scholar] [CrossRef] [Scilit]
- Buhaya, M.I.; Metwally, A.B.M. The Interplay Between Digital Technologies and Sustainable Performance: Does Lean Manufacturing Matter? Sustainability 2024, 16, 10002. [Google Scholar] [CrossRef] [Scilit]
- Wang, J.; Zhang, Y.; Yao, X.; Zhu, X. The impact of lean inventory management on ESGperformance. J. Manuf. Technol. Manag. 2025, 36, 1096–1118. [Google Scholar] [CrossRef] [Scilit]
- Chen, C.; Pong, K.Y.; Chung, W.J. When Lean Meets Industry 4.0: A Case-Based Research for Exploring the Effects of Lean 4.0 on ESG and Sustainability Performance. IEEE Trans. Eng. Manag. 2025, 72, 3023–3041. [Google Scholar] [CrossRef] [Scilit]
- Freeman, R.E. Strategic Management: A Stakeholder Approach; Pitman: Boston, MA, USA, 1984. [Google Scholar]
- Rahmaniati, N.P.G.; Pangeran, P. Integrating Enterprise Risk Management (ERM) and Environmental, Social, and Governance (ESG) Risks into Balanced Scorecard (BSC) for Sustainable Performance in a Rural Bank. Binus Bus. Rev. 2025, 16, 319–339. [Google Scholar] [CrossRef] [Scilit]
- Garefalakis, S.; Angelaki, E.; Spinthiropoulos, K.; Tsamis, G.; Garefalakis, A. The Implementation of ESG Indicators in the Balanced Scorecard—Case Study of LGOs. Risks 2025, 13, 154. [Google Scholar] [CrossRef] [Scilit]
- Lai, I.S.; Huang, Y.F.; Siang, J.H.; Weng, M.W. Evaluation of Key Success Factors for Web Design in Taiwan’s Bike Case Study. J. Asian Financ. Econ. Bus. 2020, 7, 927–937. [Google Scholar] [CrossRef] [Scilit]
- Lizarelli, F.L.; Antony, J.; Suarez, M.; Carneiro, F.; Sony, M.; Chakraborty, A.; Ma, J.; Chan, F.T. Analysis of the impact of Kaizen practices on ESG performance the mediating role of digital systems. Bus. Process Manag. J. 2025, 31, 148–175. [Google Scholar] [CrossRef] [Scilit]
- Ta, T.T.; Doan, T.N.; Tran, H.N.; Dam, T.A.; Pham, T.M.Q. Factors affecting the application of balanced scorecard to enhance operational efficiency of listed companies: The case of Vietnam. Cogent Bus. Manag. 2022, 9, 2149146. [Google Scholar] [CrossRef] [Scilit]
- Rodríguez-Rodríguez, R.; Alfaro-Saiz, J.J.; Carot, J.M. A dynamic supply chain BSC-based methodology to improve operations efficiency. Comput. Ind. 2020, 122, 103294. [Google Scholar] [CrossRef] [Scilit]
- Partouvi, S.; Najafi, S.E. A Balanced Scorecard-Driven DEAModel for Organizational Efficiency. J. Organ. Technol. Entrep. 2024, 2, 165–174. [Google Scholar] [CrossRef] [Scilit]
- Garg, A.; Deshmukh, S.G. Designing balanced scorecard for multi echelon repair inventory systems. J. Model. Manag. 2012, 7, 59–96. [Google Scholar] [CrossRef] [Scilit]
- Elsharydah, A.; Michaelis, M.A.; Rajan, N. Lean Management: Inventory Waste Management. In Manual of Practice Management for Ambulatory Surgery Centers; Rajan, N., Ed.; Springer: Cham, Switzerland, 2020. [Google Scholar] [CrossRef] [Scilit]
- Hussien, G.A. Enhancing Efficiency Effectiveness in MROInventory Management Using Lean Six Sigma. IUP J. Oper. Manag. 2025, 24, 19–55. [Google Scholar] [CrossRef] [Scilit]
- Abd-Elrahman, A.E.H.; Kamel, M.A.; Said, S.M. Measuring and managing organizational performance based on organizational capitals, service quality and BSC performance outcomes. Manag. Res. Rev. 2025, 48, 121–145. [Google Scholar] [CrossRef] [Scilit]
- Krstić, B.; Bonić, L.; Rađenović, T.; Vujatović, M.J.; Ognjanović, J. Improving Profitability Measurement: Impact of Intellectual Capital Efficiency on Return on Total Employed Resources in Smart and Knowledge-Intensive Companies. Sustainability 2023, 15, 12076. [Google Scholar] [CrossRef] [Scilit]
- Picanço, M.L.R.; Guimarães, J.L.C.; Júnior, R.N.C.C.; da Silva, M.M.; da Silva, W.C.; da Cruz, S.L.F. Balanced Scorecard in Environmental Sciences: A Tool for Sustainable Management. ARACÊ 2025, 7, 25876–25900. [Google Scholar] [CrossRef] [Scilit]
- Rana, T.; Rahman, M.J.; Öhman, P. Management Control, Performance Measurement, and Climate Risk Management Perspectives for Carbon Accounting. In Carbon Accounting for Sustainability and Environmental Management; Routledge: London, UK, 2025; pp. 328–355. [Google Scholar]
- Myung, J.K.; An, H.T.; Lee, S.Y. Corporate Competitiveness Index of Climate Change: A Balanced Scorecard Approach. Sustainability 2019, 11, 1445. [Google Scholar] [CrossRef] [Scilit]
- Tsai, Y.C.; Cheng, Y.T. Analyzing key performance indicators (KPIs) for E-commerce and Internet marketing of elderly products: A review. Arch. Gerontol. Geriatr. 2012, 55, 126–132. [Google Scholar] [CrossRef] [Scilit] [PubMed]
- Okorie, O.; Charnley, F.; Russell, J.; Tiwari, A.; Moreno, M. Circular business models in high value manufacturing: Five industry cases to bridge theory and practice. Bus. Strat. Environ. 2021, 30, 1780–1802. [Google Scholar] [CrossRef] [Scilit]
- Saleem, D.M.; Nadeem, M.S.A.; Naz, P.D.S. Medicinal crops as a pathway to sustainable agriculture, food security, farmers’ income, and sustainable development in Pakistan. J. Clim. Community Dev. 2025, 4, 157–167. [Google Scholar]
- Bataineh, A.; Ziyad, A.S.; Alrjoub, A. The effect of using balanced scorecard (BSC) on reducing production costs in the Jordanian industrial companies. J. Bus. Retail Manag. Res. 2019, 13, 190–202. [Google Scholar] [CrossRef] [Scilit]
- Elkanayati, R.M.; Shamah, R. Could the balanced scorecard enhance pharmaceutical organizations’ quality performance? Ind. Commer. Train. 2019, 51, 256–276. [Google Scholar] [CrossRef] [Scilit]
- Afonso, H.; Cabrita, M.D.R. Developing a Lean Supply Chain Performance Framework in a SME: A Perspective Based on the Balanced Scorecard. Procedia Eng. 2015, 131, 270–279. [Google Scholar] [CrossRef] [Scilit]
- El-Garaihy, W.H. Analysis of supply chain operations reference (SCOR) and balanced scorecard (BSC) in measuring supply chains efficiency using DEMATEL and DEA techniques? J. Glob. Oper. Strateg. Sourc. 2021, 14, 680–700. [Google Scholar] [CrossRef] [Scilit]
- Karintseva, O.; Tarasenko, S.; Chulanov, K.; Kharchenko, M.; Matsenko, O. Evaluating and enhancing performance of corporate strategy through KPI-S and BSC. Екoнoміка Рoзвитку Систем 2025, 7, 151–157. [Google Scholar] [CrossRef] [Scilit]
- Meena, P.L.; Tibrewala, R. Evaluating buyer performance through supplier satisfaction: A balanced scorecard and fuzzy logic approach. Benchmarking Int. J. 2026, 33, 167–195. [Google Scholar] [CrossRef] [Scilit]
- Singh, A.; Sharma, M. Development of a green IT brand image sustainability model for competitive advantage. Environ. Dev. Sustain. 2023, 25, 40–60. [Google Scholar] [CrossRef] [Scilit]
- Van Nguyen, I.; Quach, T.T.; Nguyen, T.T. Impacts of Corporate Social Responsibility and Green Marketing Strategy on Business Performance: The Moderating Role of Balanced Scorecard. J. Asian Financ. Econ. Bus. 2022, 9, 73–83. [Google Scholar]
- Sah, A.K.; Hong, Y.M.; Huang, K.C. Enhancing Brand Value Through Circular Economy Service Quality: The Mediating Roles of Customer Satisfaction, Brand Image, and Customer Loyalty. Sustainability 2025, 17, 1332. [Google Scholar] [CrossRef] [Scilit]
- Faiz, M.; Daniel, A.K. A Multi-Criteria Dual Membership Cloud Selection Model based on Fuzzy Logic for, QoS. Int. J. Comput. Digit. Syst. 2022, 12, 453–467. [Google Scholar] [CrossRef] [Scilit] [PubMed]
- Li, Z.; Wang, D.; Nan, G.; Li, M. Optimal Revenue Model of a Social Networking Service: Ad-Sponsored, Subscription-Based, or Hybrid? IEEE Trans. Eng. Manag. 2022, 71, 1927–1939. [Google Scholar] [CrossRef] [Scilit]
- Kaldırım, Y. Performance Measurement Reporting in Lean Manufacturing Environment: Integration of Balanced Scorecard Lean Accounting Box Score. J. Bus. Res. 2020, 12, 1098–1108. [Google Scholar] [CrossRef] [Scilit]
- Kang, C.K.T.; Lin, C.Y.; Ho, Y.H. Key Factors to Increasing Free Cash Flow for Manufacturers Utilizing Lean Production: An AHP-DEMATEL Approach. Inf. Manag. Bus. Rev. 2022, 14, 28–45. [Google Scholar] [CrossRef] [Scilit] [PubMed]
- Cerf, S.; Bleuse, R.; Reis, V.; Perarnau, S.; Rutten, É. Sustaining Performance While Reducing Energy Consumption: A Control Theory Approach. In Euro-Par 2021: Parallel Processing. Euro-Par 2021; Sousa, L., Roma, N., Tomás, P., Eds.; Lecture Notes in Computer Science; Springer: Cham, Switzerland, 2021; Volume 12820, pp. 334–349. [Google Scholar] [CrossRef] [Scilit]
- Jassem, S.; Zakaria, Z.; Azmi, A.C. Sustainability balanced scorecard architecture and environmental performance outcomes: A systematic review. Int. J. Prod. Perform. Manag. 2022, 71, 1728–1760. [Google Scholar] [CrossRef] [Scilit]
- Stavropoulou, E.; Spinthiropoulos, K.; Ragazou, K.; Papademetriou, C.; Passas, I. Green Balanced Scorecard: A Tool of Sustainable Information Systems for an Energy Efficient Business. Energies 2023, 16, 6432. [Google Scholar] [CrossRef] [Scilit]
- Jiang, Q.; Huang, C.; Wu, Z. Predicting building energy consumption in urban neighborhoods using machine learning algorithms. Front. Urban Rural Plan. 2024, 2, 6. [Google Scholar] [CrossRef] [Scilit]
- Guan, X.; Xu, Z.; Liu, Y.; Wu, J.; Zhu, J.; Xu, W. Reduction in Energy Consumption of the 5G Communication System and Beyond Through Collaborative Optimization for BS Site Operation: Challenges, Efforts and the New Approach. IEEE Trans. Ind. Inform. 2024, 20, 3948–3963. [Google Scholar] [CrossRef] [Scilit]
- Wang, W.; Hao, S.; Zhong, H.; Sun, Z. Integrating Behaviour-Based Safety and Organisational Culture through the Balanced Scorecard: A Conceptual Framework for Enhancing Safety Performance in Ghanaian Construction SMEs. Int. J. Innov. Sci. Res. Technol. 2026, 11, 1068–1076. [Google Scholar] [CrossRef] [Scilit]
- Rahuma, A.; Fethi, S. A new approach to evaluate environmental strategy: Empirical evidence from international petroleum companies using the balanced scorecard model. Bus. Strat. Environ. 2022, 31, 3152–3165. [Google Scholar] [CrossRef] [Scilit]
- Wang, W.; Hao, S.; Zhong, H.; Sun, Z. Toward Sustainable Construction: Optimizing Carbon Emission Reduction in the Building Supply Chain through Game-Theoretic Strategies, Government Subsidies, and Cost-Sharing Contract. J. Constr. Eng. Manag. 2024, 150, 04024042. [Google Scholar] [CrossRef] [Scilit]
- Bach, M.P.; Klinčar, A.; Aleksić, A.; Jelavić, S.R.; Zeqiri, J. Supply Chain Management Maturity and Business Performance: The Balanced Scorecard Perspective. Appl. Sci. 2023, 13, 2065. [Google Scholar] [CrossRef] [Scilit]
- Yang, L.; Lu, L. Improving supply chain transparency: From the perspective of suppliers. Ann. Oper. Res. 2025, 350, 1331–1362. [Google Scholar] [CrossRef] [Scilit]
- Amiri, S.M.H.; Islam, M.M.; Hossen, M.S.; Amiri, S.M.H.; Mamun, M.S.A. Akter N, Blockchain-enabled solutions for enhancing supply chain transparency traceability. Int. J. Sci. Res. Arch. 2025, 16, 928–945. [Google Scholar] [CrossRef] [Scilit]
- Lin, W.C.; Cheng, H.H. Improving maritime safety through enhancing marine process management: The application of balanced scorecard. Manag. Decis. 2021, 59, 604–615. [Google Scholar] [CrossRef] [Scilit]
- Elshaer, E. Alignment of Safety Management System with Business Strategy to Promote Safety Performance in Construction Field. Int. J. Sci. Technol. 2025, 16, 1–11. [Google Scholar] [CrossRef] [Scilit]
- Eifert, A.; Julmi, C. Challenges and How to Overcome Them in the Formulation and Implementation Process of a Sustainability Balanced Scorecard (SBSC). Sustainability 2022, 14, 14816. [Google Scholar] [CrossRef] [Scilit]
- Silva, A.; Maldonado, I.; Silva, M.D.; Cepeda, C. Sustainability Balanced Scorecard: Systematic Literature Review. J. Risk Financ. Manag. 2025, 18, 324. [Google Scholar] [CrossRef] [Scilit]
- Cignitas, C.; Torrents, J.A.; Vilajosana, J. The impact of strategy performance management methods on employee well-being: A case study to analyses balanced scorecard effects. J. Posit. Sch. Psychol. 2022, 6, 2653–2672. [Google Scholar]
- Guo, F.; Huang, Y.S.; Nemoto, M. Reimagining hospital management: The balanced scorecard as a catalyst for employee retention and organizational excellence. Front. Public Health 2024, 12, 1485683. [Google Scholar] [CrossRef] [Scilit] [PubMed]
- Javed, B.; Akhlaq, A. A Systematic Review of Exploring the Multiple Dimensions of Data-Driven Culture. Int. J. Trends Innov. Bus. Soc. Sci. 2024, 2, 522–536. [Google Scholar] [CrossRef] [Scilit]
- Solanki, A.; Jain, K.; Jadiga, S. Building a Data-Driven Culture: Empowering Organizations with Business Intelligence. Int. J. Comput. Trends Technol. 2024, 72, 46–55. [Google Scholar] [CrossRef] [Scilit]
- Almheiri, R.K.; Jabeen, F.; Kazi, M.; Santoro, G. Big data analytics competitive performance: The role of environmental uncertainty managerial support data-driven culture. Manag. Environ. Qual. Int. J. 2025, 36, 1071–1094. [Google Scholar] [CrossRef] [Scilit]
- Aziz, T.N.; Tajarahim, N.A.; Fadzilah, N.S.M.; Azis, T.M.F. Fostering Innovation Leadership Culture Balanced Scorecard Performance in Life Insurance Agencies: Insights from Malaysia. Int. J. Acad. Res. Bus. Soc. Sci. 2024, 14, 105–112. [Google Scholar] [CrossRef] [Scilit] [PubMed]
- Yang, C.C.; Chen, M.Y.C.; Lin, C.Y.Y. How does management innovation foster hospital performance? The mediating role of organizational capital. Knowl. Manag. Res. Pract. 2026, 10, 1–14. [Google Scholar] [CrossRef] [Scilit]
- Fabac, R. Digital Balanced Scorecard System as a Supporting Strategy for Digital Transformation. Sustainability 2022, 14, 9690. [Google Scholar] [CrossRef] [Scilit]
- Samsuden, N.S.; Kohar, U.H.A.; Khatib, S.F.A.; Abbas, A.F. Digital Capabilities and Business Performance: A Systematic Literature Review. Sustainability 2024, 16, 11108. [Google Scholar] [CrossRef] [Scilit]
- Rossini, M.; Cifone, F.D.; Kassem, B.; Costa, F.; Portioli-Staudacher, A. Being lean: How to shape digital transformation in the manufacturing sector. J. Manuf. Technol. Manag. 2021, 32, 239–259. [Google Scholar] [CrossRef] [Scilit]
- Mishra, V.; Sharma, M.G. Factors affecting implementation of digital lean in healthcare in the post-COVID world—mixed-method approach. TQM J. 2024, 36, 1651–1664. [Google Scholar] [CrossRef] [Scilit]
- Tlapa, D.; Tortorella, G.; Fogliatto, F.; Kumar, M.; Mac Cawley, A.; Vassolo, R.; Enberg, L.; Baez-Lopez, Y. Effects of Lean Interventions Supported by Digital Technologies on Healthcare Services: A Systematic Review. Int. J. Environ. Res. Public Health 2022, 19, 9018. [Google Scholar] [CrossRef] [Scilit] [PubMed]
- Saaty, T.L. Ascaling method for priorities in a hierarchical structures. J. Math. Psychol. 1977, 15, 234–281. [Google Scholar] [CrossRef] [Scilit]
- Saaty, T.L. Axiomatic foundation of the analytic hierarchy process. Manag. Sci. 1986, 32, 841–855. [Google Scholar] [CrossRef] [Scilit]
- Jain, V.; Sangaiah, A.K.; Sakhuja, S. Supplier selection using fuzzy AHP and TOPSIS: A case study in the Indian automotive industry. Neural Comput. Appl. 2018, 29, 555–564. [Google Scholar] [CrossRef] [Scilit]
- Dweiri, F.; Kumar, S.; Khan, S.A.; Jain, V. Designing an integrated AHP based decision support system for supplier selection in automotive industry. Expert Syst. Appl. 2016, 62, 273–283. [Google Scholar] [CrossRef] [Scilit]
- Ikinci, M.; Tipi, T. Food supplier selection in the catering industry using the analytic hierarchy process. Food Sci. Technol. 2022, 42, e48420. [Google Scholar] [CrossRef] [Scilit]
- Rehman, A.U.; Mian, S.H.; Umer, U.; Usmani, Y.S. Strategic Outcome Using Fuzzy-AHP-Based Decision Approach for Sustainable Manufacturing. Sustainability 2019, 11, 6040. [Google Scholar] [CrossRef] [Scilit]
- Sirikrai, S.B.; Tang, J.C.S. Industrial competitiveness analysis: Using the analytic hierarchy process. J. High Technol. Manag. Res. 2006, 17, 71–83. [Google Scholar] [CrossRef] [Scilit]
- Song, D.W.; Yeo, K.T. A Competitive Analysis of Chinese Container Ports Using the Analytic Hierarchy Process. Marit. Econ. Logist. 2004, 6, 34–52. [Google Scholar] [CrossRef] [Scilit]
- Lee, Y.; Song, J.M.; Park, S.P.; Sohn, B.R. A Study on the Comparative Analysis of Port Competitiveness Using AHP. Int. J. Marit. Aff. Fish. 2014, 6, 53–71. [Google Scholar] [CrossRef] [Scilit]
- Marzooqi, F.A.A.; Hussain, M.; Ahmad, S.Z. Performance of physical asset management using the analytic hierarchy process. Prop. Manag. 2019, 37, 327–345. [Google Scholar] [CrossRef] [Scilit]
- Desbalo, M.T.; Woldesenbet, A.K. Enhancing strategic decision-making in built asset management through BIM-Enabled asset information modelling (AIM) for public buildings in Ethiopia: A fuzzy-AHP analysis. Heliyon 2024, 10, e40824. [Google Scholar] [CrossRef] [Scilit] [PubMed]
- Hsiao, W.H.; Chang, T.S.; Huang, M.S.; Chen, Y.C. Selection criteria of recruitment for information systems employees: Using the analytic hierarchy process (AHP) method. Afr. J. Bus. Manag. 2011, 5, 6200–6208. [Google Scholar] [CrossRef]
- Asemi, A.; Ko, A.; Asemi, A. The AHP-TOPSIS based DSS for selecting suppliers of information resources. In Proceedings of the 2022 Second International Conference on Distributed Computing and High Performance Computing (DCHPC), Qom, Iran, 2–3 March 2022; IEEE: New York, NY, USA, 2022. [Google Scholar] [CrossRef] [Scilit]
- Putri, S.K.; Sulistyo, B.; Suryana, N. Designing the Performance Measurement System for A Digital Enterprise using Balanced Scorecard. J. Tek. Ind. 2024, 10, 501–511. [Google Scholar] [CrossRef] [Scilit]
- Cheng, E.W.; Li, H. Analytic hierarchy process: An approach to determine measures for business performance. Meas. Bus. Excell. 2001, 5, 30–37. [Google Scholar] [CrossRef] [Scilit]
- Belhadi, A.; Touriki, F.E.; Elfezazi, S. Evaluation of critical success factors (CSFs) to lean implementation in SMEs using AHP A case study. Int. J. Lean Six Sigma 2019, 10, 803–829. [Google Scholar] [CrossRef] [Scilit]
- Zhang, K. Evaluating return on investment for digital technology investments in multinational corporations. Bus. Inf. 2024, 7, 247–253. [Google Scholar] [CrossRef] [Scilit]
- Gyamerah, S.; Afshari, L.; Asante, D. Digital transformation in the SMEcontext: The nexus between leadership digital capabilities digital strategy. Int. Small Bus. J. 2025, 43, 303–328. [Google Scholar] [CrossRef] [Scilit]
- Che, T.; Cai, J.; Yang, R.; Lai, F. Digital transformation drives product quality improvement: An organizational transparency perspective. Technol. Forecast. Soc. Change 2023, 197, 122888. [Google Scholar] [CrossRef] [Scilit]
- Improta, G.; Russo, M.; Trassi, M.-T.; Converso, G.; Murino, T.; Santillo, L. Use of the AHP Methodology in System Dynamics: Modelling and Simulation for Health Technology Assessments to Determine the Correct Prosthesis Choice for Hernia Diseases Giovanni; Department of Public Health, University of Naples “Federico II”: Naples, Italy, 2018. [Google Scholar]
- Saaty, T. Fundamentals of Decision Making and Priority Theory with The Analytic Hierarchy Process; RWS Publications: Pittsburgh, PA, USA, 1994; Volume 6. [Google Scholar]
- Niven, P.; Lamorte, B. Introduction to OKRs. In Objectives and Key Results: Driving Focus, Alignment, and Engagement with OKRs; John Wiley & Sons, Inc.: Hoboken, NJ, USA, 2016; pp. 1–27. [Google Scholar] [CrossRef] [Scilit]
- Fattahi, M.; Noori, D.; Azimi, A. Designing and prioritizing key performance indicators in evaluating and improving the productivity of special libraries (the organization under study: Water and electricity industry of Iran). Int. J. Librariansh. 2025, 10, 43–70. [Google Scholar] [CrossRef] [Scilit]
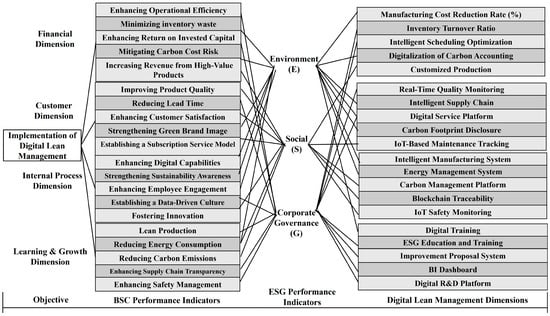
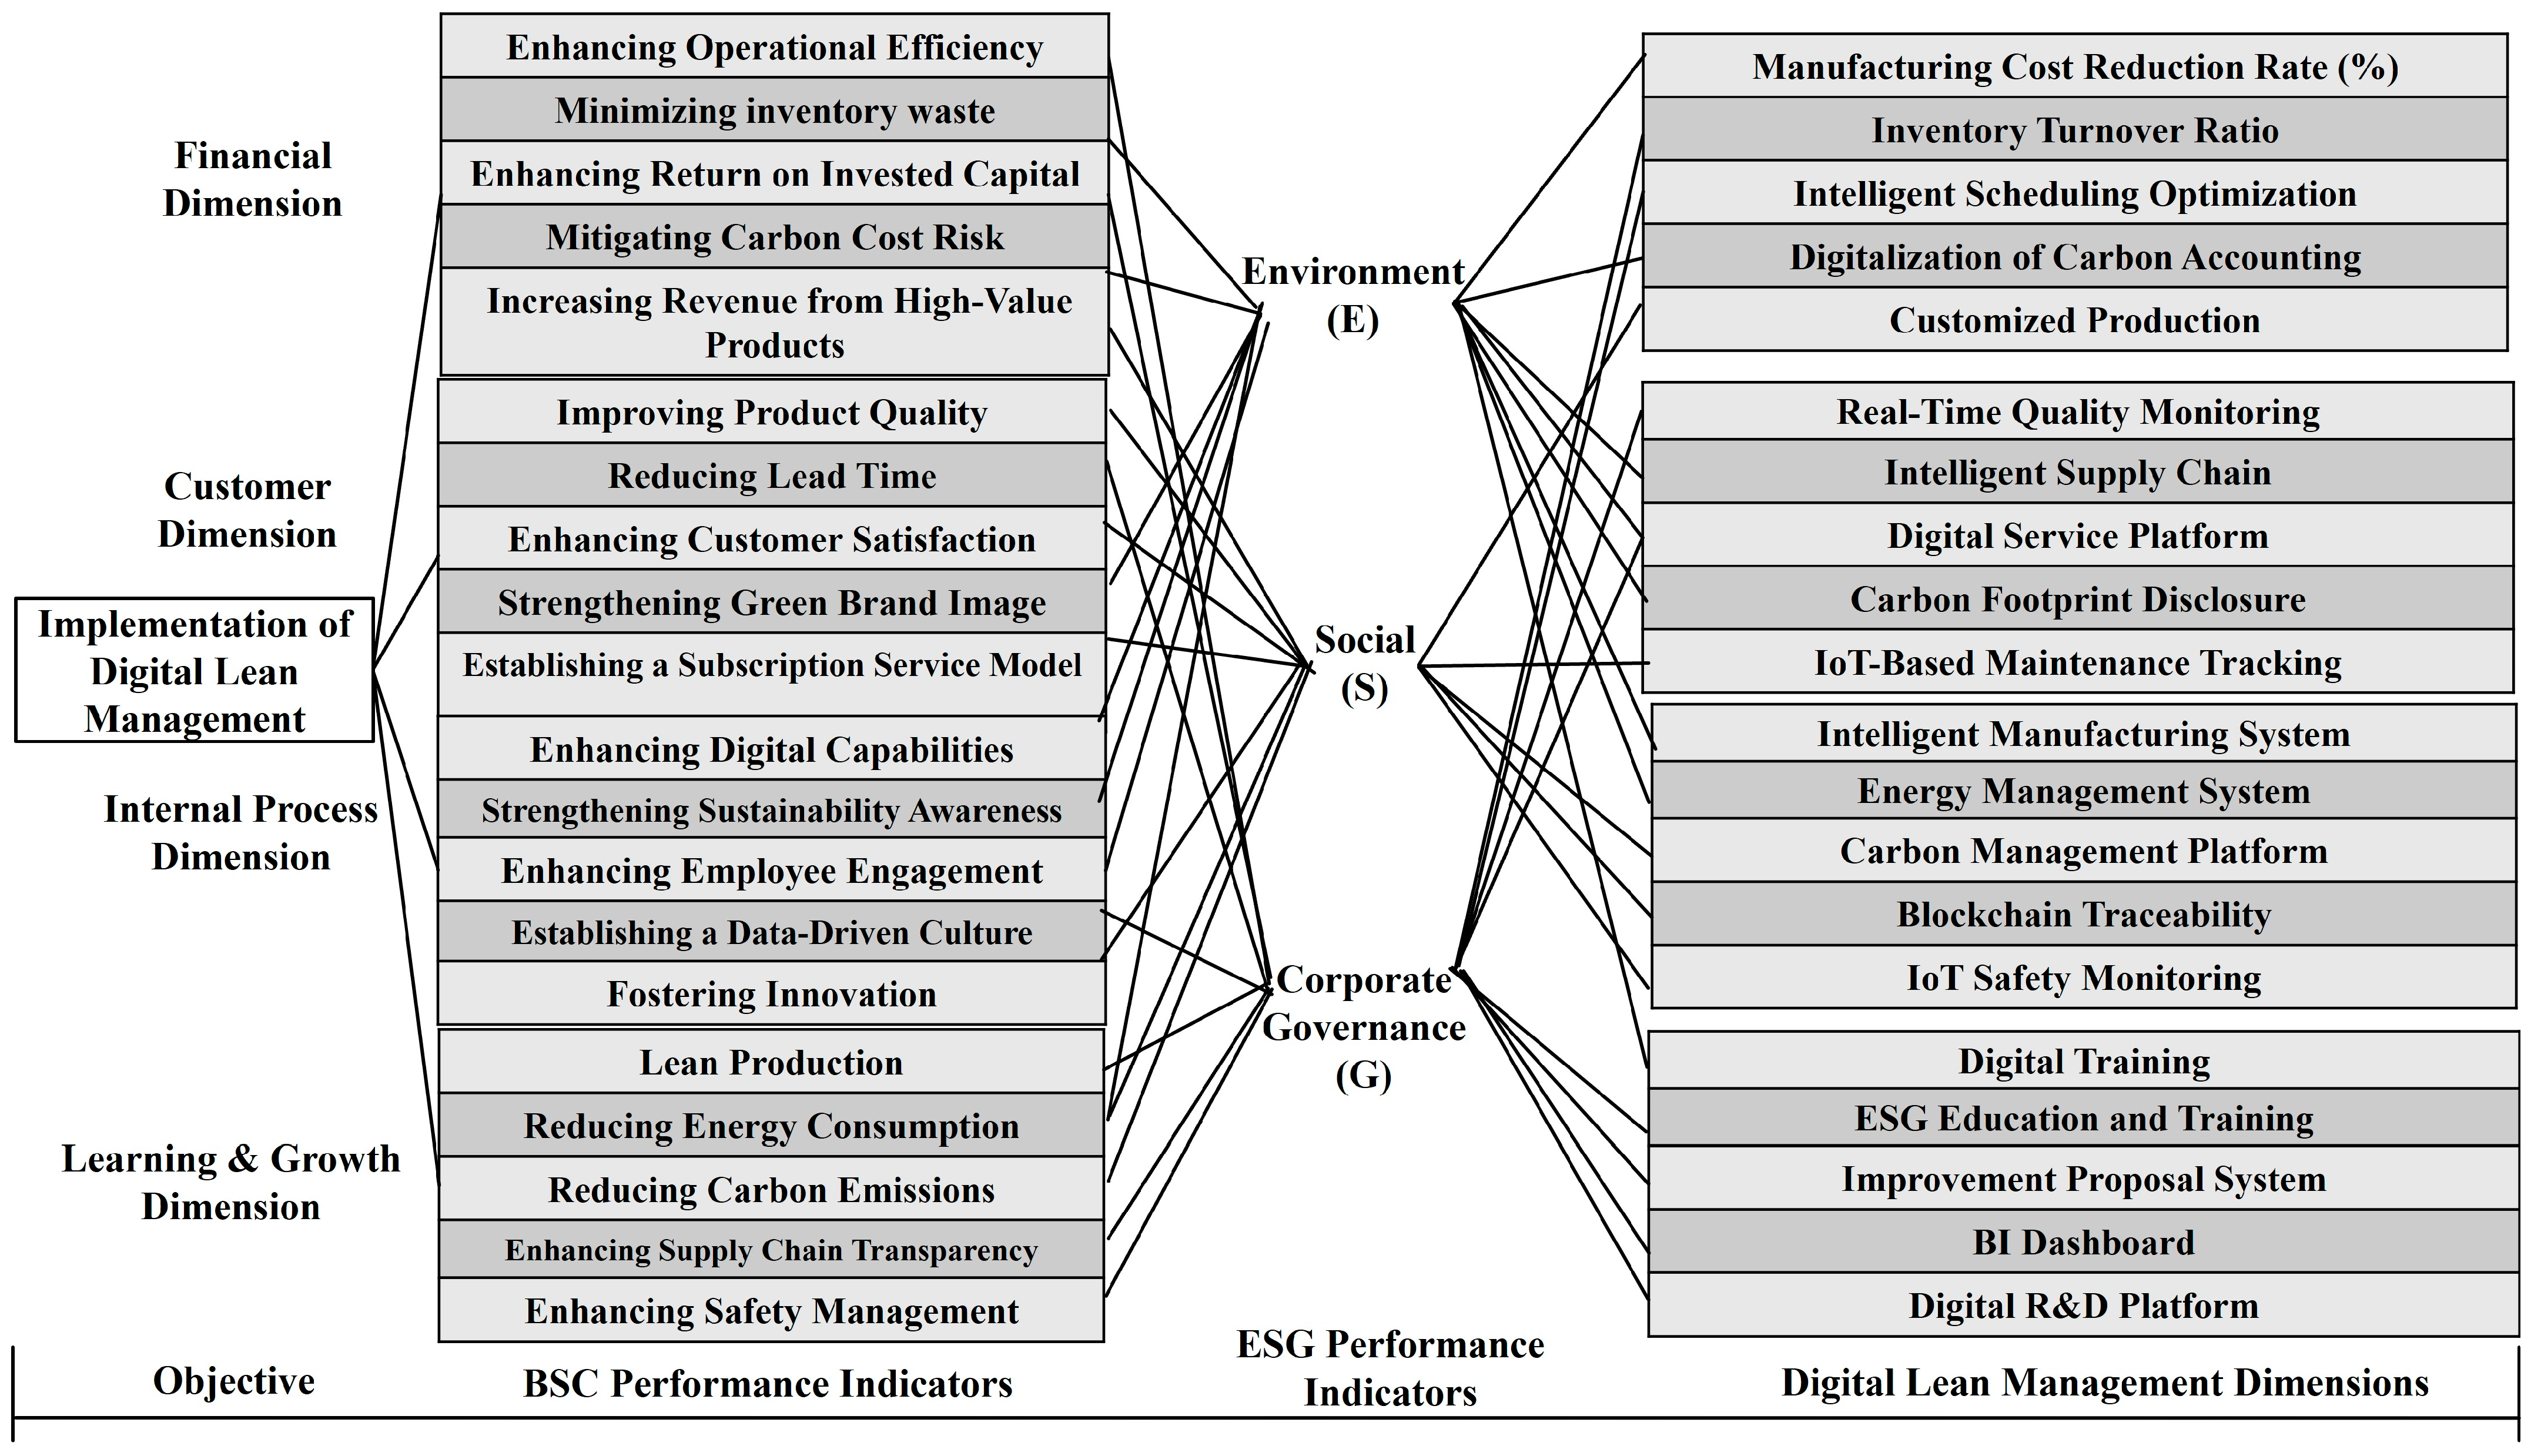
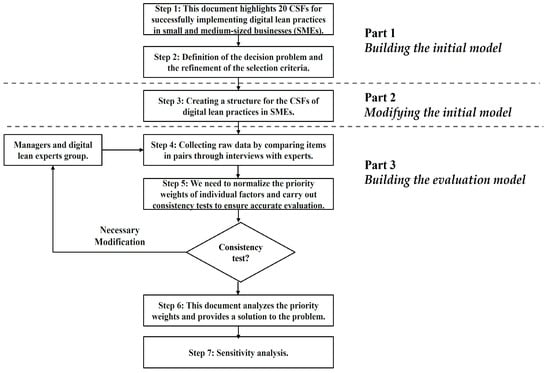
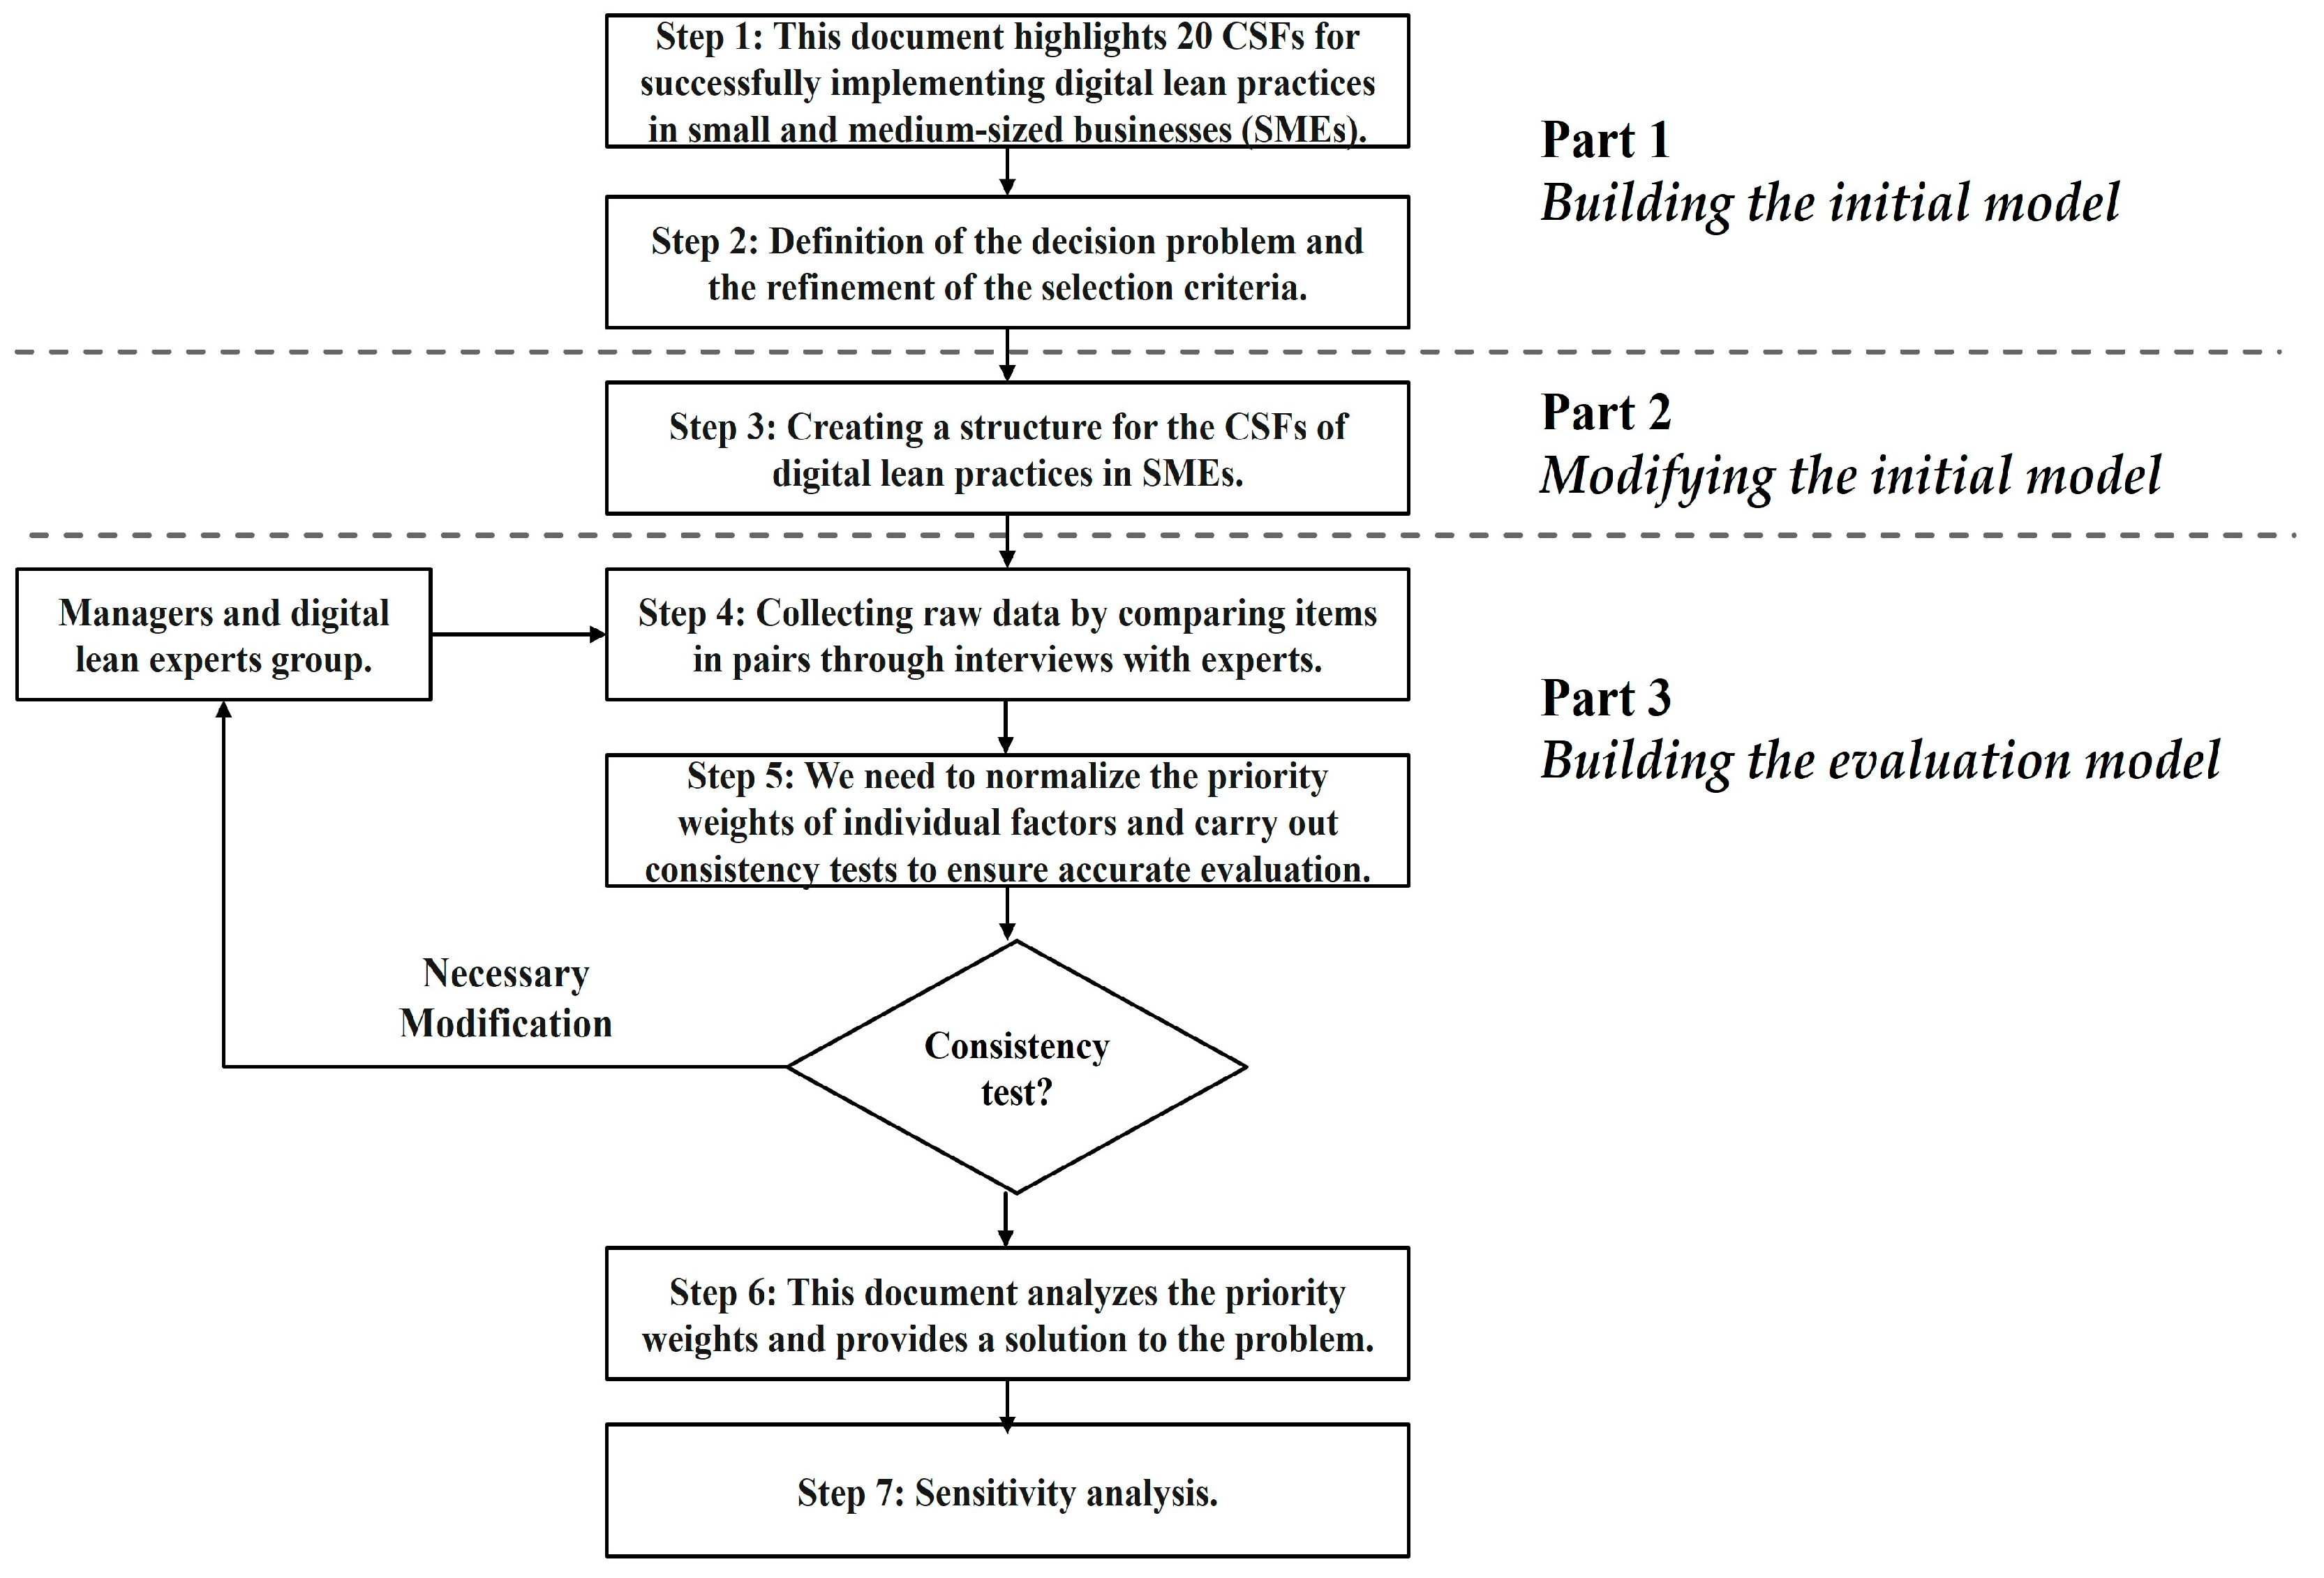
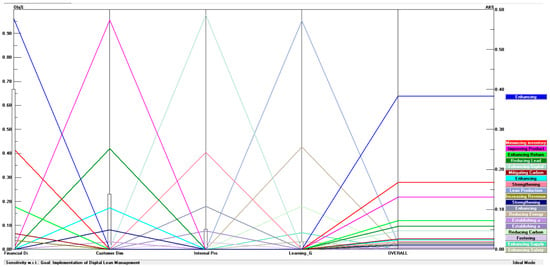
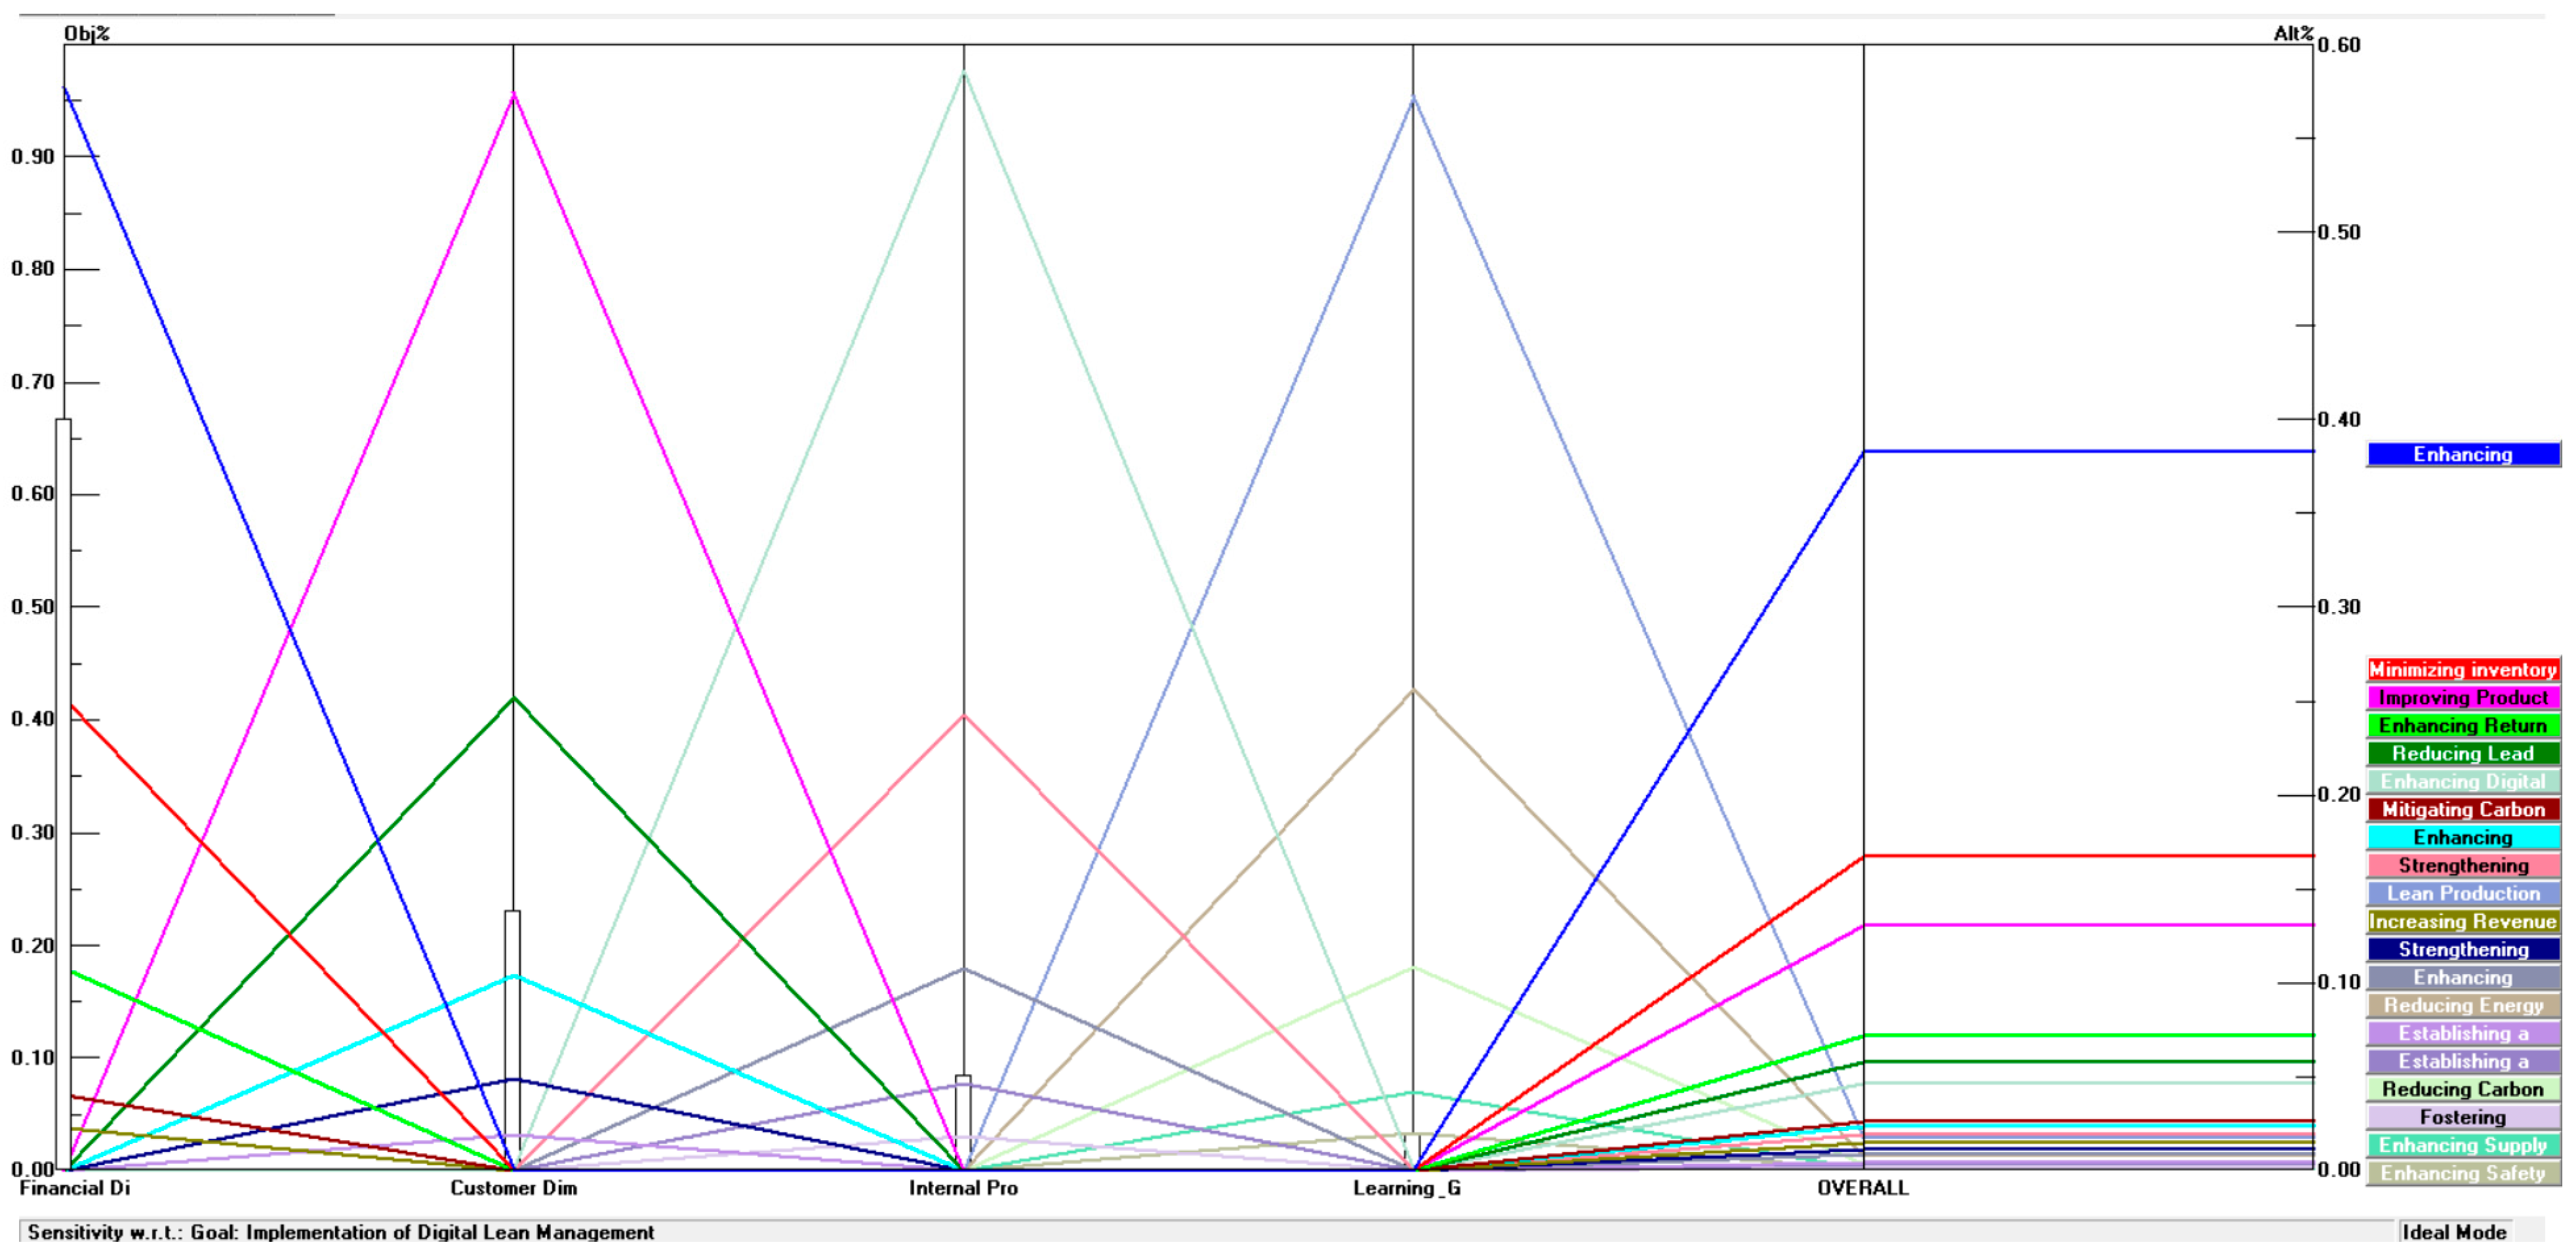
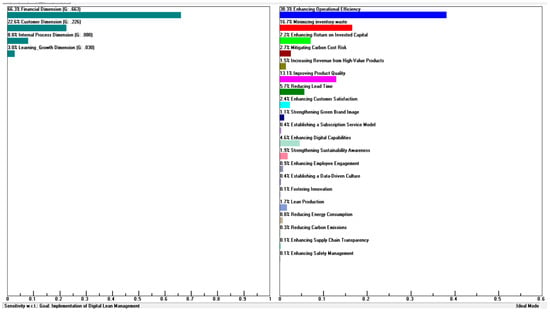
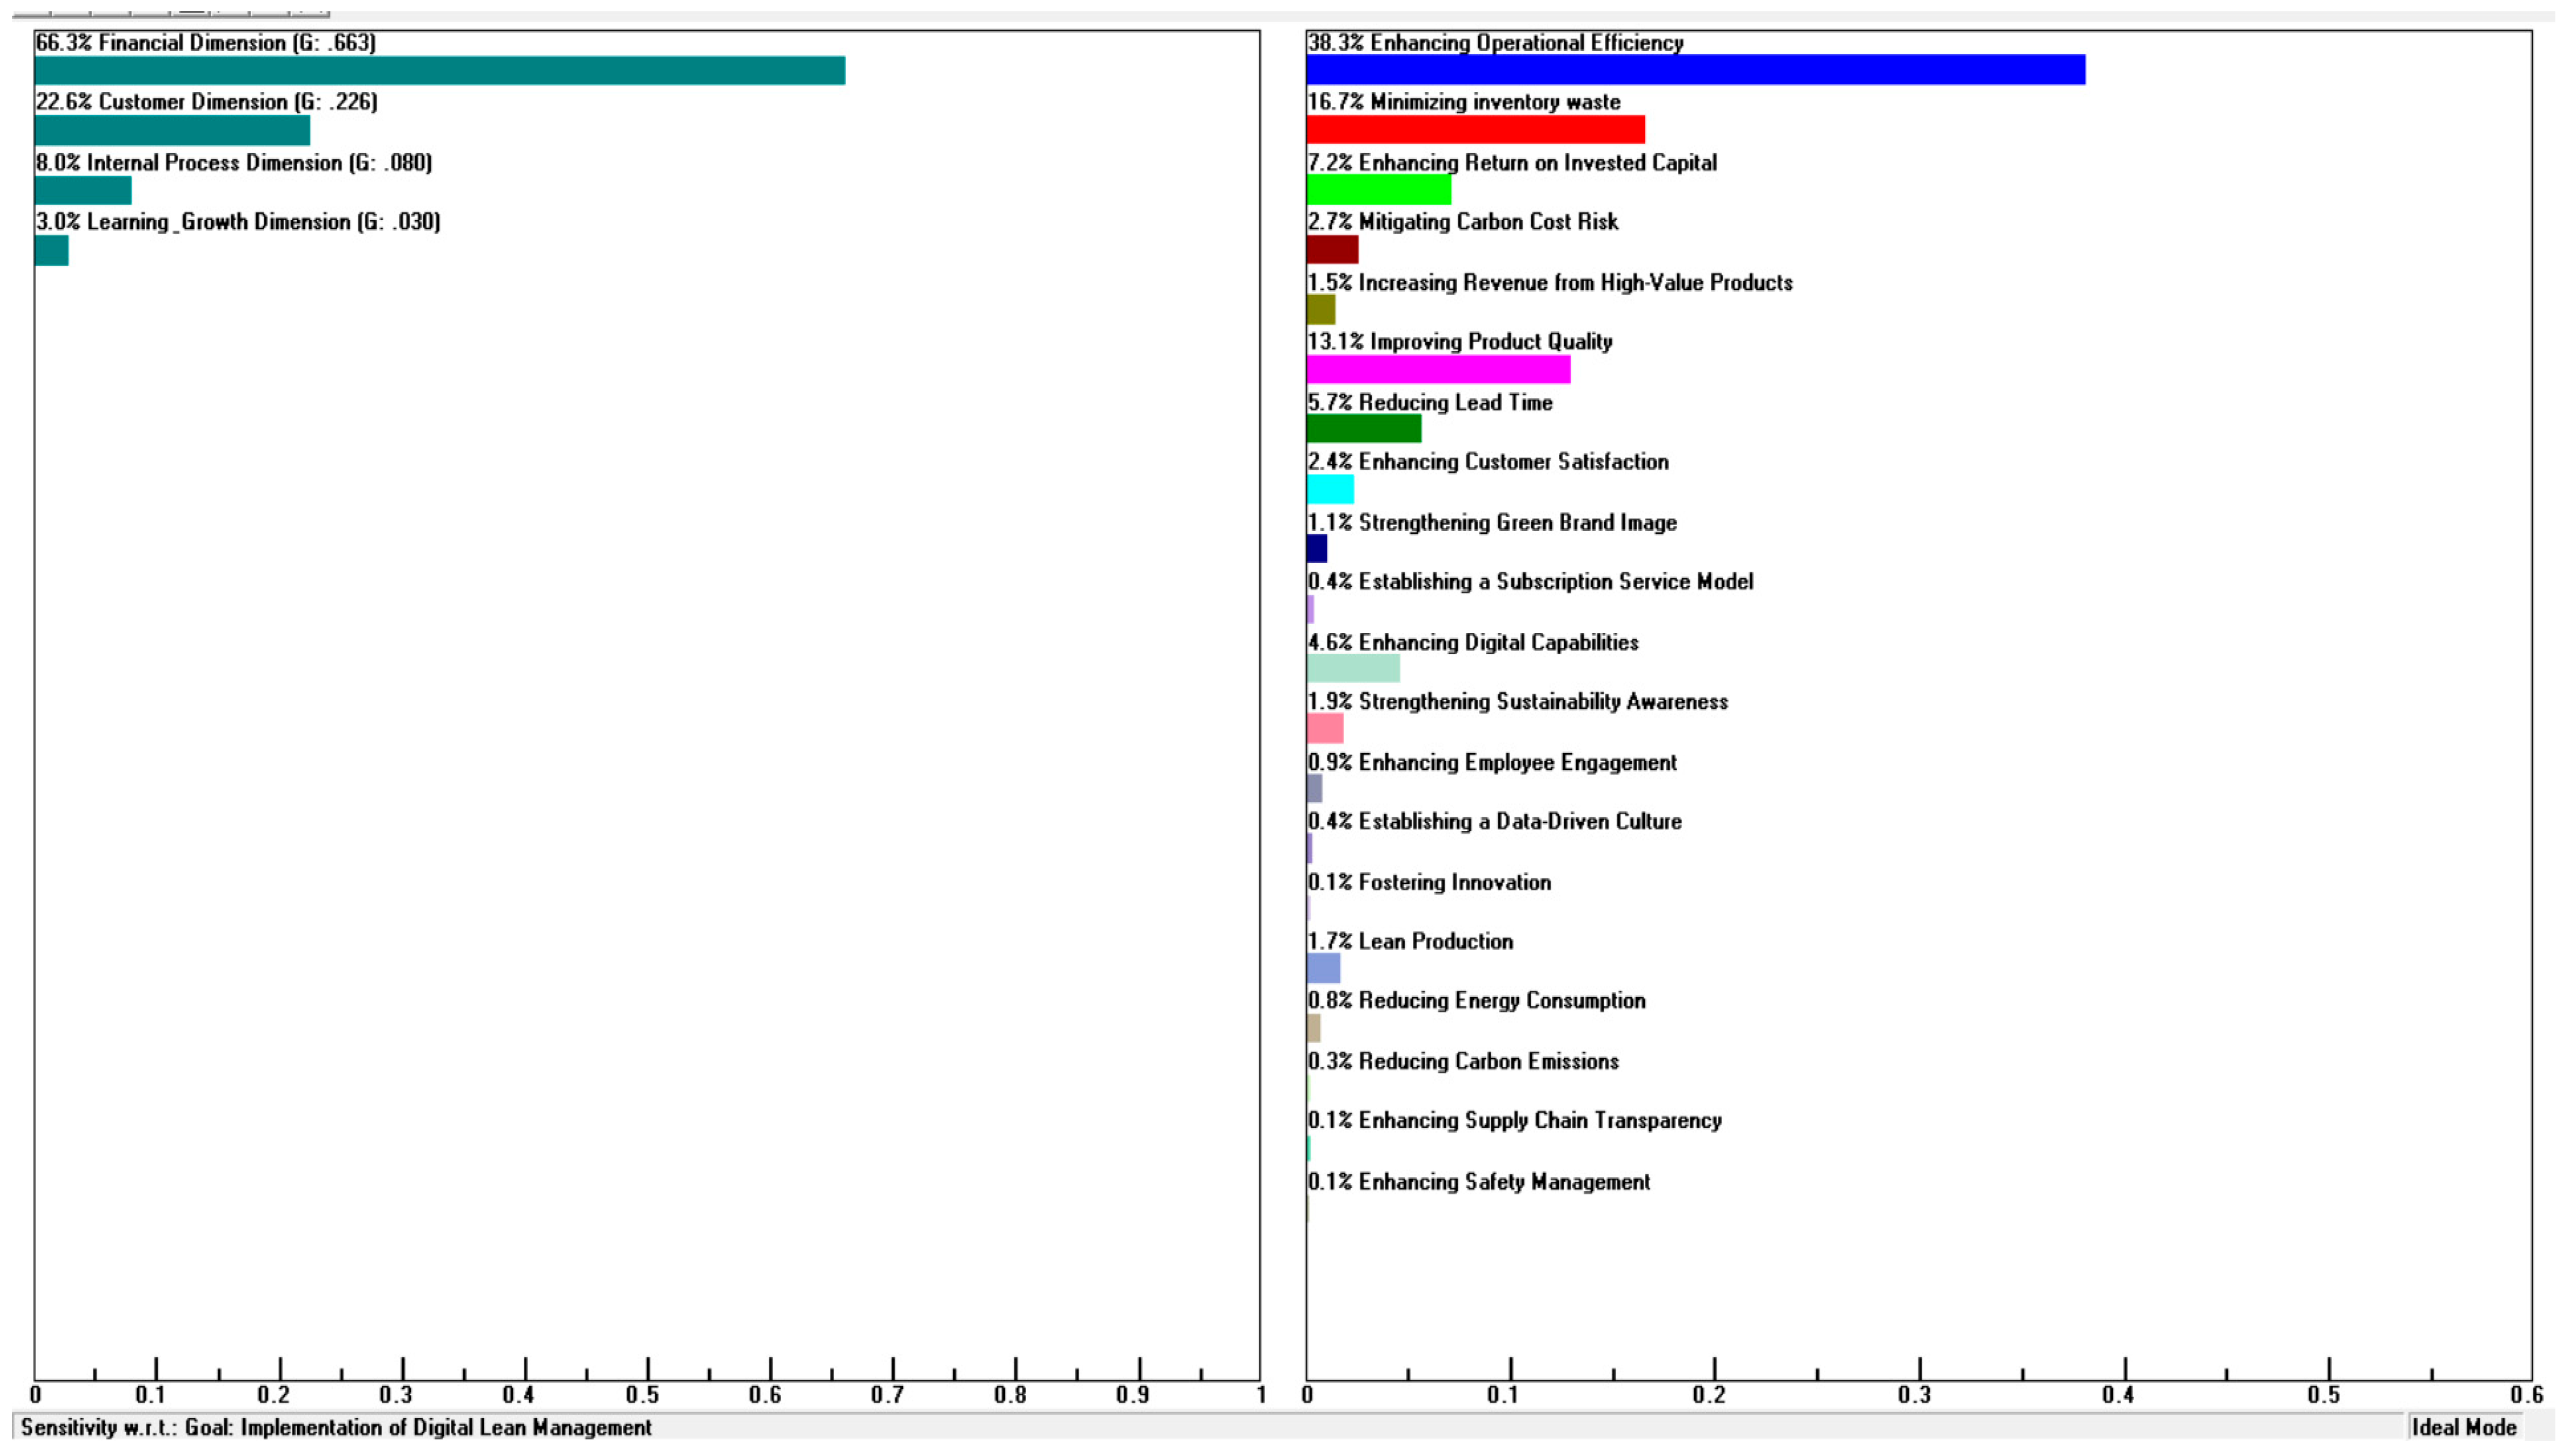
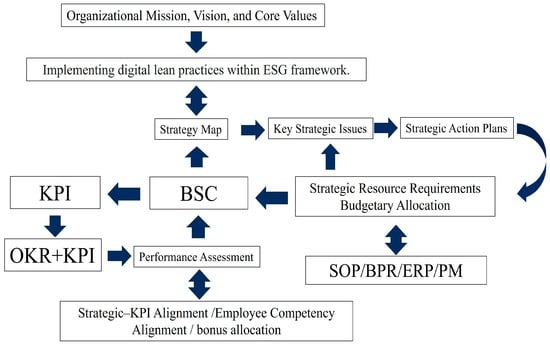
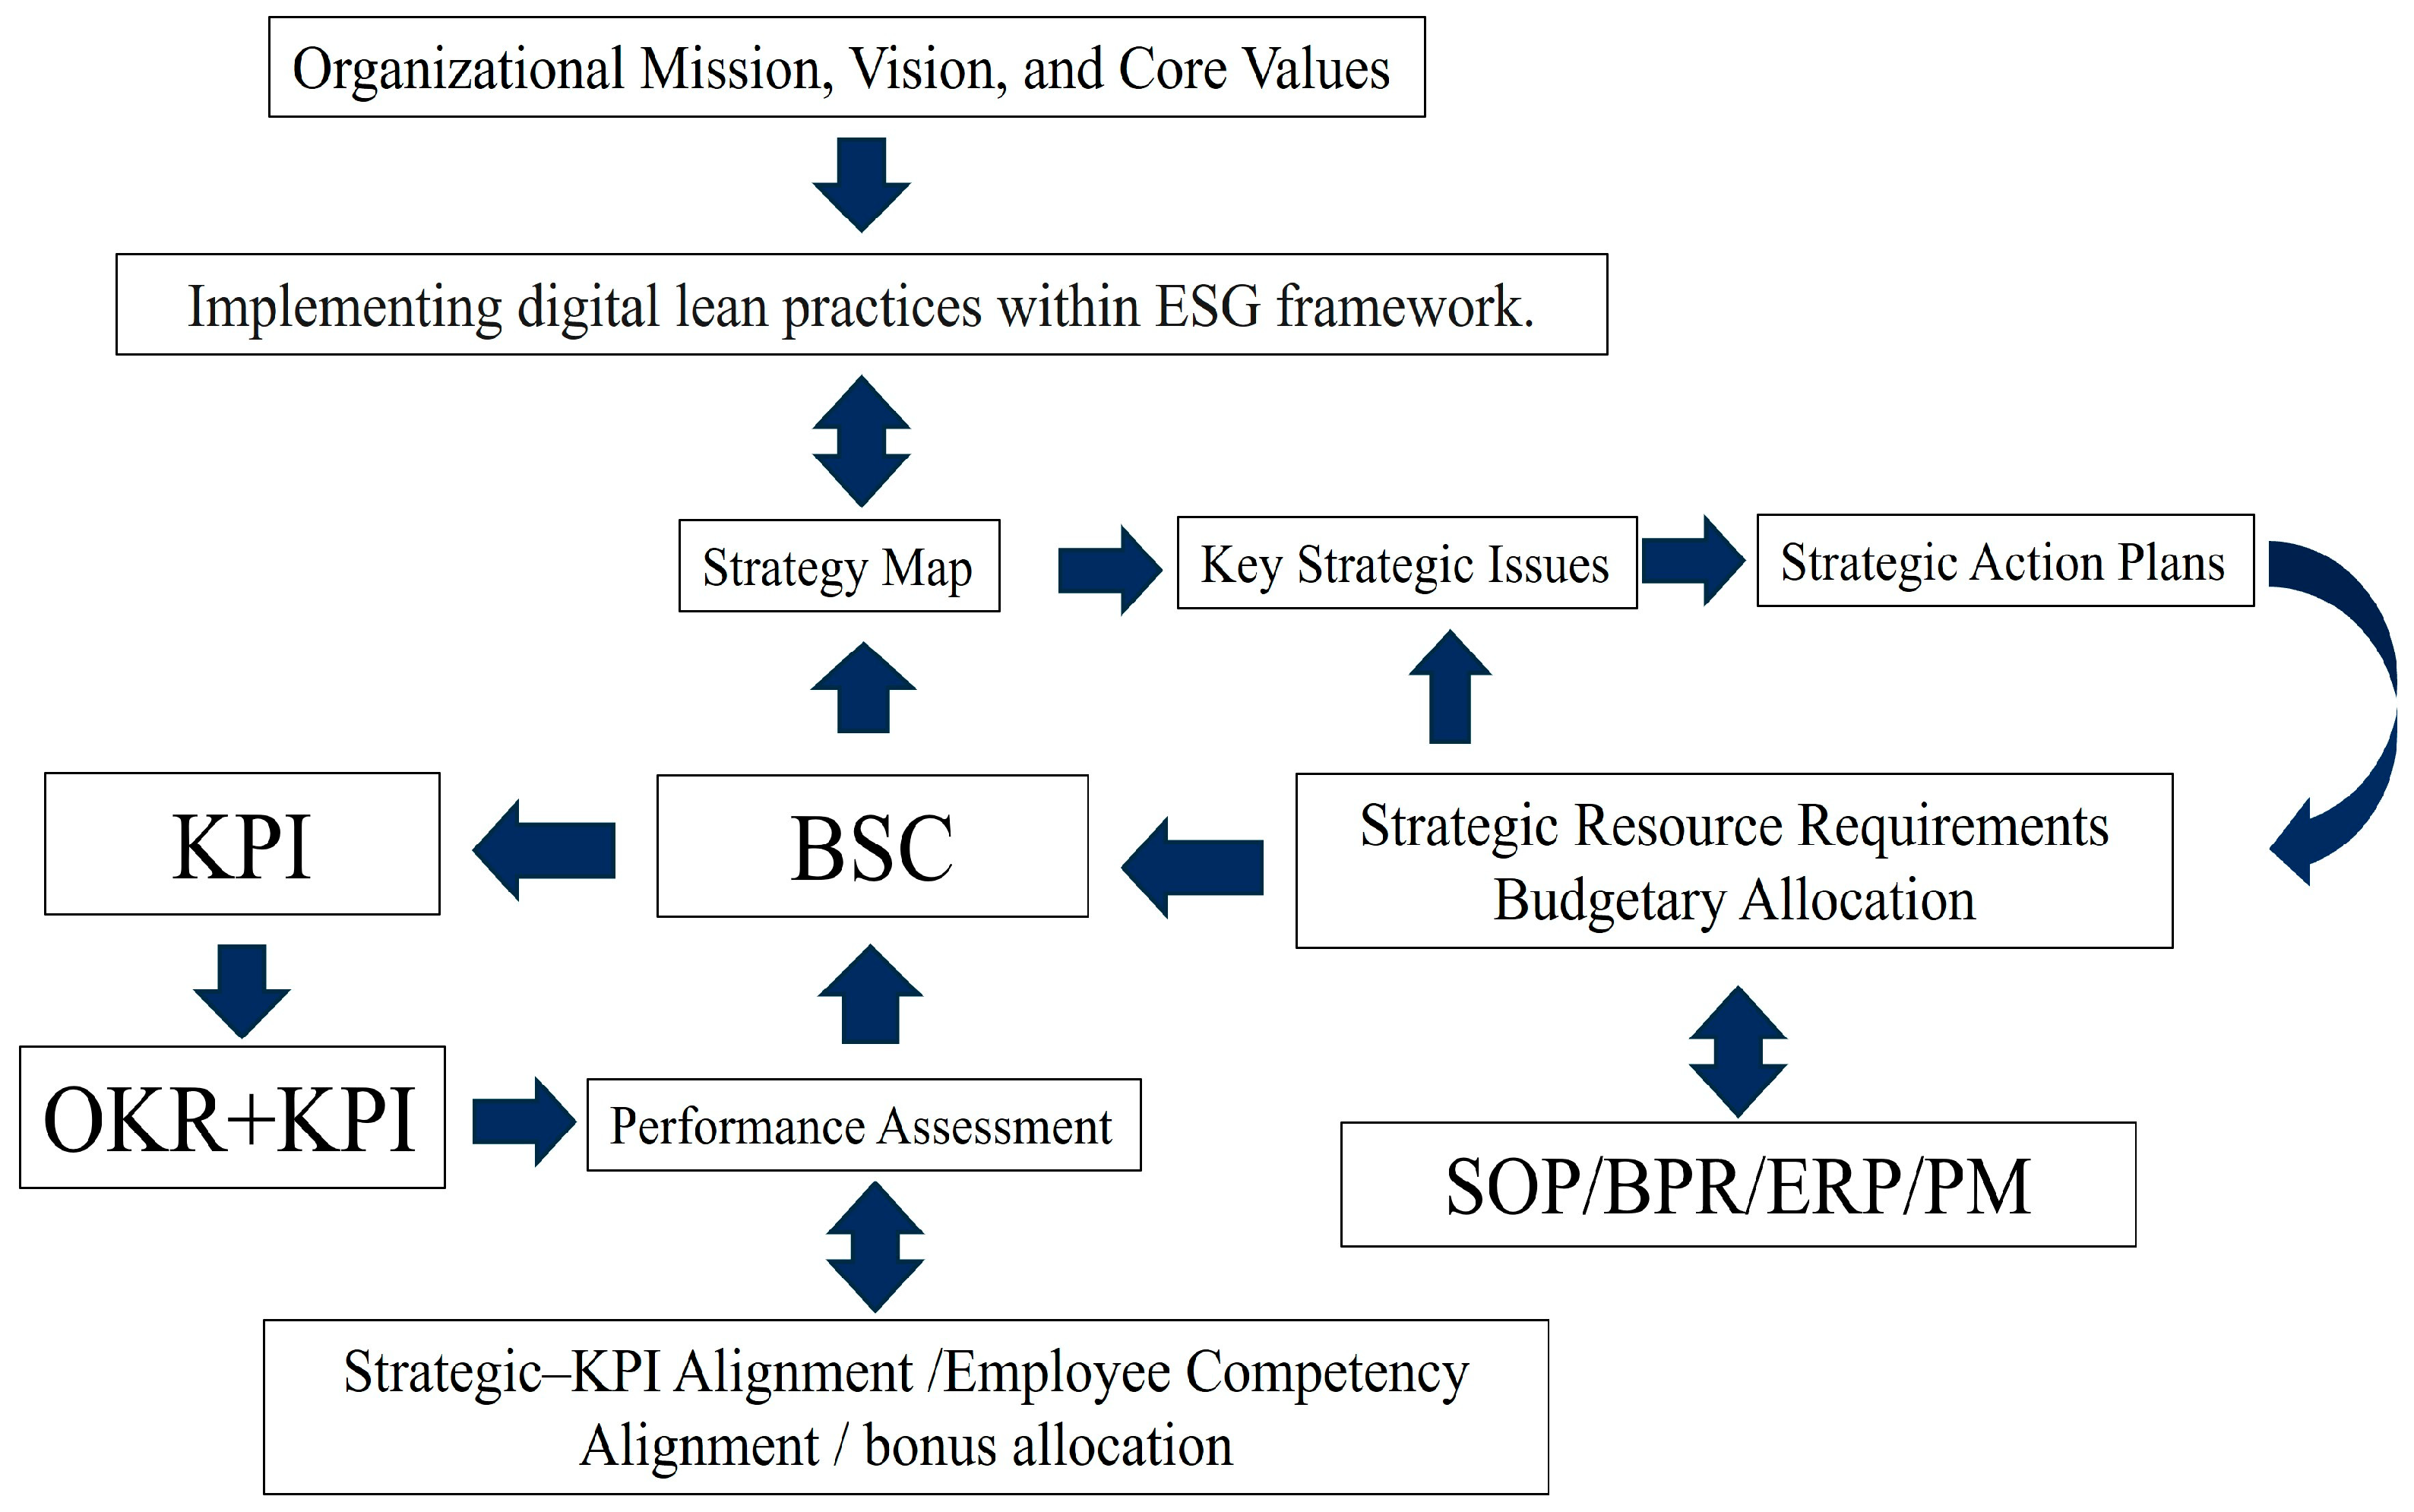
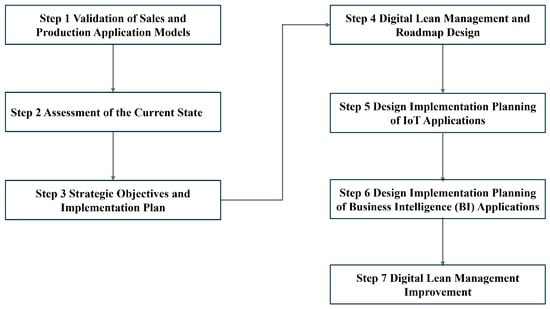
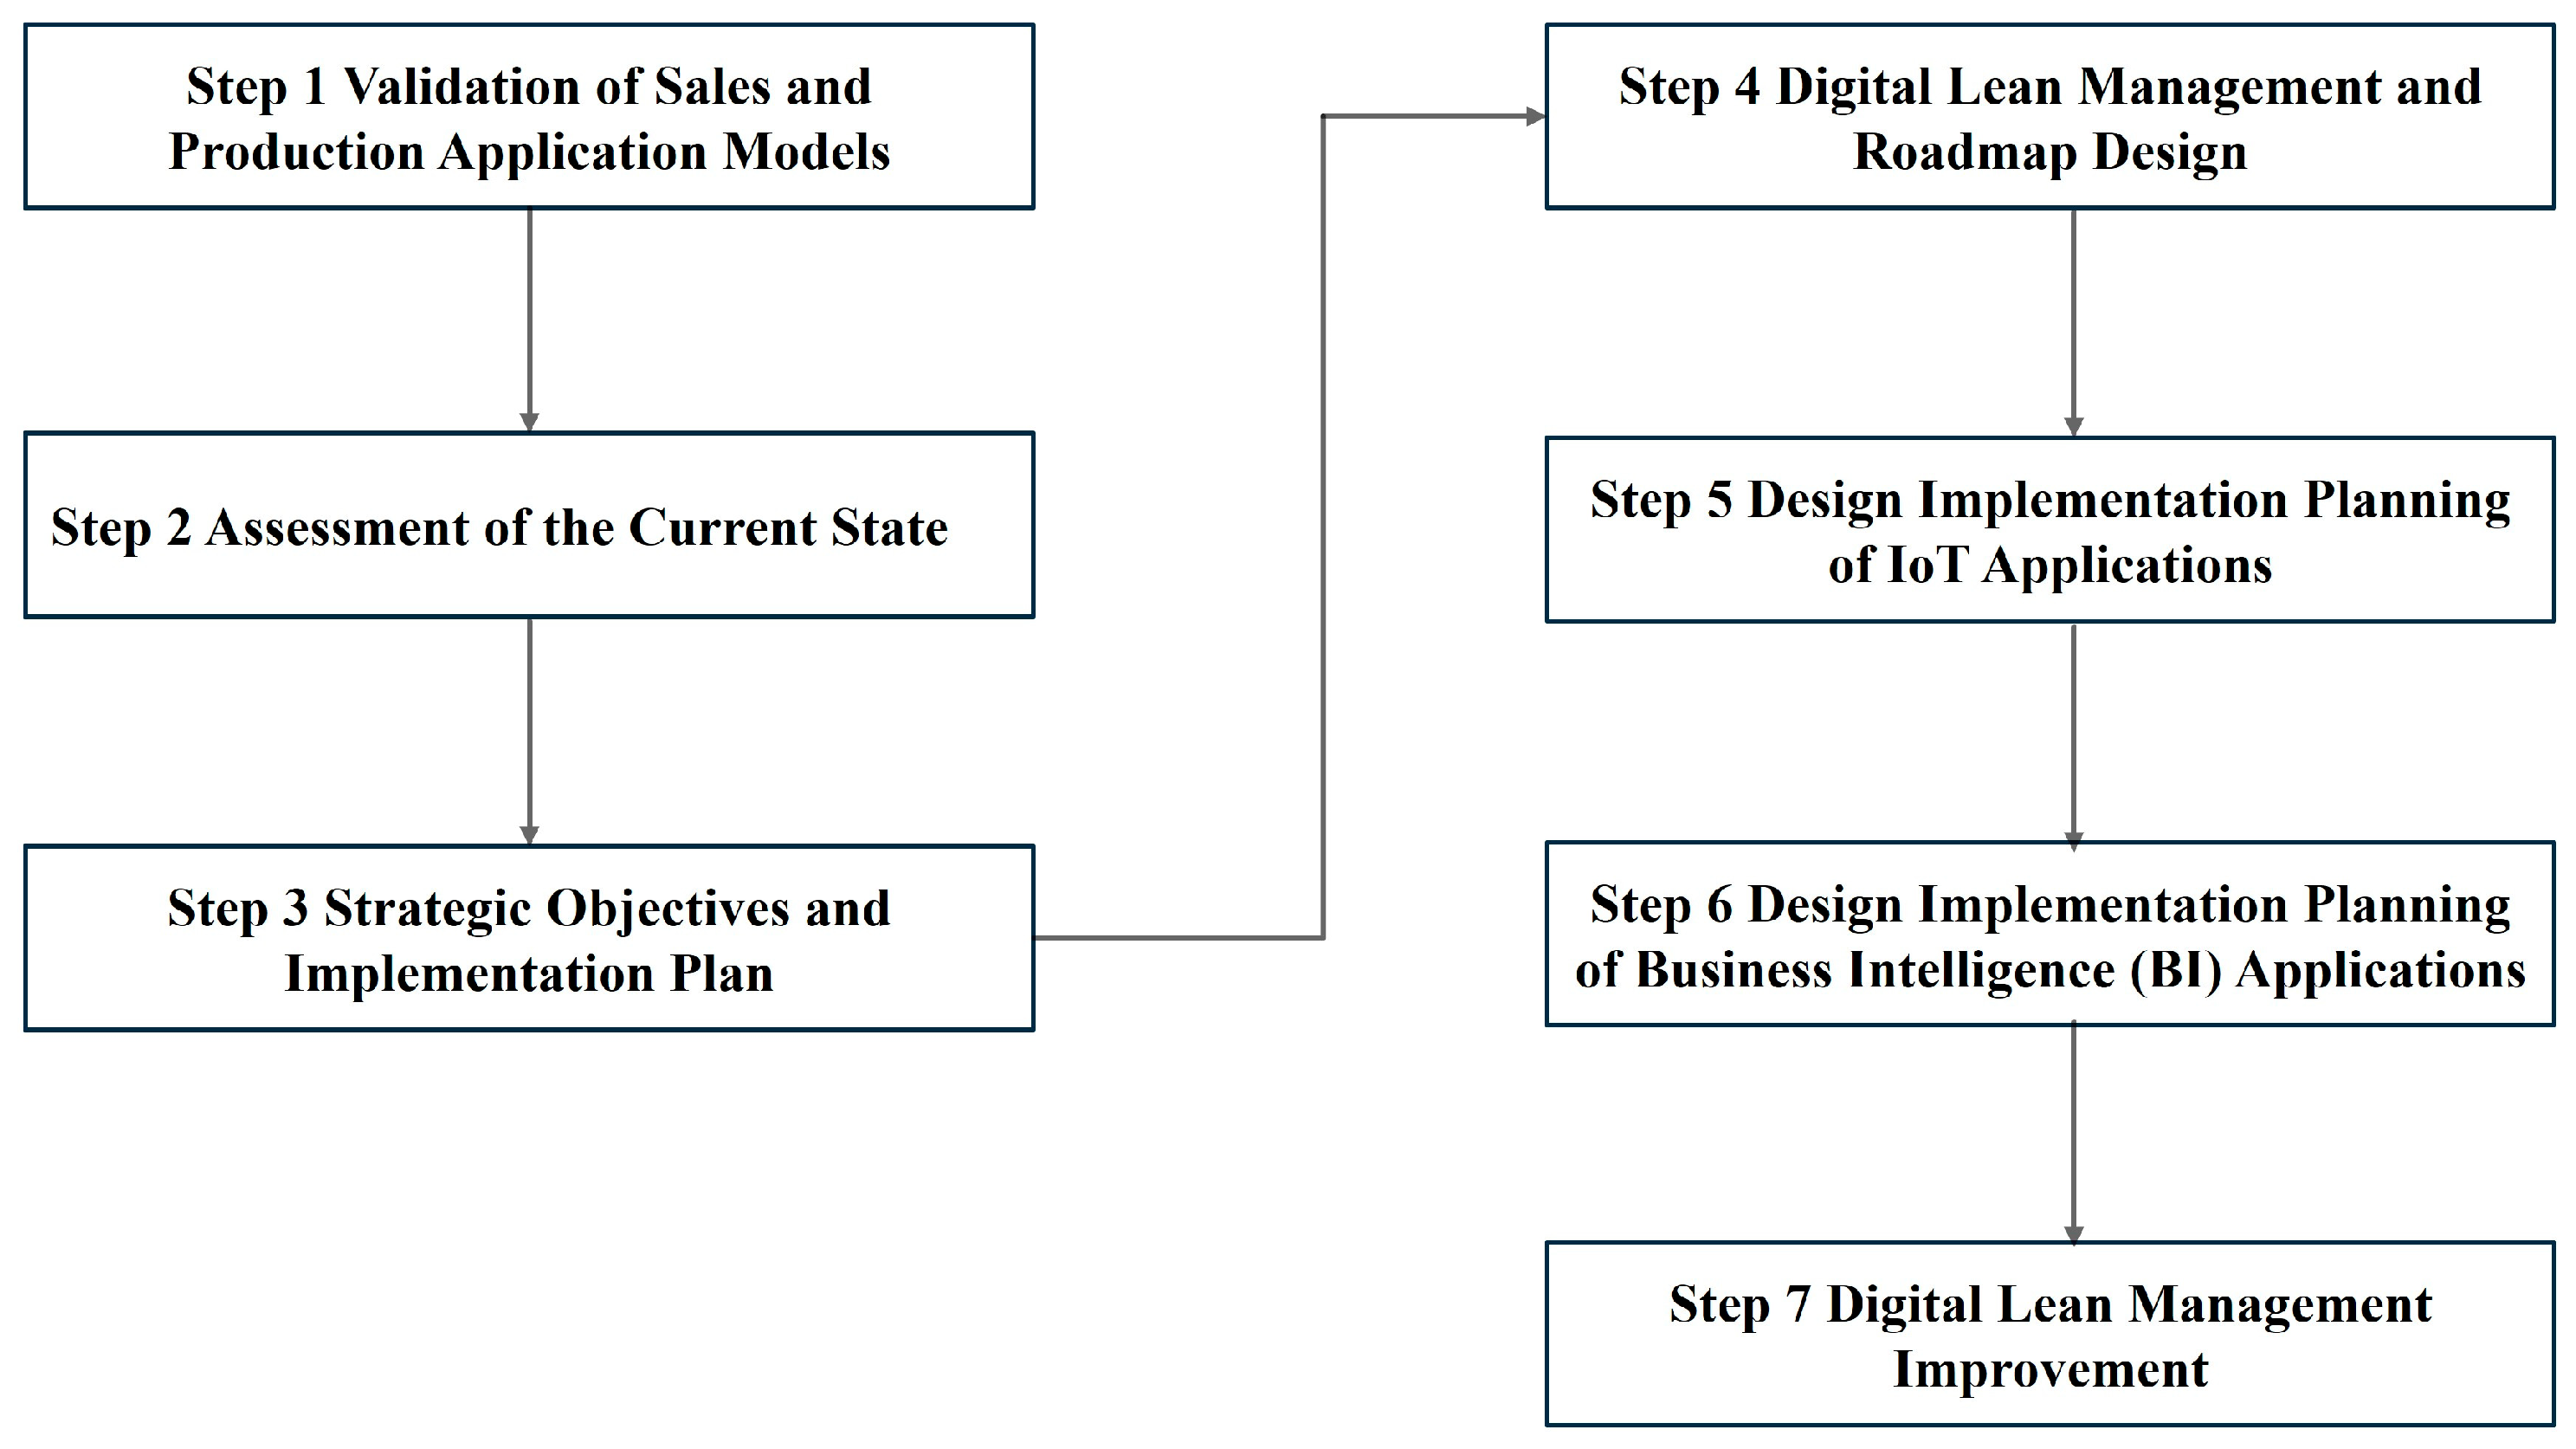
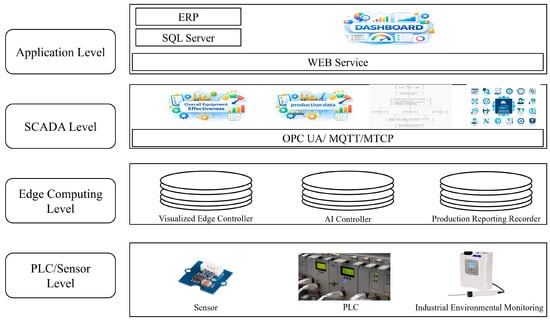
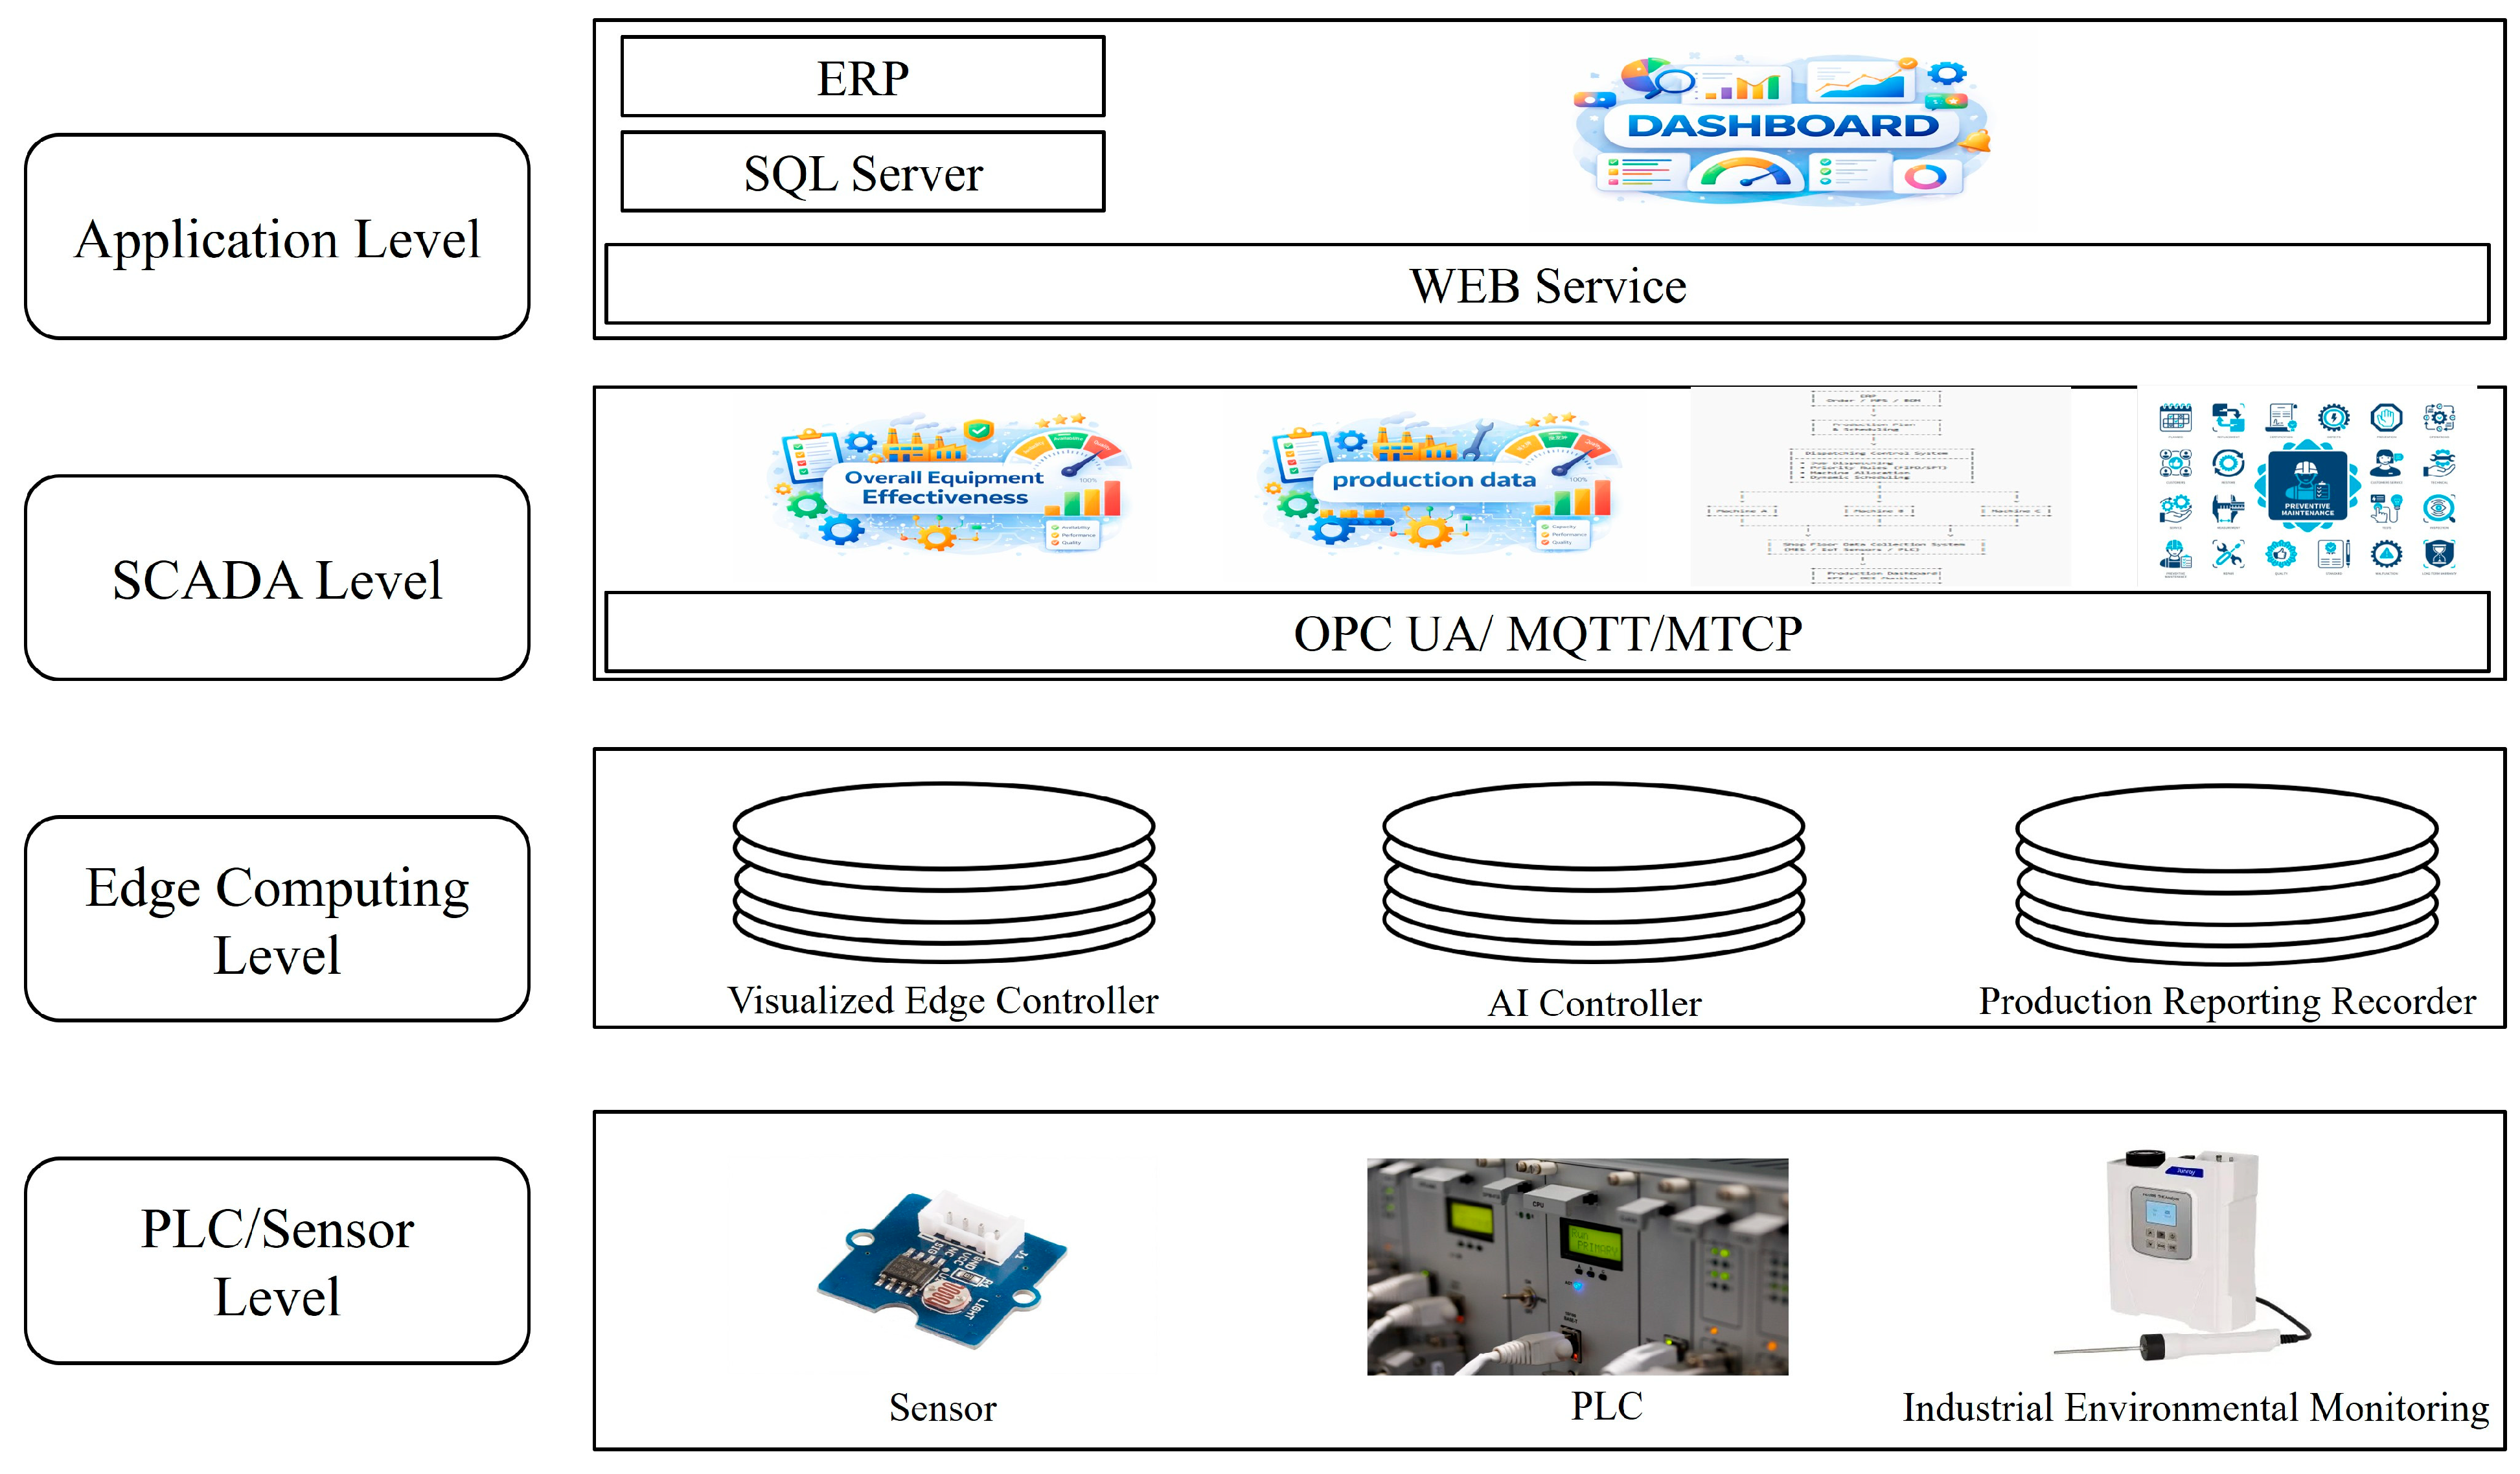
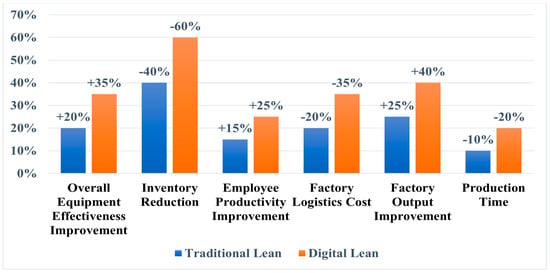
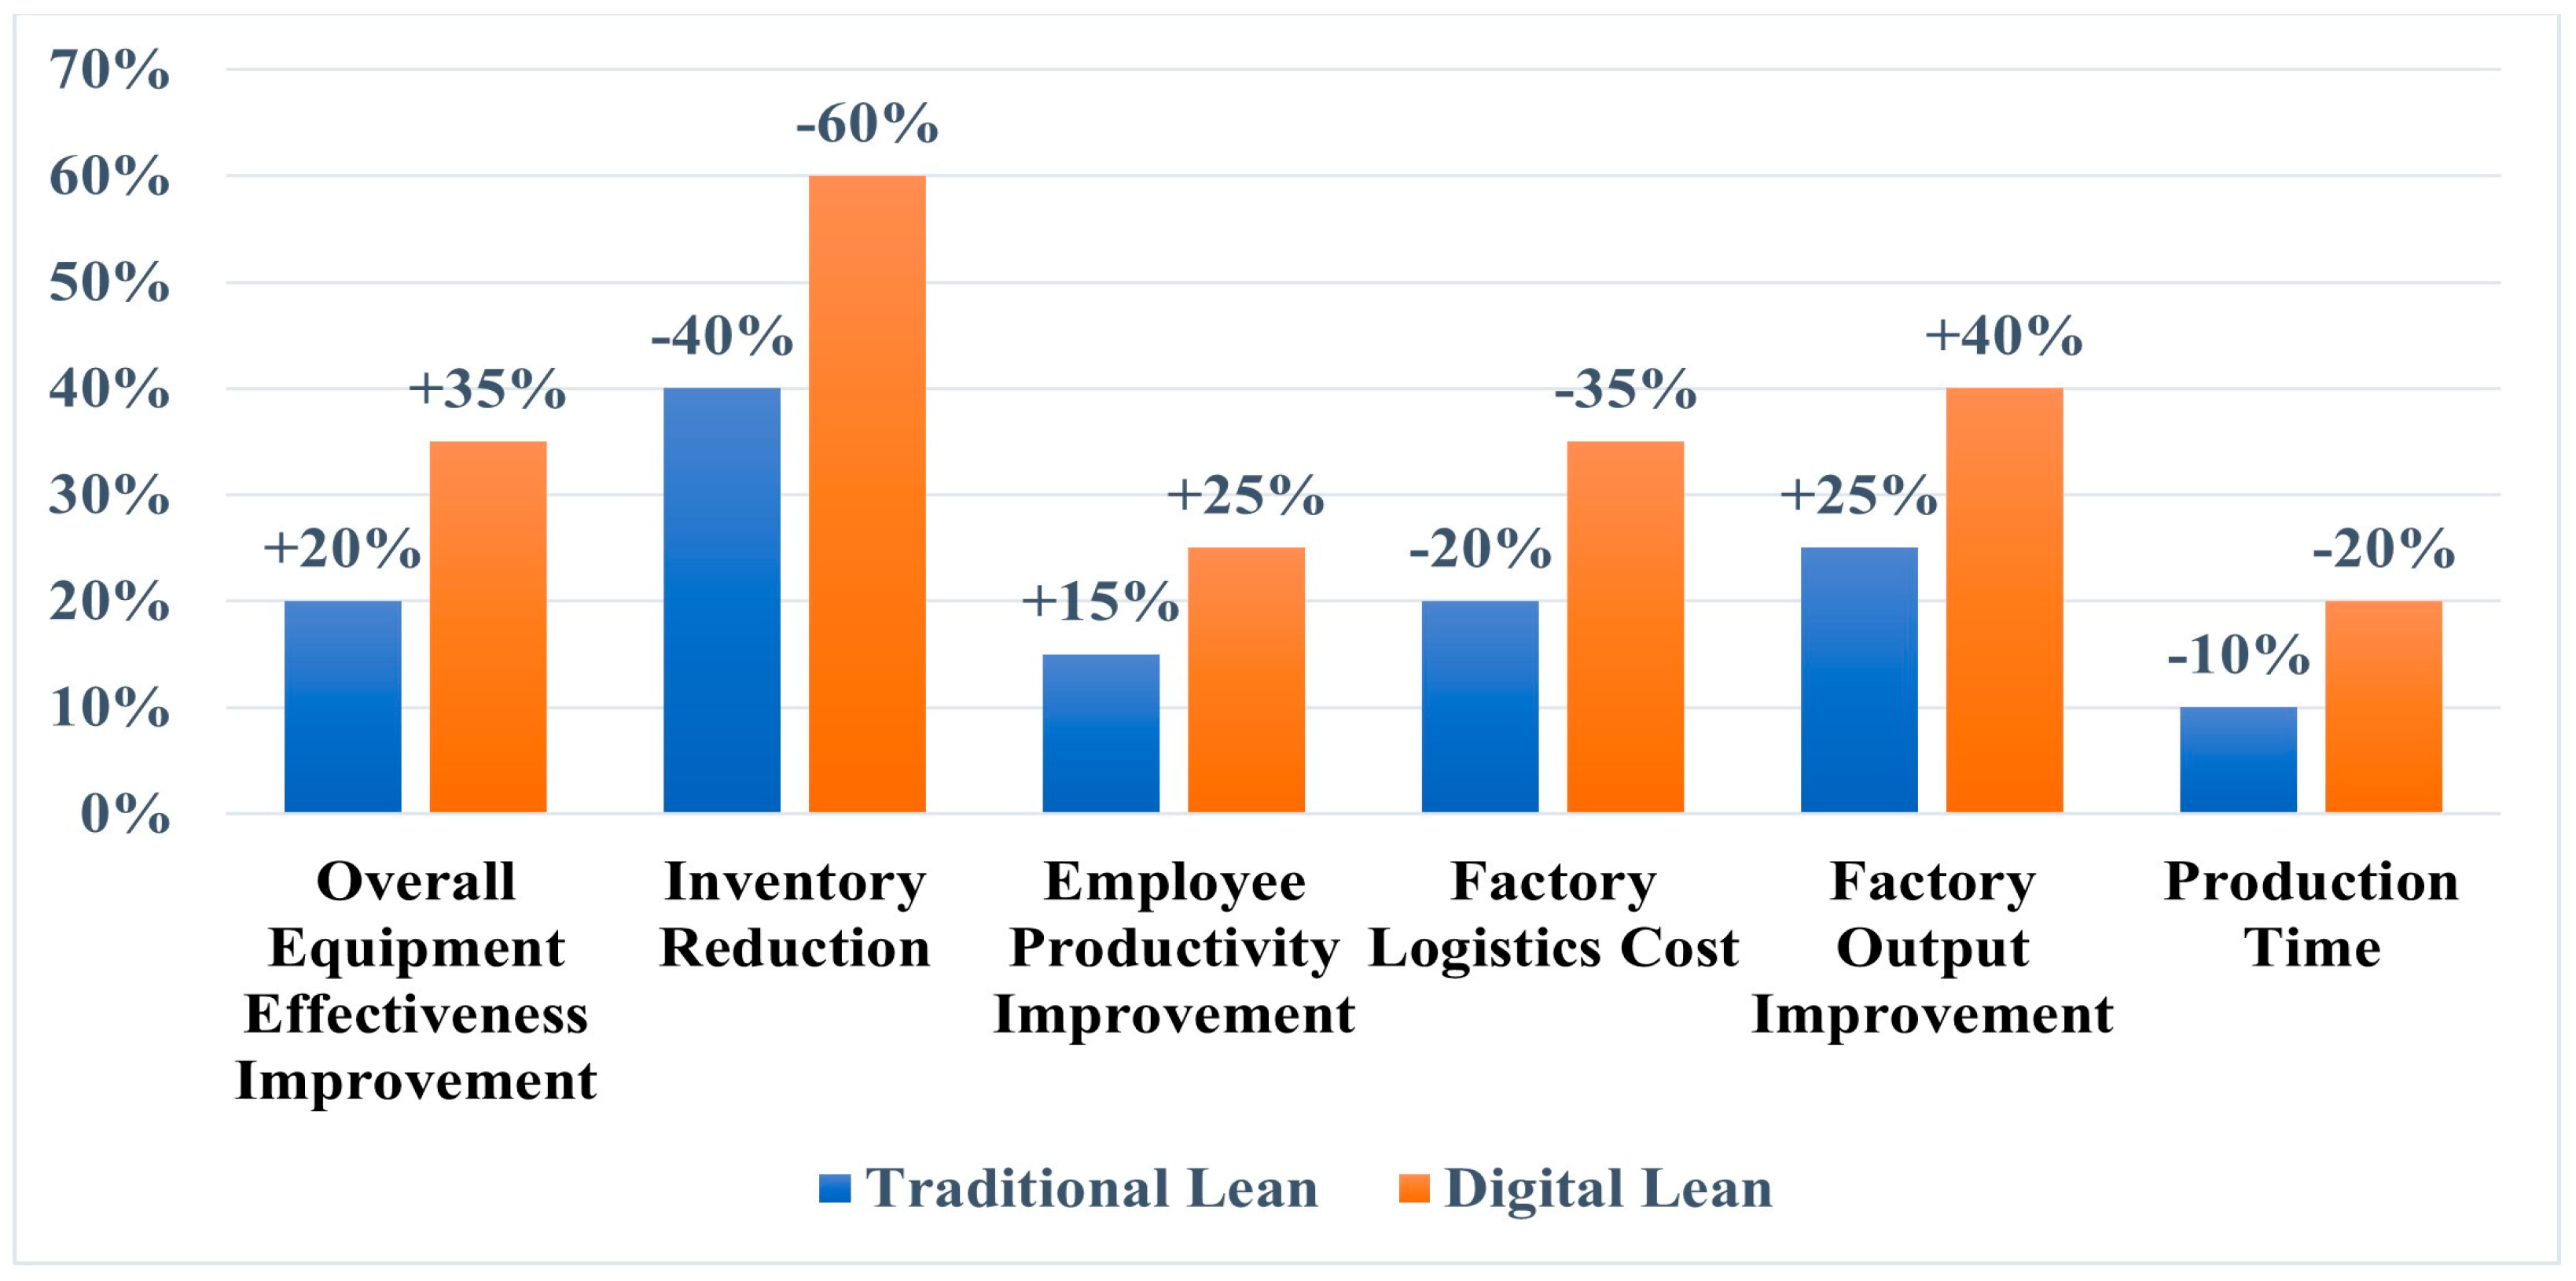

Disclaimer/Publisher’s Note: The statements, opinions and data contained in all publications are solely those of the individual author(s) and contributor(s) and not of MDPI and/or the editor(s). MDPI and/or the editor(s) disclaim responsibility for any injury to people or property resulting from any ideas, methods, instructions or products referred to in the content. |
© 2026 by the authors. Licensee MDPI, Basel, Switzerland. This article is an open access article distributed under the terms and conditions of the Creative Commons Attribution (CC BY) license.