


Abstract
Recent advancements in wearable technology have allowed researchers to collect high-resolution data on athletes’ workloads and performance, paving the way for more accurate mathematical models in sports science. In this paper, inspired by the modeling of heart rate during exercise, we introduce a novel linear, time-varying, two-state discrete-time dynamical model for predicting athletic performance in elite-level soccer players. Model parameters are estimated via the Differential Evolution optimization algorithm, and GPS-derived metrics such as metabolic power and equivalent distance index are incorporated. The model originally accounts for complex interactions between a performance-related state variable and a second lumped variable, whose dynamics are intertwined. This model was compared to the most effective deterministic (though uncertain) one in the literature, namely the (nonlinear) Busso model. Results, concerning two professional soccer players over a half-season period, show that the proposed model outperforms the traditional approach in estimation and predictive accuracy, with significantly higher correlation coefficients and lower estimation and prediction errors across all players. These findings suggest that integrating two-state dynamics and fine-grained GPS metrics provides a more biologically realistic framework for load monitoring in team sports. The proposed model thus represents a powerful tool for training optimization and athlete readiness assessment, with potential applications in real-time decision support systems for coaching staff. By predicting the effects of training load on future performance, it might also contribute to injury risk reduction and the prevention of maladaptive responses to excessive workload.
Keywords:
mathematical modeling; nonlinear dynamics; performance estimation; performance prediction; training load; GPS technology; metabolic power; soccer MSC:
92C42; 93-05; 93-10
1. Introduction
In recent decades, mathematical modeling has become a fundamental tool in sports science, allowing sports and data scientists to better understand the close relationship between training load and athletes’ performance capacity [1]. The data obtained from such modeling have provided coaches with valuable support for the prescription of increasingly effective conditioning programs aimed at maximizing athletes’ performance capacity at key moments, while avoiding illness, injury or overtraining.
The origins of these mathematical models date back to the 1970s through the studies of Banister, whose fitness-fatigue model represented the first attempt to formalize the relationship between training stimulus and performance [1]. The model proposed by Banister is based on the assumption that athletes’ performance capacity is the result of two competing factors: a first factor, called fitness, represents the positive effects of training on performance, while a second factor, called fatigue, describes the negative effects that reduce performance capacity. From a practical point of view, the model predicts that after a workload there is a brief decrease in performance due to accumulated fatigue, followed after adequate recovery by an improvement in physical capacity thanks to the adaptations induced by training [1].
Subsequent to the publication of this model, numerous studies have confirmed its effectiveness in predicting the performance capacity of athletes in several individual sports. In fact, this model has been applied in disciplines such as running [2], cycling [3], swimming [1,4], demonstrating in many of these studies a notable accuracy in predicting the actual performance of athletes [1,3,4,5].
More recently, research conducted by Busso has allowed to further develop and refine Banister’s model, successfully introducing new parameters specifically designed to capture the effects of training monotony—defined as low variability in daily workloads—and the cumulative fatigue that arises when intense sessions are performed consecutively without adequate recovery. These additions enhance the model ability to simulate real-world training responses [6]. Although these models have demonstrated their validity in many individual sports, they have proven to be less accurate when applied to athletes in team sports such as soccer, where performance is influenced by multiple physiological factors [7,8]. Indeed, a soccer match requires players to undergo numerous phases of intermittent exercise characterized by periods of high intensity alternating with phases of lower intensity or recovery [9]. This highly variable metabolic demand, to which players are subjected, represents a complex challenge for traditional models, which are often based on the assumption of a linear relationship between training load and performance.
Furthermore, soccer players are often engaged in multiple daily training sessions, each characterized by different intensities and physiological objectives (e.g., strength and power training in the morning and technical/tactical training in the afternoon). The variability of the physiological objectives of the training sessions can produce cumulative effects on the performance capacity of athletes, which are difficult to be predicted [2]. Recent studies have increasingly focused on developing predictive models of athletic performance in soccer, adopting approaches such as time-series analysis, machine learning techniques, and piecewise-linear formulations to improve the accuracy of performance forecasts [10,11,12].
More recently, deep learning and decomposition-based architectures have been applied to enhance time-series forecasting in complex multidimensional data. Hu et al. [13] proposed an adaptive multi-scale framework to capture multi-temporal dependencies, whereas Li et al. [14] introduced a channel-independent bidirectional gated model with interactive recurrent mechanisms for improved multichannel forecasting. These approaches highlight the growing relevance of AI-based models for representing nonlinear and multi-source dynamics in performance prediction.
Nevertheless, these approaches present relevant limitations such as reliance on subjective self-reports instead of GPS-derived external load [10], a focus on short-window extreme events with small sample sizes and acknowledged reliability constraints [11], or consideration of only the last training sessions without an explicit dynamical representation of training–performance interactions [12].
Consequently, building effective mathematical models in a sport such as soccer requires the inclusion of multiple and complex variables that reflect the athlete’s performance ability in a dynamic context typical of game actions. Recent advances in wearable technology have provided sports scientists with tools able to acquire more detailed data on athletes’ performance both during training sessions and during competitions [15,16]. Devices such as GPS systems and accelerometers enable real-time monitoring of critical performance parameters, including speed, acceleration, metabolic power and workload [17].
These technologies have generated enormous amounts of data, providing new opportunities to refine existing models or create more sophisticated ones. For example, some studies have shown that soccer performance is more accurately predicted when these parameters are combined together to calculate training loads, which take into account the intermittent nature of the sport [17,18].
Based on these considerations, the original contribution of this paper is to demonstrate that a new linear, time-varying, two-state model—linking the dynamics of a performance-related state variable with those of a lumped state variable, and whose parameters are estimated via the Differential Evolution optimization method—achieves more accurate performance estimation and prediction than the (nonlinear) deterministic Busso model (Data-driven approaches (e.g., LSTM, SARIMA, or random forest models for time-series prediction) have not been used for comparison). This improvement is made possible by integrating a wider range of performance metrics derived from GPS technology. The proposed model provides a more comprehensive evaluation of the interplay between training and recovery, offering a more reliable tool for estimating and predicting performance in team sports such as soccer.
Importantly, by modeling the effects of training load on future performance, the proposed modeling approach can also support the early identification of excessive or poorly distributed training sessions, helping coaches optimize training loads and prevent maladaptive responses and reduce the risk of injury. This might make it not only a predictive model, but also a preventive tool for performance sustainability and long-term athlete’s health.
2. Materials and Methods
2.1. Subjects
Two male professional soccer players were recruited from the Italian Serie A League in order to monitor their readiness during a competitive season. Players were active members of a Serie A team and had at least 5 years of competitive experience in the top division.
2.2. Video Match Analysis
A Match analysis was conducted using the STATS SportVU® system, a validated multicamera video analysis tool from STATS LLC in Chicago, IL, USA. The STATS SportVU® system is a sophisticated and widely used technology in sports analytics, especially soccer. It utilizes multiple high-definition cameras installed at various angles around the stadium to track players and the ball at rates up to 25 Hz, with a measurement accuracy determined by the Technical University of Munich (TUM) to have a typical error of 2.7% for total distance [19]. K-Sport provided raw data in Cartesian coordinates, and the primary data were smoothed at 5 Hz [20]. STATS SportVU® uses high-definition cameras, advanced software, and statistical algorithms to extract and process player (X, Y) and ball (X, Y, Z) coordinates [21]. Roof-level cameras captured player movements during matches, and the data were analyzed using STATS Viewer and STATS Dynamix, both provided by STATS Perform, to create a dataset of each player’s physical and technical performance. A specific software (https://www.gpexe.com) (accessed on 1 October 2025) was used to download and analyze data extracted from STATS SportVU, including metabolic power (W·kg−1), equivalent distance index (%), and other metabolic-energetic metrics. Data were filtered according to the theoretical model based on an energetic approach where the energy cost of accelerations and decelerations plays a central role, as suggested by di Prampero et al. [22].
2.3. GPS Technology
The external load during each training session was evaluated using high-frequency GPS Pro2 devices operating at 18 Hz (GPEXE©, Exelio SRL, Udine, Italy). The reliability, accuracy, and validity of the GPEXE© system have been reported in previous studies [23,24]. This level of resolution allows for a detailed assessment of players’ running patterns, directional changes, and speed profiles during both training sessions and official matches. The technology provides coaches with real-time performance metrics, supporting data-driven decision-making. The system is capable of calculating over 300 metrics in real time and ensures rapid and accurate data transfer. Additionally, it supports three-dimensional tracking of individual players or teams over time, enabling assessments of positional workloads, training intensities, and physiological demand changes. All GPS devices were activated 15 min prior to data collection to ensure optimal signal quality and satellite lock. Signal quality was evaluated, according to Witte and Wilson [25], based on the average number of connected satellites (mean ± SD: 11 ± 0.4) and on the horizontal dilution of precision (0.9 ± 0.1).
2.4. Parameter Estimation via Differential Evolution (DE)
To identify the optimal parameter values for both the performance estimation and prediction models (namely, the proposed two-state model and the comparative Busso model), we employed the Differential Evolution (DE) optimization algorithm. DE is particularly well-suited for solving constrained nonlinear optimization problems and has been implemented in Python to automate the parameter estimation process. As a matter of fact, all the computations were performed in Python (v3.10) using the SciPy library for numerical optimization and parameter estimation.
The DE algorithm operates by maintaining a population of candidate solutions and iteratively combining them through mutation, crossover, and selection mechanisms to explore the search space. This evolutionary approach ensures a search capability while progressively minimizing the objective function, defined here as the Sum of Squared Errors (SSE) between the model-predicted performance and the actual observed performance data.
In our implementation, the SSE cost function was evaluated over the entire time series, as reported in Section 4.1, and across multiple temporal splits using an expanding window strategy, as described in Section 4.2. The algorithm was initialized with random values within the physiologically meaningful bounds subsequently reported in Table 1. The optimization was repeated multiple times (with different seeds) to avoid convergence to local minima and ensure robustness of the estimated parameters.
Table 1.
Model parameters, their description, and the suggested bounds used during model estimation.
The DE-based estimation procedure was applied individually for each subject and for both models, allowing direct comparison of model fidelity across different formulations.
This parameter identification process ensures that each model configuration is optimally fitted to the athlete’s data, enabling reliable assessment of predictive accuracy and physiological interpretability.
2.5. Study Design
This study aimed at evaluating a novel mathematical model for estimating and predicting performance in elite-standard soccer players. Specifically, the study focuses on players participating in the Italian Premier Division (Serie A) during the 2018–2019 season. They were monitored over half a season (6 months), including the pre-season period, the first part of the regular season, and all official matches (Serie A and National League matches), which took place from July to December during the 2018–2019 season. During the pre-season, players underwent training sessions seven times a week, with friendly matches typically scheduled on Thursdays or over the weekend. These training sessions mainly focused on developing technical-tactical skills and physical fitness. During the league season, players trained six times a week, with an official match played on the weekend. Friendly and National Cup matches were usually played on Thursdays and Wednesdays, respectively.
2.6. Quantification of Load
Load quantification at the end of the training-session or of the match-day (compactly denoted by hereafter) was performed using the equation proposed by [18], which combines metabolic power (MP) and equivalent distance index (EDI) to assess external training load (ETL). Notably, this method demonstrated a significant correlation with internal training load (ITL), as measured using Edwards’ heart rate-based TL method. This finding supports the validity of the MP-based training load calculation in effectively reflecting internal physiological demands during soccer activities. Briefly, metabolic power metrics were developed to accurately describe the physical demands placed on soccer players during matches or training sessions [17]. Integrating metabolic power with kinematic parameters provides an integrated measurement of acceleration and velocity, making it a more precise indicator of the physiological effort exerted by soccer players during both training and match events [17]. In particular, to calculate metabolic power (MP), researchers applied the following formula [22] (explicit dependence on time t is omitted, for the sake of compactness, within Equations (1) and (2) hereafter):
where:
- : energetic cost of running uphill at an inclination derived from the running acceleration vector;
- : instantaneous velocity.
To better assess the metabolic intensity of the training or game, some authors propose incorporating both the equivalent distance (ED) and the equivalent distance index (EDI) [18,26,27]. ED refers to the distance an athlete would have covered at a constant pace on grass using the total energy expended during the match, while EDI is the ratio between the ED and the total distance covered in the game. It is important to note that the EDI provides an indirect estimate of the metabolic intensity of the match, with a high index indicating a greater contribution from anaerobic energy stores due to high-intensity acceleration efforts. To calculate ED and EDI, the following formulas were applied [17]:
where:
- : total energy expenditure measured in joules per kilogram;
- : energetic cost of running at a constant pace on flat, compact terrain (assumed to be );
- : grassy terrain constant;
- : equivalent distance measured in meters;
- : total distance covered in meters.
Based on existing data, the average ratio between ED and total distance covered during soccer matches was approximately 1.20 [17], though this value varied among players (range: 1.15 to 1.35) depending on positional role [28]. In our study, we calculated the external training load (ETL) on the basis of the product of MP and EDI () [18]. It defines the intensity of the external load (I) as follows:
2.7. Performance Test
All performance data were obtained from official matches and collected through video match analysis. As a performance criterion, we used the ratio between the total distance covered by the athlete and the distance covered at a metabolic power output exceeding 25 W·kg−1 (indicative of high-intensity activity). This threshold effectively identifies efforts with elevated metabolic demands and is considered a reliable indicator for assessing high-intensity performance in soccer players [29]. For the analysis, only players who completed the entire match or were substituted no earlier than five minutes before the final whistle (i.e., ≥85 min of play) were included.
3. Modeling
The modeling approach employed in this study aims at originally describing and predicting athletes’ performance capacity in response to ETL derived from GPS-based metrics. We developed a novel linear, time-varying, two-state, discrete-time dynamical model that draws inspiration from the model of heart rate dynamics during variable-intensity exercises [3,4,22].
The proposed model includes two state variables: , representing a performance-related variable at time step k, and , a lumped variable at time step k whose variations directly affect the temporal dynamics of . The model is governed by the following recursive equations:
starting from initial conditions , , where is the (%-normalized) training load input, and . The model incorporates multiple time constants to account for decaying memory effects and parameters , , , to fit the (, ) profiles satisfactorily. To ensure physiological plausibility and numerical stability, we introduced weak bounding constraints on all model parameters. These bounds, partially based on prior modelling studies [1,2,5], are used to restrict the optimization domain and reduce the computational burden. Table 1 summarizes the description of the model parameters and the bounds applied during model optimization. Note that when is negative, the load directly contributes negatively to , whereas it may still contribute positively to , in accordance with the following auto-regressive moving-average expression (Start from the first equation in (4) specialized to and then use the second equation in (4). Finally eliminate by again using the first equation in (4)):
with
This formulation allows for a more biologically plausible representation of the complex relationship between training and performance in soccer players.
On the other hand, the input term introduces a form of temporal “memory” in the system: past training loads are exponentially attenuated over time, meaning that, a training session at time k will progressively lose its influence on performance estimation at time k + 1 as k increases. This mechanism reflects the fading physiological impact of past stimuli and allows the model to mimic the adaptive dynamics of athletic response.
From a mathematical standpoint, the proposed formulation also marks a structural departure from prior models. While performance was previously estimated via single or double summations of exponentially decaying terms related to training and fatigue, here it emerges from a linear, time-varying, two-state system, with a lumped variable. This architecture enhances both the flexibility and interpretability of the model under dynamic load conditions.
Moreover, the model generates an asynchronous output—related to the performance achieved in match events—so that the visible effects of training inputs are not reflected in the instantaneous performance. This behavior captures the delayed and distributed nature of physiological adaptations and fatigue-recovery cycles, thus aligning the model behavior more closely with real-world athletes’ response.
More specifically, the model exhibits asynchronous behavior by distributing the influence of each training input over multiple future time steps. This is governed by a set of estimated time constants that rule how long the effects of a training session persist in the athlete’s physiological state. As a result, a single high-load session may influence performance across several subsequent days—initially increasing fatigue, and only later contributing to fitness improvements. This mechanism allows the model to capture both the delayed onset of adaptation and the extended recovery period, offering a more biologically realistic depiction of training responses.
To evaluate its effectiveness and highlight the value of its novel features, the proposed two-state model was systematically compared with a well-established reference, namely the three-component (Busso) model [6], which introduces a dynamic fatigue term accounting for the monotony and cumulative load of prior sessions.
Researchers started from the one-component model, which represents the most basic approach, assuming that performance is solely driven by the accumulation of fitness as a function of prior training loads [1]. This model neglects fatigue effects and uses a single exponential decay term to reflect the residual impact of each training session. Despite its simplicity, it provides a useful baseline for evaluating the predictive power of more complex models.
In general, a fitness-fatigue model conceptualizes the performance as the sum of a positive training effect (fitness) and a negative one (fatigue). It estimates the performance through the convolution of exponentially decaying responses to training impulses, weighted by individual-specific coefficients and time constants [1,2].
The mathematical formulation of the comparative model used in this study is reported below for the sake of exhaustiveness:
- Three-component (Busso) model [30]:
In particular, all terms appearing in the Busso model formulation follow the notation introduced in [30]: is the performance; is the magnitude factor for the fitness effect (positive impact of training); is the magnitude factor for the fatigue effect (negative impact of training); is the weighting factor controlling the nonlinear modulation of fatigue by past training loads (a larger indicates stronger accumulated fatigue sensitivity);. is the time constant governing the decay of fitness effects; is the time constant governing the decay of fatigue effects;. is the time constant for the decay of the negative influence of training. For parameter estimation, the following search bounds were defined to ensure numerical stability and physiological plausibility: , , and .
4. Results
4.1. Athletic Performance Estimation
As previously mentioned, the predictive capacity of the implemented models was evaluated by analyzing data from two professional soccer players.
Athletic performance was assessed, for both Player 1 and Player 2, as the ratio between the total distance covered and the distance covered at a metabolic power greater than 25 W·kg−1, which was considered indicative of high-intensity activity. Data were obtained via video analysis of official matches and high-frequency GPS devices (GPEXE©).
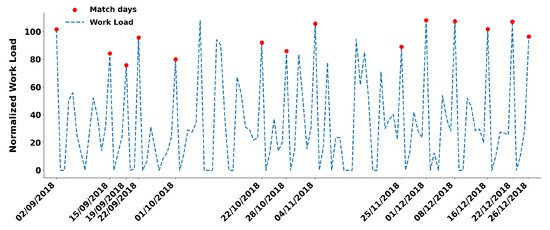
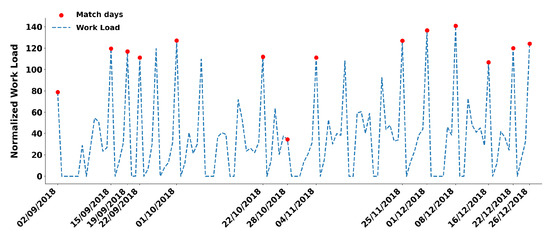
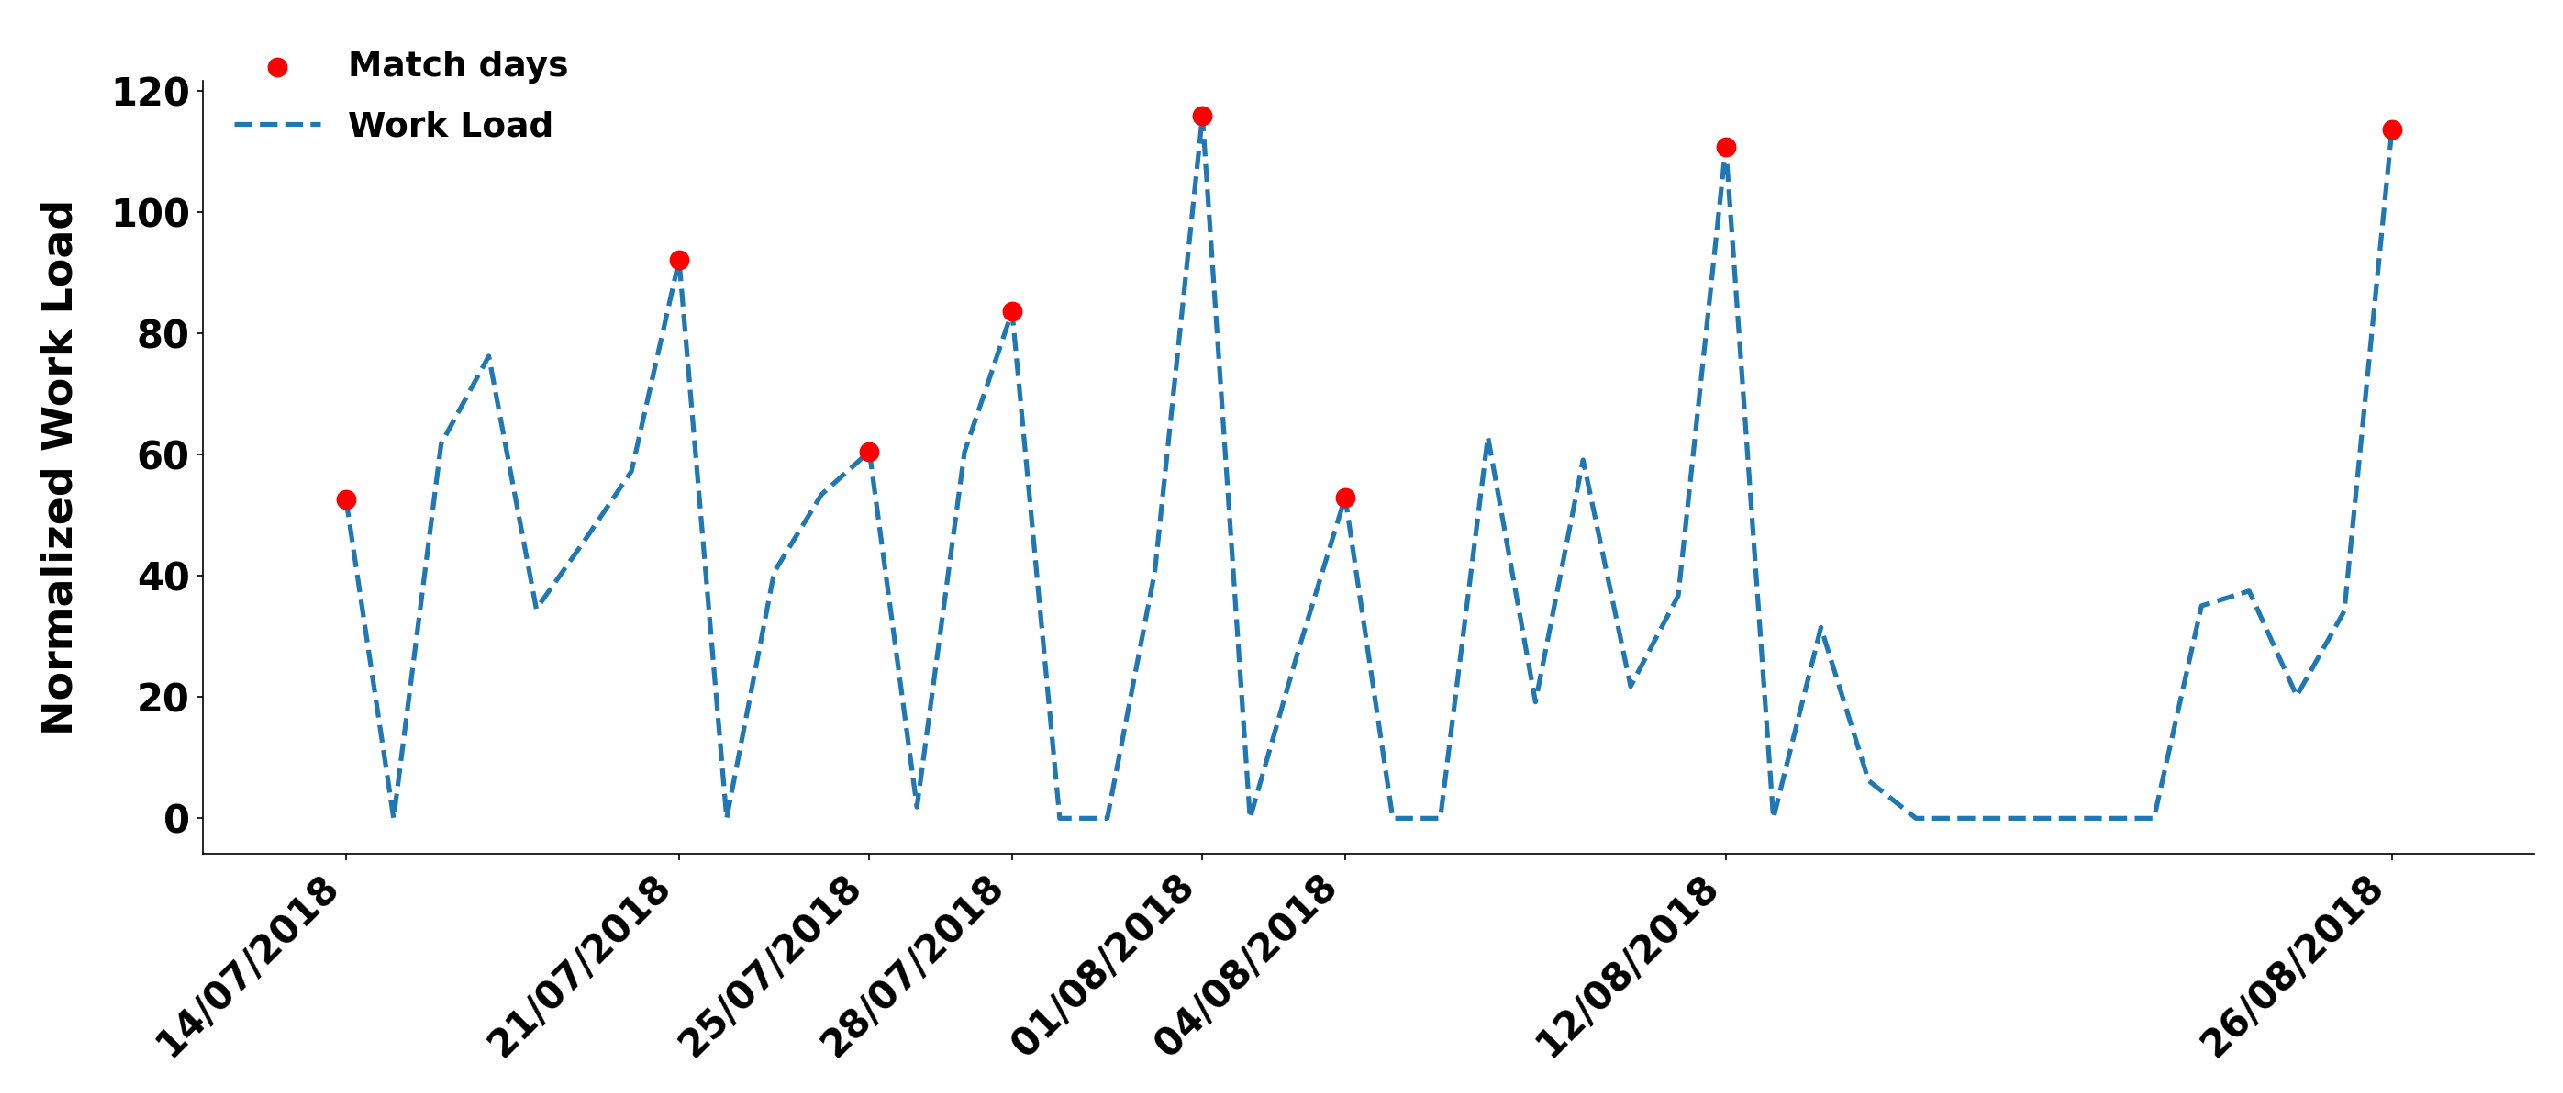
The profile for the %-normalized training load (control variable) in dependence on the training and match dates for all the considered players are reported in Figure 1, Figure 2 and Figure 3.
Figure 1.
%-normalized training load as a function of training and match dates for Player 1 during the competitive season.
Figure 2.
%-normalized training load as a function of training and match dates for Player 2 during the competitive season.
Figure 3.
%-normalized training load as a function of training and match dates for Player 2 during the pre-season.
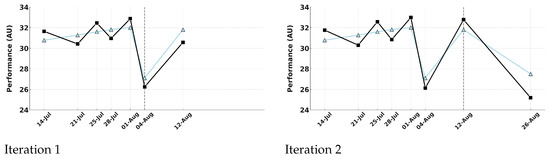
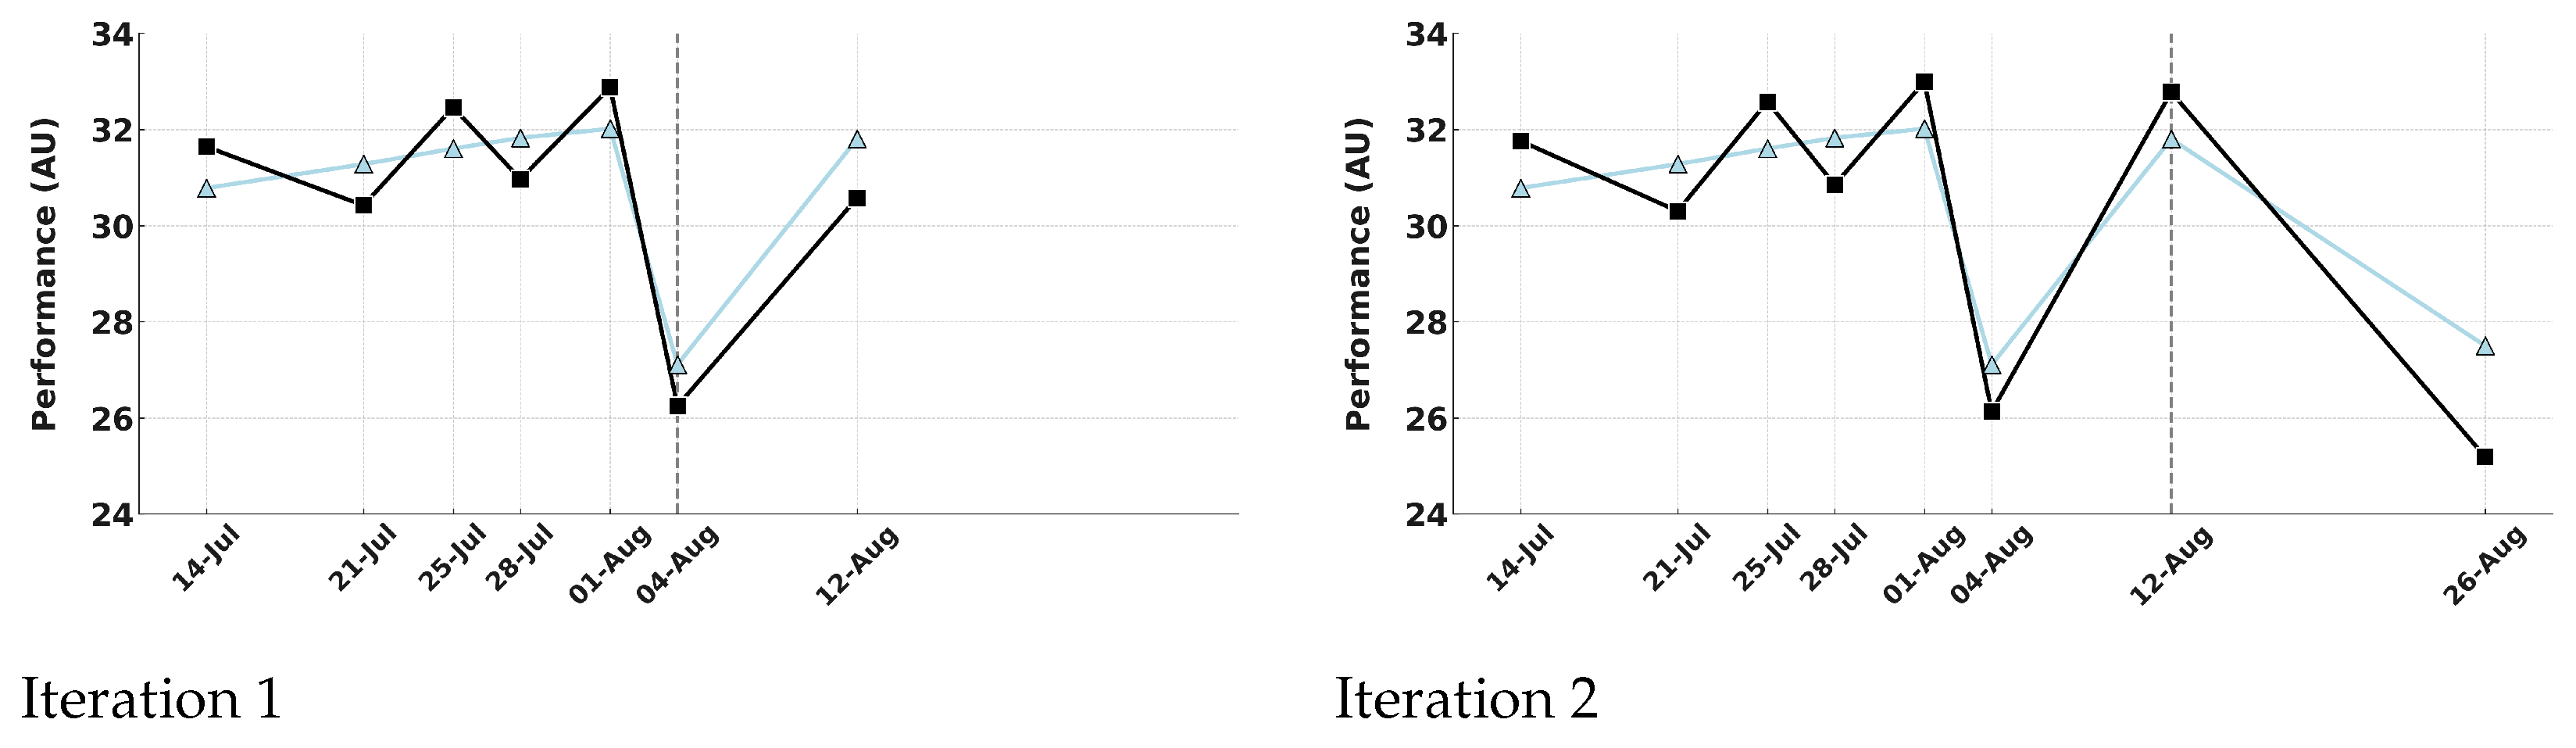
The estimations were made for each player at 14 official competitive matches, held on the following dates: 2, 15, 19, and 22 September; 1, 22, and 28 October; 4 and 25 November; 1, 8, 16, 22, and 26 December 2018. Furthermore, for Player 2, performance estimation was also assessed during the pre-season phase, considering 8 friendly matches held on 14, 21, 25, and 28 July; 1, 4, 12, and 26 August 2018.
The training and match dates for each player, both during the pre-season and the competitive season periods, are summarized in Table 2. Specifically, for each player the continuous range of training dates and of match days are reported in chronological order.
Table 2.
Training and match dates for Player 1 and Player 2 during the pre-season and the competitive season.
Model Accuracy Comparison Across Seasonal Phases
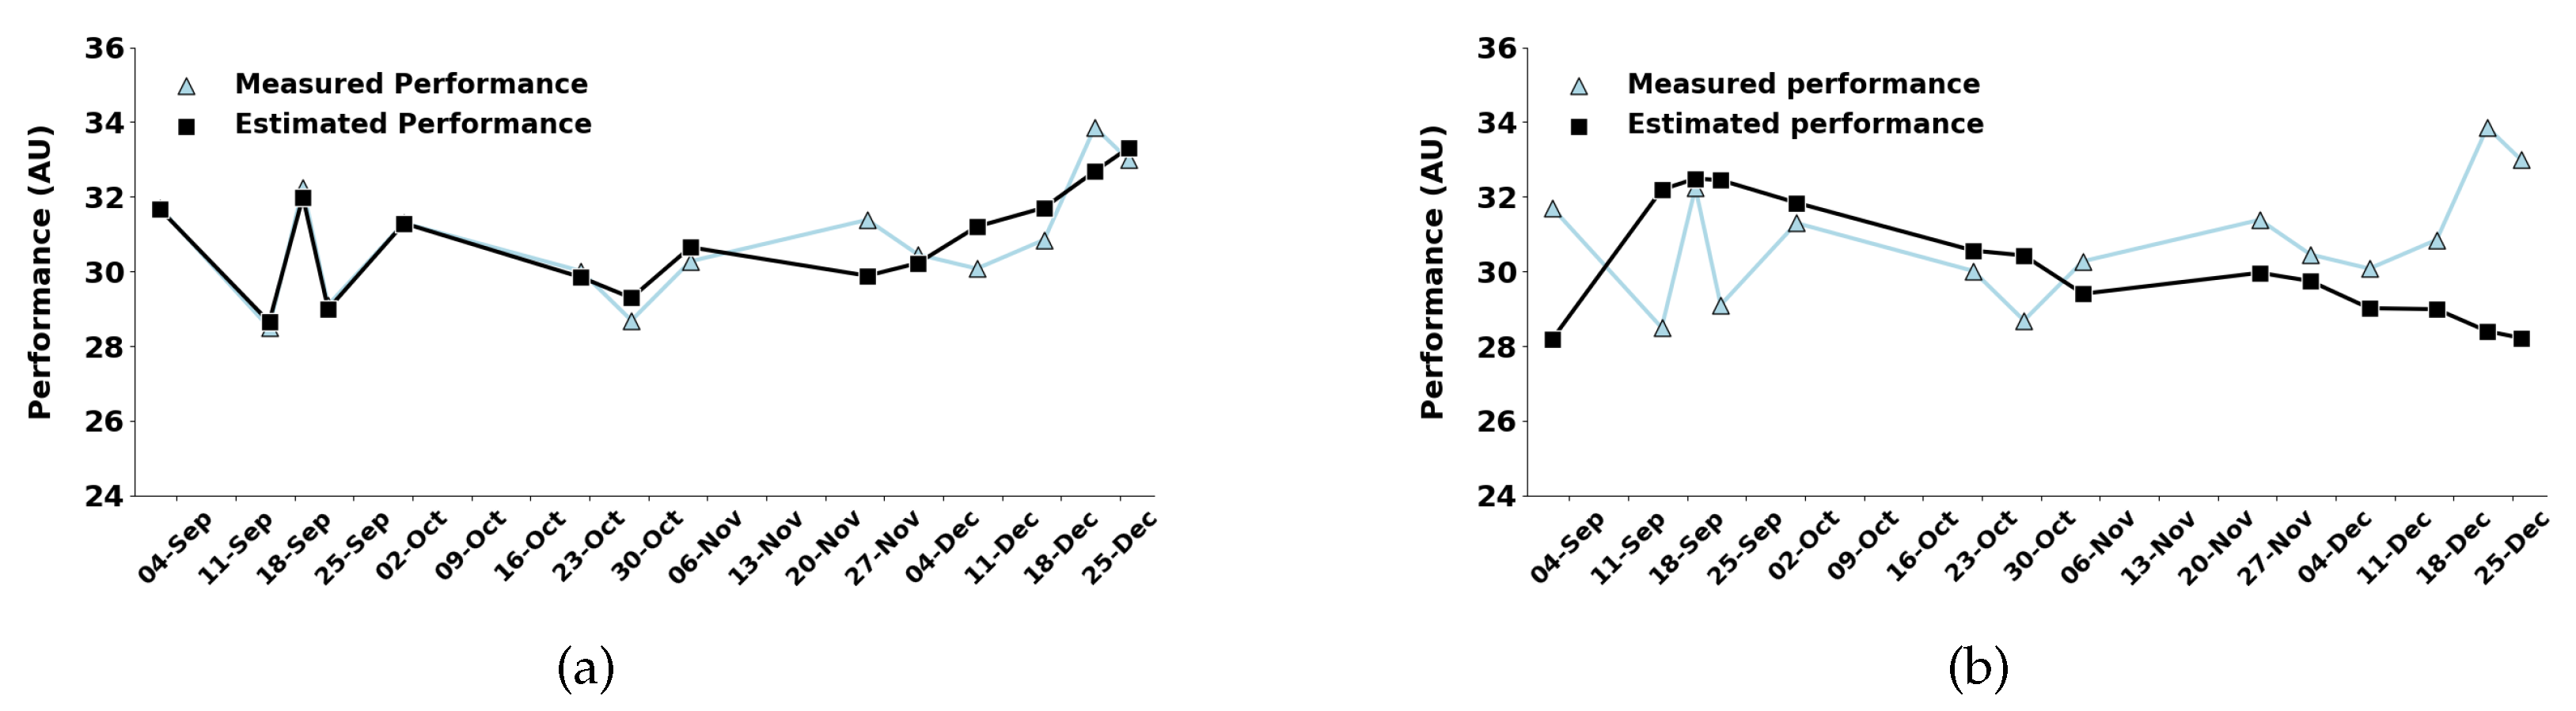
The results reported in this section show that the proposed model significantly outperforms the Busso model in estimation accuracy. Specifically, for Player 1, the proposed model achieved a Pearson correlation coefficient of and a Sum of Squared Errors (). In contrast, the Busso model yielded lower correlations and higher errors (, ).
The improved estimation performance of the proposed two-state dynamical model compared to the Busso model is consistent across the two athletes analyzed (Table 3), confirming that the inclusion of a lumped variable allows for a more accurate modeling of the complex relationship between training load and performance in professional soccer. Estimated model parameters for each player are reported in Table 4.
Table 3.
Correlation coefficient (r) and Sum of Squared Errors (SSE) for each model and player during the competitive season.
Table 4.
Identified model parameters for each player during the competitive season.
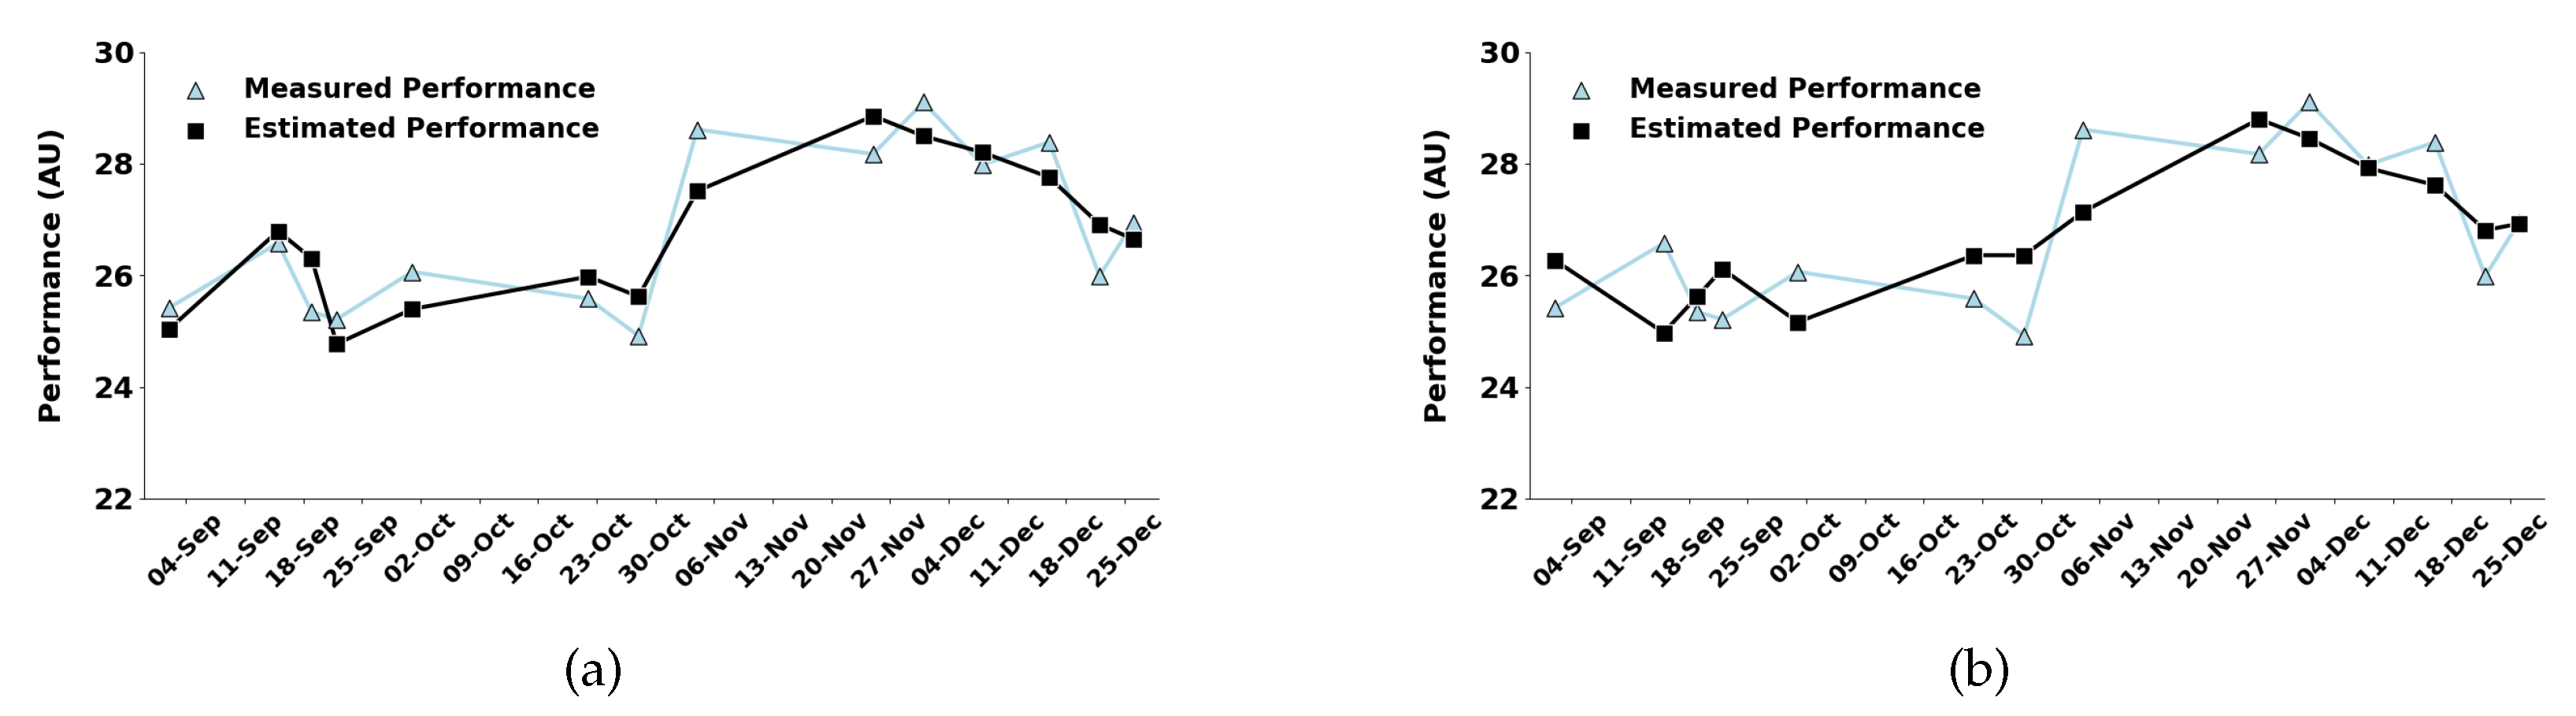
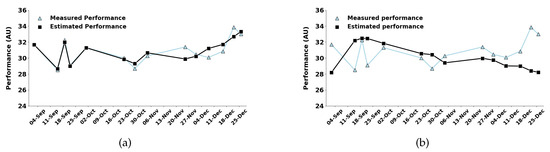
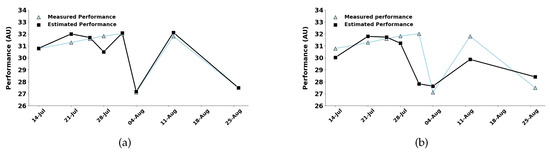
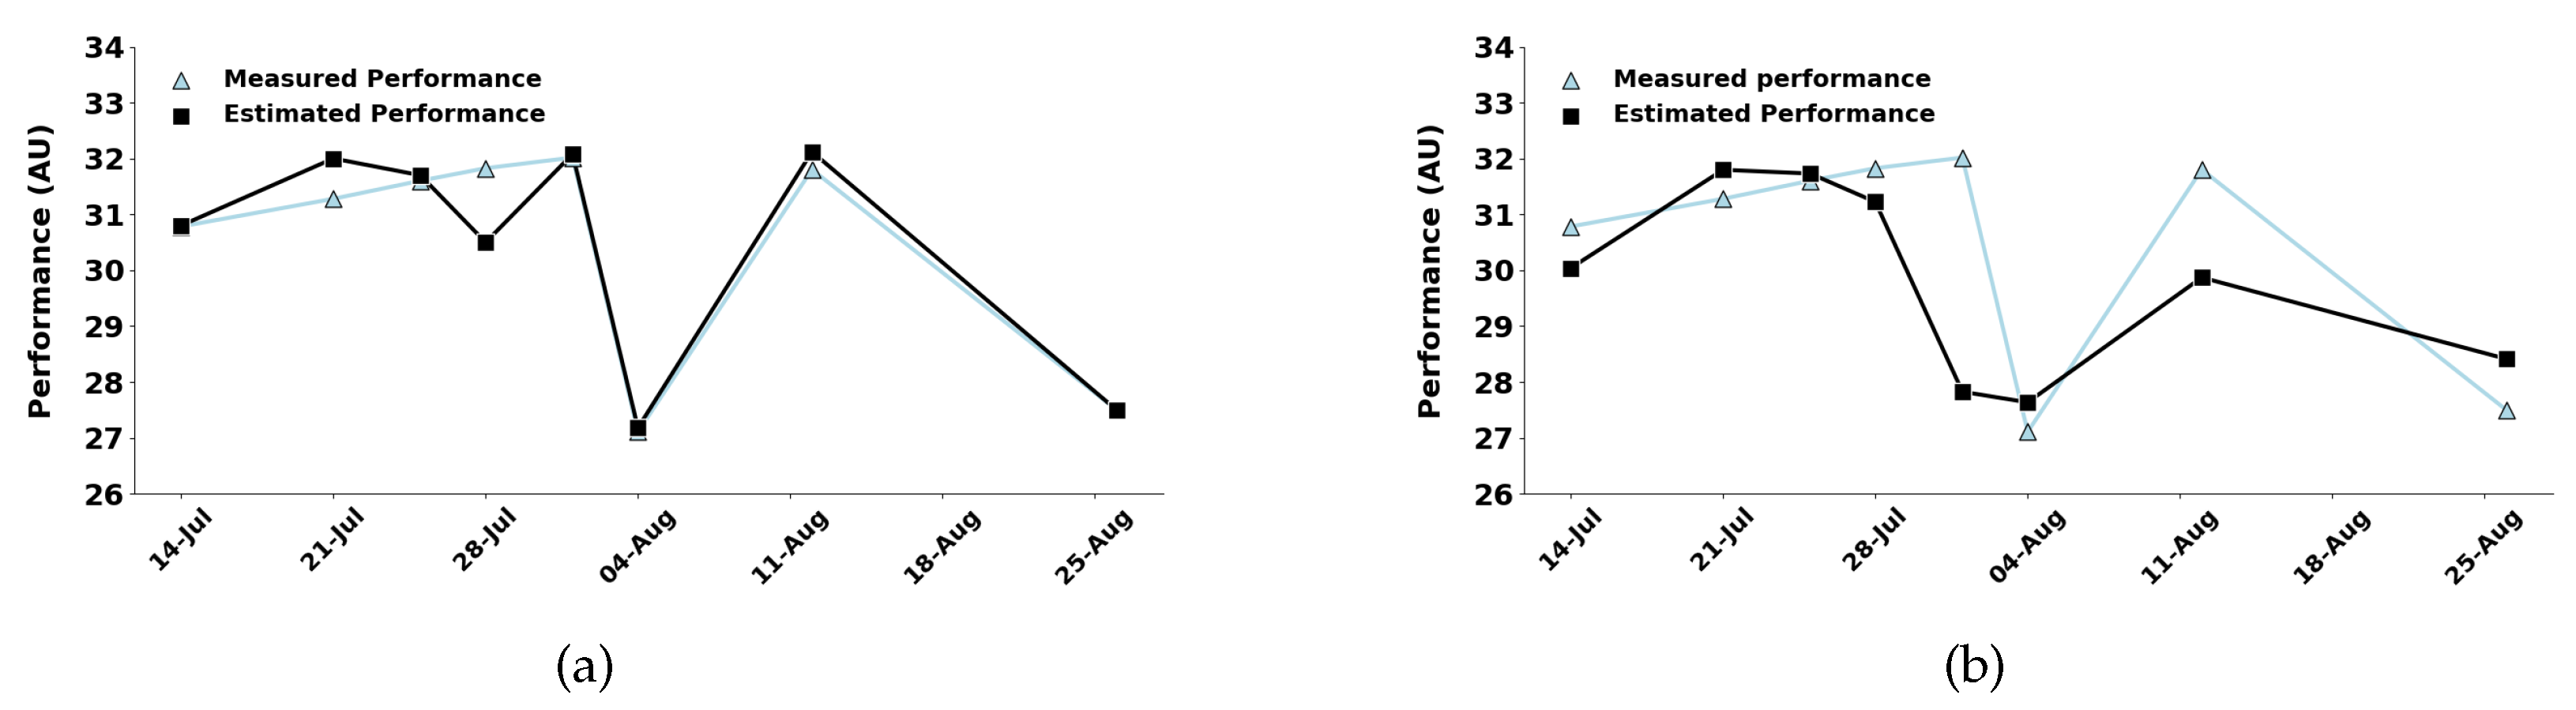
Figure 4a,b show the performance estimations for Player 1 during the competitive season, obtained using the newly proposed two-state model and the Busso model, respectively. The corresponding estimations for Player 2 are presented in Figure 5a,b. Furthermore, as shown in Figure 6a,b and in Table 5, the proposed model also achieves superior estimation accuracy during the pre-season (Player 2). The corresponding parameter estimates are provided in Table 6.
Figure 4.
Athletic performance estimation for Player 1 obtained using (a) the proposed two-state model and (b) the Busso model during the competitive season.
Figure 5.
Athletic performance estimation for Player 2 obtained using (a) the proposed two-state model and (b) the Busso model during the competitive season.
Figure 6.
Athletic performance estimation for Player 2 obtained using (a) the proposed two-state model and (b) the Busso model during the pre-season.
Table 5.
Correlation coefficient (r) and Sum of Squared Errors (SSE) for player 2 and each model during the pre-season.
Table 6.
Identified model parameters for Player 2 during the pre-season.
The following initial conditions at time step were adopted for the two-state variables and in the newly proposed model: , for Player 1 (competitive season), , for Player 2 (competitive season), and , for Player 2 (pre-season). In all cases, was set equal to the measured performance at , while was involved in the DE optimization procedure until convergence to the global minimum.
Remark.
In order to better evaluate the role of the bounds reported in Table 1, the model estimation process has been carried out three additional times by progressively expanding the parameter bounds by factors of 1.5×, 2×, and 2.5×.
Table 7 and Table 8 report the outcomes of the parameter expansion analysis performed for each model, corresponding to Player 1 and Player 2, respectively. For each expansion factor, the final Sum of Squared Errors (SSE), and the Pearson correlation coefficient (r) are provided, allowing for the evaluation of parameter stability and sensitivity to bound variation.
Table 7.
Model (4) and (7)–(8) estimation process for Player 1 during the competitive season, obtained by progressively expanding the parameter bounds by factors of 1.5×, 2×, and 2.5×. For each case, the final Sum of Squared Errors (SSE) and the Pearson correlation coefficient (r) are reported.
Table 8.
Model (4) and (7)–(8) estimation process for Player 2 during the competitive season, obtained by progressively expanding the parameter bounds by factors of 1.5×, 2×, and 2.5×. For each case, the final Sum of Squared Errors (SSE) and the Pearson correlation coefficient (r) are reported.
The obtained results demonstrate comparable and aligned values of SSE and r across all simulations, indicating that those indices are almost stable within the initially defined physiological range, thus confirming an overall consistency.
4.2. Athletic Performance Prediction
In this section, the results of an expanding window validation strategy are included to improve the assessment of model generalization capability. Specifically, the expanding window approach was carried out with reference to Player 1 and Player 2 (competitive season and pre-season): the model estimation was initially performed using the entire training and match period up to the sixth match and the resulting parameter estimates were used to predict the performance of the subsequent match on the basis of the available training load values. After each prediction, the temporal window was expanded one step forward by incorporating the predicted match and the training week before it into the new training set. As a matter of fact, the process was repeated for a total of 8 iterations (competitive season dataset) and of 2 iterations (pre-season dataset).
The following Table 9, Table 10 and Table 11 report the results obtained for each player and experimental condition (competitive season and pre-season). For both models (4) and (7)–(8), Sum of Squared Errors (SSE), correlation coefficient (r), and absolute prediction error are shown for each iteration of the expanding window strategy. Moreover, the mean values of these metrics and their percentage variations between the two models are also provided, to quantitatively highlight the differences in generalization performance.
Table 9.
Sum of Squared Errors (SSE), correlation coefficient (r), and prediction error for Player 1 during the competitive season, obtained with models (4) and (7)–(8) across all iterations of the expanding window strategy. The table also reports the mean values of each metric and their percentage variations between the two models.
Table 10.
Sum of Squared Errors (SSE), correlation coefficient (r), and prediction error for Player 2 during the competitive season, obtained with models (4) and (7)–(8) across all iterations of the expanding window strategy. The table also reports the mean values of each metric and their percentage variations between the two models.
Table 11.
Sum of Squared Errors (SSE), correlation coefficient (r), and prediction error for Player 2 during the pre-season, obtained with models (4) and (7)–(8) across all iterations of the expanding window strategy. The table also reports the mean values of each metric and their percentage variations between the two models.
Results of Table 9, Table 10 and Table 11 illustrate the model effectiveness in predicting over multiple splits, thus providing a reliable assessment of its generalization ability over time.
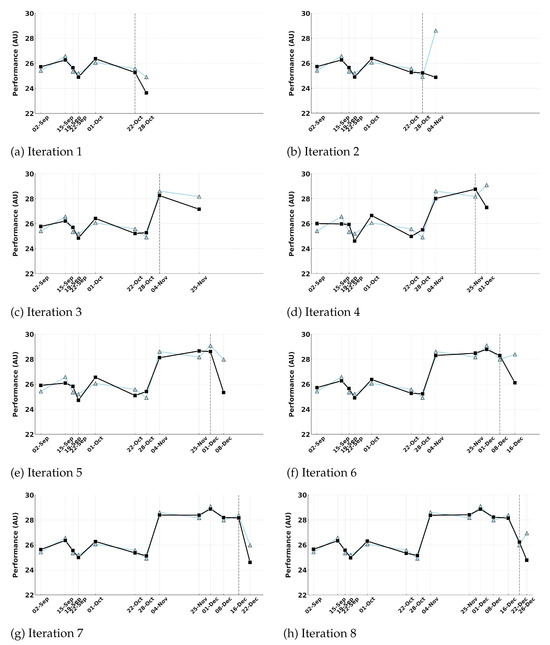
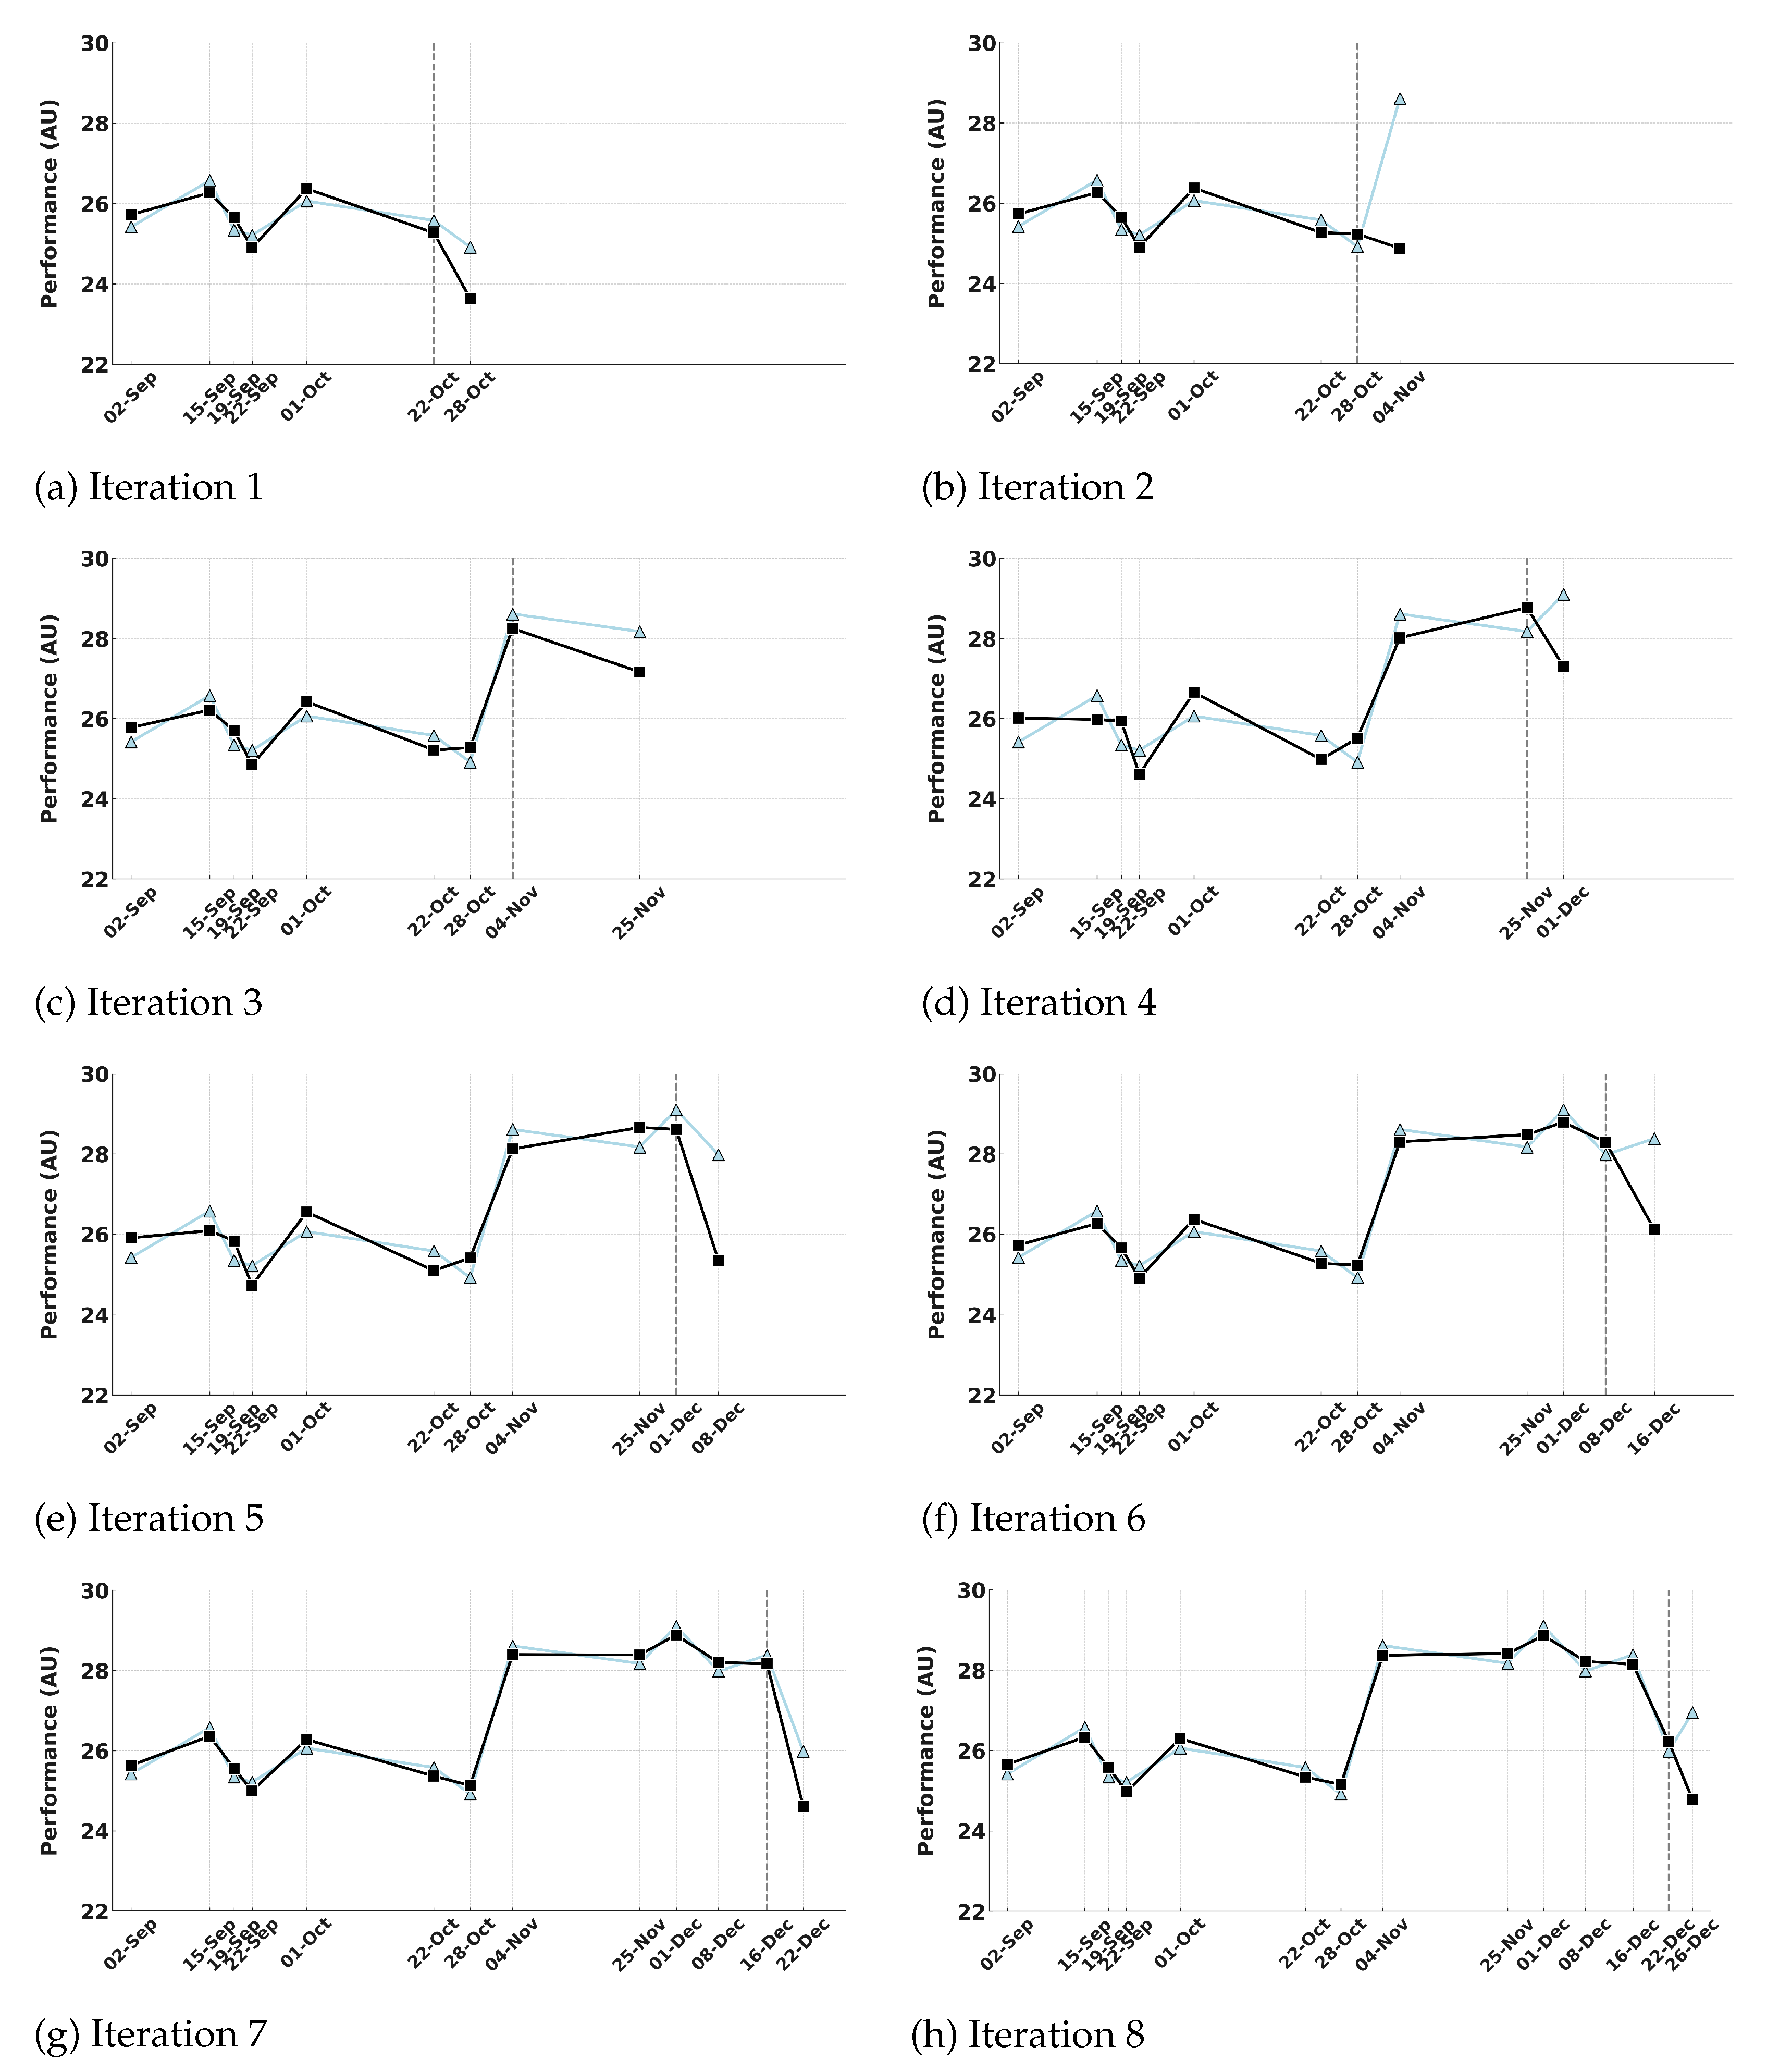
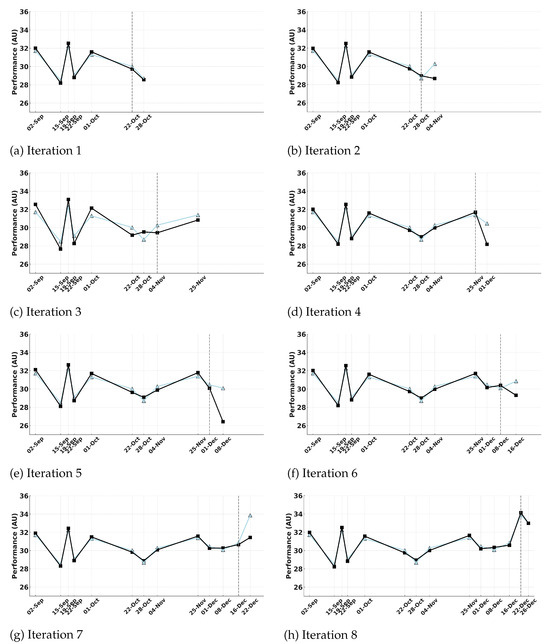
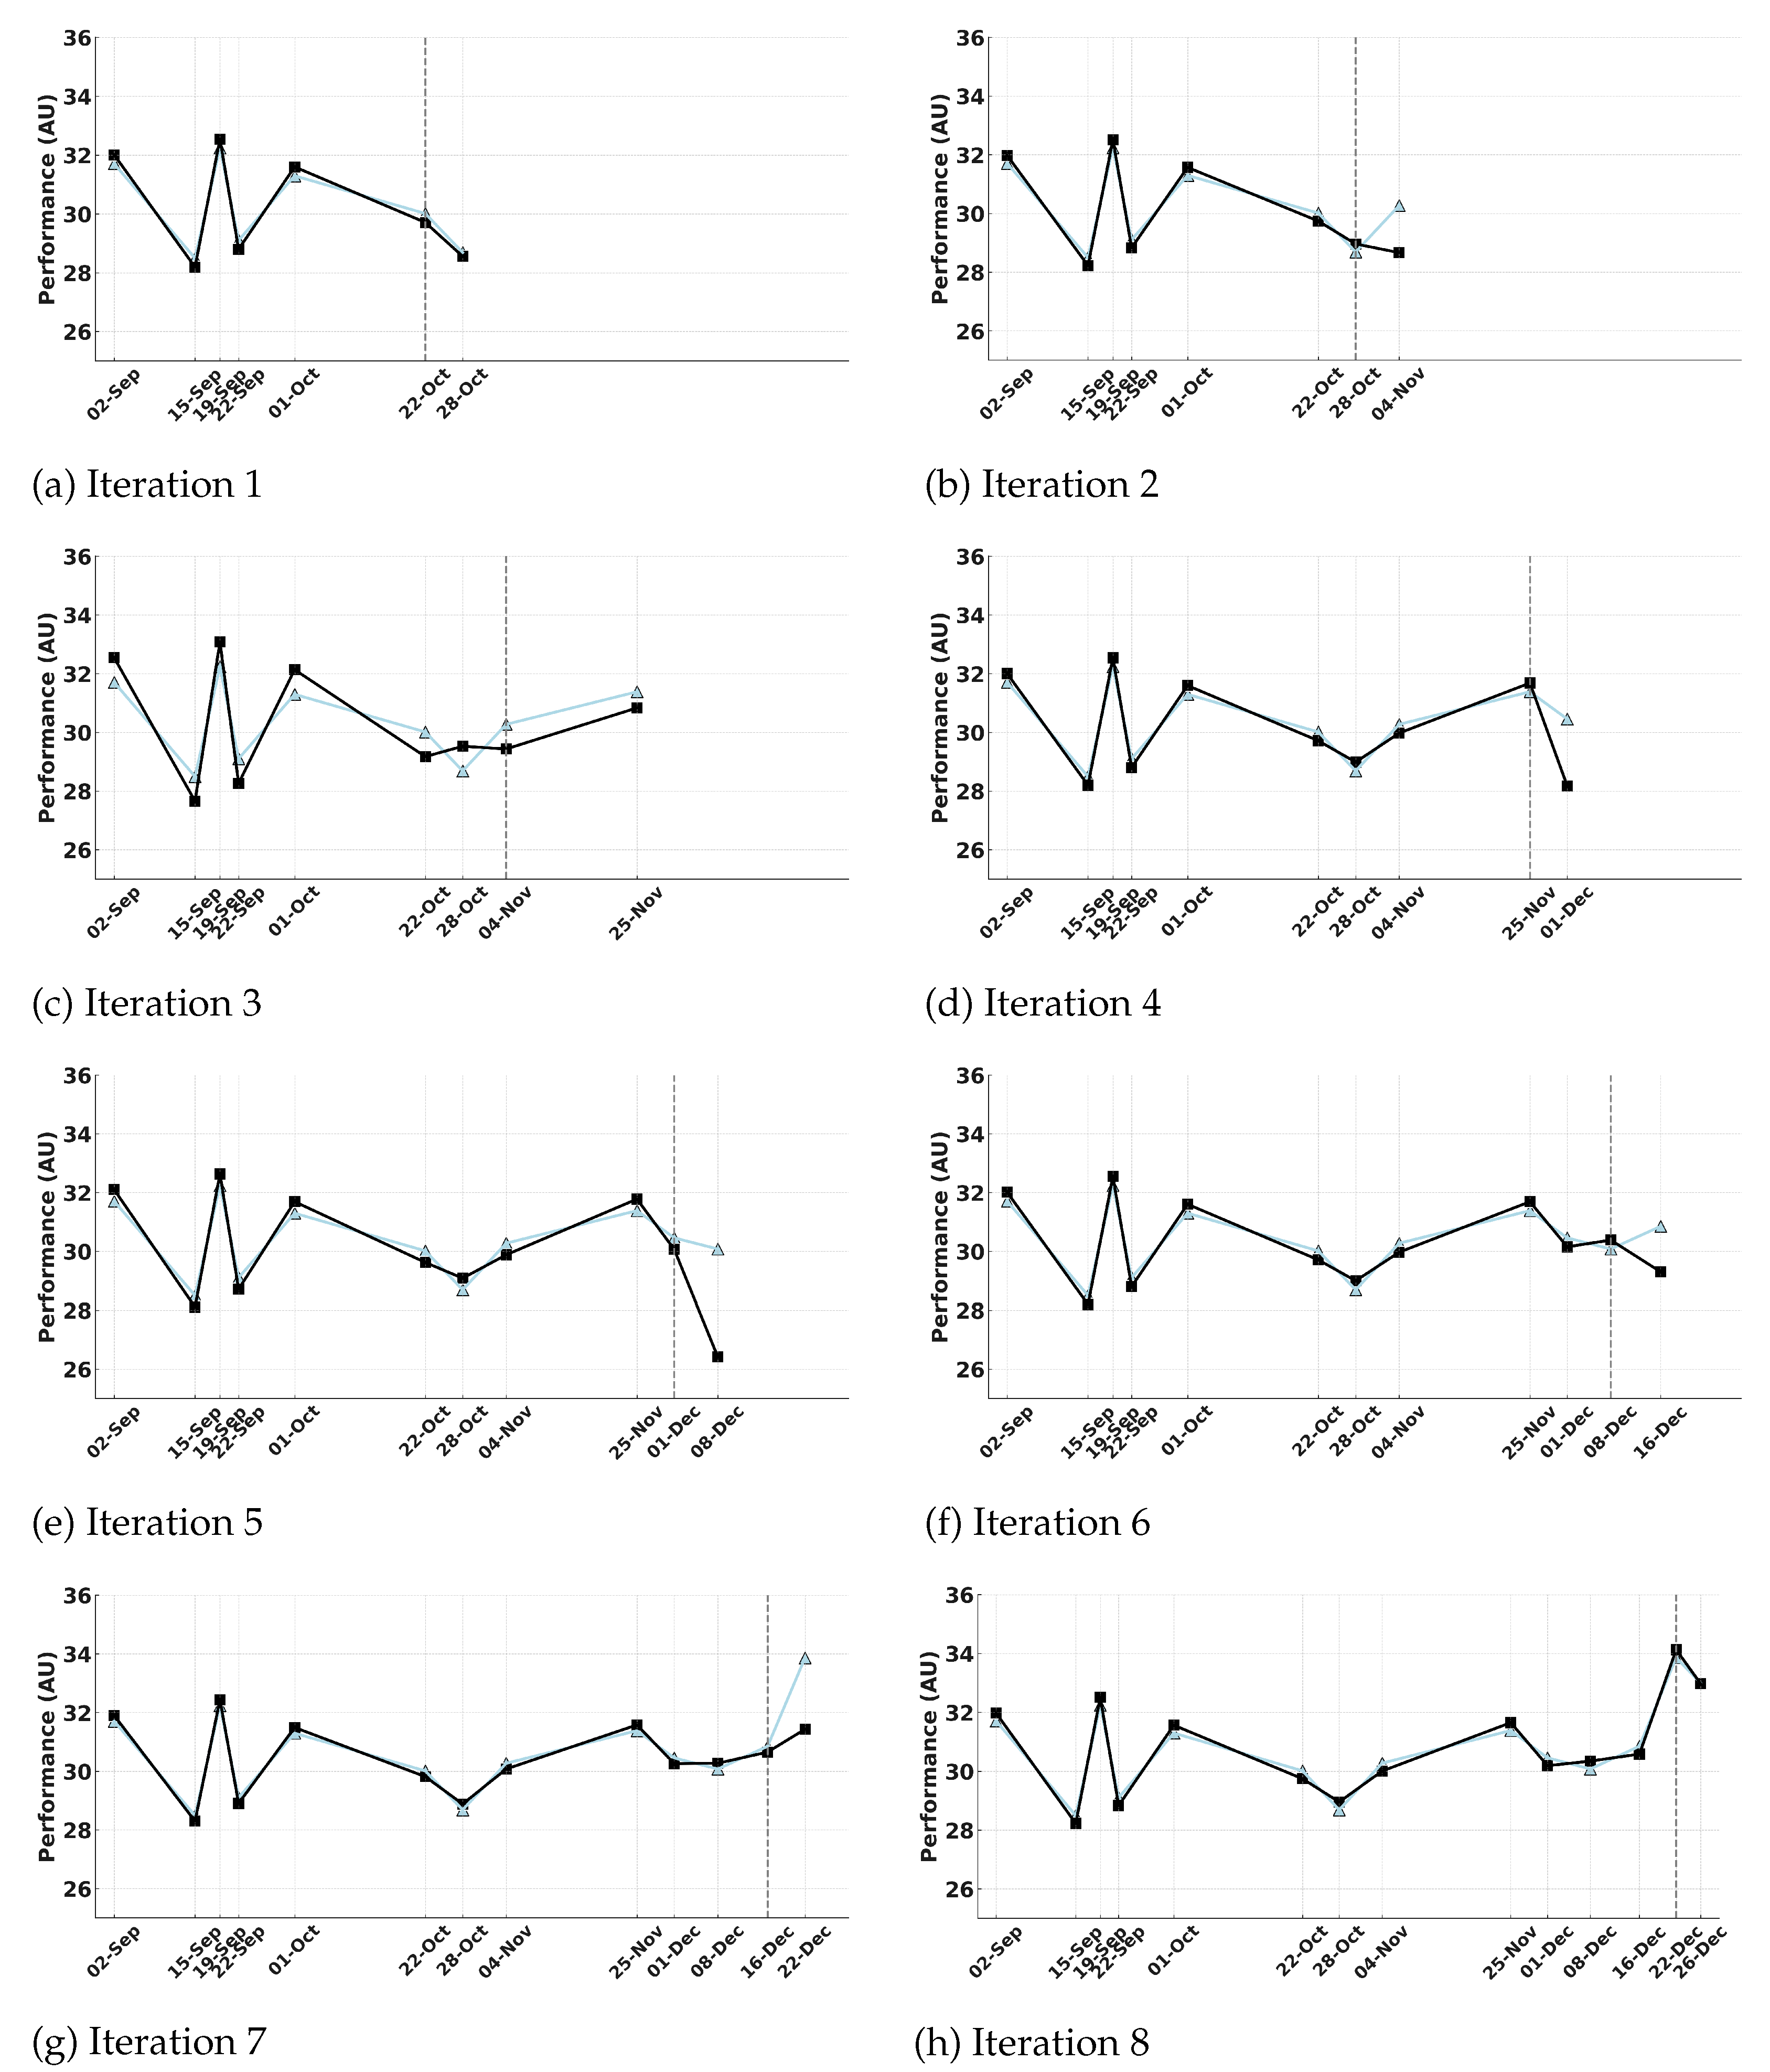
Furthermore, Figure 7, Figure 8 and Figure 9 show the evolution of the expanding-window estimation set over all iterations (see Table 9, Table 10 and Table 11) for Player 1 and Player 2 during the competitive season, and for Player 2 during the pre-season, respectively.
Figure 7.
Expanding–window validation strategy applied to Player 1, during the competitive season, across iterations 1–8. Each panel shows the measured performance (triangles) and the corresponding estimated/predicted performance (square) obtained from the model (4) optimized up to each iteration reported in Table 9. The dashed vertical line indicates the boundary between the estimation set and the prediction set for each iteration.
Figure 8.
Expanding–window validation strategy applied to Player 2, during the competitive season, across iterations 1–8. Each panel shows the measured performance (triangles) and the corresponding estimated/predicted performance (square) obtained from the model (4) optimized up to each iteration reported in Table 10. The dashed vertical line indicates the boundary between the estimation set and the prediction set for each iteration.
Figure 9.
Expanding–window validation strategy applied to Player 2, during the pre-season, across iterations 1–2. Each panel shows the measured performance (triangles) and the corresponding estimated/predicted performance (square) obtained from the model (4) optimized up to each iteration reported in Table 11. The dashed vertical line indicates the boundary between the estimation set and the prediction set for each iteration.
5. Discussion
This study evaluated the estimation and prediction performance of a novel linear, time-varying, two-state discrete-time mathematical model for athletic performance in professional soccer players. The proposed approach outperformed the (nonlinear) Busso model, showing higher Pearson correlation coefficients and lower SSE values across different athletes and seasonal phases, both during the competitive and pre-season periods (Table 3, Table 4 and Table 5; Figure 4, Figure 5 and Figure 6a,b).
Building on this structural insight, the model also introduces a predictive-preventive perspective. In fact, beyond simply describing performance retrospectively, the model might enable early identification of suboptimal load trends.
On the other hand, the integration of GPS-derived external load metrics—specifically, MP and EDI—further increased the model responsiveness. These metrics allowed a more sensitive tracking of high-intensity activities and training density, which are often underrepresented by traditional indicators. Their inclusion highlights the importance of selecting input variables that reflect the complexity of the training stimulus.
Additionally, implementing real-time model updating—via sliding-window mechanisms—may support dynamic performance tracking throughout entire competitive calendars.
The results summarized in Table 9, Table 10 and Table 11 confirm the superior performance of the proposed model compared to the nonlinear Busso formulation, both in terms of estimation accuracy and generalization stability across athletes and training phases.
For Player 1 (competitive season), the proposed model achieved a substantial reduction in total squared error ( SSE) and mean prediction error (), while maintaining a slightly higher correlation coefficient (). These improvements indicate a more accurate and coherent fit to the measured performance data, with a markedly lower dispersion of residuals across the validation windows. In particular, the model showed a more stable trend of the correlation coefficient (r ranging from 0.65 to 0.99) compared to the Busso model (r between 0.68 and 0.95), highlighting its enhanced robustness over time. Overall, the proposed formulation yielded more reliable predictions and reduced systematic deviations, as reflected by the smoother evolution of both fitting and predictive accuracy.
Similarly, for Player 2 (competitive season), the proposed model exhibited consistent yet more moderate improvements, with a decrease in SSE of approximately , an increase in correlation of about , and a reduction in prediction error of . Although the magnitude of improvement was smaller than for Player 1, the results still demonstrate a higher structural stability and reduced error variability. The proposed model produced more regular prediction patterns (error range 1–3) compared to the Busso model, which displayed higher dispersion and progressive worsening of the fitting during later iterations. This behavior suggests that the new linear two-state model generalizes better under conditions of repeated load adaptation, maintaining predictive coherence even with smaller training datasets.
Regarding the pre-season phase (Player 2), the results further confirm the general validity of the proposed approach across different temporal contexts. The model achieved a marked reduction in the sum of squared errors (), a significant increase in correlation coefficient (), and a lower prediction error () relative to the Busso model. These improvements underline the enhanced sensitivity of the model during early training phases, when physiological adaptations are more variable and performance responses less stable. The observed consistency of improvements across all metrics indicates that the proposed formulation retains its robustness even when applied to shorter, more fluctuating datasets such as those characterizing pre-season periods.
Taken together, these results confirm that the proposed linear, time-varying two-state model provides a more stable and generalizable representation of the training–performance relationship. Its ability to minimize cumulative error, maintain higher correlation with measured data, and deliver smoother predictive behavior across successive updates supports its potential use for dynamic load management and individualized performance monitoring in professional soccer contexts.
6. Limitations
This paper presents a proof of concept, based on a relatively small sample of two professional players. As such, the observed differences in predictive accuracy between models should be interpreted with caution. Future studies will involve larger and more diverse athlete populations.
7. Conclusions
This study introduced a novel linear, time-varying, two-state discrete-time mathematical model that outperforms a classical model in estimating and predicting athletic performance among elite soccer players.
A key innovation is the inclusion of GPS-derived metrics such as metabolic power and equivalent distance index, which enhanced the model sensitivity to the physiological intensity of training sessions.
The results obtained in this paper suggest that the proposed model is a powerful tool for performance estimation and prediction while suggesting that it is also a practical framework for guiding training load optimization in high-intensity team sports. It might offer a biologically grounded and data-driven approach to enhance athlete readiness and reduce the risk of overtraining.
Future extensions of this work may include real-time applications, and broader validation across diverse sports and athletic populations.
Author Contributions
Conceptualization, C.M.V. and V.M.; methodology, C.M.V. and V.M.; software, S.M. and N.C.; validation, V.M., S.M., N.C., F.L. and R.D.; formal analysis, C.M.V. and V.M.; investigation, S.M., N.C., F.L. and R.D.; resources, V.M. and C.M.V.; data curation, S.M. and N.C.; writing—original draft preparation, N.C.; writing—review and editing, N.C. and C.M.V. All authors have read and agreed to the published version of the manuscript.
Funding
This research received no external funding.
Informed Consent Statement
The players gave informed consent regarding the purposes of the research.
Data Availability Statement
The data presented in this study are available on request from the corresponding author. The data are not publicly available due to confidentiality agreements with the soccer team and privacy restrictions concerning athlete performance data.
Conflicts of Interest
Author Samir Maikano is employed by Open Fiber S.p.A., PMO–Operational Reporting Cluster C&D. The remaining authors declare that the research was conducted in the absence of any commercial or financial relationships that could be construed as a potential conflict of interest.
References
- Calvert, T.W.; Banister, E.W.; Savage, M.V.; Bach, T. A Systems Model of the Effects of Training on Physical Performance. IEEE Trans. Syst. Man Cybern. 1976, SMC-6, 94–102. [Google Scholar] [CrossRef] [Scilit]
- Morton, R.H.; Fitz-Clarke, J.R.; Banister, E.W. Modeling human performance in running. J. Appl. Physiol. 1990, 69, 1171–1177. [Google Scholar] [CrossRef] [Scilit]
- Busso, T.; Carasso, C.; Lacour, J.R. Adequacy of a systems structure in the modeling of training effects on performance. J. Appl. Physiol. 1991, 71, 2044–2049. [Google Scholar] [CrossRef] [Scilit]
- Mujika, I.; Busso, T.; Lacoste, L.; Barale, F.; Geyssant, A.; Chatard, J.C. Modeled responses to training and taper in competitive swimmers. Med. Sci. Sports Exerc. 1996, 28, 251–258. [Google Scholar] [CrossRef] [Scilit] [PubMed]
- Busso, T.; Häkkinen, K.; Pakarinen, A.; Carasso, C.; Lacour, J.R.; Komi, P.V.; Kauhanen, H. A Systems Model of Training Responses and Its Relationship to Hormonal Changes in Elite Weight-Lifters. Eur. J. Appl. Physiol. Occup. Physiol. 1990, 61, 48–54. [Google Scholar] [CrossRef] [Scilit]
- Busso, T. Variable dose-response relationship between exercise training and performance. Med. Sci. Sports Exerc. 2003, 35, 1188–1195. [Google Scholar] [CrossRef] [Scilit] [PubMed]
- Bangsbo, J. The physiology of soccer-with special reference to intense intermittent exercise. Acta Physiol. Scand. Suppl. 1994, 619, 1–155. [Google Scholar] [PubMed]
- Rampinini, E.; Coutts, A.J.; Castagna, C.; Sassi, R.; Impellizzeri, F.M. Variation in top level soccer match performance. Int. J. Sports Med. 2007, 28, 1018–1024. [Google Scholar] [CrossRef] [Scilit]
- Stølen, T.; Chamari, K.; Castagna, C.; Wisløff, U. Physiology of soccer: An update. Sports Med. 2005, 35, 501–536. [Google Scholar] [CrossRef] [Scilit]
- Kulakou, S.; Ragab, N.; Midoglu, C.; Boeker, M.; Johansen, D.; Riegler, M.A.; Halvorsen, P. Exploration of Different Time Series Models for Soccer Athlete Performance Prediction. Eng. Proc. 2022, 18, 37. [Google Scholar] [CrossRef] [Scilit]
- Nowak, M.; Bok, B.; Wilczek, A.; Oleksy, Ł.; Kamola, M. Forecasting extremes of football players’ performance in matches. Sci. Rep. 2024, 14, 27319. [Google Scholar] [CrossRef] [Scilit]
- Javadpour, L.; Khazaeli, M.; Molenaar, R. From Practice To Performance: Predicting Soccer Match Outcomes from Training Data. SN Comput. Sci. 2025, 6, 324. [Google Scholar] [CrossRef] [Scilit]
- Hu, Y.; Liu, P.; Zhu, P.; Cheng, D.; Dai, T. Adaptive Multi-Scale Decomposition Framework for Time Series Forecasting. In Proceedings of the AAAI Conference on Artificial Intelligence, Philadelphia, PA, USA, 25 February–4 March 2025. [Google Scholar]
- Li, P.; Zheng, X.; Xiang, S.; Hou, J.; Qin, Y.; Kurboniyon, M.S. Channel Independence Bidirectional Gated Mamba With Interactive Recurrent Mechanism for Time Series Forecasting. IEEE Trans. Ind. Electron. 2025, 1–10. [Google Scholar] [CrossRef] [Scilit]
- Aughey, R.J. Applications of GPS Technologies to Field Sports. Int. J. Sports Physiol. Perform. 2011, 6, 295–310. [Google Scholar] [CrossRef] [Scilit] [PubMed]
- Cummins, C.; Orr, R.; O’Connor, H.; West, C. Global Positioning Systems (GPS) and Microtechnology Sensors in Team Sports: A Systematic Review. Sports Med. 2013, 43, 1025–1042. [Google Scholar] [CrossRef] [Scilit] [PubMed]
- Osgnach, C.; Poser, S.; Bernardini, R.; Rinaldo, R.; di Prampero, P.E. Energy cost and metabolic power in elite soccer: A new match analysis approach. Med. Sci. Sports Exerc. 2010, 42, 170–178. [Google Scholar] [CrossRef] [Scilit] [PubMed]
- Manzi, V.; Savoia, C.; Padua, E.; Edriss, S.; Iellamo, F.; Caminiti, G.; Annino, G. Exploring the interplay between metabolic power and equivalent distance in training games and official matches in soccer: A machine learning approach. Front. Physiol. 2023, 14, 1230912. [Google Scholar] [CrossRef] [Scilit]
- Linke, D.; Link, D.; Lames, M. Validation of electronic performance and tracking systems EPTS under field conditions. PLoS ONE 2018, 13, e0199519. [Google Scholar] [CrossRef] [Scilit]
- Gaudino, P.; Iaia, F.M.; Alberti, G.; Strudwick, A.J.; Atkinson, G.; Gregson, W. Monitoring training in elite soccer players: Systematic bias between running speed and metabolic power data. Int. J. Sports Med. 2013, 34, 963–968. [Google Scholar] [CrossRef] [Scilit]
- Linke, D.; Link, D.; Lames, M. Football-specific validity of TRACAB’s optical video tracking systems. PLoS ONE 2020, 15, e0230179. [Google Scholar] [CrossRef] [Scilit]
- di Prampero, P.E.; Fusi, S.; Sepulcri, L.; Morin, J.B.; Belli, A.; Antonutto, G. Sprint running: A new energetic approach. J. Exp. Biol. 2005, 208, 2809–2816. [Google Scholar] [CrossRef] [Scilit]
- Nagahara, R.; Botter, A.; Rejc, E.; Koido, M.; Shimizu, T.; Samozino, P.; Morin, J.-B. Concurrent validity of GPS for deriving mechanical properties of sprint acceleration. Int. J. Sports Physiol. Perform. 2017, 12, 129–132. [Google Scholar] [CrossRef] [Scilit]
- Hoppe, M.W.; Baumgart, C.; Polglaze, T.; Freiwald, J. Validity and reliability of GPS and LPS for measuring distances covered and sprint mechanical properties in team sports. PLoS ONE 2018, 13, e0192708. [Google Scholar] [CrossRef] [Scilit]
- Witte, T.H.; Wilson, A.M. Accuracy of non-differential GPS for the determination of speed over ground. J. Biomech. 2004, 37, 1891–1898. [Google Scholar] [CrossRef] [Scilit] [PubMed]
- Guerrero-Calderón, B.; Klemp, M.; Castillo-Rodriguez, A.; Morcillo, J.A.; Memmert, D. A new approach for training-load quantification in elite-level soccer: Contextual factors. Int. J. Sports Med. 2021, 42, 716–723. [Google Scholar] [CrossRef] [Scilit]
- Guerrero-Calderón, B.; Morcillo, J.A.; Chena, M.; Castillo-Rodríguez, A. Comparison of training and match load between metabolic and running speed metrics of professional Spanish soccer players by playing position. Biol. Sports 2022, 39, 933–941. [Google Scholar] [CrossRef] [Scilit]
- di Prampero, P.E.; Botter, A.; Osgnach, C. The energy cost of sprint running and the role of metabolic power in setting top performances. Eur. J. Appl. Physiol. 2015, 115, 451–469. [Google Scholar] [CrossRef] [Scilit] [PubMed]
- Martín-García, A.; Castellano, J.; Méndez Villanueva, A.; Gómez-Díaz, A.; Cos, F.; Casamichana, D. Physical Demands of Ball Possession Games in Relation to the Most Demanding Passages of a Competitive Match. J. Sports Sci. Med. 2020, 19, 1–9. [Google Scholar]
- Kolossa, D.; Bin Azhar, M.A.; Rasche, C.; Endler, S.; Hanakam, F.; Ferrauti, A.; Pfeiffer, M. Performance Estimation using the Fitness-Fatigue Model with Kalman Filter Feedback. Int. J. Comput. Sci. Sport 2017, 16, 105–120. [Google Scholar] [CrossRef] [Scilit]

Disclaimer/Publisher’s Note: The statements, opinions and data contained in all publications are solely those of the individual author(s) and contributor(s) and not of MDPI and/or the editor(s). MDPI and/or the editor(s) disclaim responsibility for any injury to people or property resulting from any ideas, methods, instructions or products referred to in the content. |
© 2025 by the authors. Licensee MDPI, Basel, Switzerland. This article is an open access article distributed under the terms and conditions of the Creative Commons Attribution (CC BY) license (https://creativecommons.org/licenses/by/4.0/).