


Abstract
Background: Sex differences influence venous thromboembolism (VTE) risk and clinical course, but corresponding differences in circulating proteomic profiles among individuals with established VTE remain incompletely characterized. We investigated female–male differences in the MARTHA plasma proteome and evaluated whether the identified signals formed a reproducible multivariable pattern. Methods: We performed a secondary analysis of the MARTHA plasma proteomics dataset, comprising 1388 participants with VTE (906 females and 482 males) and 376 antibody-derived assays targeting 234 candidate proteins. Assay identifiers were mapped to annotated genes and protein targets using the original MARTHA antibody-panel annotation. Sex-associated differential abundance was assessed using limma linear models with empirical Bayes moderation and Benjamini–Hochberg FDR correction, with robustness evaluated using SVA-adjusted limma, Welch’s t-test, Wilcoxon rank-sum testing, and 1000 sex-label permutations. To determine whether the proteomic differences collectively provided reproducible multivariable discrimination between female and male participants, we used repeated nested cross-validation with five outer folds repeated five times and five-fold inner cross-validation for model tuning. Starting from all 376 assays, limma-based FDR feature selection was performed independently within each outer training set. Elastic Net, LASSO, Ridge, Random Forest, and radial SVM models were then trained using the selected proteomic features and evaluated on the corresponding held-out outer test observations. Results: Fifty-five assays met the FDR threshold, with 33 showing higher standardized signal in females and 22 in males. The strongest male-associated signal was RGS18 (HPA028727). Female-minus-Male difference , FDR ; Cohen’s ), whereas the two strongest female-associated assays, Bsi3134 and Bsi0352, both targeted LRG1. Forty-six assays remained significant across all five inferential approaches, indicating substantial cross-method robustness. In the nested machine-learning analysis, subject-level out-of-fold AUCs were similar across model families, ranging from 0.804 for Ridge to 0.814 for radial SVM. Feature-selection stability was also high for a core subset of assays: 29 were selected in at least 80% of the 25 outer training evaluations, including stable signals targeting RGS18, LRG1, CFHR5, and VWF. Conclusions: The MARTHA VTE cohort exhibited a robust, bidirectional sex-associated proteomic pattern distributed across multiple assay signals. Concordance across differential-abundance analyses, complementary robustness testing, nested feature-selection stability, and held-out machine-learning performance supports the presence of a reproducible multivariable sex-associated proteomic signature, although female and male participants were not completely separable at the individual level. These findings require independent replication and should be interpreted in light of the lack of adjustment for important clinical and hormonal covariates.
1. Introduction
Venous thromboembolism (VTE), comprising deep vein thrombosis (DVT) and pulmonary embolism (PE), is a major vascular disease associated with substantial morbidity and mortality [1]. VTE may present as symptomatic DVT with pain and swelling or as acute PE with potentially life-threatening circulatory consequences, and it is also a common complication among hospitalized patients [2,3].
Sex is an important biological and clinical factor in VTE [4]. Women have several sex-specific risk factors, including pregnancy, the postpartum period, and exposure to estrogen-containing oral contraceptives or hormone replacement therapy [5], whereas men have a higher risk of recurrence after an initial VTE event [6]. VTE incidence also varies according to both age and sex. Incidence increases markedly with age [7], and although the overall age-adjusted incidence is somewhat higher in men [8], younger women experience greater risk largely because of reproductive and hormonal exposures [9]. After approximately age 50, incidence becomes consistently higher in men [8]. Other established risk factors include surgery, hospitalization, prolonged immobility, active cancer, and obesity [7].
Sex differences have also been reported in VTE presentation, outcomes, and treatment. Women with PE may be more likely to present with hypotension and right ventricular dysfunction [10], whereas men may more often present with chest pain and hemoptysis [9]. Some studies have reported higher VTE-related mortality among women [11], whereas others found no significant sex differences in recurrent VTE, major bleeding, or all-cause mortality [12]. Men nevertheless appear to have a higher recurrence risk after a first unprovoked VTE event [13], and sex differences in treatment patterns and bleeding outcomes have also been reported [11]. These observations support consideration of sex as a biological variable in VTE research.
Current VTE biomarker and risk-stratification approaches remain limited. D-dimer remains the principal biomarker used in clinical evaluation [14]. Although it has high negative predictive value in appropriate low-probability settings [14], its specificity is limited because elevated levels also occur in conditions such as inflammation, malignancy, and recent surgery [15]. These limitations motivate investigation of broader molecular signatures.
Proteomics provides a high-dimensional approach for characterizing circulating molecular patterns. Both mass spectrometry-based and affinity-based technologies have been applied in thrombosis research [15]. Mass spectrometry enables broad protein profiling [14], and data-independent acquisition approaches have demonstrated reproducibility in biomarker-discovery settings [16]. Plasma proteomics nevertheless remains technically challenging because highly abundant proteins can obscure lower-abundance analytes [17], and some approaches may be difficult to scale to very large cohorts [15].
Affinity-based methods provide a complementary approach for measuring predefined protein sets [15]. Human Protein Atlas-based platforms enable targeted profiling using characterized antibodies [17,18,19,20,21], while other affinity-based technologies include proximity extension assays [15] and aptamer-based platforms such as SomaScan® [22]. Across these technologies, VTE proteomic studies have implicated inflammatory, coagulation, fibrinolytic, complement, and vascular pathways. Mass-spectrometry studies have reported differentially abundant inflammatory proteins [16], whereas large affinity-based studies have identified proteins associated with future VTE risk and highlighted complement and coagulation biology [22]. Collectively, these findings support the view that VTE involves coordinated molecular alterations across multiple biological systems.
Despite this progress, many proposed proteomic biomarkers remain unvalidated, and no proteomic signature has yet replaced or clearly improved current clinical approaches based on pretest probability and D-dimer testing [1,14]. Previous studies have also been limited by relatively small samples, heterogeneous populations, and limited external replication [1,23]. Importantly, sex is often treated only as an adjustment variable rather than examined directly as a source of proteomic variation.
Evidence from general and cardiovascular proteomic studies suggests that this may overlook important biology. Large-scale investigations have identified substantial sexual dimorphism in circulating protein abundance [24]. In the Framingham Heart Study, 61 of 71 cardiovascular-related protein biomarkers differed significantly by sex [25], and another aptamer-based investigation identified 141 proteins with significant sex differences [26]. Women and men also differ in proteins related to inflammation, adiposity, fibrosis, extracellular matrix remodeling, and platelet function [25], with hormonal status contributing to some of these differences [25].
Sex-associated proteomic patterns have likewise been reported in cardiovascular disease [27]. A large study of incident coronary artery disease identified numerous proteins with sex-specific associations with disease risk [28]. These observations provide broader context for investigating sex-associated proteomic variation in VTE, while also emphasizing that such variation is not necessarily specific to thromboembolic disease.
Several analytical strategies can be used to investigate sex-related proteomic patterns, including sex-stratified models, formal interaction tests, and direct comparisons of protein abundance between females and males [25]. For the present study, a direct Female-versus-Male comparison provides a natural first step for determining whether circulating proteomic profiles differ systematically by sex within a VTE cohort.
Relatively little work has directly examined whether women and men with established VTE differ in their plasma proteomic profiles. Important knowledge gaps also remain because clinical factors such as age, body mass index, cancer, inflammatory conditions, medication use, menopausal status, and hormonal exposures may influence circulating proteomic patterns. Recent work has emphasized the potential of plasma proteomics to improve both biological understanding and risk prediction in VTE, although clinical translation remains at an early stage [29].
The present study builds on publicly available plasma proteomic data from the MARTHA cohort. In the proteomics substudy reported by Razzaq et al. [30], plasma samples from 1388 individuals with VTE were profiled using a targeted antibody suspension bead array largely derived from the Human Protein Atlas. The cohort included 1105 individuals with DVT, 95 with isolated PE, and 188 with both DVT and PE. The dataset contains 376 antibody-derived measurements targeting proteins selected for their relevance to coagulation and fibrinolysis, endothelial biology, and cardiovascular disease-related pathways.
The original MARTHA investigation addressed a different question. Razzaq et al. [30] used proteomic and biological variables in an artificial neural network designed to distinguish PE from DVT and subsequently integrated proteomic and genetic information to investigate PE susceptibility. Sex-associated differences in the MARTHA plasma proteome were not the primary focus of that study.
Because the MARTHA proteomics substudy includes only individuals with established VTE, the present analysis cannot determine whether sex-associated proteomic differences are specific to VTE or instead reflect broader biological sex differences that would also be observed among individuals without VTE. Accordingly, the study was designed to characterize sex-associated proteomic variation within an established VTE population rather than to identify VTE-specific effects of sex.
The present study therefore addresses a distinct and complementary question: do women and men with established VTE differ systematically in their plasma proteomic profiles? We performed a secondary analysis of the MARTHA proteomics dataset to characterize sex-associated differences in standardized plasma proteomic signals. Differential-abundance modeling and complementary robustness analyses were used to identify reproducible sex-associated features, while unsupervised multivariate analyses and repeated nested machine-learning classification were used to characterize the multivariable structure and discriminatory information contained in these signals.
Our objective was not to reproduce the original PE-versus-DVT prediction framework or to develop a clinical sex-classification tool. Rather, we sought to determine whether biological sex is associated with a reproducible multivariable plasma proteomic pattern within individuals with established VTE and to prioritize proteomic signals for further biological investigation. A conceptual overview of VTE and the analytical framework of the present study is provided in Figure A1.
2. Materials and Methods
2.1. Data Source and Study Population
This study is a secondary analysis of publicly available plasma proteomics data from the MARTHA proteomics substudy originally reported by Razzaq et al. [30]. The MARTHA cohort includes patients with venous thromboembolism (VTE) recruited through the Thrombophilia Center of La Timone Hospital in Marseille, France [30]. The proteomics substudy included 1388 participants with available plasma samples: 1105 with deep vein thrombosis (DVT), 95 with isolated pulmonary embolism (PE), and 188 with combined DVT and PE [30]. In the publicly released MARTHA dataset [31], VTE phenotype is represented by the variable MTEV1, coded as 1 = DVT, 2 = isolated PE, and 3 = combined DVT and PE.
Plasma proteins were profiled using a multiplex antibody suspension bead array based predominantly on antibodies from the Human Protein Atlas (HPA), together with antibodies from other commercial sources and BioSystems International [30]. The panel comprised 376 antibody-derived measurements targeting 234 candidate proteins selected for their relevance to coagulation and fibrinolysis, endothelial biology, and cardiovascular disease-related pathways. The platform generated relative fluorescence-based assay signals rather than absolute plasma protein concentrations [30].
For biological interpretation, the 376 assay identifiers were mapped to their corresponding Ensembl gene identifiers, gene symbols, and annotated target proteins using the original MARTHA antibody-panel annotation [30]. Because multiple antibody reagents may target the same gene or protein, the 376 assay measurements do not represent 376 unique proteins. Original assay identifiers were retained alongside gene and protein annotations to preserve traceability to the released dataset. The complete assay-to-target mapping is provided in Supplementary Table S3.
The proteomic variables were analyzed on the scale provided in the released MARTHA dataset. Examination of the assay distributions indicated that the measurements were approximately centered at zero and scaled to unit variance; they were therefore treated as standardized relative assay signals. No additional logarithmic transformation, participant-wise median-centering, or other rescaling was applied.
Each participant contributed one processed proteomic profile in the released dataset and was treated as one biological observation. No new participants, biological specimens, or laboratory measurements were collected for the present study. The existing MARTHA data were analyzed for a distinct secondary objective: to characterize sex-associated differences in plasma proteomic profiles among individuals with established VTE.
2.2. Study Design and Analytical Workflow
The analysis was designed to compare plasma proteomic profiles between female and male participants with established VTE and to determine whether the observed sex-associated differences formed a reproducible multivariable pattern. The analysis had three main aims: (1) to identify proteomic assays that differed between females and males, (2) to evaluate the robustness of these findings across complementary statistical approaches, and (3) to assess the stability and multivariable discriminatory information of the sex-associated proteomic signals using repeated nested machine learning.
All statistical analyses were performed using R statistical software (version 4.4.2) within a reproducible analytical workflow. The standardized assay values in the publicly released MARTHA dataset were analyzed directly, without additional logarithmic transformation, participant-wise median-centering, or imputation. Differential abundance was evaluated using feature-wise limma linear models with empirical Bayes moderation and Benjamini–Hochberg false discovery rate (FDR) correction. Robustness was assessed using SVA-adjusted limma, Welch’s two-sample t-test, Wilcoxon rank-sum testing, and 1000 sex-label permutations.
Machine-learning performance was evaluated using repeated nested cross-validation. The procedure began with all 376 proteomic assays. For each outer training set, limma-based FDR feature selection was performed using only the training observations, after which model hyperparameters were tuned using five-fold inner cross-validation. The outer validation procedure consisted of five stratified folds repeated five times, yielding 25 held-out test evaluations. The corresponding outer test observations were not used for feature selection or hyperparameter tuning and were reserved for final performance assessment.
Using the proteomic features selected within each outer training set, Elastic Net, LASSO, Ridge regression, Random Forest, and radial support vector machine models were fitted and evaluated on the corresponding held-out outer test observations. Classification thresholds were selected from inner-cross-validation predictions and then applied to the outer test data. Model performance was summarized using subject-level out-of-fold discrimination and threshold-based classification metrics.
After the nested validation procedure, feature-selection stability and descriptive feature-importance patterns were used to characterize the reproducibility of the multivariable proteomic signal. PCA and UMAP were used separately as descriptive, unsupervised visualizations to examine the multivariate structure of the stable proteomic feature set and the extent of overlap between female and male participants. These analyses were used to visualize broad linear and nonlinear structure, respectively, and were not used for formal inference, feature selection, or predictive-performance estimation. The overall analytical workflow is summarized in Figure 1.
Figure 1.
Study design and analytical workflow for the secondary analysis of the MARTHA plasma proteomics dataset. The released standardized assay values were analyzed directly without additional imputation, logarithmic transformation, or participant-wise median-centering. Differential-abundance and robustness analyses were followed by repeated nested cross-validation. Within each outer training set, feature selection was performed before inner-cross-validation model tuning, and the corresponding held-out outer test observations were reserved for final performance evaluation. Subsequent analyses summarized feature-selection stability, descriptive feature importance, and multivariate structure using PCA and UMAP. The five analytical stages are distinguished by color for visual clarity. In the volcano plot, red points represent assays with higher standardized signals in females, blue points represent assays with higher standardized signals in males, and gray points represent assays not meeting the displayed significance criteria.
2.3. Data Cleaning and Feature Identification
The data were imported from the publicly released comma-separated value file while retaining the original variable names. Non-proteomic variables were excluded from the proteomic feature matrix, including the grouping variable Sex and the VTE phenotype variable MTEV1. The resulting feature matrix contained 376 antibody-derived proteomic measurements, consistent with the MARTHA proteomics dataset reported by Razzaq et al. [30].
As part of data-quality control, the numerical coding of the Sex variable was re-examined after the binary labels were found to have been interpreted in the opposite direction in the initial analysis workflow. The corrected interpretation assigned 0 to Female and 1 to Male. This coding was verified against the sex distribution reported by Razzaq et al. [30]. Table 1 of Razzaq et al. [30] reports 716 females among participants with DVT, 78 among those with isolated PE, and 112 among those with combined DVT and PE, yielding a total of 906 females among the 1388 participants and, consequently, 482 males. The corrected coding reproduced these totals exactly.
As an additional quality-control safeguard, the revised analysis included a programmatic check requiring the expected distribution of 906 females and 482 males before subsequent analyses were allowed to proceed. For statistical modeling, Male was specified as the reference category. Accordingly, the SexFemale coefficient represents the estimated Female-minus-Male difference: positive values indicate higher standardized assay signal in females, whereas negative values indicate higher standardized assay signal in males.
All differential-abundance analyses, robustness analyses, machine-learning procedures, tables, and figures in the revised manuscript were regenerated after the sex-variable coding was verified and corrected.
2.4. Preprocessing and Quality Control
Quality-control checks were performed before statistical analysis to verify the completeness and structure of the released dataset. No missing values were present among the 376 proteomic measurements, the Sex variable, or the VTE phenotype variable MTEV1. Consequently, all 1388 participants and all 376 proteomic features were retained for analysis, and no missing-value imputation was required.
The released MARTHA proteomic measurements were analyzed on the scale provided in the public dataset. As described above, the assay distributions were approximately centered at zero and scaled to unit variance. No additional logarithmic transformation, participant-wise median-centering, or other rescaling was applied. The (p-value) transformation used in the volcano plot was applied only to the statistical significance values for graphical display and was not applied to the proteomic measurements themselves.
Additional quality-control checks confirmed that the verified sex coding reproduced 906 females and 482 males and that the MTEV1 distribution reproduced the expected VTE phenotype counts of 1105 participants with DVT, 95 with isolated PE, and 188 with combined DVT and PE. These checks were used to verify the integrity of the imported data before subsequent statistical and machine-learning analyses.
2.5. Differential Abundance and Robustness Analyses
Sex-associated differences in proteomic measurements were evaluated primarily using feature-wise linear models implemented in limma with empirical Bayes moderation [32]. This framework estimates the sex effect separately for each proteomic feature while borrowing information across features to stabilize variance estimates, making it well suited to simultaneous analysis of many molecular measurements. Male was used as the reference category, so the SexFemale coefficient represents the estimated Female-minus-Male difference in standardized assay signal. Because no additional logarithmic transformation was applied, these coefficients are reported as effect estimates rather than literal log2 fold changes.
The primary differential-abundance models evaluated the unadjusted association between biological sex and each proteomic assay. Age, body mass index, VTE phenotype, menopausal status, oral-contraceptive or hormone-therapy exposure, anticoagulant treatment, smoking, cancer, inflammatory conditions, and other clinical covariates were not included. Accordingly, the reported associations should not be interpreted as effects independent of these potentially correlated clinical factors.
Raw p-values were adjusted using the Benjamini–Hochberg false discovery rate (FDR) procedure [33], with FDR-adjusted p-values below 0.05 considered statistically significant. Effect magnitude was additionally summarized using the Female-minus-Male standardized difference and Cohen’s d. To evaluate the robustness of the primary findings, four complementary analyses were performed in addition to the primary limma model.
First, surrogate variable analysis (SVA) was used to estimate latent sources of unwanted variation not explicitly represented by the observed sex variable [34]. The sex effect was protected in the full model while surrogate variables were estimated relative to an intercept-only null model. One surrogate variable was identified and included as an additional adjustment term in the feature-wise limma models. This analysis assessed whether the observed sex-associated signals remained after accounting for potentially unmeasured technical or biological variation.
Second, Welch’s two-sample t-test was applied independently to each proteomic feature as a conventional comparison of female and male mean standardized assay signal. Welch’s test was used because it does not require equal variances between groups.
Third, the Wilcoxon rank-sum test was applied independently to each proteomic feature as a nonparametric comparison between females and males. Because it is rank-based, it provided a complementary assessment that was less dependent on distributional assumptions.
Finally, empirical significance was evaluated using 1000 random permutations of the sex labels while the proteomic measurements remained fixed. For each permutation, the feature-wise limma model was refitted. For each feature, a two-sided empirical permutation p-value was calculated from the proportion of permuted absolute moderated t-statistics at least as large as the observed absolute moderated t-statistic, using a correction in both the numerator and denominator. The resulting permutation p-values were adjusted using the Benjamini–Hochberg FDR procedure.
For each proteomic feature, robustness was summarized across five inferential approaches: primary limma, SVA-adjusted limma, Welch’s two-sample t-test, Wilcoxon rank-sum test, and permutation-based inference. Significance for each method was defined using an FDR threshold of 0.05. Concordance across these approaches was interpreted as stronger internal evidence that a sex-associated difference was not dependent on a single inferential framework.
2.6. Machine-Learning Analysis
Five classification models representing different modeling families were evaluated: Random Forest [35], Elastic Net, LASSO, and Ridge logistic regression [36], and a Support Vector Machine with a radial basis kernel [37]. Evaluating several model families allowed us to assess whether the multivariable discriminatory signal was reproducible across different modeling assumptions rather than being dependent on a single algorithm. Similar multi-model strategies have been used in high-dimensional molecular screening applications [38].
To minimize information leakage, model development was performed using repeated nested cross-validation. The outer resampling scheme consisted of five stratified folds repeated five times, yielding 25 outer training/test evaluations. Within each outer training set, differential-abundance analysis was repeated using limma, and proteomic features with FDR were retained as candidate predictors for that outer split. The corresponding outer test fold was not used during feature selection.
Hyperparameter tuning was then performed within each outer training set using five-fold inner cross-validation. Predictors were centered and scaled within the modeling procedure. Elastic Net models were tuned over combinations of the mixing parameter and regularization parameter , whereas LASSO and Ridge models used and , respectively, with selected by inner cross-validation. Random Forest models were tuned over the number of variables considered at each split, and radial Support Vector Machines were tuned over kernel-width and cost parameters.
Female was defined as the positive classification class. Predictive performance was evaluated on the held-out outer test folds using area under the receiver operating characteristic curve (AUC), accuracy, sensitivity, specificity, balanced accuracy, and Cohen’s kappa. Under this coding, sensitivity represents the proportion of female participants correctly classified, whereas specificity represents the proportion of male participants correctly classified.
Because females represented a larger proportion of the cohort, threshold-based performance was evaluated using classification thresholds selected from the inner cross-validation predictions. For each outer split, the threshold maximizing Youden’s index was determined using only inner-training predictions and was then applied to the corresponding held-out outer test observations. This procedure allowed threshold adjustment without using information from the outer test data.
Feature-selection stability was assessed across the 25 outer training evaluations. For each proteomic feature, selection frequency was defined as the proportion of outer training sets in which the feature satisfied the limma FDR criterion. This provided a measure of how consistently each feature was recovered across resampled training datasets.
For subject-level performance summaries, repeated out-of-fold predicted probabilities were averaged across outer repeats to obtain one out-of-fold probability per participant for each model. These subject-level predictions were used to estimate AUCs and corresponding 95% confidence intervals. Thus, all reported machine-learning performance estimates were derived from predictions generated for observations that were held out from both feature selection and model tuning.
2.7. Feature Importance and Visualization
Variable importance was examined to identify proteomic features that contributed most strongly to sex classification. Because penalized regression, Random Forest, and Support Vector Machine models have different mathematical structures and quantify predictor contribution differently, their raw importance values are not directly comparable across model families [35,36,37]. Accordingly, model-specific importance values were min–max normalized to the interval within each model, with values closer to 1 indicating greater relative importance within that model.
For descriptive feature-prioritization analyses, models were fit using the stable proteomic features identified through the repeated nested cross-validation procedure. These models were used only to summarize relative feature importance and were not used to estimate predictive performance. For each feature, a consensus importance score was calculated as the mean of its normalized importance values across the available model families. This summary was used to identify features that were repeatedly prioritized across different modeling approaches rather than relying on the ranking from a single algorithm. Combining information across multiple models can be useful in high-dimensional molecular screening because different algorithms may prioritize predictors differently even when their overall predictive performance is similar [38]. The consensus importance score was interpreted as a descriptive measure of cross-model agreement and not as a statistical significance measure or evidence of biological causality.
For the penalized logistic-regression models, regression coefficients were also examined to describe the direction and relative magnitude of each feature’s contribution within the fitted multivariable models [36]. Female was coded as the positive outcome; therefore, positive coefficients indicate contributions toward a higher predicted probability of Female classification, whereas negative coefficients indicate contributions toward a higher predicted probability of Male classification. These coefficients represent conditional multivariable contributions and were interpreted separately from the marginal Female-minus-Male effect estimates obtained from the differential-abundance analysis.
Principal component analysis (PCA) and Uniform Manifold Approximation and Projection (UMAP) were used as complementary unsupervised visualization approaches to examine multivariate structure among the stable proteomic features. PCA provides a linear low-dimensional representation based on orthogonal directions that explain progressively smaller proportions of total variance [39], whereas UMAP provides a nonlinear representation designed to preserve local neighborhood relationships among observations [40]. Their complementary use allowed both broad linear structure and potentially nonlinear local organization to be examined. Previous comparative work has similarly emphasized the value of considering both linear and nonlinear representations when exploring high-dimensional data [41,42]. Both PCA and UMAP were used only for descriptive visualization and were not used for feature selection, model tuning, predictive-performance estimation, or formal hypothesis testing.
Additional visualizations were used to summarize the principal statistical and machine-learning findings. The volcano plot displayed Female-minus-Male standardized assay differences together with statistical significance. Feature-selection stability was visualized across the 25 outer training evaluations from the repeated nested cross-validation procedure. Model-specific importance plots and a cross-model importance heatmap were used to assess whether the same stable features were repeatedly prioritized across model families, while penalized-regression coefficient plots displayed the direction of multivariable feature contributions.
Predictive performance was summarized separately from descriptive feature- prioritization analyses. Model-specific receiver operating characteristic (ROC) curves and corresponding AUC values were derived from subject-level out-of-fold predictions. Sensitivity, specificity, and balanced accuracy were additionally summarized using classification thresholds selected from inner-cross-validation predictions and subsequently applied to the corresponding held-out outer test observations. This separation ensured that descriptive importance and visualization analyses were not conflated with held-out model-performance evaluation.
All statistical analyses, machine-learning procedures, and visualizations were performed in R. The principal packages used included limma, sva, caret, glmnet, randomForest, kernlab, pROC, uwot, and ggplot2. A random seed of 123 was used where applicable to support reproducibility.
3. Results
3.1. Study Cohort and Data Processing
The final analytical dataset included 1388 participants from the MARTHA proteomics substudy, comprising 906 females (65.3%) and 482 males (34.7%), with 376 antibody-derived proteomic features available for analysis [30]. The VTE phenotype distribution comprised 1105 participants with DVT, 95 with isolated PE, and 188 with combined DVT and PE. No missing values were present in the proteomic matrix, Sex, or MTEV1; consequently, all participants and all 376 proteomic features were retained for analysis. Gene and protein annotations for the assay identifiers are provided in Supplementary Table S3.
Quality-control checks confirmed that the released proteomic variables were approximately centered at zero and scaled to unit variance. The released standardized assay values were therefore analyzed directly, without additional imputation, logarithmic transformation, participant-wise median-centering, or other rescaling.
Table 1 summarizes the analytical dataset, quality-control findings, and principal statistical analysis settings used in the revised analysis.
Table 1.
Summary of the analytical dataset, preprocessing decisions, and statistical analysis framework.
3.2. Exploratory Multivariate Structure
Principal component analysis (PCA) and Uniform Manifold Approximation and Projection (UMAP) were used to examine the multivariate structure of the 29 stable proteomic features identified through the repeated nested cross-validation procedure.
In the PCA, the first two principal components explained 22.1% and 12.6% of the total variance, respectively. Female and male participants showed substantial overlap across the first two principal components, although the group centroids were modestly separated (Figure A2). This overlap indicates that the stable proteomic features did not produce two clearly separated sex-specific clusters in the dominant linear dimensions of variation.
The UMAP representation provided a complementary nonlinear visualization of the same stable feature set (Figure A3). Female and male participants again showed substantial overlap, with no evidence of two clearly separated sex-specific clusters. Thus, the absence of strong separation was observed under both linear and nonlinear low-dimensional representations.
These findings are not inconsistent with the differential-abundance or supervised machine-learning results. PCA and UMAP are unsupervised methods and do not use sex labels to construct the low-dimensional representations. Their purpose here was to visualize overall multivariate structure rather than to maximize separation between females and males or to provide a formal test of a sex effect. Statistically significant and reproducible group-level differences across multiple proteomic features can therefore coexist with substantial participant-level overlap in unsupervised low-dimensional space.
Accordingly, PCA and UMAP were interpreted only as descriptive visualizations of the multivariate structure of the stable feature set. Evidence for sex-associated proteomic differences was derived instead from the differential-abundance analyses, cross-method robustness assessments, nested feature-selection stability, and held-out supervised machine-learning performance.
3.3. Differential Abundance and Robustness Across Methods
The primary limma analysis identified 55 of the 376 proteomic features (14.6%) as significantly associated with sex after Benjamini–Hochberg correction. Of these, 33 showed higher standardized assay signal in females and 22 showed higher standardized assay signal in males. Thus, the significant findings were distributed in both directions rather than reflecting a generalized shift toward higher assay signal in one sex. Complete differential-abundance and robustness results for all 376 proteomic features are provided in Supplementary Table S1.
The overall pattern of differential abundance is shown in Figure 2. Positive Female-minus-Male effect estimates indicate higher standardized assay signal in females, whereas negative estimates indicate higher standardized assay signal in males. The vertical axis represents from the primary limma analysis, while point color identifies features meeting the Benjamini–Hochberg FDR criterion.
Figure 2.
Sex-associated differences in standardized MARTHA assay signals. The horizontal axis represents the Female-minus-Male difference in standardized assay signal from the primary limma analysis; positive values indicate higher signal in females and negative values indicate higher signal in males. The vertical axis shows from the primary limma model. Pink and blue points indicate assays with significantly higher signal in females and males, respectively, after Benjamini–Hochberg FDR correction (FDR ); gray points did not meet the FDR criterion. The vertical dashed line marks a Female-minus-Male difference of zero, and the horizontal dotted line indicates the nominal level. Selected leading associations are labeled by assay identifier.
Figure 2 shows a bidirectional pattern of sex-associated proteomic differences, with FDR-significant assays occurring on both sides of the zero-effect line. Most features were concentrated near zero and were not FDR-significant, whereas a smaller set showed reproducible differences of greater magnitude. The most prominent signals occurred at both extremes of the distribution, indicating that the observed sex association was not driven exclusively by features with higher signal in either females or males. Although more FDR-significant assays showed higher signal in females than in males (33 versus 22), the leading effect magnitudes were comparable in the two directions.
The strongest male-associated signal was HPA028727 (RGS18), with a Female-minus-Male standardized difference of (FDR ; Cohen’s ). The strongest female-associated signals were Bsi3134 and Bsi0352, both targeting LRG1, with standardized differences of 0.507 and 0.486, respectively, corresponding to Cohen’s d values of 0.522 and 0.499. Table 2 and Table 3 summarize the leading FDR-ranked features in each direction. Pink and blue indicate female- and male-associated results, respectively.
Table 2.
Leading female-associated proteomic assays from the primary differential-abundance analysis.
Table 3.
Leading male-associated proteomic assays from the primary differential-abundance analysis.
As shown in Table 2, the strongest female-associated signals were the two assays targeting leucine-rich alpha-2-glycoprotein 1 (LRG1; Bsi3134 and Bsi0352), with Female-minus-Male standardized differences of 0.507 and 0.486, respectively. The remaining leading female-associated assays showed smaller positive effects. All six assays were significant across all five inferential approaches, indicating strong cross-method robustness among the highest-ranked female-associated signals.
As shown in Table 3, RGS18 (HPA028727) was the strongest male-associated signal and had the largest absolute standardized effect among the leading assays. Other prominent male-associated targets included VWF, CFHR5, ENG, and SERPINA5. All six leading male-associated assays were significant across all five inferential approaches.
The robustness analyses showed substantial agreement across complementary statistical procedures. As summarized in Table 4, the primary limma analysis identified 55 FDR-significant assays, compared with 92 using SVA-adjusted limma, 60 using Welch’s two-sample t-test, 141 using the Wilcoxon rank-sum test, and 49 using permutation-based inference based on 1000 sex-label permutations. Forty-six assays were significant across all five inferential approaches.
Table 4.
Summary of differential-abundance robustness analyses.
The cross-method concordance indicates that a substantial core of the sex-associated proteomic signals was not dependent on a single inferential framework. In particular, 46 of the 55 assays identified by the primary limma analysis remained significant across all five approaches. The larger number of significant assays identified by some methods, particularly the Wilcoxon rank-sum test and SVA-adjusted limma, likely reflects differences in distributional assumptions, variance estimation, and sensitivity to latent or non-normal sources of variation rather than simple disagreement among methods.
Because the assay identifiers have now been mapped to their annotated gene and protein targets using the original MARTHA antibody-panel annotation, the leading signals can be discussed in biological context. Nevertheless, the robustness analyses establish reproducibility of the statistical associations rather than biological mechanism or causality. The mapped targets are therefore interpreted as biologically relevant candidate signals that require independent validation and further mechanistic investigation.
Table 5 summarizes the ten strongest sex-associated proteomic signals across both directions. Rows are ordered by the absolute magnitude of the Female-minus-Male standardized difference.
Table 5.
Leading sex-associated proteomic assays from the primary differential-abundance analysis.
As shown in Table 5, the strongest associations were distributed in both directions. Six of the ten leading assays showed higher standardized signal in males and four showed higher signal in females. The three largest absolute effects comprised the male-associated RGS18 assay (HPA028727) and two female-associated assays targeting LRG1 (Bsi3134 and Bsi0352). Together, these findings support a bidirectional, multifeature sex-associated proteomic pattern rather than a generalized increase in assay signal in either sex.
Although several associations had extremely small FDR-adjusted p-values, their standardized effect sizes were moderate rather than extreme. Given the sample size of 1388 participants, consistent differences of moderate magnitude can produce very small p-values. Statistical significance was therefore interpreted together with effect magnitude and cross-method robustness.
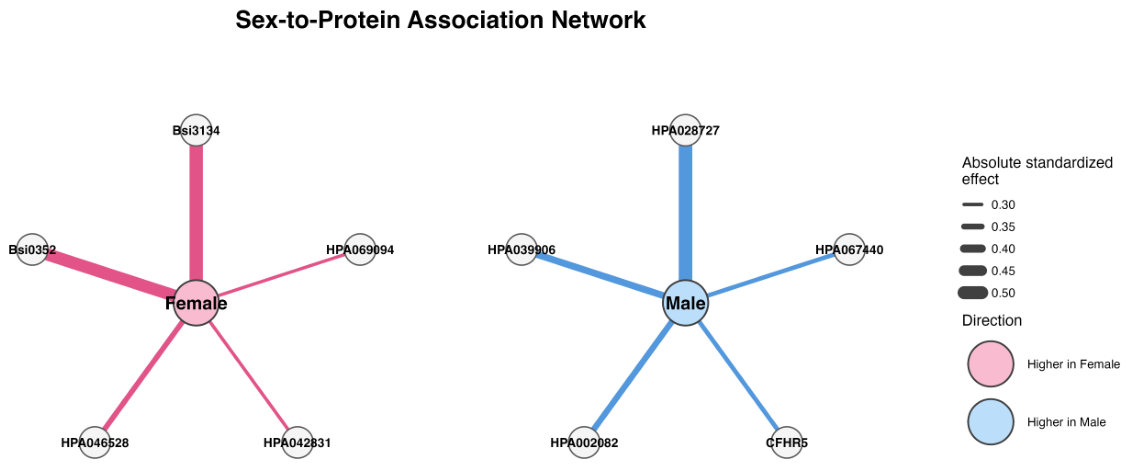
A complementary network visualization of selected leading female- and male-associated signals is provided in Figure A7. The network illustrates the direction and relative magnitude of these associations.
3.4. Machine-Learning Classification Performance
Predictive performance was evaluated using the repeated nested cross-validation procedure described above, with feature selection and hyperparameter tuning restricted to the outer training data. Five model families were evaluated: Elastic Net, LASSO, Ridge regression, Random Forest, and radial Support Vector Machine (SVM).
Subject-level out-of-fold discrimination was similar across the five models (Figure 3). AUC estimates ranged from 0.804 for Ridge regression to 0.814 for radial SVM, with Elastic Net, LASSO, and Random Forest yielding AUCs of 0.807, 0.808, and 0.809, respectively. The corresponding 95% confidence intervals showed substantial overlap, indicating no clear performance advantage for any single model family.
Figure 3.
Nested cross-validated discrimination across the five machine-learning models. Model-specific receiver operating characteristic (ROC) curves are based on subject-level out-of-fold predicted probabilities obtained from repeated nested cross-validation. The AUC summary shows point estimates and 95% DeLong confidence intervals. Feature selection and hyperparameter tuning were performed using the outer training data, and the corresponding held-out outer test observations were reserved for performance evaluation.
The ROC results therefore indicate moderate discrimination of female and male participants across all five model families rather than strong superiority of a particular algorithm. The relatively narrow range of AUC estimates further suggests that the observed discriminatory information was not strongly dependent on model choice.
Threshold-based classification performance is summarized in Figure 4. Classification thresholds were selected from inner-cross-validation predictions and subsequently applied to the corresponding held-out outer test observations. Balanced accuracy ranged from approximately 0.72 to 0.74 across models. Elastic Net showed the highest balanced accuracy, approximately 0.74, whereas Random Forest showed the lowest, approximately 0.72.
Figure 4.
Nested cross-validated threshold-based classification performance across the five machine-learning models. Points represent mean balanced accuracy, sensitivity, and specificity across the 25 outer validation evaluations, and error bars represent 95% confidence intervals. Classification thresholds were selected using inner-cross-validation predictions only and then applied to the corresponding held-out outer test observations. Female was treated as the positive class.
Sensitivity and specificity were of broadly similar magnitude, although some model-specific differences were evident. LASSO showed somewhat higher sensitivity than specificity, whereas Random Forest showed the opposite pattern, with lower sensitivity and higher specificity. Elastic Net produced the most similar sensitivity and specificity estimates. Overall, the threshold-based results suggest that classification performance was not driven solely by the larger female group, although substantial individual-level misclassification remained.
Complete model-specific performance estimates, including 95% confidence intervals for AUC, sensitivity, specificity, and balanced accuracy, are provided in Appendix A.2. Complete hyperparameter-tuning results across the 25 outer training evaluations are provided in Supplementary Table S2.
Taken together, the nested cross-validation results support an internally reproducible multivariable sex-associated proteomic signal, while the small differences among model families do not justify emphasizing any single algorithm. At the same time, the moderate AUC and balanced-accuracy values and the remaining classification errors indicate substantial overlap between female and male participants at the individual level.
3.5. Stable Machine-Learning Features and Model Interpretation
Feature-selection stability was assessed across the 25 outer training evaluations from the repeated nested cross-validation procedure. Twenty-nine proteomic assays were selected in at least 80% of the outer training sets, including 19 selected in all 25 evaluations. These results indicate that a substantial core of sex-associated features was repeatedly recovered despite variation in the training samples. Selection frequencies are summarized in Figure A4.
Consensus machine-learning importance values for the 29 stable features, together with their selection frequencies and direction of association, are reported in Table A3. These importance values provide a descriptive measure of cross-model feature prioritization and should not be interpreted as statistical significance. Model-specific and cross-model importance patterns are additionally shown in Figure A5 and Figure A6.
To further characterize the multivariable contribution of the stable feature set, standardized coefficients from Elastic Net, LASSO, and Ridge logistic regression models were examined. Female was coded as the positive outcome; therefore, positive coefficients indicate contributions toward Female classification, whereas negative coefficients indicate contributions toward Male classification. Figure 5 shows the direction and relative magnitude of these coefficients across the three penalized regression models.
Figure 5.
Standardized penalized-regression coefficients for selected stable sex-associated proteomic features. Female was coded as the positive classification outcome. Positive coefficients indicate contributions toward Female classification, whereas negative coefficients indicate contributions toward Male classification. Coefficients are shown separately for Elastic Net, LASSO, and Ridge logistic-regression models.
As shown in Figure 5, the coefficient patterns were broadly consistent across the three regularization approaches. In particular, Bsi3134 and Bsi0352 contributed toward Female classification across all three models, whereas HPA028727, CFHR5, and HPA002082 consistently contributed toward Male classification. This directional agreement indicates that several leading features played similar multivariable roles across different forms of penalization.
The penalized-regression coefficients should not be interpreted as equivalent to the Female-minus-Male effects from the differential-abundance analysis. The latter represent marginal differences in individual assay signals, whereas penalized-regression coefficients represent conditional contributions to classification in the presence of the other predictors. Correlation among proteomic features and regularization can therefore alter the magnitude and, in some cases, the direction of individual coefficients.
Taken together, nested feature-selection stability, cross-model importance, and penalized-regression coefficients support a distributed multifeature classification pattern rather than dependence on a single assay. These quantities describe statistical behavior within the present dataset and modeling framework and do not establish causal effects or clinically validated biomarkers. Independent biological validation and external replication are required before clinical interpretation.
3.6. Overall Interpretation of the Results
Across the complementary analyses, a consistent pattern emerged. The differential-abundance results identified sex-associated proteomic differences in both directions, and the robustness analyses showed that a substantial core of these associations was supported across multiple inferential frameworks. The corresponding effect sizes were generally moderate rather than extreme, indicating distributed differences across multiple assay signals rather than a small number of exceptionally large effects.
The unsupervised visualizations provided a complementary view of this pattern. Both PCA and UMAP showed substantial overlap between female and male participants, although the group centroids were modestly displaced (Figure A2 and Figure A3). The individual observations were nevertheless extensively intermixed, and neither method revealed clearly separated sex-specific clusters. These findings suggest that the sex-associated proteomic differences reflect modest shifts in multivariate location within a background of substantial participant-level heterogeneity, rather than two distinct molecular profiles. This interpretation is consistent with the supervised analyses, which demonstrated moderate discrimination but not complete individual-level separation between female and male participants (Figure 3 and Figure 4).
The repeated nested cross-validation analyses further showed that the multivariable signal was not dependent on a single model family or a single partition of the data. A stable subset of proteomic features was repeatedly selected across outer training samples, and several leading features showed similar directional contributions across the penalized-regression models (Figure 5). Together, these results support a distributed multifeature sex-associated proteomic pattern rather than dependence on a single assay or modeling approach.
The identified features should nevertheless be interpreted as statistically prioritized signals rather than validated biomarkers or causal biological determinants. Assay identifiers were mapped to annotated gene and protein targets using the original MARTHA antibody-panel annotation, enabling biological contextualization of the leading signals; however, these annotations do not by themselves establish mechanism or clinical utility.
The revised nested cross-validation framework was designed to reduce optimism from feature-selection and tuning procedures by restricting these steps to training data and reserving the corresponding outer test observations for performance evaluation. The resulting estimates therefore provide a more rigorous assessment of internal predictive performance, but external validation in an independent cohort remains necessary to establish generalizability.
4. Discussion
This secondary analysis of the MARTHA plasma proteomics dataset identified a reproducible, bidirectional pattern of sex-associated proteomic variation among individuals with established VTE. The strongest male-associated signal mapped to RGS18, whereas the strongest female-associated signals were two assays targeting LRG1. Other prominent targets included VWF, CFHR5, PROCR, ENG, and SERPINA5. Importantly, the findings were not driven by a single assay or statistical procedure; rather, they reflected a broader pattern of moderate differences distributed across multiple proteomic features.
Previous studies have demonstrated substantial sex-associated variation in the circulating proteome in healthy, population-based, and cardiovascular cohorts [24,25,26,27,28]. The present study addresses a distinct question by examining whether such differences are also detectable and reproducible within a cohort composed entirely of individuals with established VTE. Because the MARTHA proteomics substudy does not include a non-VTE comparison group, the present findings cannot determine whether the observed female–male differences are specific to VTE or instead reflect broader biological sex differences that would also be present in individuals without VTE. The results should therefore be interpreted as sex-associated proteomic variation within a VTE population.
Direct comparison with prior sex-proteomics studies also requires caution because the study populations, proteomic platforms, protein coverage, disease settings, and statistical definitions of sex-specific association differ substantially. For example, Sier et al. [28] recently reported sex-specific plasma-proteomic associations with incident coronary artery disease in the UK Biobank, with prominent targets including CDKN2D, MYH9, SKAP2, and CTSH. These are not the principal targets highlighted in the present MARTHA analysis, in which the leading signals included RGS18, LRG1, CFHR5, VWF, PROCR, ENG, and SERPINA5. This difference should not be interpreted as evidence of complete non-overlap, because a formal cross-platform comparison of the full protein sets was not performed. Rather, the prior literature provides important context showing that sex-associated proteomic variation is not unique to VTE. Studies including appropriately matched female and male participants both with and without VTE will be needed to test sex-by-VTE-status interactions and determine whether individual proteomic differences represent general sex-associated variation or signals specifically modified by VTE.
Several of the leading mapped targets are biologically relevant to pathways previously implicated in thrombosis and vascular biology. Prior proteomic studies of VTE have highlighted coagulation, complement, inflammatory, endothelial, and vascular-remodeling pathways [15,22]. Within the present analysis, signals involving VWF, CFHR5, PROCR, ENG, and SERPINA5 are consistent with biological processes related to hemostasis, complement regulation, and endothelial function [43,44,45,46,47,48,49,50,51,52]. RGS18 is also of interest because of its relationship to platelet signaling [53,54], whereas LRG1 has been linked to inflammatory and vascular processes [55]. Heat shock proteins provide additional context for interpreting proteomic findings, as they participate in cellular responses to physiological stress [56] and have been investigated in cancer-related biological processes [57]. These observations provide biological context for the statistical findings but remain hypothesis-generating because the present analysis does not establish mechanism or causality.
The robustness analyses further support the internal consistency of the identified signals. A large core of associations remained significant across multiple inferential approaches with different distributional assumptions and variance-estimation strategies. This agreement suggests that the principal sex-associated signals were not artifacts of a single statistical framework. At the same time, the standardized effect sizes were generally moderate, despite some very small FDR-adjusted p-values. Thus, the findings are better interpreted as a coordinated pattern of modest differences across multiple features than as a small number of exceptionally large molecular effects.
The unsupervised and supervised analyses provided complementary perspectives on this multivariate pattern. PCA and UMAP showed substantial overlap between female and male participants, with only modest displacement of the group centroids and no clearly separated sex-specific clusters. In contrast, the supervised models achieved moderate discrimination across several algorithmic families. These findings are not contradictory. PCA and UMAP summarize multivariate structure without using sex labels, whereas the supervised models explicitly evaluate whether combinations of proteomic features contain information relevant to sex classification. Together, the results indicate that sex-associated proteomic differences are collectively informative while remaining embedded within substantial inter-individual heterogeneity.
Feature-selection stability provided additional evidence that the multivariable signal was not dependent on a single resampling split. A core subset of assays was repeatedly selected across outer training samples, and several leading differential-abundance signals showed consistent directional contributions across the penalized-regression models. This agreement among marginal association, resampling stability, and multivariable model behavior supports a distributed multifeature pattern rather than dependence on a single marker.
Biological interpretation was based on assay-to-gene and assay-to-protein annotations reported for the original MARTHA antibody panel [30]. Because these measurements were generated using a targeted antibody suspension bead array and represent relative fluorescence-based assay signals rather than absolute protein concentrations, the identified associations should be interpreted as target-associated proteomic signals. The platform also does not resolve specific proteoforms arising from alternative splicing, post-translational modification, proteolytic processing, or other sources of molecular heterogeneity. Future studies using more molecularly resolved proteomic technologies may therefore help clarify the specific protein forms underlying the observed associations.
The machine-learning analyses were not intended to develop a clinical tool for determining sex, which is already known. Their purpose was to test whether the observed proteomic differences formed a reproducible multivariable pattern. The revised nested cross-validation framework restricted feature selection, hyperparameter tuning, and classification-threshold selection to training data, while reserving the corresponding outer test observations for performance evaluation. This design provides a more rigorous estimate of internal predictive performance than the original exploratory workflow. Nevertheless, all predictive estimates remain internally validated within a single cohort, and external validation is required before generalizability can be established.
Several limitations should be considered. First, the study was cross-sectional and included only individuals with established VTE; therefore, causal interpretation and VTE specificity cannot be established. Second, the primary differential-abundance models were not adjusted for important clinical and hormonal factors such as age, body mass index, VTE phenotype, menopausal status, hormonal exposures, anticoagulant treatment, smoking, cancer, and inflammatory conditions. Residual confounding is therefore possible. Third, the publicly released proteomic variables were analyzed on their supplied standardized scale, so the reported limma coefficients represent Female-minus-Male differences in standardized assay signal rather than literal log2 fold changes. Finally, the study lacks external validation and independent biological confirmation of the prioritized targets.
Future work should focus on independent replication, multivariable adjustment for clinical and hormonal characteristics, and comparison of proteomics-only, clinical-only, and combined clinical–proteomic models. Studies that include appropriately matched participants with and without VTE will be particularly important for determining whether specific sex-associated proteomic differences are modified by VTE status. Pathway-level, network-based, and more molecularly resolved proteomic analyses may also help determine whether the observed signals converge on shared biological processes.
Overall, the findings support a reproducible but heterogeneous sex-associated proteomic pattern within the MARTHA VTE cohort. The identified differences are distributed across multiple assays, are supported by complementary statistical and machine-learning analyses, and provide moderate multivariable discrimination without producing complete female–male separation. Mapping of the leading signals to biologically relevant targets improves their interpretability, but independent replication, clinical and hormonal adjustment, and biological validation remain necessary before their broader biological or clinical significance can be established.
5. Conclusions
This secondary analysis of the MARTHA plasma proteomics dataset identified a reproducible, bidirectional pattern of sex-associated proteomic variation among individuals with established VTE. The findings were supported across complementary differential-abundance analyses and by repeated nested machine-learning procedures, indicating that the observed signal was distributed across multiple proteomic features rather than driven by a single assay or modeling approach.
The supervised analyses demonstrated consistent multivariable discrimination across several model families, while feature-selection stability supported the presence of a persistent multifeature signal across resampled training datasets. Together, these findings indicate that the observed sex-associated proteomic pattern was not dependent on a single algorithm or a single partition of the data.
These results highlight the importance of considering sex as a biological variable in VTE proteomic research while also demonstrating substantial overlap between female and male proteomic profiles at the individual level. The identified assays should therefore be interpreted as statistically prioritized sex-associated proteomic signals rather than clinically validated biomarkers or causal biological determinants.
The revised nested cross-validation framework provides a rigorous estimate of internal predictive performance by separating feature selection, model tuning, and threshold optimization from held-out test evaluation. Nevertheless, external validation, adjustment for relevant clinical and hormonal characteristics, and independent biological confirmation of the mapped protein targets will be necessary to establish the broader biological and clinical significance of these findings.
Supplementary Materials
The following supporting information can be downloaded at: https://www.mdpi.com/article/10.3390/proteomes14040055/s1.
Author Contributions
Conceptualization, M.Z. and M.S.; methodology, M.Z.; formal analysis, M.S.; software, M.Z.; data curation, M.Z.; visualization, M.Z.; writing—original draft preparation, M.Z. and P.K.T.; writing—review and editing, M.S.; literature review, P.K.T.; supervision, M.Z.; project administration, M.Z. All authors have read and agreed to the published version of the manuscript.
Funding
This research received no external funding.
Institutional Review Board Statement
The present study is a secondary analysis of publicly available MARTHA plasma proteomics data [31] and involved no new participant recruitment, intervention, or biological specimen collection. The original MARTHA study was conducted in accordance with the Declaration of Helsinki and received approval from the relevant institutional ethics committees, as reported by Razzaq et al. [30].
Data Availability Statement
The plasma proteomics dataset analyzed in this study was originally generated in the MARTHA proteomics substudy reported by Razzaq et al. [30] and is publicly available through Zenodo at https://zenodo.org/record/4280776 (accessed on 30 August 2026). The present study represents a secondary analysis of these publicly available data. The R code used for data preprocessing, statistical analysis, machine-learning model fitting, and figure generation is provided as Supplementary Material accompanying this article.
Acknowledgments
This work benefited from resources and collaborative engagement provided by the Statistical Consulting Lab (SCL), Department of Mathematics and Statistics, East Tennessee State University (https://www.etsu.edu/cas/math/statistical_consulting_labs_scl.php (accessed on 30 August 2026)). The authors gratefully acknowledge the lab’s infrastructure and collaborative environment that supported computational analysis and methodological development. The authors declare that no generative artificial intelligence or large-language model tools were employed for drafting, data analysis, or figure generation in this work.
Conflicts of Interest
The authors declare no conflicts of interest.
Abbreviations
The following abbreviations are used in this manuscript:
| AUC | Area Under the Receiver Operating Characteristic Curve |
| BH | Benjamini–Hochberg |
| CI | Confidence Interval |
| CV | Cross-Validation |
| DA | Differential Abundance |
| DVT | Deep Vein Thrombosis |
| EB | Empirical Bayes |
| EN | Elastic Net |
| FDR | False Discovery Rate |
| FPR | False Positive Rate |
| LASSO | Least Absolute Shrinkage and Selection Operator |
| ML | Machine Learning |
| PC | Principal Component |
| PCA | Principal Component Analysis |
| PE | Pulmonary Embolism |
| QC | Quality Control |
| RF | Random Forest |
| ROC | Receiver Operating Characteristic |
| SVA | Surrogate Variable Analysis |
| SVM | Support Vector Machine |
| TPR | True Positive Rate |
| UMAP | Uniform Manifold Approximation and Projection |
| VTE | Venous Thromboembolism |
Appendix A. Additional Results
The Supplementary Materials provides the complete differential-abundance results, additional visualizations of feature-selection stability and machine-learning feature importance, and a summary of nested cross-validated classification performance.
Appendix A.1. Feature-Importance and Association Figures
Figure A1.
Conceptual overview of venous thromboembolism and the analytical framework used in the present study. The upper panel summarizes major VTE risk factors, key pathophysiologic mechanisms, development of deep vein thrombosis (DVT), embolization, pulmonary embolism (PE), and major clinical consequences. The lower panel summarizes the present analytical framework, in which plasma proteomic measurements from individuals with VTE were compared between females and males using differential-abundance analysis, robustness analyses, dimensionality-reduction methods, and nested machine-learning classification.
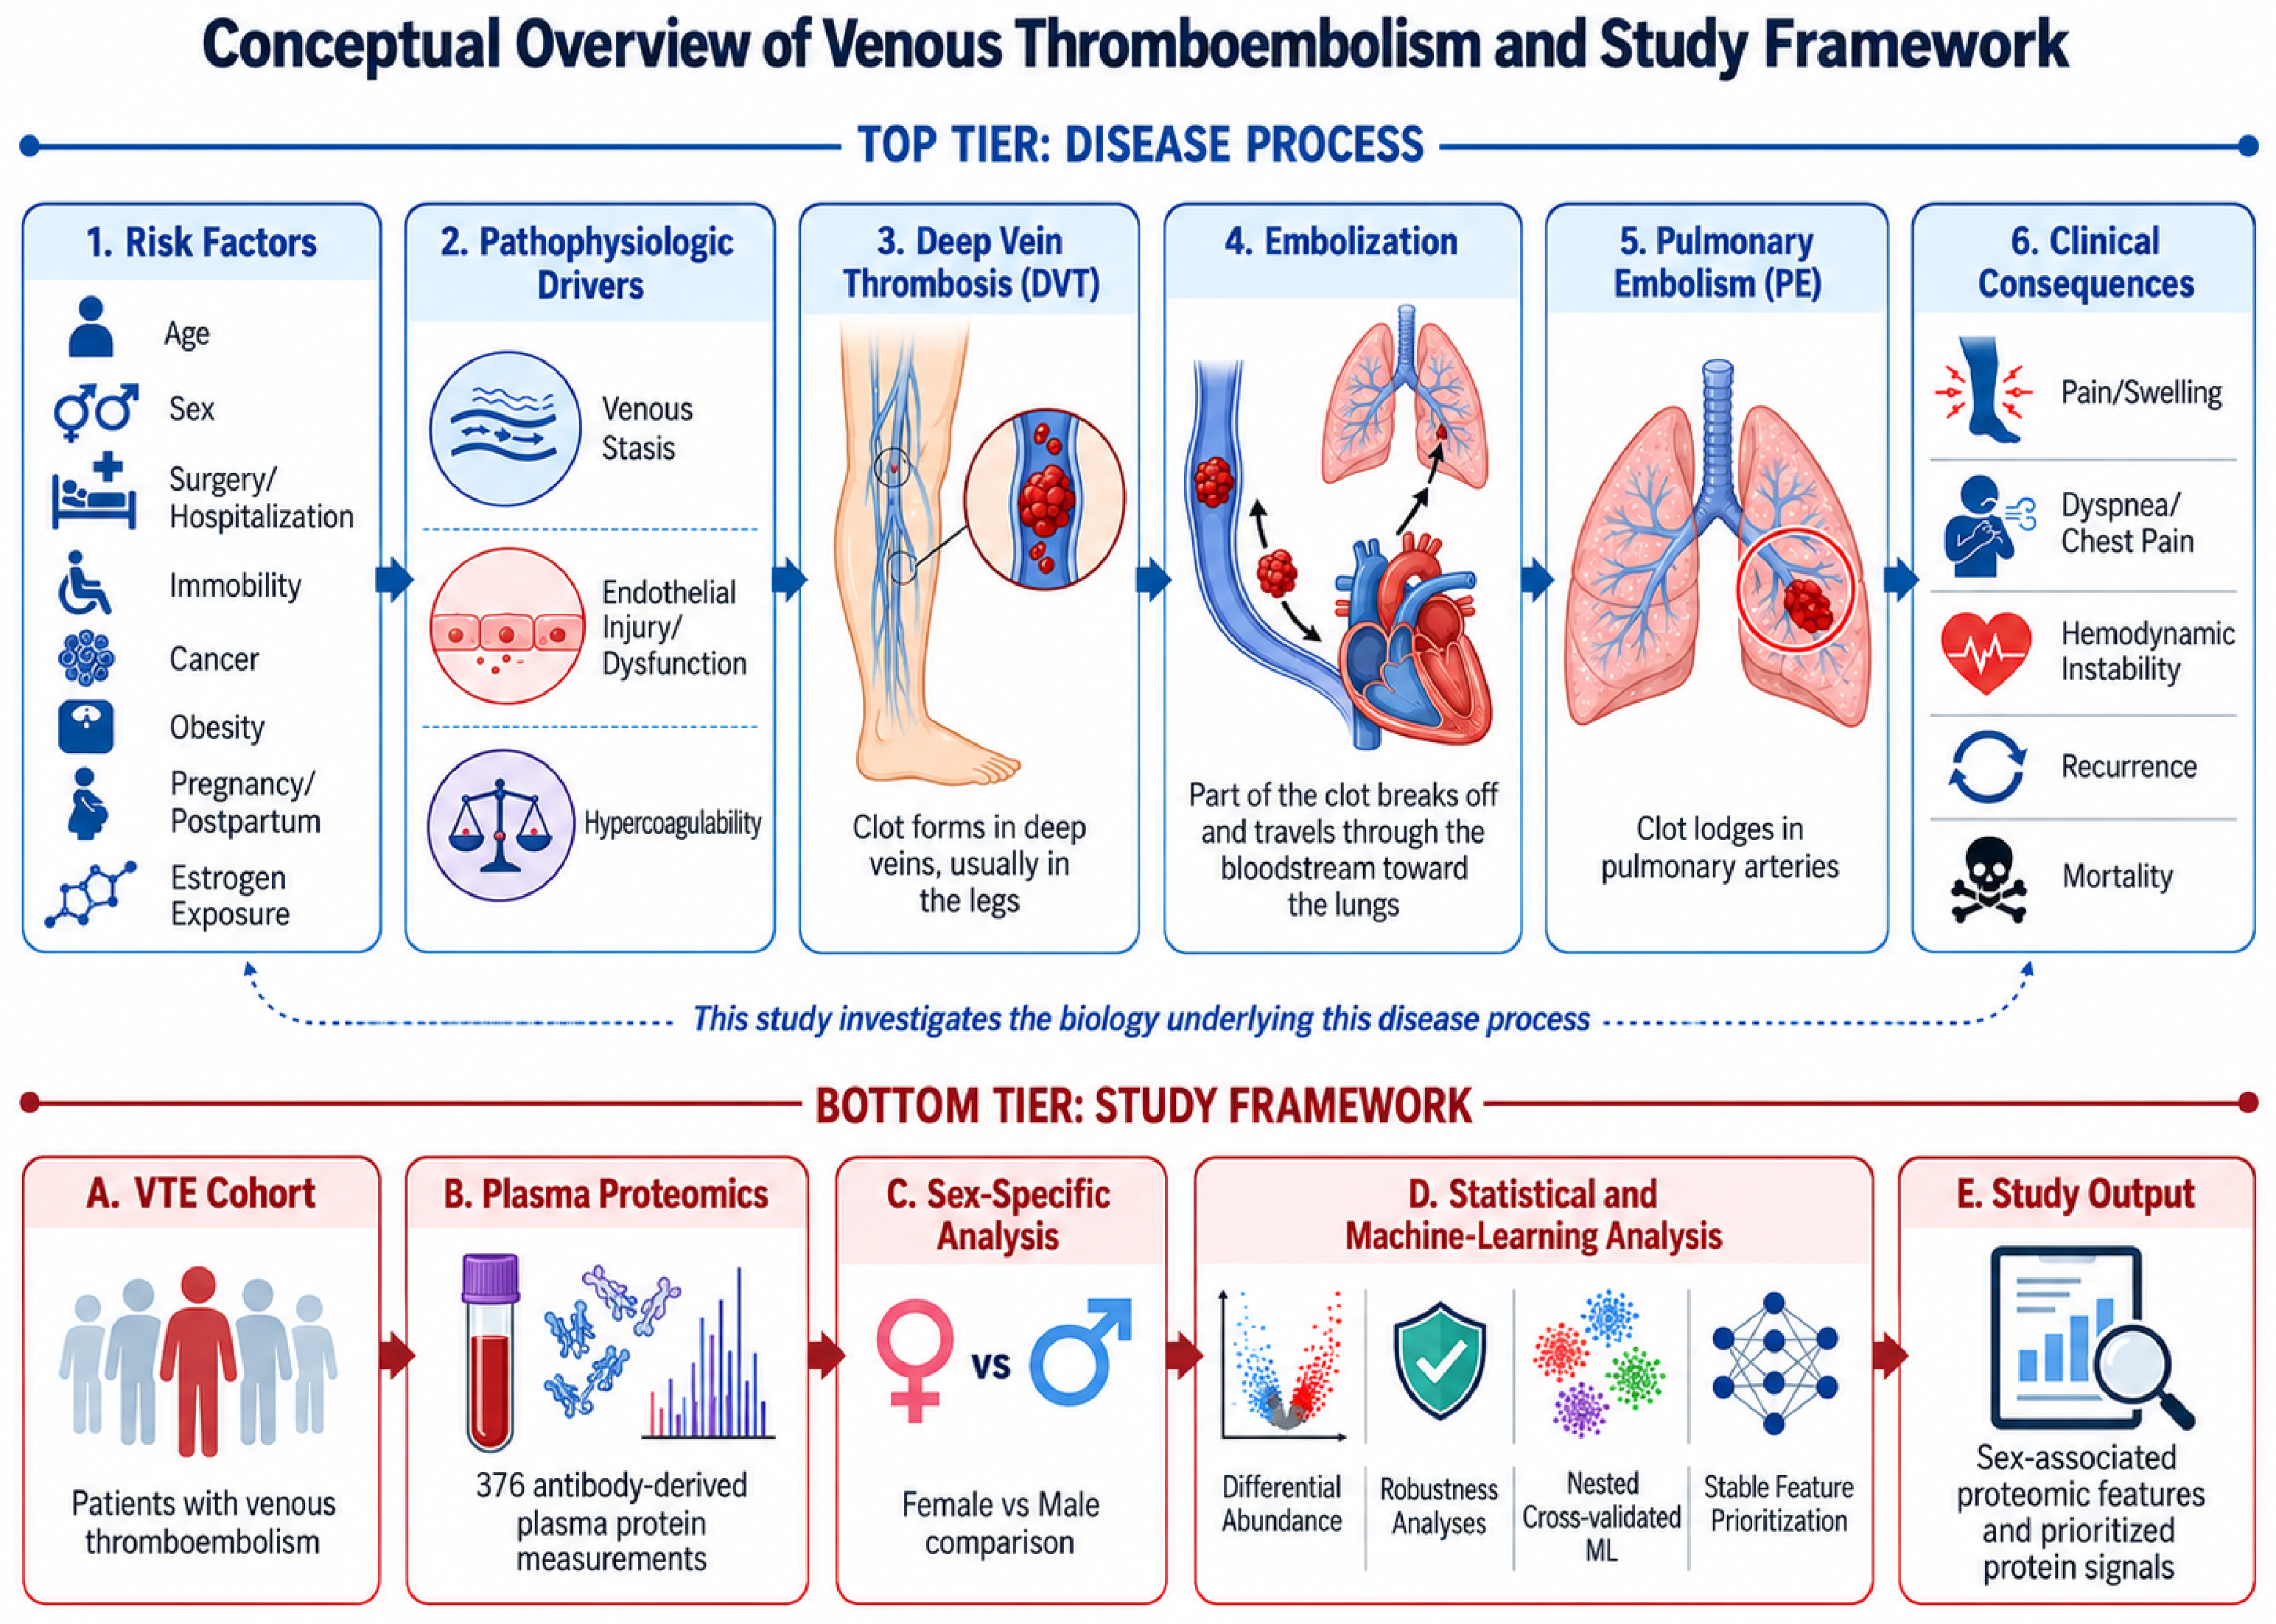
Figure A2.
Principal component analysis of the 29 stable proteomic features identified through nested cross-validation. Each point represents one participant and is colored by biological sex. The first two principal components explained 22.1% and 12.6% of the total variance, respectively. Ellipses summarize the 95% group distributions, and diamonds indicate group centroids. Female and male participants showed substantial overlap in PCA space, indicating that the sex-associated proteomic signal did not produce complete multivariate separation.
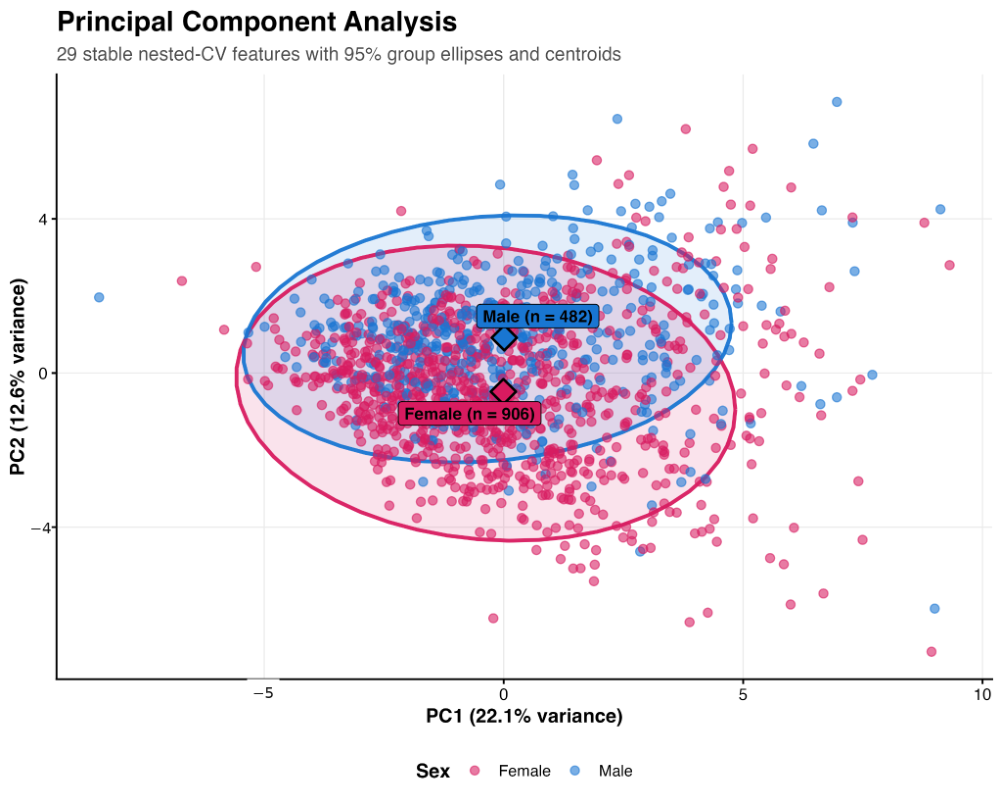
Figure A3.
UMAP visualization based on the 29 stable proteomic features identified through nested cross-validation. Each point represents one participant and is colored by sex. Ellipses summarize the 95% group distributions, and diamonds indicate group centroids. Female and male participants showed substantial overlap, indicating that the sex-associated proteomic signal did not produce distinct multivariate clusters.
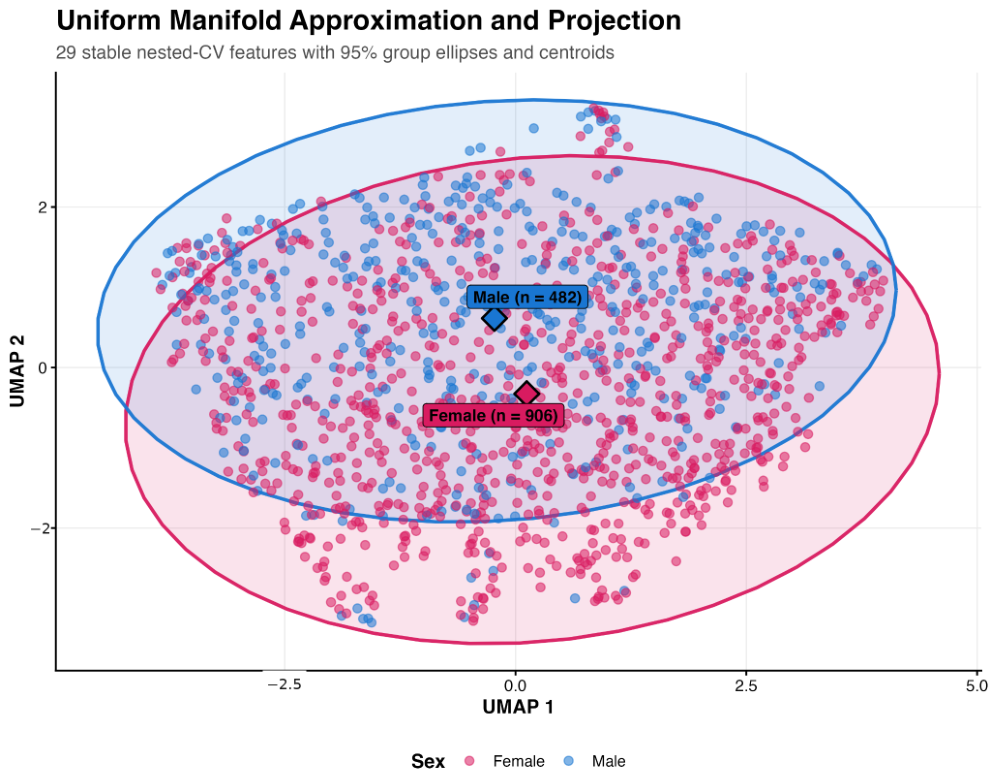
Figure A4.
Feature-selection stability across the repeated nested cross-validation procedure. The displayed assays are ranked by the proportion of the 25 outer training evaluations in which they met the limma FDR feature-selection criterion. Twenty-nine assays were selected in at least 80% of the outer training evaluations, and 19 were selected in all 25 evaluations.
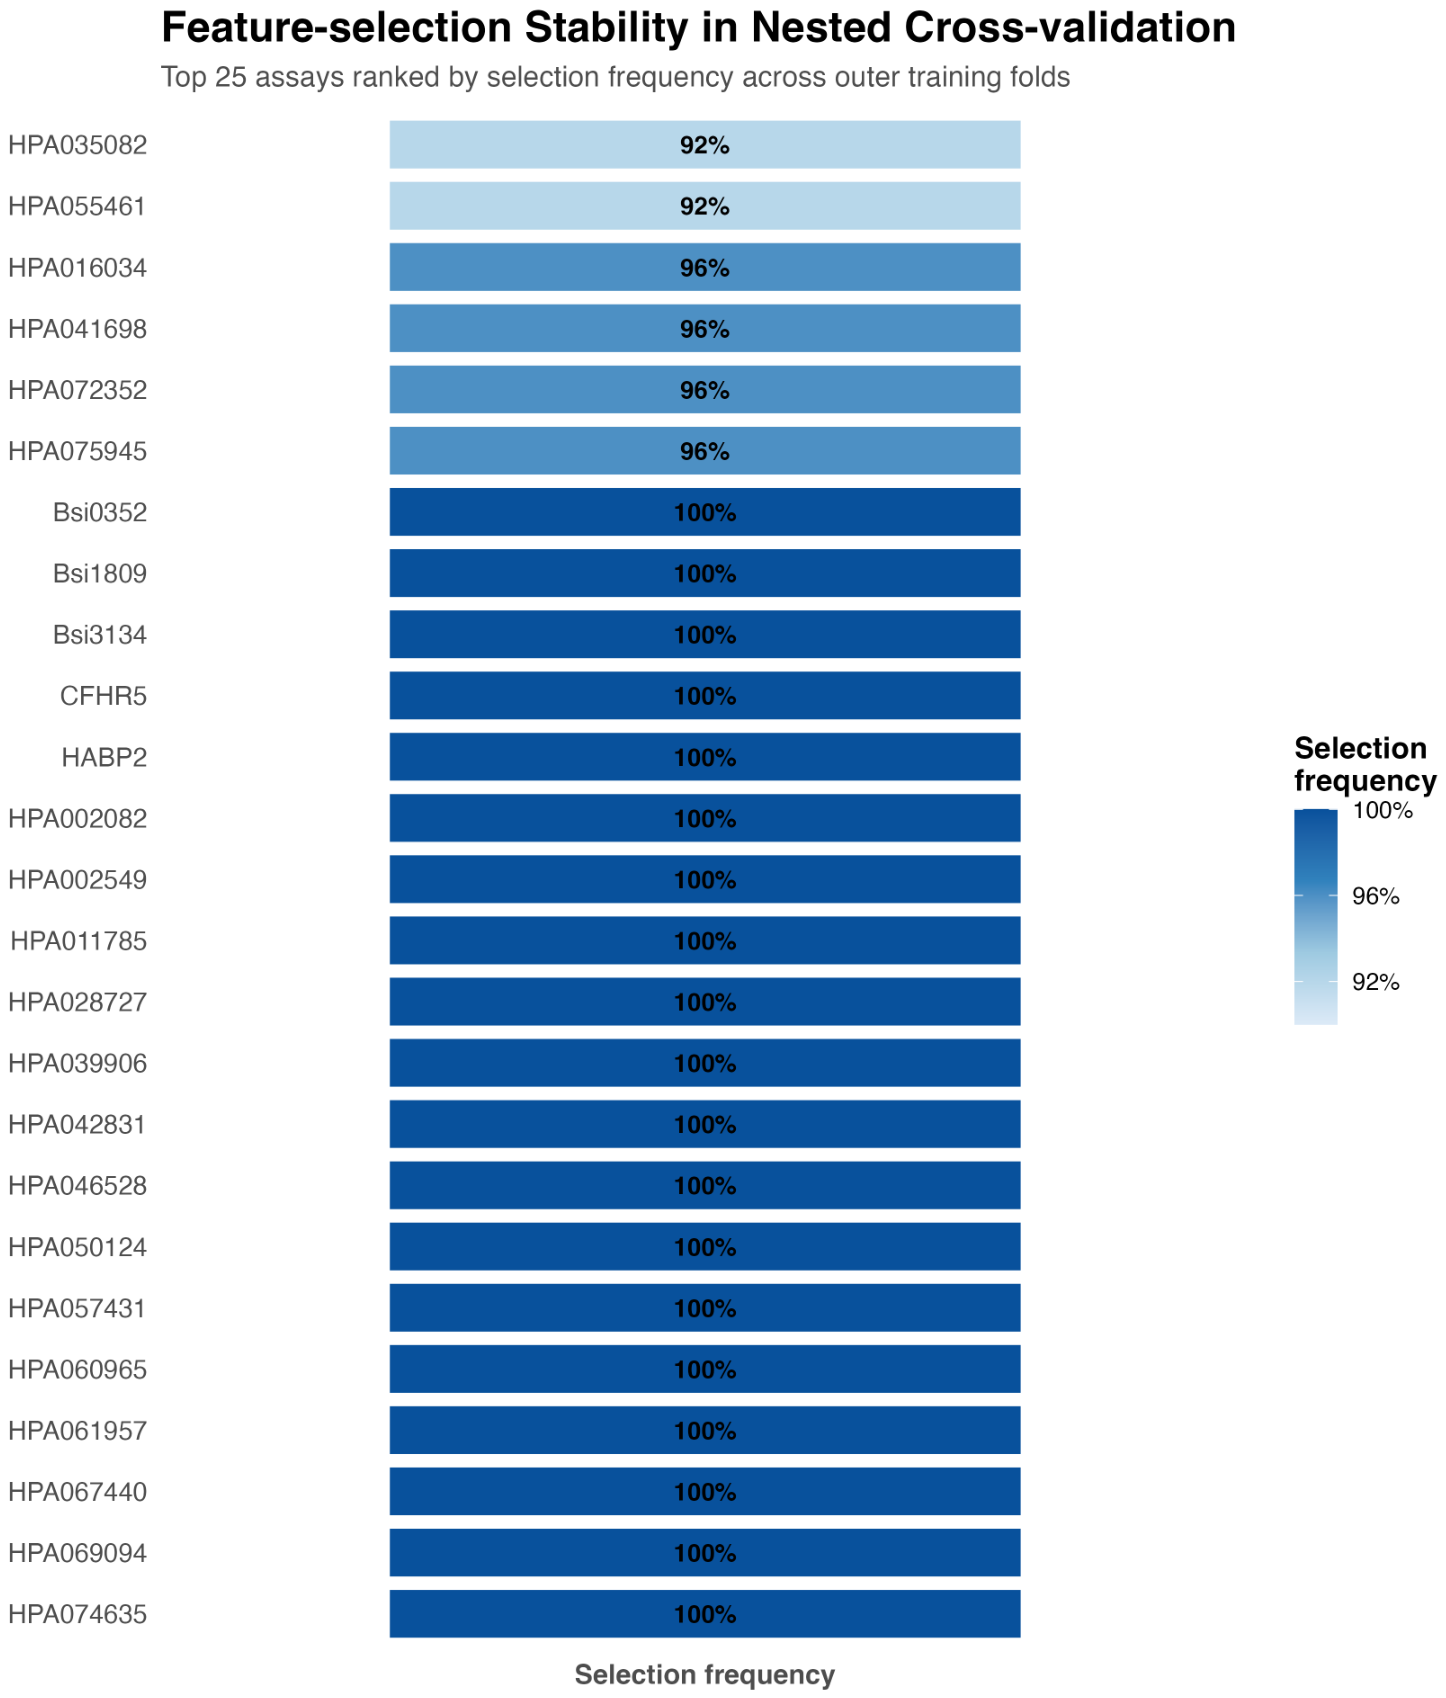
Figure A5.
Model-specific importance of stable sex-associated proteomic features. Original MARTHA assay identifiers are retained in the figure to preserve readability and traceability to the released dataset. Corresponding gene symbols, annotated target proteins, Female-minus-Male effects, selection frequencies, and consensus machine-learning importance values for the stable features are provided in Table A3, and the complete assay-to-gene/protein mapping for all 376 assays is provided in Supplementary Table S3. Importance values were normalized within each model. Features with higher standardized signal in females and males are shown separately to facilitate comparison across Elastic Net, LASSO, Random Forest, Ridge regression, and radial support vector machine models. These importance summaries are descriptive and are presented separately from the nested cross-validated predictive-performance estimates.
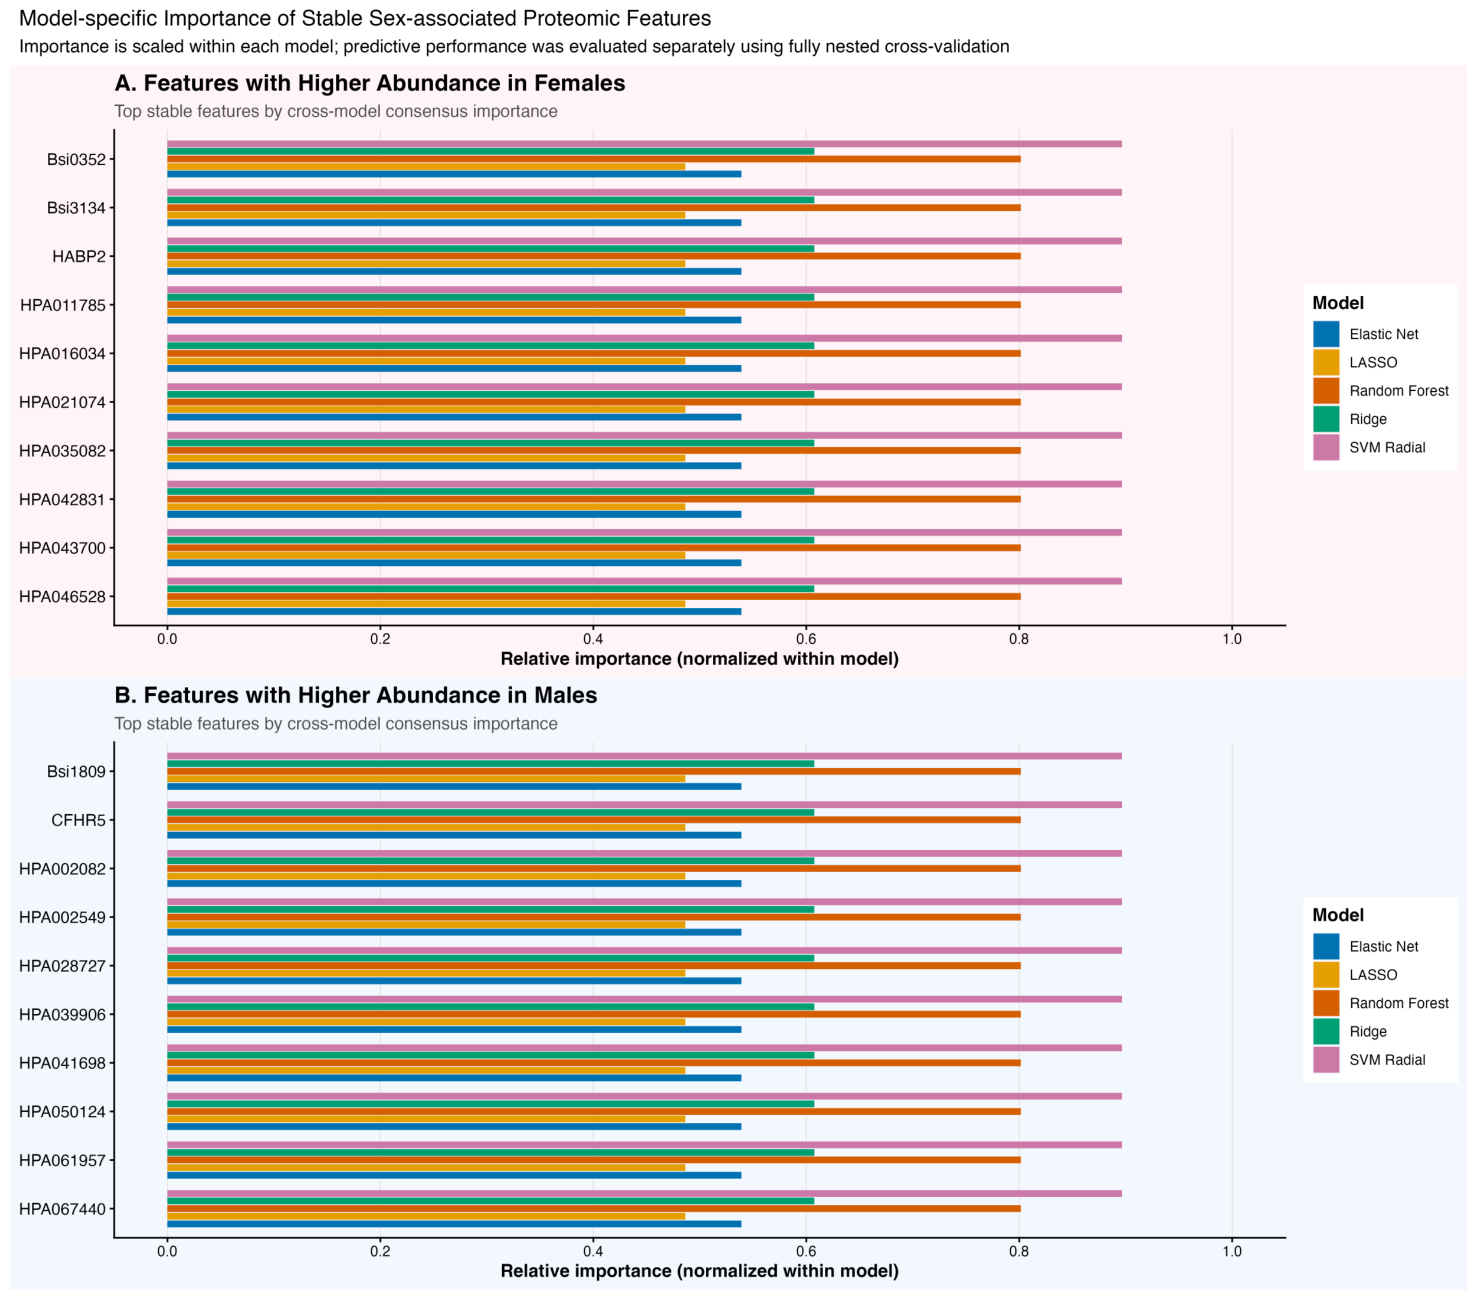
Figure A6.
Cross-model importance of stable sex-associated proteomic features. Original MARTHA assay identifiers are retained as row labels to maintain figure readability and traceability to the released dataset. Corresponding gene symbols and annotated protein targets for these stable features are provided in Table A3, and the complete assay-to-gene/protein mapping for all 376 assays is provided in Supplementary Table S3. The heatmap summarizes normalized importance values across Elastic Net, LASSO, Random Forest, Ridge regression, and radial support vector machine models. Female-associated features are displayed separately from male-associated features. Values were normalized within model and should be interpreted as descriptive comparisons of relative importance patterns rather than as measures of predictive performance.
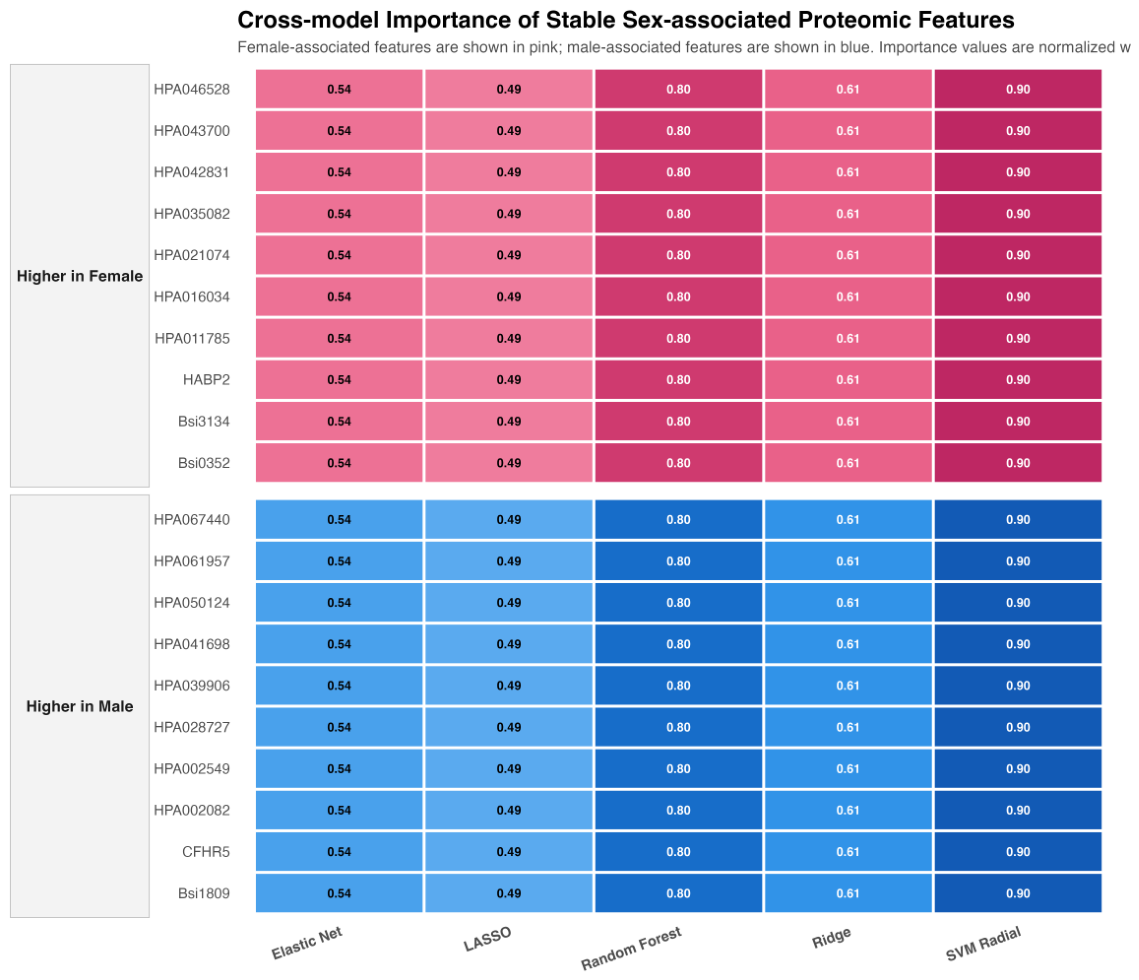
Figure A7.
Sex-to-protein association network for selected leading sex-associated proteomic assays. Pink nodes and edges indicate assays with higher standardized signal in females, whereas blue nodes and edges indicate assays with higher standardized signal in males. Edge width represents the absolute magnitude of the standardized Female-minus-Male effect estimate. The network is intended as a descriptive visualization of the direction and relative magnitude of selected leading associations.
Appendix A.2. Nested Cross-Validated Machine-Learning Performance Summary
Table A1.
Machine-learning hyperparameter search spaces and tuning summary across the nested cross-validation procedure. Hyperparameters were selected independently within each outer training set using five-fold inner cross-validation.
Table A2.
Nested cross-validated classification performance across machine-learning models.
Appendix A.3. Stable Machine-Learning Features and Consensus Importance
Table A3.
Stable proteomic features identified through repeated nested cross-validation and their consensus machine-learning importance. Pink represents female participants, while blue represents male participants.
References
- Mathews, R.; Hinds, M.T.; Nguyen, K.P. Venous thromboembolism: Diagnostic advances and unaddressed challenges in management. Curr. Opin. Hematol. 2024, 31, 122–129. [Google Scholar] [CrossRef] [Scilit] [PubMed]
- Turpie, A.G.; Chin, B.S.; Lip, G.Y. Venous thromboembolism: Pathophysiology, clinical features, and prevention. BMJ 2002, 325, 887–890. [Google Scholar] [CrossRef] [Scilit] [PubMed]
- Waheed, S.M.; Kudaravalli, P.; Hotwagner, D.T. Deep Venous Thrombosis. In StatPearls [Internet]; StatPearls Publishing: Treasure Island, FL, USA, 2026. Available online: https://www.ncbi.nlm.nih.gov/books/NBK507708/ (accessed on 30 August 2026).
- He, C.; Chu, J.; Li, Y.; Dang, Y.; Xue, K.; Cai, C. Reassessing the risk of venous thromboembolism (VTE) events in women. Clin. Appl. Thromb./Hemost. 2024, 30, 10760296241305108. [Google Scholar] [CrossRef] [Scilit] [PubMed]
- O’Kelly, A.C.; Michos, E.D.; Shufelt, C.L.; Vermunt, J.V.; Minissian, M.B.; Quesada, O.; Smith, G.N.; Rich-Edwards, J.W.; Garovic, V.D.; El Khoudary, S.R.; et al. Pregnancy and reproductive risk factors for cardiovascular disease in women. Circ. Res. 2022, 130, 652–672. [Google Scholar] [CrossRef] [Scilit] [PubMed]
- Roach, R.E.J.; Lijfering, W.M.; Rosendaal, F.R.; Cannegieter, S.C.; le Cessie, S. Sex difference in risk of second but not of first venous thrombosis: Paradox explained. Circulation 2014, 129, 51–56. [Google Scholar] [CrossRef] [Scilit] [PubMed]
- Cushman, M. Epidemiology and risk factors for venous thrombosis. Semin. Hematol. 2007, 44, 62–69. [Google Scholar] [CrossRef] [Scilit] [PubMed]
- Heit, J.A. Epidemiology of venous thromboembolism. Nat. Rev. Cardiol. 2015, 12, 464–474. [Google Scholar] [CrossRef] [Scilit] [PubMed]
- Ciarambino, T.; Crispino, P.; Para, O.; Giordano, M. Gender medicine: A new possible frontiers of venous thromboembolism. Stresses 2023, 3, 167–181. [Google Scholar] [CrossRef] [Scilit]
- Jarman, A.F.; Mumma, B.E.; Singh, K.S.; Nowadly, C.D.; Maughan, B.C. Crucial considerations: Sex differences in the epidemiology, diagnosis, treatment, and outcomes of acute pulmonary embolism in non-pregnant adult patients. J. Am. Coll. Emerg. Physicians Open 2021, 2, e12378. [Google Scholar] [CrossRef] [Scilit] [PubMed]
- Chan, S.M. Sex Differences in Patients with Deep Vein Thrombosis. Ph.D. Thesis, Yale School of Medicine, New Haven, CT, USA, 2023. Available online: https://elischolar.library.yale.edu/ymtdl/4173 (accessed on 30 August 2026).
- Yoshikawa, Y.; Yamashita, Y.; Morimoto, T.; Amano, H.; Takase, T.; Hiramori, S.; Kim, K.; Oi, M.; Akao, M.; Kobayashi, Y.; et al. Sex differences in clinical characteristics and outcomes of patients with venous thromboembolism—From the COMMAND VTE Registry. Circ. J. 2019, 83, 1581–1589. [Google Scholar] [CrossRef] [Scilit] [PubMed]
- Douketis, J.D.; Tosetto, A.; Marcucci, M.; Baglin, T.; Cosmi, B.; Cushman, M.; Kyrle, P.; Poli, D.; Tait, R.C.; Iorio, A. Risk of recurrence after venous thromboembolism in men and women: Patient level meta-analysis. BMJ 2011, 342, d813. [Google Scholar] [CrossRef] [Scilit] [PubMed]
- Fernandez Turizo, M.J.; Patell, R.; Zwicker, J.I. Identifying novel biomarkers using proteomics to predict cancer-associated thrombosis. Bleeding Thromb. Vasc. Biol. 2024, 3, 120. [Google Scholar] [CrossRef] [Scilit] [PubMed]
- Edfors, F.; Iglesias, M.J.; Butler, L.M.; Odeberg, J. Proteomics in thrombosis research. Res. Pract. Thromb. Haemost. 2022, 6, e12706. [Google Scholar] [CrossRef] [Scilit] [PubMed]
- Liu, Y.; Gao, L.; Fan, Y.; Ma, R.; An, Y.; Chen, G.; Xie, Y. Discovery of protein biomarkers for venous thromboembolism in non-small cell lung cancer patients through data-independent acquisition mass spectrometry. Front. Oncol. 2023, 13, 1079719. [Google Scholar] [CrossRef] [Scilit] [PubMed]
- The Human Protein Atlas. The Human Blood Atlas. 2025. Available online: https://www.proteinatlas.org/humanproteome/blood (accessed on 30 August 2026).
- The Human Protein Atlas. Antibody Validation. Available online: https://www.proteinatlas.org/humanproteome/tissue/method/antibody+validation (accessed on 30 August 2026).
- Guergova-Kuras, M.; Kurucz, I.; Hempel, W.; Tardieu, N.; Kadas, J.; Malderez-Bloes, C.; Jullien, A.; Kieffer, Y.; Hincapie, M.; Guttman, A.; et al. Discovery of lung cancer biomarkers by profiling the plasma proteome with monoclonal antibody libraries. Mol. Cell. Proteom. 2011, 10, M111.010298. [Google Scholar] [CrossRef] [Scilit] [PubMed]
- The Human Protein Atlas. HSPA4-Antibodies. 2025. Available online: https://www.proteinatlas.org/ENSG00000132326-HSPA4/antibody (accessed on 30 August 2026).
- Sigma-Aldrich. Anti-TMEM109 Antibody Produced in Rabbit, Prestige Antibodies® Powered by Atlas Antibodies. 2025. Product No. HPA011785. Available online: https://www.sigmaaldrich.com/US/en/product/sigma/hpa011785 (accessed on 30 August 2026).
- Brækkan, S.K.; Onsaker, A.L.; Nøst, T.H.; Tang, W.; Hindberg, K.D.; Morelli, V.M.; Guan, W.; Jonasson, C.; Folsom, A.R.; Hveem, K.; et al. The plasma proteome and risk of future venous thromboembolism—Results from the HUNT Study. Thromb. Haemost. 2025, 125, 574–584. [Google Scholar] [CrossRef] [Scilit] [PubMed]
- Behravesh, S.; Hoang, P.; Nanda, A.; Wallace, A.; Sheth, R.A.; Deipolyi, A.R.; Memic, A.; Naidu, S.; Oklu, R. Pathogenesis of thromboembolism and endovascular management. Thrombosis 2017, 2017, 3039713. [Google Scholar] [CrossRef] [Scilit] [PubMed]
- Koprulu, M.; Wheeler, E.; Kerrison, N.D.; Denaxas, S.; Carrasco-Zanini, J.; Orkin, C.M.; Hemingway, H.; Wareham, N.J.; Pietzner, M.; Langenberg, C. Sex differences in the genetic regulation of the human plasma proteome. Nat. Commun. 2025, 16, 4001. [Google Scholar] [CrossRef] [Scilit] [PubMed]
- Lau, E.S.; Paniagua, S.M.; Guseh, J.S.; Bhambhani, V.; Zanni, M.V.; Courchesne, P.; Lyass, A.; Larson, M.G.; Levy, D.; Ho, J.E. Sex Differences in Circulating Biomarkers of Cardiovascular Disease. J. Am. Coll. Cardiol. 2019, 74, 1543–1553. [Google Scholar] [CrossRef] [Scilit] [PubMed]
- Curran, A.M.; Fogarty Draper, C.; Scott-Boyer, M.-P.; Valsesia, A.; Roche, H.M.; Ryan, M.F.; Gibney, M.J.; Kutmon, M.; Evelo, C.T.; Coort, S.L.; et al. Sexual dimorphism, age, and fat mass are key phenotypic drivers of proteomic signatures. J. Proteome Res. 2017, 16, 4122–4133. [Google Scholar] [CrossRef] [Scilit] [PubMed]
- Liu, Y.; Wang, Z.; Collins, S.P.; Testani, J.; Safdar, B. Sex differences in proteomics of cardiovascular disease—Results from the Yale-CMD registry. Int. J. Cardiol. Heart Vasc. 2025, 58, 101667. [Google Scholar] [CrossRef] [Scilit] [PubMed]
- Sier, V.Q.; Dimitrova, K.; Peters, E.H.A.B.; van der Loo, W.P.M.; Willems van Dijk, K.; van Heemst, D.; Bax, W.H.; Quax, P.H.A.; Pasterkamp, G.; Mokry, M.; et al. Sex-specific associations of the plasma-proteome with incident coronary artery disease. Cardiovasc. Res. 2026, cvag186. [Google Scholar] [CrossRef] [Scilit] [PubMed]
- Mei, Y.; Vad, O.B.; Beyer, A.F.; Ghouse, J.; Lundegaard, P.R. Plasma proteomics enhances genetic risk prediction and biological understanding of venous thromboembolism. medRxiv 2025, preprint. [Google Scholar] [CrossRef] [Scilit]
- Razzaq, M.; Iglesias, M.J.; Ibrahim-Kosta, M.; Goumidi, L.; Soukarieh, O.; Proust, C.; Roux, M.; Suchon, P.; Boland, A.; Daiain, D.; et al. An artificial neural network approach integrating plasma proteomics and genetic data identifies PLXNA4 as a new susceptibility locus for pulmonary embolism. Sci. Rep. 2021, 11, 14015. [Google Scholar] [CrossRef] [Scilit] [PubMed]
- Razzaq, M.; Odeberg, J.; Morange, P.-E.; Trégouët, D.-A. MARTHA Plasma Proteomics Dataset. Zenodo. Available online: https://zenodo.org/record/4280776 (accessed on 30 August 2026).
- Ritchie, M.E.; Phipson, B.; Wu, D.; Hu, Y.; Law, C.W.; Shi, W.; Smyth, G.K. limma powers differential expression analyses for RNA-sequencing and microarray studies. Nucleic Acids Res. 2015, 43, e47. [Google Scholar] [CrossRef] [Scilit] [PubMed]
- Benjamini, Y.; Hochberg, Y. Controlling the false discovery rate: A practical and powerful approach to multiple testing. J. R. Stat. Soc. Ser. B 1995, 57, 289–300. [Google Scholar] [CrossRef] [Scilit]
- Leek, J.T.; Storey, J.D. Capturing heterogeneity in gene expression studies by surrogate variable analysis. PLoS Genet. 2007, 3, 1724–1735. [Google Scholar] [CrossRef] [Scilit] [PubMed]
- Breiman, L. Random forests. Mach. Learn. 2001, 45, 5–32. [Google Scholar] [CrossRef] [Scilit]
- Friedman, J.; Hastie, T.; Tibshirani, R. Regularization paths for generalized linear models via coordinate descent. J. Stat. Softw. 2010, 33, 1–22. [Google Scholar] [CrossRef] [Scilit]
- Cortes, C.; Vapnik, V. Support-vector networks. Mach. Learn. 1995, 20, 273–297. [Google Scholar] [CrossRef] [Scilit]
- Zahed, M.; Skafyan, M.; Rasoulianboroujeni, M. Machine Learning and Ranking-Based Evaluation for Prioritizing High-Potency Ionizable Lipids in LNP-Mediated RNA Delivery. Algorithms 2026, 19, 353. [Google Scholar] [CrossRef] [Scilit]
- Jolliffe, I.T.; Cadima, J. Principal component analysis: A review and recent developments. Philos. Trans. R. Soc. A Math. Phys. Eng. Sci. 2016, 374, 20150202. [Google Scholar] [CrossRef] [Scilit] [PubMed]
- McInnes, L.; Healy, J.; Saul, N.; Grossberger, L. UMAP: Uniform Manifold Approximation and Projection. J. Open Source Softw. 2018, 3, 861. [Google Scholar] [CrossRef] [Scilit]
- Zahed, M.; Skafyan, M. Silhouette-Based Evaluation of PCA, Isomap, and t-SNE on Linear and Nonlinear Data Structures. Stats 2025, 8, 105. [Google Scholar] [CrossRef] [Scilit]
- Zahed, M.; Skafyan, M. Positioning Fractal Dimension and Lacunarity in the IBSI Feature Space: Simulation with and Without Wavelets. Radiation 2025, 5, 32. [Google Scholar] [CrossRef] [Scilit]
- The Human Protein Atlas. VWF-Antibodies. Available online: https://www.proteinatlas.org/ENSG00000110799-VWF/summary/antibody (accessed on 25 October 2026).
- Denis, C.; Lenting, P.J. Von Willebrand factor: At the crossroads of bleeding and thrombosis. Int. J. Hematol. 2012, 95, 353–361. [Google Scholar] [CrossRef] [Scilit] [PubMed]
- Haberichter, S.L. von Willebrand factor propeptide: Biology and clinical utility. Blood 2015, 126, 1753–1761. [Google Scholar] [CrossRef] [Scilit] [PubMed]
- Koster, T.; Blann, A.D.; Briët, E.; Vandenbroucke, J.P.; Rosendaal, F.R. Role of clotting factor VIII in effect of von Willebrand factor on occurrence of deep-vein thrombosis. Lancet 1995, 345, 152–155. [Google Scholar] [CrossRef] [Scilit] [PubMed]
- van der Weerd, N.; van Os, H.J.A.; Ali, M.; Schoones, J.W.; van den Maagdenberg, A.M.J.M.; Kruyt, N.D.; Siegerink, B.; Wermer, M.J.H. Sex Differences in Hemostatic Factors in Patients with Ischemic Stroke and the Relation with Migraine—A Systematic Review. Front. Cell. Neurosci. 2021, 15, 711604. [Google Scholar] [CrossRef] [Scilit] [PubMed]
- Schachta, I.; Żekanowska, E.; Styczyński, J.; Murawska, J.; Lattanzi, S.; Alexandre, A.M.; Słomka, A. Factor VII-activating protease (FSAP) and its importance in hemostasis—Part II: A link between FSAP, blood coagulation, and fibrinolysis: A narrative review. Int. J. Mol. Sci. 2025, 26, 10709. [Google Scholar] [CrossRef] [Scilit] [PubMed]
- Mambetsariev, N.; Mirzapoiazova, T.; Mambetsariev, B.; Sammani, S.; Lennon, F.E.; Garcia, J.G.N.; Singleton, P.A. Hyaluronic acid binding protein 2 is a novel regulator of vascular integrity. Arterioscler. Thromb. Vasc. Biol. 2010, 30, 483–490. [Google Scholar] [CrossRef] [Scilit] [PubMed]
- Hoppe, B.; Tolou, F.; Radtke, H.; Kiesewetter, H.; Dörner, T.; Salama, A. Marburg I polymorphism of factor VII-activating protease is associated with idiopathic venous thromboembolism. Blood 2005, 105, 1549–1551. [Google Scholar] [CrossRef] [Scilit] [PubMed]
- Willeit, J.; Kiechl, S.; Weimer, T.; Mair, A.; Santer, P.; Wiedermann, C.J.; Römisch, J. Marburg I polymorphism of factor VII-activating protease: A prominent risk predictor of carotid stenosis. Circulation 2003, 107, 667–670. [Google Scholar] [CrossRef] [Scilit] [PubMed]
- Sasikumar, P.; AlOuda, K.S.; Kaiser, W.J.; Holbrook, L.M.; Kriek, N.; Unsworth, A.J.; Bye, A.P.; Sage, T.; Ushioda, R.; Nagata, K.; et al. The chaperone protein HSP47: A platelet collagen binding protein that contributes to thrombosis and hemostasis. J. Thromb. Haemost. 2018, 16, 946–959. [Google Scholar] [CrossRef] [Scilit] [PubMed]
- The Human Protein Atlas. RGS18 Protein Expression Summary. Available online: https://www.proteinatlas.org/ENSG00000150681-RGS18 (accessed on 30 August 2026).
- Alshbool, F.Z.; Karim, Z.A.; Vemana, H.P.; Conlon, C.; Lin, O.A.; Khasawneh, F.T. The regulator of G-protein signaling 18 regulates platelet aggregation, hemostasis and thrombosis. Biochem. Biophys. Res. Commun. 2015, 462, 378–382. [Google Scholar] [CrossRef] [Scilit] [PubMed]
- Ai, J.; Druhan, L.J.; Hunter, M.G.; Loveland, M.J.; Avalos, B.R. LRG-accelerated differentiation defines unique G-CSFR signaling pathways downstream of PU.1 and C/EBPϵ that modulate neutrophil activation. J. Leukoc. Biol. 2008, 83, 1277–1285. [Google Scholar] [CrossRef] [Scilit] [PubMed]
- Kregel, K.C. Invited Review: Heat shock proteins: Modifying factors in physiological stress responses and acquired thermotolerance. J. Appl. Physiol. 2002, 92, 2177–2186. [Google Scholar] [CrossRef] [Scilit] [PubMed]
- Abi Zamer, B.; El-Huneidi, W.; Eladl, M.A.; Muhammad, J.S. Ins and Outs of Heat Shock Proteins in Colorectal Carcinoma: Its Role in Carcinogenesis and Therapeutic Perspectives. Cells 2021, 10, 2862. [Google Scholar] [CrossRef] [Scilit] [PubMed]
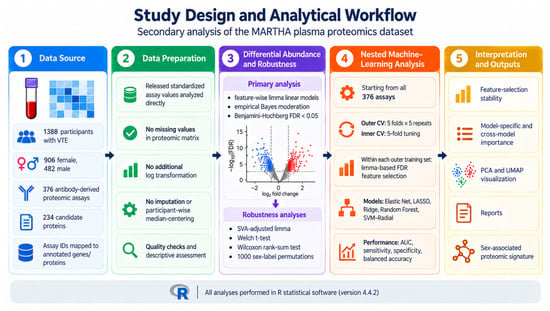
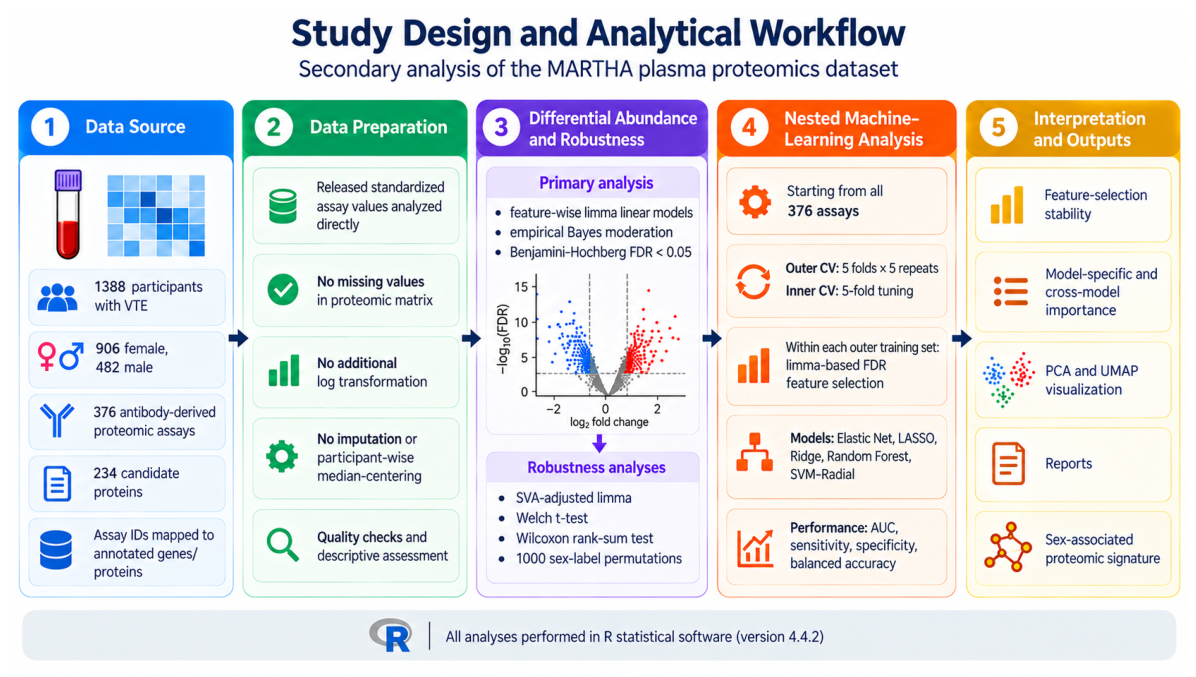
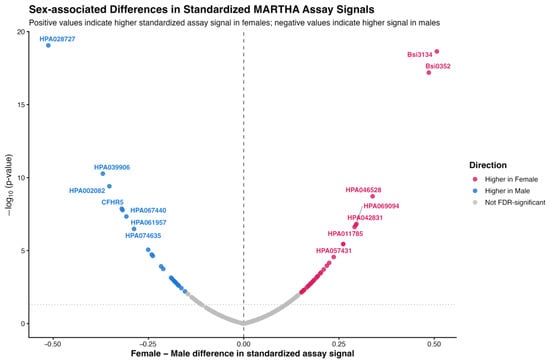
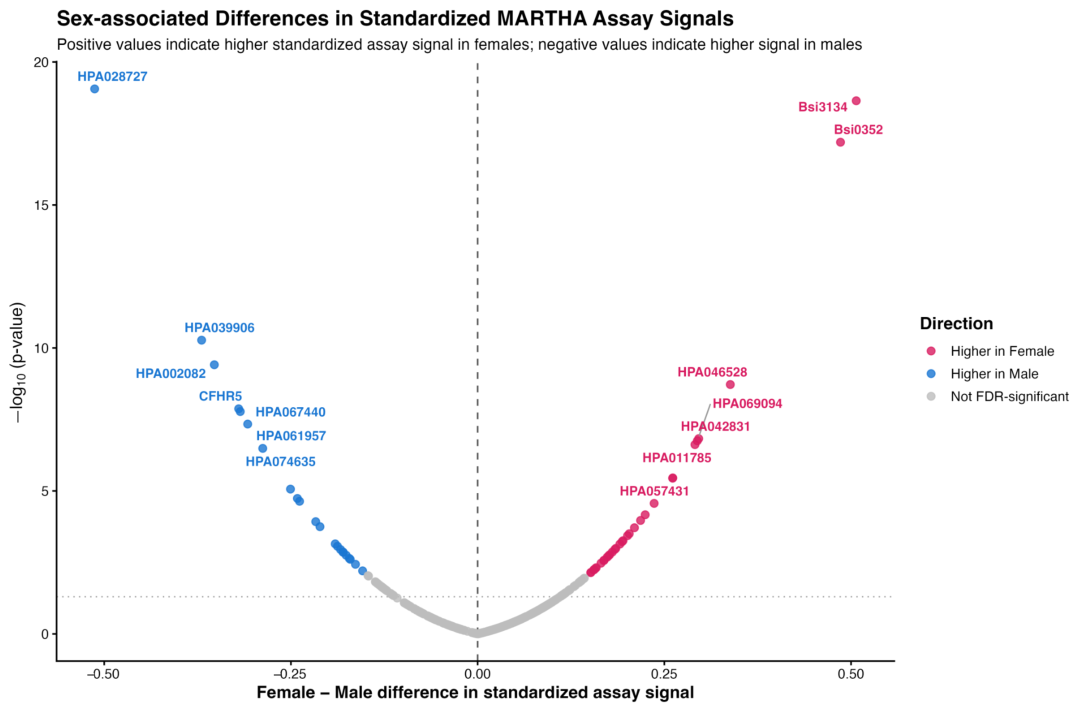
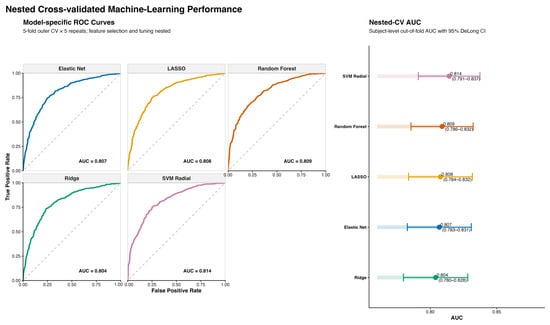
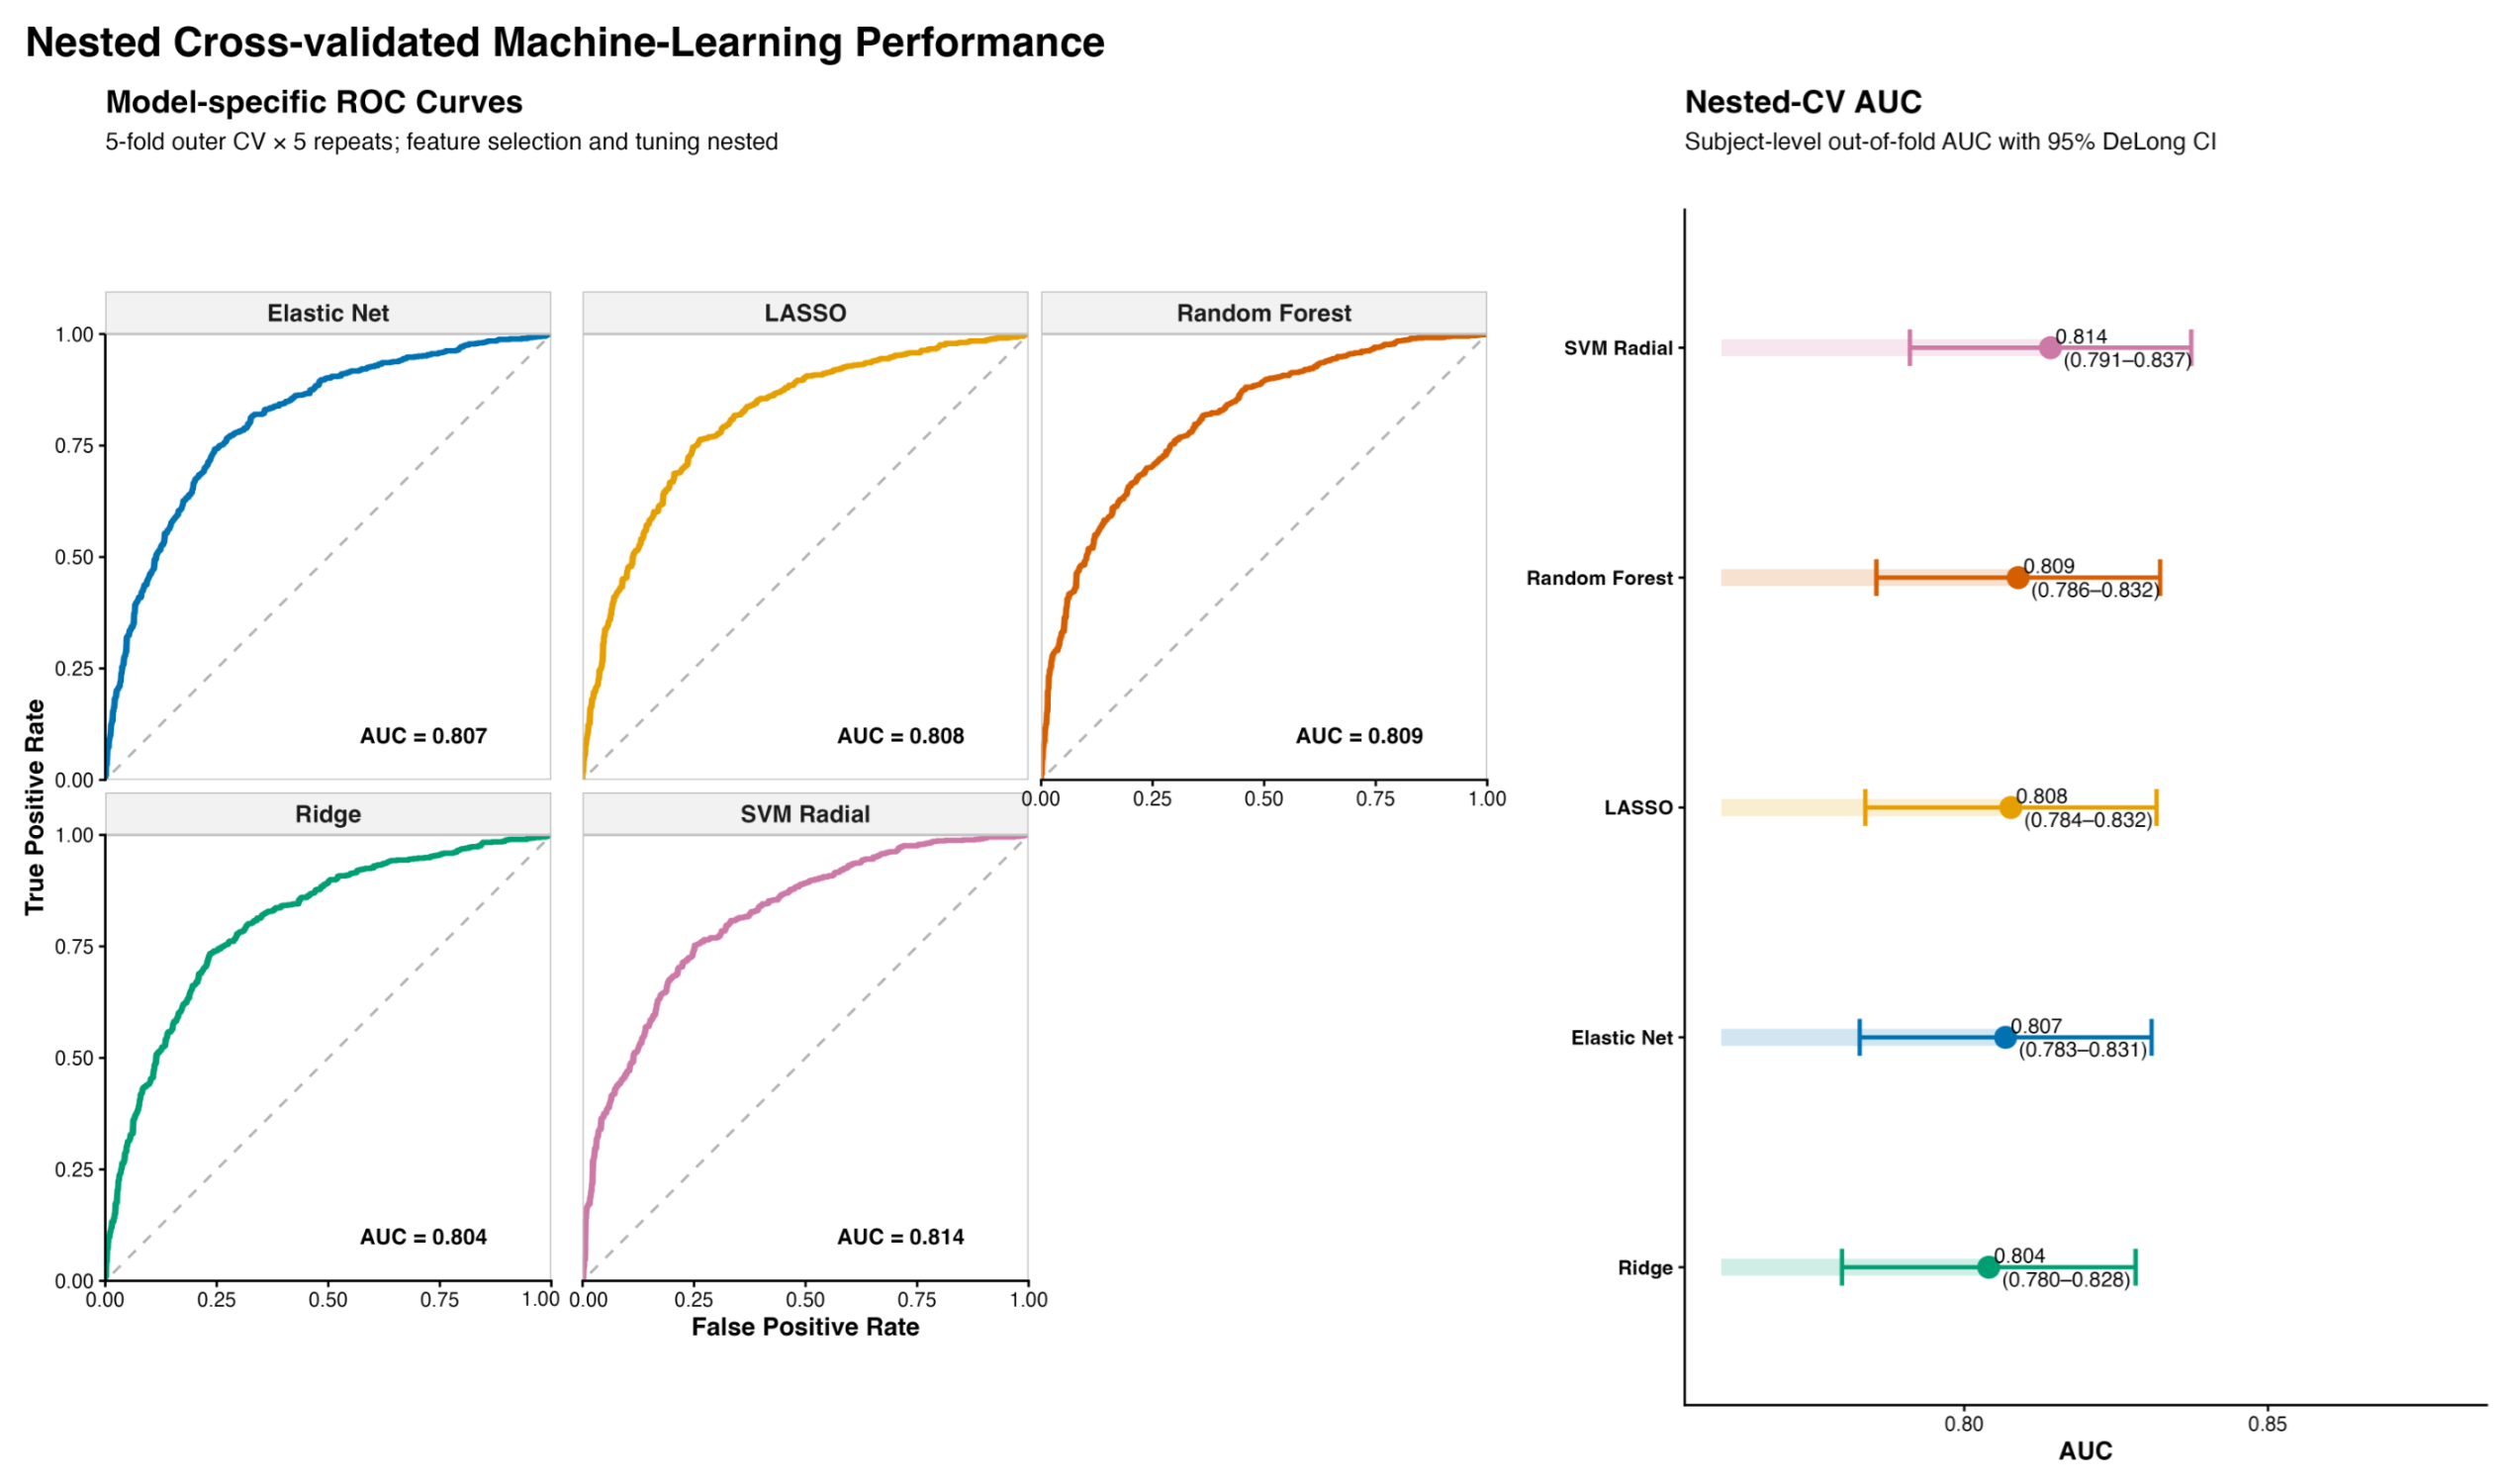
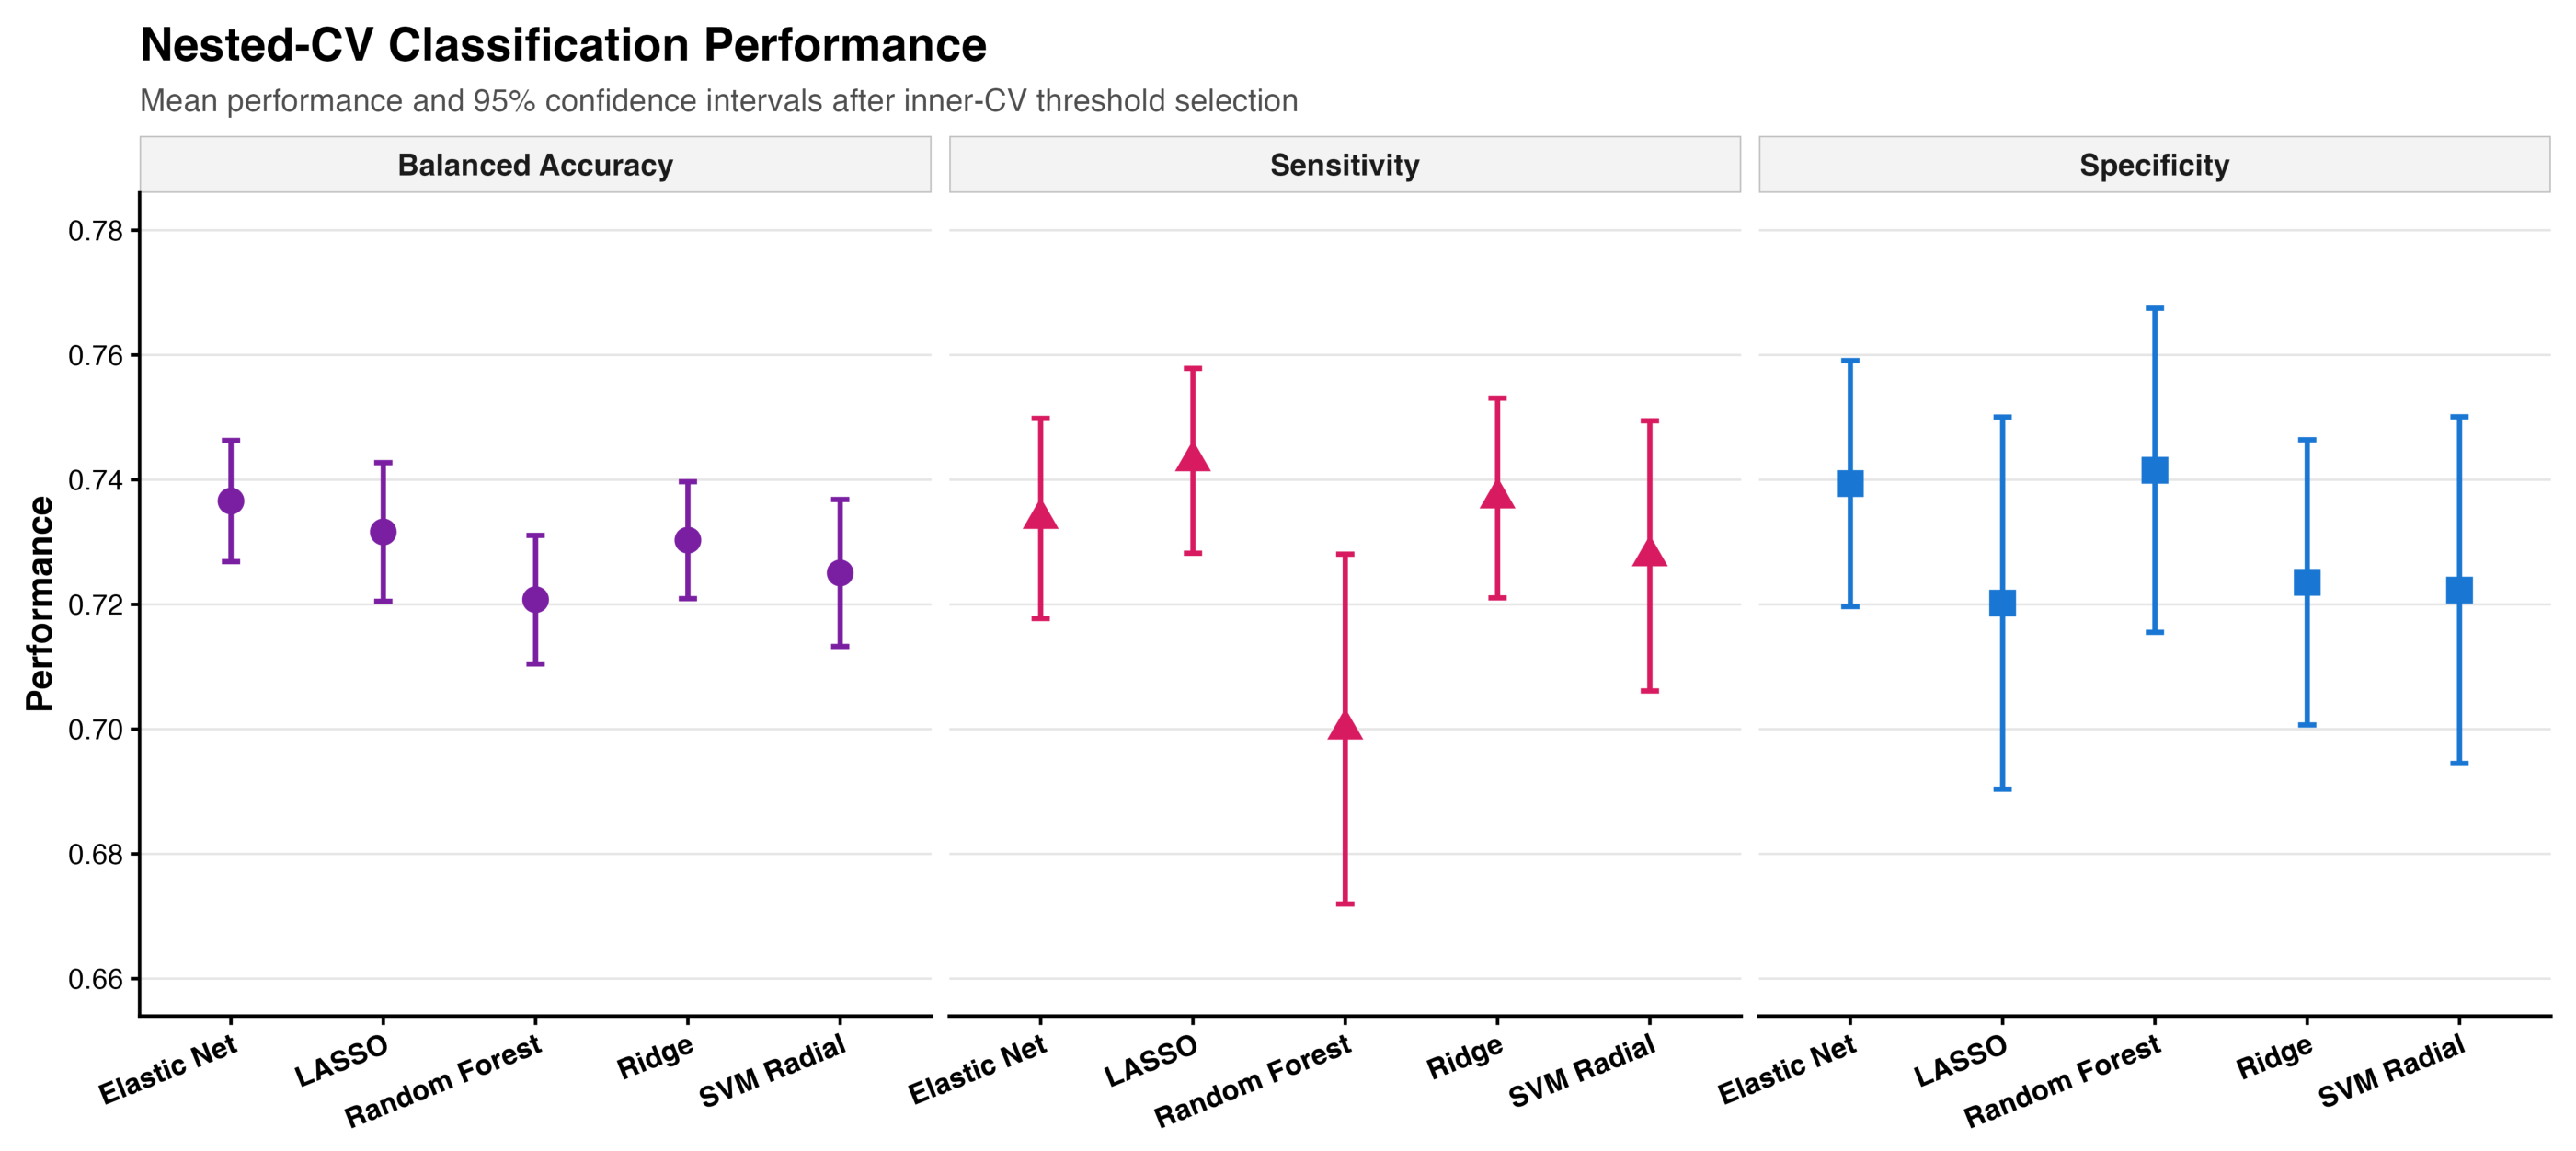
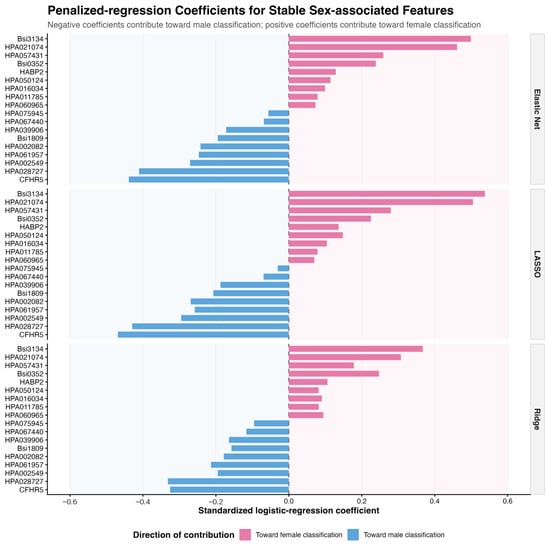
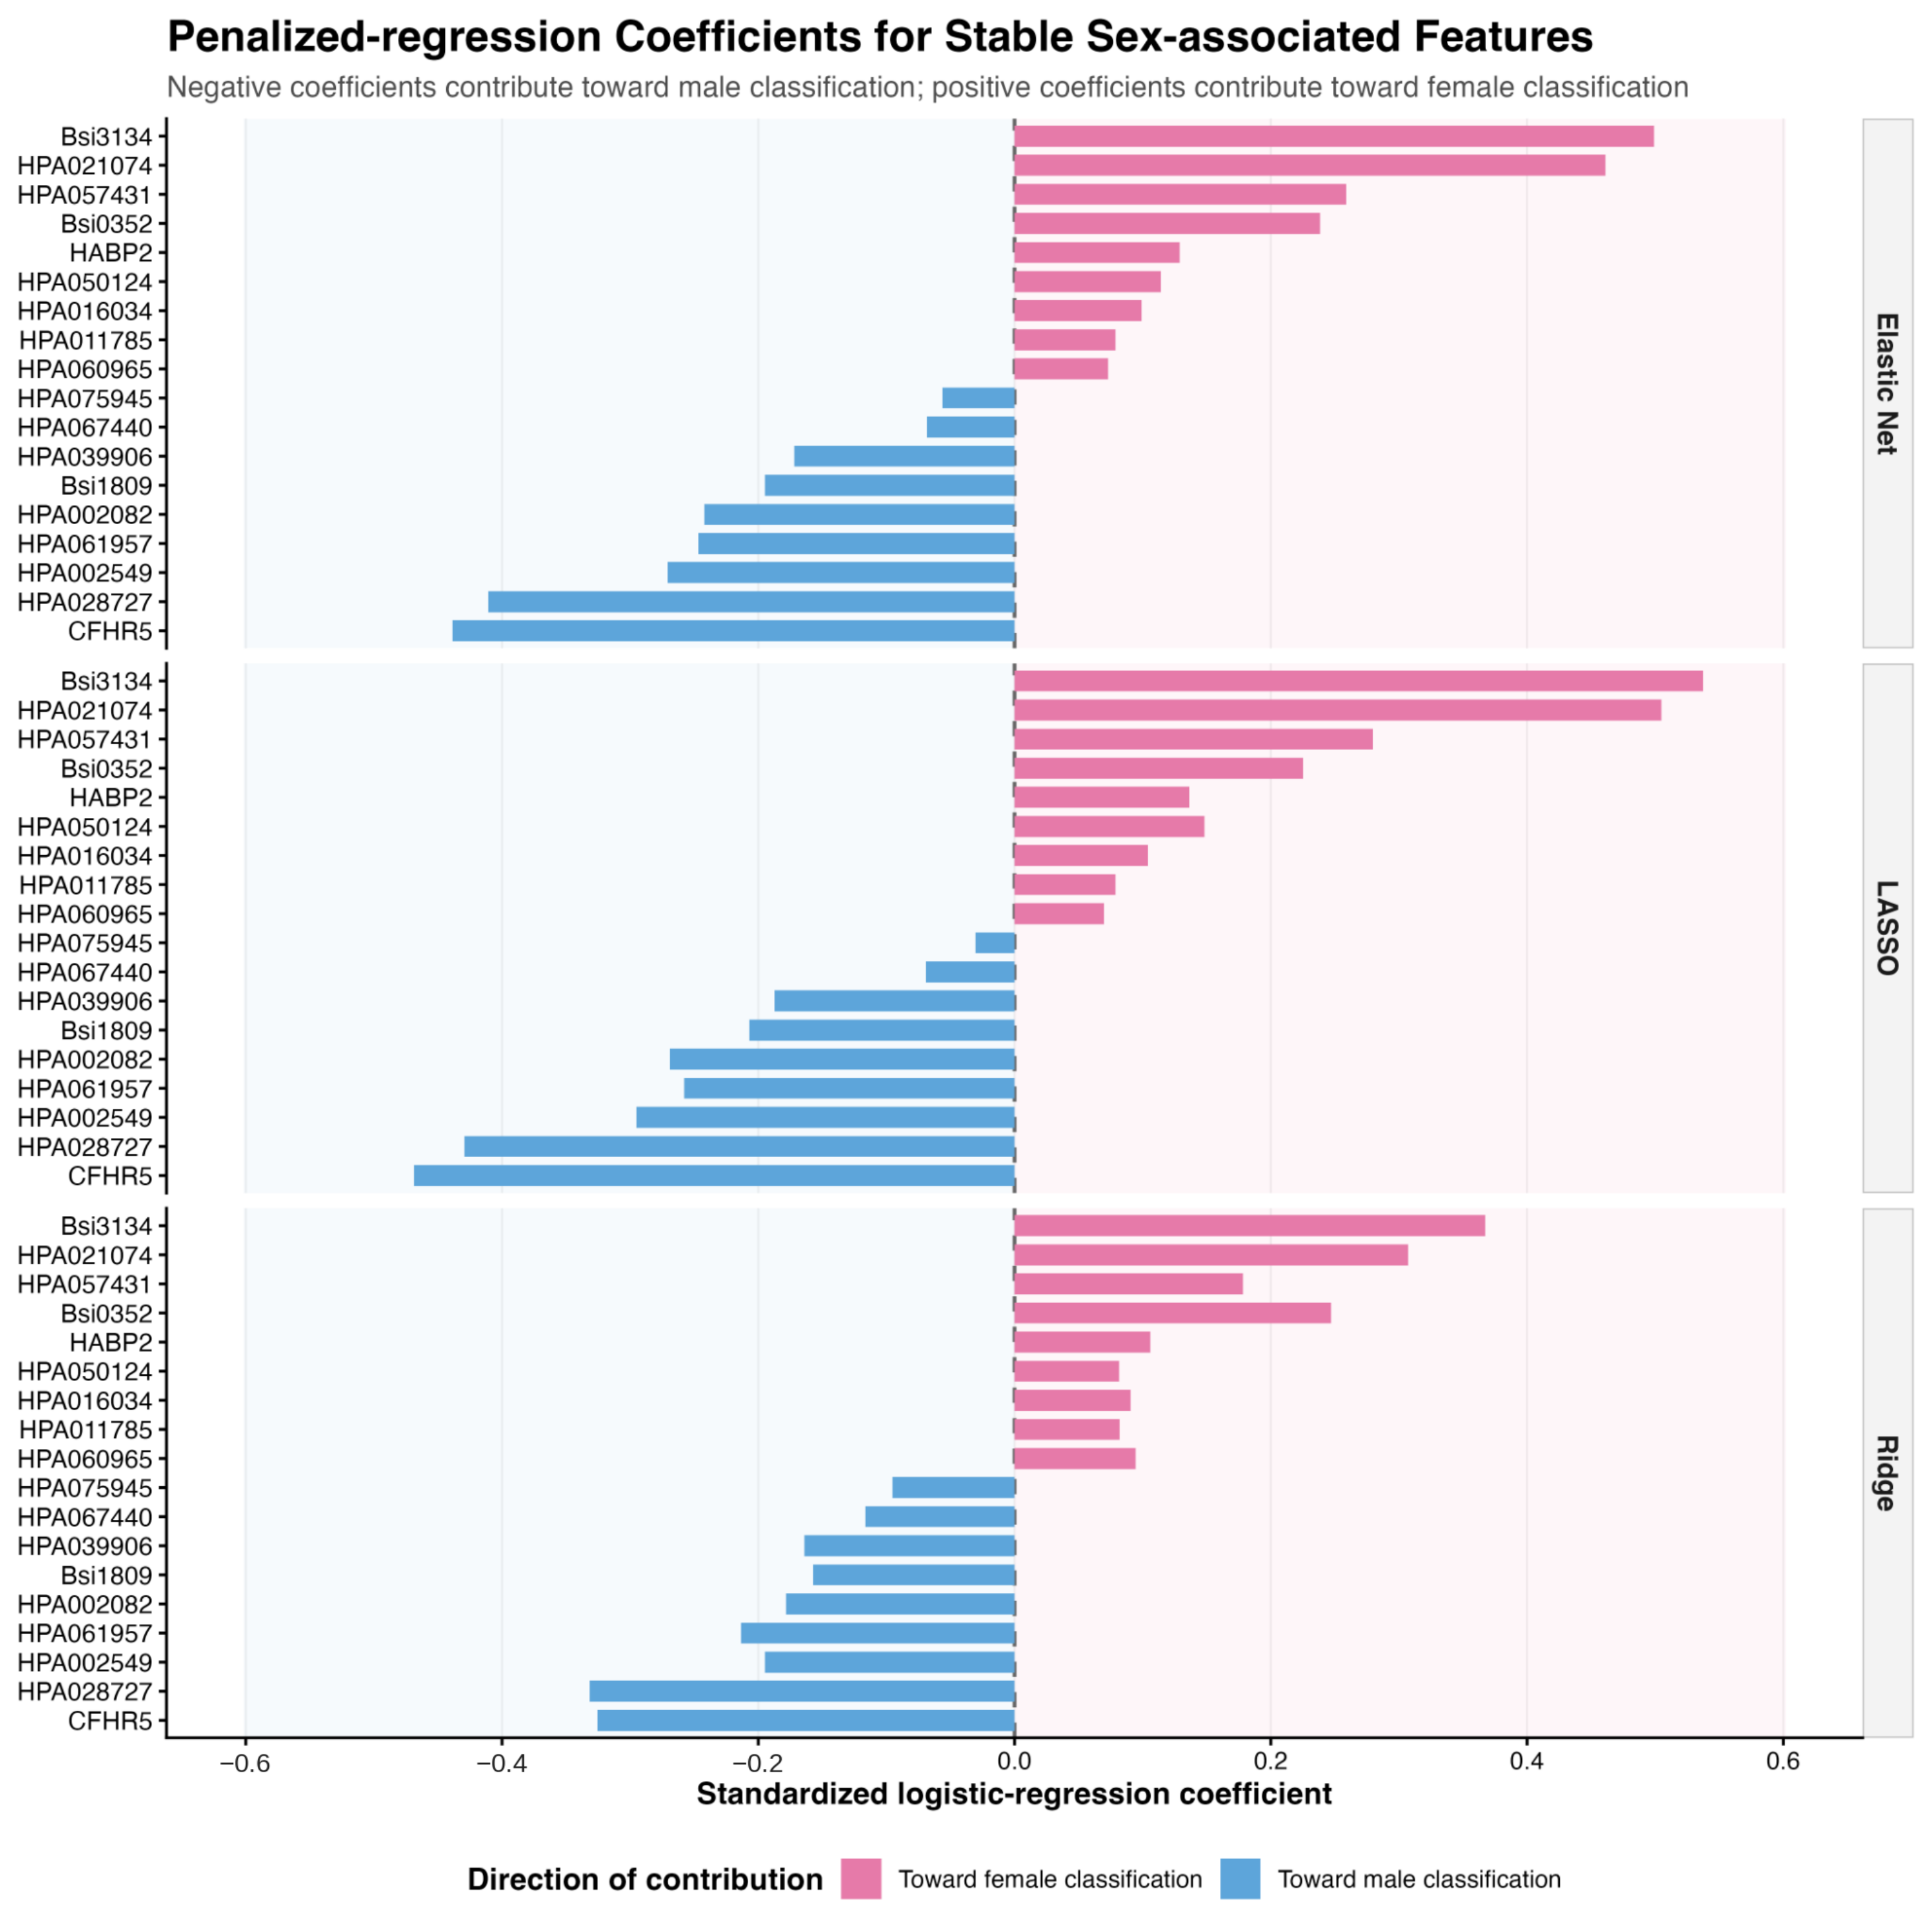

Disclaimer/Publisher’s Note: The statements, opinions and data contained in all publications are solely those of the individual author(s) and contributor(s) and not of MDPI and/or the editor(s). MDPI and/or the editor(s) disclaim responsibility for any injury to people or property resulting from any ideas, methods, instructions or products referred to in the content. |
© 2026 by the authors. Licensee MDPI, Basel, Switzerland. This article is an open access article distributed under the terms and conditions of the Creative Commons Attribution (CC BY) license.