


Abstract
Statistical literacy is essential for biomedical researchers, yet doctoral training in applied biostatistics and reproducible data analysis remains limited despite the growing accessibility of open-source tools such as R. This retrospective observational programme evaluation examined three consecutive editions (2021–2023) of an intensive three-day doctoral course in applied biostatistics with R, delivered at the Instituto Maimónides de Investigación Biomédica de Córdoba (IMIBIC) and the Universidad de Córdoba (UCO). Each edition enrolled 15 doctoral students with a 5:1 student-to-instructor ratio and used a problem-based curriculum of nine modules supported by a purpose-written open-access textbook. End-of-course examination performance was described using a ten-item multiple-choice examination; because the examination was not psychometrically equated across editions, score distributions are reported descriptively by cohort rather than used to infer cross-edition differences in learning or competence. Satisfaction was evaluated across four ACSA-aligned domains and was descriptively high in all editions; in the combined within-participant analysis, the Teaching Team domain was rated higher than the other domains. Self-reported theoretical and practical knowledge ratings increased descriptively from pre- to post-course within each edition. The 2021 ratings were reconstructed retrospectively from qualitative responses and were therefore not pooled or directly compared with the directly scaled 2022–2023 ratings. Qualitative feedback highlighted the theory–practice balance and low student-to-instructor ratio, with longer duration as the principal suggestion. The findings support the feasibility and acceptability of this intensive R-based training model, but the uncontrolled design, non-equated examination, small samples, and self-reported outcomes preclude claims about learning improvement, causal effectiveness, or durable competence.
1. Introduction
Statistical literacy is a cornerstone of biomedical research, yet surveys consistently document substantial gaps among life-science graduates and early-career researchers (Garfield et al., 2008; Luque-Fernández & Negro Calduch, 2019). Doctoral students must navigate an increasingly data-intensive landscape—from randomised controlled trials to high-throughput omics—while most doctoral programmes devote limited formal instruction to quantitative methods (Council of the European Union, 2018). This mismatch between research demands and methodological preparation has tangible consequences: inadequate statistical training is linked to reproducibility failures, analytical errors, and a reduced capacity to critically evaluate the literature (Peng, 2009).
R (R Core Team, 2023) has become the reference environment for statistical computing in the life sciences, offering a rich ecosystem of packages through the Comprehensive R Archive Network (CRAN) and Bioconductor, together with literate-programming tools such as R Markdown and Quarto that promote transparent, reproducible research workflows (Peng, 2009; Chance et al., 2007). Its open-source nature makes it accessible regardless of institutional budget, and its vibrant international community continuously develops discipline-specific analytical resources. Unlike proprietary software such as SPSS, SAS, or Stata, R accompanies researchers throughout their careers independently of institutional licensing decisions.
Nevertheless, the transition from passive statistical consumers to active R users poses a considerable challenge. Students frequently report programming anxiety, unfamiliarity with command-line interfaces, and difficulty connecting statistical theory to code-based implementation (Garfield et al., 2007). These barriers call for pedagogically informed designs that go beyond traditional lecture formats and exploit the interactive, iterative character of R-based analysis.
Educational course design can be interpreted through several overlapping learning theories (Bruner, 1960; Piaget, 1973; Vygotsky, 1978; Sweller, 1988; Lave & Wenger, 1991; Zimmerman, 2002; Biggs & Tang, 2011), but presenting all of them as explanatory frameworks would overstate what a retrospective programme evaluation can support. We therefore restrict the pedagogical rationale to two design principles that map directly onto observable features of the course: Problem-Based Learning (PBL) and Cognitive Load Theory (CLT). These principles are used descriptively to explain design choices; their mechanisms were not tested and no theory-comparison hypotheses were prespecified.
PBL anchors instruction in authentic disciplinary problems and promotes application of statistical reasoning to concrete research questions (Garfield et al., 2008). In this course, that principle was reflected in the use of clinical and omics datasets from the outset so that statistical choices were motivated by biomedical questions rather than by abstract formula manipulation.
CLT (Sweller, 1988) provided a practical rationale for sequencing and scaffolding when students had to learn programming syntax, statistical concepts, and data interpretation simultaneously. The course therefore progressed from R syntax and the RStudio environment to inferential methods, while annotated R Markdown notebooks provided pre-written code structures that students could execute, inspect, and modify. Other features—including the low student-to-instructor ratio, instructor coaching, post-course materials, and alignment between objectives, exercises, and assessment—are described as practical design features rather than attributed to additional theoretical frameworks.
In response to documented needs at the IMIBIC/UCO research campus, an intensive course in applied biostatistics with R was designed and delivered annually from 2021 to 2023. A dedicated open-access textbook, Introducción a la Bioestadística con R (Mora Ortiz et al., 2022), was authored specifically for the course, combining pedagogical narrative, worked R examples, and practical exercises. The present article reports a single-centre retrospective programme evaluation of the course across three editions. The evaluation had four exploratory objectives: (i) to describe end-of-course examination performance across editions; (ii) to characterise satisfaction and self-reported pre/post knowledge patterns; (iii) to document edition-by-edition modifications introduced through the Plan-Do-Study-Act (PDSA) cycle; and (iv) to identify practical implications and limitations relevant to doctoral biostatistics training. No causal hypotheses were prespecified. The study’s distinctive contribution is the integration, across three consecutive editions, of criterion-referenced examination performance, ACSA-aligned multi-domain satisfaction, self-reported knowledge ratings, qualitative feedback, and a documented continuous-improvement cycle. This design permits the improvement process and concurrent outcome patterns to be described across editions rather than inferred from a single cohort.
2. Materials and Methods
2.1. Educational Context
This study was a retrospective observational evaluation of a routinely delivered educational programme. The course “Introduction to Biostatistics with R” was offered as a continuing doctoral education activity jointly organised by IMIBIC and UCO. Three editions were delivered between October 2021 and January 2023. Each edition admitted a maximum of 15 doctoral students enrolled in biomedical, biological, or health-science PhD programmes, selected on a first-come basis after brief background screening to ensure a minimum level of scientific preparation; demand exceeded available places, and waiting lists were generated. The course was delivered at IMIBIC during the first edition and in the Faculty of Medicine computer laboratory (UCO) during the 2022 and 2023 editions. Three instructors staffed each edition, yielding a student-to-instructor ratio of approximately 5:1. The study size was determined by the fixed course capacity and the available archival records rather than by an a priori power calculation. Table 1 summarises the logistical characteristics of each edition.
Table 1.
Course logistics across three editions.
2.2. Pedagogical Rationale
The course was not designed to operationalise or test multiple educational theories. For this retrospective programme evaluation, the pedagogical rationale is restricted to the two design principles most directly instantiated in the curriculum. PBL (Garfield et al., 2008) was operationalised by embedding each statistical technique within realistic biomedical research scenarios using authentic datasets. CLT (Sweller, 1988) informed sequencing from basic R syntax and the RStudio Integrated Development Environment (IDE) to inferential methods and motivated annotated R Markdown notebooks that reduced syntactic burden during guided practice. The 5:1 student-to-instructor ratio, post-course materials, and alignment between learning objectives, exercises, and examination items are reported as practical design features, not as tests of additional theoretical mechanisms.
2.3. Teaching Materials
The primary resource was a purpose-written open-access textbook, Introducción a la Bioestadística con R (Introduction to Biostatistics with R) (Mora Ortiz et al., 2022), written in the students’ native language to avoid the additional cognitive burden of simultaneously processing scientific/statistical content in a non-native language (English) while learning R’s programming syntax. The book was published by UCOPress (ISBN 978-84-9927-665-6) and was funded in part by the European Union’s Horizon 2020 programme under the Marie Skłodowska-Curie grant agreement No. 847468. The textbook was structured in ten sections mirroring the course content: from a motivational overview of R and the RStudio IDE through data types and objects, descriptive statistics, assumption testing, group comparisons (t-test, ANOVA, Kruskal–Wallis), correlation, linear models, power analysis, and advanced data visualisation. Each section opened with a concise list of key concepts, followed by an accessible narrative explanation and guided practical exercises.
A central pedagogical feature of the textbook was its explicit adoption of an interactive, pipeline-based approach to statistical analysis: rather than selecting options from a graphical menu, readers were guided to execute commands sequentially in R, inspect intermediate outputs, and use the results of each step to inform the next. This workflow mirrors professional practice in computational biology and data science and was reinforced throughout the course exercises. Each chapter was paired with a corresponding R Markdown (.Rmd) notebook containing executable code, inline commentary, and self-assessment questions using real biomedical datasets. All materials—textbook, notebooks, and datasets—were provided to participants before the start of each session and remained freely accessible after the course.
2.4. Curriculum
The three-day programme was structured around nine thematic modules arranged in a deliberate pedagogical sequence. The first two modules addressed the computational foundation: Module 1 introduced the R ecosystem and the RStudio IDE, covering package installation, object creation, basic data types, and directory management; Module 2 focused on data import and management, including inspection for missing values using is.na() and common data-wrangling operations. These early sessions were deliberately straightforward in statistical content to allow students to build confidence with the R environment before encountering inferential methods, consistent with CLT recommendations for managing intrinsic load.
Modules 3 and 4 introduced descriptive and exploratory analysis. Module 3 covered summary statistics using the Hmisc, pastecs, and psych packages, together with basic graphical displays; Module 4 addressed assumption testing—normality (Shapiro–Wilk test, Q-Q plots) and homogeneity of variance (Levene’s test)—providing the gateway to the parametric versus non-parametric decision framework that underpinned subsequent modules.
Modules 5 and 6 formed the inferential core of the course. Module 5 covered parametric group comparison: the independent-samples and paired t-test, one-way Analysis of Variance (ANOVA), and two-way ANOVA with interaction terms, all implemented using the rstatix package with publication-ready effect-size estimates. Module 6 introduced the non-parametric counterparts—the Wilcoxon rank-sum and signed-rank tests, and the Kruskal–Wallis test with Dunn post-hoc comparisons—and contextualised their use within the assumption-testing workflow from Module 4. Module 7 covered Pearson and Spearman correlation and simple linear regression, including diagnostic plots. Module 8 addressed power analysis and sample size calculation using the pwr package, emphasising the planning implications for research grant applications. Module 9, placed at the end of the programme to serve as an integrative capstone, explored advanced data visualisation with ggplot2, lattice, and ggpubr, applying these tools to summarise and communicate the results of analyses performed in earlier modules.
The thematic modules of the course map directly onto the chapters of the companion textbook (Mora Ortiz et al., 2022), enabling participants to review the theoretical background before each session and revisit worked examples independently afterwards. The curriculum as a whole is outlined below:
- Module 1: Introduction to R and RStudio (interface, packages, objects, data types)
- Module 2: Data import, inspection, and management (missing values, is.na(), data wrangling)
- Module 3: Descriptive statistics (Hmisc, pastecs, psych packages; summary tables and basic plots)
- Module 4: Assumption testing (normality: Shapiro–Wilk, Q-Q plots; homogeneity: Levene’s test)
- Module 5: Parametric group comparison (t-test, one-way and two-way ANOVA; effect sizes)
- Module 6: Non-parametric alternatives (Wilcoxon rank-sum/signed-rank, Kruskal–Wallis, Dunn post-hoc)
- Module 7: Correlation (Pearson, Spearman) and simple linear regression with diagnostic plots
- Module 8: Power analysis and sample size calculation (pwr package)
- Module 9: Advanced data visualisation (ggplot2, lattice, ggpubr)
2.5. Computational Environment
Participants used institution-provided computers running R (≥4.1.0) and RStudio Desktop (≥2021.09). Required CRAN packages (tidyverse, Hmisc, pastecs, psych, ggpubr, rstatix, pwr) and relevant Bioconductor packages were pre-installed from the 2022 edition onward—a procedural change made in direct response to 2021 feedback about setup delays. Installation scripts and instructions for replicating the environment on personal machines were distributed to all participants for post-course use.
2.6. Assessment
End-of-course examination performance was assessed in all three editions. Participants completed a ten-item multiple-choice examination scored from 0 to 10 (one point per item; no penalty for incorrect answers). Each item presented a clinical or methodological stem with four response options, exactly one of which was correct. The examination covered R-environment knowledge, statistical reasoning, and applied package operation. In 2021, an additional practical examination (0–5 scale) was administered and contributed to the final course mark; this component was discontinued in 2022–2023. The ten-item examination was not formally psychometrically validated or equated across editions. Consequently, examination results are reported descriptively by cohort, and no inferential between-edition significance test is retained in the final analysis. Items were aligned a priori with the stated learning objectives and were intended as a brief criterion-referenced end-of-course assessment rather than a validated measure of learning gain. The items were developed by the course teaching team from the learning objectives and worked examples in the companion textbook and were reviewed internally for content alignment before first use; the item bank was not subsequently subjected to a formal item-analysis or equating procedure.
2.7. Satisfaction Surveys
In addition to the examination, students completed the standard ACSA satisfaction questionnaire. The student instrument contained 19 quantitative items rated on an 11-point scale from 0 (lowest satisfaction/agreement) to 10 (highest). Seventeen items contributed to the four domains analysed in this study: Usefulness (3 items), Methodology (7 items), Organization and Resources (6 items), and Teaching Team (1 item). Two additional General Satisfaction items were collected as part of the full questionnaire but were not included in the four-domain inferential analyses. The Usefulness items addressed expectations, relevance, and applicability; Methodology addressed format, teaching methods, group organisation, evaluation, and tutorials; Organization and Resources addressed materials, facilities, duration, and logistical support; and Teaching Team was assessed with a single overall item. The instrument follows the standard questionnaire of the Agencia de Calidad Sanitaria de Andalucía (ACSA; Andalusian Health Care Quality Agency), routinely used for accredited continuing-education activities within the Andalusian public health system. The complete 19-item student instrument, the 13-item instructor instrument, and the four open-ended student prompts are reproduced in Appendix A.
A supplementary pre/post instrument captured self-reported theoretical and practical knowledge on a 0–5 scale. In 2022 and 2023, participants completed the numeric questionnaire on the first morning (pre) and final afternoon (post) of the course. In 2021, the available pre/post responses were qualitative and were retrospectively coded onto the same 0–5 scale independently by two raters, with disagreements resolved by discussion. Because the 2021 measurement procedure was reconstructed retrospectively and was not equivalent to the directly scaled 2022–2023 instrument, 2021 values are presented as reconstructed descriptive data and are not pooled or directly compared with 2022–2023. No inferential pre/post significance tests or pooled estimates are reported for this outcome. For the satisfaction-domain analysis, distributional assumptions were inspected with the Shapiro–Wilk test. Because several domain-by-year cells showed non-normality and ceiling effects, between-year comparisons were analysed with Kruskal–Wallis tests, within-year between-domain differences with Friedman tests, and pairwise post-hoc contrasts with Wilcoxon signed-rank tests using Holm correction. Effect sizes are reported as ε2 for Kruskal–Wallis tests and Kendall’s W for Friedman tests. Given the small and uneven annual samples (n = 7–14), descriptive patterns and effect sizes are emphasised alongside p-values, and non-significant results are not interpreted as evidence of equivalence or stability.
2.8. Continuous Improvement Process
After each edition, the instructional team conducted a structured review of satisfaction survey results and open-ended comments following the Plan-Do-Study-Act (PDSA) quality improvement cycle. Identified areas for improvement were directly operationalised in the subsequent edition. Specific modifications included: pre-installation of all required R packages before the 2022 sessions (addressing 2021 feedback about setup delays); provision of an additional set of post-course practice exercises at the end of the 2022 edition (responding to requests for more independent study materials); upgrading of the computing infrastructure in the 2023 venue (addressing complaints about slow machines and package installation failures in 2022); and extension of the data visualisation module in 2023 (responding to expressed interest in ggplot2).
3. Results
3.1. Student Profile
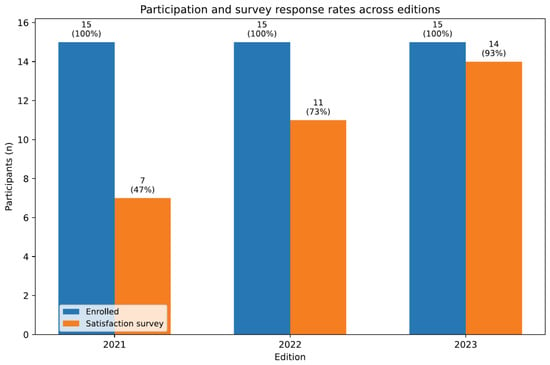
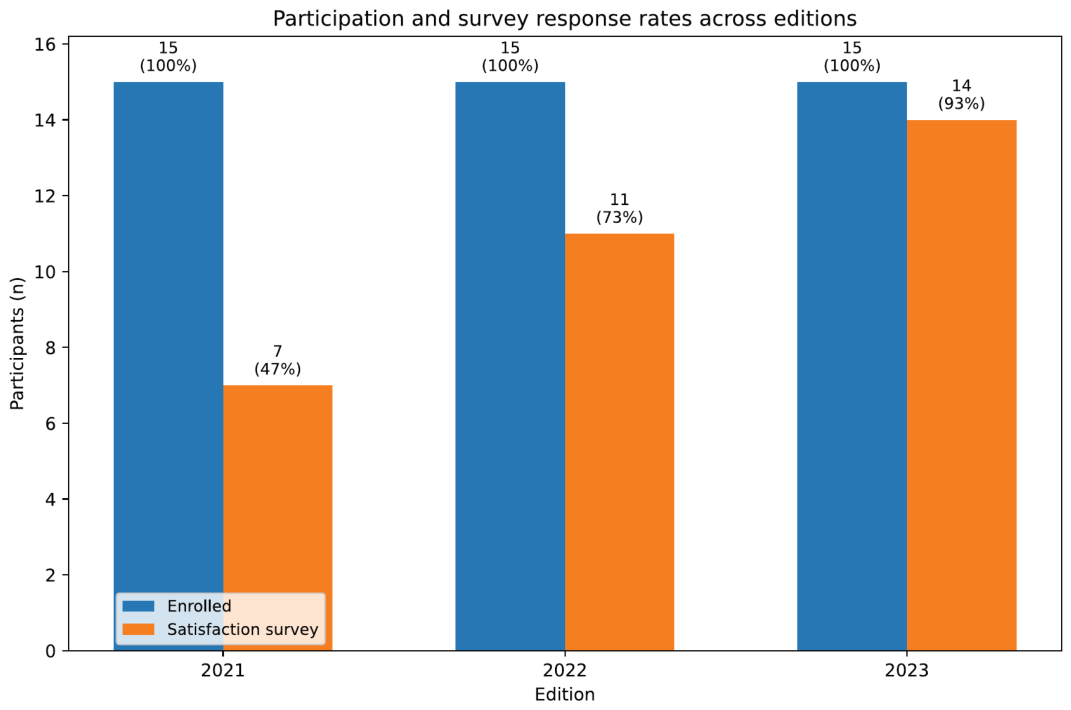
Across three editions, a total of 45 doctoral students were enrolled (15 per edition). The participant profile was broadly similar across years: most participants were enrolled in biomedical or biological science doctoral programmes and were aged 26–40 years. Prior R experience was consistently low: 57% of respondents in 2021, 73% in 2022, and 71% in 2023 reported little or no prior R experience. Satisfaction-survey response counts available for the domain analysis were 7 in 2021, 11 in 2022, and 14 in 2023 (Figure 1). With fewer than half of enrolled students responding in 2021 (7/15, versus 11/15 in 2022 and 14/15 in 2023), the 2021 satisfaction estimates are particularly susceptible to nonresponse bias, and cross-edition comparisons involving 2021 should be interpreted with this asymmetry in mind. The higher response rates in later editions coincided with the introduction of in-session survey completion as part of the PDSA cycle.
Figure 1.
Participation and survey response rates across the three course editions. Bars show the number enrolled and the number completing the satisfaction survey.
3.2. End-of-Course Examination Performance
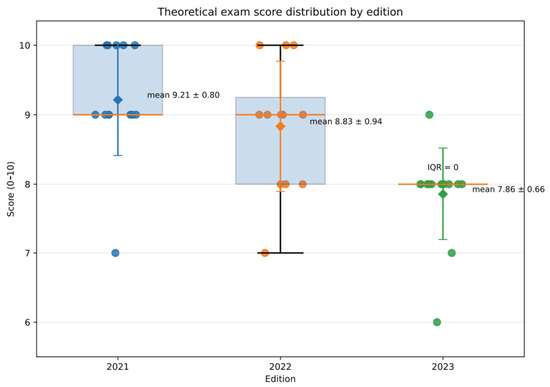
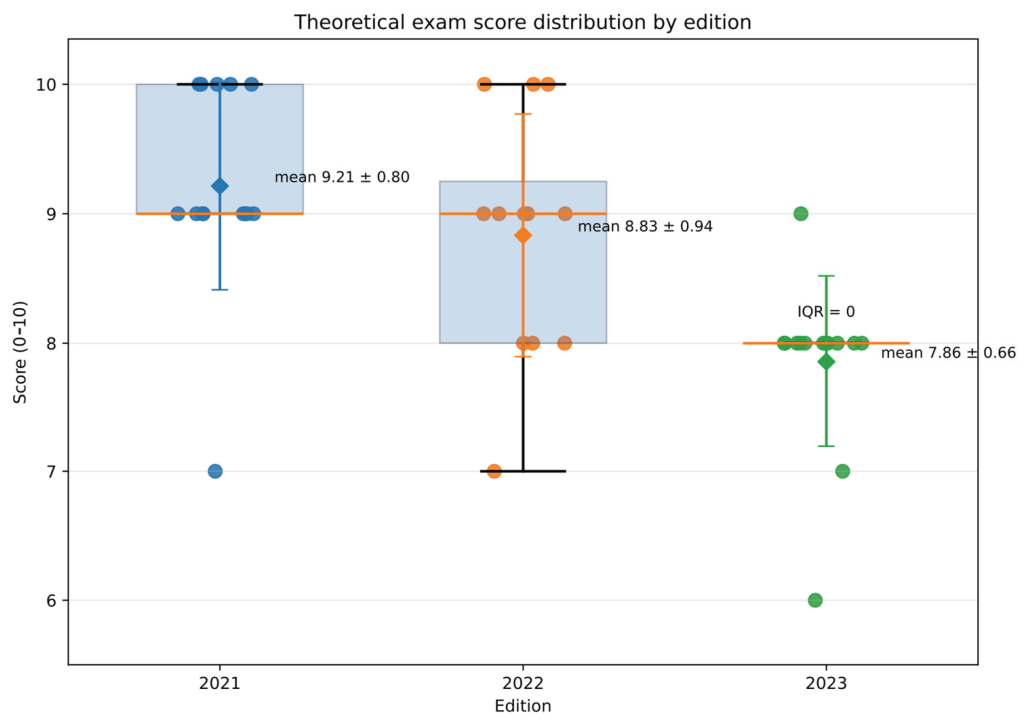
In the 2021 edition (n = 14), theoretical examination scores ranged from 7 to 10 out of 10, with a mean of 9.21 (Standard Deviation [SD] = 0.80). Five students achieved the maximum score of 10, eight obtained a 9, and one obtained a 7. In the 2022 edition (n = 12), theoretical examination scores ranged from 7 to 10 out of 10, with a mean of 8.83 (SD = 0.94). Three students achieved the maximum score of 10, five obtained a 9, three scored 8, and one obtained a 7. In the 2023 edition (n = 14), theoretical scores ranged from 6 to 9 out of 10, with a mean of 7.86 (SD = 0.66). Most students clustered around a score of 8 (n = 11), with one student scoring 9, one scoring 7, and one obtaining the minimum score of 6.
Figure 2 displays the distribution of theoretical examination scores by cohort. Because item difficulty was not psychometrically equated across editions, no inferential between-cohort significance test is reported. Descriptively, the 2023 cohort had a lower mean score than the 2021 and 2022 cohorts and a markedly compressed distribution: 11 of 14 students scored exactly 8, and Q1, median, and Q3 were all 8 (IQR = 0). These differences should not be interpreted as evidence of a change in learning, competence, or course quality. In 2021, the practical examination mean was 3.5/5 and the composite final mark was 8.1/10; these 2021-specific outcomes are reported descriptively because no equivalent practical component was collected in 2022–2023.
Figure 2.
Distribution of examination scores by edition. Boxplots show the median and interquartile range, with whiskers extending to the most extreme non-outlier values. Individual student scores are overlaid as filled points, and diamonds denote mean ± SD. In 2023, the box collapses to a horizontal line because Q1, median, and Q3 were all equal to 8 (IQR = 0). The shaded boxes represent the interquartile range, horizontal lines indicate the median, individual points represent participants, and diamonds denote mean ± SD. Blue indicates 2021, orange indicates 2022, and green indicates 2023.
3.3. Self-Reported Pre/Post Knowledge Ratings
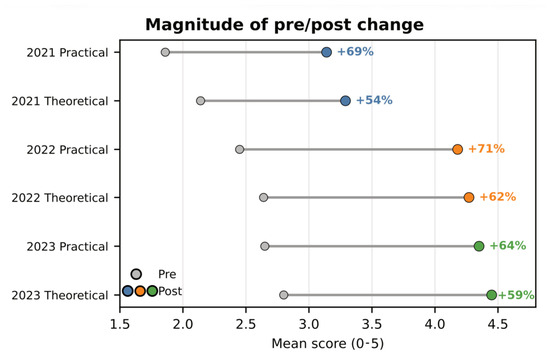
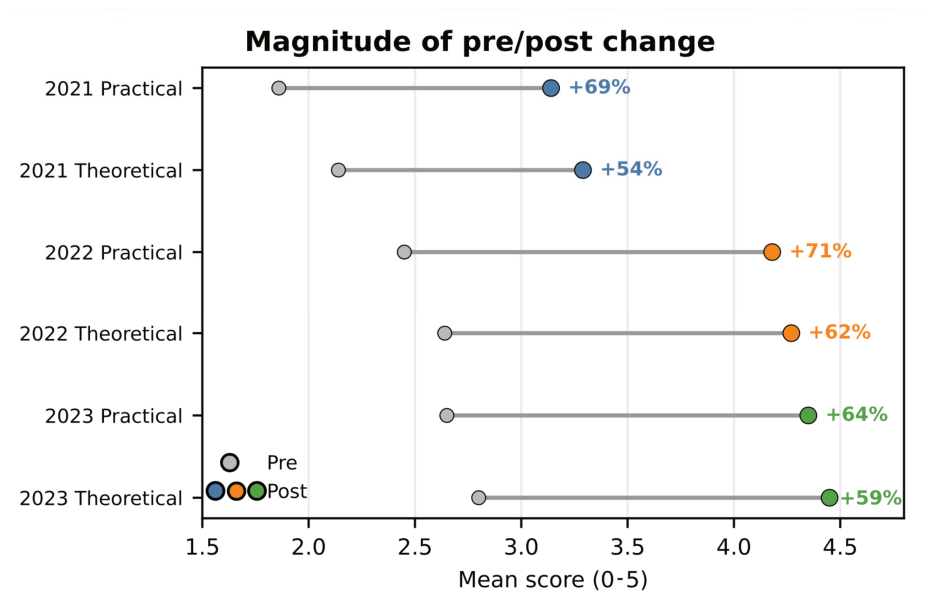
Self-reported theoretical and practical knowledge ratings were higher post-course than pre-course within each edition (Figure 3). Results are presented separately by edition. The 2021 data were reconstructed by retrospective coding of qualitative responses and are therefore not pooled or directly compared with the directly scaled 2022–2023 data; no inferential pre/post significance tests are reported. These ratings represent perceived change rather than demonstrated competence.
Figure 3.
Dumbbell plot of pre/post self-reported knowledge ratings by edition and knowledge type. Percentages indicate descriptive within-edition changes in mean ratings. The 2021 values were reconstructed retrospectively from qualitative responses and are not directly comparable with the directly scaled 2022–2023 ratings; no pooled or cross-edition inferential analysis was performed.
In the 2021 cohort (n = 7), the reconstructed theoretical rating increased from a pre-course mean of 2.14 to a post-course mean of 3.29/5 (+54%), and the reconstructed practical rating from 1.86 to 3.14/5 (+69%); these values are retained as archival descriptive information only. In the directly scaled 2022 cohort (n = 11), theoretical ratings increased from 2.64 to 4.27/5 (+62%) and practical ratings from 2.45 to 4.18/5 (+71%). In 2023 (n = 14), theoretical ratings increased from 2.80 to 4.45/5 (+59%) and practical ratings from 2.65 to 4.35/5 (+64%). Within the directly scaled cohorts, the direction of change is compatible with increased perceived knowledge after the course, but the uncontrolled design and self-reported nature of the measure preclude causal attribution or conclusions about demonstrated learning.
3.4. Satisfaction Survey Results
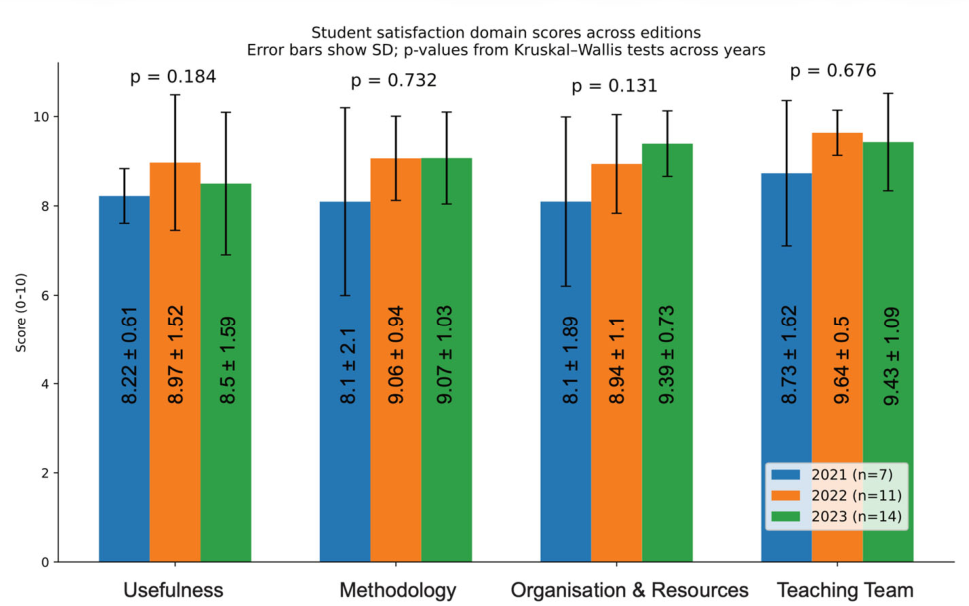
Descriptively, satisfaction-domain scores were high across all three editions. Kruskal–Wallis tests did not detect statistically significant between-year differences for any of the four domains (Table 2). Given the small and unequal sample sizes and ceiling effects in several domain-by-year cells, these null comparisons should be treated as inconclusive and not as evidence that satisfaction or programme quality was equivalent or stable across years.
Table 2.
Descriptive statistics and between-year comparisons of satisfaction domain scores (mean ± SD).
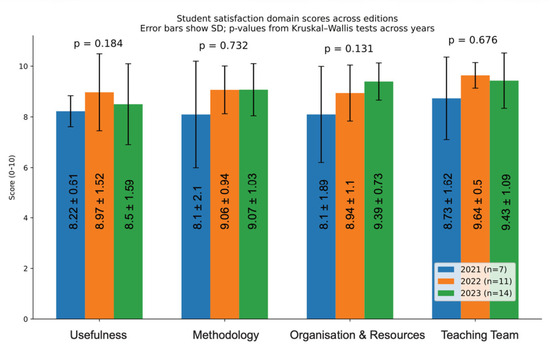
Within each edition and across the combined dataset, differences between domains were examined using Friedman tests (Table 3). In 2021, no significant domain differences were detected. Significant omnibus effects were observed in 2022 and 2023 and in the combined analysis (n = 32). The Teaching Team had the highest mean rating in each edition. In 2022, post-hoc tests showed higher Teaching Team ratings than Methodology and Organization and Resources; in 2023, Usefulness was rated lower than Methodology, Organization and Resources, and Teaching Team, while Organization and Resources exceeded Methodology. In the combined dataset, Teaching Team was rated higher than all three other domains. Global mean scores were: Usefulness = 8.60, Methodology = 8.86, Organization and Resources = 8.95, and Teaching Team = 9.35 (Figure 4). These within-respondent comparisons support relative domain rankings, but they do not establish between-cohort stability or overall programme effectiveness.
Table 3.
Within-year and global Friedman test results for differences between satisfaction domains.
Figure 4.
Student satisfaction domain scores across editions. Error bars show SD; p-values are the results from the Kruskal–Wallis tests across years.
Overall, the descriptive ratings indicate favourable participant experience, with the Teaching Team emerging as the highest-rated domain in the combined analysis. The absence of statistically significant between-year differences remains inconclusive because of limited power, unequal response rates, and ceiling effects.
3.5. Qualitative Feedback
Thematic analysis of open-ended survey responses across all three editions yielded a coherent pattern of findings. Three dominant positive themes emerged consistently. First, the integration of theory and practice was the most frequently cited strength: students repeatedly praised the hands-on, exercise-driven format and the clarity of the supporting textbook as a resource that made statistical concepts accessible without sacrificing rigour. Representative comments included: “The appropriate integration of theory and practice” (“La correcta combinación de la teoría con la práctica”, 2021); “The practical exercises using real data were the most useful component” (“Los ejercicios prácticos con datos reales fueron lo más útil”, 2022); and “The personalised support helped resolve questions in real time” (“La atención personalizada resolvió dudas en tiempo real”, 2023). Second, instructor accessibility was universally praised: the 5:1 student-to-instructor ratio was specifically cited as enabling individualised coaching, and the instructor’s approachable communication style was highlighted as reducing the anxiety that many students associate with statistics and programming. Third, the practical applicability of the materials was emphasised by participants who noted that the course directly addressed analytical challenges they were facing in their own research, with comments such as “Útil para mis estudios en metabolómica” (“Useful for my analysis in metabolomics”) underscoring the disciplinary relevance of the training.
The most prominent negative theme was insufficient course duration, mentioned in more than 70% of responses across editions. Students consistently expressed a desire for additional sessions to consolidate content and explore advanced topics including survival analysis, machine learning, and multi-omics integration. Secondary suggestions included the provision of more post-course exercises for independent practice, better management of heterogeneous prior knowledge within the group, and improvements to the computing environment (slow package installation and occasional computer failures were mentioned in 2022, issues addressed by the 2023 infrastructure upgrade).
3.6. Continuous Improvement Across Editions
The PDSA review cycle translated student and instructor feedback into documented modifications across editions. In 2022, required packages were pre-installed to address the setup delays reported in 2021, and a supplementary practice exercise set was later distributed in response to requests for more independent study. In 2023, the computing infrastructure was upgraded and the visualisation module was extended. These changes document a functioning continuous-improvement process. Because the cohorts were independent and there was no comparison condition, however, the available data cannot establish that the PDSA modifications caused the observed satisfaction or performance patterns.
4. Discussion
This single-centre retrospective programme evaluation documents an intensive applied-biostatistics course that was feasible to deliver, was rated favourably by participants, and yielded generally strong end-of-course examination scores. These findings are descriptive and should not be interpreted as causal evidence of course effectiveness or learning improvement. The favourable participant ratings and generally strong end-of-course performance are compatible with prior literature emphasising authentic data, active computing, and practice-oriented statistics teaching (Chance et al., 2007; Çetinkaya-Rundel & Ellison, 2021), but the present design does not test those pedagogical mechanisms. Satisfaction was high on the 0–10 scale in each edition, but the non-significant between-year Kruskal–Wallis tests are inconclusive given small, unequal samples and ceiling effects. Within respondents, the Teaching Team was the highest-rated domain in the combined analysis, while Usefulness was the lowest-rated domain in 2023.
The examination data show a descriptive between-edition pattern: mean theoretical scores were 9.21/10 in 2021, 8.83/10 in 2022, and 7.86/10 in 2023, and the 2023 distribution was markedly compressed, with 11 of 14 students scoring exactly 8 (IQR = 0). Because the ten-item examination was not psychometrically equated across years, the final analysis does not attach inferential statistical significance to these cross-edition differences. The observed pattern could reflect differences in cohort preparation or self-selection, item wording or difficulty, or other edition-specific factors, and the available data cannot distinguish among these explanations. Accordingly, the score pattern should be treated as descriptive variation in end-of-course examination performance rather than evidence of a change in learning, competence, or course quality.
Self-reported theoretical and practical knowledge ratings were higher post-course than pre-course within each edition, but these measures capture perceived rather than demonstrated learning and are vulnerable to response-shift bias, social desirability, and post-course overestimation. The 2021 series carries an additional and more fundamental comparability limitation because qualitative responses were retrospectively mapped to a numeric scale; it should therefore be regarded as reconstructed archival information rather than evidence of replication across editions. The directly scaled 2022–2023 ratings also remain self-reported and uncontrolled. Satisfaction findings require similar caution: the bounded 0–10 scale produced ceiling effects, and the 2021 response rate was only 47%. For these reasons, the most defensible satisfaction conclusion concerns relative domain rankings within respondents, particularly the strong Teaching Team ratings in the combined analysis, rather than claims of stable quality across cohorts.
Several limitations warrant explicit emphasis. First, the study was a retrospective programme evaluation without a comparison group, so causal attribution to the course is not possible. Second, there was no validated pre-course performance assessment; the ten-item examination measured end-of-course performance only, was not formally psychometrically validated, and was not equated across editions. It therefore cannot establish learning gains, and cross-edition examination results are interpreted descriptively only. Third, the 2021 practical examination was not repeated in later years, further limiting cross-edition comparability. Fourth, the pre/post knowledge outcome was self-reported, and the 2021 responses were retrospectively coded rather than collected directly on the 0–5 scale; this measurement non-equivalence precludes pooling or direct comparison of 2021 with 2022–2023. Fifth, satisfaction samples were small and unequal, with substantial potential for nonresponse bias in 2021, and ceiling effects limited the sensitivity of the 0–10 instrument to between-cohort differences. Sixth, sex- and age-stratified outcome analyses were not feasible because examination records were anonymous and could not be linked to individual demographic information in any edition; demographic linkage was available only for the 2021 satisfaction survey, in which the linked sample comprised one man and six women, precluding a meaningful sex comparison and preventing comparable demographic analyses across editions. Finally, the evaluation did not include longitudinal follow-up, so it cannot determine whether the course produced durable, transferable competence in participants’ subsequent research practice.
These limitations define clear priorities for future evaluation. A multi-centre replication with a comparison or waitlist-control condition would strengthen causal inference. A psychometrically validated pre/post performance assessment, using identical or formally parallel forms, would permit direct measurement of learning change and valid comparison across cohorts. Larger samples with prospectively linked demographic and outcome data would allow prespecified analyses of sex, age, and prior-background moderators. Finally, prospective evaluation of a longer or modular format, together with longitudinal assessment of whether participants correctly apply the methods in their own thesis analyses, would test whether the requested increase in course duration translates into better retention and durable competence.
5. Conclusions
Across three consecutive editions, this intensive course in applied biostatistics with R was feasible to deliver and was rated favourably by participants. Mean end-of-course theoretical examination scores were 9.2/10 in 2021, 8.8/10 in 2022, and 7.9/10 in 2023. The lower 2023 mean is reported descriptively; because the examination was not psychometrically equated across editions, it cannot be interpreted as evidence of a cross-edition change in learning, competence, or course quality. Self-reported theoretical and practical knowledge ratings were higher post-course than pre-course within each edition, but the reconstructed 2021 values are not directly comparable with the directly scaled 2022–2023 ratings. Satisfaction ratings remained high on the bounded 0–10 scale, and the combined within-respondent analysis identified the Teaching Team as the highest-rated domain. These outcomes are distinct and non-interchangeable: satisfaction reflects reported experience, the multiple-choice examination reflects end-of-course performance, and self-report reflects perceived knowledge. None of these measures, alone or in combination, demonstrates learning improvement, durable competence, or causal course effectiveness.
The principal practical implication is that a short, intensive format can provide an acceptable foundation for applied R training, but participants repeatedly requested more time to consolidate skills and address advanced topics. A modular or extended format therefore warrants prospective evaluation. More broadly, the study illustrates the value of pairing routine educational assessment with a documented continuous-improvement process while keeping conclusions proportionate to the design and measurement constraints.
Author Contributions
Conceptualization, M.M.-O., L.R.-G., and R.P.-R.; methodology, M.M.-O., L.R.-G., and R.P.-R.;; software, M.M.-O., L.R.-G., and R.P.-R.; validation, M.M.-O. and L.R.-G.; formal analysis, M.M.-O.; investigation, M.M.-O. D.G.-G., and L.R.-G.; resources, M.M.-O., D.L.-G. and I.V.-U.; data curation, M.M.-O. and D.G.-G.; writing—original draft preparation, M.M.-O. and R.P.-R.; writing—review and editing, M.M.-O.; visualization, M.M.-O. and R.P.-R.; supervision, M.M.-O., L.R.-G. and D.G.-G.; project administration, M.M.-O.; funding acquisition, M.M.-O. E.P.-P.: Investigation, Writing—original draft; P.P.-M.: Supervision, Project administration. All authors have read and agreed to the published version of the manuscript.
Funding
This research received no external funding.
Institutional Review Board Statement
The research team contacted the Research Ethics Committee of Reina Sofía University Hospital (Andalusian Health Service, Córdoba) regarding this evaluation. The Committee indicated that the study did not fall within its remit and that formal ethical review and approval were not required, as the work is a retrospective, non-interventional evaluation of routinely collected educational-assessment data (examination scores and the mandatory ACSA satisfaction questionnaire administered as part of standard continuing-education quality-assurance procedures); participants were not assigned to any group, condition, or intervention, no health-related data or biological samples were collected, and results are reported only in aggregated, non-identifiable form.
Data Availability Statement
The data presented in this study are available on request from the corresponding authors due to institutional data-protection restrictions on student records.
Acknowledgments
The authors would like to thank the Instituto Maimónides de Investigación Biomédica de Córdoba (IMIBIC) and Reina Sofía University Hospital for providing the institutional resources and facilities that supported this course. We also thank all the students who participated in the course and the University of Córdoba and IMIBIC staff involved in its organization and delivery for their valuable support and collaboration. Declaration of Generative AI and AI-Assisted Technologies: During the preparation of this manuscript, the authors used ChatGPT v. 5. and Anthropic v. 5. for the purposes of improving English language phrasing, structuring paragraphs for logical flow and coherence, identifying relevant bibliographic references, and helping synthesize the core theoretical frameworks. The authors have reviewed and edited the output and take full responsibility for the content of this publication.
Conflicts of Interest
The authors declare no conflicts of interest.
Abbreviations
The following abbreviations are used in this manuscript:
| Abbreviation | Full term |
| ACSA | Agencia de Calidad Sanitaria de Andalucía |
| ANOVA | Analysis of Variance |
| CLT | Cognitive Load Theory |
| CRAN | Comprehensive R Archive Network |
| IDE | Integrated Development Environment |
| IMIBIC | Instituto Maimónides de Investigación Biomédica de Córdoba |
| PBL | Problem-Based Learning |
| PDSA | Plan-Do-Study-Act |
| R | R programming language for statistical computing |
| SD | Standard Deviation |
| UCO | Universidad de Córdoba |
Appendix A
This appendix reproduces the full quantitative item set and the open-ended qualitative prompts referred to in Section 2.7. The student questionnaire follows the standard instrument of the Agencia de Calidad Sanitaria de Andalucía (ACSA), routinely used for accredited continuing-education activities within the Andalusian public health system. All quantitative items were rated on an 11-point scale (0–10), where 0 indicated the lowest level of satisfaction/agreement and 10 the highest.
Appendix A.1. Student Questionnaire (Quantitative Items)
Usefulness (items 1–3)
- The expectations I had regarding the usefulness of this training activity were met.
- The content developed during the training activity was useful and adapted to my expectations.
- I will be able to apply the knowledge acquired in my professional practice.
Methodology (items 4–10)
- 4.
- The format (course, seminar, workshop, rotation, etc.) was adequate to achieve the objectives.
- 5.
- The modality (in-person, remote, e-learning, etc.) facilitated learning of the content taught.
- 6.
- The teaching methods used by the instructors were adequate for the optimal development of the activity.
- 7.
- Where applicable, the distribution of groups was appropriate for the development of the activity.
- 8.
- The evaluation system used allowed me to know my level of mastery after completing the activity.
- 9.
- The number of tutorials/office hours established was adequate to address my needs and queries.
- 10.
- The tutorials/office hours held allowed me to resolve my doubts and queries.
Organization and Resources (items 11–16)
- 11.
- Documentation and materials were provided with sufficient notice for the development of each module.
- 12.
- The teaching materials and resources made available were adequate for the optimal development of the activity.
- 13.
- The physical or virtual facilities facilitated the development of the activity.
- 14.
- The duration of the activity was adequate to achieve the objectives set at the outset.
- 15.
- The secretariat and coordination of the activity provided adequate support for its optimal development (registration, communication, certificates, etc.).
- 16.
- Overall, the logistical organisation contributed to the development of the training activity.
Teaching Team (item 17)
- 17.
- Overall, I am satisfied with the participation and performance of the teaching team.
General Satisfaction (items 18–19; collected as part of the ACSA instrument but not included in the four-domain inferential analyses)
- 18.
- Overall, I am satisfied with the development of the activity.
- 19.
- I would recommend this training activity to other professionals.
Appendix A.2. Instructor Questionnaire (Quantitative Items)
A parallel 13-item instrument, following the same ACSA framework, was completed by the teaching team after each edition.
Organization and Resources (items 1–8)
- Prior information about my participation as an instructor was adequate and received with sufficient notice.
- The time allocated for my participation as an instructor was adequate for the content to be taught.
- The scheduled timetable for my session/tutoring was respected.
- The secretariat and coordination of the activity provided adequate support for its optimal development (registration, communication, certificates, etc.).
- I was able to access the information and resources needed to plan and deliver my participation as an instructor.
- The teaching resources made available to me were adequate for the optimal development of the activity.
- The physical or virtual facilities facilitated the development of the activity.
- Overall, the logistical organisation facilitated my participation as an instructor in the training activity.
Participation of the Students (items 9–13)
- 9.
- The participants in the activity matched the expected profile.
- 10.
- The number of participants allowed me to provide adequate attention to the students.
- 11.
- I was informed with sufficient notice of the students’ prior level of mastery of the content to be taught.
- 12.
- I was informed of the students’ expectations with sufficient notice to adapt my session accordingly.
- 13.
- Overall, I am satisfied with the development of the activity.
Appendix A.3. Open-Ended Qualitative Prompts (Student Questionnaire)
The following four open-ended prompts were administered identically in every edition:
- “The best part of the activity was…”
- “What should be improved is…”
- “What I missed was…”
- “Other suggestions or comments:”
References
- Biggs, J. B., & Tang, C. S. (2011). Teaching for quality learning at university: What the student does (4th ed.). McGraw-Hill; Society for Research into Higher Education; Open University Press. [Google Scholar]
- Bruner, J. S. (1960). The process of education. Harvard University Press. [Google Scholar]
- Chance, B., Ben-Zvi, D., Garfield, J., & Medina, E. (2007). The role of technology in improving student learning of statistics. Technology Innovations in Statistics Education, 1(1), 1–26. [Google Scholar] [CrossRef] [Scilit]
- Council of the European Union. (2018). Council recommendation of 22 May 2018 on key competences for lifelong learning. Official Journal of the European Union, C189, 1–13. [Google Scholar]
- Çetinkaya-Rundel, M., & Ellison, V. (2021). A fresh look at introductory data science. Journal of Statistics and Data Science Education, 29, 4. [Google Scholar] [CrossRef] [Scilit]
- Garfield, J., Ben-Zvi, D., Chance, B., Medina, E., Roseth, C., & Zieffler, A. (2008). Developing students’ statistical reasoning: Connecting research and teaching practice. Springer. [Google Scholar]
- Garfield, J., Ooms, A., & Chance, B. (2007). Assessing students’ conceptual understanding after a first course in statistics. Statistics Education Research Journal, 6(2), 28–58. [Google Scholar] [CrossRef] [Scilit]
- Lave, J., & Wenger, E. (1991). Situated learning: Legitimate peripheral participation (1st ed.). Cambridge University Press. [Google Scholar]
- Luque-Fernández, M. Á., & Negro Calduch, E. (2019). Education in public health, epidemiology and biostatistics in Spain from a global and comparative perspective. Gaceta Sanitaria, 33, 502–503. [Google Scholar] [CrossRef] [Scilit]
- Mora Ortiz, M., Pino Ángeles, A., & Jiménez, F. A. (2022). Introducción a la bioestadística con R. Editorial Universidad de Córdoba. [Google Scholar]
- Peng, R. D. (2009). Reproducible research and biostatistics. Biostatistics, 10, 405–408. [Google Scholar] [CrossRef] [Scilit]
- Piaget, J. (1973). To understand is to invent: The future of education. Grossman Publishers. [Google Scholar]
- R Core Team. (2023). R: A language and environment for statistical computing. R Foundation for Statistical Computing. Available online: https://www.R-project.org/ (accessed on 1 March 2021).
- Sweller, J. (1988). Cognitive load during problem solving: Effects on learning. Cognitive Science, 12, 257–285. [Google Scholar] [CrossRef]
- Vygotsky, L. S. (1978). Mind in society: The development of higher psychological processes. Harvard University Press. [Google Scholar]
- Zimmerman, B. J. (2002). Becoming a self-regulated learner: An overview. Theory Into Practice, 41, 64–70. [Google Scholar] [CrossRef] [Scilit]

Disclaimer/Publisher’s Note: The statements, opinions and data contained in all publications are solely those of the individual author(s) and contributor(s) and not of MDPI and/or the editor(s). MDPI and/or the editor(s) disclaim responsibility for any injury to people or property resulting from any ideas, methods, instructions or products referred to in the content. |
© 2026 by the authors. Licensee MDPI, Basel, Switzerland. This article is an open access article distributed under the terms and conditions of the Creative Commons Attribution (CC BY) license.