


Abstract
Experiential learning through simulations offers a unique but often underutilized opportunity to bridge the gap between pedagogy and empirical research. This study addresses this gap by transforming the Pemberton’s Dilemma simulation from a classroom exercise into a quantitative, empirical research project to investigate the dynamics of trust, cooperation, and opportunistic behavior. To address questions related to such trust interactions, the simulation was modified to include variable payout stakes, restricted and permitted communication phases, and an additional surprise round to measure long-term trust reputation effects. From 2017 through 2025, data was gathered from a convenience sample of 611 students from a large public university in the Northwestern United States. Results indicate that non-trusting behavior has a significantly greater mirroring effect than trusting behavior and that higher financial stakes frequently prime groups toward opportunistic hedging. While opportunistic strategies yielded greater short-term gains, longitudinal analysis revealed a significant positive correlation between consistent trust and monetary outcomes. Furthermore, the surprise round data confirmed that prior trust violations severely diminished cooperation and earnings in the future unknown round. The study supports the benefits of integrating quantitative research into pedagogical experiential tools to advance scholarly understanding (in this case of trust dynamics and the vital role of transparent communication and sustainability-compatible strategies), enhance student learning, and to provide data-driven recommendations for organizations.
1. Introduction
Traditionally, experiential learning has been framed almost exclusively as a teaching strategy—a wonderful pedagogical tool to aid student involvement and learning (Daday et al., 2025). However, scholars are now recognizing that too often there are missed opportunities to expand that learning and to discover new knowledge, that instead of only creating and assessing learning outcomes, simulations and in-class activities can be used as controlled laboratories to gather high-fidelity data on social interaction, decision-making, and cognitive heuristics (Uziel, 2004). Particularly, learning can be increased beyond the typical student reflections by (1) creatively expanding the scope of the given exercise or activity being used, and (2) using the activity and resultant student experience as a research mechanism by gathering and analyzing data from it. In other words, rather than thinking of teaching and research as two separate silos, they can be combined in novel, iterative ways that benefit multiple constituencies (Saenz & Cano, 2009). In a cyclical fashion, a simulation tool for learning can produce research findings that inform the literature, further augment students’ learning, influence future research questions that lead to modified simulations to address those questions, allow additional discovery to be shared with students, and so forth. Scholars are thus calling for a methodological shift to view and use pedagogical activities like simulations as an extended research tool (Uziel, 2004; Waseem, 2024). This paper responds to that call to pursue the serendipitous benefits of expanding the role of simulations in this way. Specifically, I modify the Pemberton’s Dilemma trust simulation (Lewicki et al., 2020) that students participate in and collect and analyze the data in order to address important research questions related to trust interactions. The resultant research findings can then be used to expand student learning, add to the scholarly literature, and provide individuals and organizations with practical recommendations to improve their interactions to reap the benefits that trust enables.
1.1. Experiential Learning
A well-established literature has validated the educational benefits of various forms of experiential learning including co-op programs, study abroad opportunities, internships, service-learning and other community-based projects, along with in-class exercises, activities, and simulations (Daday et al., 2025; Theurl et al., 2024). Collectively, these are often termed high-impact practices (Brownell & Swaner, 2010) and have been credited in empirical studies as enhancing student deep learning, engagement, success, and achieving learning outcomes (Kapania et al., 2025; Salinas-Navarro et al., 2024; Zilvinskis et al., 2022). Simulations have been shown to be particularly useful by allowing students to experience high-fidelity, real-life issues in a protected educational environment (Greenberg & Tomlinson, 2004; Uziel, 2004).
For instance, in the health care field, many simulations are designed as interventions to help students practice and improve in some area. Examples include using mannequins on which to practice nursing (Orabil et al., 2025), student teams comprising different health areas to practice collaborative care (Graves et al., 2025), role-play clinical care disagreement scenarios between medical students and nurses to better understand and practice the dynamics of conflict resolution (Huth et al., 2025), and even nursing students acting as patients to reflect on the importance of empathy from the patient’s perspective (ter Beest et al., 2018). Business and management sciences are another educational area that have discovered the benefits of using simulations as a pedagogical tool to improve students’ learning enjoyment (Bitrián et al., 2020), positive attitudes (Gatti et al., 2019), student engagement and motivation (Bitrián et al., 2020; Huang et al., 2022), and self-assessed subject matter understanding and life skill development in first-year students (Scheuring & Thompson, 2025). These are important examples of the efficaciousness of using simulations in promoting positive student outcomes. However, again, there are fewer examples where the research connected with a simulation has been expanded to produce empirical support for or greater knowledge in the content area of the simulation (Saenz & Cano, 2009).
1.2. The Importance of Trust
A particularly important domain to understand and master for individual and organizational success that is ripe for applying simulations is trust. Trust is typically defined as “a firm belief in the reliability, truth, ability, or strength of someone or something,” (Oxford University Press, n.d.). Importantly, trusting also entails vulnerability, hope, and risk—letting go and placing some aspect of one’s safety or success in the hands of another, allowing oneself to be vulnerable and trust that another will be there for you when you are at risk (Deutsch et al., 2006). Why then would anyone ever trust? Perhaps because the potential upside rewards through cooperation can be compelling, and the increased costs by not trusting can be damaging (Taghian et al., 2015). Scholars have studied the meaningful costs introduced into relationships, companies, and countries due to lack of trust and trustworthiness with employees, customers, suppliers, and the public. For example, a lack of trust between these constituencies is believed to be a significant obstacle to financial performance, innovation, and long-term sustainability (Bencsik et al., 2020; Oláh et al., 2019). When trust is absent, businesses face higher costs in monitoring, enforcement, and negotiation, reduced cooperation, and market inefficiencies (Bencsik et al., 2020; Cline et al., 2022; Tisdell, 2008). On the other hand, studies have found that trust can act as a foundational component for collaboration, building companies’ reputations, and efficient market functioning (Cline et al., 2022; Taghian et al., 2015; Tisdell, 2008). Unfortunately, reports suggest that many firms underestimate or fail to recognize altogether the negative economic impacts of not trusting or the benefits of establishing cooperation (Bencsik et al., 2020). Similarly, Covey (2018, p. 13) has argued that “trust in organizations is a misunderstood, overlooked, and underutilized asset,” that instead of actually trusting, people behave opportunistically, focus on protecting themselves, and default to legalistic, bureaucratic, time-killing, and check-and-balance processes (Covey, 2018). Thus, research to discover more about the factors that influence trust exchanges and optimal outcomes is vital.
1.3. Enhancing the Use of the Trust Dilemma Simulation
Inherent in all trust decisions is a conundrum due to the possibility of greater gain if the other party also acts trustingly, or greater loss if the other party acts opportunistically (Deutsch et al., 2006). This dilemma in trust situations was conceptually formalized in 1950 by mathematicians Merrill Flood and Melvin Dresher (Flood, 1950). Later that year Albert Tucker created the well-known prison scenario dubbed the “Prisoner’s Dilemma” (Tucker, 1950/1989). Specifically, the scenario was that two criminal partners were interrogated in separate rooms and incentivized to betray the other person (who would then receive a heavier sentence) in exchange for the betrayer receiving a lighter sentence. If both betrayed, they would each receive the lighter sentence. However, if both criminals did not betray their partner (cooperate), both would go free! As formulated, the “mathematically correct” solution is mutual defection; and yet that is also the worst collective outcome for both parties. This underscores the importance of trust to achieve optimal outcomes. Years later an offshoot simulation called “Pemberton’s Dilemma” (PD) was created and adopted as a pedagogical tool within business schools to help students understand principles of trust, interdependence, and the pressure between cooperation and competition (Lewicki et al., 2020).
A traditional Pemberton’s Dilemma simulation has several adaptations that create a superior pedagogical tool. First, it reflects a business scenario, making it more relevant and relatable to students than a criminal context. Specifically, it involves two competing retail stores that must decide to either remain open on Sunday (the opportunistic, defecting choice) or close on Sunday (the trusting decision with greater mutual gains, but also a potentially weaker outcome). Other improvements include students making decisions within groups versus as individuals, having multiple rounds so that groups/stores interact repetitively with the same party over time, and allowing communication with the other store (Lewicki et al., 2020). As such, this simulation creates a safe environment for students to experience how cooperation may be established, how trust may disappear under meaningful financial pressure, and the importance of cooperation in an iterated environment (Aldo & Avila, 2021). That being said, a review of the literature reveals that the use of the Pemberton’s Dilemma for pedagogical and related research purposes has been severely constrained. The scarcity of research has been primarily limited to having students submit reflective papers on their experience following participating in the simulation (e.g., Carranza, 2018; Ramos, 2014). A handful of other studies used the Prisoner’s Dilemma to test constructs that might influence participants to behave more cooperatively or more selfishly. These include how socially close participants feel to the other party (Aldo & Avila, 2021), modifying the payout schedule (Locey et al., 2013), the level of participant traits like pro-social or paranoia (Ellett et al., 2013; Sun et al., 2023), and how trusting behaviors were perceived by participants (Misra & Kalro, 1979). These are on the right track.
Taken as a whole, then, ‘research’ has been mostly comprising localized, qualitative data collection such as student reactions, rather than large, externally published, generalizable empirical studies (e.g., Lewicki et al., 2020). As such, although the use of trust simulations in education provides a foundational pedagogical benefit, current applications often lack the depth and methodological creativity required to maximize knowledge discovery (Uziel, 2004). Thus, the present study contributes to the literature in the following ways. First, it addresses the gap by repositioning the Pemberton’s Dilemma to operate simultaneously as both a pedagogical instrument and a rigorous behavioral research context. The study also includes a meaningful enhancement of the Pemberton’s Dilemma simulation itself, creating a more sophisticated mechanism to foster more comprehensive student learning and create a rigorous behavioral research context. Next, this study utilizes the modified simulation to facilitate large-scale, quantitative empirical research designed to investigate some important underlying dynamics of trust decisions. Finally, this dual-purpose approach offers a significant contribution to the field by answering the call to bridge the gap between classroom instruction and scholarly inquiry (Saenz & Cano, 2009) through a simulation that provides empirical advancement and practical application in the field of behavioral science.
1.4. Exploratory Questions
As stated previously, the domain objective was to discover various elements that influence trusting exchanges and their related outcomes, by providing empirical, quantitative testing and analysis using an enhanced version of the Pemberton’s Dilemma. Owing to the limited research of trust dynamics involved in the Pemberton’s Dilemma simulation, the present study is somewhat exploratory in nature and is thus formulated by research questions with a priori expectations, instead of hypotheses. The specific questions/areas investigated were based on and informed by a review of the relevant trust literature along with reasoning related to the simulation. As such, this study provides some of the first empirical testing of the following questions within the Pemberton’s Dilemma.
- Q1: Does trusting or does non-trusting behavior have a larger influence on the subsequent behavior of the paired group?
In one case, if a group behaved opportunistically, to what extent would their paired group follow suit and behave opportunistically in the next round? In another case, if a group showed trust, would that cause their paired group to act trustingly in the next round? The inquiry, then, was to determine the presence and the relative magnitude of these two mirroring or reciprocal effects. Related initial work in this area posits that trust is easier to destroy than to build, that opportunistic behavior is often seen as more informative of a person’s true character, and that the sting of being taken advantage of creates a stronger defensive reaction to another’s mistrust than the pleasantness of their cooperation—this has been coined the trust asymmetry principle (Slovic, 1993). In their seminal work, Baumeister et al. (2001) argued that negative information carries more weight than positive information across many domains, including social trust. Other scholars have similarly posited that an opportunistic move by a group can shift the equilibrium of a relationship toward mutual defection (Labianca & Brass, 2006). Sociologists have theorized this is because people may be biologically and socially primed to prioritize a potential warning sign of a breach of trust over the positive signal of a cooperative gesture (Schneier, 2012). In one empirical study using a simple game where players moved pieces either opportunistically or cooperatively, they found that participants were more likely to punish an intentional act of opportunism than they were to reward an intentional act of cooperation (Offerman, 2002). Consistent with this research, and given the parameters inherent in the Pemberton’s Dilemma (i.e., greater downside risk when trusting, along with the potential for a more positive outcome by behaving opportunistically if the other group trusted), it was anticipated that a group’s opportunistic behaviors would have a larger impact than would their trusting behaviors on the subsequent actions of their paired group.
- Q2: What is the influence of greater stakes on trusting behavior decisions?
In other words, would a modified payout matrix with greater potential reward and greater potential risk cause groups to become more cooperative or more opportunistic? While a simple economic model might suggest that higher rewards always lead to higher opportunism, competing research theories reveal a more complex social–psychological relationship that also predicts an increase in trustees’ reciprocity. On the one hand, behavioral economics argues that when stakes are raised, people’s focus shifts toward opportunism due to the increased tension produced by (1) greed—potential greater gain, and by (2) the fear of betrayal—avoiding greater potential loss (e.g., Bohnet & Zeckhauser, 2004; Mazar et al., 2008). First, Transaction Cost Theory (TCT) posits that most people are bounded ethically, that as the reward for acting opportunistically increases, individuals shift from normative decision-making (what is right) to calculative decision-making (what is profitable) (Cuypers et al., 2021). When the value of the material gain outweighs the perceived immediate costs, people reach their “tipping point” and frequently choose to act unscrupulously (Mazar et al., 2008). Second, Betrayal Aversion Theory posits that as the potential loss grows larger, people move from a “social preference” mindset relying on reciprocity, to a “risk-assessment” mindset (Malhotra, 2004). Their aversion to being betrayed intensifies, fearing both the potential financial loss and the emotional cost of being a “sucker.” This may lead people to choose the safer, albeit lower-reward option over the higher stakes cooperative leap-of-faith (Bohnet & Zeckhauser, 2004). An empirical study using a simple trust game supported these theories; participants were more likely to behave opportunistically when the payout was significantly higher (Berg et al., 1995).
On the other hand, Trustee Reciprocity Theory posits that in trust scenarios when the stakes increase, so often does a sense of obligation. In high-stakes situations, trustees may feel a stronger normative pressure to reciprocate trust to avoid the guilt of a high-value betrayal (Fehr & Schmidt, 1999). Additionally, conflicting data demonstrated that although people may be more likely to lie as their own gain increases (as argued by TCT), they are less likely to lie as the loss to the other party increases (Gneezy, 2005). This highlights a complexity of the Pemberton’s Dilemma since the choice to act opportunistically in the double-stake’s scenario simultaneously results in a greater gain for oneself and a complete loss (zero dollars) for the other party. Since these different theories support opposite positions, it makes it more complicated to predict how people will act in higher-stakes environments. That being said, in the present study I predicted participants would become more opportunistic when the stakes were raised.
- Q3: What is the influence of the number of future rounds remaining on trusting behavior decisions?
When parties expect to interact on multiple occasions over a long time, their interdependence becomes more salient, and the fear of losing out on the future large rewards of repeated cooperation may outweigh the present gain of acting opportunistically (Axelrod, 1984). This phenomenon is explained by the Folk Theorem, which states that in an infinitely repeated game, outcomes that are mutually beneficial can be maintained if (1) the parties value the future, and if (2) there is a way to “punish” a party who acts opportunistically (Fudenberg & Maskin, 1986). Simply stated, as the number of expected future interactions increases, the likelihood of cooperation rises while the temptation for opportunism falls. In contrast, then, as a series of interactions comes closer to the end, the incentive to act opportunistically would rise (Ambrus & Pathak, 2011; Engle-Warnick & Slonim, 2004). By extension, in a final round with no recognized financially negative repercussions from betraying the other party, Folk Theorem would predict that trust would evaporate and opportunistic behaviors ensue. Taken together then, I predicted that there would be a positive relationship between trust behaviors and the number of rounds remaining, and that in the last interaction, defection would be at its highest.
- Q4: What is the impact of restricted and permitted communication between paired groups on trusting behaviors and on money made?
Without the ability to communicate, groups may default to pessimistic assumptions about the other party’s greed, leading the group to preemptive opportunism (Bicchieri et al., 2022). In general then, the academic literature supports a positive relationship between communication and cooperation (e.g., Balliet, 2010) due to the following psycho-sociological factors. First, communication can shift one’s view of an anonymous “opponent” into a human partner, increasing empathy and triggering social norms of fairness. For example, making an agreement to cooperate can create a social contract, and people have a psychological aversion to breaking explicit promises (Bicchieri & Lev-On, 2007). Next, parties can use communication to align their goals, coordinate a plan, and synchronize their expectations (Kollock, 1998). Communication can also create the ability to signal and thus better understand the intent of the parties (Bicchieri et al., 2022). However, it has also been found that communication is sometimes used to facilitate sophisticated opportunism. Specifically, a person may intentionally build a false sense of security in the other party before defecting in a final round (Rogers et al., 2017). In the present study, it was anticipated that the opportunity to communicate with one’s paired group would permit verbal assurances of their commitment to act cooperatively and thus result in more decisions to trust. As well, since interacting cooperatively leads to more beneficial outcomes, it was also predicted that groups would make more money during rounds when they could communicate with their paired store.
- Q5: What is the impact of a group’s trusting behaviors on how much money they make?
Behavioral economics and psychology research postulate nuanced relationships between how much people trust, how trustworthy they are, the societal environment, and their financial success. For example, Slemrod and Katuscak (2005) posit that (1) those engaging in trusting behaviors (willingly making oneself vulnerable to another) will earn higher incomes, as trust allows them to enter into more transactions, delegate tasks, and form professional networks; but (2) those engaging in trustworthiness (honoring another’s vulnerability rather than acting opportunistically) will have lower incomes, because opportunistic individuals can capture greater payoffs by cheating in one-off transactions or cutting corners when monitoring is low. Butler et al. (2016) have a slightly different take, predicting that both low trusters (who are overly pessimistic and forgo many profitable opportunities by refusing to collaborate or delegate) and high trusters (who are overly optimistic, enter too many risky agreements, and are cheated more frequently) will earn less. They argue that higher income is typically achieved by individuals with an intermediate-to-high level of trust whose actions align with the actual average trustworthiness of the population. This last part hints at another notion, that the financial payoff for trusting may depend on the social climate of the country or industry. It is argued that in high-trust societies, where reputation is easily tracked, trustworthiness is a financial asset, and honest parties are sought out for the most lucrative, long-term partnerships. Whereas, in low-trust societies, opportunism is more financially rational because trustworthy people are often exploited and there are few reputational rewards for honesty (Slemrod & Katuscak, 2005; Zak & Knack, 2001). Still other scholars highlight the importance of the level of the interaction, arguing that although at the individual level people might realize gains from opportunism, those same low-trust behaviors negatively affect financial performance at the organizational level by increasing businesses’ monitoring costs and decreasing innovation (Nguyen et al., 2021). Taken all together, it was predicted in the present study that groups that trusted more in the Pemberton’s Dilemma simulation would make more money than those that did not.
- Q6: What impacts the level of trust behaviors and money made in unknown future transactions?
This question relates to one of the most important elements of the study—the likelihood of possible ‘limitless’ future interactions in real life. Even when an initial agreement or transaction between parties may seem finite, the reality of the interconnectedness of individuals and organizations and of changing markets, technology, industries, and so forth, can create previously unseen future opportunities to interact with those parties again or someone connected to them (Sharabati et al., 2024; Vărzaru & Bocean, 2024). For this reason, scholars have suggested that an open ecosystem consistent with a network approach is a better strategy than viewing transactions as discrete interactions (Barczak et al., 2021). Therefore, it is vital to identify factors that may influence (1) the willingness of parties to engage with others in the future after a planned, finite number of interactions, and (2) the concomitant outcomes of those future interactions. The trust level of parties at the conclusion of existing interactions is likely an important factor (Duong et al., 2024). Research suggests that even a single breach requires significant time and resilience to repair, and once trust is destroyed, it is hard to regain (Aguiar et al., 2024; Haque, 2021). Some evidence indicates that trust harmed by anticipated opportunistic behavior may be restored, but trust harmed by lying and betrayals is much harder to recover (e.g., Aguiar et al., 2024; Haque, 2021; Schweitzer et al., 2006). To test this, a surprise round was added after participants finished their last known interaction. The prediction was that if groups had behaved opportunistically in earlier rounds (particularly in the last one), then in the added round their paired party would be less likely to trust them, and the group would make less money in that added round. This was labeled the burned bridge effect.
2. Methodology
2.1. Sample and Design
Participants in the study were 611 university juniors and seniors enrolled from 2017 through 2025 in a required management course within the college of business of a large public university in the Northwestern United States. As such, participants were from 13 different majors (e.g., business administration, marketing, finance, accountancy, etc.). During the coverage of conflict management, one class day (1½ h) was dedicated to the Pemberton Dilemma simulation. Before class on the days of the simulation, students in each class were randomly assigned in up to eight groups (with three to five students in each group), and groups were paired with another group using a pseudo-random number generator (PNRG) in Microsoft Excel. This resulted in 184 groups over the data-gathering period. Given that the data were collected across different classes, extensive measures were taken to minimize and control for any potential systematic between-class variance and other possible nuisance variables through strict study control conditions. Specifically, a standardized procedural simulation protocol was used each time. This included participants receiving identical written instructions, scripted verbal explanations identically delivered, the same amounts of time for each portion of the simulation, and the simulation being administered by the same lead researcher. This ensured that the findings reflect the simulation characteristics rather than any idiosyncratic differences.
In order to answer the research questions regarding group trust interactions discussed above, and to expand student experience and learning, several enhancements to the Pemberton’s Dilemma (PD) simulation were added so that it had the following characteristics: (1) students interacted and made decisions within groups, (2) there were eight regular consecutive rounds, (3) rounds included no intra-group communication allowed (1–4) and intra-group communication allowed (5–8), (4) the payout schedule reflected reality with the optimal results occurring through cooperation/trusting, (5), two rounds had double payouts, and (6) inclusion of a surprise round after the believed “end” of the simulation (round 9).
Students received a handout explaining the PD simulation, which was then read and explained to them (see Appendix A). In summary, paired groups represented two stores in the town of Pemberton where “blue-laws” prohibited commercial activity on Sundays (although citizens wanted to shop on Sundays). Thus, a store remaining open could possibly generate additional revenue, but only if one store were open. If both stores remained open, the sheriff would fine both of the stores, significantly reducing their revenue for the week. To make matters worse, if a store closed while the other remained open on Sunday, the closed store would generate no revenue ($0) for the week since customers would switch their allegiance to the open store and shop there all week.
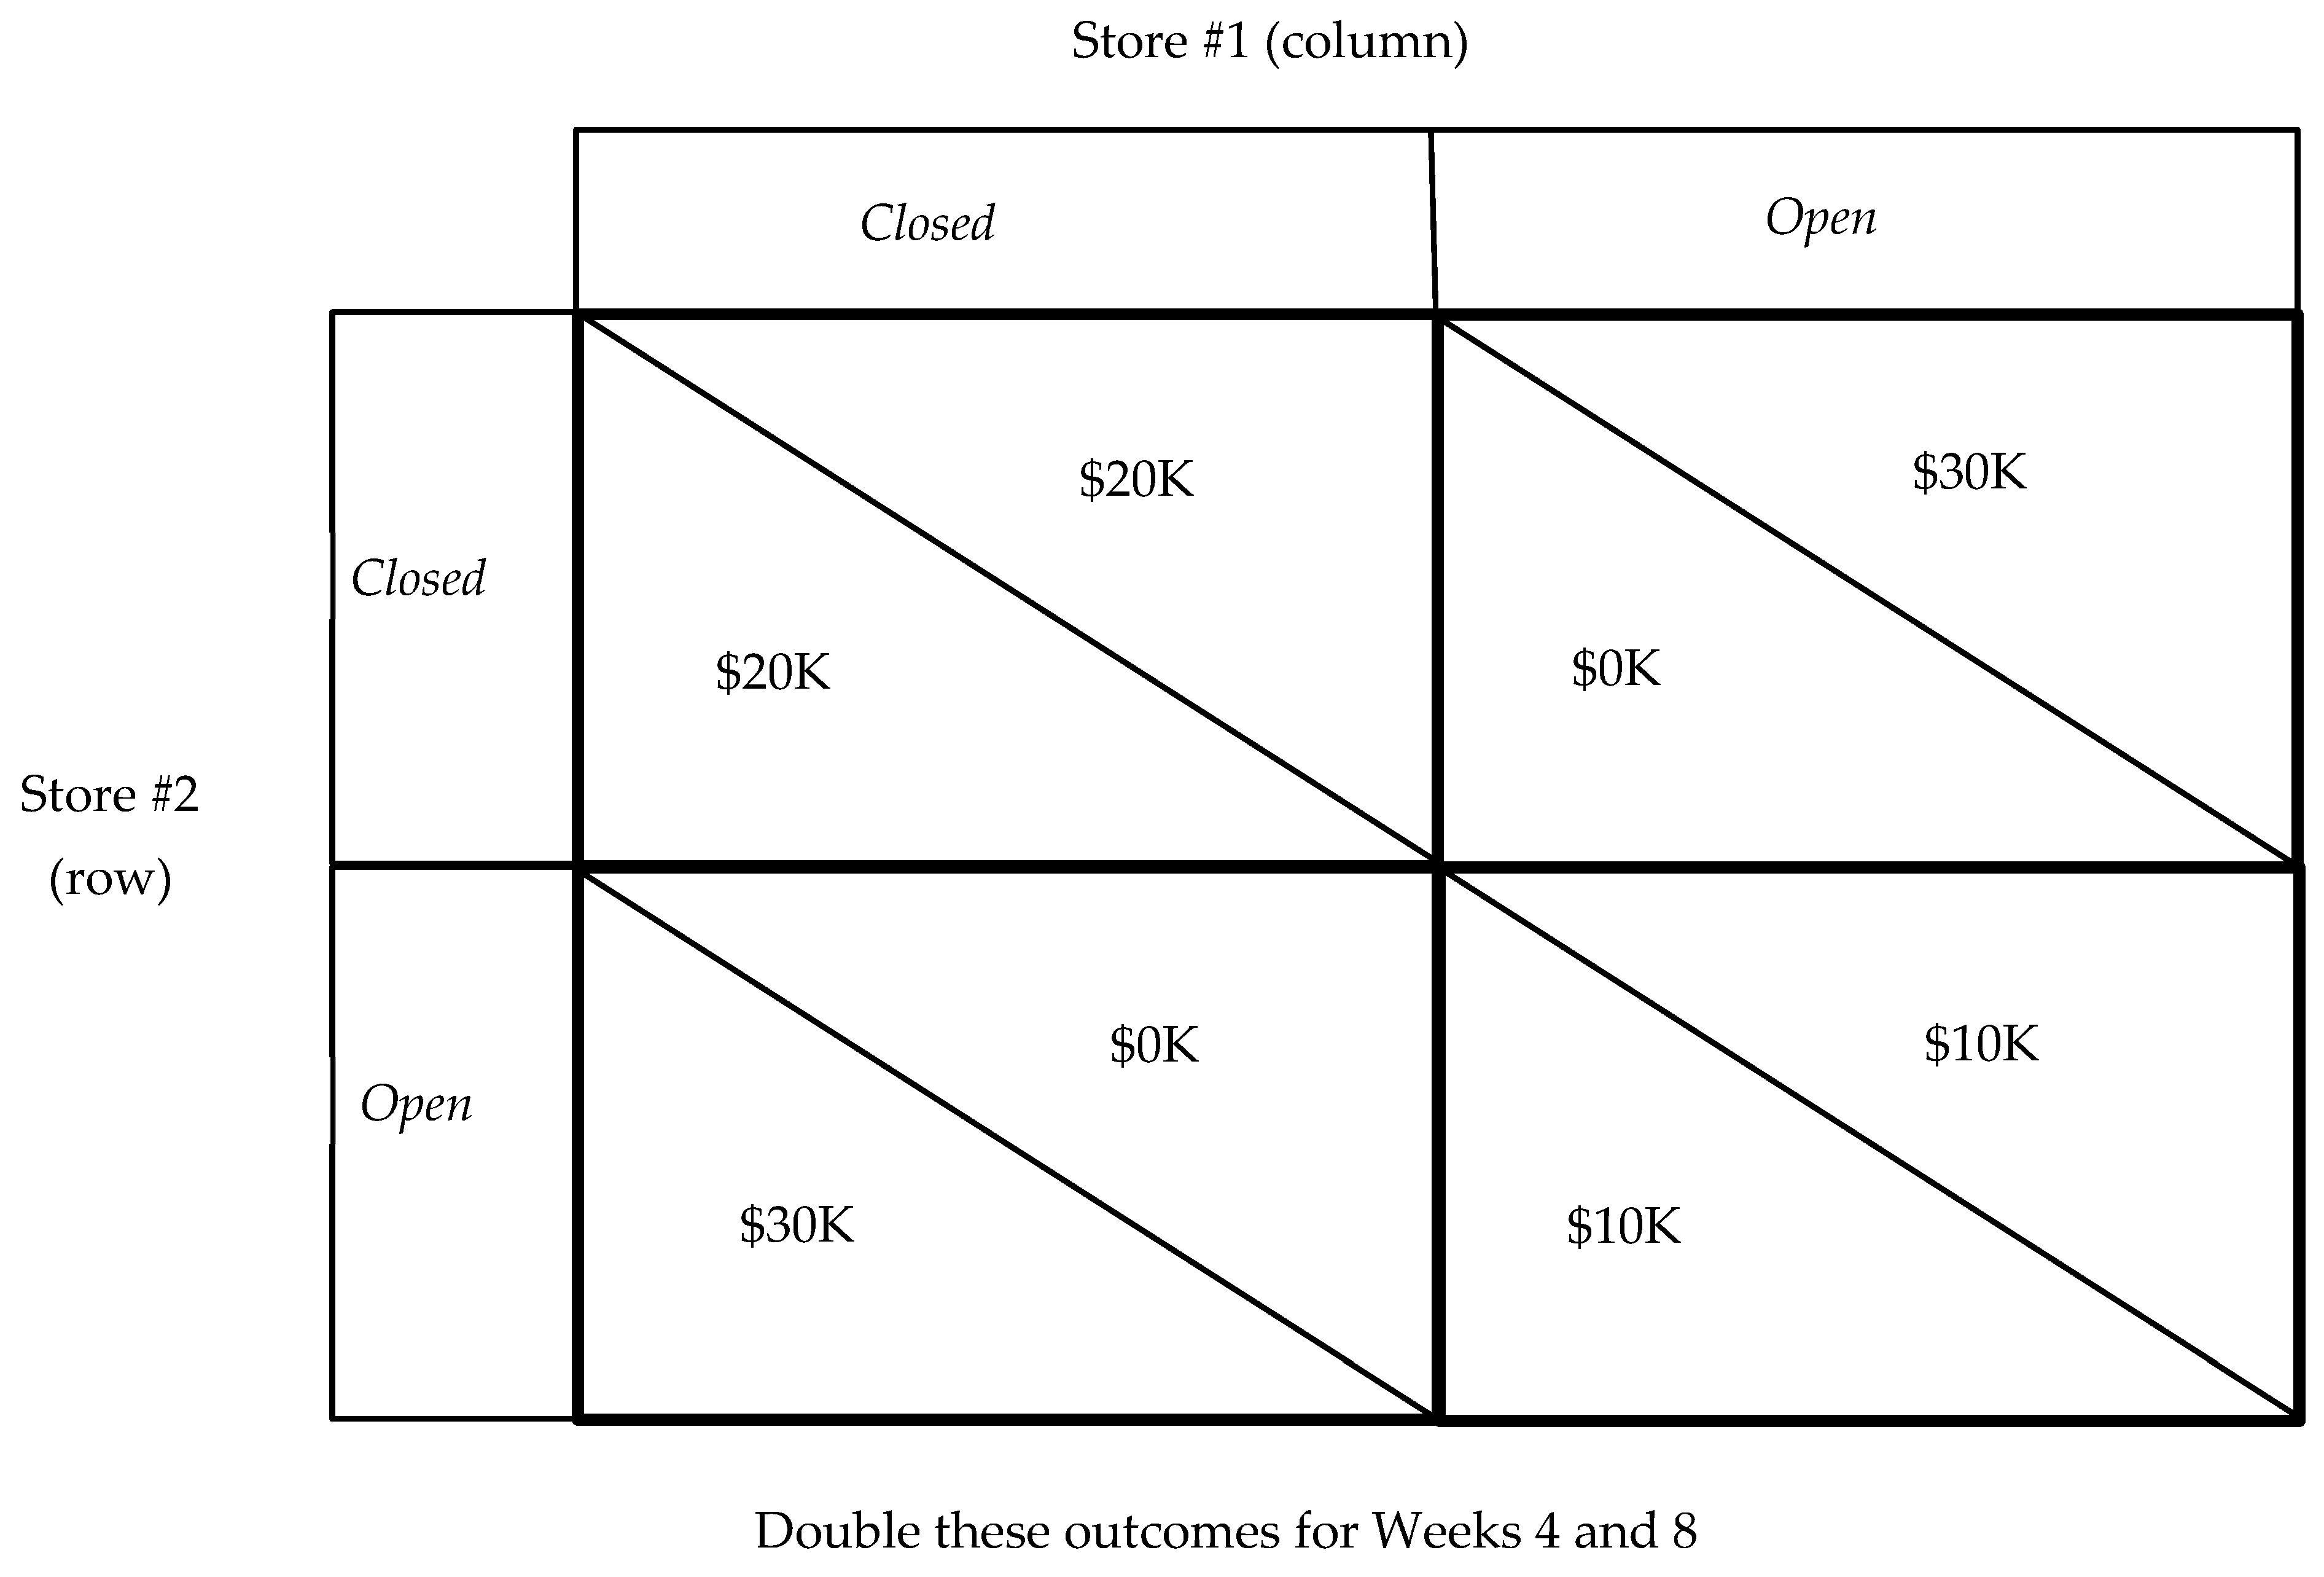
To aid students in understanding and remembering the possible outcomes with each choice combination, a payoff matrix slide was displayed on a screen in the classroom for the remainder of the simulation (see Appendix B). If both stores acted with trust and cooperation by remaining closed, each made $20,000 that week. However, if only one store trusted and remained closed, they would make nothing ($0), while the opportunistic/non-trusting store would make $30,000. Finally, if both stores acted opportunistically (remaining open), they would each only make $10,000. These payoffs were doubled in weeks four and eight. Each store’s task was to decide one week at a time for each of the eight weeks to either close on Sunday (act with trust) or to remain open (act opportunistically). The bottom half of the handout had a place for each student to record the decisions made (open/closed) and the dollar payout amount earned by each store for each week (as well as sub-totals for weeks 1–4 and 5–8 and a total).
The simulation was then conducted in a controlled, organized, and systematic manner. Each store was given eight slips of paper whereon was written “Open” and “Closed” (one for each week). During the first four rounds, student groups were not allowed to communicate with their paired store except to exchange their decision (slip of paper) at the appointed time for each round. The simulation transpired as follows. Student groups were allowed time to discuss among themselves (e.g., what strategy they wanted to pursue, pros and cons of the decisions they would make, etc.). They were then told to make a decision for week 1 and to circle open or closed on that slip of paper. Once everyone had done that, they were instructed to select a person from their group who then walked to the middle of the room to simultaneously exchange slips with their paired group’s representative. They were then told to record on their ledger sheet the decisions and amount of money earned for their store and for their paired store. They could then discuss amongst their store what they wanted to do going forward (for the next round). After sufficient time, they were again instructed to make a decision for that week and to circle it on the appropriate slip of paper, to exchange slips of paper, and to record the outcomes on their ledger. This process was repeated for weeks 1–4. Before week four, students were reminded that the outcomes were doubled and what those amounts would be. Each of these rounds lasted about six minutes. Throughout these rounds, care was taken to ensure that no other communications happened between the paired stores. After they recorded the results from week 4, each store was asked to indicate verbally what their dollar amount payout for each of the first four rounds and sub-total were. These amounts were written on the white board in front of the room for each pair of stores.
Students were then reminded that before each of the next four rounds (rounds 5–8) they could communicate verbally with their paired store. This invitation to discuss, meet, and communicate with their paired store if they wished to was repeated before each of those rounds. Communication could be done as an entire store or as some representative subset. The simulation procedure for weeks 5–8 then followed as outlined above, with the addition of this verbal communication opportunity (i.e., verbal communication with paired store, time to communicate among your own store, group decision, exchange of decision slip, record outcome for each store…repeat). Each of these four rounds lasted about eight minutes. This ordering was important to allow groups to discuss among themselves after having communicated with their paired store (to provide fuller opportunity for decisions of trust or non-trust). In addition, a crucially important condition of the simulation was that groups were not allowed to write anything in front of their paired group (no signed contracts, no circling of open/closed in front of the other group, etc.)—only verbal communication. This was to ensure that the study examined and tested trust, not contracts, monitoring, or governance—which are some of the conditions and cost when trust is not present.
Before week eight, students were reminded of the double payout and what those amounts were. Again, after recording round 8, each store was asked to indicate verbally what their dollar amount payout for each of weeks 5–8 were, the sub-total, and their total. These amounts were written on the white board for each pair of stores. At this point, an unknown surprise week was presented. Students were told that there was excess inventory and that a week 9 would now be conducted that had triple the outcomes (and what those amounts were). Groups were invited to communicate with their paired store if they desired. After following the same procedures for this surprise round, results and grand totals were recorded on the board.
The simulation took approximately 1 h and 15 min. This was followed by a 15 min purposeful discussion with the students regarding the simulation, their experiential learning, their group’s objectives, strategies to achieve those objectives, disconnections between objectives and actions, insights, and lessons learned, etc. Data was gathered by collecting all of the ledgers that groups’ kept during the simulation. These were examined to ensure they were complete and accurate (e.g., that the dollar amount earned in each round was correct according to the open/closed decisions of the paired stores and the payout matrix). Any inaccuracies were corrected. There was no attrition in the study as all groups completed the simulation (N = 184). Data from the ledger sheets were entered into Excel and the file uploaded into SPSS Version 31 for analysis.
2.2. Measures
The research used a quantitative design. As outlined in the research questions, given simulation characteristics acted as independent variables (e.g., double stakes, communication restrictions, number of remaining rounds, and unknown future round), trusting/opportunistic behaviors as both IVs and DVs, and the amount of money made as a dependent variable. Trust was measured as deciding to close on Sunday, and Non-trust (protective/opportunistic behavior) was measured as a decision to remain open on Sunday. This data was recorded as a “1” (closed) or “0” (open) for each store and their paired store for each of the nine weeks. Inasmuch as the simulation task was designed to capture these trust dilemma decisions while varying given simulation factors, measurement reliability was ensured through procedural standardization and a high-fidelity deliberative protocol (e.g., instruction scripts, 6–8 min group discussions, standard format to disseminate decisions to paired groups). This effectively minimized measurement error and ensured that choices reflected intentional group consensus rather than stochastic noise, and that decisions transmitted to paired groups were clear. According to Game Theory (Axelrod, 1984) and the payoff decision matrix used in this study (Lewicki et al., 2020), measuring trust and non-trust/opportunistic behavior in this way are valid measures of these constructs. The Dollar Amount Earned for each of the nine weeks was measured/determined according to the payout matrix and the open/closed decision of each store. The reliability of this measure was confirmed by examining and verifying the accuracy of each group’s ledger sheet.
3. Analysis and Results
The dataset is structured at the group level (N = 184), utilizing a within-subjects design to account for the repeated nature of the simulation. Given the exploratory nature of the research questions, a parsimonious statistical approach was adopted centered on mean calculation and significance comparison (t-tests), correlations (Pearson’s r), and significance comparison of correlations (z-score) with the group as the level of analysis. This approach was chosen to maintain a direct link between the raw behavioral data and the findings, ensuring clear interpretability of the group-level responses to the simulation’s parameters. Specifically, for research questions regarding the impact of given simulation characteristics or time-horizons (e.g., increased stakes, specific round versus subsequent rounds), analysis was conducted using the group’s mean performance in specific discrete rounds. For research questions involving categorical conditions (e.g., communication vs. no-communication), data were aggregated by calculating and comparing average mean trust scores during those conditions. In all instances, the group remained the unit of analysis, and paired-comparison tests were used to account for the non-independence of observations across rounds.
3.1. Comparison of Impact of Trusting Versus Opportunistic Behaviors on the Paired Group
First, I examined whether others’ trusting or not trusting had a bigger influence on the subsequent behavior of a paired group. In other words, to what extent did groups decide to be non-trusting in the subsequent round when their paired group was non-trusting to them in the present round, and to what extent did a group decide to be trusting in the subsequent round when their paired group was trusting to them in the present round. In general, it can be seen that the mean trust levels went down in rounds 1–4 and 5–8 (see Table 1). So, although some groups started out in the first round with a level of trust (mean = 0.37), that went down significantly in the subsequent rounds (round 4 mean = 0.10). It appears then that other group’s not-trusting had a bigger impact on subsequent trusting decisions. If, instead, trusting had a bigger impact, the overall trust levels would be going up each round.
Table 1.
Mean differences in trust between all rounds.
To quantify this, for each round I examined the decision of a group (open or closed) and then the paired group’s decision in the following round (i.e., the impact of a group’s round 1 on the paired group’s round 2, impact of a group’s round 2 on the paired group’s round 3, and so forth to round 8 on round 9). I then calculated the average number of times across the simulation that (1) a group was open (not trust) and the following round the paired group was open (not trust)—mean = 0.46, as well as (2) the average number of times a group was closed (trust) and the following round the paired group was closed (trust)—mean = 0.21.
I then conducted a more stringent test as well. I calculated the average number of times a group influenced their paired group to change their trust level. Specifically, I examined the average number of times that (1) a group did not trust (open) but the paired group was trusting (closed), and then in the following round the paired group changed and did not trust either (mean = 0.11), as well as the average number of times that (2) a group trusted but the paired group did not, and then in the following round the paired group changed and was also trusting (mean = 0.04). Consistent with the expectation for Q1, the results showed that a group’s not trusting had a significantly larger impact on their paired group than did trusting behaviors. Specifically, not trusting led the paired group to not trust in the next round more than trusting behaviors led a paired group to also be trusting.
3.2. Influence of Greater Stakes (Gain and Loss)
Second, I expected that the greater the stakes involved, the more protective and opportunistic groups would be. Rounds 4 and 8 had double outcomes, so the potential for greater reward but also for greater relative risk (Closed-Closed = $40K each, Open-Open = $20K each, Open-Closed = $60K–$0). Analysis of the data supported this expectation (Q2)—the amount of trust was lowest in the rounds with double outcomes. Specifically, round 4 at 0.10 dropped 0.11 from round 3 (t = 6.28, p < 0.001), and round 8 at 0.24 dropped 0.33 from round 7 (t = 14.59, p < 0.001)—see Table 1.
3.3. Influence of the Number of Future Rounds Remaining
Third, I examined how trust levels varied depending upon the number of future rounds the groups knew they had remaining. Analysis revealed that trust behaviors diminished the closer the groups got to the supposed end of the simulation. There were statistically significant decreases in the mean trust level from round 5 (0.75) to rounds 6 (0.71), 7 (0.57), and 8 (0.24); from round 6 to rounds 7 and 8; and from round 7 to 8 (see Table 1). In fact, by round 8 (when groups could communicate with their pair) the level of trust had fallen to a mean of 0.24 which was no different than round 2 (mean = 0.23, n.s.) when they could not communicate. Similarly (regarding the influence of number of future rounds remaining), I also tested the magnitude of the impact on trust when groups believed they were engaged in the last round. The mean trust level drop from round 7 to the “final” round 8 was the largest drop between any two rounds in the entire simulation (drop = 0.33; t = 14.59; p < 0.001). This was not just due to round 8 being a double round, as the drop from 7 to 8 (0.33) was significantly greater than the other double-round drop from round 3 to 4 (0.11; t = 7.77; p < 0.001). Thus, the findings supported the two predictions in Q3.
3.4. Restricted and Permitted Communication
The next area of inquiry was the impact of restricted and of permitted communication between groups on trusting behaviors and on the amount of money groups made (see Table 2). The average mean trust for rounds 1–4 when they could not communicate was only 0.23, compared with an average more than double that amount, of 0.57, for rounds 5–8 when groups were able to communicate with their paired group (t = 22.83; p< 0.001). Similarly, groups made more money when they were able to communicate with their paired group (rounds 5–8 = $75.25) compared with when communication with the paired group was not allowed (rounds 1–4 = $60.38)—mean difference t = 11.04; p < 0.001. These findings relating to the facilitating benefits of communication were consistent with the expectations in Q4. The study results also highlighted that just because communication is permitted (like in real organizations) does not mean that people sufficiently communicate. Specifically, levels of communication diminished across communication rounds until before round 8, and only one of four pairs of groups typically communicated.
Table 2.
Mean comparisons of trusting behaviors and money made for permitted versus restricted communication.
3.5. Trusting and Monetary Results
The fifth analysis examined the impact of group’s trusting behavior on how much money they made. Contrary to expectations, results indicated that it depended upon the time-period in question. First, in the short-run, there was a negative relationship between a group’s trust level and the amount of money they made in the same round (see Table 3). In other words, the more they trusted, the less money they made. For example, in round 5, groups’ trusting behaviors were correlated −0.43 with how much money they made in round 5. This was one of the strongest, most consistent correlational trends. In seven of the eight rounds, entities made more money when they behaved opportunistically in that round (i.e., took advantage of the other party). On the other hand, over time, how much money groups made was positively correlated with their exhibiting trusting behaviors (rounds 1–4 r = 0.08; rounds 5–8 r = 0.12; rounds 1–8 r = 0.28)—see Table 4. Thus, results partially supported the predictions related to Q5, in that over the long run, those who demonstrated trust made more money, and those who behaved opportunistically made less.
Table 3.
Correlations of group’s trust behavior each round with amount of money they made in the same round—short-term.
Table 4.
Correlations between average trust behaviors over time with amount of money made—long-term.
3.6. Impact of Past Trusting or Opportunistic Behaviors on Unknown Future Interactions
Recall that the participants were led to believe that there were only eight rounds. Then, a subsequent surprise round 9 was added in order to empirically examine any influence of groups’ past trusting or opportunistic behaviors on the outcomes of that new round. As predicted, analysis revealed that the level of trusting behaviors groups’ showed in previous exchanges (rounds 5–8) significantly impacted how much their paired group was willing to trust them in the surprise round 9. Specifically, Table 5 shows the significant correlations between how much a group demonstrated trust in each of rounds 5, 6, 7, and 8 with how much their paired group trusted them in round 9. For example, showing trust back in round 5 had a 0.11 correlation with their paired group trusting the group in the surprise round 9—see Table 5. Table 5 also reports how a group being trustworthy in rounds 5–8 was significantly correlated with their making more money in the surprise round 9. For example, showing trust in round 7 was a significant predictor (r = 0.13) with making more money in surprise round 9. Next, further analysis revealed the particular importance of the trust shown in the most recent exchange (round 8). Specifically, statistical comparisons were made between the size of the correlation in round 8 (r = 0.29) with the correlations in rounds 5, 6 and 7. Z-scores demonstrated that the correlation between a groups’ trusting in round 8 with their paired group trusting them in round 9 was significantly greater than the relationships from earlier rounds (see z-scores in Table 5). Similarly, the correlation between groups’ trust level in round 8 with how much money they made in the surprise round 9 (r = 0.23) was significantly greater than the impact of trust behaviors in earlier rounds 5–7 on round 9 income (see z-scores right side of Table 5). All of these results were consistent with the predictions related to Q6.
Table 5.
Correlations of group’s trusting behaviors in rounds 5–8 with their paired group’s trusting in surprise round 9, and with the amount of money the group made in surprise round 9.
3.7. Robustness and Sensitivity
The breadth of the dataset (N = 184 groups) allows for high confidence in the observed means. In addition, several supplemental sensitivity analyses were conducted to further assure the stability of the findings. First, I re-ran the analyses four times, each time excluding the top and bottom 5% of groups that (1) were most trusting, (2) were most opportunistic, (3) made the most money, and (4) made the least money. The results remained consistent and significant, ensuring that any outliers were not driving the observed effects. Second, to account for any potential last-round trust-attenuation confound when analyzing the impact of communication (rounds 4–8) versus no-communication (rounds 1–4), I excluded round 8 and reran the analysis. Again, the results remained consistent and significant, suggesting that the findings are robust across different round specifications and are not merely an artifact. Finally, as an example of the practical significance of the findings beyond statistical p-values, I calculated the effect size for the comparison of the trust levels between communication and no-communication rounds. The analysis yielded a d = 1.89. This represents an extraordinarily large effect (Cohen, 1988), suggesting that the influence of communication on trust decisions is substantial and robust across the sample.
4. Discussion
The breadth of questions pursued during the Pemberton’s Dilemma simulation and the related analysis produced meaningful insights into group cooperative versus opportunistic exchanges. This underscores the importance and value of the process of pondering how pedagogical tools, exercises, and activities could be expanded and the data collected and used in research to increase knowledge to benefit students, the academic literature, and practice. This section discusses ways the present study findings contribute to research and practice, highlighting important content-area insights gained by expanding a pedagogical simulation and combining it with empirical research.
4.1. Scholarly and Practical Implications
4.1.1. Trust Domain
Q1: The present study found that when groups acted opportunistically, their paired groups tended to reciprocate that mistrust more often than they reciprocated trusting behaviors after groups acted cooperatively. In other words, mistrusting has a larger impact on paired groups than does trusting. This finding is consistent with and reinforces the trust asymmetry principle (Slovic, 1993)—in this case, that negative information transmitted through opportunistic behaviors has a greater effect than does positive information (Baumeister et al., 2001). The current data contributes additional evidence to the few empirical studies which show that breaches of trust can lead to mutual defection and create an iterative downward trust spiral (Labianca & Brass, 2006; Schneier, 2012). Inasmuch as trust is a crucial factor within and between organizations to lower costs and achieve greater results (e.g., Bencsik et al., 2020), this finding is important for organizations. Specifically, these results suggest that individuals and organizations will need to do more than simply exhibit trusting behaviors to garner the trust of others. One suggestion is for organizations to explicitly identify the particular benefits for each party of acting cooperatively in given transactions and to discuss these with the other party. Then, openly committing to that path together should produce better outcomes for both.
Q2: Related to the effect of higher-stakes transactions, results supported the economic models over the social-psychology ones (e.g., Trust Reciprocity Theory—Fehr & Schmidt, 1999)—groups exhibited more opportunistic behaviors when the stakes were greater (larger potential gain or loss). Consistent with the economic arguments (Bohnet & Zeckhauser, 2004; Mazar et al., 2008), groups tended to focus on the potential to make more money if they stayed open and their paired store were closed ($60K) and avoiding the potential of earning nothing while allowing the other store to make $60K. The findings help corroborate Transaction Cost Theory (Cuypers et al., 2021), in that the increased magnitude of the possible reward seemed to cause participants to shift to a short-term financial focus, and substantiate Betrayal Aversion Theory (Malhotra, 2004), as groups shifted to a risk-assessment focus to act protectively to avoid a potentially greater “loss” when trusting. Unfortunately, the end result of this opportunistic focus was most often both stores making less money (only $20K versus $40K in those rounds), and/or weakening trust if their paired store had acted cooperatively. The current study’s findings can be applied by putting organizations on notice—when interacting in larger-stakes transactions, their organization and the other party will likely have a greater opportunistic tendency. Recognizing this, they should make intentional efforts towards trust by identifying the potential benefits of cooperation in the scenario and explicitly sharing these with the other party. To the extent this is not successful, scholars argue that in high-stakes situations, organization should strengthen governance by increasing monitoring, create “hostages” (collateral if the other entity cheats), and possibly vertically integrating (purchase the other entity to bring them in-house) (Ahamed et al., 2021).
Q3: The present findings corroborate the Folk Theorem and similar classical arguments that with longer future interaction periods, people tend to recognize their interdependence and mutual need to work together and behave more cooperatively (Axelrod, 1984; Fudenberg & Maskin, 1986). The results also validated past research by demonstrating that as parties get closer to the believed end of interacting, groups will behave more opportunistically to acquire greater gains since the relationship is in the later stage (e.g., Ambrus & Pathak, 2011). In particular, the study found a strong “end-game effect”, as defection was at its highest in the believed last interaction (Cuypers et al., 2021). These results underscore several practical recommendations to attempt to mitigate increased opportunism near the end of exchanges. First, organizations can overlap multiple agreements across time, essentially by negotiating the next project before the current one ends, creating a reason for the party to continue to cooperate on the current project to secure the next deal (Cuypers et al., 2021). Next, as organizations come closer to the end of interactions, to the extent that sufficiently enduring trusting relationships have not been built, and if no future deals can be created, the present results support scholars’ recommendation for organizations to budget for and engage in higher-intensity monitoring (Ha, 2020; Perret et al., 2025).
Q4: Although scholarly thought predicts that communication can be used to either set up intentional opportunistic behaviors (e.g., Rogers et al., 2017) or to facilitate cooperation (e.g., Balliet, 2010), the present results concurred with the latter, more widely accepted tenet by demonstrating that acting in a trusting manner was much more prevalent when groups could communicate with their paired group. Also consistent with past research (e.g., Bicchieri & Lev-On, 2007; Bicchieri et al., 2022), groups in the present study used communication to signal trust and reach verbal agreements to cooperate. In addition, because trust-building communication led to significantly higher earnings, these results underscore the vital importance of open, sincere dialogue within and between organizations. Specifically, organizations should inculcate a culture of transparent, consistent communication internally and with external stakeholders as they seek to understand the concerns and needs of others, and to communicate about the concomitant benefits of working cooperatively.
Q5: As explained near the beginning of this paper, the literature on the relationship between trusting behaviors and subsequent financial success posits a variety of possibilities. The empirical results of this study contribute to that literature by validating the horizon-dependent bifurcated relationship between trusting behaviors and the resultant financial outcomes. Specifically, concurring with Slemrod and Katuscak (2005), it was found that in the short-term groups can earn the most through behaving opportunistically and pursuing their own welfare with little regard for the other party (even to the use of deceit). However, in the long run, the data verified that an opportunistic strategy was shortsighted and ineffective (Slemrod & Katuscak, 2005). Over time, the best outcomes are reserved for those who exhibit trust, are trustworthy, and interact cooperatively (Nguyen et al., 2021). Theoretically, the practical application of the first finding might seem to support an endorsement for people and organizations to deceive, cut corners, or even cheat when in short-term, one-off transactions. However, as will be discussed with Q6, no entity can guarantee that any transaction is insular with no impact on the future. Instead, especially given the current environment and age where “sustainability” is the model for success, this study’s results demonstrate that trust, trustworthiness, and integrity are an imperative to achieve maximal outcomes. Unfortunately, the results also demonstrated that the principle and value of trust to achieve optimal performance is still too often overlooked and under-appreciated (Covey, 2018).
Q6: Perhaps the most poignantly important pedagogical extension of the Pemberton’s Dilemma simulation that was added in this study was the “lesson of the ninth-round”—the inclusion of a surprise future round after students thought they had finished the last interaction. This addition is consistent with the premise of the real likelihood of multiple, unforeseen, possible future interactions with a given party or related parties (Sharabati et al., 2024; Vărzaru & Bocean, 2024). The current data verified that the trust level at the conclusion of the known interactions was a significant predictor of trust behaviors and financial success in the future interaction (Duong et al., 2024). Specifically, the finding that opportunistic behavior weakened a partner’s future trust bolsters the researchers’ argument that once trust is violated, it is extremely difficult to regain (Aguiar et al., 2024; Haque, 2021).
In addition, a unique contribution of this study is the discovery that recency is the primary driver of trust, finding that the final interaction carries more weight in the paired group’s decision-making process than the behaviors of any previous round. I dubbed this the “Janet Jackson effect” (“What have you done for me lately?”). A practical implication is for individuals and organizations to remember the greater financial gain of possible future transactions in order to fortify themselves against the incentive to shift to opportunism in the “final” stage of a project. The data reinforces that the only effective and responsible strategy is one that focuses on sustainability to ensure and maximize success in the long run by creating and maintaining trust.
4.1.2. Educational Domain
The multiple findings discussed above that contribute to the trust literature are evidence of successfully fulfilling the larger objective of the present study, namely, to bridge the gap between pedagogy and empirical research by simultaneously using a student experiential learning simulation as a research mechanism. This study, then, contributes to the limited educational literature that answers the call to combine teaching and research in novel ways, such as using an in-class activity as a controlled laboratory to expand research knowledge (Saenz & Cano, 2009; Uziel, 2004; Waseem, 2024). This provides additional evidence and an example for other educators. Next, the study findings were also used to expand the knowledge base for student learning. Specifically, the study results related to the benefits and traps of trusting and opportunistic behaviors have been shared (and are being shared) with students to enhance their understanding and learning, and to provide valuable recommendations for their own practice in organizations. For example, near the end of the simulation, students were very surprised when they were informed there would be an added ninth round, and that the potential for reward was so great (triple outcomes). Many, having just “stabbed their paired store in the back,” now realized the dire consequences of their short-sighted decision. Such poignant experiential learning prepares students to understand and more deeply appreciate principles taught in class and their application to real life. For this reason, the students could then better relate when I shared with them a true, personal example of the wisdom to not burn bridges (When I got a new job at a wonderful company because I had not burned a bridge even though I was justified in doing so). To summarize, beyond contributing to the literature and providing new subject-matter content for students, this paper provides a roadmap for educational development and offers evidence-based recommendations designed to help organizational members navigate the complexities of trust to achieve better collective outcomes.
4.2. Boundary Conditions, Limitations and Future Research
The present findings provide additional support for recognized boundary conditions that past scholarly work has identified under which the results would operate. One condition for trust to produce more favorable results is a society that values trust and has more lucrative opportunities for long-term partnerships (Slemrod & Katuscak, 2005). Although this would apply to most societies, there are still some low-trust cultures where circumstances exclusively reward opportunism and trustworthy people are often exploited (Zak & Knack, 2001). Next, consistent with the Folk Theorem, the flourishing of self-governing trust is contingent upon two primary conditions: a high valuation of future interactions and the existence of monitoring mechanisms to detect opportunistic behavior (Fudenberg & Maskin, 1986). Notably, such monitoring must be common knowledge among all parties. While these conditions are pervasive in the information era, their efficacy remains context-dependent.
In addition, the present study has some potential limitations associated with the study design. The primary limitations surround using a student sample involved in a simulation and examining simple, brief transactions compared with investigating actual organizational actors in large-scale commercial exchanges. This can raise a question regarding the generalizability of the results. The following factors seem to mitigate meaningful concerns and assure an acceptable level of external validity. First, the study dealt with basic, fundamental principles related to trust (i.e., Axelrod, 1984). Second, the simulation design and the questions explored were supported by classic and contemporary trust theory and thought (e.g., Cuypers et al., 2021; Geyskens et al., 2006; Slovic, 1993). Third, the results were consistent with prior empirical research conducted in authentic commercial settings (e.g., Ha, 2020; Nguyen et al., 2021). Finally, since the major objective of the study was to demonstrate the serendipitous benefits of employing a class pedagogy as a research mechanism, using a simulation and student sample were vital to the study design. Next, the study participants were from one country/culture. It is possible that people from other cultures with distinctive values might respond differently in such trust scenarios. Similarly, it is possible that students from different colleges or universities might behave differently in the simulation.
These potential study limitations and insights gained from the present study also germinated several ideas for related future research. One idea is to study the group processes that led to their decision-making. Similarly, it would be interesting to investigate participants’ thinking behind their decisions, how they made sense of the trust domain, their goals during the transactions, and ultimately why groups made the decisions they did. Koretsky et al. (2018) propose that academic simulations can use qualitative inquiry into sense-making to research student thinking processes. For example, participants could complete short surveys each round indicating why they decided to be open or closed. Of course, care should be exercised to not create demand characteristics that might influence their decisions.
Next, it would be fascinating to test the potential impact of a party’s repeated trust round after round regardless of the behavior of their paired group. During the present study, when a group’s trusting was not matched in that round, they would most often go to non-trusting right away (so essentially only the impact of trusting for one round was tested). This begs the question if repeated trust could finally make a change in an otherwise non-trusting paired group. Since the trusting group would likely have to endure repeated unfavorable outcomes, the study would need to be set up with a forced trusting experimental condition that remained unknown to the paired group.
Inasmuch as communication was shown to be so vital in trust decisions and subsequent financial success, another important future research investigation is why some groups did not communicate when they were allowed to. Possible explanations to test include (1) trust had been demonstrated consistently and was already strong; (2) trust had been violated, so the burned group was not interested in listening to their paired group that had shown they could not be trusted; and/or (3) a group was planning to act opportunistically and did not want to have to lie to their paired group. Next, inasmuch as individual differences are important factors that can impact behavior, it could be informative to examine potential personality correlates and individual values that influence people to behave in a more trusting/cooperative or less trusting/opportunistic fashion. In addition, building on this study’s exploratory findings, future research could investigate higher-order iterative relationships by using more complex models to examine how the back-and-forth interactions between paired groups may influence their decisions over time. Finally, future research could expand the simulation to address broader questions, run the simulation with students at different universities or from distinct country cultures, as well as examining trust dynamics within field settings—specifically focusing on professional populations engaged in substantive commercial exchanges.
5. Conclusions
This study helps address the teaching–research gap by gathering data from 184 student groups to provide some of the first quantitative empirical testing of an expanded Pemberton Dilemma trust simulation. This resulted in empirically substantiating expected trust exchange behaviors and outcomes and producing valuable new insights and recommendations in how to better manage interdependent trust interactions. Importantly, all of this served as an example of the benefits of expanding the scope of educational simulations and of combining them with content-area research studies. Thus, this study demonstrates and underscores the use of pedagogical experiential-learning tools with empirical inquiry to produce research findings that can enlarge student learning, augment the scholarly literature, and provide practical recommendations to individuals and organizations.
Funding
This research received no external funding.
Institutional Review Board Statement
The Institutional Review Board of Boise State University exempted this study from human subjects approval since it was limited to normal educational practices that were already part of the courses, Protocol Number: 076-SB23-101.
Informed Consent Statement
Student consent was waived by the Institutional Review Board of Boise State University since the study was limited to normal educational practices that were already part of the courses, Protocol Number: 076-SB23-101.
Data Availability Statement
The dataset used in this article is not readily available because the data are part of two other ongoing research studies. It may be possible to make available just the data from this study upon request from the corresponding author.
Acknowledgments
During the preparation of this manuscript, the author used Gemini 3 for the purposes of some literature search and minor text editing. The author has reviewed and edited the output and takes full responsibility for the content of this publication.
Conflicts of Interest
The author declares no conflicts of interest.
Appendix A. Pemberton’s Dilemma Explanation
- The Situation
You (and your partners) own one of two general stores in the small town of Pemberton, ID, each of which typically produces $20,000 of revenue during the six-day week. “Blue laws” prohibit commercial transactions on Sundays but shoppers want to shop on Sundays and will generate an additional $10,000 of business. If one store is open, the sheriff will ignore it. If both stores are open, the sheriff will take action and fine the owners $15,000 each.
- The Dilemma
- You have to decide whether to open or stay closed on each of 8 consecutive Sundays.
- The outcomes each week are:
- ▪
- If both are closed on Sunday, you each earn weekly revenue of $20,000.
- ▪
- If both are open on Sunday, you each earn an additional $5000 but are fined $15,000, so you each clear only $10,000 for the week.
- ▪
- If one is open and the other closed, the open store generates a total of $30,000 for the week and the store that is closed generates no revenue ($0) because customers switch their allegiance to the store that was open and shop there all week.
- You may not communicate with the other store owner(s), except to register your weekly decision during weeks 1–4. After that you may talk with the other store owners before each of the week’s 5–8.
- All net revenues (payoffs) are doubled in Weeks #4 and #8.
- You will communicate your decisions one at a time by simultaneously exchanging pieces of paper with your decision (open or closed). You will then record the decisions below and the dollar amount. You will proceed to the next week when directed by the professor.
| Week # | My Store | The Other Store | ||
| Open/Closed | Amount | Open/Closed | Amount | |
| 1 | ||||
| 2 | ||||
| 3 | ||||
| 4 (payoff x 2) | ||||
| Sub-Total | ||||
| 5 | ||||
| 6 | ||||
| 7 | ||||
| 8 (payoff x 2) | ||||
| Sub-Total | ||||
| Total | ||||
Appendix B. Pemberton’s Dilemma Payoff Matrix
References
- Aguiar, M., Schilke, O., Dubner, R., Barros, A., & Kiderman, J. (2024). From crisis to comeback: The long road to rebuilding corporate trust. Boston Consulting Group. Available online: https://www.bcg.com/publications/2024/rebuilding-corporate-trust (accessed on 1 March 2026).
- Ahamed, A. F. M. J., Stump, R. L., & Noboa, F. (2021). What drives importer opportunism? Learning from a developing country in Latin America. Journal of Global Marketing, 34(2), 146–164. [Google Scholar] [CrossRef] [Scilit]
- Aldo, C. T., & Avila, R. (2021). Nondiscounted costs and socially discounted benefits as predictors of cooperation in prisoner’s dilemma games. The Psychological Record, 71, 167–178. [Google Scholar] [CrossRef] [Scilit]
- Ambrus, A., & Pathak, P. A. (2011). Cooperation over finite horizons: A theory and experiments. Journal of Public Economics, 95(7–8), 500–512. [Google Scholar] [CrossRef] [Scilit]
- Axelrod, R. (1984). The evolution of cooperation. Basic Books, Inc. [Google Scholar]
- Balliet, D. (2010). Communication and cooperation in social dilemmas: A meta-analytic review. Journal of Conflict Resolution, 54(1), 39–57. [Google Scholar] [CrossRef] [Scilit]
- Barczak, B., Kafel, T., & Magliocca, P. (2021). Network approaches and strategic management: Exploration opportunities and new trends. Journal of Entrepreneurship, Management and Innovation, 17(3), 7–35. [Google Scholar] [CrossRef] [Scilit]
- Baumeister, R. F., Bratslavsky, E., Finkenauer, C., & Vohs, K. D. (2001). Bad is stronger than good. Review of General Psychology, 5(4), 323–370. [Google Scholar] [CrossRef]
- Bencsik, A., Jakubik, M., & Juhasz, T. (2020). The economic consequences of trust and distrust in knowledge-intensive organizations. Journal of Competitiveness, 12(3), 28–46. [Google Scholar] [CrossRef] [Scilit]
- Berg, J., Dickhaut, J., & McCabe, K. (1995). Trust, reciprocity, and social history. Games and Economic Behavior, 10(1), 122–142. [Google Scholar] [CrossRef] [Scilit]
- Bicchieri, C., Dimant, E., & Sontuoso, A. (2022). Social proximity and the erosion of norm compliance. Games and Economic Behavior, 132, 59–72. [Google Scholar] [CrossRef] [Scilit]
- Bicchieri, C., & Lev-On, A. (2007). Computer-mediated communication and cooperation in social dilemmas: An experimental analysis. Politics, Philosophy & Economics, 6(2), 139–168. [Google Scholar] [CrossRef] [Scilit]
- Bitrián, P., Buil, I., & Catalán, S. (2020). Flow and business simulation games: A typology of students. The International Journal of Management Education, 18(1), 100365. [Google Scholar] [CrossRef] [Scilit]
- Bohnet, I., & Zeckhauser, R. (2004). Trust, risk and betrayal. Journal of Economic Behavior & Organization, 55(4), 467–484. [Google Scholar] [CrossRef] [Scilit]
- Brownell, J. E., & Swaner, L. E. (2010). Five high-impact practices: Research on learning outcomes, completion, and quality. Association of American Colleges & Universities. [Google Scholar]
- Butler, J. V., Giuliano, P., & Guiso, L. (2016). The right amount of trust. Journal of the European Economic Association, 14(5), 1155–1180. [Google Scholar] [CrossRef] [Scilit]
- Carranza, C. (2018). Pemberton’s dilemma reflective paper. Available online: https://www.scribd.com/document/383201476/1-Pemberton-s-Dilemma-Reflective-Paper (accessed on 20 December 2025).
- Cline, B. N., Williamson, C. R., & Xiong, H. (2022). Trust, regulation, and market efficiency. Public Choice, 190, 427–456. [Google Scholar] [CrossRef] [Scilit]
- Cohen, J. (1988). Statistical power analysis for the behavioral sciences (2nd ed.). Lawrence Erlbaum Associates. [Google Scholar]
- Covey, S. M. R. (2018). The speed of trust: The one thing that changes everything. Free Press. [Google Scholar]
- Cuypers, I. R., Hennart, J. F., Silverman, B. S., & Ertug, G. (2021). Transaction cost theory: Past progress, current challenges, and suggestions for the future. Academy of Management Annals, 15(1), 111–150. [Google Scholar] [CrossRef] [Scilit]
- Daday, J., O’Donnell, K., Vande Zande, C., Kinzie, J., & Zilvinskis, J. (2025). Higher education undone: An argument for more experiential learning. Change: The Magazine of Higher Learning, 57(3), 28–32. [Google Scholar] [CrossRef] [Scilit]
- Deutsch, M., Coleman, P. T., & Marcus, E. C. (Eds.). (2006). The handbook of conflict resolution: Theory and practice (2nd ed.). Jossey-Bass. [Google Scholar]
- Duong, N. T., Lin, H. H., Wu, T. L., & Wang, Y. S. (2024). Understanding consumer trust dynamics and purchase intentions in a multichannel live streaming e-commerce context: A trust transfer perspective. International Journal of Human–Computer Interaction, 41(14), 9123–9136. [Google Scholar] [CrossRef] [Scilit]
- Ellett, L., Allen-Crooks, R., Stevens, A., Wildschut, T., & Chadwick, P. (2013). A paradigm of the study of paranoia in the general population: The prisoner’s dilemma game. Cognition & Emotion, 27(1), 53–62. [Google Scholar]
- Engle-Warnick, J., & Slonim, R. L. (2004). The evolution of strategies in a repeated trust game. Journal of Economic Behavior & Organization, 55(4), 553–573. [Google Scholar] [CrossRef] [Scilit]
- Fehr, E., & Schmidt, K. M. (1999). A theory of fairness, competition, and cooperation. The Quarterly Journal of Economics, 114(3), 817–868. [Google Scholar] [CrossRef] [Scilit]
- Flood, M. M. (1950). A non-cooperative pair (Research Memorandum RM-407). RAND Corporation.
- Fudenberg, D., & Maskin, E. (1986). The folk theorem in repeated games with discounting or with incomplete information. Econometrica, 54(3), 533–554. [Google Scholar] [CrossRef] [Scilit]
- Gatti, L., Ulrich, M., & Seele, P. (2019). Education for sustainable development through business simulation games: An exploratory study of sustainability gamification and its effects on students’ learning outcomes. Journal of Cleaner Production, 207, 667–678. [Google Scholar] [CrossRef] [Scilit]
- Geyskens, I., Steenkamp, J. B. E., & Kumar, N. (2006). Make, buy, or ally: A transaction cost theory meta-analysis. Academy of Management Journal, 49(3), 519–543. [Google Scholar] [CrossRef] [Scilit]
- Gneezy, U. (2005). Deception: The role of consequences. The American Economic Review, 95(1), 384–394. [Google Scholar] [CrossRef] [Scilit]
- Graves, J., Roche, R., Washington, V., & Sonnega, J. (2025). Assessing and improving students’ collaborative skills using a mental health simulation: A pilot study. Journal of Interprofessional Care, 39(1), 126–129. [Google Scholar] [CrossRef] [Scilit] [PubMed]
- Greenberg, J., & Tomlinson, E. (2004). Situated experiments in organizations: Transplanting the lab to the field. Journal of Management, 30(5), 703–724. [Google Scholar] [CrossRef] [Scilit]
- Ha, H.-Y. (2020). Exploring the effects of trust and its outcomes in B2B relationship stages: A longitudinal study. Sustainability, 12(23), 9937. [Google Scholar] [CrossRef] [Scilit]
- Haque, A. (2021). The relationship between perceived organisational support and turnover intention: The mediating role of organisational trust. International Journal of Business Anthropology, 11(1), 1–22. [Google Scholar]
- Huang, Y. M., Silitonga, L. M., & Wu, T. T. (2022). Applying a business simulation in a flipped classroom to enhance engagement, learning achievement, and higher-order thinking skills. Computers & Education, 183, 104494. [Google Scholar]
- Huth, K., Growdonb, A. S., Stockmand, L. S., Brett-Fleeglere, M., Shannonf, T. M., Taylorg, M., Hunderth, E. S., & Kesselheimb, J. C. (2025). Establishing trust within interprofessional teams with a novel simulation activity in the pediatric clerkship. Journal of Interprofessional Care, 39(6), 1095–1100. [Google Scholar] [CrossRef] [Scilit]
- Kapania, M., Savla, J., & Skaggs, G. (2025). Deep approaches to learning, student satisfaction, and employability in STEM. Education Sciences, 15(9), 1126. [Google Scholar] [CrossRef] [Scilit]
- Kollock, P. (1998). Social dilemmas: The anatomy of cooperation. Annual Review of Sociology, 24(1), 183–214. [Google Scholar] [CrossRef] [Scilit]
- Koretsky, M., Keeler, J., Ivanovitch, J., & Cao, Y. (2018). The role of pedagogical tools in active learning: A case for sense-making. International Journal of STEM Education, 5(1), 18. [Google Scholar] [CrossRef] [Scilit] [PubMed]
- Labianca, G., & Brass, D. J. (2006). Exploring the social ledger: Negative relationships and social capital in organizations. Academy of Management Review, 31(3), 596–614. [Google Scholar] [CrossRef] [Scilit]
- Lewicki, R. J., Barry, B., & Saunders, D. M. (2020). Negotiation: Readings, exercises, and cases (8th ed.). McGraw-Hill Education. [Google Scholar]
- Locey, M. L., Safin, V., & Rachlin, H. (2013). Social discounting and the prisoner’s dilemma game. Journal of the Experimental Analysis of Behavior, 99, 85–97. [Google Scholar] [PubMed]
- Malhotra, D. (2004). Trust and reciprocity decisions: The differing signals of trustor and trusted parties. Organizational Behavior and Human Decision Processes, 94(2), 61–73. [Google Scholar] [CrossRef] [Scilit]
- Mazar, N., Amir, O., & Ariely, D. (2008). The dishonesty of honest people: A theory of self-concept maintenance. Journal of Marketing Research, 45(6), 633–644. [Google Scholar] [CrossRef] [Scilit]
- Misra, S., & Kalro, A. (1979). Triangle effect and the connotative meaning of trust in Prisoner’s Dilemma: A cross cultural study. International Journal of Psychology, 14(4), 255–259. [Google Scholar] [CrossRef] [Scilit]
- Nguyen, H. N., Hung, L. M., & Quynh, N. T. (2021). The impact of trust and opportunistic behavior of employees on business performance: Case study in Vietnam. Journal of Organizational Behavior Research, 6(1), 233–242. [Google Scholar]
- Offerman, T. (2002). Hurting hurts more than helping helps: The nature of the attribution bias in sequential games. European Economic Review, 46(8), 1423–1437. [Google Scholar] [CrossRef] [Scilit]
- Oláh, J., Yusmar, A. H., Máté, D., Novotny, Á., Popp, J., Lakner, Z., & Kovács, S. (2019). A trust approach to the financial performance of information and communications technology enterprises. Polish Journal of Management Studies, 20(1), 332–342. [Google Scholar] [CrossRef] [Scilit]
- Orabil, A. M., Alnajjar, H. A., Fouly, H. A., & Aljohani, W. F. (2025). Integrating team-based learning with high-fidelity simulation: Experience of nursing students. Saudi Journal for Health Sciences, 14(2), 176–187. [Google Scholar] [CrossRef] [Scilit]
- Oxford University Press. (n.d.). Trust. Oxford English Dictionary. Available online: https://www.oed.com/search/dictionary/?scope=Entries&q=trust (accessed on 22 November 2025).
- Perret, C., Han, T. A., Domingos, E. F., Cimpeanu, T., & Powers, S. T. (2025). Disentangling trust from cooperation: Trust as reduced monitoring across social dilemmas. arXiv. [Google Scholar] [CrossRef] [Scilit]
- Ramos, J. (2014). Reflection paper. Available online: https://www.scribd.com/doc/250069838/final-reflection-paper (accessed on 2 December 2025).
- Rogers, T., Zeckhauser, R., Gino, F., Norton, M. I., & Schweitzer, M. E. (2017). Artful paltering: The risks and rewards of using truthful statements to mislead. Journal of Personality and Social Psychology, 112(3), 456–473. [Google Scholar] [CrossRef] [Scilit] [PubMed]
- Saenz, M. J., & Cano, J. L. (2009). Experiential learning through simulation games: An empirical study. International Journal of Engineering Education, 25(2), 296–307. [Google Scholar]
- Salinas-Navarro, E. E., Da Silva-Ovando, A. C., & Palma-Mendoza, J. A. (2024). Experiential learning labs for the post-COVID-19 pandemic era. Education Sciences, 14(7), 707. [Google Scholar] [CrossRef] [Scilit]
- Scheuring, F., & Thompson, J. (2025). Enhancing graduate employability: Exploring the influence of experiential simulation learning on life skill development. Studies in Higher Education, 50(2), 256–270. [Google Scholar] [CrossRef] [Scilit]
- Schneier, B. (2012). Liars and outliers: Enabling the trust that society needs to thrive. John Wiley & Sons. [Google Scholar]
- Schweitzer, M. E., Hershey, J. C., & Bradlow, E. T. (2006). Promises and lies: Restoring violated trust. Organizational Behavior and Human Decision Processes, 101(1), 1–19. [Google Scholar] [CrossRef] [Scilit]
- Sharabati, A.-A. A., Ali, A. A. A., Allahham, M. I., Hussein, A. A., Alheet, A. F., & Mohammad, A. S. (2024). The impact of digital marketing on the performance of SMEs: An analytical study in light of modern digital transformations. Sustainability, 16(19), 8667. [Google Scholar] [CrossRef] [Scilit]
- Slemrod, J., & Katuscak, P. (2005). Do trust and trustworthiness pay off? Journal of Human Resources, 40(3), 621–646. [Google Scholar] [CrossRef] [Scilit]
- Slovic, P. (1993). Perceived risk, trust, and democracy. Risk Analysis, 13(6), 675–682. [Google Scholar] [CrossRef] [Scilit]
- Sun, Q., Luo, S., Gao, Q., Fan, W., & Liu, Y. (2023). Intuitive thinking impedes cooperation by decreasing cooperative expectations for pro-self but not for pro-social individuals. Journal of Social Psychology, 163(1), 62–78. [Google Scholar] [CrossRef] [Scilit]
- Taghian, M., D’Souza, C., & Polonsky, M. (2015). A stakeholder approach to corporate social responsibility, reputation, and business performance. Social Responsibility Journal, 11(2), 340–363. [Google Scholar] [CrossRef] [Scilit]
- ter Beest, H., van Bemmel, M., & Adriaansen, M. (2018). Nursing student as patient: Experiential learning in a hospital simulation to improve empathy of nursing students. Scandinavian Journal of Caring Sciences, 32(4), 1390–1397. [Google Scholar] [CrossRef] [Scilit]
- Theurl, P., Frick, E., & Barrios, E. (2024). Professional learning communities of student teachers in internship. Education Sciences, 14(7), 706. [Google Scholar] [CrossRef] [Scilit]
- Tisdell, C. (2008). Trust and its implications for economic activity, welfare, and globalisation (Working paper). The University of Queensland. [Google Scholar]
- Tucker, A. W. (1950). A two-person dilemma. Mimeograph, Stanford University. (Reprint in 1989, Readings in games and information (E. Rasmusen, Ed., pp. 7–8)). [Google Scholar]
- Uziel, I. (2004). The use of simulations as a research tool in the study of social interactions and decision-making [Unpublished doctoral dissertation]. Hebrew University of Jerusalem.
- Vărzaru, A. A., & Bocean, C. G. (2024). Digital transformation and innovation: The influence of digital technologies on turnover from innovation activities and types of innovation. Systems, 12(9), 359. [Google Scholar] [CrossRef] [Scilit]
- Waseem, M. (2024). Using simulation to teach research. Clinical Researcher, 38(2), 16–26. [Google Scholar]
- Zak, P. J., & Knack, S. (2001). Trust and growth. The Economic Journal, 111(470), 295–321. [Google Scholar] [CrossRef] [Scilit]
- Zilvinskis, J., Kinzie, J., Daday, J., O’Donnell, K., & Vande Zande, C. (2022). Delivering on the promise of high-impact practices: Research and models for achieving equity, fidelity, impact and scale. Routledge. [Google Scholar]

Disclaimer/Publisher’s Note: The statements, opinions and data contained in all publications are solely those of the individual author(s) and contributor(s) and not of MDPI and/or the editor(s). MDPI and/or the editor(s) disclaim responsibility for any injury to people or property resulting from any ideas, methods, instructions or products referred to in the content. |
© 2026 by the author. Licensee MDPI, Basel, Switzerland. This article is an open access article distributed under the terms and conditions of the Creative Commons Attribution (CC BY) license.